1. Introduction
Animated cartography has the potential to help visualize spatio-temporal data, and it is considered a contribution in various fields. One important aspect is its ability to enhance the spatial cognition and understanding of complex geographic phenomena. Studies have shown that animated cartographic visualizations improve spatial comprehension and facilitate the communication of geospatial information [
1,
2]. Additionally, animated maps provide a dynamic representation of temporal and spatial changes, enabling the exploration of temporal patterns and trends [
3,
4,
5]. This has proven invaluable in fields, such as urban planning, environmental monitoring, and epidemiology, where the ability to observe changes over time is essential for decision making and analysis [
6,
7,
8]. Furthermore, animated cartography has also found applications in education and public outreach, as it engages users in an interactive and immersive experience, facilitating the comprehension and retention of geographic knowledge [
9,
10]. Therefore, the integration of animated cartography in various domains is of paramount importance in addressing contemporary challenges and promoting informed decision making.
Animated maps offer a multitude of visual and dynamic variables that contribute to their effectiveness in conveying spatial information. Visual variables, such as color, size, shape, and texture, allow for the representation of different geospatial attributes and their variations over time [
11,
12]. These variables provide a means to encode and differentiate multiple layers of information simultaneously, aiding in the comprehension and interpretation of complex spatial patterns [
13]. By animating these visual variables, the temporal aspect of the data can be effectively communicated. Dynamic variables, including duration, rate of change, or frequency, further enhance the portrayal of temporal change and facilitate the perception of patterns and trends [
14]. The smooth transition between frames, coupled with controlled animation speeds, ensures that viewers can follow the changes without experiencing cognitive overload [
15,
16]. The interplay between visual and dynamic variables in animated maps allows for the exploration of spatio-temporal relationships and supports the identification of temporal dynamics that may be otherwise difficult to discern in static maps [
5].
The use of visual variables, also recognized as visual channels [
17,
18,
19], in representing spatial data is a well-established practice. Certain visual variables, such as shape, orientation, and location, are commonly used to convey the qualitative features of data. On the other hand, variables like size or color hue are typically employed to represent quantitative information [
20]. However, researchers have explored the incorporation of animated techniques to expand the possibilities of using qualitative visual variables to present quantitative data [
21,
22]. This is made possible by leveraging the differential speed at which symbols change or animate. For instance, by continuously changing the orientation of a symbol, it can create the impression of rotation. Consequently, different symbol rotation speeds can be utilized to represent distinct data classes. In summary, while some visual variables are traditionally associated with qualitative or quantitative data, the introduction of animation techniques has demonstrated the potential of qualitative visual variables to convey quantitative information by leveraging differences in symbol change or animation speed [
23].
However, the perception of cartographic animation is more difficult than for static map images [
24]. Therefore, the usage of dynamic symbols, which are defined as symbols which constantly change one of their main visual variables, should be considered, since they might not necessarily increase the accuracy of cartographic communication but can enable users to comprehend the message more quickly [
25,
26,
27]. In recent years, scientists have placed greater emphasis on the perception of animated maps rather than their technical design capabilities [
28,
29,
30,
31,
32]. One of the dynamic features of point symbols is that motion velocity is a preattentive attribute, meaning it is noticed very quickly, within just a few hundred milliseconds [
33,
34]. Following Feature Integration Theory, preattentive features (individual features) are rapidly identified by the low-level visual system, distinct from distractors that are automatically perceived in parallel across the visual field [
35]. Treisman [
36] identified visual properties that can be recognized preattentively. These “preattentive features” also play a role in cartographic research, particularly in map design. To date, a significant number of features, even animated, considered preattentive have been identified [
34,
37].
Many methods for studying the perception of cartographic products have been presented thus far. Among the various available methods, user studies deserve special recognition as they have gained immense popularity in cartographic research. These studies aim to gather subjective feedback, preferences, and perceptions of users regarding the animated maps’ effectiveness, comprehension, and overall experience [
38,
39,
40]. In addition to survey methods, eye tracking has gained importance in recent times. It involves recording eye movements, like fixations and saccades, and related indexes such as time to the first fixation, target dwell, and fixation count, and has become increasingly significant in various fields of cartography [
41,
42,
43].
Based on the aforementioned information, the following research questions remain unaddressed:
What is the impact of motion velocity as a preattentive attribute in pictorial symbols on the comprehension speed of animated maps?
How should the differences between speed classes of pictorial symbols be distributed so that the fastest-changing symbol could be perceived preattentively?
Which of the designed pictorial symbols are perceived preattentively?
The main aim of this research is to assess how the motion of dynamic point symbols impacts preattentive processing on a map. In particular, it determines the parameters of motion velocity for cartographic animated pictorial symbols, which are responsible for the preattentive perception of the target symbols. An additional goal is to propose a methodology for designing dynamic pictorial symbols using graphic-coding software.
2. Related Work
Several researchers have offered guidance on designing dynamic symbols. Lai and Yeh [
20] proposed a method for assessing the effectiveness of blinking symbols compared to static symbols. They confirmed that dynamic symbols were recognized quicker than their static counterpart. However, complemented by Koussoulakou and Kraak’s [
25] research, it is discussed that blinking symbols also have a distractive potential depending on the number of symbols. This was also noticed in a study by Cybulski and Wielebski [
44]. They presented a study on the effectiveness and efficiency of not only blinking but also rotation and pulsation. In their study, blinking was the least-efficient method compared to other types of dynamic symbols. On the other hand, Zhang et al. [
45] suggested in their study that the implementation of dynamic symbols in quantitative mapping reveals greater participant interest in the presented data. However, all these studies were based only on geometric symbols.
Preattentive processing has been studied within the field of visual perception theory. The first studies on preattentive vision emerged in the 1980s [
35,
36,
46,
47,
48]. Dynamic attributes such as motion velocity, which can be applied to cartographic symbols, were studied by Schmitt et al. [
34] and Nakayama and Silverman [
37]. They found that target symbols with faster motion velocity can be found preattentively among other dynamic symbols. However, those studies were not related to cartographic symbology, as the symbols used in the mentioned studies were based on basic geometries and did not include pictorial symbols. They also did not encompass the data classification methods of motion velocity, as utilized in cartographic presentation.
There is relatively limited research dedicated to preattentive perception in the field of cartography. Among the few, one can mention the research conducted by Michaelidou et al. [
49]. They suggested that symbols that had a kind of hole or gap were perceived preattentively among other symbols on a static map with a topographic background. While there is a lack of research in the field of animated cartography regarding the preattentiveness of symbols, individual researchers have shown interest in this topic [
50,
51].
The study presented in this article constitutes the second part of broader research initiated by Cybulski and Krassanakis [
23]. The mentioned study [
23,
50] utilizes the same method and equipment to investigate the preattentive perception of geometric symbols. These symbols are grounded in basic geometry, including shapes like squares, triangles, or pentagons, which serve as the foundation for animation in the study. They suggested that the most successful geometry for various kinds of animation, including pulsation, blinking/flickering, and rotation, across all motion distribution scales, is the square. However, they reported that blinking/flickering, as a type of motion in the cartographic environment, does not support preattentive processing and should be avoided in dynamic map design.
Various cited studies in this context use eye-tracking methods, primarily aimed at recording intricate eye movement patterns. Eyes move to bring a specific part of the visible field into high resolution, allowing the perception of fine details at the central direction of gaze. Simultaneously, attention is focused on that point, facilitating momentary concentration on the object or region of interest. Tracking eye movements provides insights into the observer’s attention path, offering valuable information about their interests and clues about their perception of the viewed scene [
52]. From several eye movement metrics, cartographic studies often employ fixations, saccades, smooth pursuit, and pupil size [
53,
54,
55].
In summary, it can be concluded that there is a research gap in this area. Firstly, there is a lack of research on the effectiveness of dynamic symbols, particularly pictorial symbols, and methods of designing them concerning the distribution of motion velocity differences. The classification of data by symbol size or color is well recognized in cartographic methods, while the distribution of differences in movement speed between symbols is relatively weakly studied. Even though the application of dynamic symbols was introduced in 2018 by ESRI in ArcGIS PRO 2.2 and by QGIS in QField, the quantitative usage of this symbology remains untouched.
Secondly, their preattentive effect, i.e., their ability to communicate spatial information within a fraction of a second, is not yet known. Indeed, this serves as motivation for undertaking the present research.
3. Materials and Methods
3.1. Dynamic Pictorial Symbol Map Design
Administrative borders were chosen as the cartographic background. Each of these areas had 10 administrative units based on real border data. Borders were selected to be similar size and not too elongated vertically or horizontally. This was to make them uniform but not identical.
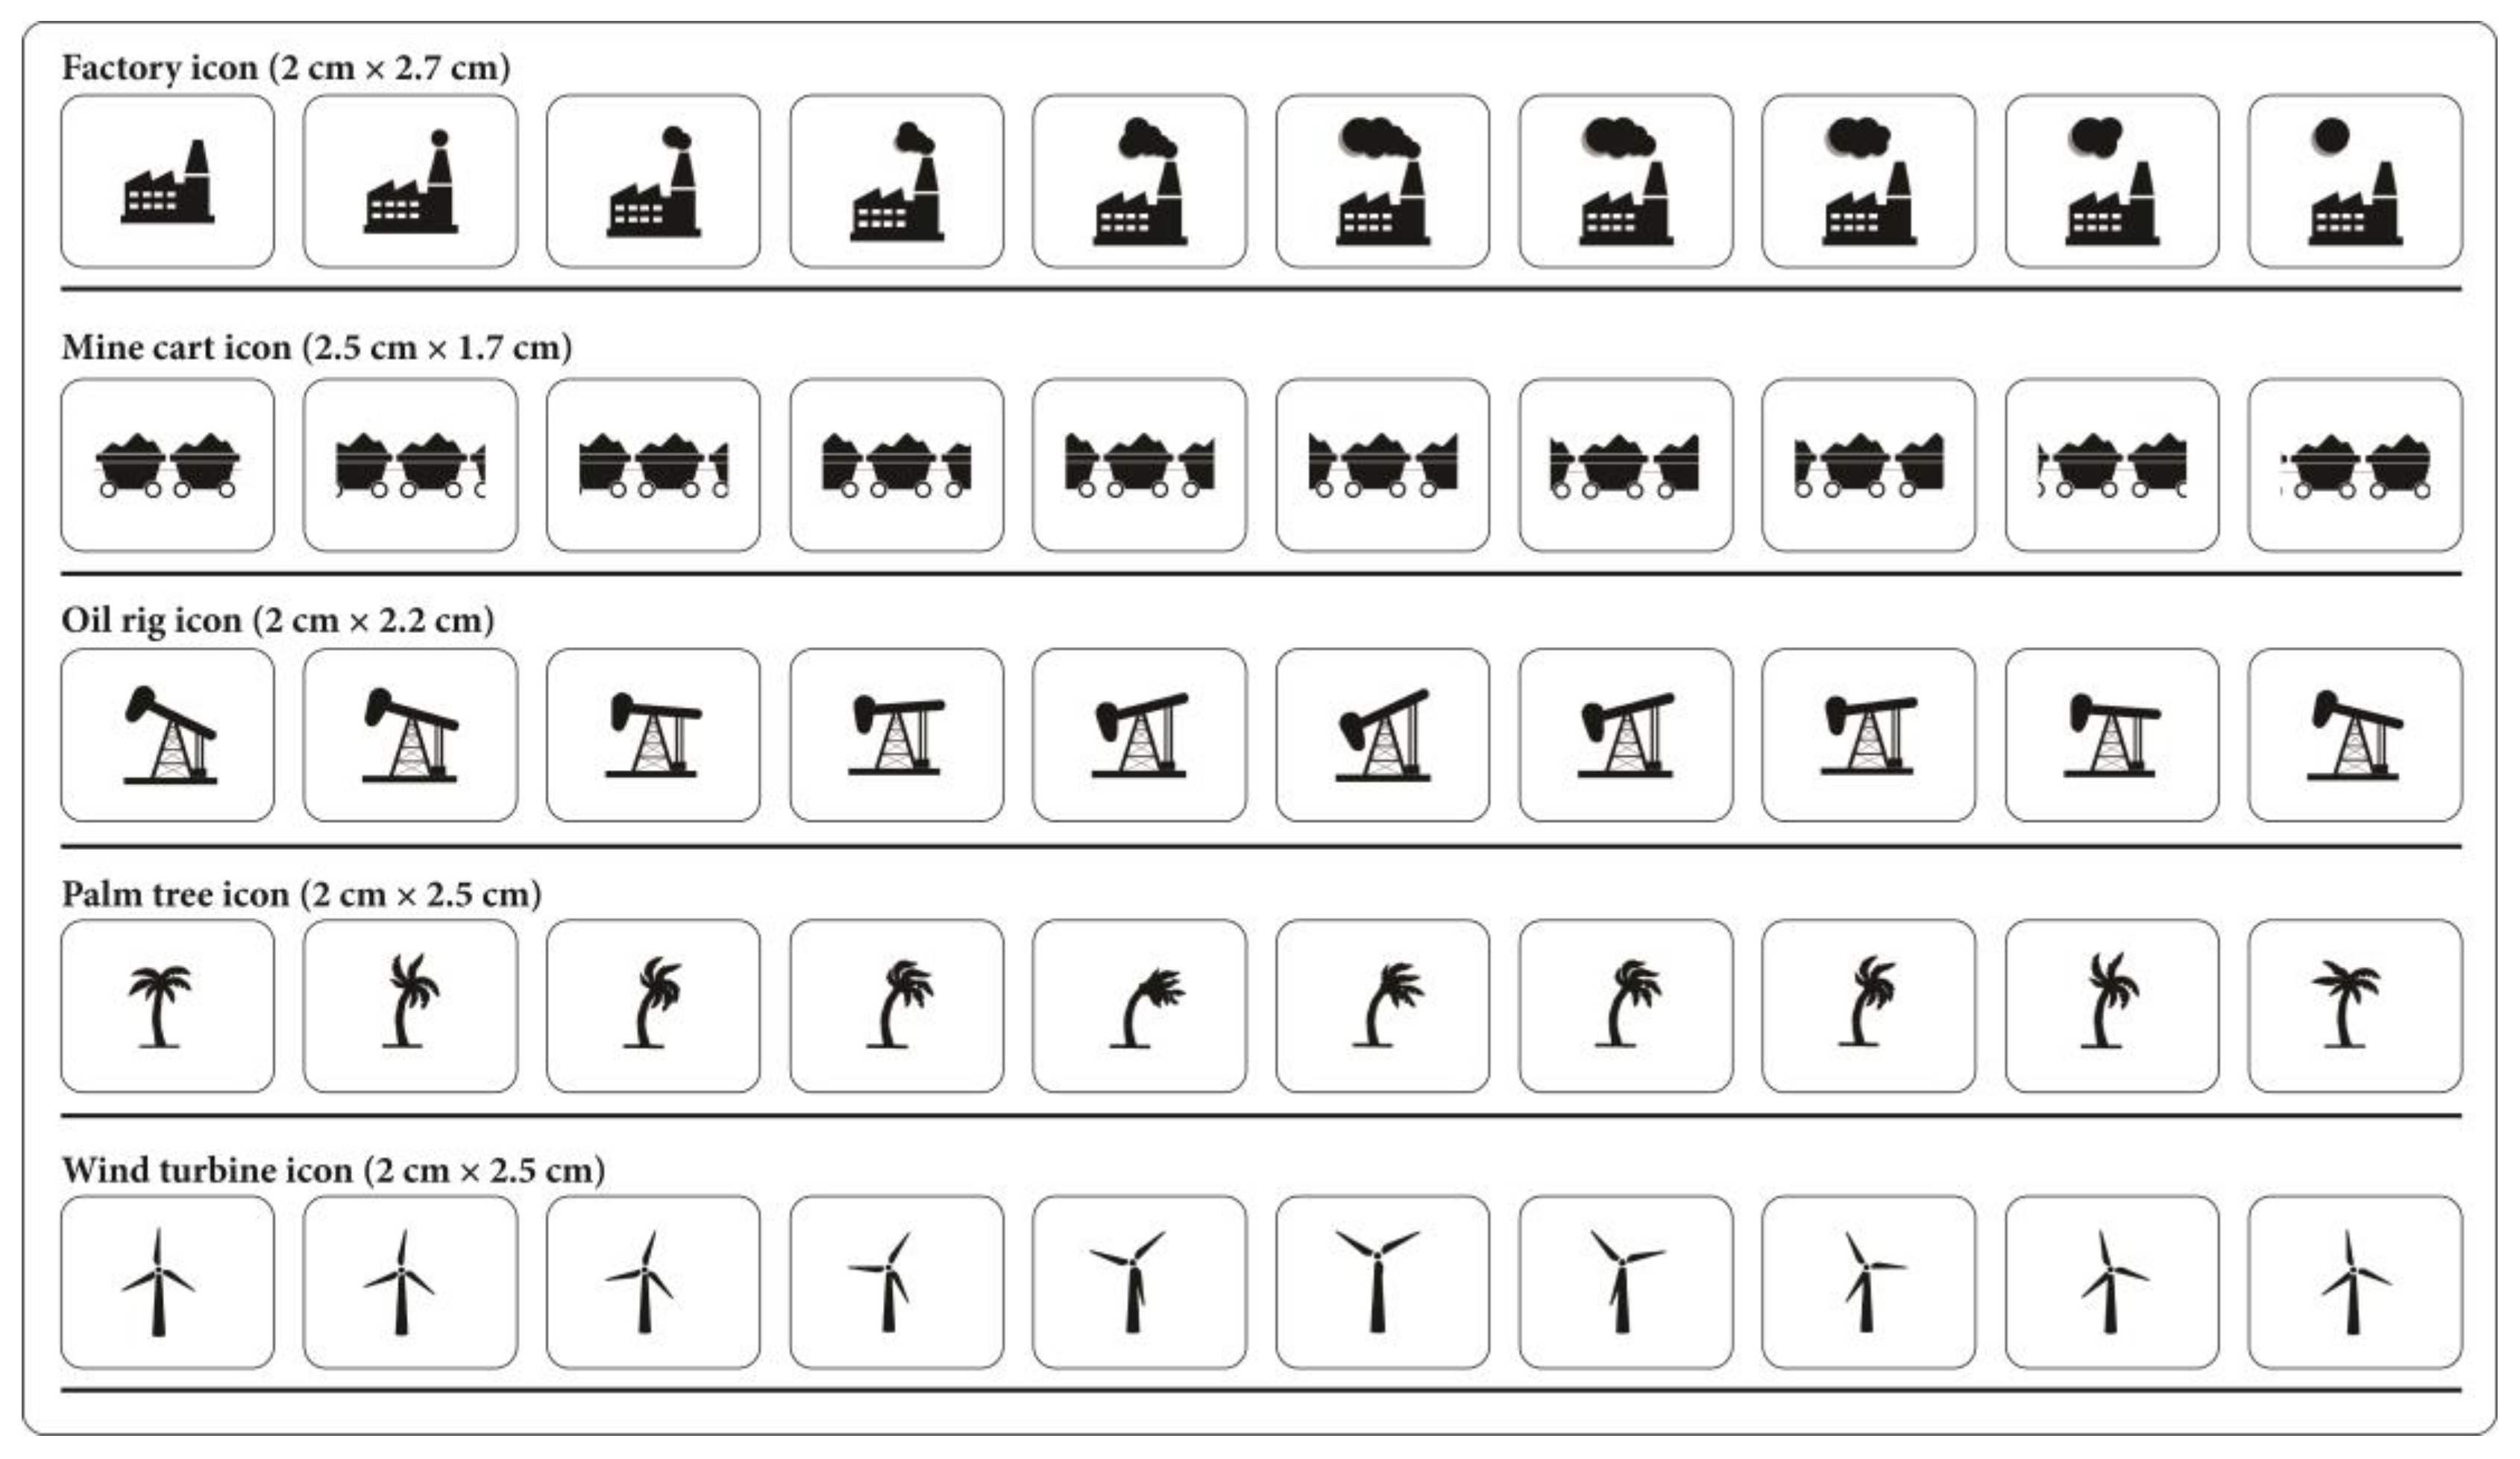
Five pictorial symbols were designed (factory, mine cart, oil rig, palm tree, and wind turbine). For each symbol, an animation was designed to demonstrate the change in its shape. In
Figure 1, an animation of each symbol was presented frame by frame. When it comes to the selection of pictorial symbols, the aim here was to ensure that, after considering the animation, the shape changes would be varied. Therefore, very different symbols were selected. Of course, only five symbols were chosen for the experiment, which is a somewhat subjective decision. All symbols were of similar size, with a width of 2 cm (except for the mine cart, which was 2.5 cm), and the height varied from 1.7 cm to 2.7 cm. Since there was variation in symbol size, it was decided that the symbols should be larger than the suggested minimal sizes of map symbols [
56].
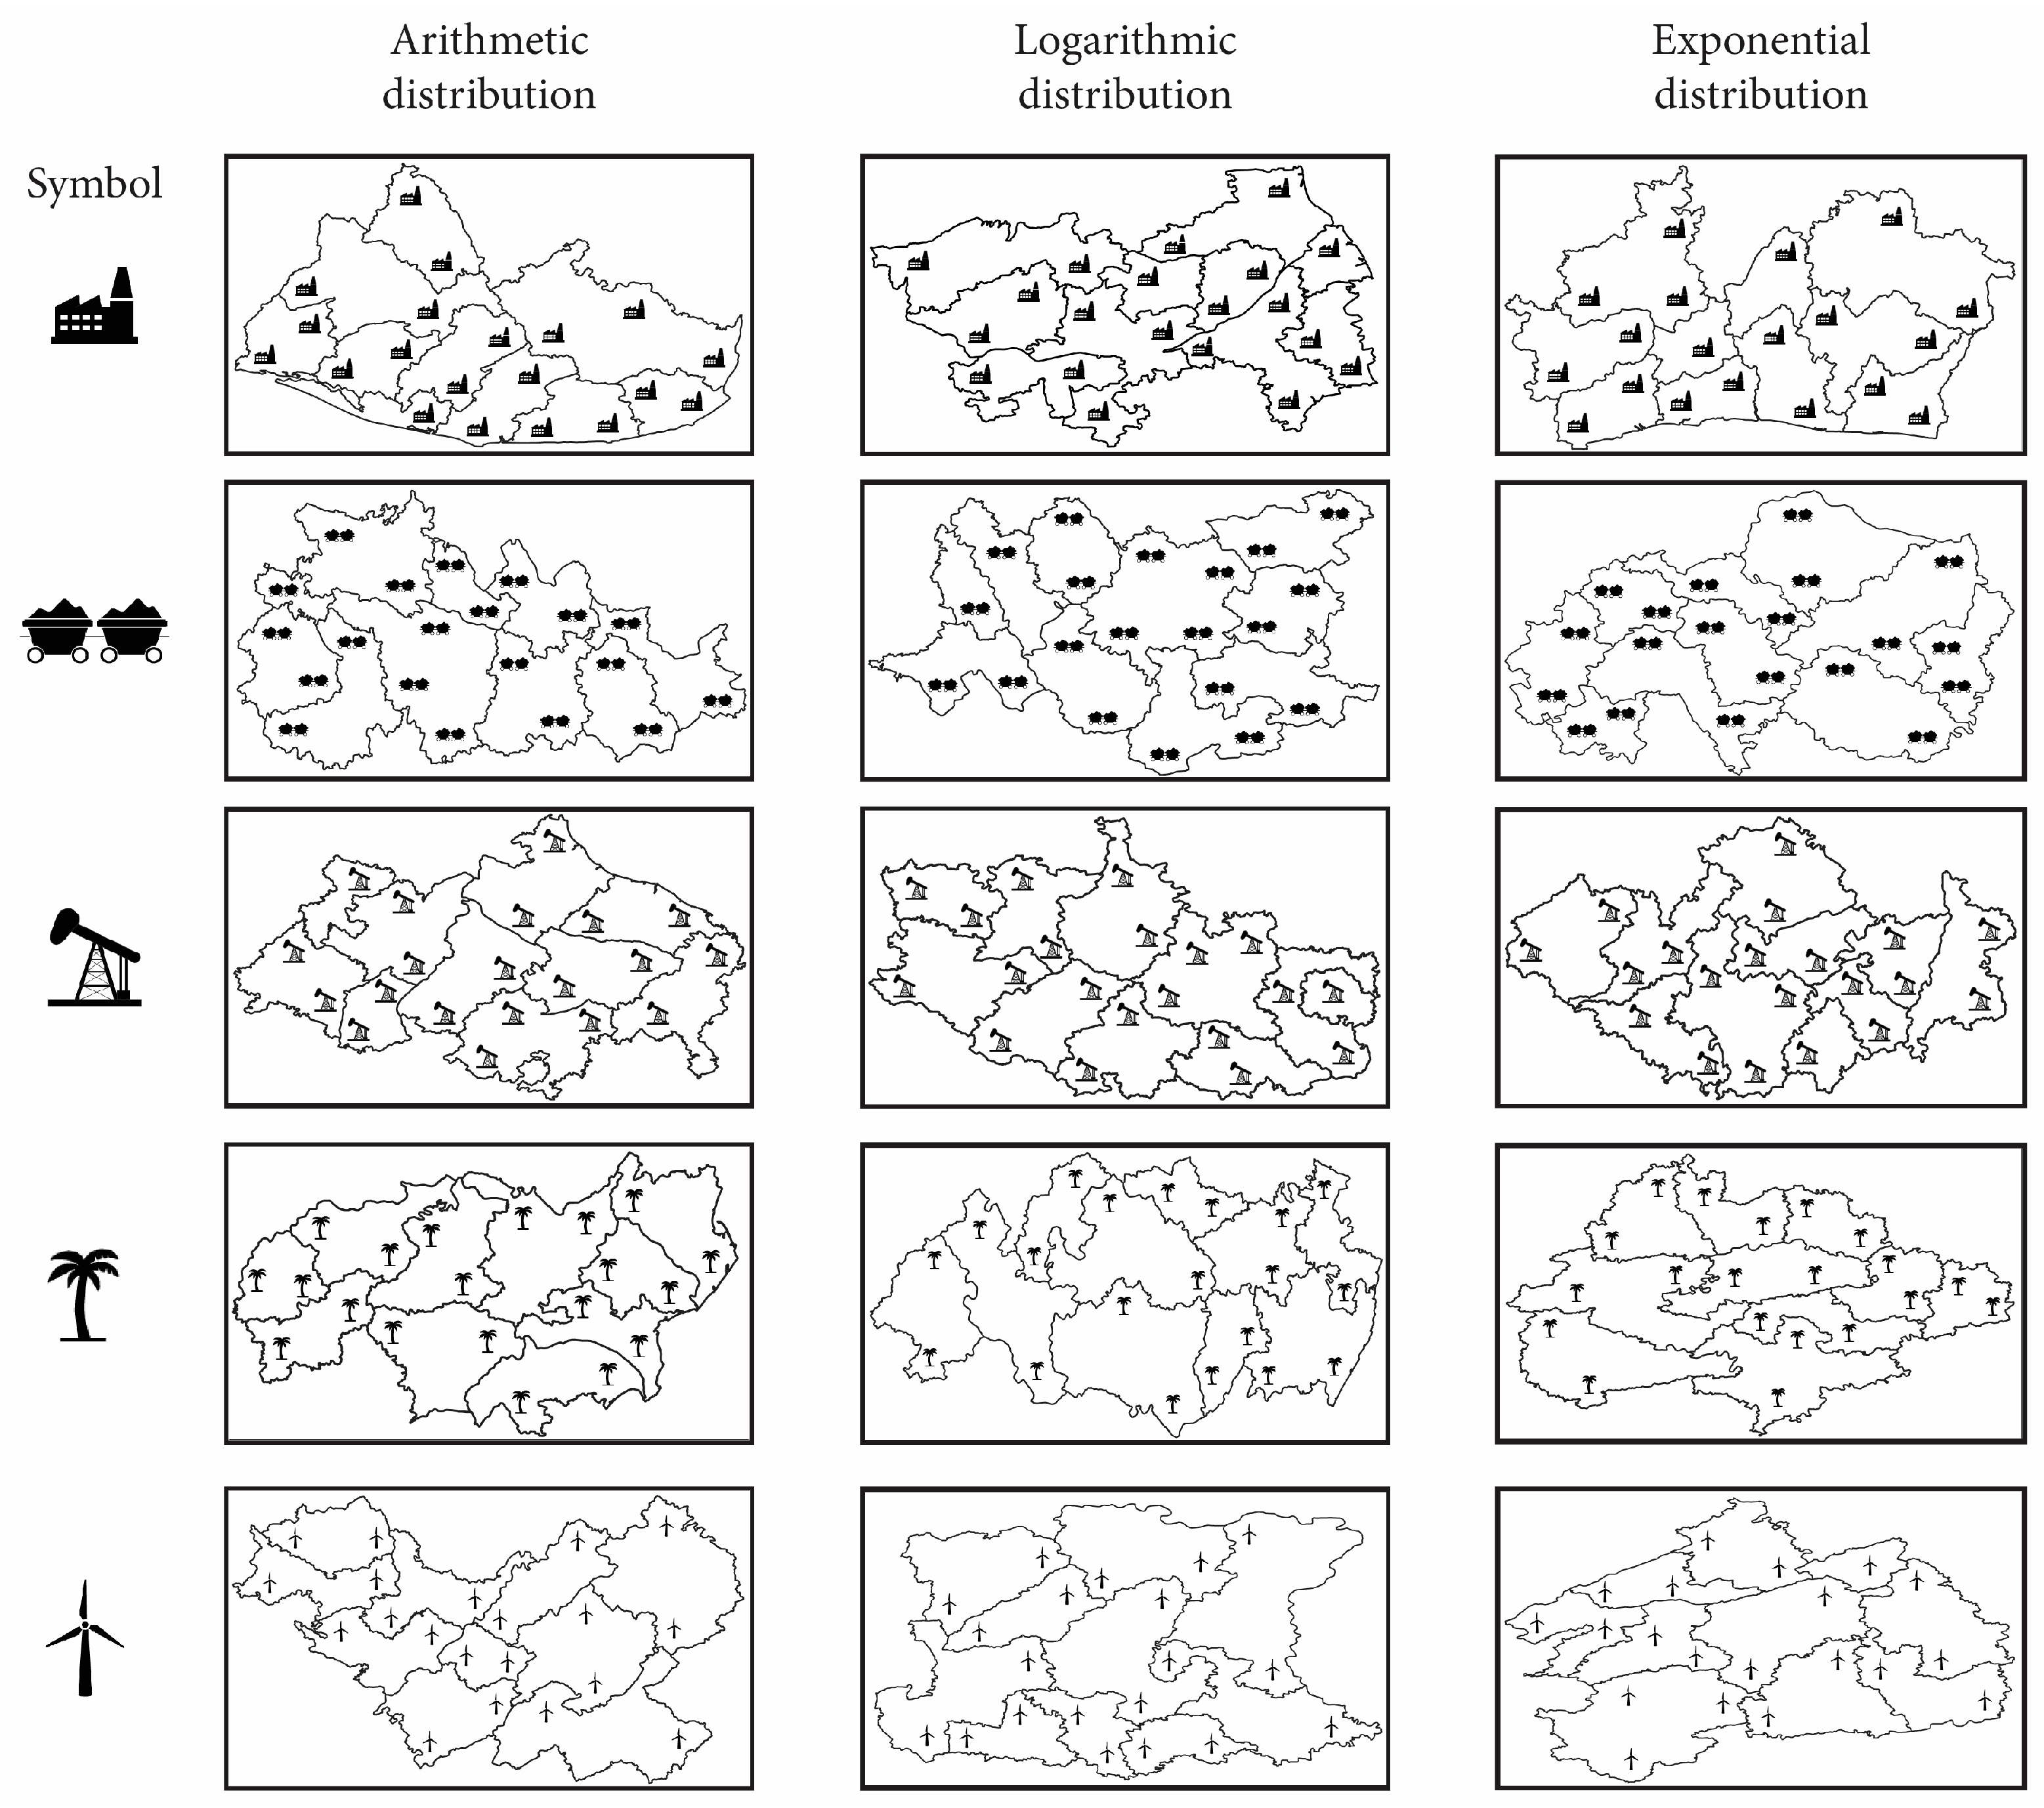
Each of the presented symbols consisted of 10 individual frames, each depicting a change in its shape. To quantitatively represent these changes on the map, it was necessary to categorize them into different speed classes. Following the principles outlined by Harrower [
24] and Lloyd [
57], it is essential to consider that the perception of animated maps can be limited due to their dynamic nature. Therefore, five symbol–speed classes were applied, along with three types of speed distribution between each class: arithmetic, logarithmic, and exponential. The definition of speed distribution was based on the fastest symbol, which consistently maintained a frame rate of 100 frames per second (fps). Within this 100 fps range, the fastest symbol completed 10 full cycles of change. Consequently, a slower symbol with 80 fps would complete only eight full cycles of changes. The distribution of speed into quantitative classes corresponding to different scales is presented in
Table 1.
In cartography, quantification brackets or classes refer to the ranges or intervals into which data are divided or categorized for mapping purposes. This process is known as data classification [
58]. It involves grouping numerical data values into discrete classes or intervals, making it easier to represent spatial patterns and variations on a map. The goal is to simplify the presentation of complex data. In the context of dynamic point symbols used in cartography, speed classes refer to different categories or levels of motion speed assigned to symbols based on the underlying data values they represent.
Each instance of a pictorial symbol has been randomly placed in twenty different locations on the administrative border map. This was made possible by a Python-based algorithm, “Create Random Points”, available through ArcGIS Pro 3.1. The placement of symbols was manually adjusted to ensure that each administrative unit contained between one and three symbols, and none were placed on the border. To each symbol on the map, a different speed class was randomly assigned according to the selected distribution scale. However, on each map, only one symbol had a speed of 100 fps (and it was considered the target symbol in the experimental procedure). The map contains symbols of a single type, e.g., only factories. Further, 15 maps were designed in this way. Examples of each map, taking into account different scales of speed distribution, are visible in
Figure 2.
To grasp the idea of dynamic pictorial symbols, it should be noted that each symbol instance had the same rate of change, which is considered a dynamic variable in cartographic design [
10,
59]. The only variable that differentiates one from another is motion velocity [
23,
34], which enables the presentation of the same rate of change between two frames at various speeds.
3.2. Participants
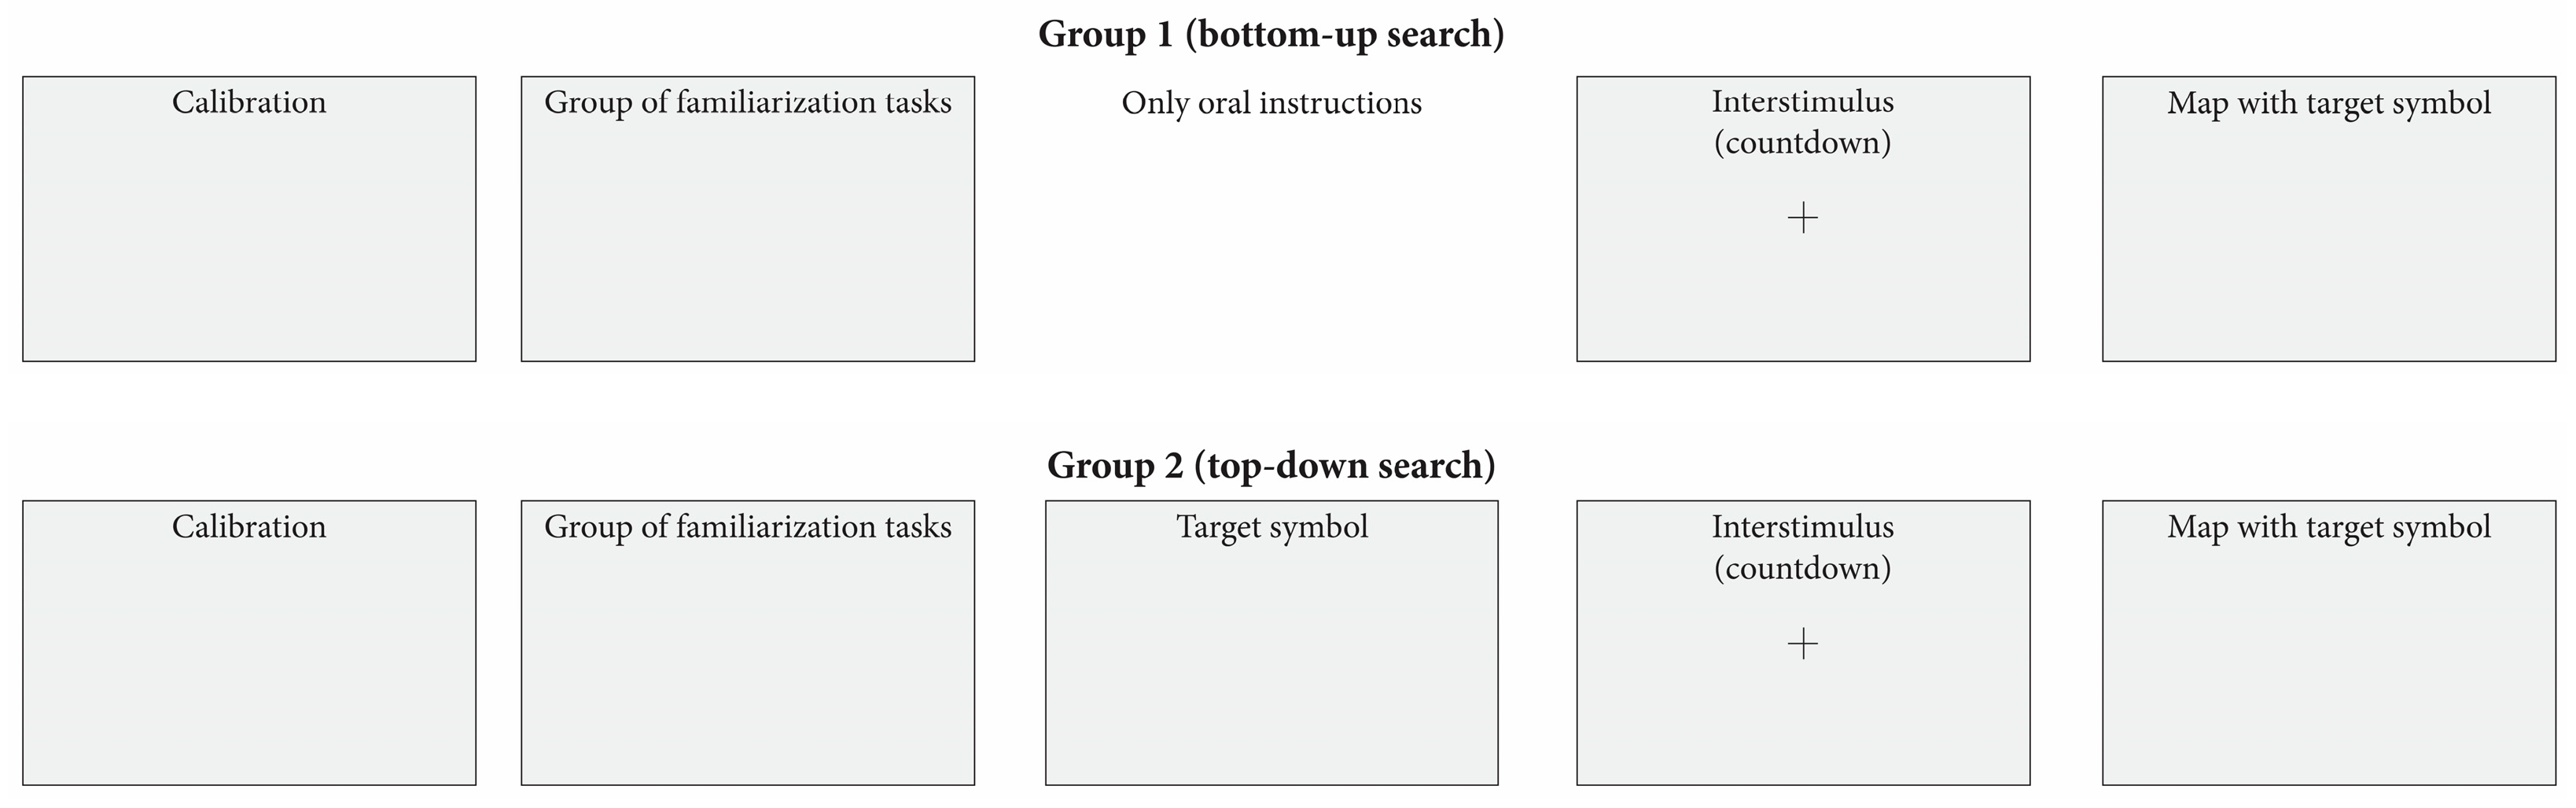
A total of 103 participants, aged 19 to 44, from Adam Mickiewicz University in Poznań, Poland, took part in the experiment. The average age of the participants was 22.5 ± 4.3 years, and the participant group had a balanced composition with respect to gender. The experiment was designed for two groups. First-group participants were exclusively tasked with identifying the most rapidly changing symbol across the entirety of the map. The second group of participants were consistently presented with the target symbol prior to viewing the stimuli of each map. This approach is related to the top-down and bottom-up approaches presented in many visual search studies [
60,
61]. The first group consisted of 50 individuals, with ages ranging from 19 to 41, averaging at 22.6 ± 4.4 years. In the second group, there were 53 participants aged 19 to 44, with an average age of 22.3 ± 4.3 years.
All participants possessed normal or corrected-to-normal vision, and none exhibited astigmatism. Prior to commencing the experiment, informed consent was acquired from each participant. Their involvement in the study was entirely voluntary, and participants received no compensation; they willingly agreed to partake under these conditions. The study conducted adheres to the ethical standards set forth by the institutional ethics committee.
3.3. Apparatus
We employed the SR Research EyeLink 1000 Plus (SR Research Ltd., Ottawa, ON, Canada) eye tracker, equipped with a sampling rate of 2000 Hz and additional chin and forehead supports, to record participants’ eye movements. All materials were displayed on a 21-inch monitor with a resolution of 1920 × 1080 pixels. The distance between participants’ eyes and the eye tracker was maintained at approximately 50 cm, while the distance between the monitor and participants’ eyes was approximately 90 cm.
3.4. Procedure
The procedure involved presenting all maps featuring dynamic point symbols individually to each participant in a random order. In the first group, participants viewed maps with symbols but without a specified target symbol. They were only instructed to identify and select the fastest-changing symbol within each map. This was a specific reference to the particular speed class, in which only one symbol was classified. In contrast, the second group observed the target dynamic point symbol with actual speed parameters, consistently set as the fastest one. They had unlimited time to familiarize themselves with the target symbol displayed. Then, they were instructed to search for and select it on the following map. Prior to the actual experiment, participants from both groups underwent calibration using a 9-point calibration procedure. Subsequently, they completed a series of familiarization tasks, with participants achieving an average gaze sample score of 98% ± 0.8% (±0.7% in the second group).
Each map featured dynamically animated symbols for a duration of 1000 ms. After this period, all map symbols ceased movement, and participants selected the target symbol from the map by clicking the left mouse button. Before each stimulus presentation, participants were shown an interstimulus cue, consisting of a 3-s time period counter-positioned at the center of the display. They received specific instructions to fixate their gaze on this interstimulus cue. The experimental procedure scheme is presented in
Figure 3.
4. Results
The analysis of the results was performed using several variations of ANOVA (Analysis of Variance), a statistical method that compares the means of different groups to determine if there are statistically significant differences between them. The null hypothesis posits group equality in terms of the mean. The F-statistic, a ratio of variance between groups to variance within groups, is pivotal in this analysis, along with the associated
p-value. If the F-statistic is relatively high and the significance level is
p < 0.05, the null hypothesis is rejected, allowing for the identification of differences between multiple groups [
62].
4.1. Succesfull Detection of Target Symbol
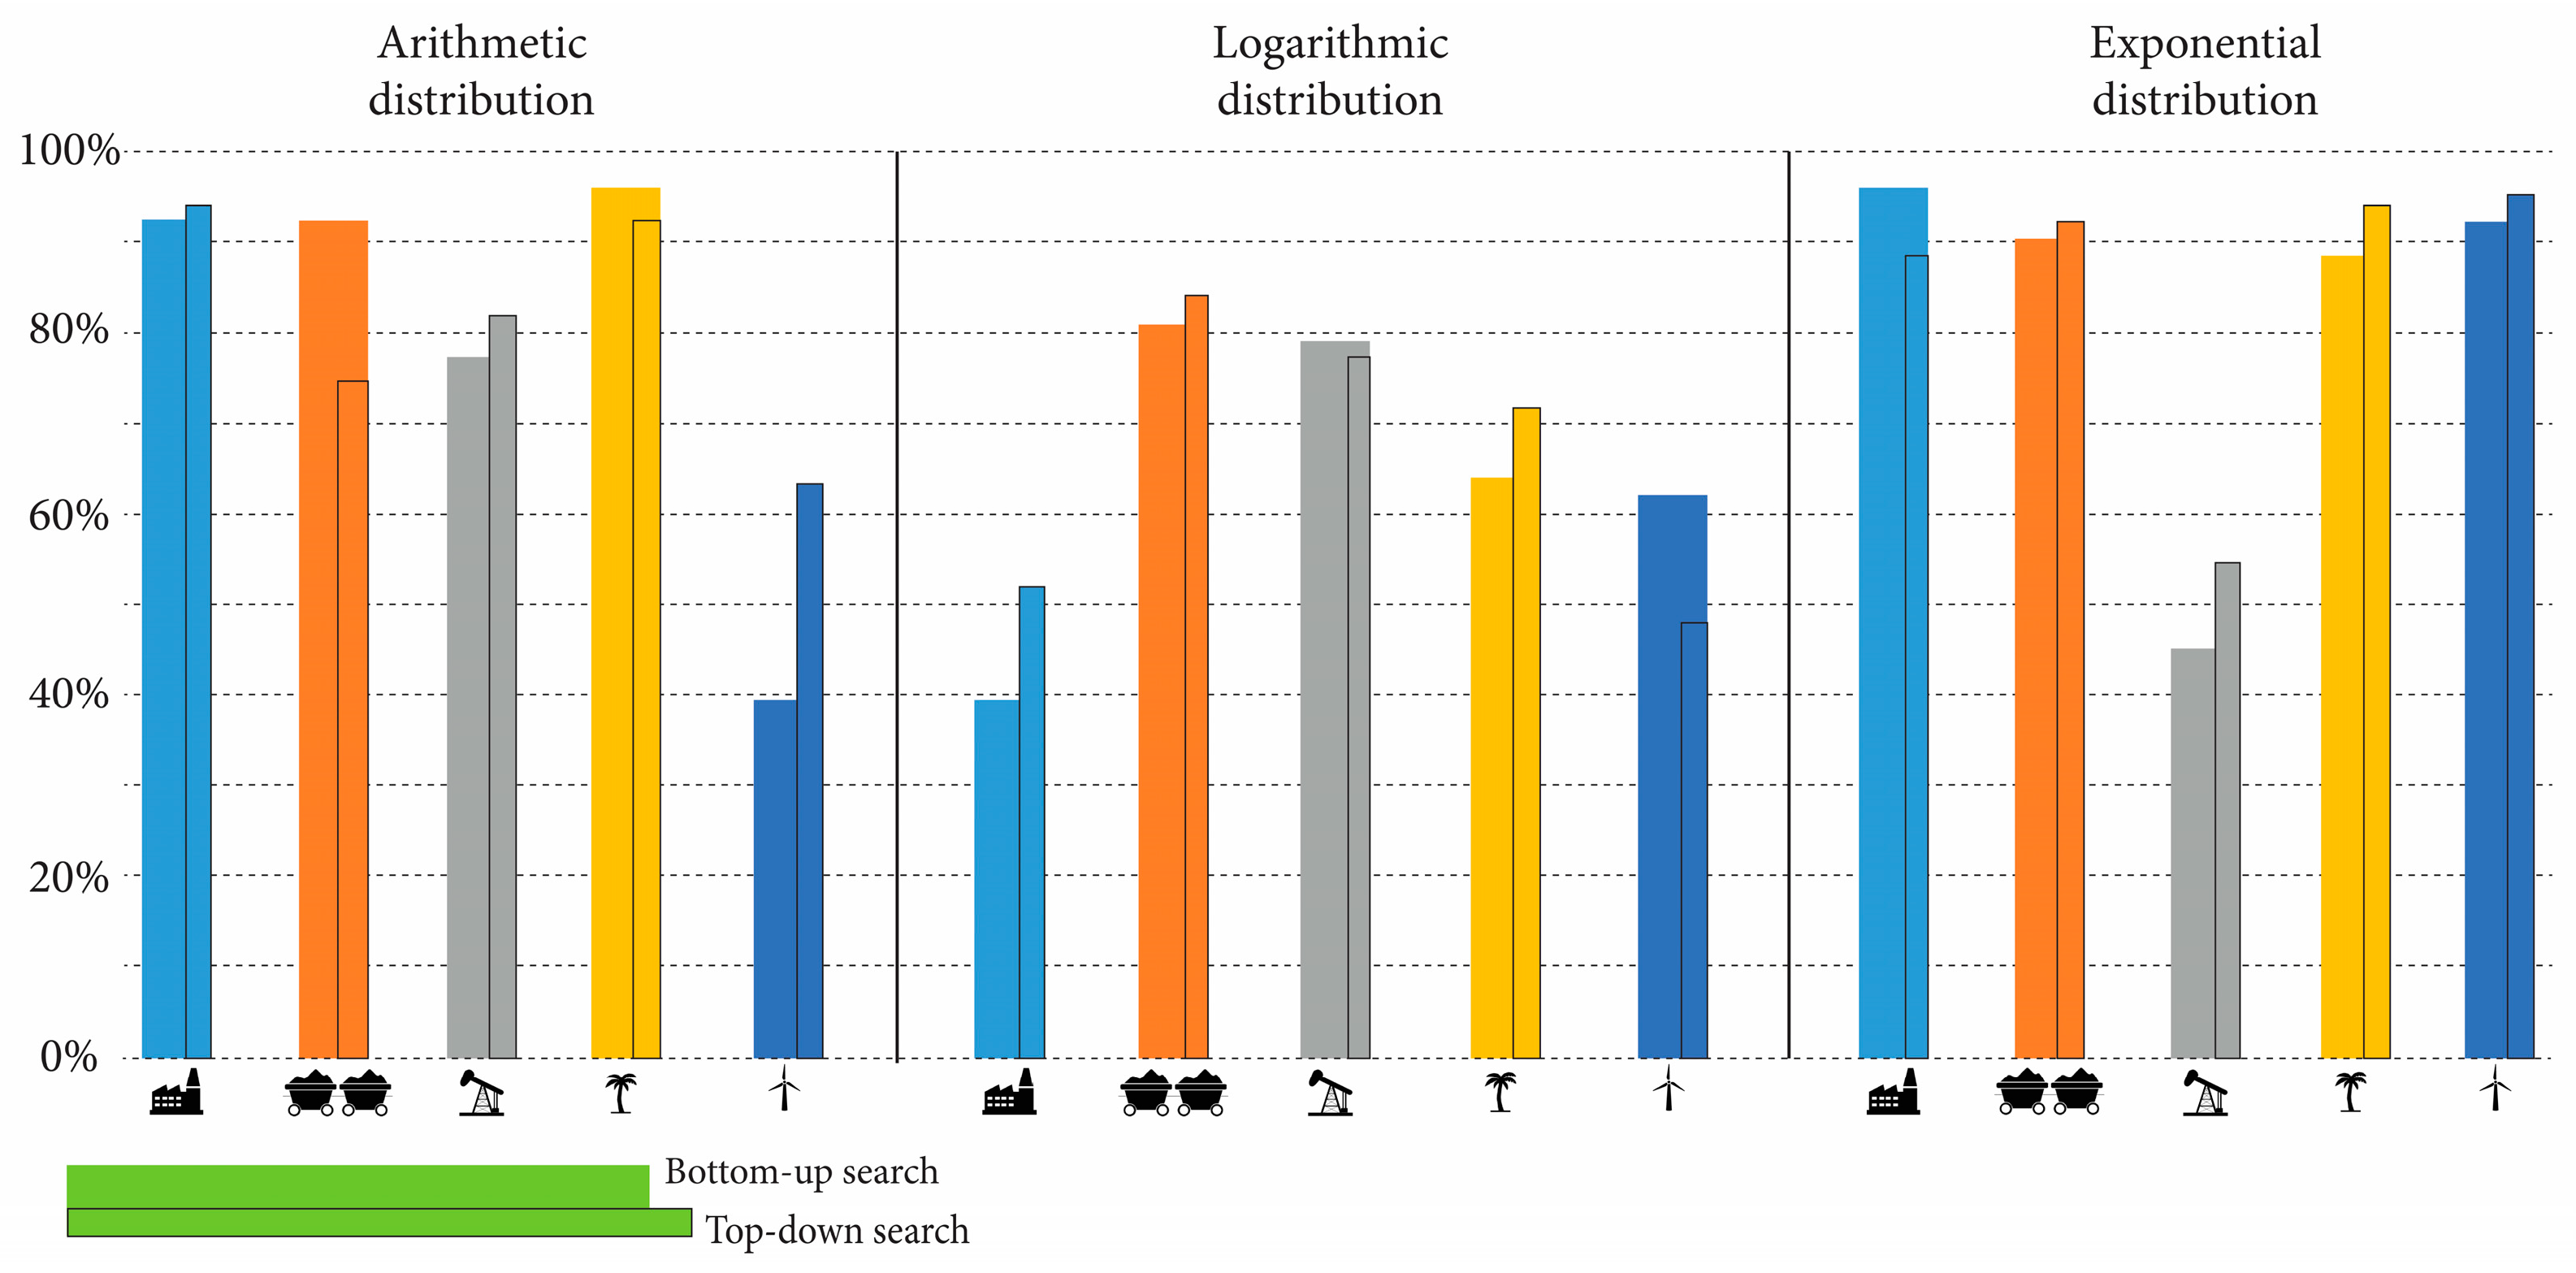
Based on the coordinates of the mouse cursor selections, it was possible to determine whether the searched symbol had been identified correctly. On this basis, a percentage success rate was determined for each symbol on each scale and is presented in
Figure 4.
The presented results of the success rate in the bottom-up search show that two symbols turned out to be the most easily found in preattentive processing at all scales, namely the mine cart (88% despite the motion distribution) and the palm tree (83% despite the motion distribution). In addition, the Pearson Chi-square test reveals differences among individual symbols broken down into different speed distribution scales. For the arithmetic distribution, the symbols that were noticed in the preattentive process by over 90% of users were the factory, the mine cart, and the palm tree, while the wind turbine achieved the lowest result, with a success rate below 40% (p = 10−6, df = 4, χ2 = 34.37).
In the bottom-up search, in the logarithmic speed distribution, the highest degree of success in preattentive processing was observed for the mine cart, which achieved over 80% success (81.1%), and the oil rig, which achieved slightly below 80% success (79.25%) (p = 30−5, df = 4, χ2 = 26.07). In the case of exponential speed distribution, all symbols except the oil rig achieved a success rate above or slightly below 90%, where the factory emerged as the best detectable animated symbol in preattentive processing (p = 10−6, df = 4, χ2 = 65.60).
The success rate results in the top-down search mirror the bottom-up findings, highlighting two symbols that proved to be the most easily detected in preattentive processing across all scales. Specifically, the mine cart achieved an 84% success rate, and the palm tree reached an 86% success rate, even when accounting for motion distribution. Furthermore, the Pearson Chi-square test identified significant differences among individual symbols across various speed distribution scales. In the case of the arithmetic distribution, the factory and the palm tree were noticed in the preattentive process by over 90% of users, while the wind turbine had the lowest success rate, falling below 65% (p = 46−4, df = 4, χ2 = 20.18).
In the top-down search, the logarithmic speed distribution yielded the highest degree of success, with results mirroring the bottom-up search for the mine cart, achieving over 80% success (83.7%). These differences were found to be statistically significant (p = 23−4, df = 4, χ2 = 21.74). Similarly, in the case of exponential speed distribution, the results aligned with the bottom-up search, as all symbols, except the oil rig, achieved a success rate above or slightly below 90%. Notably, the wind turbine and palm tree emerged as the best detectable animated symbols in preattentive processing, marking a significant difference (p = 10−6, df = 4, χ2 = 42.56).
4.2. Fixations on Target among Distractors
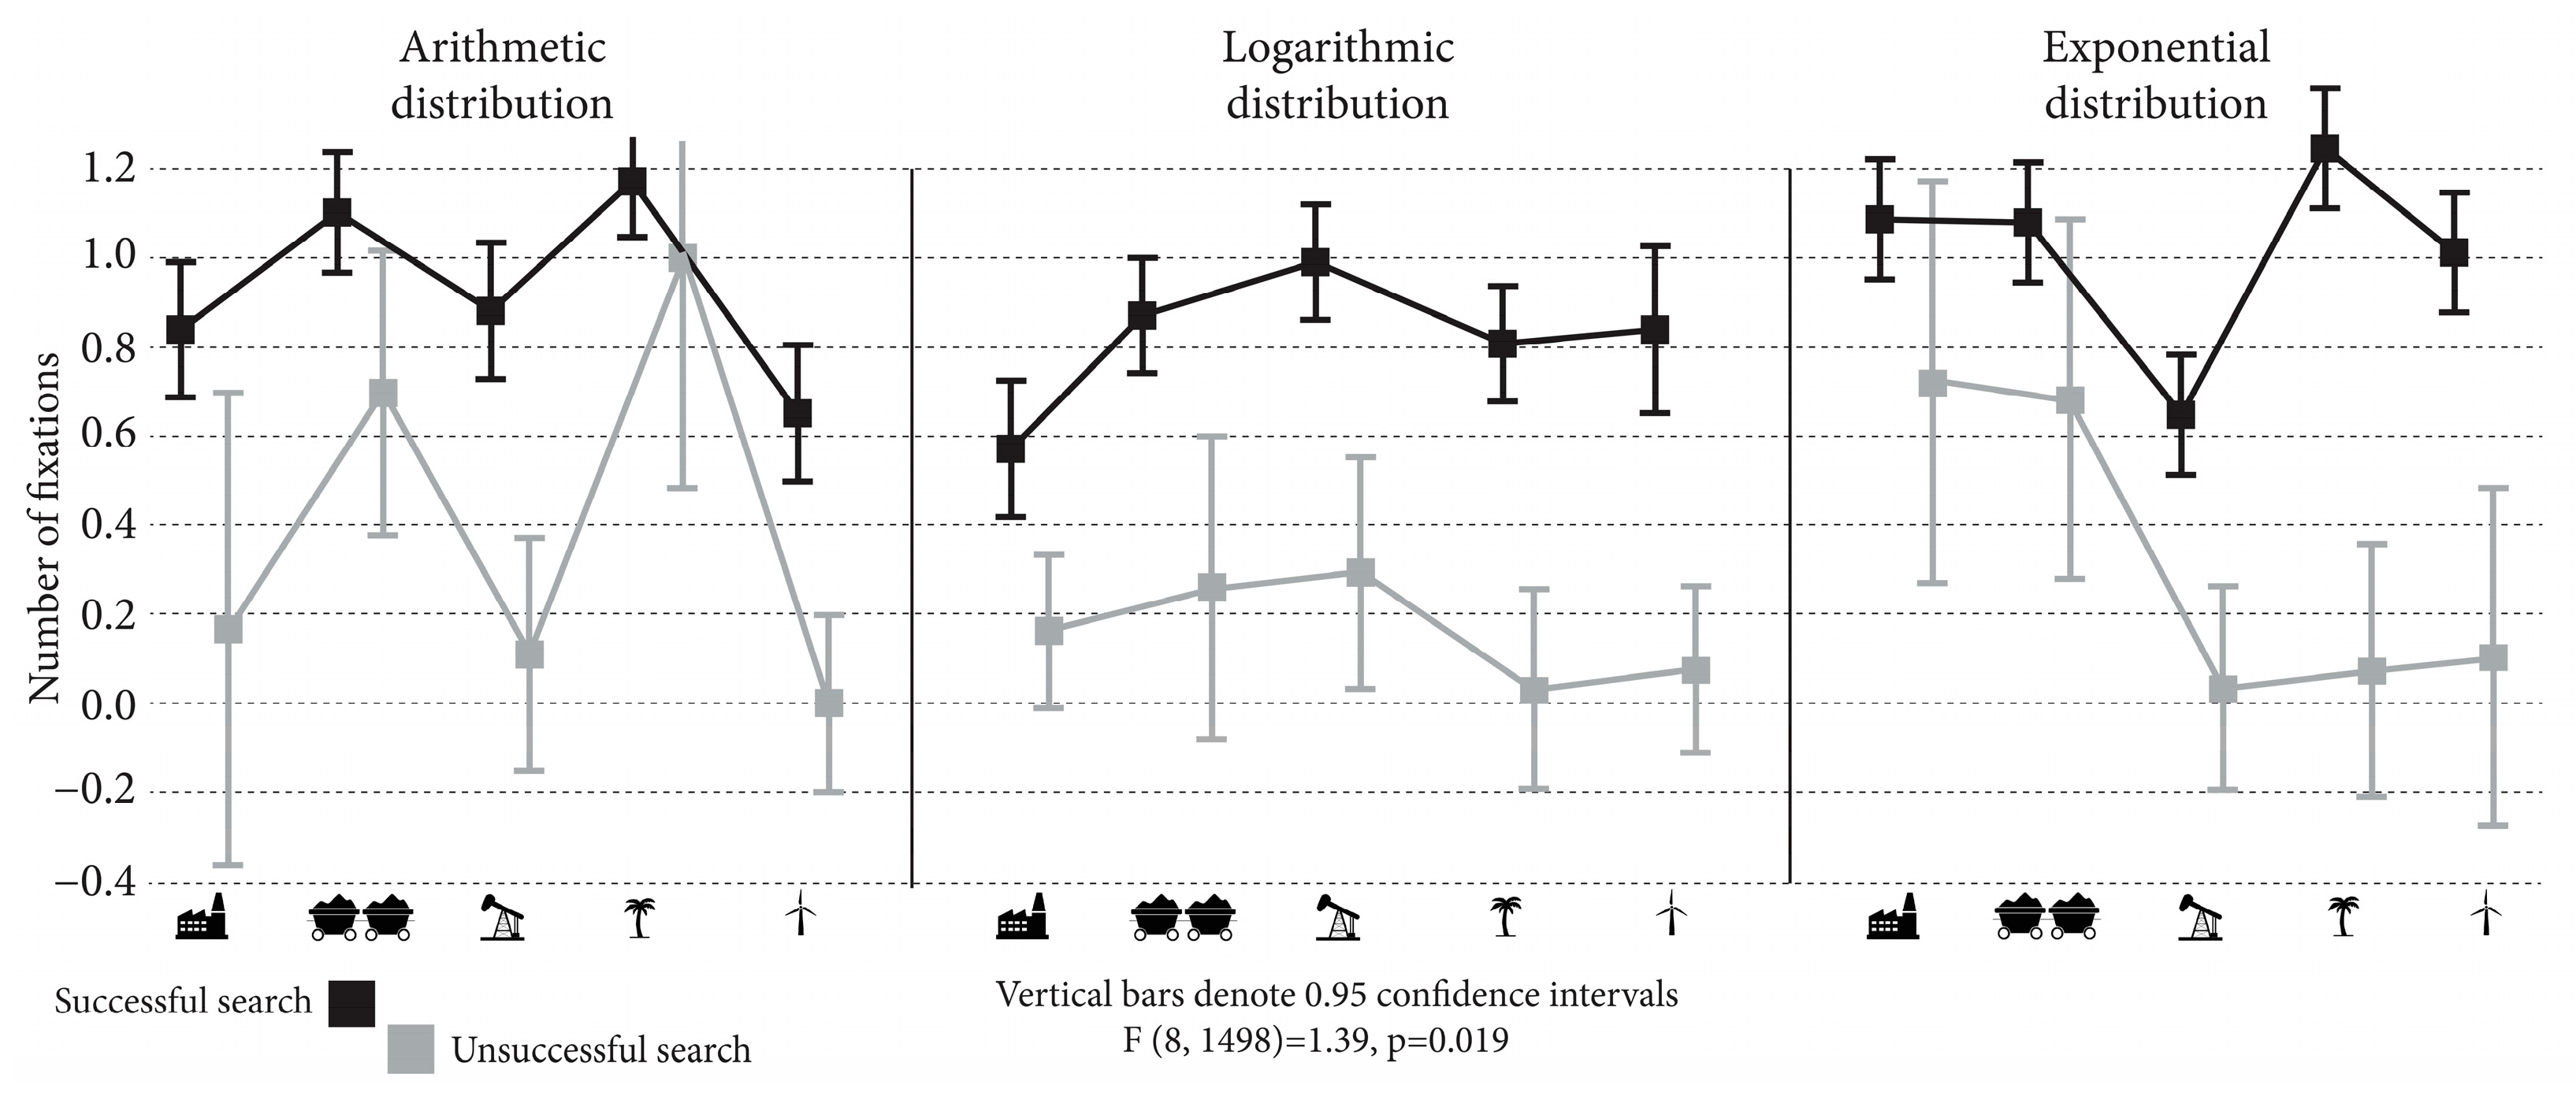
To locate one symbol motion at a different speed than the others among 20 identical dynamic symbols within one second, it is essential to examine the user’s visual attention dynamics during this brief animation. The first factor here is the number of fixations on the symbol being searched for, both in the bottom-up and top-down processes. The statistical analysis utilized repeated measures ANOVA (rANOVA), with a 5 × 3 × 2 design, where the within-subject factors were symbol icon (5 conditions), motion distribution scale (3 conditions), and search success (2 conditions).
Figure 5 presents differences in the average number of fixations on the target symbol, taking into account diverse motion distribution scales, dynamic symbol icon, and search success. The differences between search conditions (top-down and bottom-up) did not show statistical significance.
According to
Figure 5, unsuccessful participants struggled to visually capture the target symbol. This challenge is particularly evident in the logarithmic distribution of motion among the symbol classes. Unlike the exponential and arithmetic distributions where several symbols achieved an average of 1 or almost 1 fixation, suggesting that unsuccessful participants might have seen the target but were unsure due to the distractors’ speed, the logarithmic distribution failed to effectively target the fastest-changing symbol.
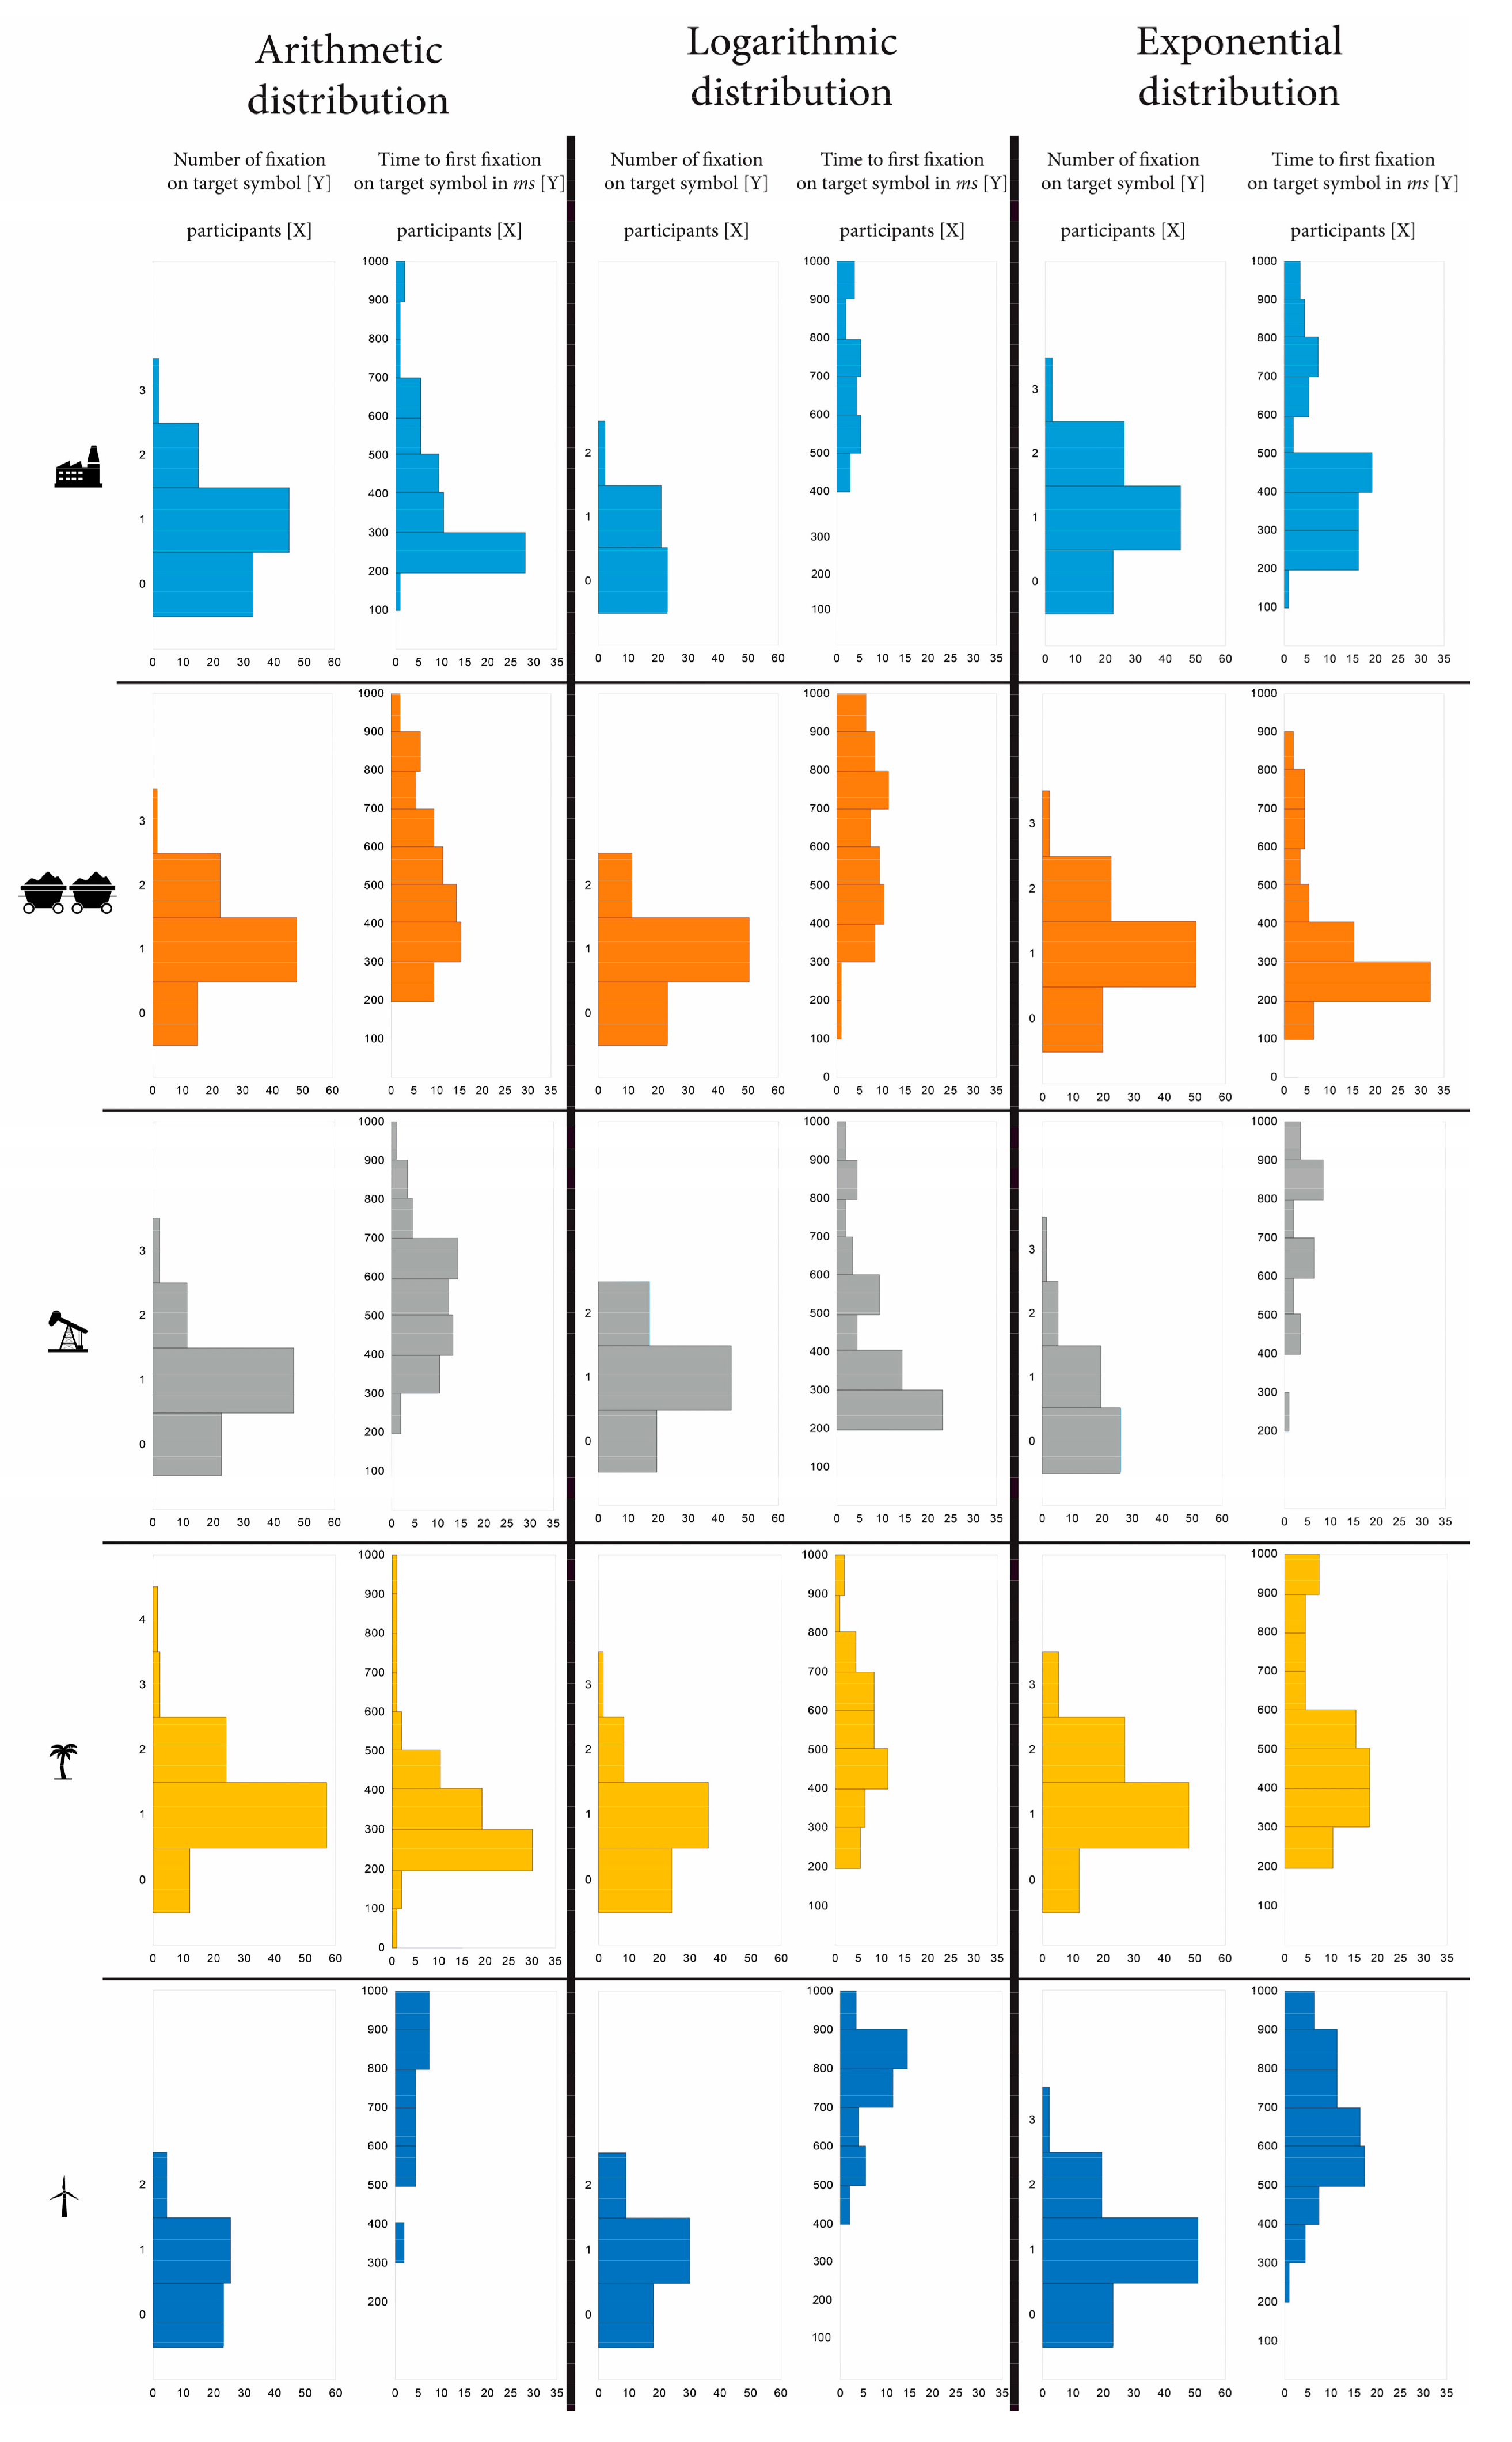
However, it should be noted that, during the one second in which the map was displayed, users had an average of 1 to 1.5 fixations, regardless of the conditions in which they viewed the symbol they were looking for. Therefore, additionally, it is important to examine the overall distribution of the number of fixations on the target. However, given that there were no statistically significant differences between bottom-up and top-down processing, the summary presented in
Figure 6 serves as an overview of time to the first fixation and fixation count.
In the analysis of participants’ eye movements during the detection of specific animated symbols on the arithmetic scale, distinct patterns emerged for various icons. For the factory icon, 33 participants showed remarkable efficiency, with 0 fixations on the target, while 45 participants had 1 fixation. The mine cart icon presented a different trend, with 15 participants exhibiting 0 fixations and 48 having 1 fixation on the target. The oil rig icon revealed 22 participants without fixations and 46 with only one fixation. The palm tree icon demonstrated a mix, with 12 participants having 0 fixations and 57 having 1. Lastly, the wind turbine icon displayed 23 participants with 0 fixations and 25 with only 1 fixation.
Notably, participants varied in the timing of their first fixations on the target symbols. For instance, 28 participants for the factory icon and 9 participants for the mine cart icon achieved their first fixations between 200 and 300 ms. Additionally, two participants for the oil rig icon and three participants for the palm tree icon fixated on the target within 200–300 milliseconds. Symbols that scored the highest success rate had the fastest time to the first fixation, occurring in less than 0.3 s. The more cognitively challenging dynamic symbols, from the participants’ perspective, took longer to elicit the first fixation.
To analyze the statistical significance of the time to the first fixation on the target across both search conditions, a factorial ANOVA with a 5 × 3 design was employed. The results revealed a highly significant relationship (F = 25.27, p = 10−5). On the arithmetic scale, the palm tree emerged as the symbol fixated the fastest (average 279 ms), corresponding to its high success rate. On the other hand, the wind turbine, with the lowest success rate, also had the slowest time to the first fixation (average 739 ms). On the logarithmic scale, the oil rig was the symbol fixated the fastest (average 438 ms), aligning with its high success rate on the motion distribution scale. Once again, the wind turbine exhibited the slowest time to the first fixation (average 751 ms) but did not have the lowest success rate. The factory, identified as the most challenging to perceive on the logarithmic scale, also had a prolonged time to the first fixation (average 686 ms). On the exponential motion distribution scale, the mine cart was the symbol fixated the fastest (average 344 ms), corresponding to its success rate on that scale. Another highly successful symbol, the factory, showed a very similar time to the first fixation (average 466 ms). Surprisingly, the oil rig, which was poorly detected on the exponential scale, had the lowest time to the first fixation (average 710 ms). It appears that the wind turbine’s dynamics were challenging to fixate, consistently scoring the lowest time to the first fixations across all motion distribution scales.
4.3. Focusing on the Target
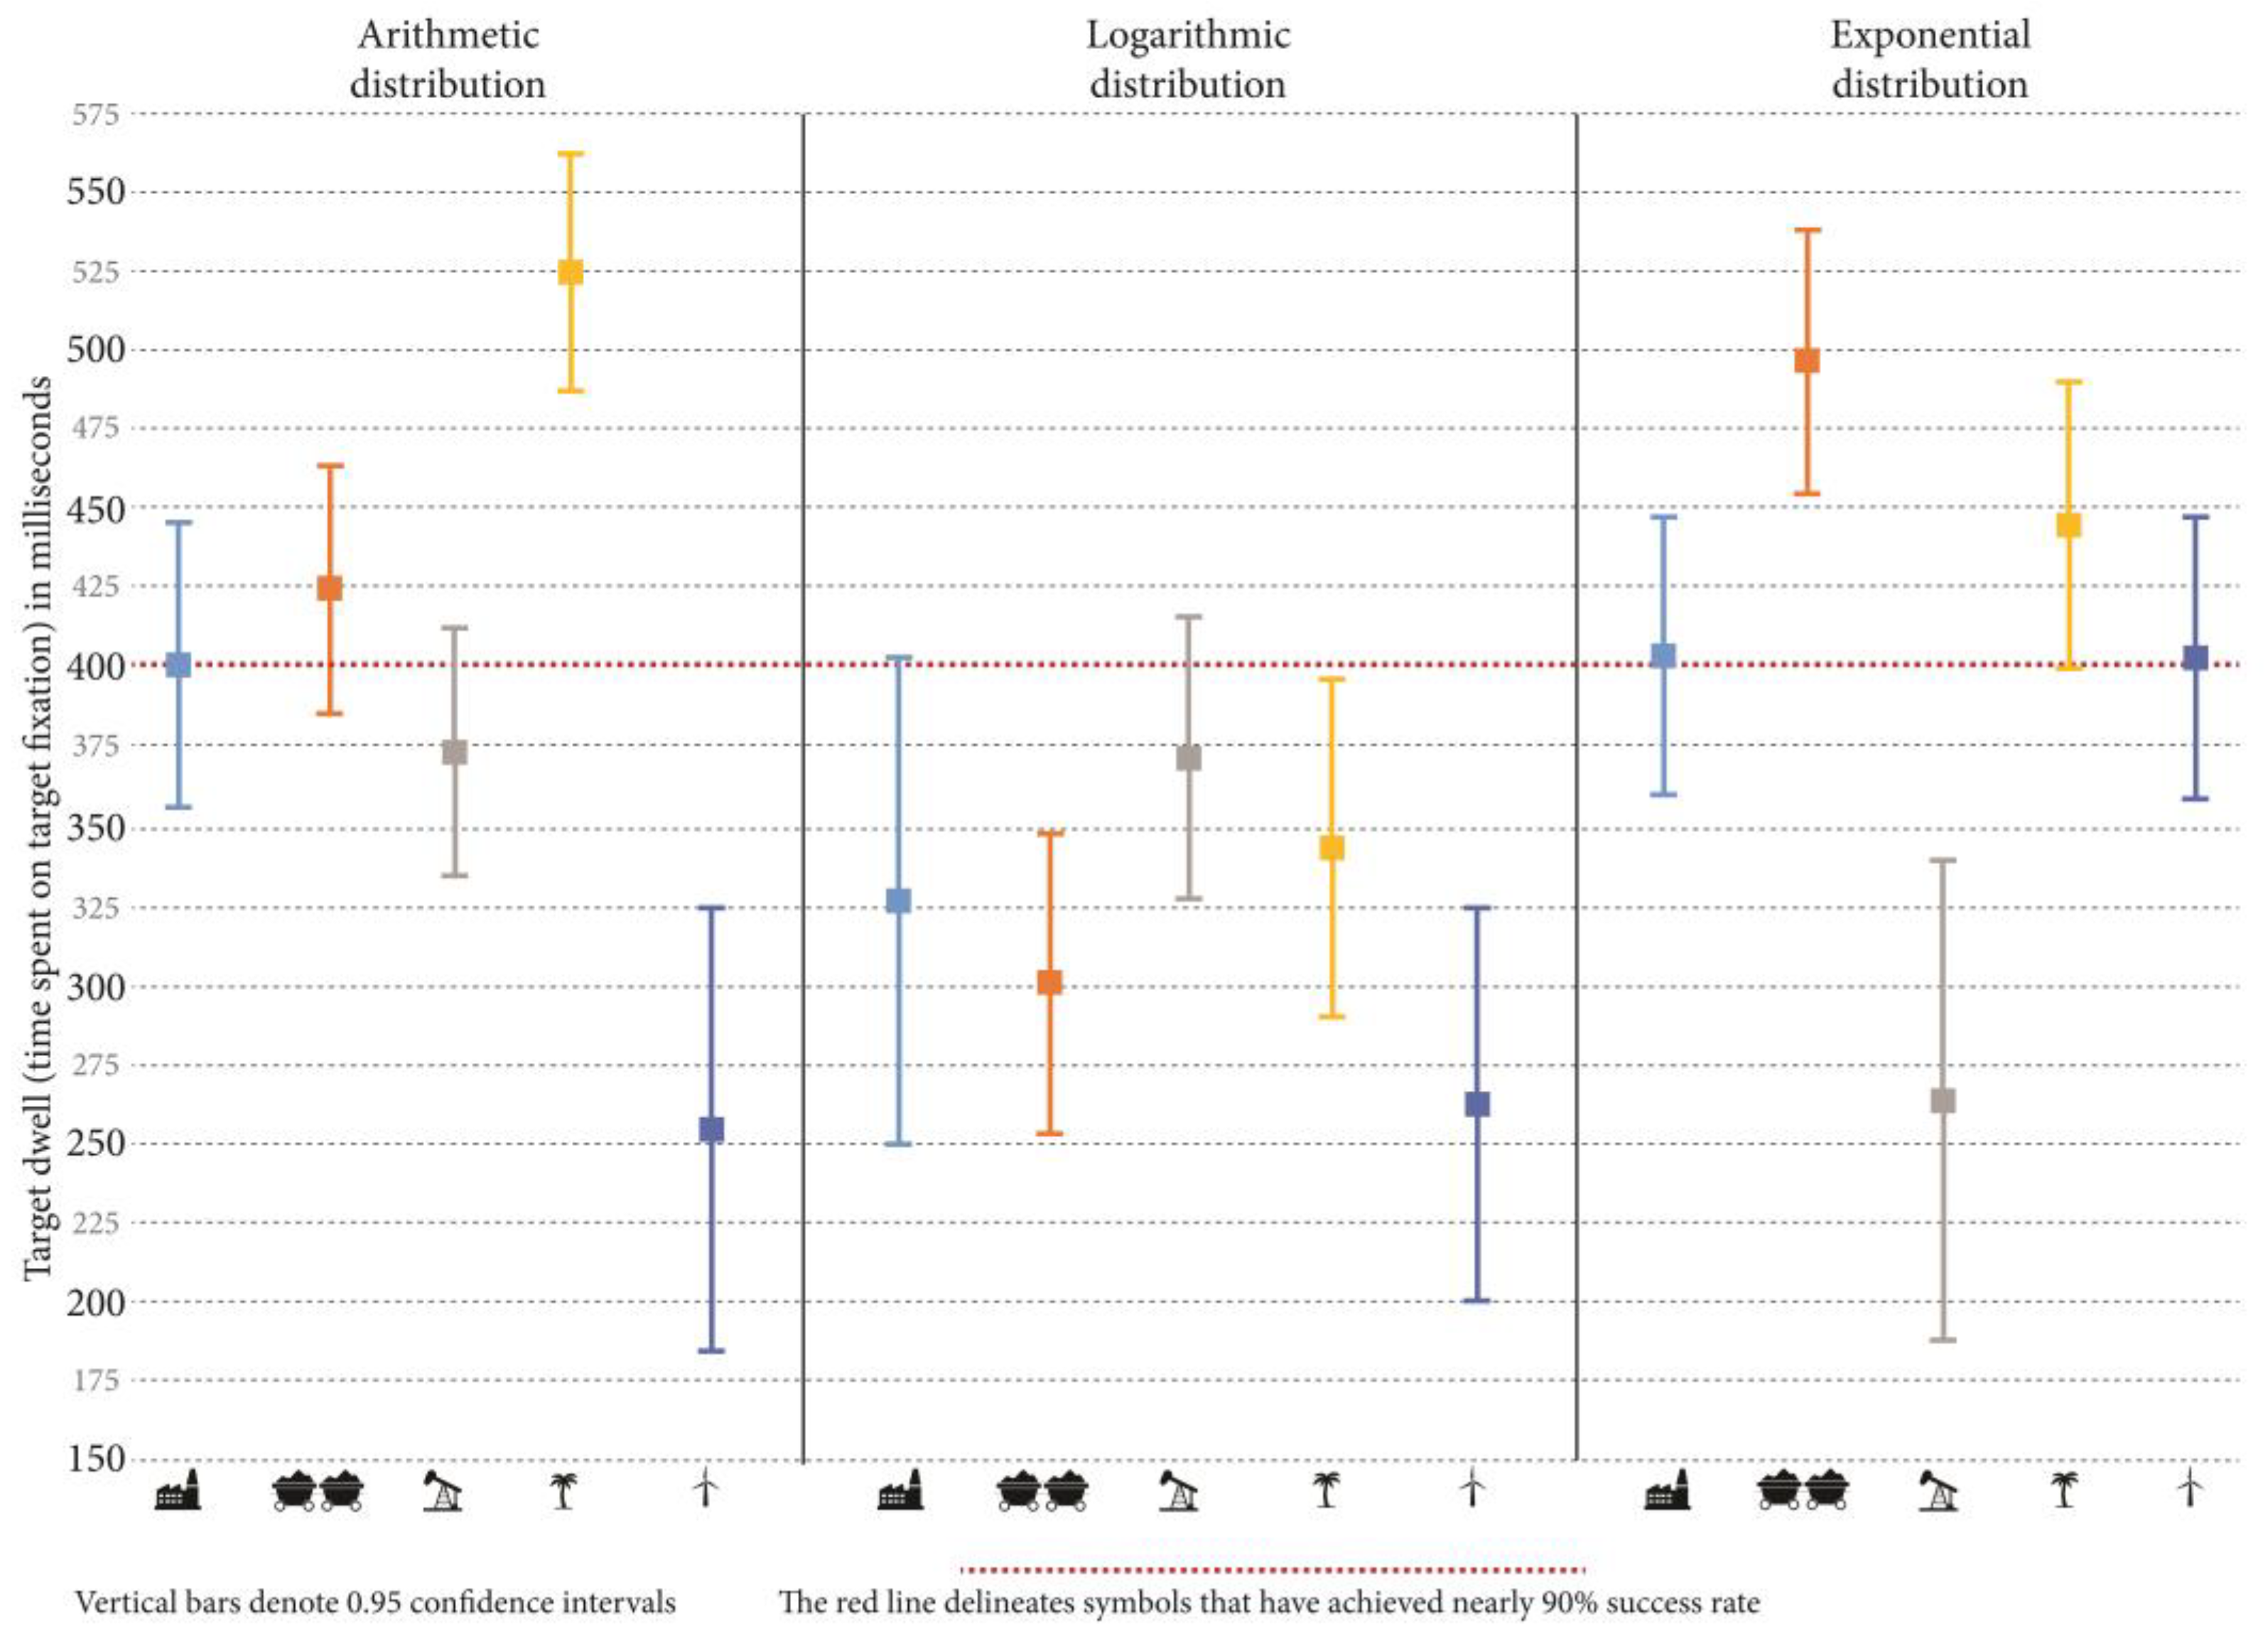
To assess the statistical significance of the dwell time on the target symbol under both search conditions, a factorial ANOVA with a 5 × 3 design was utilized. The results showed highly statistically significant differences among within subject factors (F = 6.38,
p = 10
−6) and are presented in
Figure 7.
In
Figure 7, the data indicate a notable pattern in visual processing during preattentive stages. Symbols that were successfully detected in this early, automatic processing phase, characterized by at least one fixation and a high success rate exceeding 90%, demonstrated a prolonged fixation time on the respective symbol. The fixation time, surpassing 400 milliseconds, suggests that these symbols captured more focused and sustained attention during the initial, rapid processing.
Secondly, symbols with the lowest success rates exhibited notably brief dwell times on target symbols, a trend particularly evident in the wind turbine symbol on the arithmetic scale of motion distribution and the oil rig symbol on the exponential scale of motion distribution.
The logarithmic distribution seems to confuse attention capturing, as the results are consistently worse. Study participants had difficulty correctly identifying the fastest-changing symbol, as reflected in the number of fixations on the target based on search success (see
Figure 5).
5. Discussion
The results of the success rate clearly indicate, and this was statistically validated, that, in alignment with findings from psychological research [
34,
37], the speed of movement is indeed a preattentive feature of objects. However, in the field of cartography, the specific representation of this movement through symbols plays a crucial role in determining how effectively it is noticed. This emphasizes the importance of understanding the nuances of symbol representation, shedding light on the intricate relationship between movement characteristics and symbol design in the cartographic context. Further exploration of these dynamics could contribute valuable insights into optimizing symbol design for enhanced preattentive processing.
Some of these dynamics cause cognitive issues reflected in the number of fixations, which were relatively low for the wind turbine, especially within arithmetic and logarithmic distributions. It should be noted that the motion related to the wind turbine symbol was rotational. This specific kind of movement is more adequately applicable to geometrical symbols like a pentagon or square [
22,
23]. This type of movement was also effectively applied in human–machine interfaces, where rotational elements were simple geometrical shapes rather than pictorial symbols [
63].
Investigation into participants’ responses to animated symbols unveiled distinctive fixation patterns across various icons, emphasizing the role of symbol design and motion in preattentive processing [
23]. The timing of first fixations further highlighted individual differences in cognitive processing, providing valuable insights into the visual dynamics associated with each symbol. From the standpoint of vision theories and preattentive processing, it is intriguing that the initial fixations on the searched symbol occurred approximately 200 milliseconds after the onset of the phase when preattentive vision typically concludes. This timing aligns with the theoretical understanding of the cognitive processes involved in the early stages of visual perception [
33,
34,
35,
36].
The results showed that elements perceived preattentively tend to engage cognitive resources for a longer duration. This observation underscores the significance of dwell time as an indicator of the cognitive processing depth and attentional allocation during the early stages of visual perception. This is confirmed by studies focusing on the cognition of preattentive features [
46,
64]. The relationship between low success rates and short dwell times on target symbols in eye-tracking studies can be attributed to several factors related to the fact that participants struggle to recognize the fastest symbol and fixate somewhere else, leading to a serial search [
37,
48].
6. Conclusions
At this point, it is possible to answer the research questions posed at the beginning, thanks to the obtained results, a well-conducted experiment, and the disclosure of certain relationships facilitated by the eye-tracking technology. Answering the first research question, which was “What is the impact of motion velocity as a preattentive attribute in pictorial symbols on the comprehension speed of animated maps?”, the following answer can be given:
Motion velocity can enhance the salience of animated symbols, making them stand out against static elements, but even more interesting is that it can stand out against other animated distractors. Rapid motion can attract attention preattentively, quickly drawing the viewer’s gaze to the animated symbol, facilitating automatic identification and engaging cognitive resources, resulting in longer dwell time.
The answer to the second research question, which was “How should the differences between speed classes of pictorial symbols be distributed so that the fastest-changing symbol could be perceived preattentively?”, is that the most successful motion distributions were found to be those based on exponential or arithmetic scales. The latter is particularly recommended considering the high success rates observed among study participants.
While the pictorial symbol forming the basis of dynamic symbols slightly complicates the interpretation of the results, it is crucial to acknowledge that each symbol carries its own semiotics and associated movement. Therefore, the answer to the third research question, “Which of the designed pictorial symbols are perceived preattentively?”, requires broader explanation. There were types of motion, like rotational, which did not work well with pictorial symbols, even on the most effective motion distribution scale. However, the animation must align with symbol semiotics; for instance, the symbol of a factory with smoke is inherently natural. It would be an unconventional approach if an animation unrelated to the symbolism of the point was used instead, for example, if the factory symbol took on the same animation as a mine cart.
Although it can be observed that most of the symbols examined in this study exhibit similar behavior on arithmetic and exponential scales, specific types of movement are not perceived uniformly by users. However, the location where an animated symbol occurs on a map, and its graphical relationship to other symbols and textual elements will be of vast importance for interpreting all symbols. Therefore, exploring various geographical relationships is an intriguing and open question that remains for future research.
At this juncture, it is crucial to highlight a certain limitation of this study, which is associated with the fact that, for experimental reasons, it was not feasible to examine a vast number of pictorial symbols. Consequently, it is postulated that future research should aim to comprehensively explore and determine the types of movement, possibly including directional aspects, that are best suited for utilization as dynamic point symbols. By leveraging preattentive features in cartographic symbol design, cartographers could aim to enhance the efficiency of map reading and comprehension. Preattentively processed symbols allow map readers to quickly extract essential information from a map, facilitating a more intuitive and effective identification of spatial data. From this perspective, more studies on the preattentive processing of cartographic messages are needed in future research. Another limitation of this study relates to the equipment used in the experimental procedure. Despite the implementation of a high-precision eye tracker, nowadays, there are possibilities to evaluate user experience and performance using EEG (electroencephalography) or think-aloud protocols, which might be considered in future studies.


