

Semantic-Enhanced Graph Convolutional Neural Networks for Multi-Scale Urban Functional-Feature Identification Based on Human Mobility
 , , , and
Abstract
1. Introduction
2. Related Work
2.1. Place Embedding with Graph Convolutional Neural Networks
2.2. Advanced Data and Methods for Urban Land-Use Identification
3. Methodology
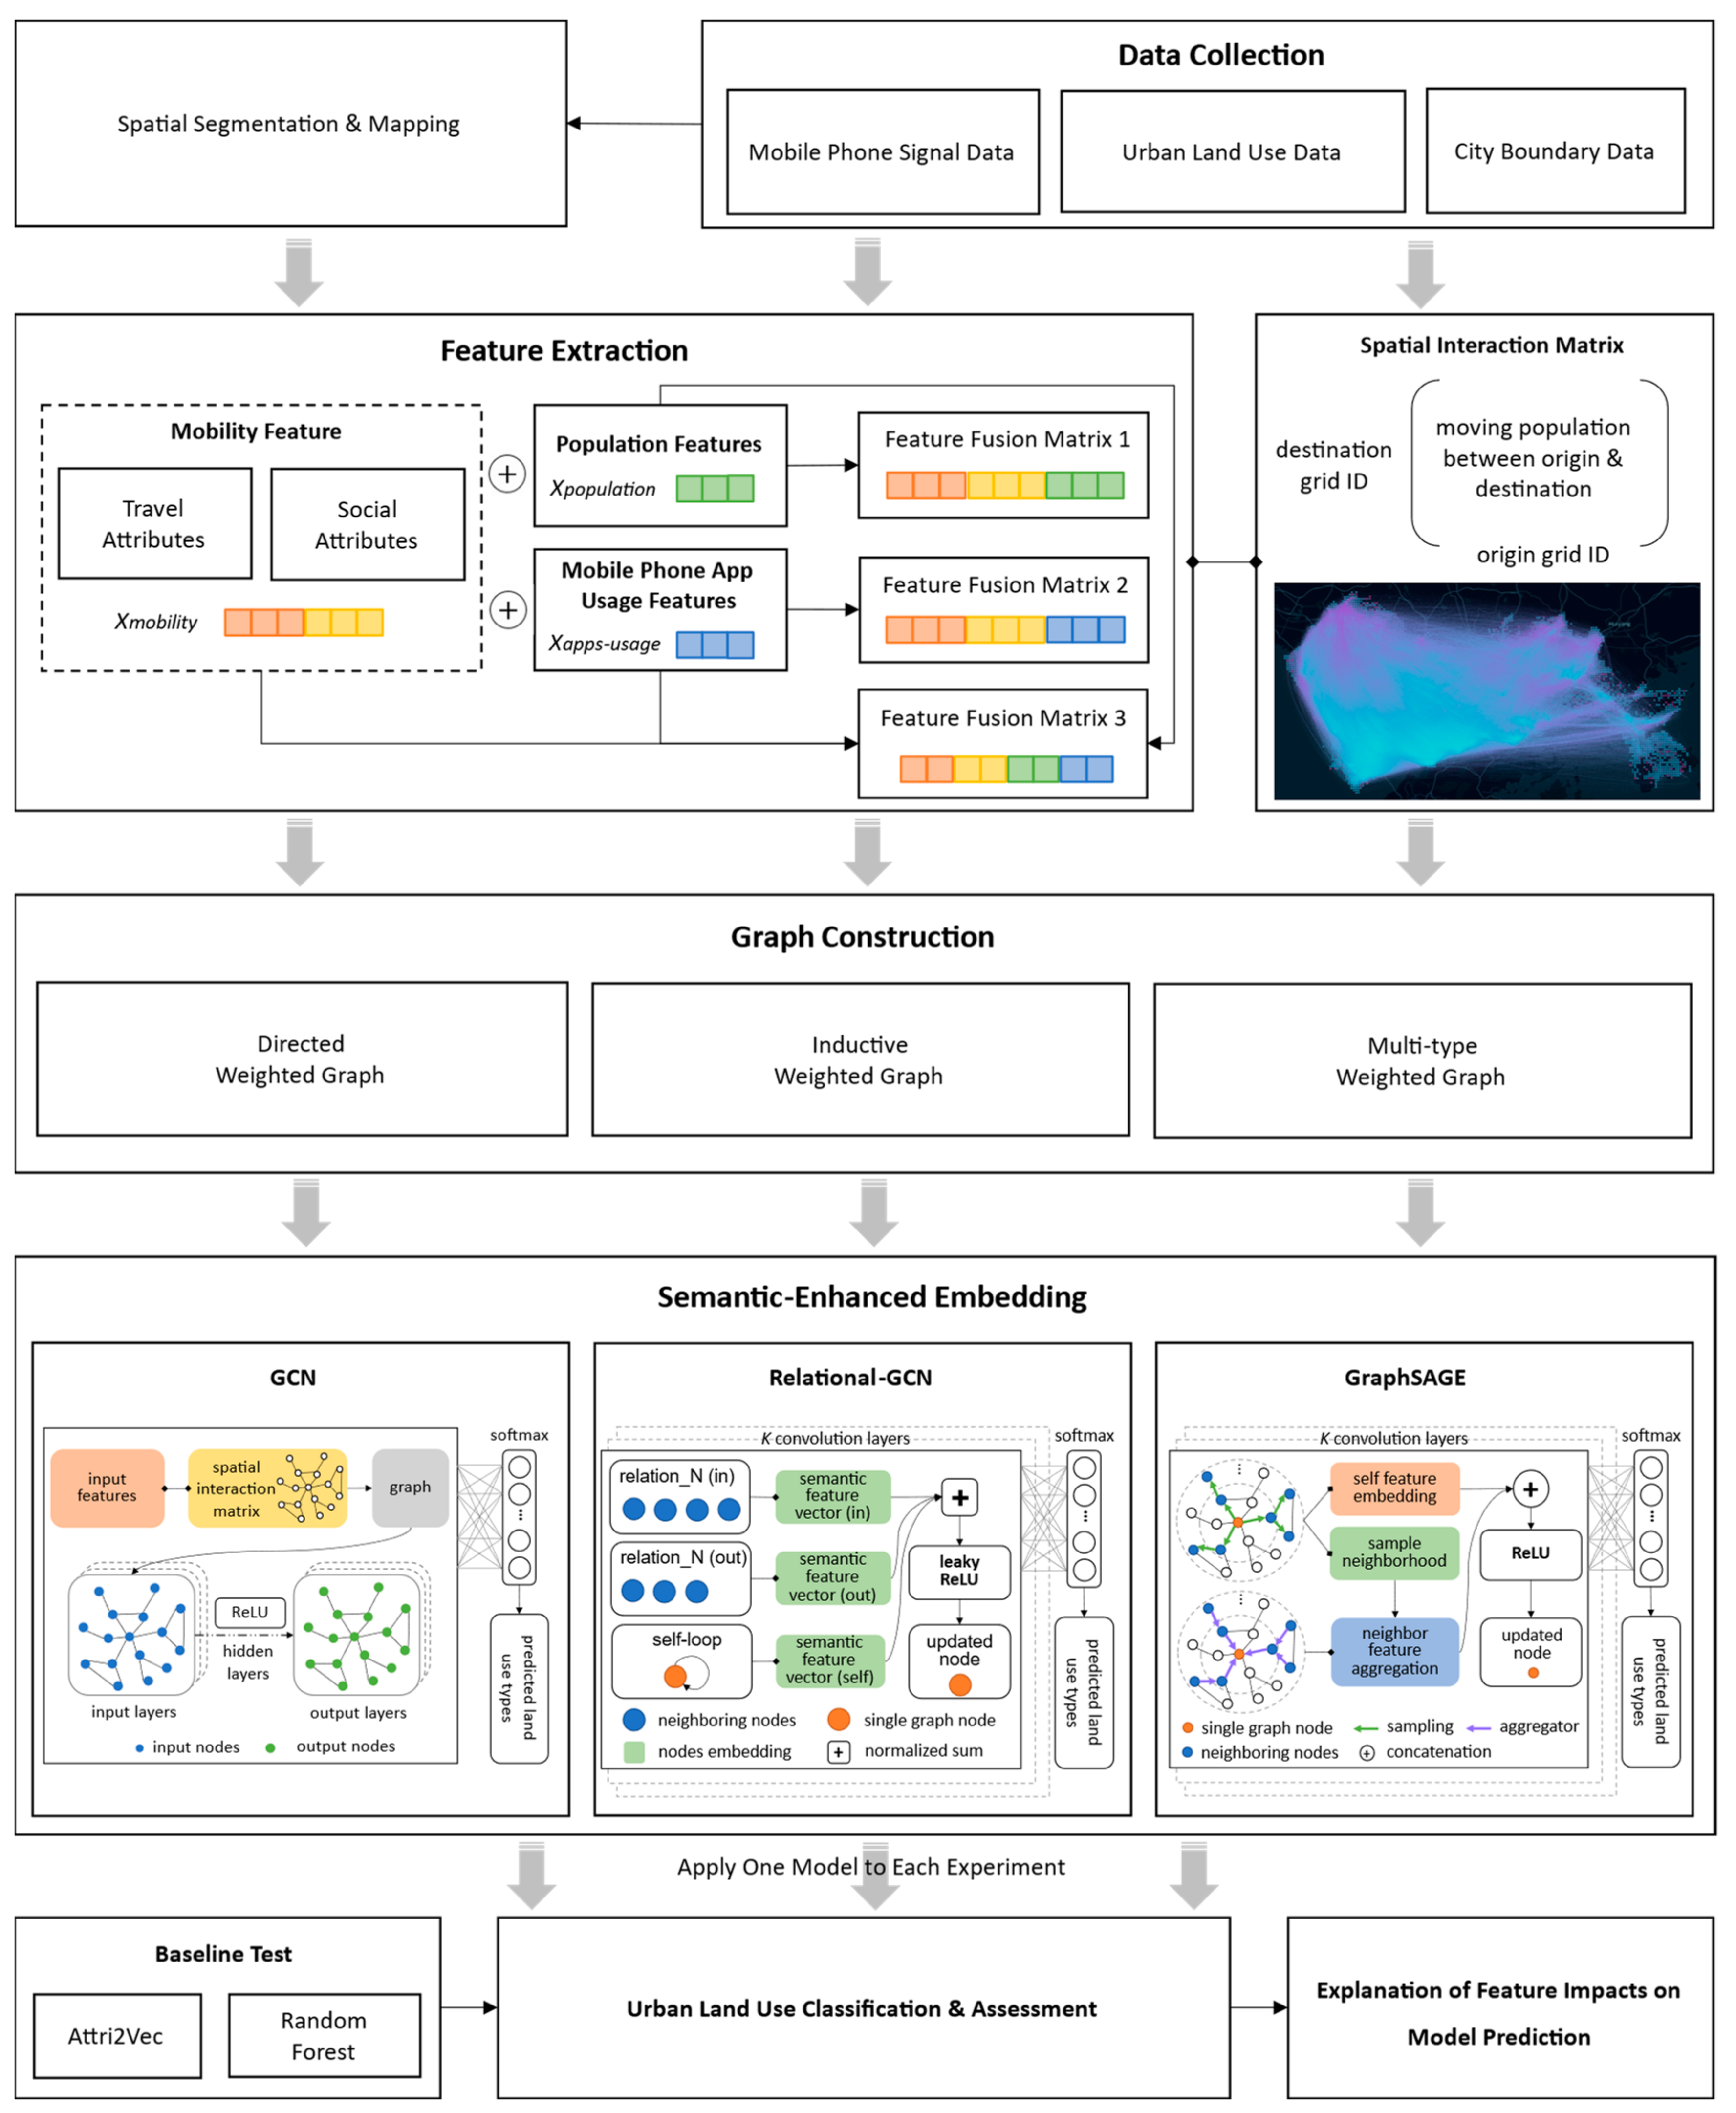
3.1. Overview
3.2. Graph Representation
3.2.1. Building the Grid-Travel Corpus
3.2.2. Generating a Feature Matrix from Multi-Modal Data Fusion
3.2.3. Constructing Semantic-Enhanced Graph
3.3. Graph Convolution
3.3.1. GCN
3.3.2. Relational GCN
3.3.3. GraphSAGE
4. Implementation and Results
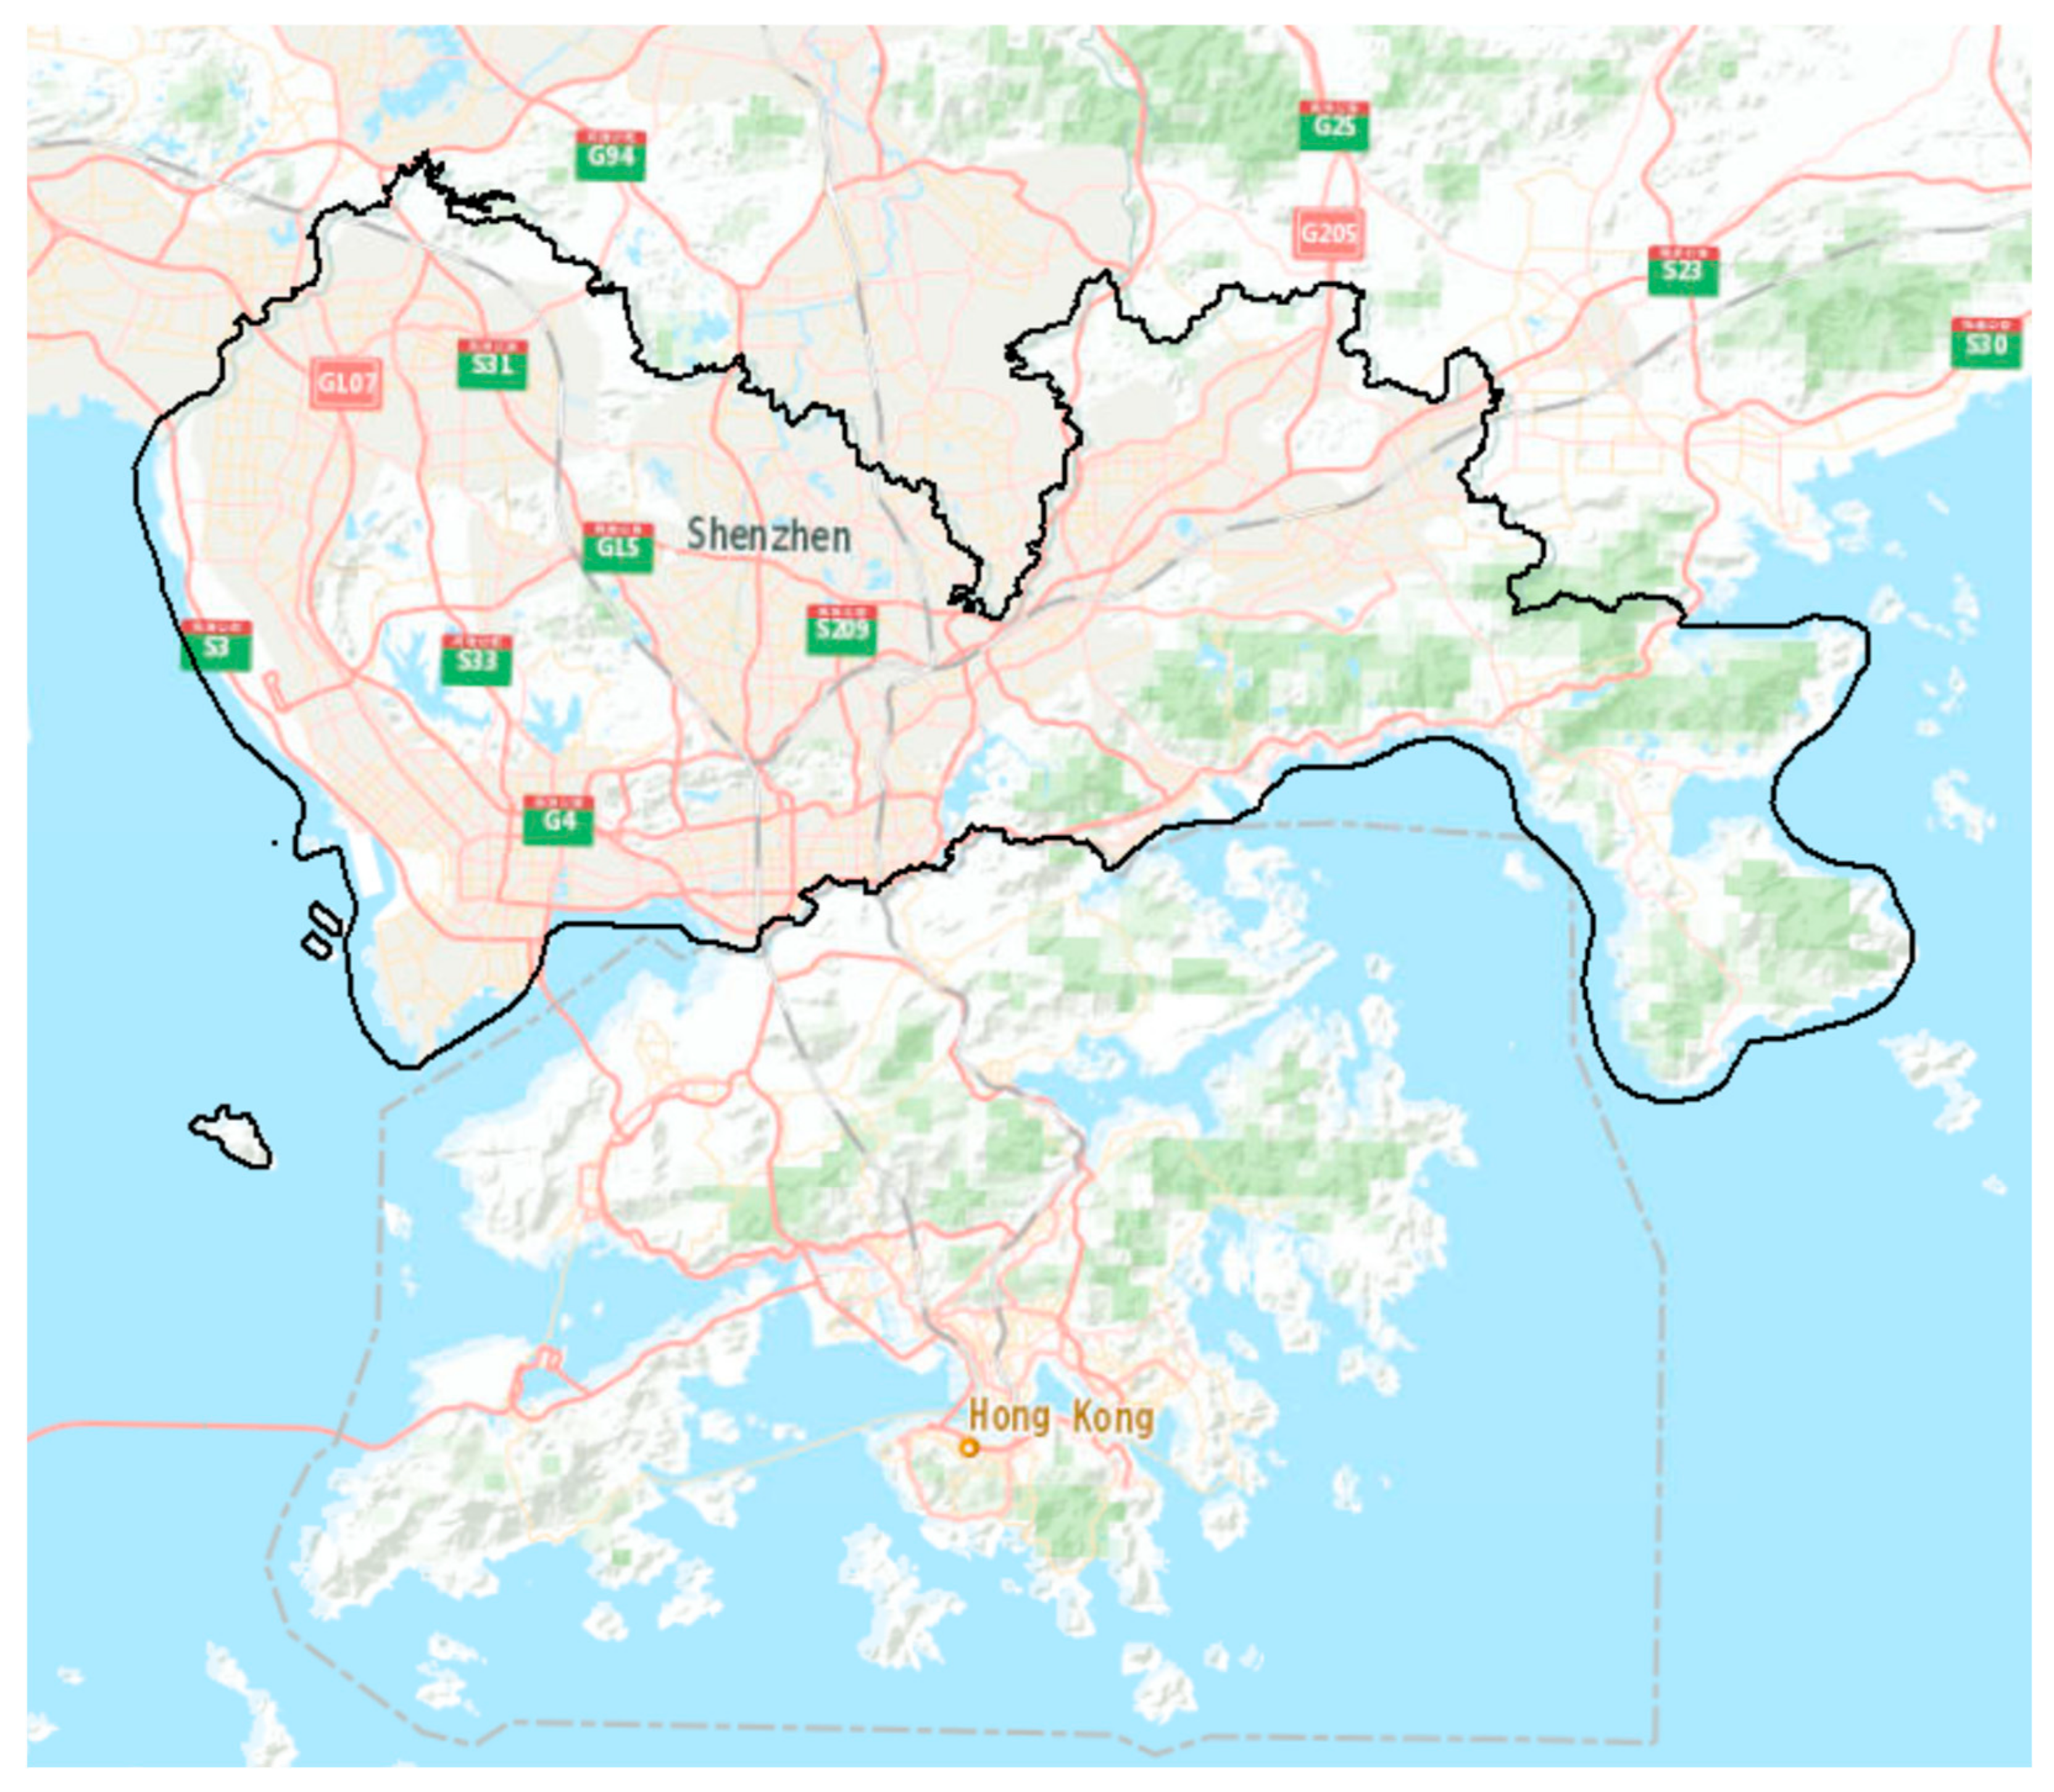
4.1. Study Area and Data Description
4.2. Geo-Semantic Embedding and Prediction
4.3. Results of Urban Functional Feature Identification
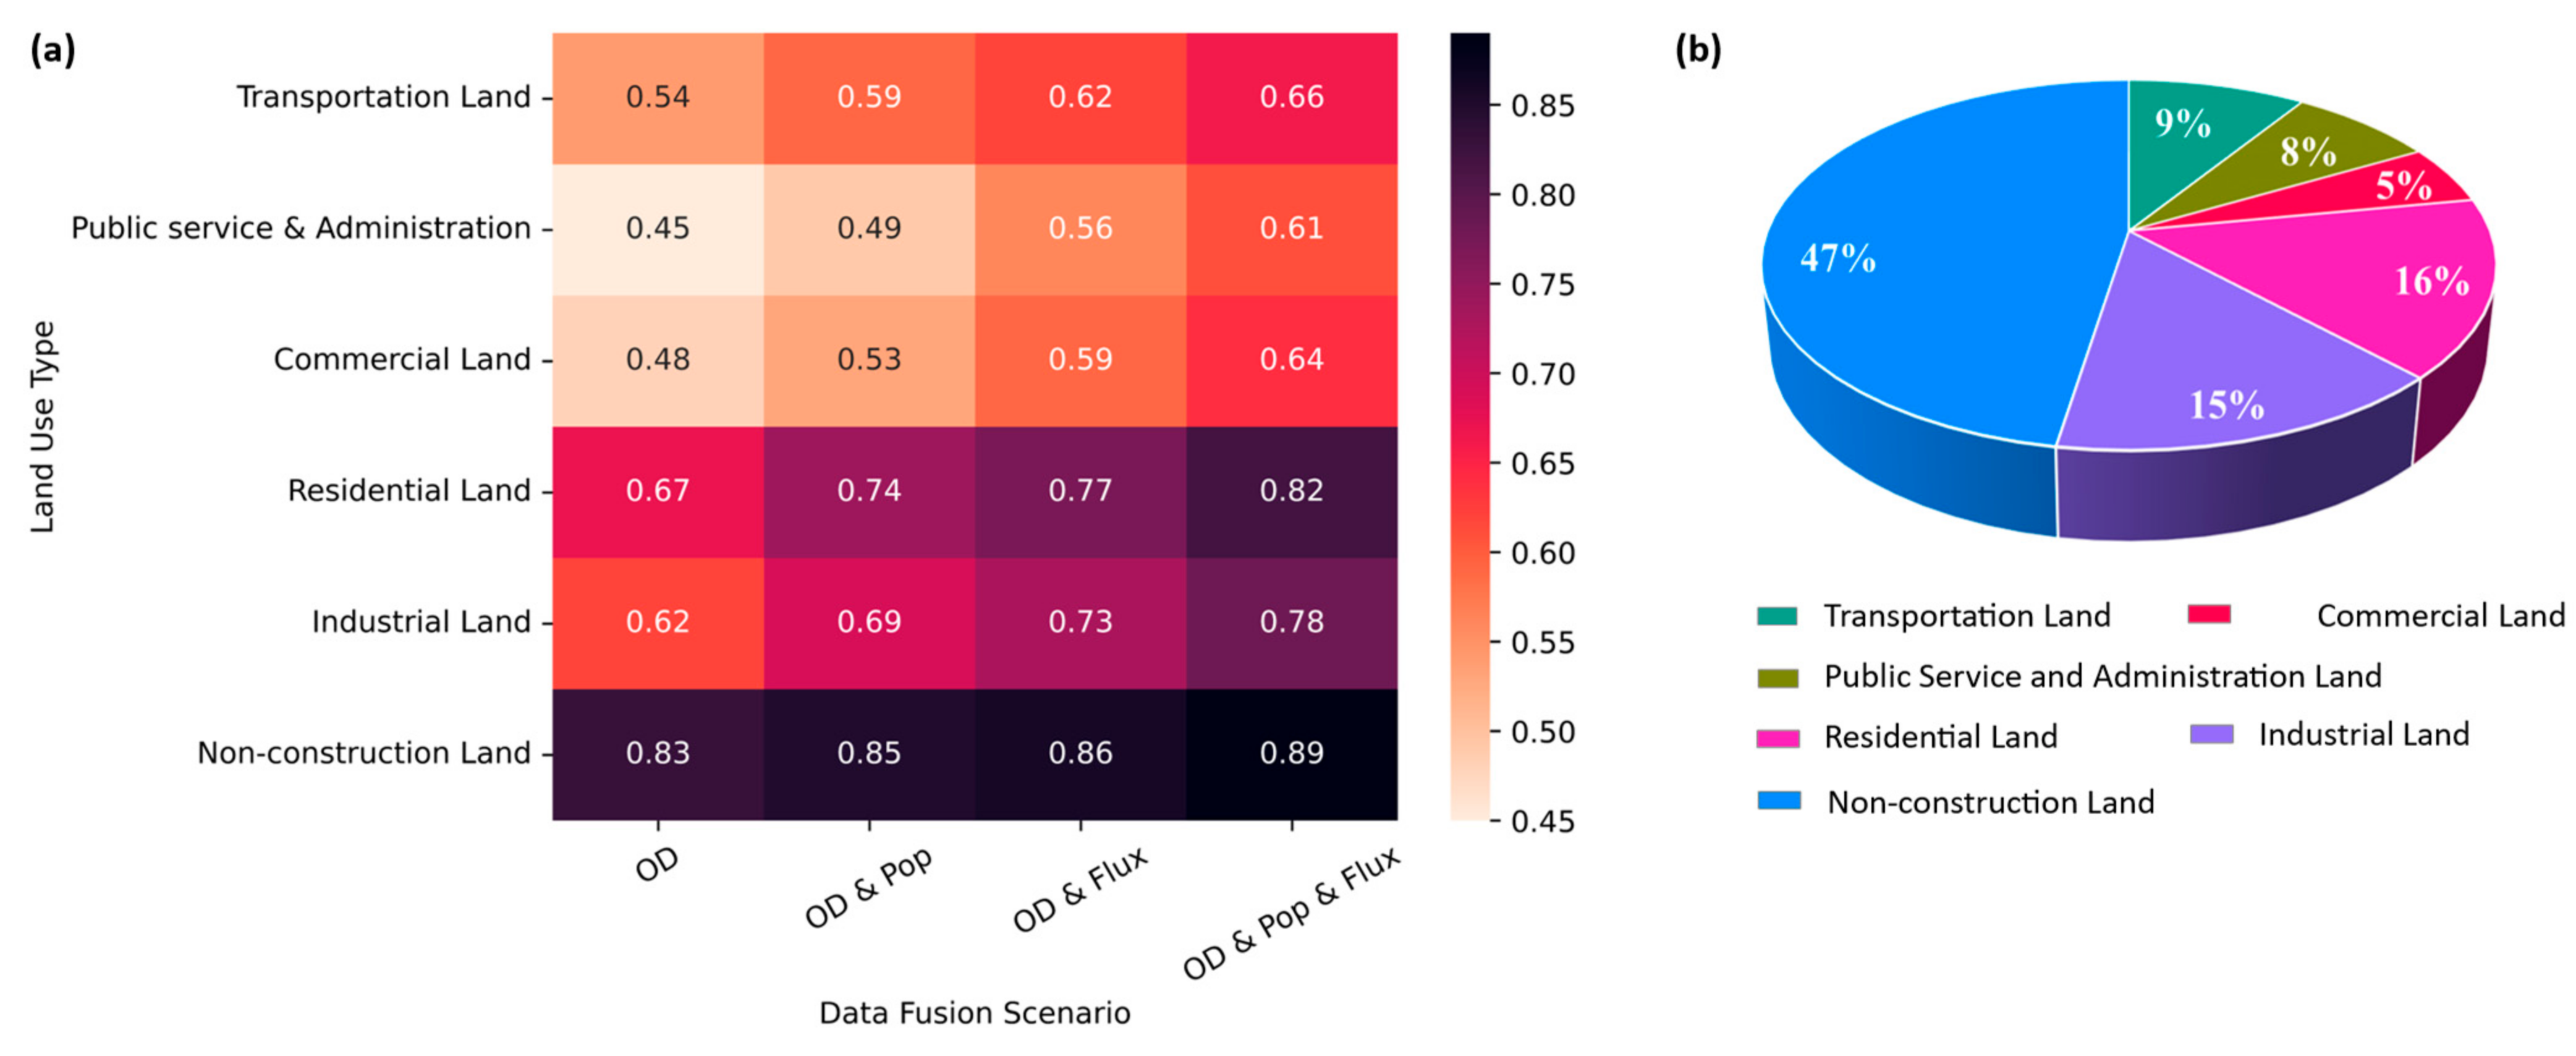
4.3.1. The Performance of Multi-Modal Data Fusion
4.3.2. The Performance of Different Embedding Models
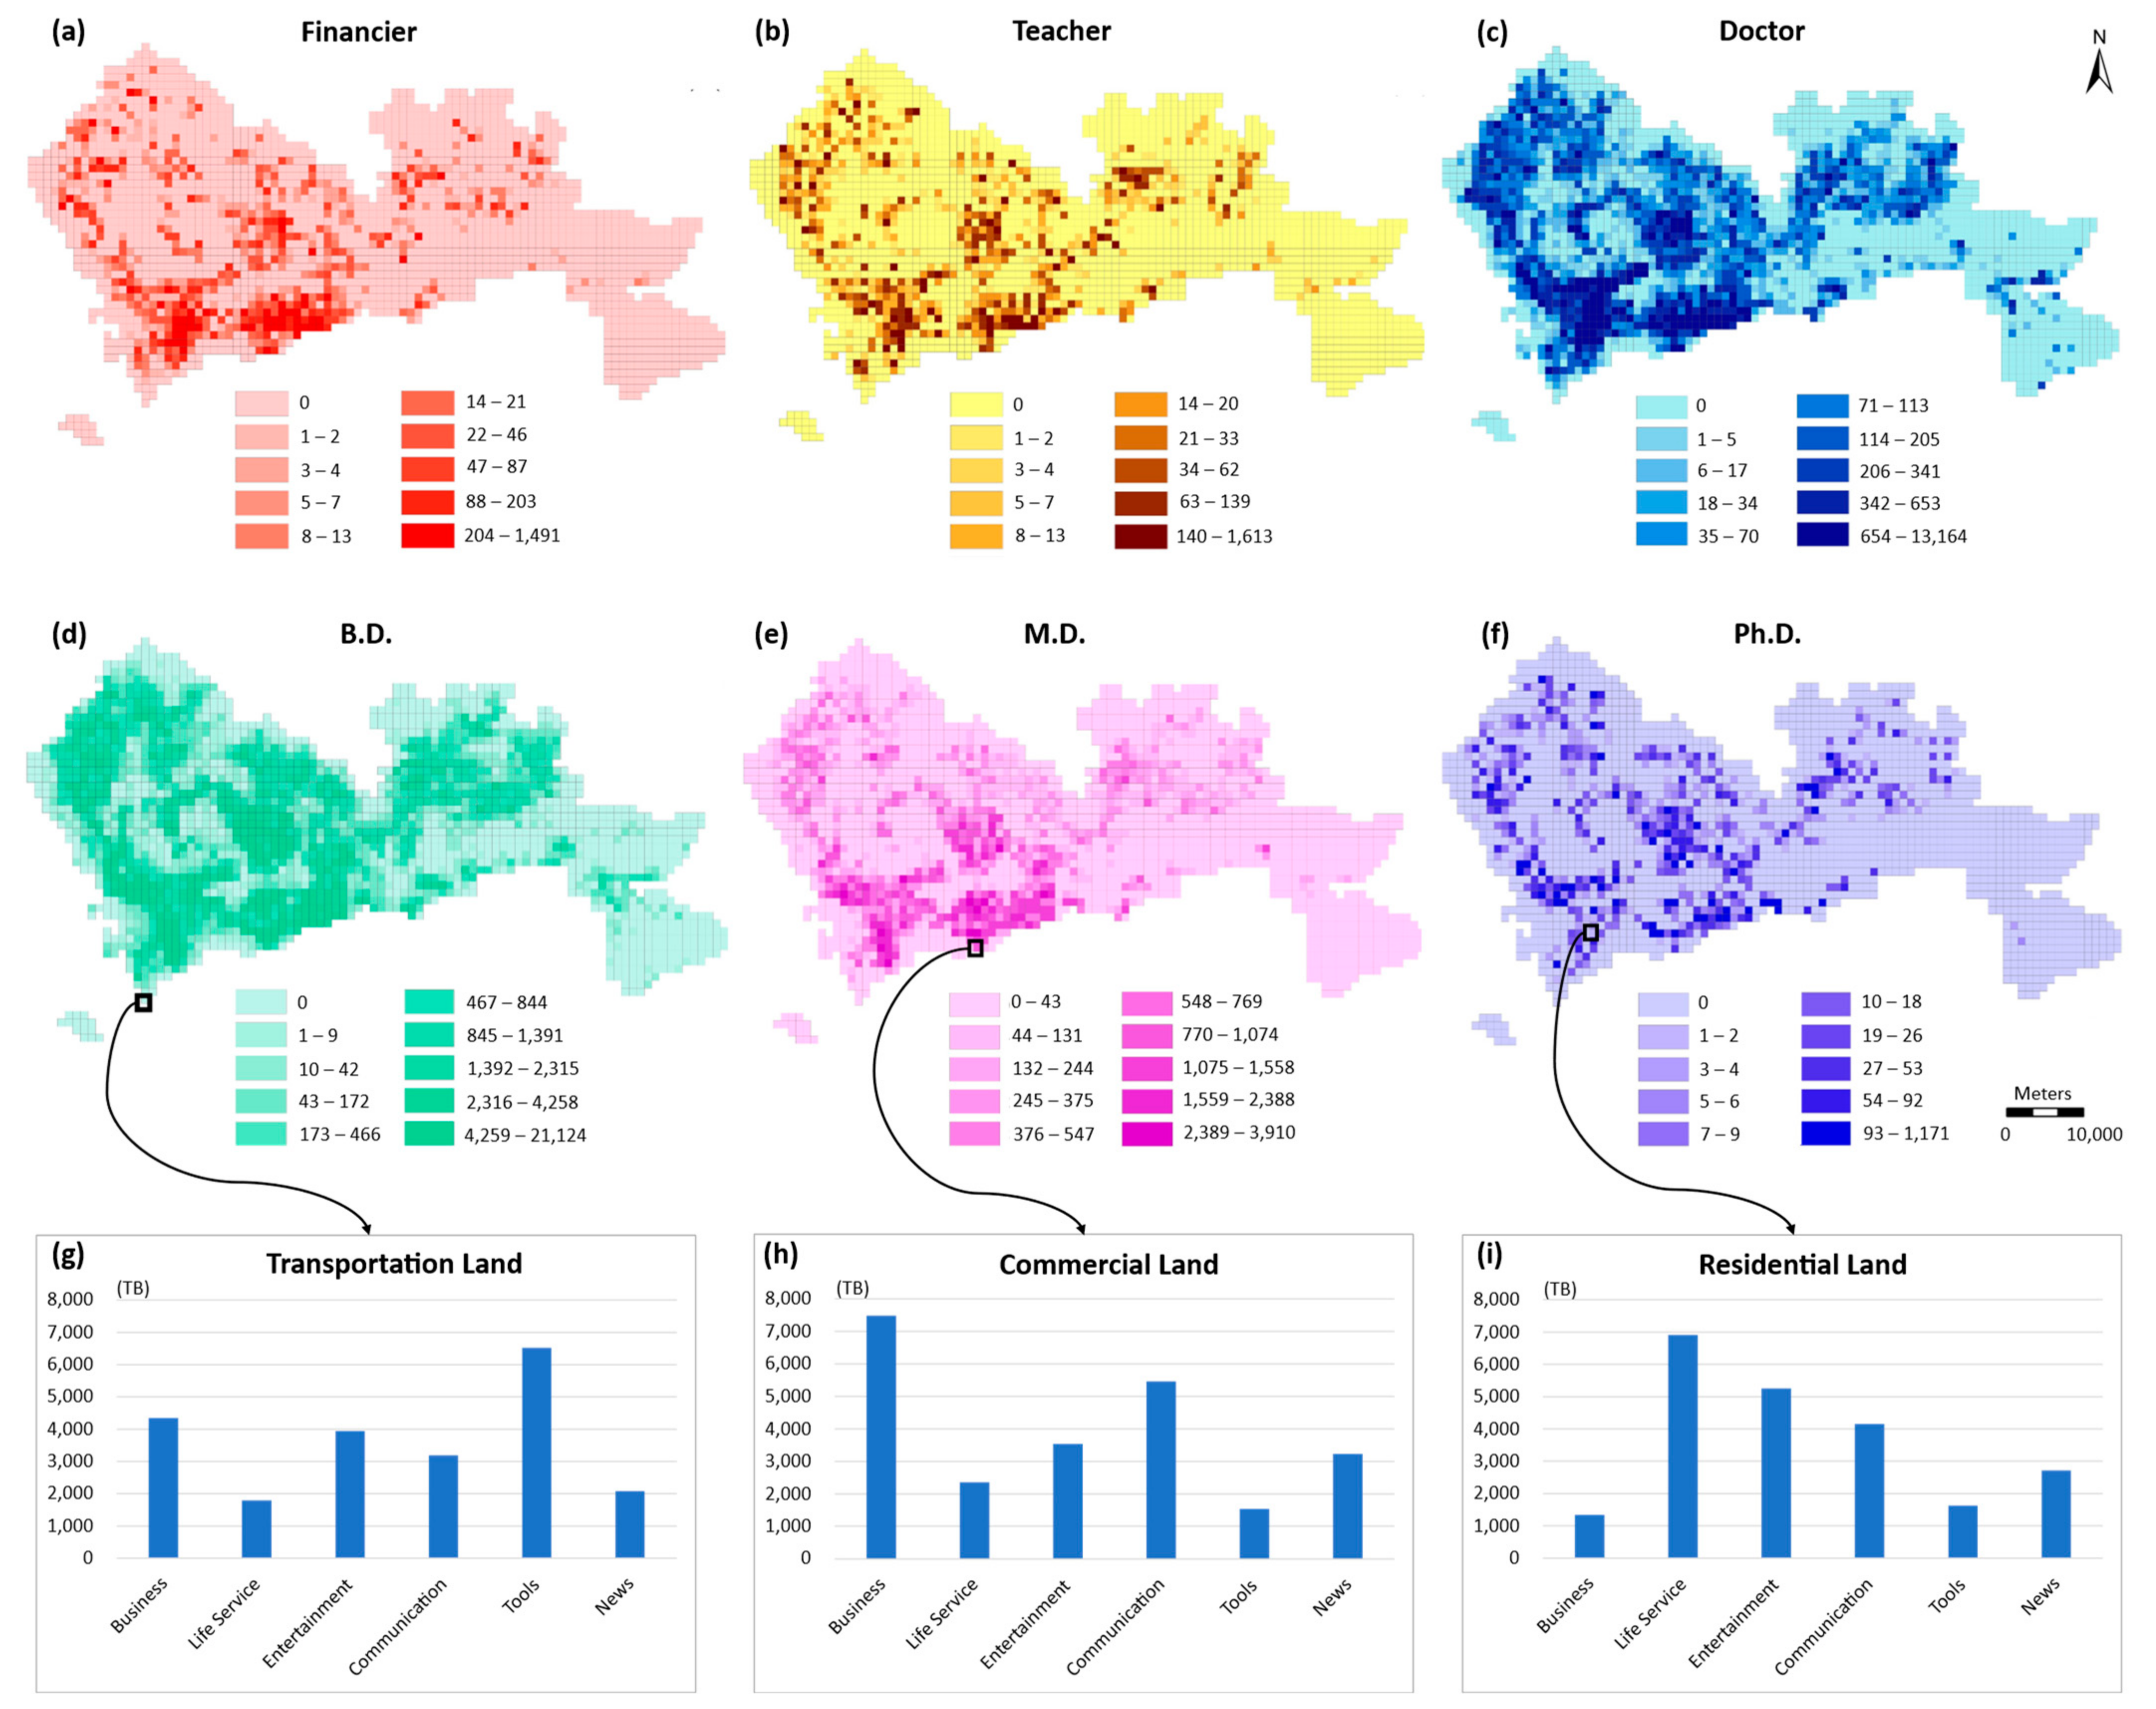
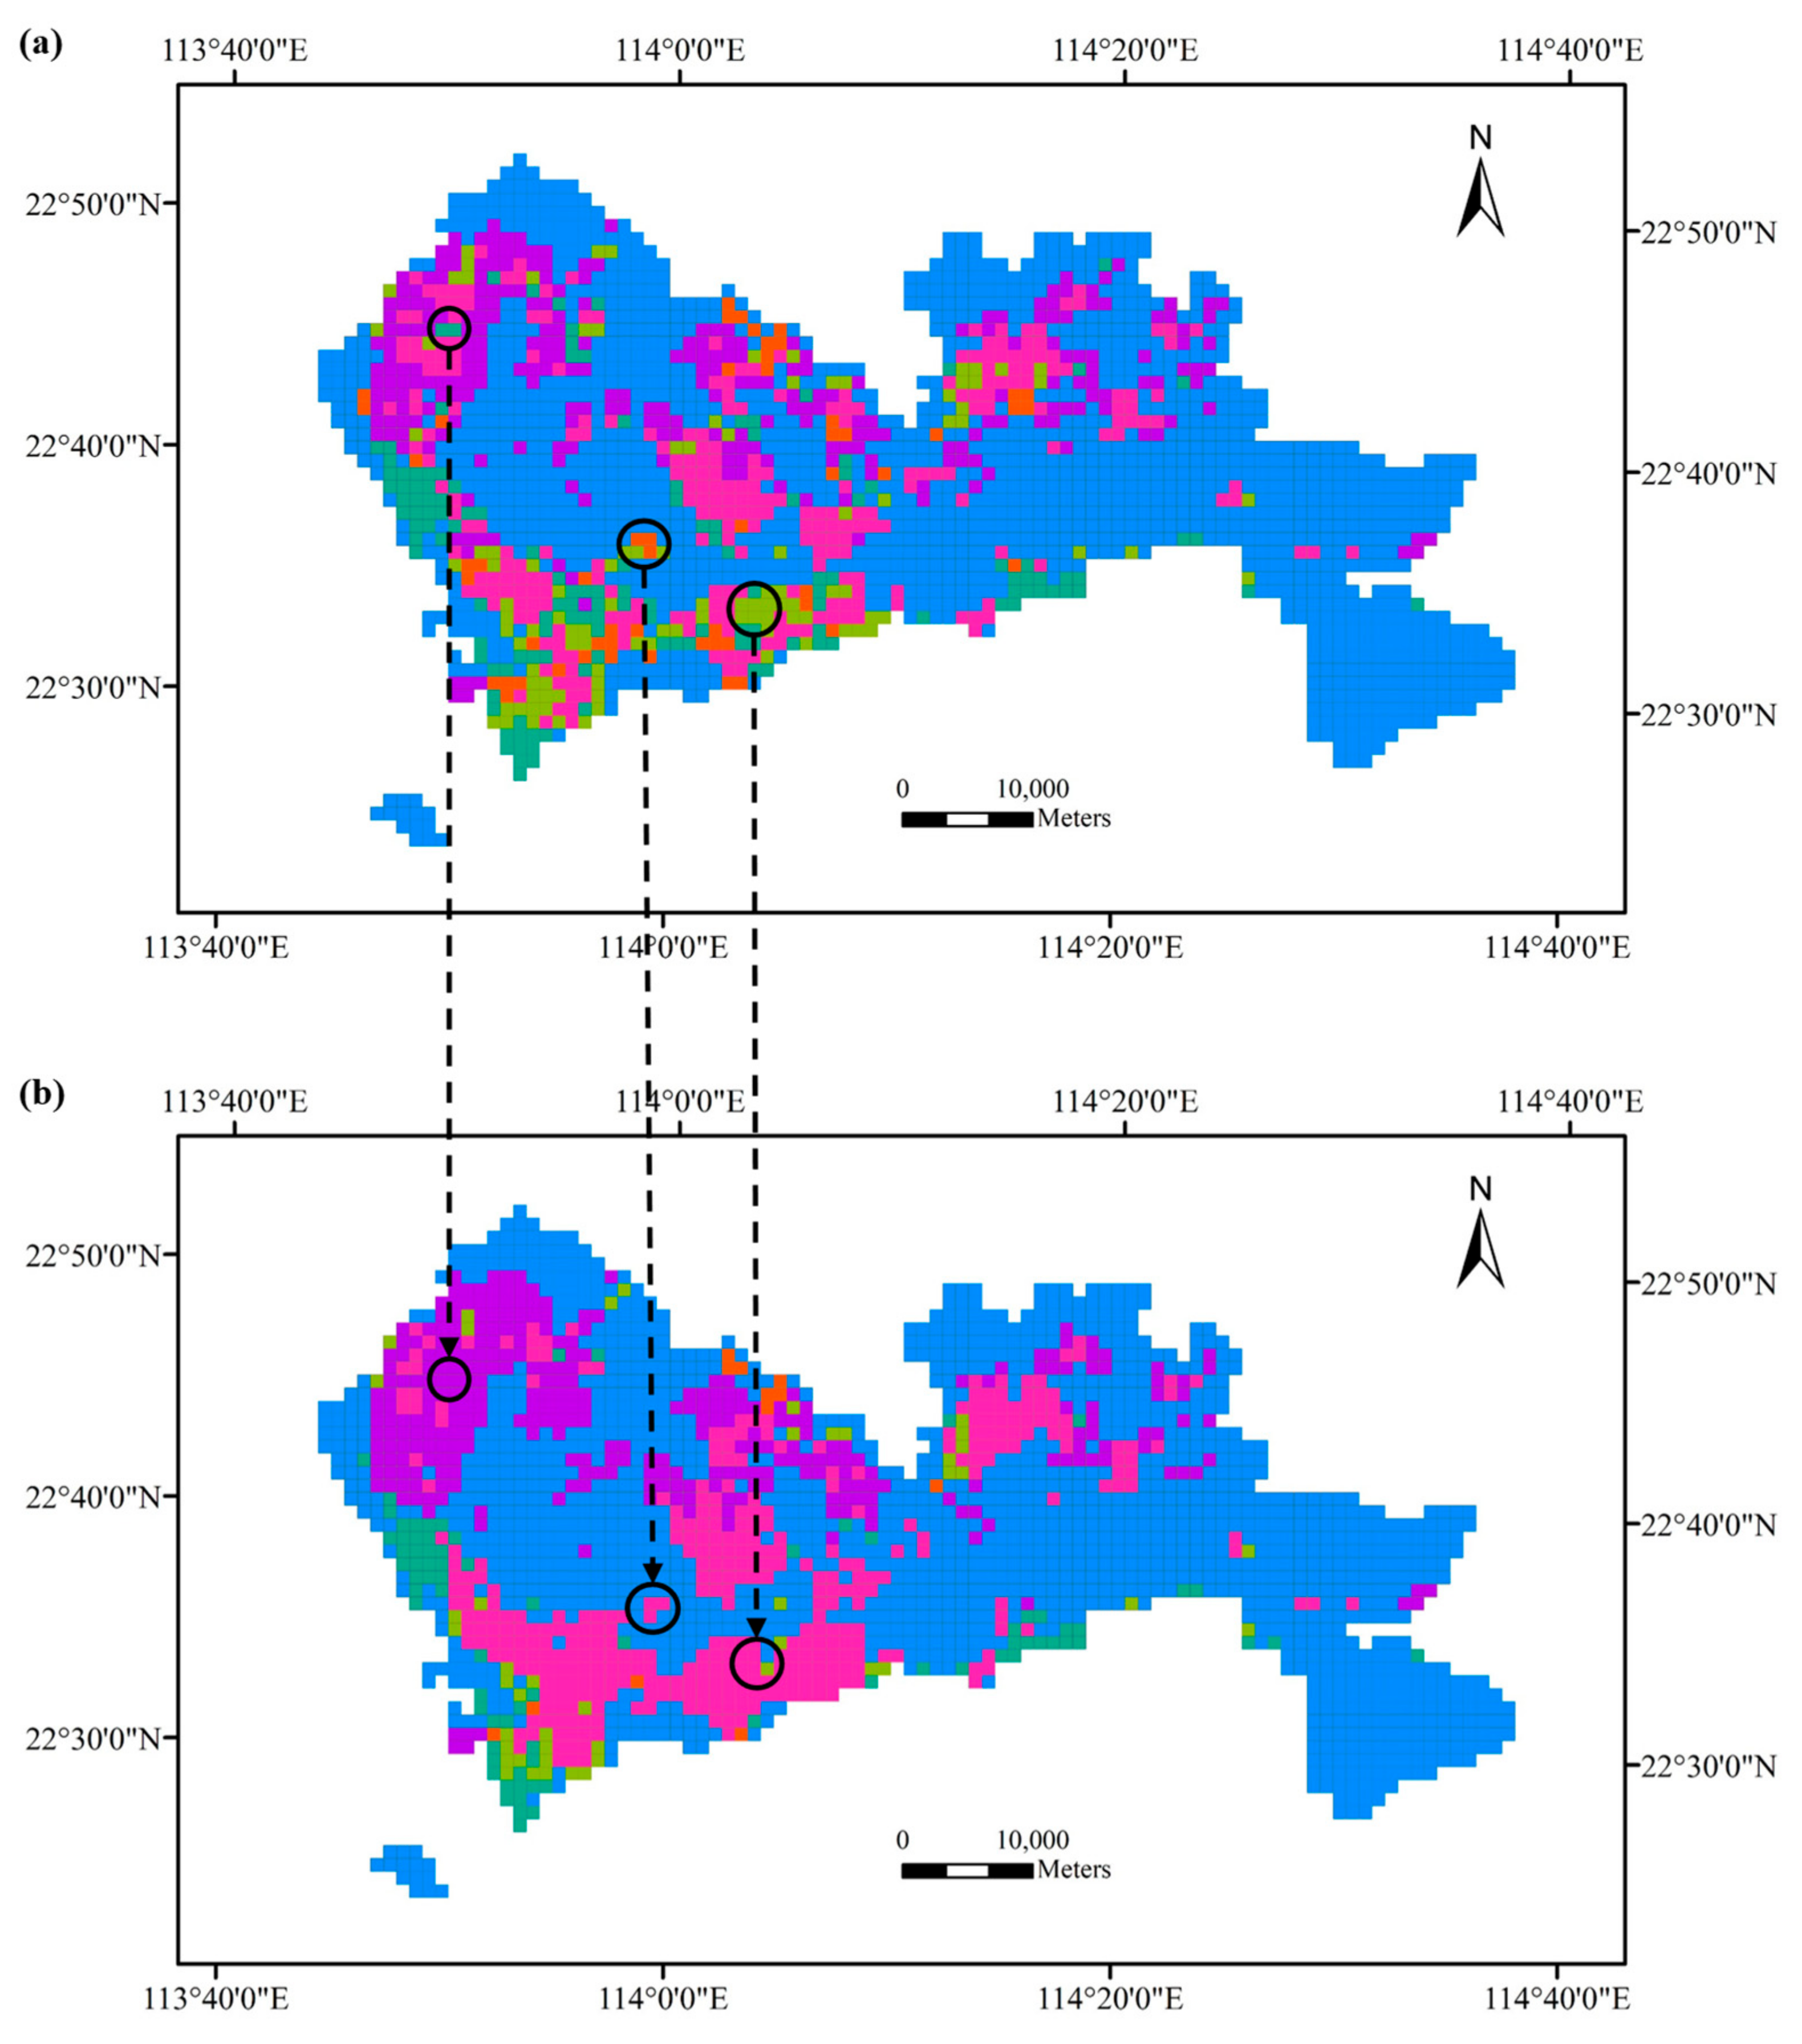
4.3.3. Geospatial Distribution of Urban Functional Features
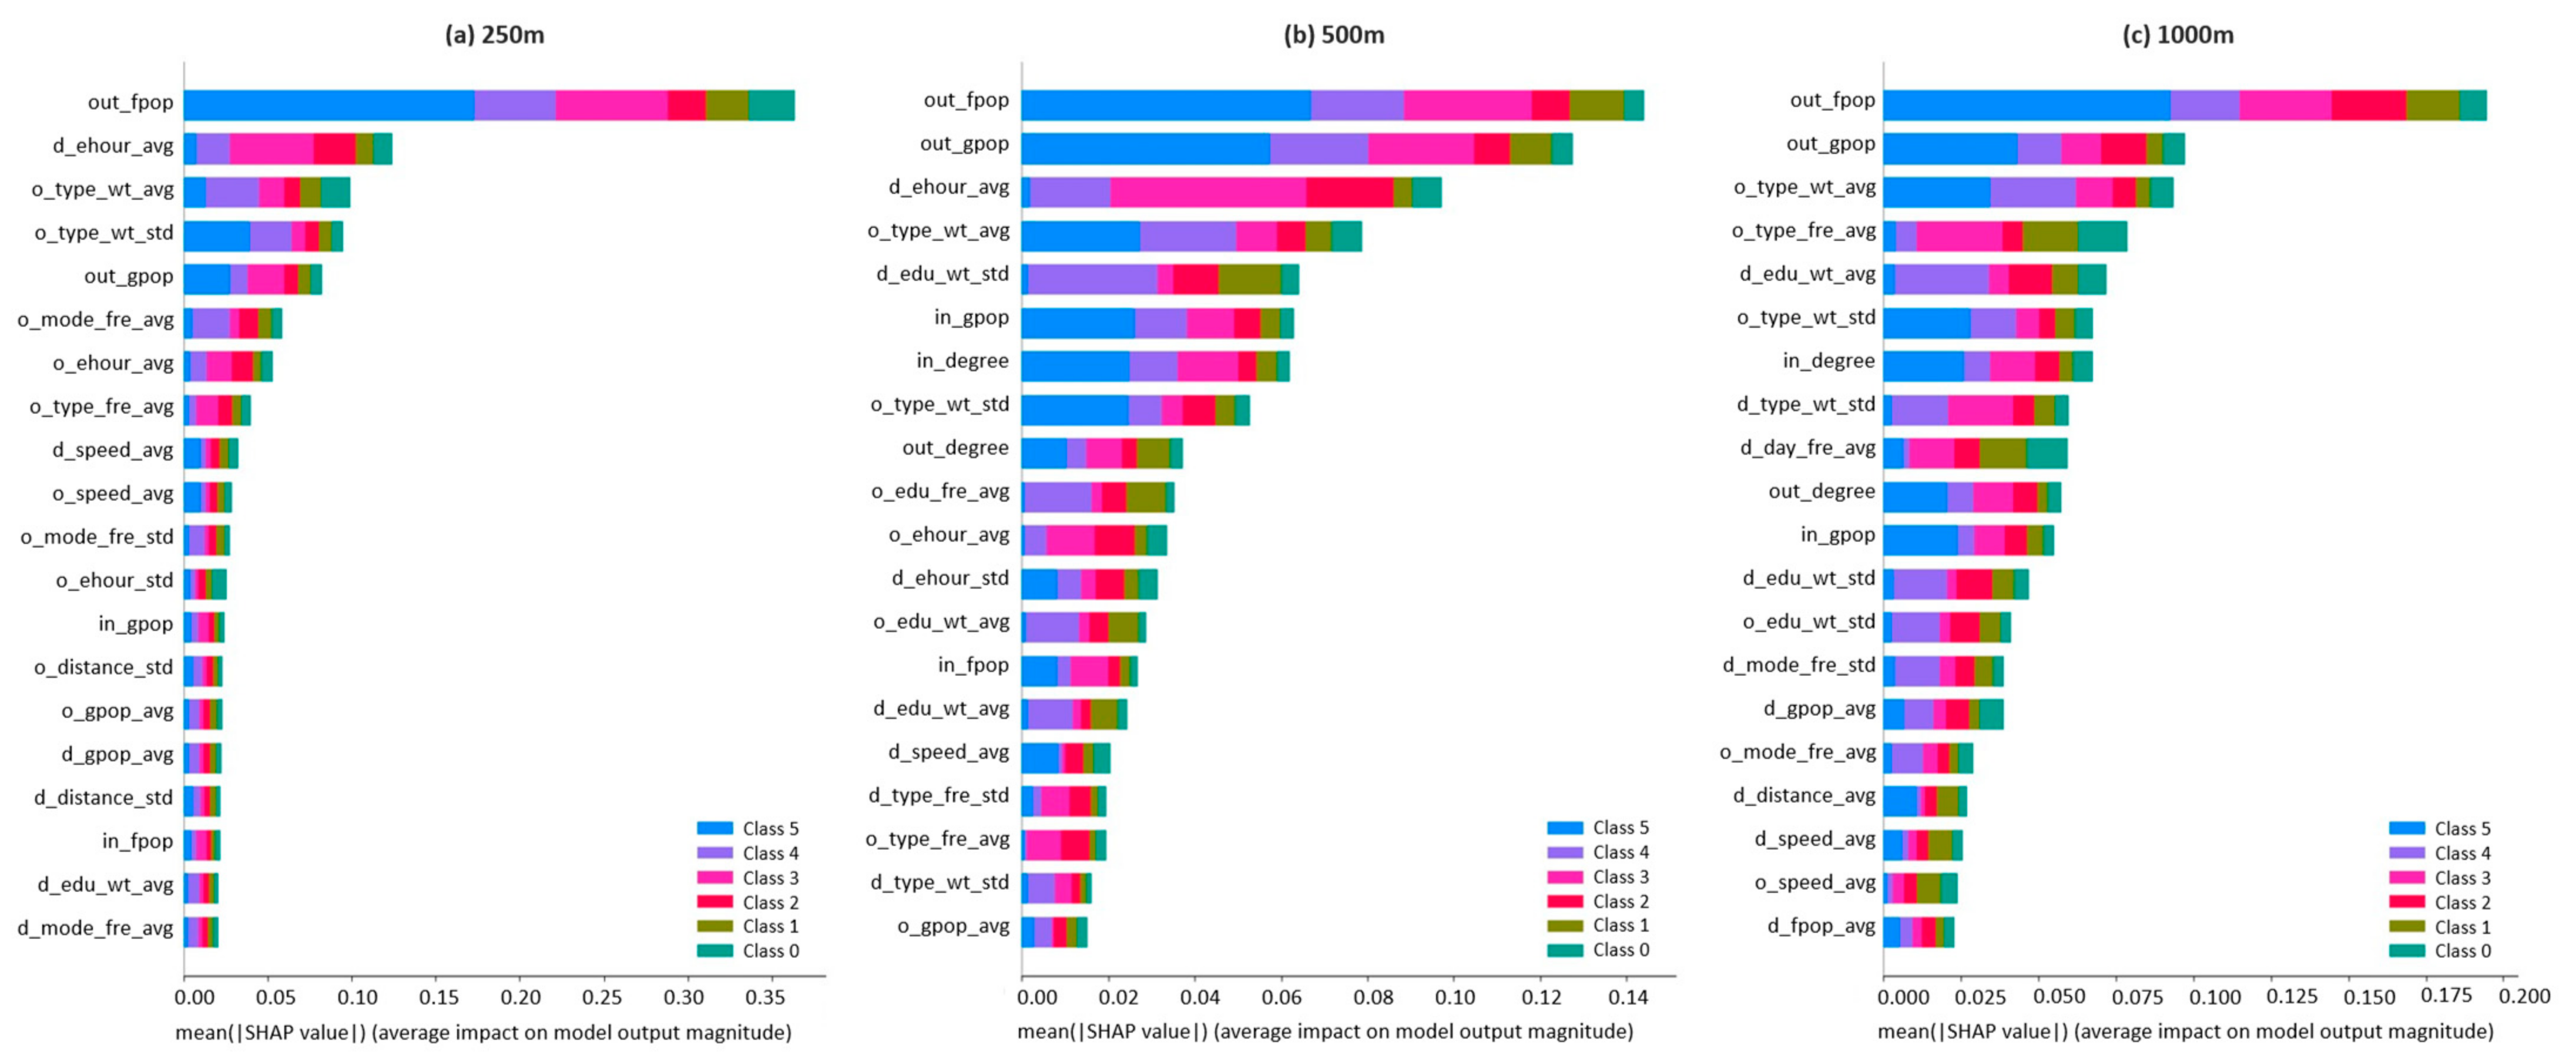
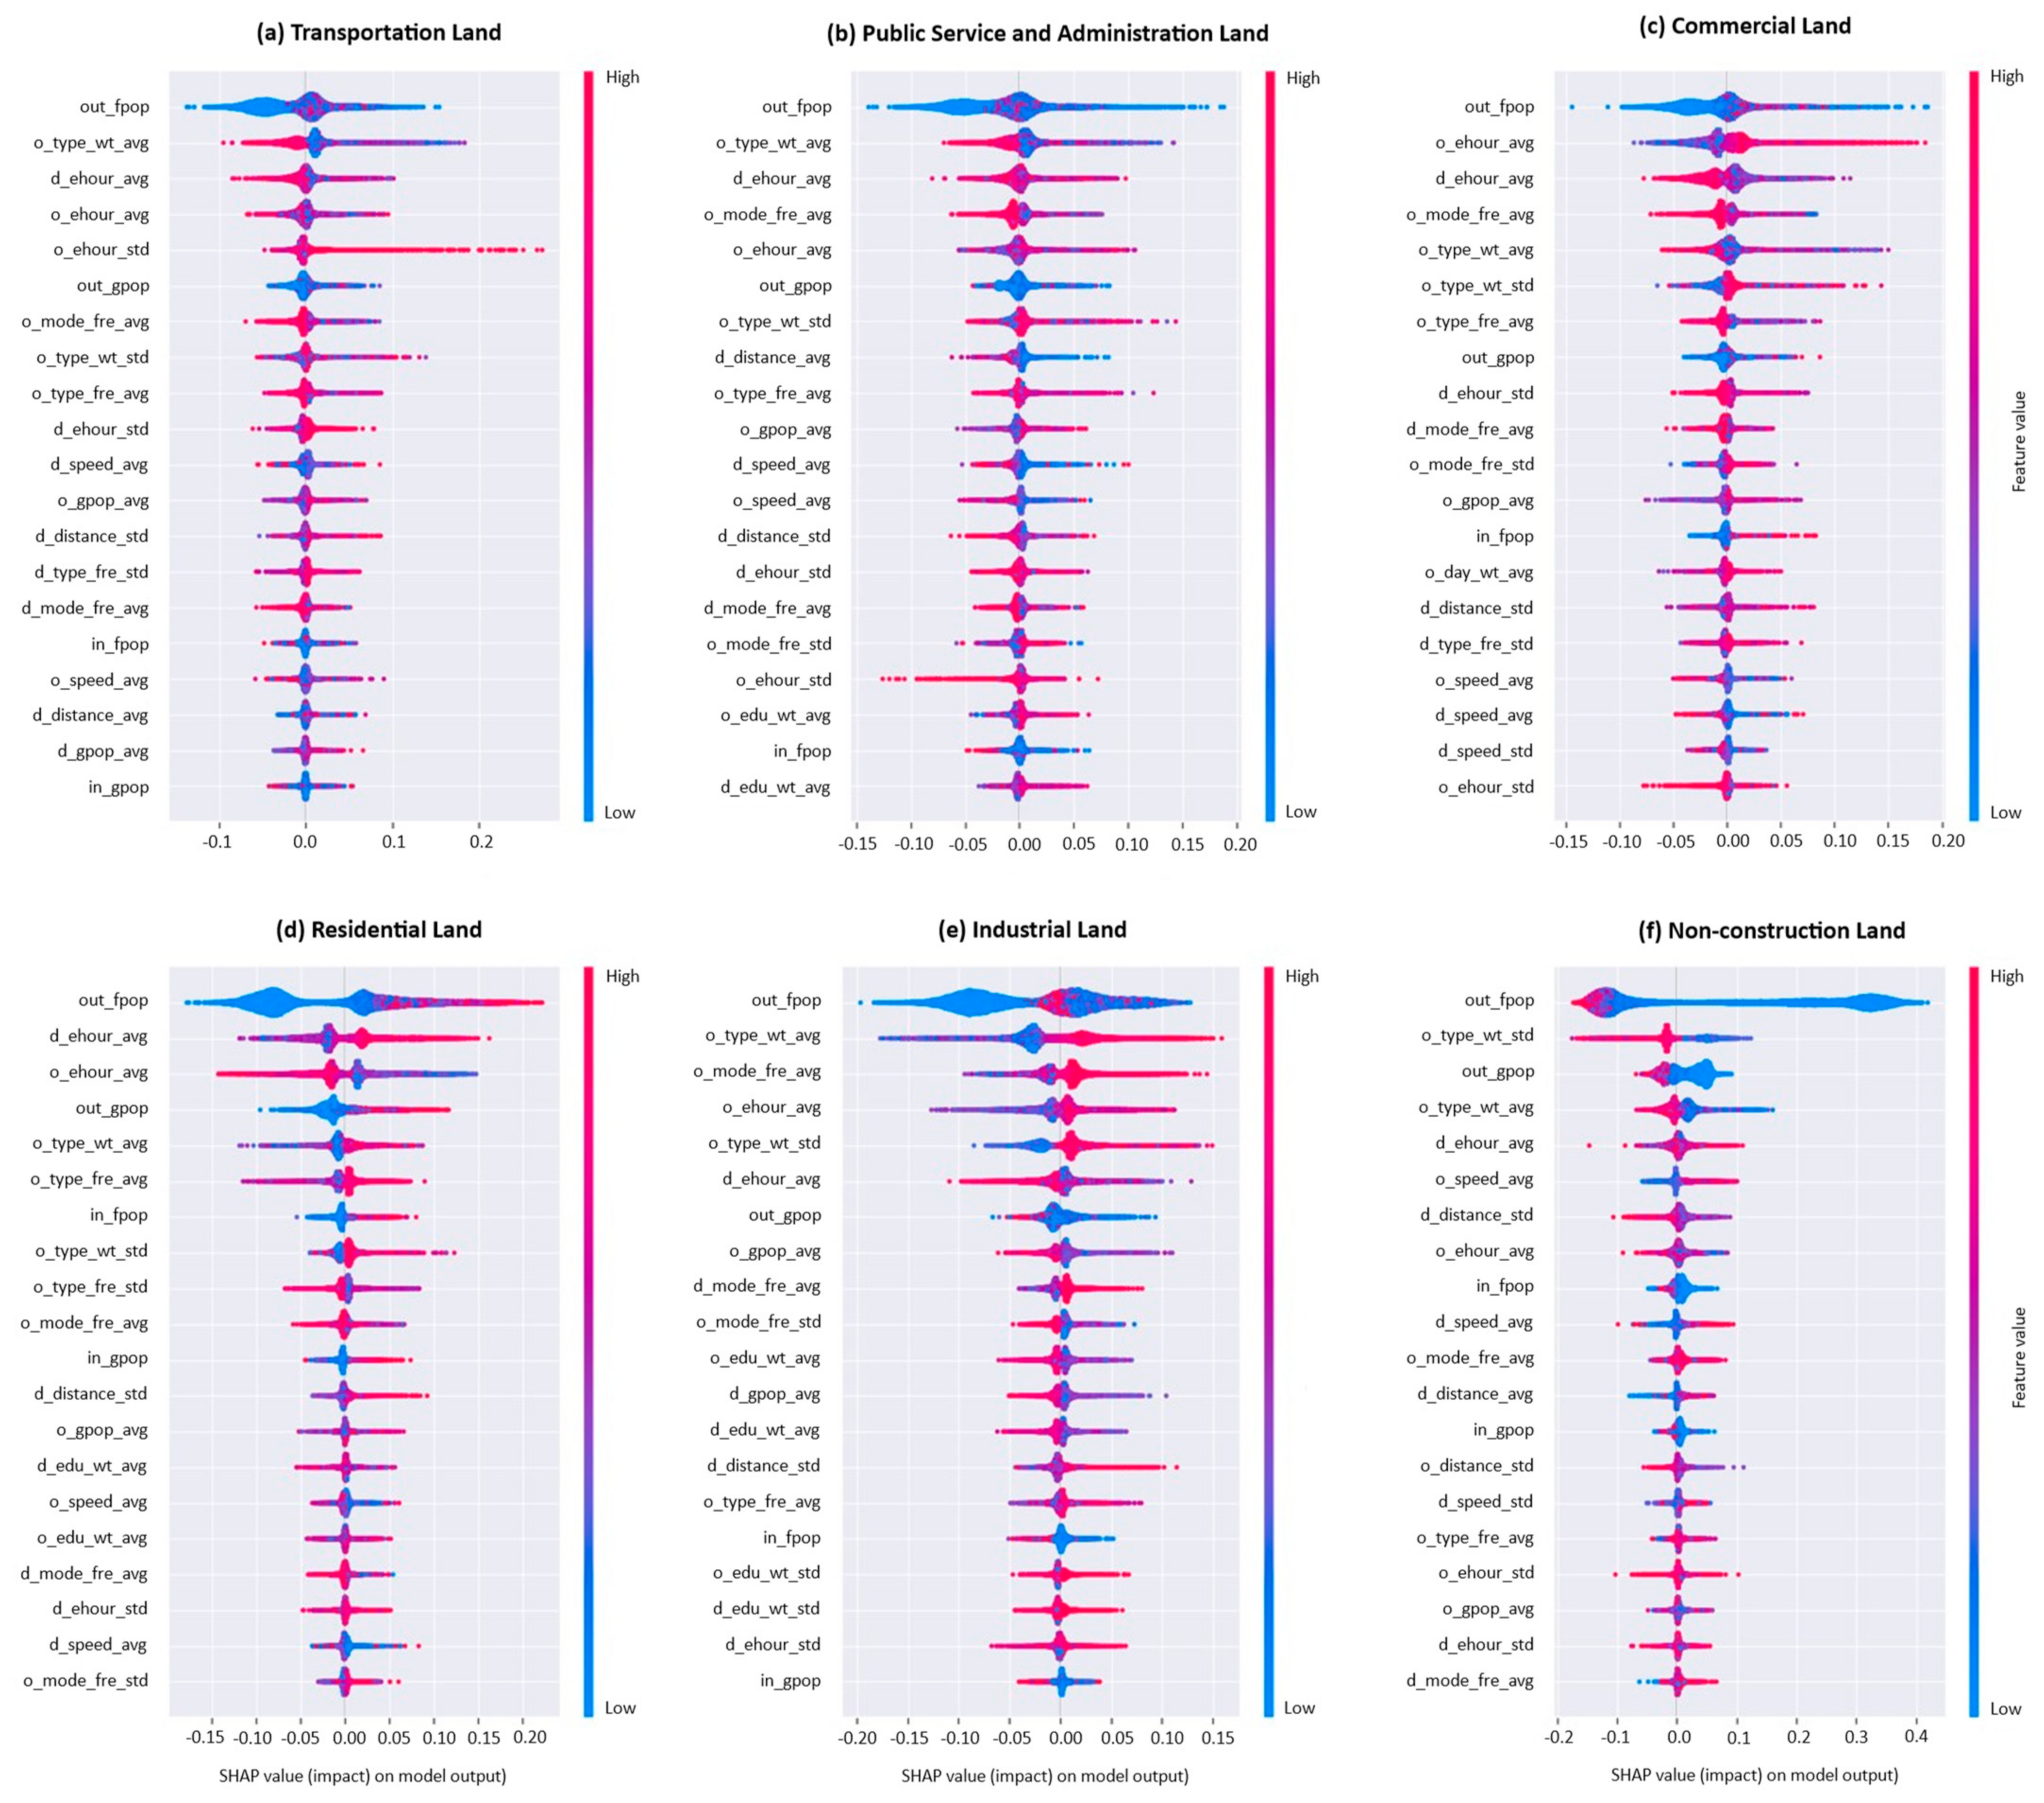
4.3.4. Explanation of Feature Impacts on Model Prediction
5. Discussion
6. Conclusions
Author Contributions
Funding
Data Availability Statement
Acknowledgments
Conflicts of Interest
References
- Comtois, C.; Slack, B. The Geography of Transport Systems; Routledge: London, UK, 2009. [Google Scholar]
- Boarnet, M.; Crane, R. The influence of land use on travel behavior: Specification and estimation strategies. Transp. Res. Part A Policy Pract. 2001, 35, 823–845. [Google Scholar] [CrossRef]
- Wong, D.W. The modifiable areal unit problem (MAUP). In WorldMinds: Geographical Perspectives on 100 Problems: Commemorating the 100th Anniversary of the Association of American Geographers 1904–2004; Springer: Dordrecht, The Netherlands, 2004; pp. 571–575. [Google Scholar]
- Balsa-Barreiro, J.; Menendez, M.; Morales, A.J. Scale, context, and heterogeneity: The complexity of the social space. Sci. Rep. 2022, 12, 9037. [Google Scholar] [CrossRef] [PubMed]
- Jing, C.; Zhang, H.; Xu, S.; Wang, M.; Zhuo, F.; Liu, S. A hierarchical spatial unit partitioning approach for fine-grained urban functional region identification. Trans. GIS 2022, 26, 2691–2715. [Google Scholar] [CrossRef]
- Tao, H.; Wang, K.; Zhuo, L.; Li, X. Re-examining urban region and inferring regional function based on spatial–temporal interaction. Int. J. Digit. Earth 2019, 12, 293–310. [Google Scholar] [CrossRef]
- Liu, Y.; Liu, X.; Gao, S.; Gong, L.; Kang, C.; Zhi, Y.; Chi, G.; Shi, L. Social Sensing: A New Approach to Understanding Our Socioeconomic Environments. Ann. Assoc. Am. Geogr. 2015, 105, 512–530. [Google Scholar] [CrossRef]
- Zhu, D.; Zhang, F.; Wang, S.; Wang, Y.; Cheng, X.; Huang, Z.; Liu, Y. Understanding Place Characteristics in Geographic Contexts through Graph Convolutional Neural Networks. Ann. Assoc. Am. Geogr. 2020, 110, 408–420. [Google Scholar] [CrossRef]
- Mai, G.; Janowicz, K.; Hu, Y.; Gao, S.; Yan, B.; Zhu, R.; Cai, L.; Lao, N. A review of location encoding for GeoAI: Methods and applications. Int. J. Geogr. Inf. Sci. 2022, 36, 639–673. [Google Scholar] [CrossRef]
- Pei, T.; Sobolevsky, S.; Ratti, C.; Shaw, S.; Li, T. Machine learning and deep learning. In Elgar Encyclopedia of Technology and Politics; Edward Elgar Publishing: Cheltenham, UK, 2022; Volume 11, p. 113. [Google Scholar]
- Gao, R.; Xie, J.; Zhu, S.C.; Wu, Y.N. Learning grid cells as vector representation of self-position coupled with matrix representation of self-motion. arXiv 2018, arXiv:1810.05597. [Google Scholar]
- Klemmer, K.; Xu, T.; Acciaio, B.; Neill, D.B. SPATE-GAN: Improved Generative Modeling of Dynamic Spatio-Temporal Patterns with an Autoregressive Embedding Loss. Proc. AAAI Conf. Artif. Intell. 2022, 36, 4523–4531. [Google Scholar] [CrossRef]
- Defferrard, M.; Bresson, X.; Vandergheynst, P. Convolutional neural networks on graphs with fast localized spectral filtering. Adv. Neural Inf. Process. Syst. 2016, 29, 3844–3852. [Google Scholar]
- Liu, X.; Chen, M.; Claramunt, C.; Batty, M.; Kwan, M.-P.; Senousi, A.M.; Cheng, T.; Strobl, J.; Cöltekin, A.; Wilson, J.; et al. Geographic information science in the era of geospatial big data: A cyberspace perspective. Innovation 2022, 3, 100279. [Google Scholar] [CrossRef] [PubMed]
- Huang, W.; Zhang, D.; Mai, G.; Guo, X.; Cui, L. Learning urban region representations with POIs and hierarchical graph infomax. ISPRS J. Photogramm. Remote. Sens. 2023, 196, 134–145. [Google Scholar] [CrossRef]
- Yang, X.; Stewart, K.; Tang, L.; Xie, Z.; Li, Q. A Review of GPS Trajectories Classification Based on Transportation Mode. Sensors 2018, 18, 3741. [Google Scholar] [CrossRef] [PubMed]
- Zhang, F.; Wu, L.; Zhu, D.; Liu, Y. Social sensing from street-level imagery: A case study in learning spatio-temporal urban mobility patterns. ISPRS J. Photogramm. Remote. Sens. 2019, 153, 48–58. [Google Scholar] [CrossRef]
- Goodchild, M.F. Formalizing place in geographic information systems. In Communities, Neighborhoods, and Health: Expanding the Boundaries of Place; Springer: Berlin/Heidelberg, Germany, 2010; pp. 21–33. [Google Scholar]
- Roy, J.R.; Thill, J.-C. Spatial interaction modelling. Pap. Reg. Sci. 2003, 83, 339–361. [Google Scholar] [CrossRef]
- Zhong, C.; Arisona, S.M.; Huang, X.; Batty, M.; Schmitt, G. Detecting the dynamics of urban structure through spatial network analysis. Int. J. Geogr. Inf. Sci. 2014, 28, 2178–2199. [Google Scholar] [CrossRef]
- Qiao, S.; Huang, G.; Yeh, A.G.-O. Mobility as a Service and urban infrastructure: From concept to practice. Trans. Urban Data, Sci. Technol. 2022, 1, 16–36. [Google Scholar] [CrossRef]
- Alessandretti, L.; Aslak, U.; Lehmann, S. The scales of human mobility. Nature 2020, 587, 402–407. [Google Scholar] [CrossRef]
- Zheng, Y.; Capra, L.; Wolfson, O.; Yang, H. Urban computing: Concepts, methodologies, and applications. ACM Trans. Intell. Syst. Technol. (TIST) 2014, 5, 1–55. [Google Scholar] [CrossRef]
- Hu, S.; Gao, S.; Wu, L.; Xu, Y.; Zhang, Z.; Cui, H.; Gong, X. Urban function classification at road segment level using taxi trajectory data: A graph convolutional neural network approach. Comput. Environ. Urban Syst. 2021, 87, 101619. [Google Scholar] [CrossRef]
- Xu, Y.; Jin, S.; Chen, Z.; Xie, X.; Hu, S.; Xie, Z. Application of a graph convolutional network with visual and semantic features to classify urban scenes. Int. J. Geogr. Inf. Sci. 2022, 36, 2009–2034. [Google Scholar] [CrossRef]
- Zhang, Y.; Li, Q.; Tu, W.; Mai, K.; Yao, Y.; Chen, Y. Functional urban land use recognition integrating multi-source geospatial data and cross-correlations. Comput. Environ. Urban Syst. 2019, 78, 101374. [Google Scholar] [CrossRef]
- Simini, F.; Barlacchi, G.; Luca, M.; Pappalardo, L. A Deep Gravity model for mobility flows generation. Nat. Commun. 2021, 12, 6576. [Google Scholar] [CrossRef] [PubMed]
- Tian, C.; Zhang, Y.; Weng, Z.; Gu, X.; Chan, W.K. Learning Fine-grained Location Embedding from Human Mobility with Graph Neural Networks. In Proceedings of the 2022 International Joint Conference on Neural Networks (IJCNN), Padova, Italy, 18–23 July 2022. [Google Scholar]
- Mikolov, T.; Chen, K.; Corrado, G.; Dean, J. Efficient estimation of word representations in vector space. arXiv 2013, arXiv:1301.3781. [Google Scholar]
- Church, K.W. Word2Vec. Nat. Lang. Eng. 2017, 23, 155–162. [Google Scholar] [CrossRef]
- Le, Q.; Mikolov, T. Distributed representations of sentences and documents. In Proceedings of the International Conference on Machine Learning, PMLR, Beijing, China, 22–24 June 2014. [Google Scholar]
- Grover, A.; Leskovec, J. node2vec: Scalable feature learning for networks. In Proceedings of the 22nd ACM SIGKDD International Conference on Knowledge Discovery and Data Mining, San Francisco, CA, USA, 13–17 August 2016. [Google Scholar]
- Zhai, W.; Bai, X.; Shi, Y.; Han, Y.; Peng, Z.-R.; Gu, C. Beyond Word2vec: An approach for urban functional region extraction and identification by combining Place2vec and POIs. Comput. Environ. Urban Syst. 2019, 74, 1–12. [Google Scholar] [CrossRef]
- Zhang, J.; Li, X.; Yao, Y.; Hong, Y.; He, J.; Jiang, Z.; Sun, J. The Traj2Vec model to quantify residents’ spatial trajectories and estimate the proportions of urban land-use types. Int. J. Geogr. Inf. Sci. 2021, 35, 193–211. [Google Scholar] [CrossRef]
- Xu, Y.; Zhou, B.; Jin, S.; Xie, X.; Chen, Z.; Hu, S.; He, N. A framework for urban land use classification by integrating the spatial context of points of interest and graph convolutional neural network method. Comput. Environ. Urban Syst. 2022, 95, 101807. [Google Scholar] [CrossRef]
- Bruna, J.; Zaremba, W.; Szlam, A.; LeCun, Y. Spectral networks and locally connected networks on graphs. arXiv 2013, arXiv:1312.6203. [Google Scholar]
- Kipf, T.N.; Welling, M. Semi-supervised classification with graph convolutional networks. arXiv 2016, arXiv:1609.02907. [Google Scholar]
- Schlichtkrull, M.; Kipf, T.N.; Bloem, P.; Van Den Berg, R.; Titov, I.; Welling, M. Modeling relational data with graph convolutional networks. In The Semantic Web, Proceedings of the 15th International Conference, ESWC 2018, Heraklion, Greece, 3–7 June 2018; Springer: Berlin/Heidelberg, Germany, 2018; Volume 15. [Google Scholar]
- Hamilton, W.; Ying, Z.; Leskovec, J. Inductive representation learning on large graphs. Adv. Neural Inf. Process. Syst. 2017, 30. [Google Scholar]
- Veličković, P.; Cucurull, G.; Casanova, A.; Romero, A.; Lio, P.; Bengio, Y. Graph attention networks. arXiv 2017, arXiv:1710.10903. [Google Scholar]
- Hajibabaee, P.; Malekzadeh, M.; Heidari, M.; Zad, S.; Uzuner, O.; Jones, J.H. An empirical study of the graphsage and word2vec algorithms for graph multiclass classification. In Proceedings of the 2021 IEEE 12th Annual Information Technology, Electronics and Mobile Communication Conference (IEMCON), Vancouver, BC, Canada, 27–30 October 2021. [Google Scholar]
- Zhang, D.; Yin, J.; Zhu, X.; Zhang, C. Attributed network embedding via subspace discovery. Data Min. Knowl. Discov. 2019, 33, 1953–1980. [Google Scholar] [CrossRef]
- Zhao, L.; Song, Y.; Zhang, C.; Liu, Y.; Wang, P.; Lin, T.; Deng, M.; Li, H. T-GCN: A Temporal Graph Convolutional Network for Traffic Prediction. IEEE Trans. Intell. Transp. Syst. 2020, 21, 3848–3858. [Google Scholar] [CrossRef]
- Yu, B.; Lee, Y.; Sohn, K. Forecasting road traffic speeds by considering area-wide spatio-temporal dependencies based on a graph convolutional neural network (GCN). Transp. Res. Part C: Emerg. Technol. 2020, 114, 189–204. [Google Scholar] [CrossRef]
- Fang, F.; Zeng, L.; Li, S.; Zheng, D.; Zhang, J.; Liu, Y.; Wan, B. Spatial context-aware method for urban land use classification using street view images. ISPRS J. Photogramm. Remote. Sens. 2022, 192, 1–12. [Google Scholar] [CrossRef]
- Chen, T.; Bowers, K.; Zhu, D.; Gao, X.; Cheng, T. Spatio-temporal stratified associations between urban human activities and crime patterns: A case study in San Francisco around the COVID-19 stay-at-home mandate. Comput. Urban Sci. 2022, 2, 1–12. [Google Scholar] [CrossRef] [PubMed]
- Jin, R.; Xia, T.; Liu, X.; Murata, T.; Kim, K.-S. Predicting Emergency Medical Service Demand With Bipartite Graph Convolutional Networks. IEEE Access 2021, 9, 9903–9915. [Google Scholar] [CrossRef]
- Yu, X.; Shi, S.; Xu, L. A spatial–temporal graph attention network approach for air temperature forecasting. Appl. Soft Comput. 2021, 113, 107888. [Google Scholar] [CrossRef]
- Wang, H.; Zhang, H.; Tang, G.; Zhou, L.; Jiang, S. Inter-city association pattern recognition by constructing cultural semantic similarity network. Trans. GIS 2022, 26, 2225–2243. [Google Scholar] [CrossRef]
- Du, Z.; Zhang, X.; Li, W.; Zhang, F.; Liu, R. A multi-modal transportation data-driven approach to identify urban functional zones: An exploration based on Hangzhou City, China. Trans. GIS 2020, 24, 123–141. [Google Scholar] [CrossRef]
- Zhou, W.; Ming, D.; Lv, X.; Zhou, K.; Bao, H.; Hong, Z. SO–CNN based urban functional zone fine division with VHR remote sensing image. Remote. Sens. Environ. 2020, 236, 111458. [Google Scholar] [CrossRef]
- Li, X.; Zhang, C.; Li, W. Building block level urban land-use information retrieval based on Google Street View images. GIScience Remote. Sens. 2017, 54, 819–835. [Google Scholar] [CrossRef]
- Ye, C.; Zhang, F.; Mu, L.; Gao, Y.; Liu, Y. Urban function recognition by integrating social media and street-level imagery. Environ. Plan. B Urban Anal. City Sci. 2021, 48, 1430–1444. [Google Scholar] [CrossRef]
- Andrade, R.; Alves, A.; Bento, C. POI Mining for Land Use Classification: A Case Study. ISPRS Int. J. Geo-Inf. 2020, 9, 493. [Google Scholar] [CrossRef]
- Tu, W.; Cao, J.; Yue, Y.; Shaw, S.-L.; Zhou, M.; Wang, Z.; Chang, X.; Xu, Y.; Li, Q. Coupling mobile phone and social media data: A new approach to understanding urban functions and diurnal patterns. Int. J. Geogr. Inf. Sci. 2017, 31, 2331–2358. [Google Scholar] [CrossRef]
- Mawuenyegah, A.; Li, S.; Xu, S. Exploring spatiotemporal patterns of geosocial media data for urban functional zone identification. Int. J. Digit. Earth 2022, 15, 1305–1325. [Google Scholar] [CrossRef]
- Liu, X.; Tian, Y.; Zhang, X.; Wan, Z. Identification of Urban Functional Regions in Chengdu Based on Taxi Trajectory Time Series Data. ISPRS Int. J. Geo-Inf. 2020, 9, 158. [Google Scholar] [CrossRef]
- Long, Y.; Shen, Z. Discovering functional zones using bus smart card data and points of interest in Beijing. In Geospatial Analysis to Support Urban Planning in Beijing; Springer: Berlin/Heidelberg, Germany, 2015; pp. 193–217. [Google Scholar]
- Huang, X.; Zhao, Y.; Ma, C.; Yang, J.; Ye, X.; Zhang, C. TrajGraph: A Graph-Based Visual Analytics Approach to Studying Urban Network Centralities Using Taxi Trajectory Data. IEEE Trans. Vis. Comput. Graph. 2015, 22, 160–169. [Google Scholar] [CrossRef]
- Liu, B.; Deng, Y.; Li, M.; Yang, J.; Liu, T. Classification Schemes and Identification Methods for Urban Functional Zone: A Review of Recent Papers. Appl. Sci. 2021, 11, 9968. [Google Scholar] [CrossRef]
- Cao, R.; Tu, W.; Yang, C.; Li, Q.; Liu, J.; Zhu, J.; Zhang, Q.; Li, Q.; Qiu, G. Deep learning-based remote and social sensing data fusion for urban region function recognition. ISPRS J. Photogramm. Remote. Sens. 2020, 163, 82–97. [Google Scholar] [CrossRef]
- Psyllidis, A.; Gao, S.; Hu, Y.; Kim, E.-K.; McKenzie, G.; Purves, R.; Yuan, M.; Andris, C. Points of Interest (POI): A commentary on the state of the art, challenges, and prospects for the future. Comput. Urban Sci. 2022, 2, 20. [Google Scholar] [CrossRef]
- Chen, Z.; Yeh, A.G.-O. Delineating functional urban areas in Chinese mega city regions using fine-grained population data and cellphone location data: A case of Pearl River Delta. Comput. Environ. Urban Syst. 2022, 93, 101771. [Google Scholar] [CrossRef]
- Pei, T.; Sobolevsky, S.; Ratti, C.; Shaw, S.-L.; Li, T.; Zhou, C. A new insight into land use classification based on aggregated mobile phone data. Int. J. Geogr. Inf. Sci. 2014, 28, 1988–2007. [Google Scholar] [CrossRef]
- Ríos, S.A.; Muñoz, R. Land Use detection with cell phone data using topic models: Case Santiago, Chile. Comput. Environ. Urban Syst. 2017, 61, 39–48. [Google Scholar] [CrossRef]
- Zhong, Y.; Fei, F.; Zhang, L. Large patch convolutional neural networks for the scene classification of high spatial resolution imagery. J. Appl. Remote. Sens. 2016, 10, 25006. [Google Scholar] [CrossRef]
- Bao, H.; Ming, D.; Guo, Y.; Zhang, K.; Zhou, K.; Du, S. DFCNN-Based Semantic Recognition of Urban Functional Zones by Integrating Remote Sensing Data and POI Data. Remote Sens. 2020, 12, 1088. [Google Scholar] [CrossRef]
- Lin, H.; Xu, B.; Chen, Y.; Jing, Q.; You, L. The virtual geographic environments: More than the digital twin of the physical geographical environments. In New Thinking in GIScience; Springer: Berlin/Heidelberg, Germany, 2022; pp. 17–28. [Google Scholar]
- Mai, G.; Janowicz, K.; Yan, B.; Zhu, R.; Cai, L.; Lao, N. Multi-scale representation learning for spatial feature distributions using grid cells. arXiv 2020, arXiv:2003.00824. [Google Scholar]
- Wang, J.; Kong, X.; Xia, F.; Sun, L. Urban human mobility: Data-driven modeling and prediction. ACM SIGKDD Explor. Newsl. 2019, 21, 1–19. [Google Scholar] [CrossRef]
- Williams, A.M.; Foord, J.; Mooney, J. Human mobility in functional urban regions: Understanding the diversity of mobilities. Int. Rev. Sociol. 2012, 22, 191–209. [Google Scholar]
- Mohan, A.; Pramod, K.V. Network representation learning: Models, methods and applications. SN Appl. Sci. 2019, 1, 1–23. [Google Scholar] [CrossRef]
- Hofman, J.M.; Watts, D.J.; Athey, S.; Garip, F.; Griffiths, T.L.; Kleinberg, J.; Margetts, H.; Mullainathan, S.; Salganik, M.J.; Vazire, S.; et al. Integrating explanation and prediction in computational social science. Nature 2021, 595, 181–188. [Google Scholar] [CrossRef] [PubMed]
- Burkart, N.; Huber, M.F. A Survey on the Explainability of Supervised Machine Learning. J. Artif. Intell. Res. 2020, 70, 245–317. [Google Scholar] [CrossRef]
- Lundberg, S.M.; Erion, G.G.; Lee, S.-I. Consistent individualized feature attribution for tree ensembles. arXiv 2018, arXiv:1802.03888. [Google Scholar]
- Arbia, G.; Petrarca, F. Effects of scale in spatial interaction models. In Spatial Econometric Interaction Modelling; Springer: Berlin/Heidelberg, Germany, 2016; pp. 85–101. [Google Scholar]
- Yang, X.; Fang, Z.; Yin, L.; Li, J.; Lu, S.; Zhao, Z. Revealing the relationship of human convergence–divergence patterns and land use: A case study on Shenzhen City, China. Cities 2019, 95, 102384. [Google Scholar] [CrossRef]
- Rossi, E.; Charpentier, B.; Di Giovanni, F.; Frasca, F.; Günnemann, S.; Bronstein, M. Edge Directionality Improves Learning on Heterophilic Graphs. arXiv 2023, arXiv:2305.10498. [Google Scholar]
- Tobler, W. On the first law of geography: A reply. Ann. Assoc. Am. Geogr. 2004, 94, 304–310. [Google Scholar] [CrossRef]
- Chen, N.; Akar, G. Effects of neighborhood types & socio-demographics on activity space. J. Transp. Geogr. 2016, 54, 112–121. [Google Scholar]
- Liu, S.; Zhang, L.; Long, Y.; Long, Y.; Xu, M. A New Urban Vitality Analysis and Evaluation Framework Based on Human Activity Modeling Using Multi-Source Big Data. ISPRS Int. J. Geo-Inf. 2020, 9, 617. [Google Scholar] [CrossRef]


| Name | Connotation | Examples | |
|---|---|---|---|
| Travel Attribute | Travel Type | The purpose of the travel | commuting, dwelling, etc. |
| Transport Mode | The means of transportation | subway, highway, airplane, train, etc. | |
| Travel Time | The exact hour of departure and arrival time and the total time (h) spent on the trip | departure time: 14:00 arrival time: 16:00 total time: 2 h | |
| Distance | The distance (km) between the origin and destination | 15 km, 30 km, etc. | |
| Speed | The average speed (km/h) over the total distance | 40 km/h, 70 km/h, etc. | |
| Date | The date and the type of day that the traveling happens | 5 November 2019, workday 23 November 2019, weekend | |
| Social Attribute | Gender | Gender group of travelers | Male, Female |
| Age | The age group of travelers | Youth, Middle-aged, The elderly, etc. | |
| Occupation | Occupational classification of travelers | Financier, Teacher, Doctor, Administrator, Farmer, etc. | |
| Education | Educational qualification of travelers | B.D., M.D., Ph.D., etc. | |
| Income | Income level of travelers | Ten levels, from 1 to 10 | |
| Probability of Owning Cars | The probability level that a traveler owns a car | Five levels: high, middle, low, etc. | |
| Probability of Owning Houses | The probability level that a traveler owns a house | Five levels: high, middle, low, etc. |
| Spatial Scale | Node Number | Edge Number | Data Source | Feature Dimension | Edge Weighted | Direction Type |
|---|---|---|---|---|---|---|
| 250 m | 28,180 | 3,753,124 | OD | 112 | √ | Directed and Undirected |
| OD and Flux | 118 | √ | ||||
| OD and Pop | 158 | √ | ||||
| OD and Pop and Flux | 164 | √ | ||||
| 500 m | 7838 | 2,376,382 | OD | 112 | √ | Directed and Undirected |
| OD and Flux | 118 | √ | ||||
| OD and Pop | 158 | √ | ||||
| OD and Pop and Flux | 164 | √ | ||||
| 1000 m | 2133 | 835,408 | OD | 112 | √ | Directed and Undirected |
| OD and Flux | 118 | √ | ||||
| OD and Pop | 158 | √ | ||||
| OD and Pop and Flux | 164 | √ |
| Random Forest | GCN | ||||
|---|---|---|---|---|---|
| OA (%) | Kappa (%) | OA (%) | Kappa (%) | ||
| 250 m | OD | 63.16 | 49.54 | 74.79 | 60.51 |
| OD and Pop | 65.31 | 51.85 | 77.36 | 62.72 | |
| OD and Flux | 67.36 | 52.93 | 79.48 | 65.83 | |
| OD and Pop and Flux | 69.78 | 54.24 | 82.59 | 69.25 | |
| 500 m | OD | 60.95 | 45.93 | 70.16 | 56.19 |
| OD and Pop | 63.81 | 48.18 | 72.71 | 58.04 | |
| OD and Flux | 64.97 | 49.16 | 74.59 | 60.93 | |
| OD and Pop and Flux | 67.02 | 51.63 | 78.14 | 64.01 | |
| 1000 m | OD | 55.72 | 39.84 | 63.48 | 47.23 |
| OD and Pop | 57.29 | 40.52 | 65.61 | 49.56 | |
| OD and Flux | 59.25 | 41.96 | 67.34 | 52.59 | |
| OD and Pop and Flux | 62.98 | 44.35 | 70.79 | 55.74 | |
| 250 m | 500 m | 1000 m | ||||
|---|---|---|---|---|---|---|
| OA (%) | Kappa (%) | OA (%) | Kappa (%) | OA (%) | Kappa (%) | |
| Random Forest | 69.78 | 54.24 | 67.02 | 51.63 | 62.98 | 44.35 |
| Attri2Vec | 71.35 | 55.82 | 69.36 | 53.19 | 64.54 | 45.93 |
| GCN | 82.59 | 69.25 | 78.14 | 64.01 | 70.79 | 55.74 |
| Relational GCN | 83.71 | 70.56 | 81.04 | 67.15 | 75.72 | 61.92 |
| Directed GraphSAGE | 86.20 | 74.72 | 83.17 | 69.73 | 73.91 | 58.07 |
| Inductive GraphSAGE | 87.49 | 76.28 | 79.72 | 65.28 | 71.33 | 56.85 |
Disclaimer/Publisher’s Note: The statements, opinions and data contained in all publications are solely those of the individual author(s) and contributor(s) and not of MDPI and/or the editor(s). MDPI and/or the editor(s) disclaim responsibility for any injury to people or property resulting from any ideas, methods, instructions or products referred to in the content. |
© 2024 by the authors. Licensee MDPI, Basel, Switzerland. This article is an open access article distributed under the terms and conditions of the Creative Commons Attribution (CC BY) license (https://creativecommons.org/licenses/by/4.0/).
Share and Cite
Chen, Y.; Zhao, P.; Lin, Y.; Sun, Y.; Chen, R.; Yu, L.; Liu, Y. Semantic-Enhanced Graph Convolutional Neural Networks for Multi-Scale Urban Functional-Feature Identification Based on Human Mobility. ISPRS Int. J. Geo-Inf. 2024, 13, 27. https://doi.org/10.3390/ijgi13010027
Chen Y, Zhao P, Lin Y, Sun Y, Chen R, Yu L, Liu Y. Semantic-Enhanced Graph Convolutional Neural Networks for Multi-Scale Urban Functional-Feature Identification Based on Human Mobility. ISPRS International Journal of Geo-Information. 2024; 13(1):27. https://doi.org/10.3390/ijgi13010027
Chicago/Turabian StyleChen, Yuting, Pengjun Zhao, Yi Lin, Yushi Sun, Rui Chen, Ling Yu, and Yu Liu. 2024. "Semantic-Enhanced Graph Convolutional Neural Networks for Multi-Scale Urban Functional-Feature Identification Based on Human Mobility" ISPRS International Journal of Geo-Information 13, no. 1: 27. https://doi.org/10.3390/ijgi13010027
APA StyleChen, Y., Zhao, P., Lin, Y., Sun, Y., Chen, R., Yu, L., & Liu, Y. (2024). Semantic-Enhanced Graph Convolutional Neural Networks for Multi-Scale Urban Functional-Feature Identification Based on Human Mobility. ISPRS International Journal of Geo-Information, 13(1), 27. https://doi.org/10.3390/ijgi13010027