1. Introduction
Geographic information systems (GIS) have undergone a turbulent evolution over the last two decades. They were literally revolutionized by the rise of web maps in the new millennium, which started the routine processing and visualization of spatial data in the form of interactive outputs and tools to more dynamic and accessible web-based solutions [
1]. WebGIS platforms have emerged as powerful tools, which allow users to perform complex geospatial analyses and collaborate remotely through web browsers. However, despite the advancements in web-based geospatial technologies, one significant challenge remains: the integration of various (raster, sensor, etc.) data analyses within WebGIS environments. With the enormous development of internet technologies in recent years (canvas, data storages, responsive design, geolocation, etc.), more advanced, mostly vector-oriented WebGIS-based solutions are also becoming increasingly popular [
2]. Han [
3] also highlights the “interaction with users and connections to a wider audience and its advanced data integration capabilities”. These allow not only the publication but also the analysis and processing of spatial data directly in the World Wide Web (WWW) environment. This is a paradigm shift in GIS [
4], where the entire infrastructure is being moved from desktop- (GIS) to web-based solutions (WebGIS).
Tools supporting spatial analysis are taking spatial data processing to a new level. They bring a higher level of interactivity. Analytical data processing can be performed in real time or based on individual user parameters (e.g., buffer distance, hot spot limit, attribute field selection, etc.) [
5]. Geographic and geoinformatic analyses are now common practices in the desktop environment, and they are used routinely. Similarly, web mapping applications have become so established that they are now part of the daily habits of millions of users [
6] on a global, national and regional level within numerous settings [
7,
8,
9,
10]. The next step reflecting the evolution of WebGIS (such as the combination of GIS within the web platform) is the implementation of spatial features and advanced analysis directly into online map libraries [
11]. Cloud-computing-based applications are already following this trend [
12]. Applications such as ArcGIS Online already offer more or less analytical functions in their environment, i.e., tools and functionalities, which were, until recently, the prerogative of desktop-based solutions only. The list of simple operations, such as line/area measurement, buffer or heat map generation, is being extended with non-trivial geoprocessing operations, e.g., intersect, clip or calculate centroids. This functionality thus takes the use and deployment of GIS tools to the next level for both laymen and experts [
13].
Turf.js [
14] is a geospatial web processing service within web-based GIS environments. One of the limitations of Turf.js is its lack of support for raster data analysis. As a result, tasks such as remote sensing, satellite imagery analysis and terrain modeling, which rely heavily on raster data, cannot be performed using Turf.js. Despite this limitation, Turf.js remains a valuable tool for vector-oriented geospatial tasks and contributes significantly to the advancement of web-based geospatial analysis.
Despite the challenge of raster data analysis, the adoption of WebGIS has seen remarkable progress. Several web-based geospatial applications have emerged, showcasing the potential of online geospatial analysis—for instance, “52°North WPS” [
15], which is an open-source implementation of the Open Geospatial Consortium (OGC) standard. This implementation provides a framework for developing web-based geospatial processing services and allows users to execute geospatial processes over the web. “EnviroMonitor” empowers environmental scientists to monitor real-time sensor data, analyze environmental trends and make informed decisions using a web-based interface. Such examples demonstrate the practicality and value of WebGIS in addressing diverse geospatial challenges.
The main contribution of this paper is the performance of a comparison and evaluation of online geoprocessing tools in a WebGIS environment, focusing on vector data operations supported by the development of a custom solution for geospatial analysis. Compared to alternative comparative studies, such as those by Yue et al. [
13] or Chen et al. [
16], this study is aimed toward end-user-oriented solutions. Therefore, the paper has two sub-goals. The primary sub-goal is to perform an analysis and evaluation of online libraries supporting geoprocessing tools in WebGIS, specifically focusing on ArcGIS Online, GISCloud, CARTO, FOURSQUARE and GeOnline. A comparison of alternative solutions on the market is made in terms of the functionality offered. In addition, testing is also conducted to measure the speed and performance of individual geospatial operations. Based on previous comparison, the secondary goal is to implement a custom solution for geospatial analysis through a specialized geospatial library Turf.js. The mapping application through a user-friendly interface will allow the performance of spatial operations, analysis and data manipulation. Additionally, the development of the GeOnline application demonstrates the availability of specialized geospatial libraries such as Turf.js for non-trivial geospatial analysis in a web browser.
2. Geospatial Analysis in the Context of WebGIS
In general, the term WebGIS is accepted as a strategy for accessing and dealing with geographic information through the internet environment [
17]. WebGIS is covered in detail in a number of publications, and it is a widely accepted term [
18]. According to Dorman [
19], WebGIS is “a software and hardware configuration that enables the sharing of maps, spatial data, and geographic operations using common web communication protocols such as HTTP and WebSockets”. Meanwhile, Čepický [
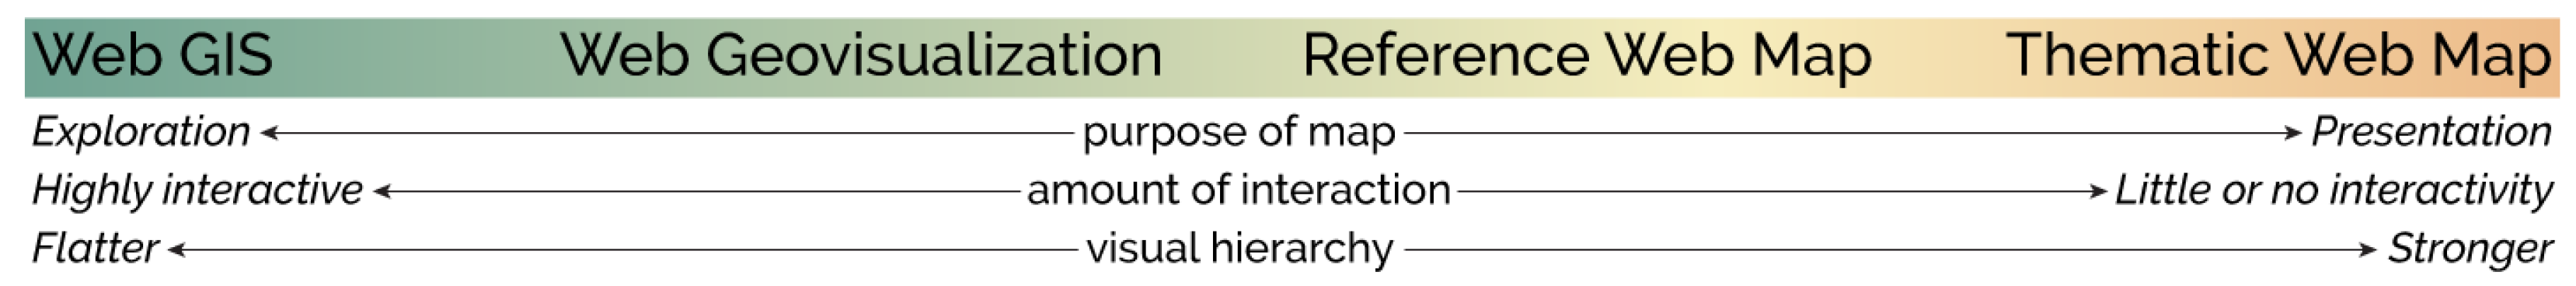
20] defines web mapping as “the design, implementation, creation and delivery of maps using the WWW”; for WebGIS, he extends the definition to include an extra analysis and processing phase (“the design, implementation, creation, delivery, analysis and processing of maps using the WWW”). Sack [
21], in a chapter dedicated to web mapping, comes up with a “swoopy diagram” dedicated to the categorization of web maps. Based on a trio of defined parameters (purpose of the map, interactivity, visual hierarchy), he divides web maps into four categories: WebGIS, Web Geovisualization, Reference Web Map, Thematic Web Map (see
Figure 1). In this view, WebGIS is characterized as highly interactive with a low degree of visual hierarchy and with an emphasis on exploring implications, not just as a tool for presentation purposes.
WebGIS emphasizes the processing, storage and analysis of spatial data [
22], including their algorithms. It is undoubtedly related to the field of web cartography, and the topics overlap and intersect to a large extent. In fact, “WebGIS”, “web cartography” and “web mapping” are often used in a similar sense, although they cannot be considered synonymous. The exact boundary between the topics is difficult to define; web cartography uses web maps as a presentation medium [
23] and focuses on visualization, while WebGIS has recently acquired more and more data and analytical functions. The implementation of new visualization methods and analyses is the latest trend in the direction of GIS into the future [
24]. Veenendaal et al. [
25] add that “WebGIS is the most common form of online GIS”; according to Hojati [
26], WebGIS is a subset of GIS.
Netek [
27] operates with the term WebGIS as a combination of the separate concepts of World Wide Web and GIS (WebGIS = WWW + GIS). From a technological perspective, the concept combines state-of-the-art methods in the context of geographic information technologies (GIT), principally based on the methods of service-oriented architecture (SOA), cloud computing and the internet as a platform. GIS affects all processes of the map output “production line”—from data collection and storage to data analysis and visualization. In that case, the entire workflow is managed within a desktop environment. In the case of WebGIS, the workflow is managed within a web environment.
2.1. Implementation of Cloud Computing
Terminologically, an analogy can also be drawn with the concept of “CloudGIS” or “GIS cloud” [
28]. While WebGIS generally allows the use of cloud storage as one of several alternatives (the application can be accessed from its own server, localhost, commercial webhosting, etc.), cloudGIS is oriented exclusively toward being hosted in a cloud environment. Therefore, cloudGIS could be considered a subset of WebGIS. A typical feature is the authenticated access, allowing, among other things, data and layer archiving in addition to map application creation, usually under a freemium business model.
Cloud computing in general is a model of using computing technology available through the internet. Mell and Grance [
29] define cloud as “a computing model for enabling ubiquitous, convenient, and on-demand network access to a shared pool of configurable computing resources (e.g., servers, storage, applications, and services) that can be rapidly provisioned and released with minimal management effort or service provider interaction”. The cloud architecture provides services or programs stored (on extraneous servers) in an internet environment, and the user benefits from the scalability of applications. Users can access their data or programs through a web browser anywhere in the world, but in fact, the computing resources lie outside the reach of the actual structure—“somewhere in the clouds”. In general, cloud computing can be defined as the access to data or computing power in an internet environment [
30].
The principles of cloud computing build on each other. Lawyer [
31] defines five pillars of cloud computing:
Internet technologies—services available entirely over the internet;
Service principle—the consumer and provider needs are separated by a clearly defined interface, which can be described as a service;
Measurement and pay-per-use—usage is tracked based on defined metrics, which then enable charging for it;
Scalability and elasticity—computing resources can be scaled up/down operationally to respond to current needs;
Resource sharing—realizes the economies of scale and maximizes resource efficiency.
From an architectural perspective, cloud computing can be approached at three levels [
32]. Infrastructure as a service (IaaS) provides the greatest flexibility. It offers storage and computing resources to deploy any software. The user can install and configure their own applications, renting hardware (analogous to a dedicated server). The IaaS is suitable in cases where the user wants to use a cloud solution but cannot or does not want to maintain their own technological facilities. It allows the user to set the computing power exactly according to the requirements. Platform as a service (PaaS) extends the IaaS with the ability to manage the platform on which the application runs (similar to web hosting), often supplemented with pre-installed tools. The provider delivers the platform and takes care of running the technology and hardware. The disadvantage (but also an advantage, on the other hand) is the lack of hardware management. Hierarchically, the highest level of cloud computing is the software as a service (SaaS) model [
33]. The customer rents a specific application designed for specific purposes or software from the provider and pays only for the time of real use. All tools mentioned in this paper are available under the SaaS cloud computing model.
For deploying WebGIS solutions in the cloud, there are services specialized directly in the area of spatial data processing according to the SaaS model. The customer leases a specific application or software from the provider and pays only for the actual use. Specific examples are ArcGIS Online, CARTO, Mapbox, GIS Cloud, MapTiler and others. These services allow the visualization, analysis and sharing of spatial data. De facto, these are GIS clients available online in an internet environment. From the point of view of this study, the principle of Service Oriented Architecture (SOA) is fundamental.
2.2. Implementation of Services
The principle of SOA is the provision of services to other components through a communication protocol over a network; in practice, these are standardized services, which allow working with data or tools “remotely”, without local access to them [
18]. It is a general approach, a generic concept for service composition independent of the implementation and platform. Users can share data, maps, compositions, tools or entire applications without the need for intervention or direct ownership of the raw data. The SOA model is based on the interaction of two parties: the service provider and the service consumer (user/client/consumer).
While in a conventional GIS in a desktop environment, the power of the computer itself is used to process operations, in a WebGIS solution, it is the services, which are used for processing. A specific implementation of SOA in the GIS domain consists of web map services. In general, these are services providing data or operations where the user accesses the required information through the internet. These are actually located on a remote server. Data services for visualization are already routinely used. However, the general principle of web services can be applied to a broader spectrum—metadata, cataloging services, transformation, sensor networks, ontology, styling or operations (processes). The Open Geospatial Consortium (OGC) is an expert group “committed to improving access to geospatial, or location information” [
34]. An overview of the most used services in the field of web cartography is given in
Table 1. The most used types of services are map or object services, enabling the visualization of raster or vector geodata. The Web Map Service (WMS) [
35] generates a data image based on client request (the required operation, bounding box defining the extent and scale, format file, coordinate reference system, version, active layers, image dimensions, style), which then sends the map back to the user as a raster image [
36]. This raster image is a portrayal of the data, which may be of raster or vector origin in the database. Every time there is a movement, however minimal, in the map field, a new query is sent to the server, and a new output is generated. WMS publishing requires an infrastructure and a suitable technical solution for data publishing (GeoServer, MapServer, ArcGIS for server). On the other hand, consuming the service is trivial. It is supported by most desktop GIS software. However, a simple web browser can also be used for visualization; a specific WMS entry with all parameters, returning the desired image, then looks like a URL
http://geoportal.cuzk.cz/WMS_ORTOFOTO_PUB/WMService.aspx?service=WMS&request=GetMap&version=1.3.0&layers=GR_ORTFOTORGB&format=image/jpeg&width=800&height=600&bbox=50.5,14.0,50.8,14.3&crs=epsg:4326&styles= (accessed on 5 September 2023).
2.3. Web Processing Service and Turf Library
Process services, analogous to the above examples of web services, allow working with geographic data in the web interface and performing spatial analyses (e.g., buffer, clip, filtering), network analyses or spatial data editing. A specific implementation of a processing service is the Web Processing Service (WPS). The WPS is an OGC standard [
37] and includes three operations, which a client can request from a server. These operations are
GetCapabilities—This operation provides the client with metadata regarding the specific operations implemented offered by the server. It provides a general description of the operations and their names.
DescribeProcess—It gives the client detailed information regarding the processes, including the required inputs, their allowable formats and possible outputs.
Execute—This operation allows the client to execute an implemented operation, which takes the specified parameters and returns a result layer.
According to Quinn [
38], the WPS specification does not specify any kinds of spatial data processing operations. There are hundreds of potential operations, which can be included. Specific processes, inputs and outputs are defined by each individual WPS implementation. When a WPS is requested for the first time, the GetCapabilities operation then returns a list of available processes.
Implementing spatial operations via services follows a strictly established workflow specified by the OGC [
39]. For example, if the user wants to create a buffer zone over the input layer, the following steps are executed: The requests for metadata are called through the GetCapabilities operation. → The response is that the server supports the buffer operation, including service metadata and metadata describing the available processes. → The user requests the DescribeProcess. → The answer to this query specifies the ability to set the size of the wrapper zone, including the units. → Finally, the user launches buffer processing through the Execute operation, which returns the newly created buffer zone layer over the input layer.
An example of a concrete WPS implementation is PyWPS [
40], Zoo Open WPS Platform or WPS extension by GeoServer. Each operation is defined by GetCapabilities, and the requests are based on HTTP GET or POST request. Using these requests, the standard further defines
Encoding the request to execute a process;
Encoding the response from the executed process;
Inserting data and metadata into the inputs and outputs of the executed process;
Reference data inputs and outputs accessible on the web;
Support for long-term processes;
Process status information;
Information regarding errors, which occurred during the process;
Storage of process outputs.
With the gradual transition of applications to the cloud, it can be concluded that WPS has enormous potential. Process web services can add value to web maps in terms of the ability to perform spatial operations, analyses and to work with data, not just simple visualization as before. Web map applications integrating process services can partially replace the traditional approach through desktop software. Finally, WPS adds value to the field of WebGIS, but it is only a declaration and description of background processes; it does not define the user environment, cartographic symbology [
41] or user interaction. Therefore, there is a need to use client-side solutions.
Currently, there are only a few really usable implementations of geospatial analysis within the WebGIS area, but one library provides a variety of prepared and ready-made operations, such as buffer, dissolve, intersect, union, transform, etc.: Turf.js [
14]. It is a JavaScript library distributed under the open Massachusetts Institute of Technology (MIT) license (free to use). According to Quinn [
38], “many spatial processing operations are quite common and there is a great desire from GIS web developers to invoke these without the overhead of a WPS. The Turf.js has gained popularity for allowing geoprocessing directly on GeoJSON vectors in a JavaScript environment”. It is built as a modular collection of 140 modules for geoprocessing tools as a web-based universal alternative for spatial analysis processes [
42].
There is a crucial technical difference between Turf.js as a specific implementation and other WPS as a general scheme. Since JavaScript is computed on the client side, the client machine runs the processing code, not the server. Therefore, WPS provides server-based spatial processes, while Turf.js is based on client-based operations. That strategy allows the creation of platform-independent and no-installation-process-required solutions because only a web browser is required. It was developed to directly support the most used open-source mapping libraries, such as Leaflet and Mapbox. The implementation of Turf.js into any custom JavaScript application is elementary and simple [
43]. It requires Turf core script, typically located in the <head> element of the webpage, which defines the general variable “turf” and then defines the required operation.
The typical GIS operation for demonstration used routinely on both desktop and web solutions is, e.g., buffer. It calculates the wrapping zone around the input features within a given distance (radius). A run of the buffer command via Turf.js requires the definition of the global Turf.js variable, the operation name (buffer), two obligatory variables (input features, radius) and an optional variable (unit). Then, the code in the JavaScript notation of the command is
3. Methodology—Case Study Development
GeOnline is the authors’ case study, developed with a focus on the implementation of non-trivial geospatial analysis within the web browser. The motivation of the project is to demonstrate the availability of spatial analysis tools and to provide the end user with a unique environment for spatial operations. The main aim of the development process is to implement, test and compare a list of spatial analyses available on the market of WebGIS solutions (see below for a list of supported operations). Alternative tools are analyzed to identify suitable analytical operations, specify their pros and cons, and compare them. GeOnline thus provides a solution, which implements the features expected in alternative solutions but at the same time adds additional value to the new tools.
The core is based on the Turf.js library and enables the running of spatial operations, analyses and data processing. The abbreviation GeOnline stands for a combination of “geospatial” and “online”. The application is available in English; it is free to use and available online at URL
https://gis.upol.cz/geonline/ (accessed on 5 September 2023). The solution combines the traditional and widely used combination of Hypertext Markup Language (HTML), Cascading Style Sheets (CSS) and JavaScript (JS).
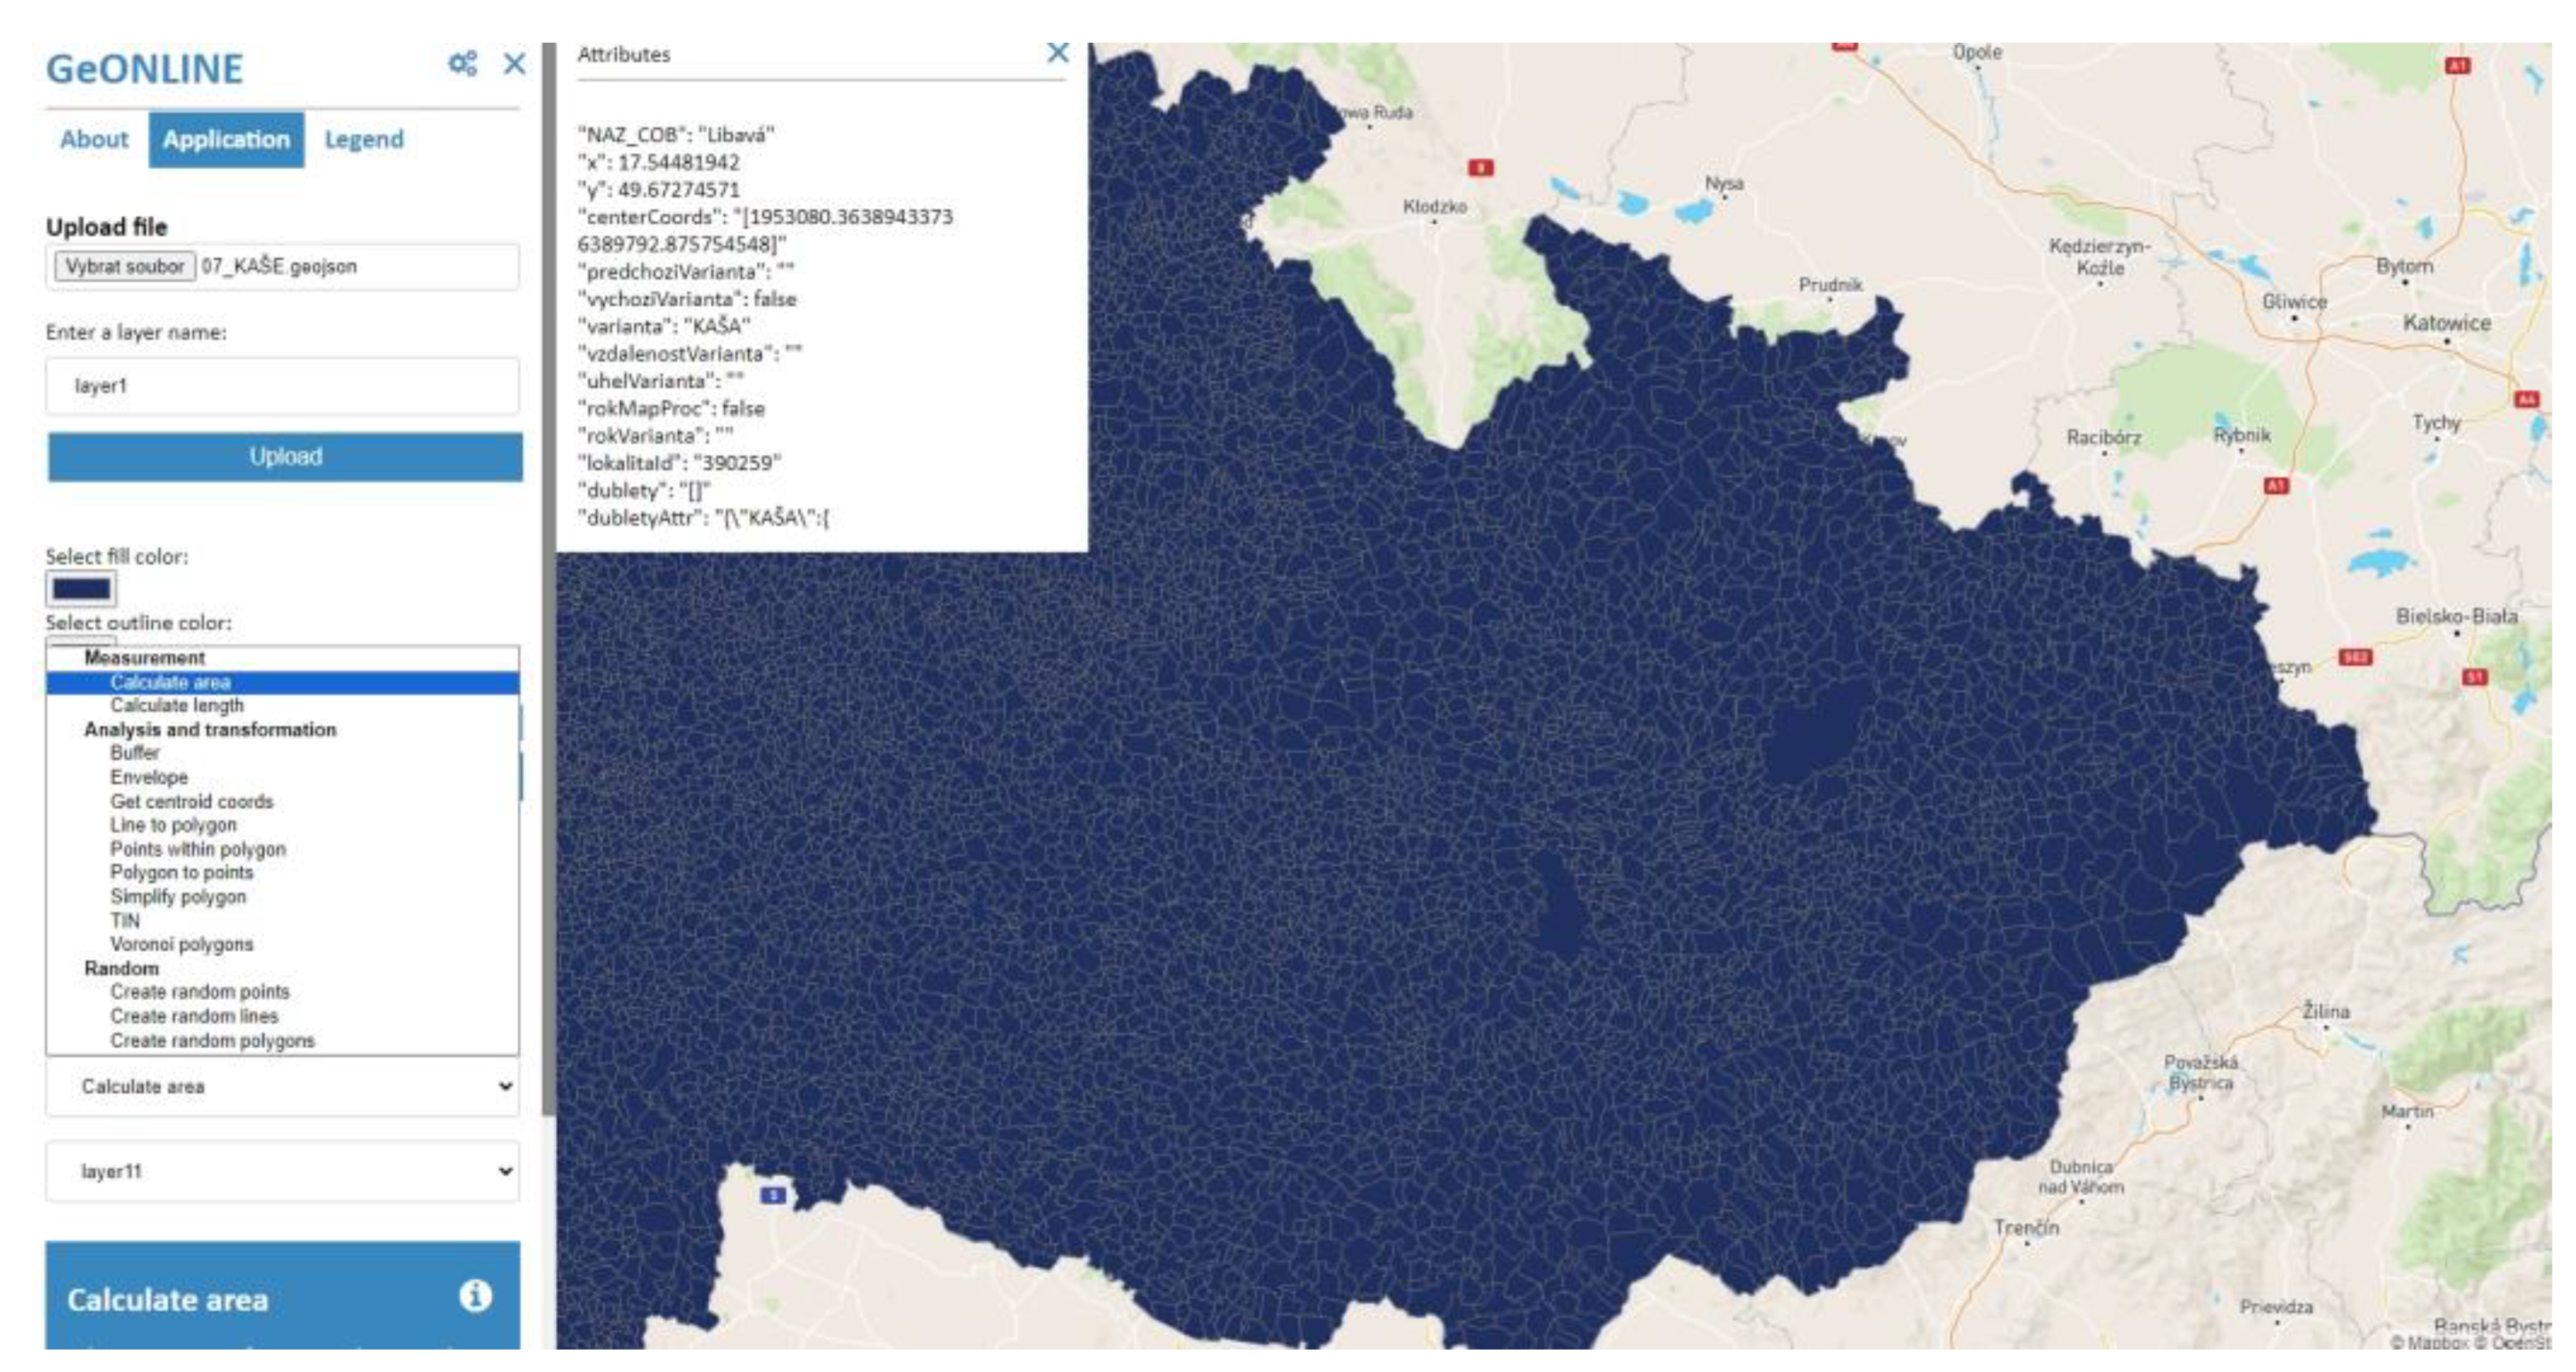
The interface of the application is divided into a map field, which occupies the main part of the display, and a sidebar, which can be used to operate the application (see
Figure 2). The sidebar is divided into three tabs. The first About tab serves as a short introduction to the application and contains instructions on how to use it. The Application tab is the main part of the sidebar. It houses the file upload, layer list and spatial operations options. The last tab, Legend, is used to display the individual cartographic features for the available layers. The OpenAboutApp, OpenContent and OpenLegend functions are used to switch between the tabs. Since the Turf.js library only allows performing spatial operations and is not intended for data visualization, it was necessary to choose a suitable mapping solution. The Mapbox GL JS [
44] library was chosen from a number of open-source libraries. The main reason is its comprehensiveness, speed, wide selection of plugins and extensive support, including elaborate documentation. A factor taken into account was also the Mapbox team’s collaboration with Turf.js; the tutorials for linking Turf.js to the Mapbox GL JS library are available on the official Mapbox website [
44].
The final list of operations was chosen to be as diverse as possible and with additional value seen in alternative solutions. Fourteen spatial operations in total, divided into three categories, were implemented:
Measurement (2): Calculate area; Calculate length;
Analysis and transformation (9): Buffer; Envelope; Get centroid coordinates; Line to polygon; Points within polygon; Polygon to points; Simplify polygon; Create TIN; Voronoi polygons;
Random (3): Create random points; Create random lines; Create random polygons.
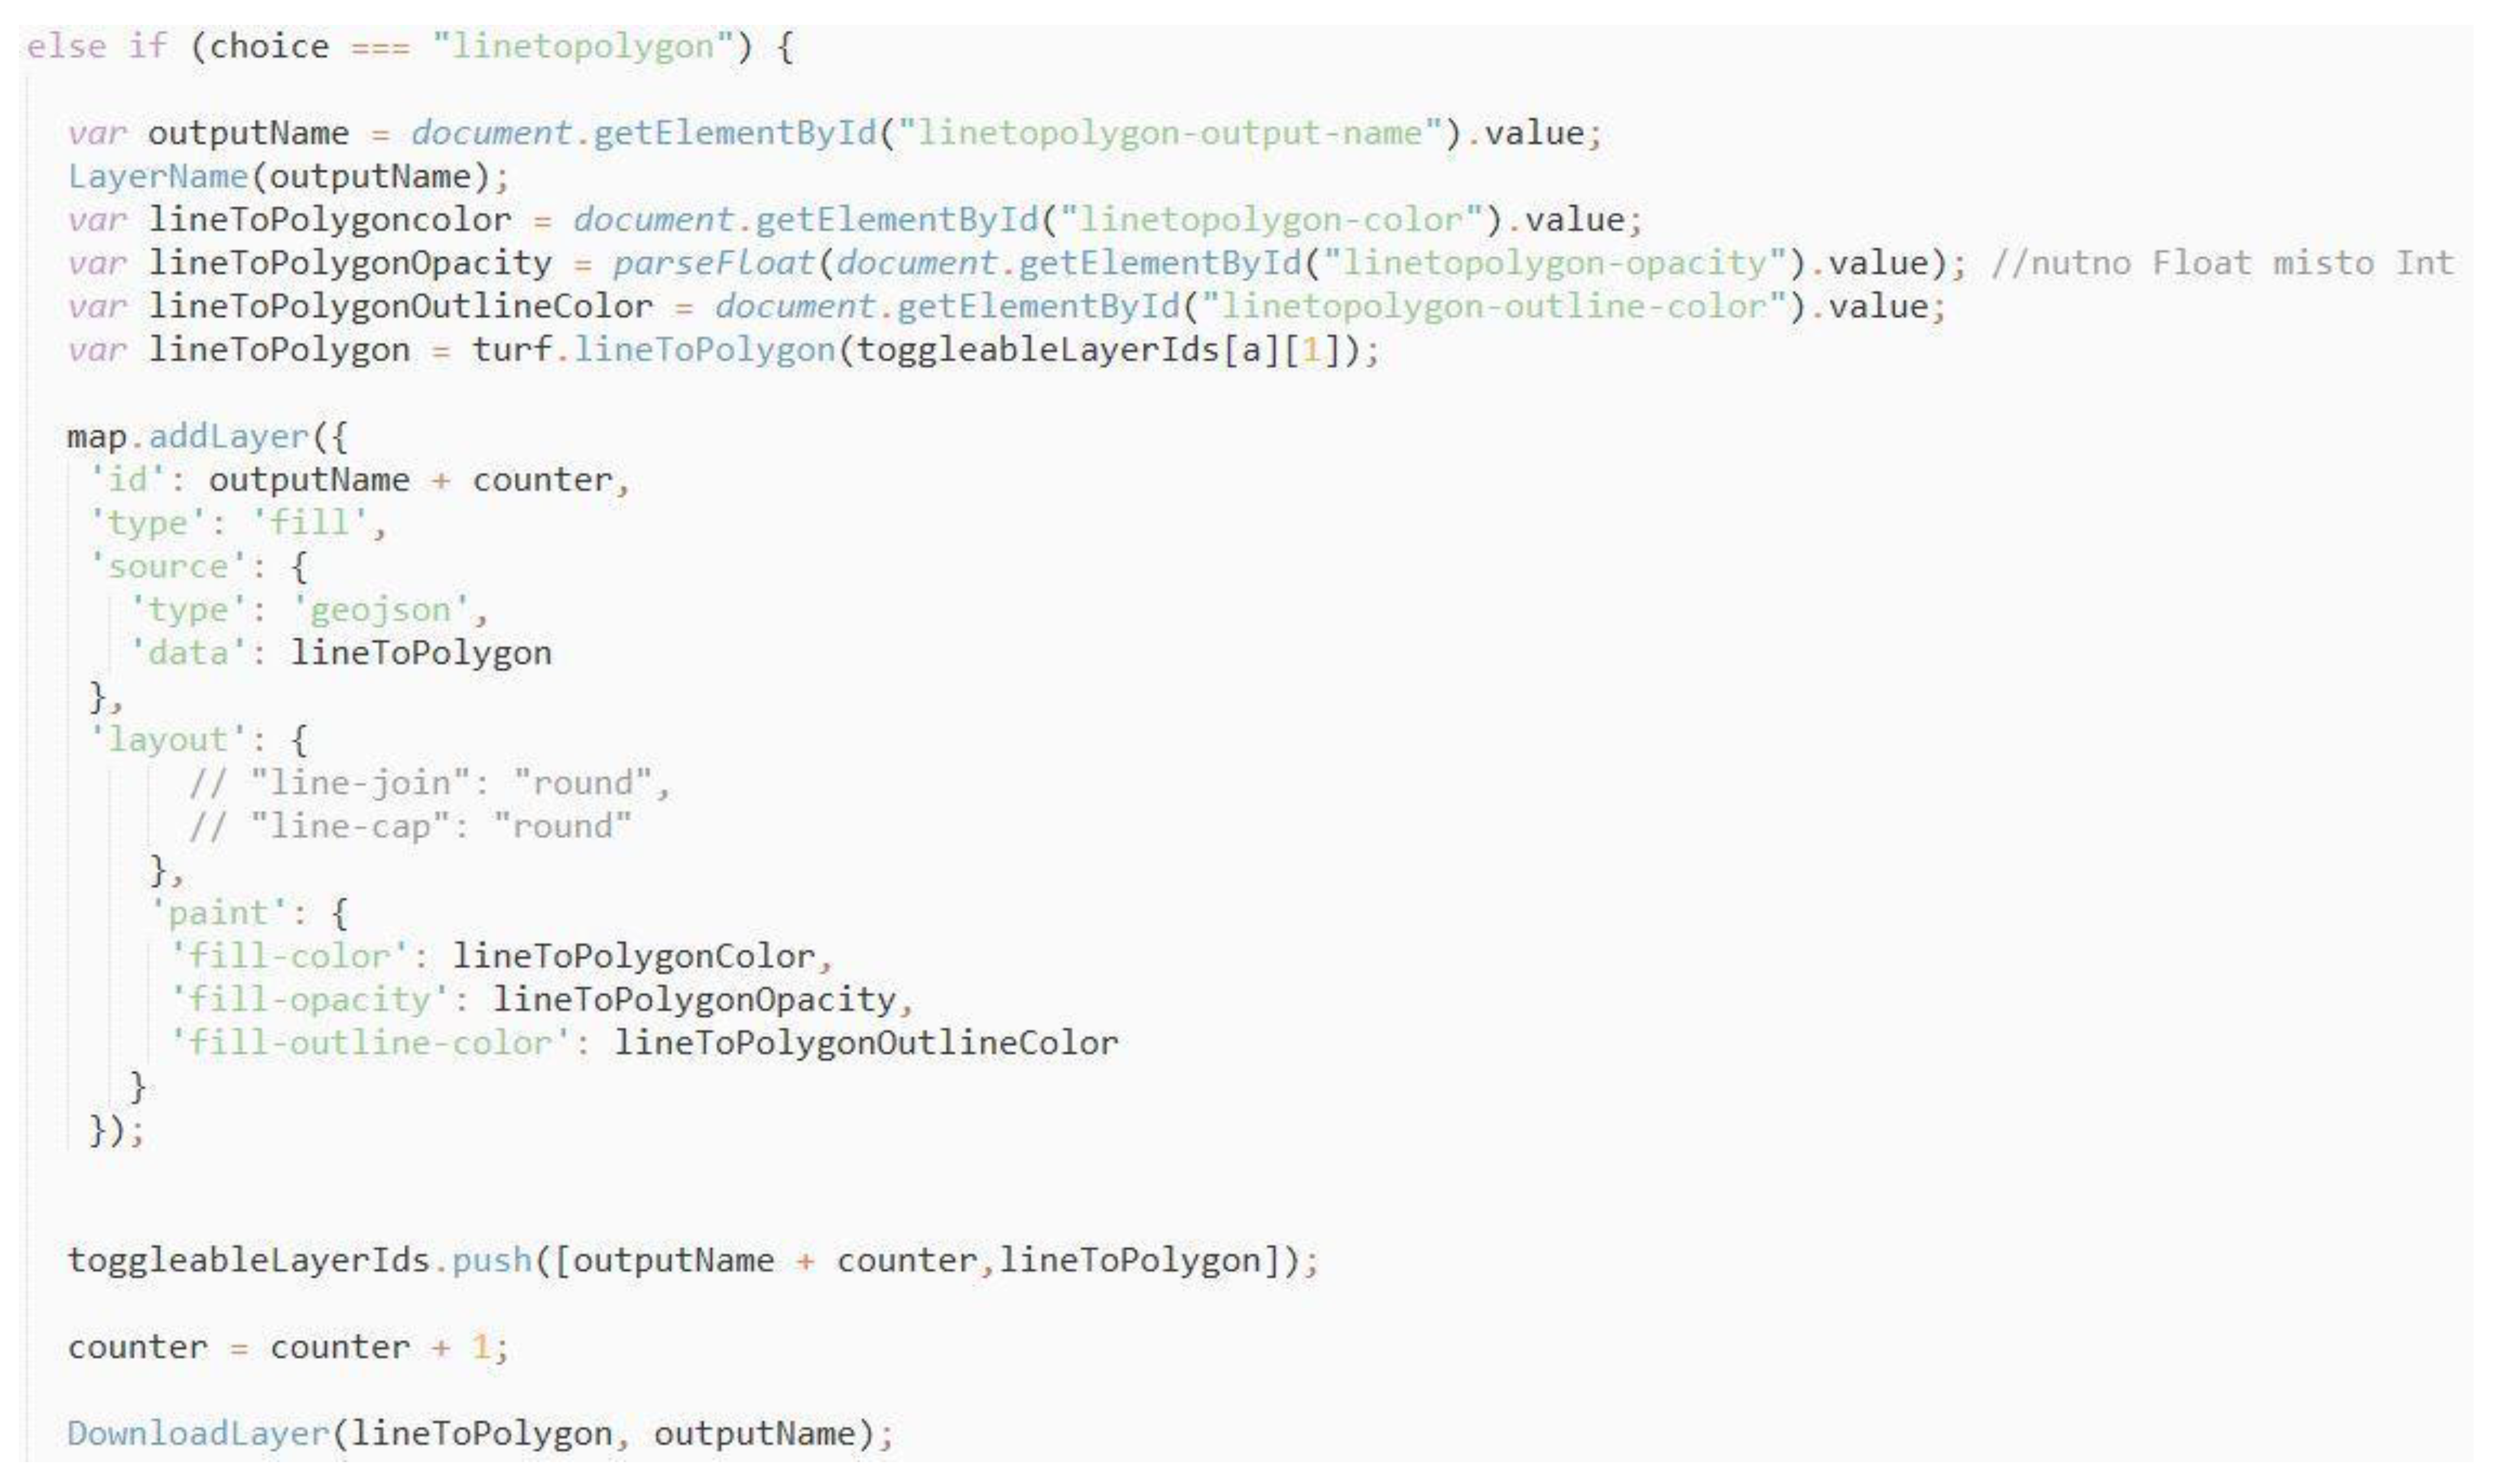
In the sidebar, under the Select operation heading, a scrolling menu was created, where all the implemented operations are located. Selecting one of them will expand a form with additional attributes and basic symbology editing options. Each operation can only be performed on a specific data type (point, line, polygon), and the suitability of each layer is ensured in the same way as for file upload—in this case, through the SuitableLayer function. In the case of the Points within polygon operation, two layers are input, and the SecondSuitableLayer function is executed with the SuitableLayer function. The result is the ListOfSuitableLayers array, which is output to the drop-down list below the selected operation. After selecting the operation, the layer and the attributes, the Execute function is launched when the SUBMIT button is clicked. It uses the getElementById() method to provide all input parameters and selects a function from the Turf.js library to execute the spatial operation (
Figure 3). The resulting layer is stored in the toggleableLayersId field—and thus, in the list of layers in the sidebar—and is displayed in the map field. A link is created to download the new layer, and a cartographic feature is written on the legend.
Along with the newly created layer, a download link is created under the title List of layers. The LinkToDownload function is launched after the operation from the Turf.js library and takes two arguments: the layer with the data and its name. Using the encodeURIComponent(JSON.stringify()) function, the data from the layer are stored in the data variable, and a link is created using the document.createElement() method, which is placed in the download icon of the layer. The parameters of color, width, line connection type and line termination are implemented for the line geometries.
4. Results—Comparison Study
The main objective of this paper is to make a comparison of alternative solutions providing spatial analytical operations through a web-based solution. Inspired by studies focused on performance analysis by El-Sayed et al. [
45] or by Alfaqih [
28], the authors attempted to compile a comprehensive review of the studied issue in two phases. In the first phase, testing and comparison of the tools available on the market in terms of the available functionality were carried out. In the second step, performance testing of the selected solutions was performed.
For the comparative study, the tools available on the market, which support the functionality of web process services and their visualization in a cloud environment, were included as ready-made solutions: ArcGIS Online, CARTO, Foursquare Studio, GISCloud and GeOnline (in alphabetical order). Therefore, the study did not include solutions in the form of APIs (MapBox GL JS, Google Maps API, Esri API, etc.). In addition to the above products, there are a number of alternative products available on the market (e.g., MapBox, Maptiler Cloud, Kepler, etc.). Overlapping these products is the MapBox API, which partly uses the Turf.js libraries.
This comparison study was based on comprehensive research of the issues and solutions available on the market. Two basic groups of geospatial processes were defined for the purpose of this article: visual-driven and data-driven analyses (see
Table 2). The first group comprises visual-driven geospatial processes. They only involve changing the visualization over the original input data; however, there is no backward spatial operation over the original data. Examples of visual-driven visualizations are the heat map, grid, hexbin, clustering. In this case, the input data remain the same, while the computation is only necessary to change the expression method; a typical example is changing the visualization of a point layer into the form of a heat map. Visualizations in the form of heat maps or grids can today be considered as standard visualization methods, which are available through a number of visualization tools (ArcGIS Online, CARTO, Maptiler, Mapbox, Google Maps API, Leaflet and many others), but not all of them support analysis tools. The issue of heat maps is discussed in detail in Netek et al. [
46].
The second group comprises data-driven computed (true) geospatial analyses. This is a set of methods based on spatial operations of input data, where the data are computed and then transformed, usually into a new data layer. Typical examples include the operations of buffer, calculate centroids, spatial join, intersect, merge, aggregate and others.
A specific group of spatial operations includes geocoding (forward and reverse) and geolocation operations. However, these operations are not based on spatial analysis; for this reason, they are not the focus of this study.
This paper primarily focuses on data-driven (data-based) analysis, available via a cloud computing environment.
4.1. Functionality Comparison
Several geoinformatic aspects, such as the number of operations, input formats, attribute or geometry editing, were selected for comparison (see
Table 3). The most important aspect is the number of spatial operations offered by the applications. First, a comparison of quantitative characteristics and aspects was made. The highest number of operations (29) is offered by ArcGIS Online; the GeOnline application supports 14 spatial operations, comparable to CARTO, which offers 15 operations, while GIScloud offers only 4.
ArcGIS Online [
47] is a cloud-based and most comprehensive solution for these options [
48]. It is distributed as a SaaS for publishing, viewing and sharing data, interactive maps and applications in Esri’s web environment. Data can be injected into ArcGIS Online in a variety of ways: both web services (WMS, WFS, WMTS, WPS) and local files (Shapefile (SHP), Geographic JavaScript Object Notation (GeoJSON), comma-separated values (CSV) or GPS Exchange Format (GPX), etc.) are supported. It offers the largest number of spatial operations, and apart from the absence of geolocation or numerical scaling, it has great support for input formats and offers advanced cartographic visualization capabilities. A great advantage is the possible integration with the Esri ecosystem (ArcGIS Pro, ArcGIS Server). For each operation performed, the user has points deducted, which must be purchased. Almost all web browsers are supported, even in mobile versions.
Supported ArcGIS Online operations (29 in total, divided into six categories):
Summarize data (5): Aggregate Points; Join Features; Summarize Nearby; Summarize Within; Summarize Center and Dispersion;
Find locations (8): Find Existing Locations; Derive New Locations; Find Similar Locations; Choose Best Facilities; Create Viewshed; Create Watersheds; Trace Downstream; Find Centroids;
Data enrichment (1): Enrich Layer;
Analyze patterns (5): Calculate Density; Find Hot Spots; Find Outliers; Find Point Clusters; Interpolate Points;
Use proximity (5): Create Buffers; Create Drive-Time Areas; Find Nearest; Plan Routes; Connect Origins to Destinations;
Manage data (5): Extract Data; Dissolve Boundaries; Generate Tessellations; Merge Layers; Overlay Layers.
GISCloud [
49] is one of the first web-based GIS, whose functionality is stored in the cloud. It supports a range of vector formats (SHP, GPX, KML, SQLite, etc.), raster formats (TIF, JPG, PNG, JP2, etc.) and web services (WMS, WFS, WMTS, TMS). It is a commercial software. GISCloud offers the smallest selection of spatial operations, only four. Moreover, two of them can only be performed with the input layer in the PostGIS database. The same limitation applies to editing attributes of individual features. In addition to WebGIS itself, GISCloud also provides APIs (REST and JavaScript), which allows data manipulation and UI customization. The user can also host custom applications on GISCloud.
Supported GISCloud operations (four in total): Buffer; Heat Map; Near; Area.
CARTO (formerly CARTODB) [
50] is a cloud computing platform for spatial data analysis and distribution distributed as SaaS, which is distributed as a free software built on PostGIS and PostreSQL. It is primarily intended for users who do not have professional experience in GIS. CARTO supports all basic formats (SHP, GeoJSON, CSV, KML, GPX) or geodatabases. It offers several operations (geocoding, filtering, envelope zones, trends, point selection). CARTO provides the second highest number of spatial operations. It offers a large variety of input formats, and apart from the absence of scaling and geolocation, it offers all the basic functions. CARTO tries to support and implement general standards for spatial data, such as the wide use of GeoJSON or vector tiles. It works in a framework-agnostic way, so the implementation in user web applications does not depend on a specific framework; however, use of the React library is recommended by CARTO developers (the CARTO for the React framework is ready for this case). In addition to JavaScript implementation, CARTO also supports Python implementation using its own CARTOframes library. CARTOframes is intended to serve as a complement or replacement for the pandas or jupyternotebooks libraries.
Supported CARTO operations (15 in total): Create second layer; Geocoding; Add columns from two datasets; Intersection and Aggregation; Create path buffers/distances; Create centers of geometries; Create polygons from points; Filter by column value; Select points in polygon; Create lines from points; Subsample percent rows; Calculate point clusters; Remove outliers and clusters; Predict trends and volatility; Find nearest.
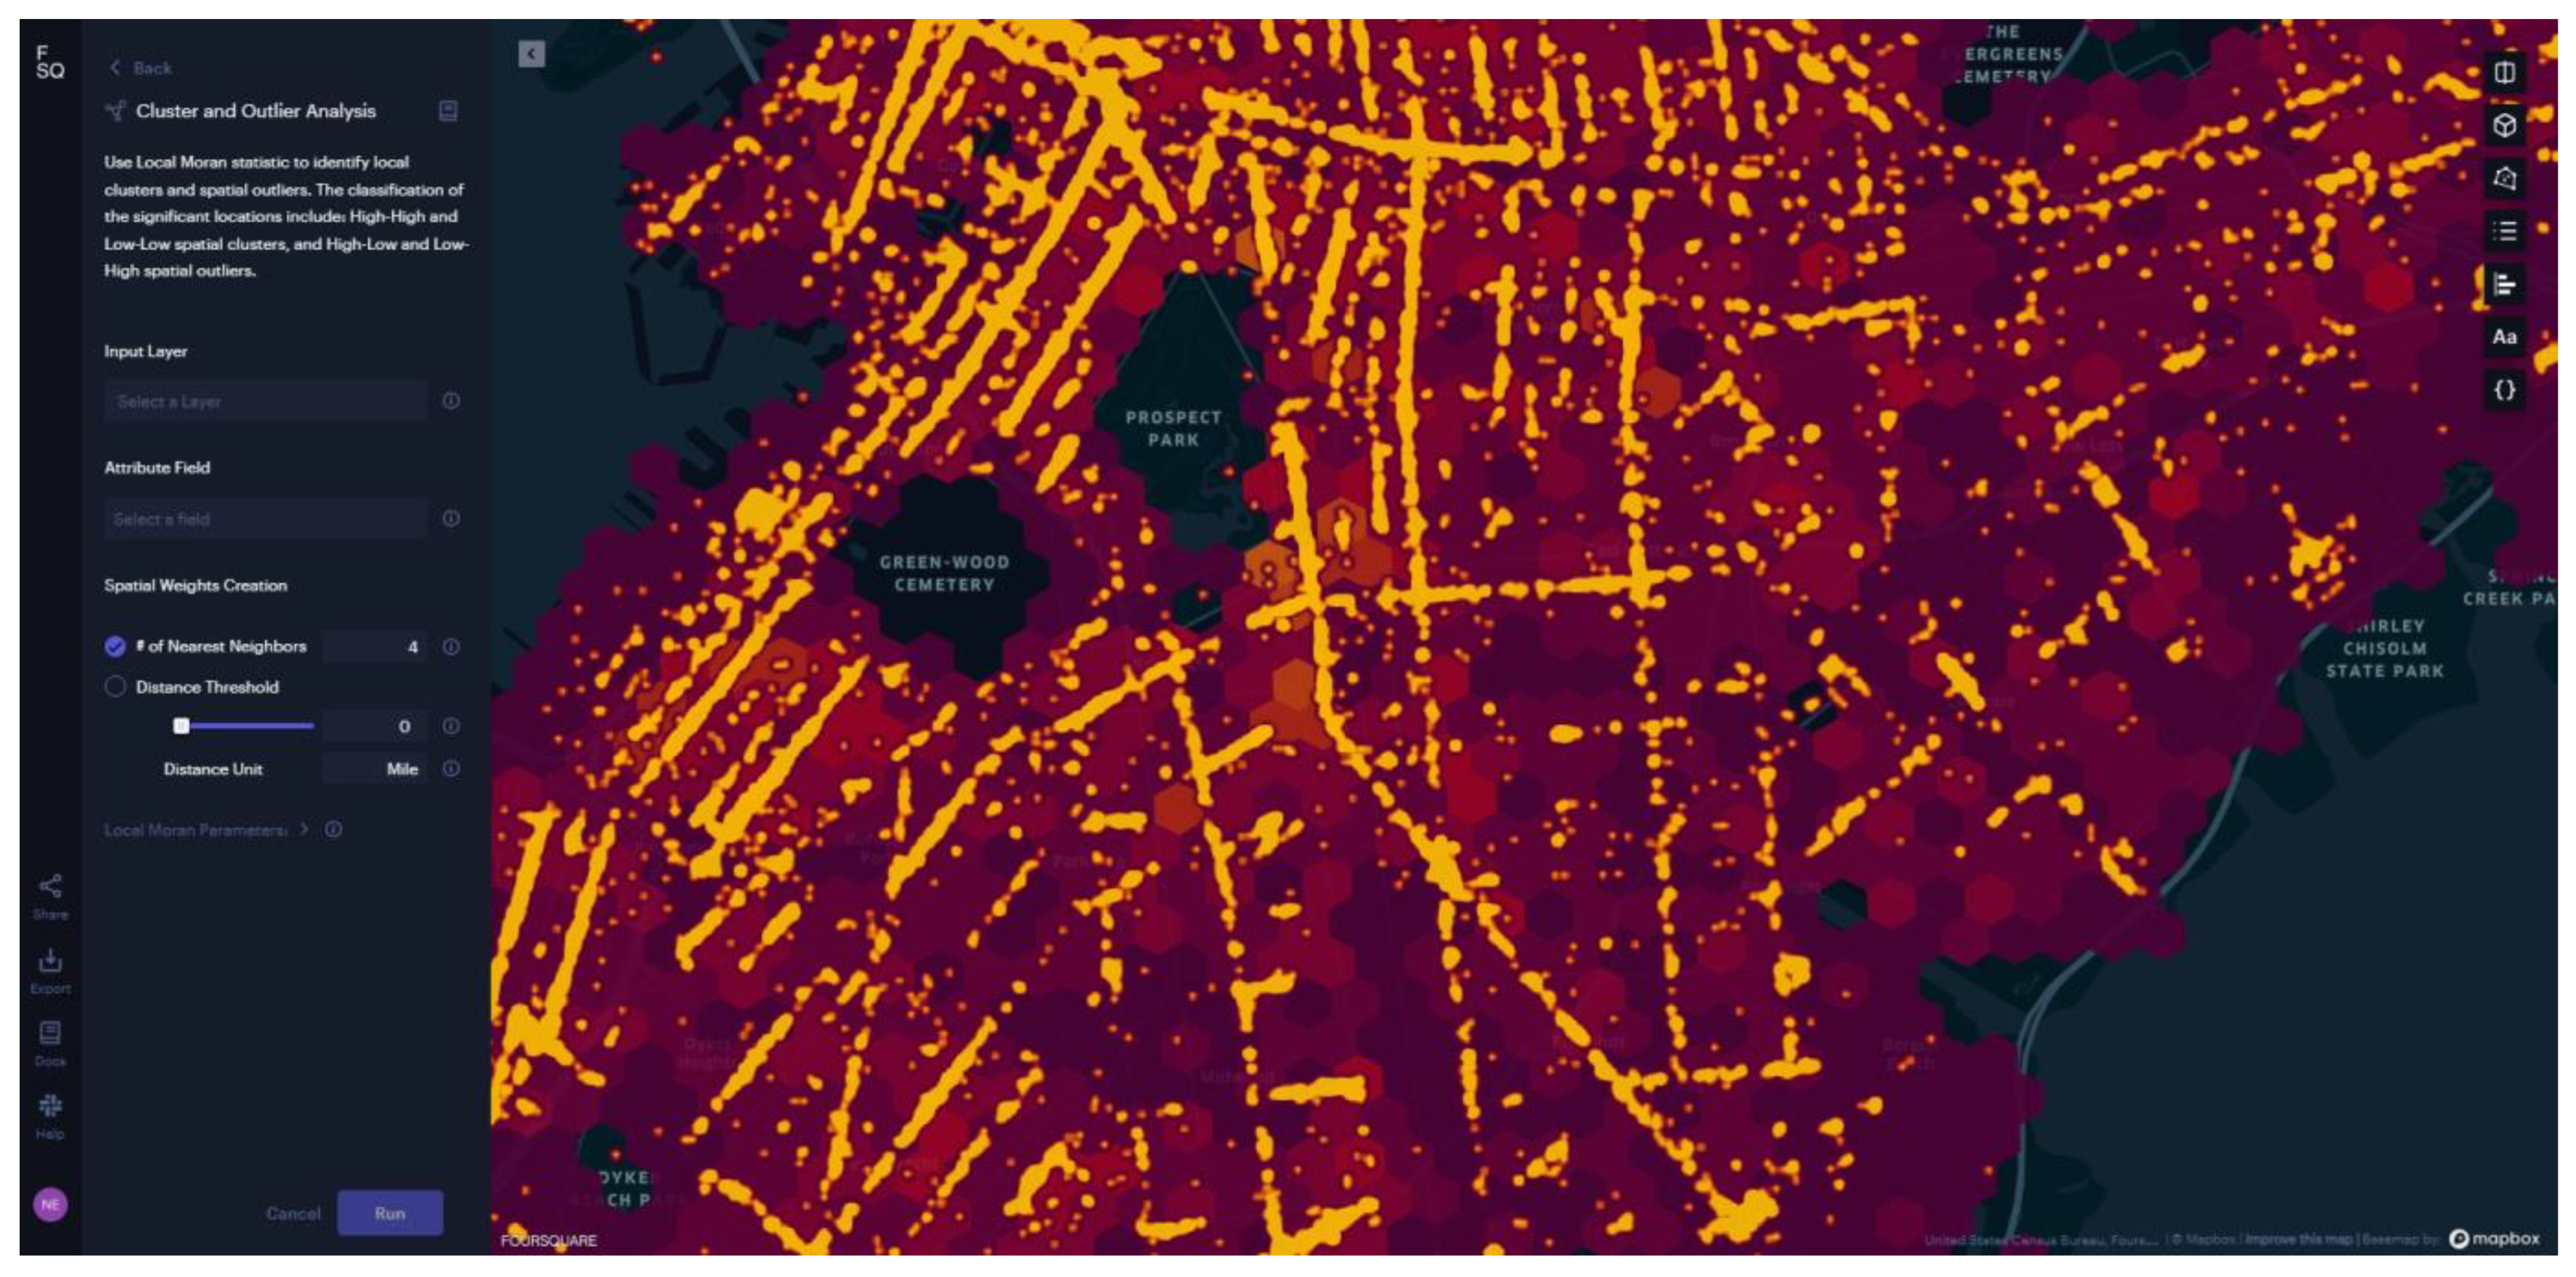
The Foursquare Studio (formerly Unfolded) [
51] is one of the new WebGIS tools. It supports data in CSV, JSON, GeoJSON, Esri SHP, ZIP, Excel, KML and other formats. It uses a custom HexTiles tiling system to display data, which should speed up on-the-fly data analysis and also support performance efficiency in bigdata processing. It includes two spatial operations in total: Cluster and Outlier Analysis (hot spots and cold spots;
Figure 4) and Suitability Analysis (finding potentially suitable locations). There are also point, arc and grid visualization tools. The application does not yet support standalone tools; only Spatial Join can be created, or data can be filtered by spatial and temporal affiliation. Foursquare Studio can also be used in Grafana and Google Data Studio to visualize spatial data using SQL.
Supported Foursquare Studio operations (three in total): Outlier Analysis; Suitability Analysis; Geocoding.
GeOnline is a lighter version of the above solutions. It offers 14 spatial operations; the biggest drawback is the limited number of input formats and the lack of editing attributes and geometry. The biggest advantage of this application is its simplicity and speed. The application is the only one, which does not offer the option of user accounts. This can be considered both an advantage (simplicity and accessibility) and a disadvantage (lack of data saving into local storage and history). One of the biggest weaknesses of the GeOnline application is the range of input formats; the user has the option to upload data only in the GeoJSON format. Other applications offer a wider portfolio of raster and vector formats. In this aspect, GeOnline cannot compete with alternative solutions from other companies. All applications offer basic map elements (legend, zoom, export). In addition to GeOnline, other web applications also offer attribute and geometry editing. However, the GISCloud platform only offers attribute editing for layers, which were uploaded via the database. Additionally, unlike other products, GeOnline does not offer an underlying map selection or concept search. On the other hand, GeOnline does offer a geolocation option.
Supported GeOnline operations (14 in total): Area calculation; Length calculation; Buffer; Envelope; Get center coordinates; Line to polygon; Points in polygon; Polygon to points; Polygon simplification; TIN creation; Voronoi polygons; Random point creation; Random line creation; Random polygon creation.
4.2. Performance Testing
In addition to the conventional methods available via user interface, we also have web-based tools for using geospatial functions and processing spatial data. The OGC has created WPS, a service, which communicates using XML, for this purpose. WPS can also be used within a client machine, for example in QGIS. Similarly, some web APIs allow the use of this service (OpenLayers).
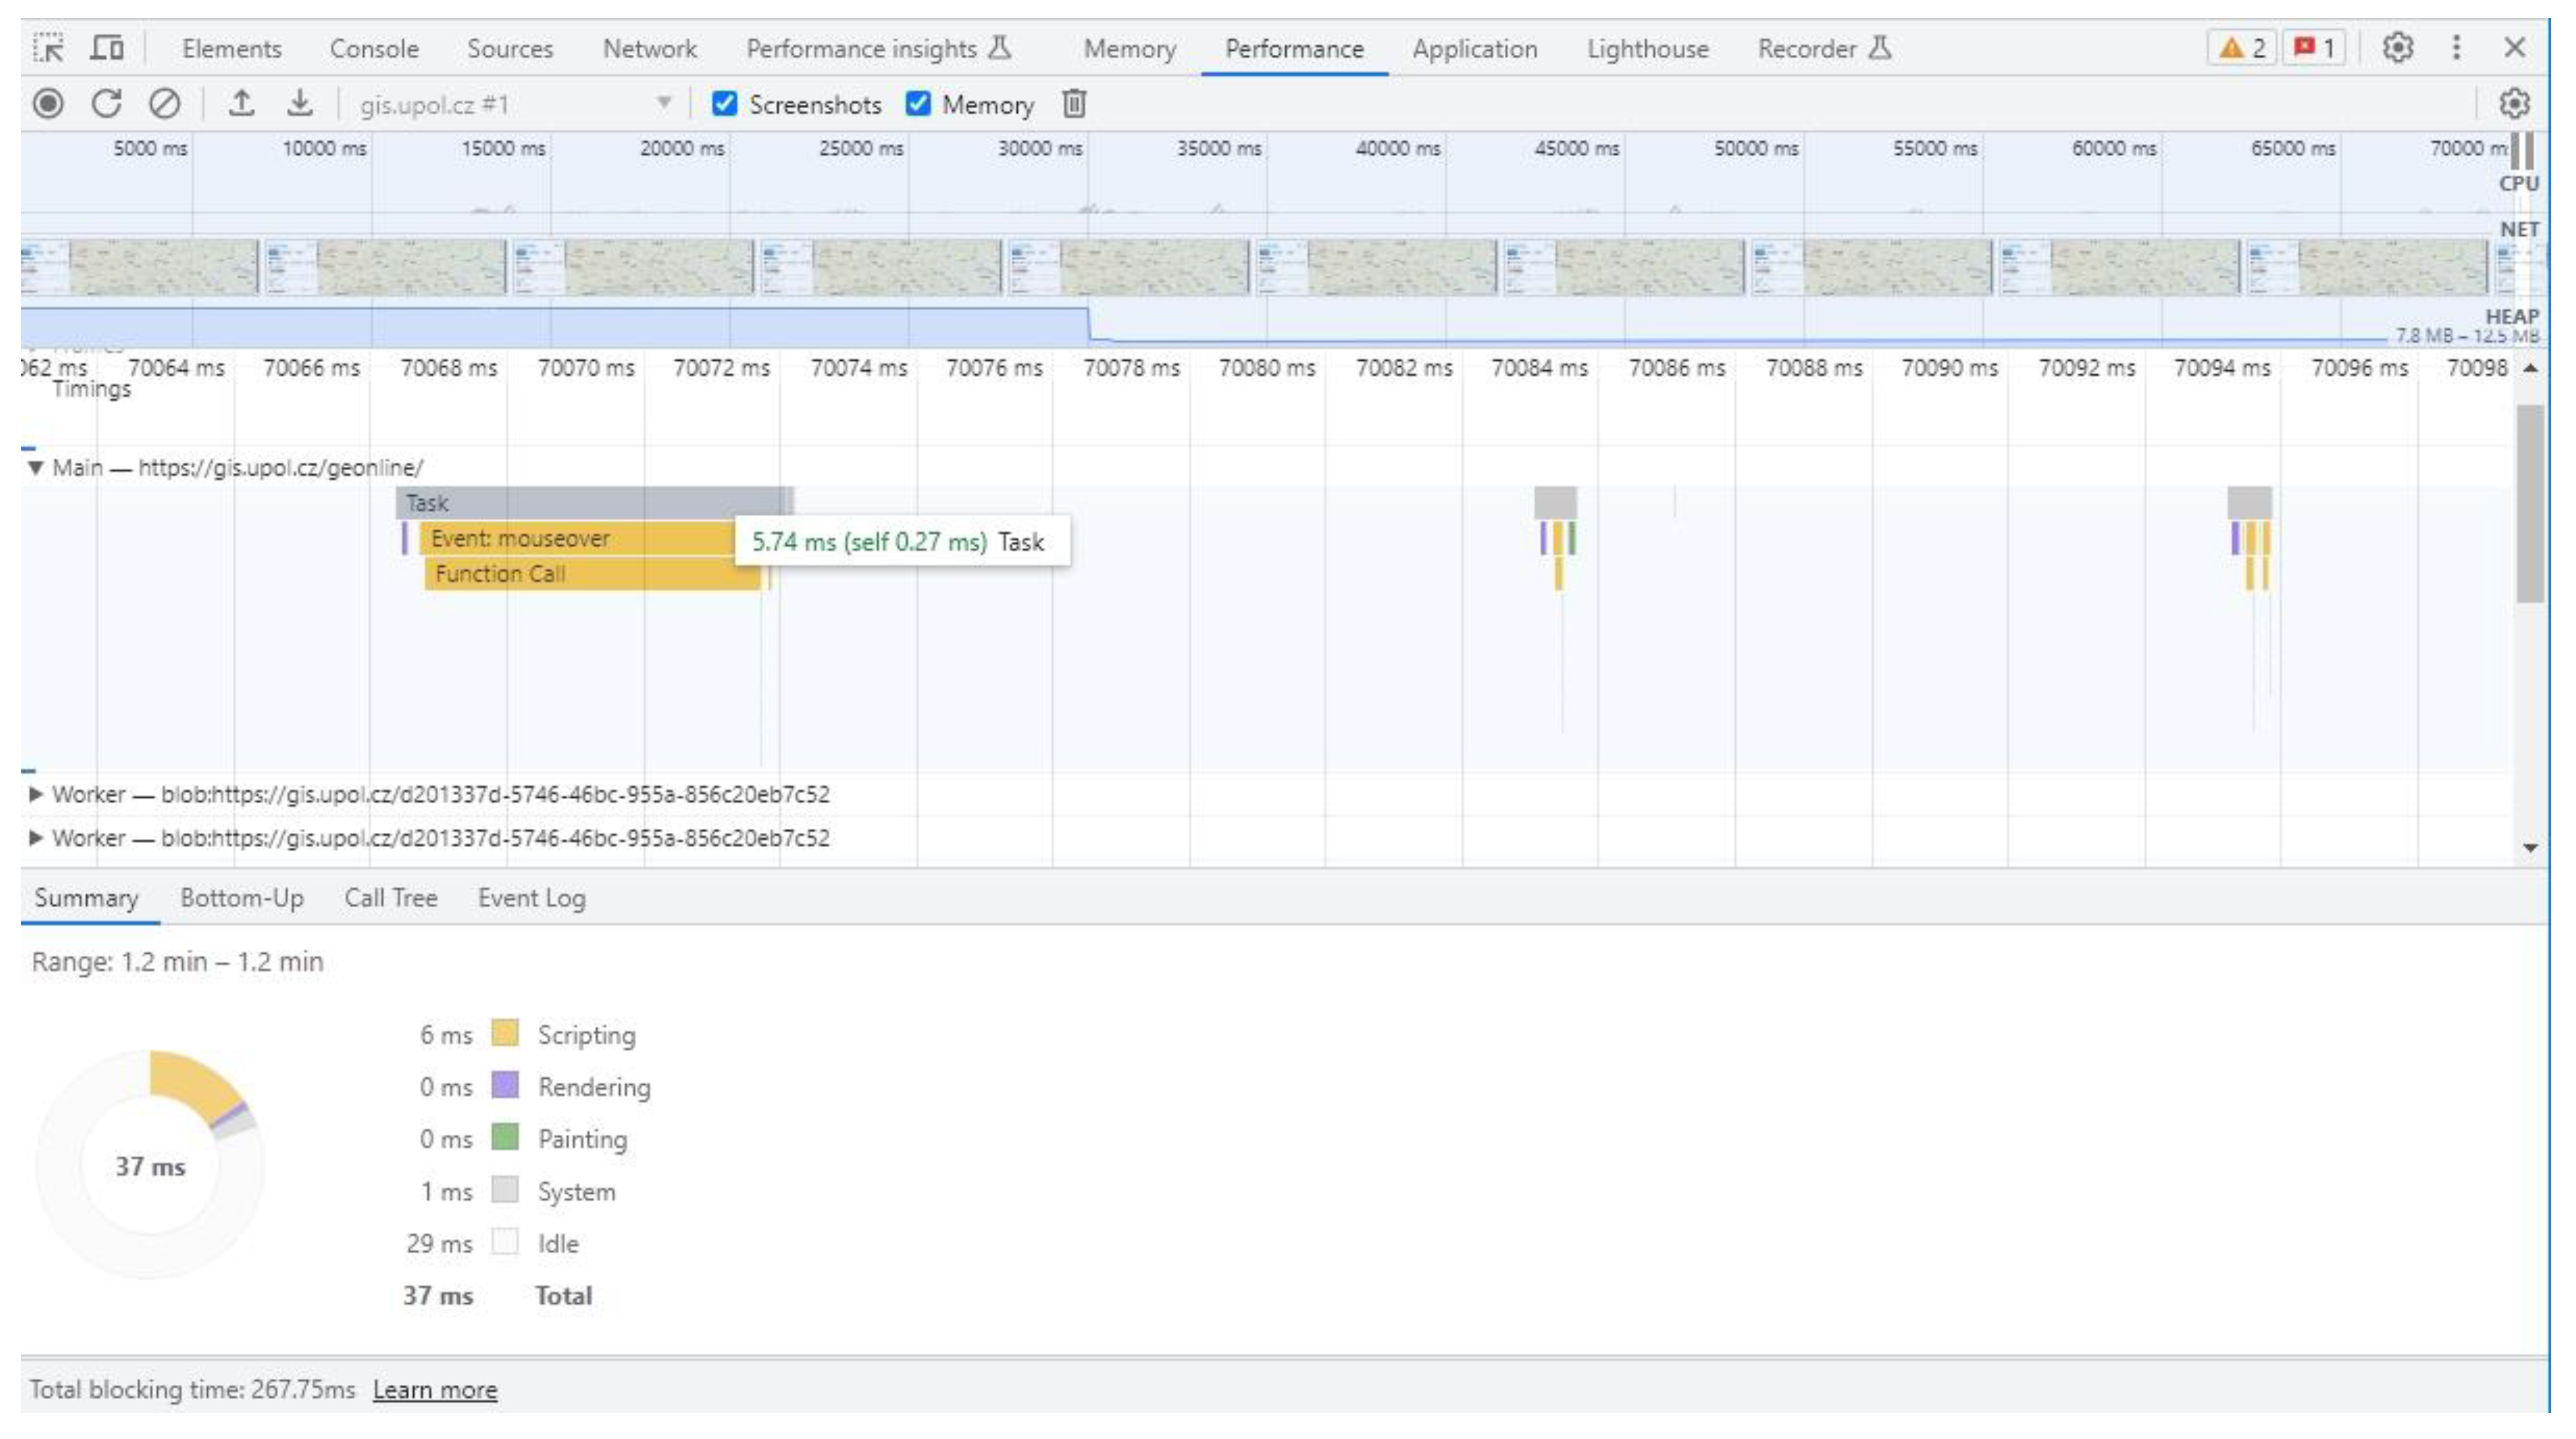
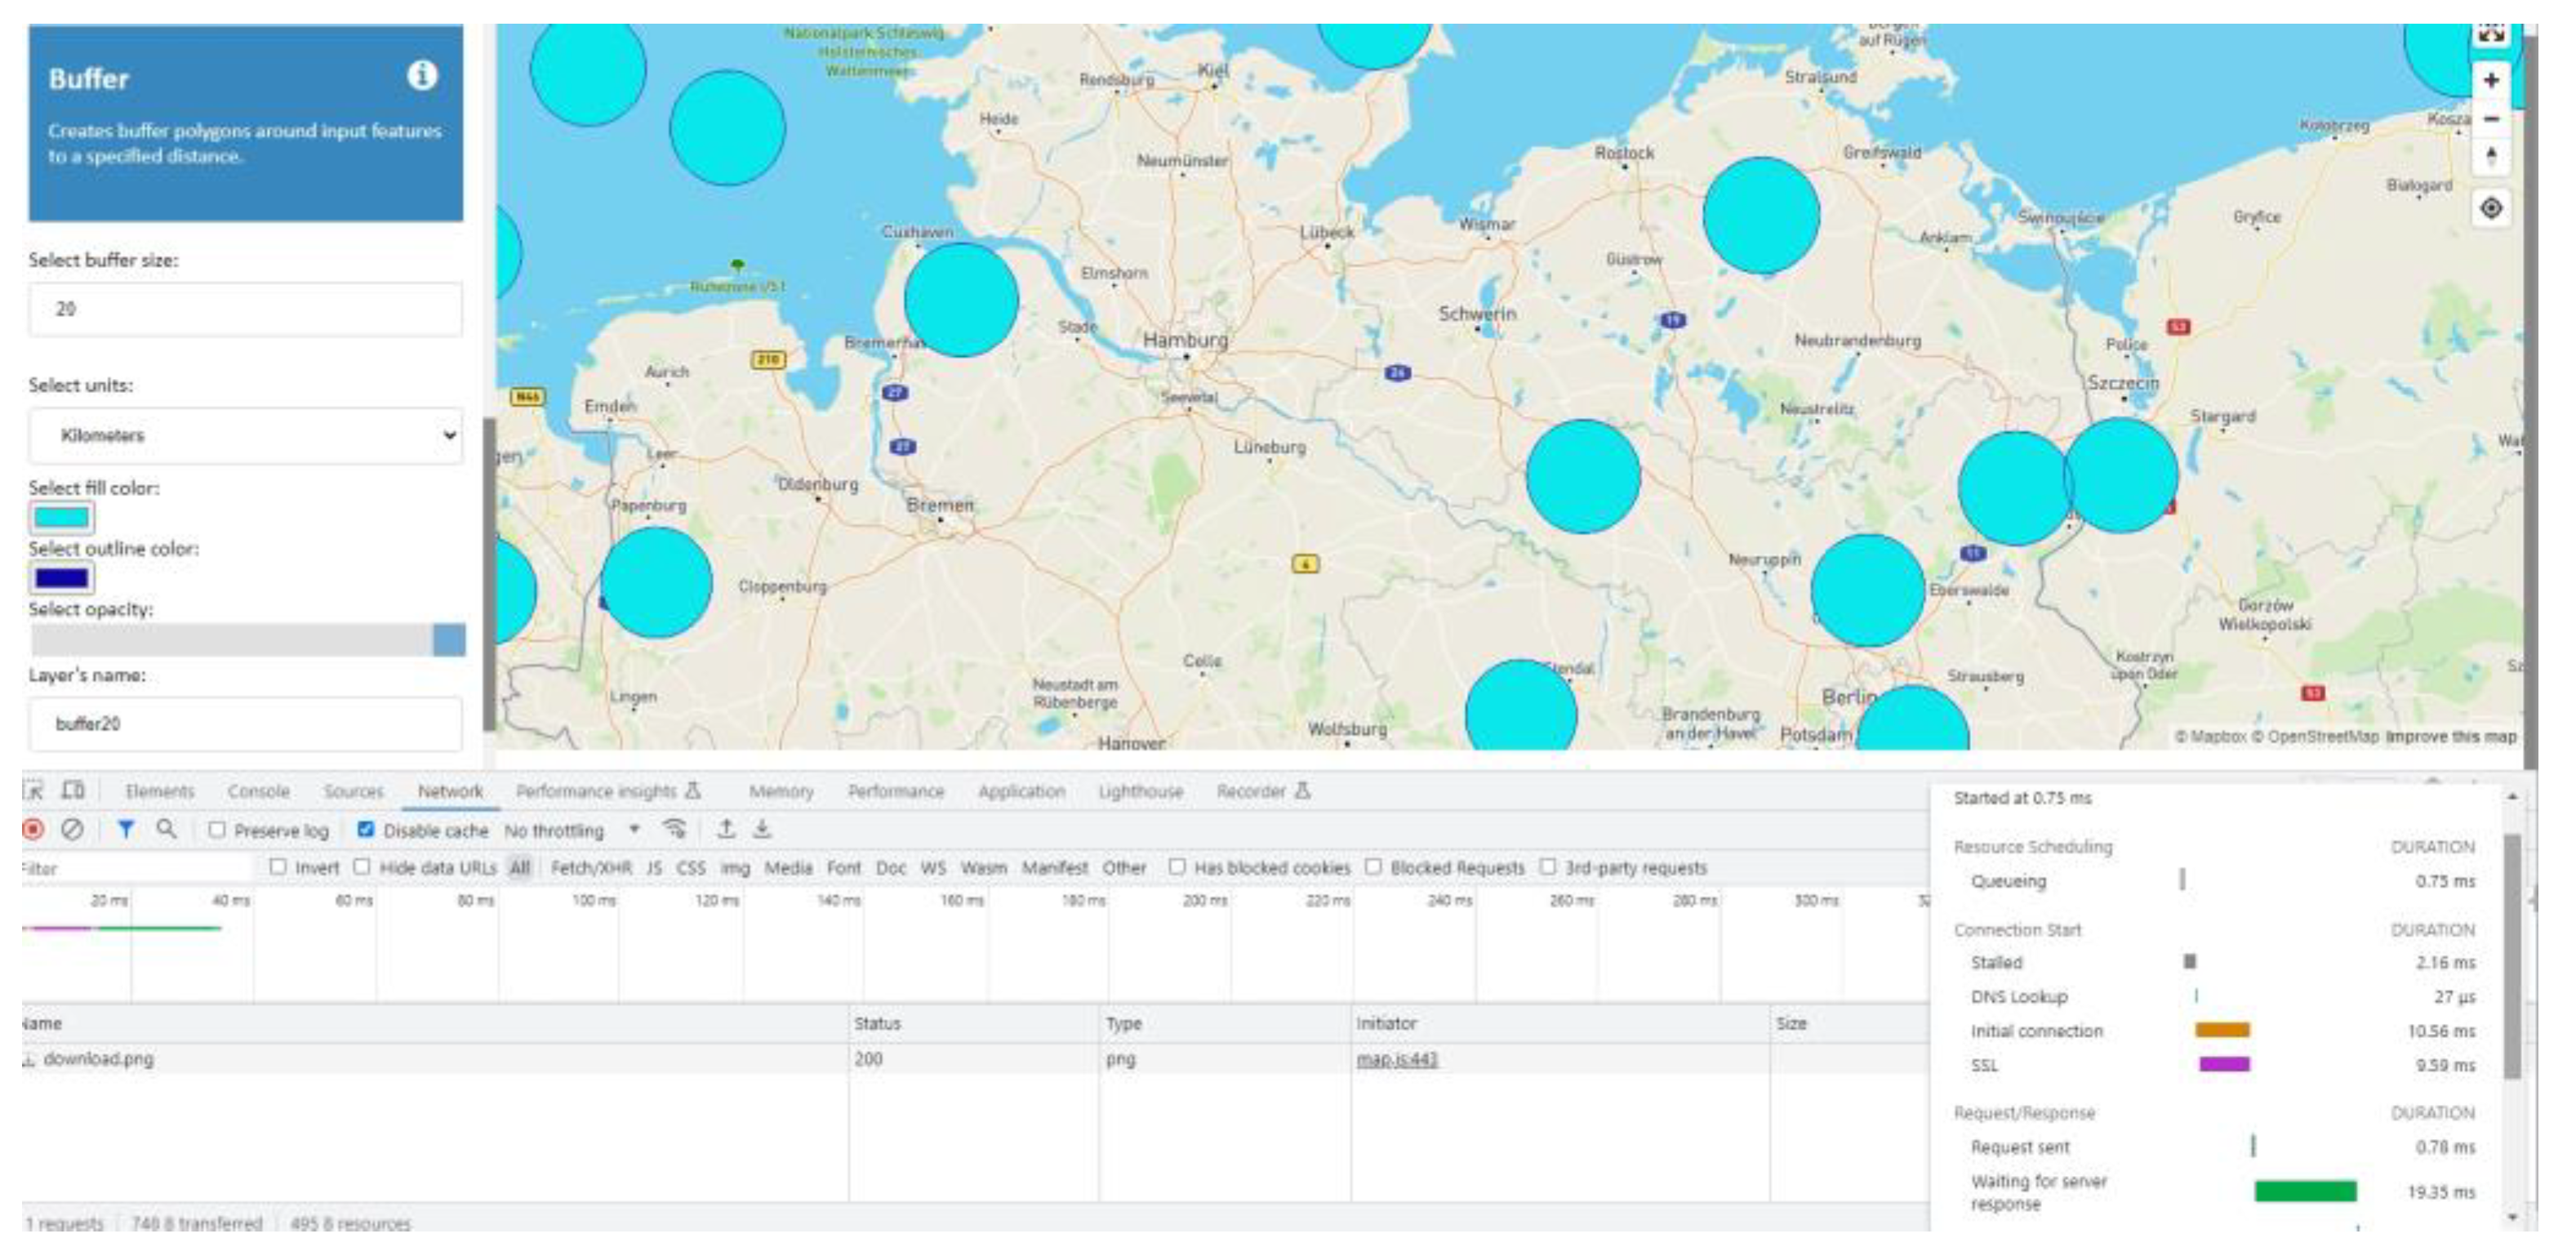
Two stages of performance tests were performed. First, the performance test of GeOnline, in two exemplary operations (create random points and buffer), was performed. The aim of this testing stage was to identify the performance limits and calibrate the performance of the GeOnline application. Then, a comparison test of five alternatives, including GeOnline, was performed to compare the performance results among alternative solutions. DevTools (Developer Console) is an integral tool in the current web browsers used to proceed, record and calculate the results of both stages (
Figure 5) [
52]. Google Chrome, the most used web browser [
53] with Chromium rendering engine, was used for this study to follow the same rendering as the majority of the market. Ten measurements in total were performed for each test; the minimum and maximum results were excluded; and the arithmetic mean was calculated as the final value. All performance tests were always carried out with the maximum map field zoom-out to ensure the results’ comparability. When the map field is zoomed in on a certain area, the generated layer is usually rendered earlier/faster because of the smaller data extent. All measurements were carried out under the same conditions on the same computer with the following specifications:
Processor: Intel(R) Core(TM) i5-3570 CPU @ 3.40 GHz,
RAM: 16.0 GB RAM,
Apacer AS350 512 GB (SSD),
Graphics Card: Intel HD Graphics,
Wired internet connection: 930 Mbps download,
Browser: Google Chrome, version 111.0.5563.147.
First, the performance test of GeOnline was performed (see
Figure 6). The aim was to identify performance limits. Two example operations were selected (create random points and buffer) and tested among several datasets with different parameters (number of generated points) (see
Table 4 and
Table 5). The complexity of buffer operations depends on the distance parameter; therefore, 100 m radius was set for all tests. The buffer operation passed within all datasets. Creating random points failed with 1,000,000 or more generated points. Moreover, source code optimization should reduce the waiting time for the full loading parameter to approx. 25 s (for 250k points) or approx. 58 s (for 500k points).
Previous performance tests gave us important feedback for the next development, but on the other hand, we wanted to compare the performance of GeOnline among alternative solutions. In order to compare the alternative solutions, the performance of selected operations implemented in them was tested. These operations were selected for inclusion in as few solutions as possible:
Buffer creation (used twice with different numbers of input points),
Polygon centroid calculation (not in GISCloud),
Cluster and outlier analysis (not in GeOnline and GISCloud),
Heat map creation (not in GeOnline and GISCloud).
The following indicators were monitored as part of performance testing:
Full time loading—the total time from the start of the operation to the loading of the output data,
Process time/execution—total time of calculation of the given operation (computational process),
Number of requests—number of requests to the server,
Transferred over network—volume of data transferred over the network,
Resources loaded by the page—volume of data loaded by the page without compression and caching.
In the buffer creation (see
Table 6 and
Table 7), polygon centroid (see
Table 8) and cluster analysis (see
Table 9) comparison test, the best (lowest) values were measured using GeOnline. The calculations of the output display operations were performed in fast times, with only one query sent and a small volume of data transferred and retrieved. On the contrary, the highest values in terms of loading and computation time were achieved when measuring these operations on the ArcGIS Online platform. The reason for these higher values is the optimization of the platform for high traffic and performance in combination with the multitude of tools, applications and data available.
The most queries to complete the operation were always required while using the CARTO application. This application was also measured to have the highest values of data volume loaded by the web page (application) during the measurement. However, in terms of time measurements, average results were obtained compared to the other applications.
Only in the case of the use of heat map (see
Table 10) tools were the results different. On the ArcGIS Online platform, the heat map was created fastest by sending only one request; the volume of data transferred and retrieved was also low. On the other hand, the heat map took the longest to load with FOURSQUARE. The measurement values of other operations for this application were comparable to GeOnline. The heat map creation tool was also included in the GISCloud application, but the values were not measured in this application due to the long computation time in the online environment.
The measurement values of the speed of calculation of simple operations are in the order of units of seconds. In the case of a larger volume of data in the input layer or a more computationally intensive operation, the processing time and subsequent rendering of the data are longer. Overall, the number of queries sent to the server and the volume of data transferred over the network and retrieved by the page varied depending on the operation and, more importantly, the application used.
5. Conclusions
Online geoprocessing tools in the WebGIS environment are becoming increasingly important in providing spatial analysis capabilities to users. While web cartography focuses more on visualization, WebGIS enables users to perform analytical operations. The development of GeOnline demonstrates the availability of specialized geospatial libraries such as Turf.js for non-trivial geospatial analysis in a web browser. By utilizing the specialized geospatial library Turf.js, GeOnline successfully implemented non-trivial vector operations, such as intersect, clip and calculate centroids. The paper emphasized the importance of data-driven analysis in addition to visual-driven analysis, making it a valuable contribution to the field of geospatial research.
Five geospatial tools, namely ArcGIS Online, GISCloud, CARTO, FOURSQUARE and GeOnline, were thoroughly compared and evaluated, considering various aspects, including the range of supported operations. While ArcGIS Online was identified as the most comprehensive solution currently available on the market, GeOnline performed commendably and demonstrated competitive performance compared to alternative solutions.
Overall, the study shows that there are a variety of cloud-based solutions available for WebGIS, each with its strengths and weaknesses. The performance tests conducted demonstrate that GeOnline performs well compared to alternative solutions. The study provides a useful guide for users and developers interested in selecting and evaluating online geoprocessing tools for WebGIS applications.
It is worth noting that the field of web-based geospatial analysis is constantly evolving, and new tools and technologies may emerge after the completion of this study. Thus, further research and updates to this comparative analysis will be necessary to remain current with the latest developments in the domain.
In terms of the future, we suggest several options for future research, such as implementing tools for (near) real-time data handling; integrating machine-learning algorithms; cross-platform compatibility; integration with IoT networks; or integrating measures of data security and user privacy.
During the study, several limitations were brought up. The research was limited to only four other solutions, which could have an effect on the results. The focus was specifically on vector data operation. For broader analysis scope, another comparison should be performed for other data formats.


