Abstract
Artificial intelligence (AI) has demonstrated its ability to complete complex tasks in various fields. In urban studies, AI technology has been utilized in some limited domains, such as control of traffic and air quality. This study uses AI to better understand diverse urban studies data through a novel approach that uses a convolutional neural network (CNN). In this study, a building outline in the form of a two-dimensional image is used with its corresponding metadata to test the applicability of CNN in reading urban data. MobileNet, a high-efficiency CNN model, is trained to predict the location of restaurants in each building in Seoul, Korea. Consequently, using only 2D image data, the model satisfactorily predicts the locations of restaurants (AUC = 0.732); the model with 2D images and their metadata has higher performance but has an overfitting problem. In addition, the model using only 2D image data accurately predicts the regional distribution of restaurants and shows some typical urban forms with restaurants. The proposed model has several technical limitations but shows the potential to provide a further understanding of urban settings.
1. Introduction
1.1. Research Background
The use of artificial intelligence (AI) is increasing in various fields as it has been proven to have high performance and wide applicability. In the urban planning and management field, AI is used in areas like traffic management [1] and air quality control [2]. Attempts are also being made to extend the application of AI in urban engineering to different areas, such as land-use planning and architectural design [3,4].
For AI to perform complex tasks in urban planning, the built environment must be understood using computers. In traditional urban research, the characteristics of a city or region are described in some indexes by aggregating data in a certain area. However, using aggregated data does not provide a large enough sample size to train a complicated AI model because an aggregated index only represents an area or district. In addition, aggregate data depend on the configuration of the aggregate area [5]. Therefore, for AI to be used in urban studies, new forms of data with improved spatial resolution should be used to analyze urban settings.
Currently, information about urban settings is mostly described two-dimensionally in a geographic information system (GIS). Therefore, detecting spatial patterns in two-dimensional (2D) data is key for analyzing the spatial pattern of individual urban agents. Convolutional neural networks (CNNs), the most widely used architectures for image recognition, use millions of parameters to summarize images into several numerical values. This process allows for the description of an innumerable diversity of urban areas; AI is also able to perform more complex tasks. Moreover, in areas lacking digitized spatial data (such as developing countries or new town sites), it is possible to predict urban characteristics using minimal investigations, such as satellite images [6,7].
In this study, the understanding of urban spaces using 2D images was tested by applying the images in the prediction of restaurant locations. Those predictions can be improved by using building outline data and CNN-based machine learning model because restaurant businesses depend on their surroundings [8,9,10]. Existing studies cannot accurately predict the locations of individual restaurants [11]. Subsequently, this study visualizes and analyzes the predicted distribution of restaurants according to the hierarchy of urban areas to gain insight into the relationship between urban form and restaurant location.
The following sections review the literature on restaurant location, urban morphology, and the application of AI in the urban planning field. The Research Methodology section includes the research question, data, model, and an explanation of the case study area. In the Results section, the model’s performance is shown, and the distribution of restaurant locations is analyzed. Finally, the meaning of the model and the results are explained in the Discussion section.
1.2. Related Studies
1.2.1. Location Theory of Commercial Facilities
Starting with von Thünen [12], early location theories have tried to explain the principles of division in district-scale urban areas, such as the central business district (CBD) or industrial districts. Regarding commercial facilities, Christaller’s [13] central place theory (CPT) argues that commercial activity in a city occurs in a locally concentrated center with different hierarchies. CPT is combined with other principles, such as spatial interaction theory [14], minimum differentiation [15], and gravity models [16,17,18,19], and these form the basic theories of regional demand and the formation of central places. However, these location models have limitations in that they only explain the locations of central places at the macroscopic level. Some studies have criticized these models for having strong normative assumptions that may be less practical [20,21].
Later empirical approaches regarding the commercial centers of cities revealed the qualitative effects of socioeconomic environments and transportation availability on restaurant locations. The socioeconomic attributes of nearby regions represent the demand-side characteristics of commercial areas; the size of commercial centers (number of stores) is dependent [22,23] on these characteristics. The transportation environment (including mass accessibility, parking availability, and pedestrian volume) is an important factor that affects the accessibility of retail stores to customers [24,25,26,27].
For individual businesses, a competitive environment is regarded as an important factor. Competitors make individual business owners vulnerable; however, the clustering effect (which varies by business category) often attracts more customers to nearby commercial areas [24,27,28].
In terms of decision-making procedures for retail stores, hierarchical processes with multiple criteria are suggested; analytic hierarchy process [29,30], analytic network process [31], rough set theory [9], and spatial queries using point of interest (POI) data [32] are studied in the literature.
In short, retail stores are normally located in commercial centers, and the distribution of retail stores is highly affected by the location of commercial centers. However, decision-making regarding where individual restaurants should be located still relies on a combination of rough, traditional principles.
1.2.2. Urban Form and Restaurant Location
In classical urban design theories, urban form characteristics are often associated with urban functions including commercial use. Refs. [33,34] analyzed a city by abstracting its basic form and provided a theoretical basis for the argument that human recognition and city function are influenced by urban forms. Jacobs [35], Gehl [36], and Lynch [37] argued that there is a pedestrian-friendly style of urban forms, and that urban forms in this style can enhance urban vitality by encouraging street activities. This theoretical trend provides an environmental and psychological framework for the impact of building- and block-scale urban forms on residents’ lives.
Later empirical studies provided various measurements of the urban form. These measurements provide a basis for summarizing the urban form at a collective level into simple, numerical values for use in statistical analyses. Researchers at the regional scale have applied variables to analyze urban forms on a macroscopic scale, including city size, building density, centrality [38], polycentricity [39,40], location quotient [41], and Gini coefficients. Other researchers with neighborhood-scale perspectives have analyzed urban forms with building- and block-scale variables, such as building footprint size, building coverage ratio [42,43], width–length ratio of buildings and blocks [44], compactness [45], entropy index [46], and spatial integration calculated by space syntax [47].
Using these indicators, researchers have attempted to find empirical evidence for the relationship between urban form and restaurant location. Jacobs [35] argues that fine-grained urban tissue has a positive impact on urban vitality, and several studies either support [8,48,49] or partially refute this [50]. Connectivity in urban street networks is also measured in the form of gravity connectivity [51], graph connectivity [10], and spatial integration calculated by space syntax [52] to claim that places with high connectivity are preferred for retail locations because connectivity reduces the cost of travel, and more pedestrian traffic is likely.
Some studies claim that urban form characteristics have been considered less important recently because, with the propagation of smartphones, social network services [25] and online map services [53] have become powerful sources of restaurant information. Since customers gather information about retail stores from the Internet, in recent years, restaurant locations that are less physically accessible have become more viable than they were before they were able to share information online [54].
In summary, diverse urban form characteristics (such as building density, building footprint size or compactness) are being developed, and it is shown that they affect retail store locations. However, there are fewer studies about assessing urban forms for individual restaurant locations because urban form indexes are often calculated within a given area.
1.2.3. Applying Convolutional Neural Networks to Urban Planning
Advancements in computer technology have continuously expanded the scope of research in urban studies. Early urban research was conducted from a macroscopic and static perspective because there were no data or tools to empirically prove the mathematical relationship between elements in the city. However, with the advent of computers, city modeling has become possible, and statistical analysis has become a common research method. In addition, it became possible to understand the city from a dynamic perspective, and the units of analysis were divided into sectors and smaller areas [55,56]. Since the 1970s, attempts have been made to understand cities through the behavior of individual agents, such as cellular automata and agent-based models [57]. In addition, simulations in certain fields, such as transportation and microclimate, have been continuously developed and used in practice [58,59,60].
Since the 2010s, countless amounts of data have been generated and stored through the big data revolution. In urban engineering, the location and attribute information of individuals, buildings, and other POIs in a city have been digitized, and AI training and verification have become easier using artificial neural networks, which precede the existence of the smart cities industry. AI has been adopted in numerous urban studies [3] and geography [61], supporting decision-making in urban planning and the design progress or interpreting large-scale data in simple forms [62,63].
Image processing is one of the most widely used methods in urban research. CNN, a widely used algorithm for reading an image, can summarize an image (represented by millions of numbers) into several numerical values. One CNN application uses those summarized values to analyze the scenery of an urban point [64,65]. Some studies use classification [66] or unsupervised clustering [67] for specific purposes in urban engineering. Other studies use satellite images to classify the urban land use and land cover [68,69], while still others use image recognition to read 2D urban form images to predict attributes of urban spaces [70,71].
For urban commercial facilities, supervised learning algorithms for classification or regression have been applied to commercial demand estimation [72,73] and commercial location recommendations [74,75]. Ouyang et al. [76] applied a CNN using images in the form of a 2D map to estimate the rental prices of retail buildings. Chen et al. [77] used urban form indicators to determine the relationship between urban morphology and vitality.
In summary, many studies have utilized AI in urban studies in order to improve the performance of regression or classification with aggregated data. CNN is used for evaluating street landscape or photogrammetry, but there are fewer reports that use CNN to read geospatial data.
1.2.4. Research Gap
In the existing literature, there are many studies that try to quantify urban forms and analyze them with numerical models. However, those studies measure urban forms as aggregate statistics. Using a CNN, the spatial pattern of elements in an n-dimensional space can be detected and analyzed in a quantitative manner. Moreover, multiple urban layers, such as the built environment, green spaces, demographic distribution, and transportation environment, can be read together. Also, there are studies to evaluate the growth and decline of commercial centers, but there is less consideration in deciding individual locations of restaurants in a qualitative manner.
The main contributions of this study are summarized as follows:
- The applicability of CNN is tested in this study to understand urban form in quantitative manner.
- Relations between urban form and restaurant location are analyzed via the perspective of a neural network.
- This study shows the applicability of CNN in any form of geospatial data that various urban data can be used in a 2D form in further studies.
2. Materials and Methods
2.1. Research Questions and Analysis Methods
The purpose of this study is to develop a tool that can read urban forms to evaluate the location of a restaurant. The developed tool is tested to determine whether it predicts and analyzes the location accurately, and the results are described. The main research question is as follows: Is a CNN-based tool for reading urban forms able to analyze restaurant locations? To answer this question, three more detailed research questions are defined: (Q1) Is the novel method able to predict where a restaurant is located? (Q2) Is there any advantage to using a CNN when evaluating restaurant locations compared to existing models? (Q3) Does the classification method provide further understanding of restaurant locations?
This study’s experiment involves reading the urban form using neural networks to obtain information about urban locations. However, more detailed criteria are required to answer these questions. Do the new tools function well? If so, would they perform better than existing tools? Is there any other use for this new tool? To address these problems, three sub-questions are defined.
Q1 evaluates the practicality of the new tool. If the tool can accurately determine whether a restaurant is located on a certain parcel, it has enormous practicality and can immediately be usable in the practical field. Even if the answer to Q1 is negative, it does not mean that the newly developed tool is not useful. If there is evidence that CNN-based image recognition can improve existing methods, it remains applicable to urban engineering. Q2 verifies the technical significance of introducing an image-recognition algorithm. If the image recognition model can improve the performance by comparing the image recognition model with the existing model, it is possible to judge the effect of the urban form on commercial locations. Q3 evaluates the interpretability of the model’s learning results. One well-known shortcoming of neural networks is their low explainability, which means it is difficult for users to determine the cause of a given result. However, there are ways to explain the results of the neural networks. AI combined with these methods is called explainable artificial intelligence (XAI). Researchers seek to use XAI to explain social phenomena.
2.2. Research Data
The independent variables are classified according to the existing literature. The four categories are: building outline images, urban form attributes [48,51], regional characteristics [9,23], and socioeconomic characteristics [9,30,31]. Each sample is taken from a building in a residential area. Apartment complexes are excluded from the analysis. The samples with missing values are excluded from the analysis. A total of 261,849 samples (289,378 excluded) are used in the analysis. Although there is a large amount of excluded data, the missing data would not significantly affect the result because the characteristics of missing data samples are not heterogeneous from the other data. The final sample size is also sufficiently large. Full descriptions of the input variables are provided in Table 1.

Table 1.
Descriptions of input variables.
The building outline image is described in the form of a 2D map, with pixels of voids described in black (0) and pixels where the building stands described in white (1). To improve learning efficiency, two 64 × 64 images of different scales are prepared. One covers 128 m × 128 m, and the other covers 512 m × 512 m. The image representation method is illustrated in Figure 1.
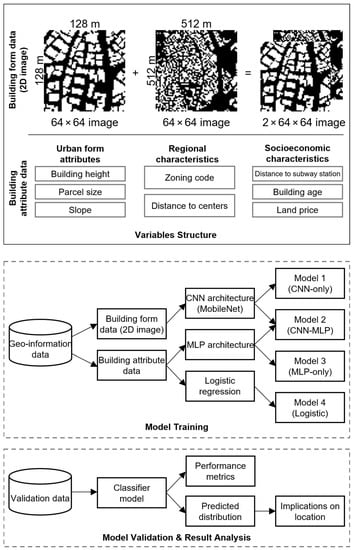
Figure 1.
Representation of research data and methodology.
Urban form attributes are included to implement the urban form data in the reinforced model. Three variables are used, including building height (in meter), parcel size (in m2), and slope. Slopes are classified into five categories (lowland, flatland, mild-sloped, steep-sloped, and highland) [78] by the Korean Ministry of Land, Infrastructure, and Transportation (MOLIT).
The regional characteristics include zoning codes and distances to business districts. In this study, only residential zones in Seoul City are considered, but the allowed usage and density differs among the detailed zoning codes. The distance to business districts is used to measure the center–periphery characteristics of the surrounding region of a building. Because Seoul City has three major central business districts, the distances to the three districts are all used.
The socioeconomic characteristics include transit accessibility, building age, and land prices. Transit accessibility is represented by the distance to nearby subway stations, which is very important in Seoul’s public transportation system. The building age is calculated based on the building’s date of administrative approval. The land price is represented by an officially assessed value to ensure data availability and resolution.
The dependent variable in this study is whether a building has a restaurant in its location. It is prepared using governmental approval data from the restaurant business. In Korea, there is a “general restaurant” category, which includes ordinary restaurants and bars, and a “resting restaurant” category, which includes convenience stores, cafés, or fast-food restaurants. In this study, restaurants in both categories are integrated without separation. Samples with restaurants are described with the label “1” (“Class 1”), and others with “0” (“Class 0”).
2.3. Classifier Models Design
In this study, four different classifier models are compared. Model 1 is a CNN-only model. If the building outline implies some meaning regarding the urban environment, training image data with a CNN creates a fine classifier model. In addition, the classification results of this model show the pure effect of the urban form on restaurant locations. However, building outline images contain very limited information, and additional attributes should be provided to perform a more accurate classification. Model 2 is the CNN-MLP (multi-layer perceptron) model. Classifying restaurant locations using only urban form images is difficult, even for AI. Variables other than the building outline image (hereinafter referred to as “metadata”) are used to train an MLP model and improve the performance of the classifier. The MLP and CNN models are combined to obtain the best output. Model 3 is the MLP-only model. It is built to test the advantages of the CNN in the CNN-MLP model. If CNN-MLP is better than the MLP model, the CNN component of the new tool can be used to improve the existing classifier model. Model 4 is a logistic regression model. Because the three previous models are all based on machine learning, a logistic regression model is built to test the effect of adopting a neural network for the location selection problem.
Models 1 and 2 are designed to test Q1, which concerns the performance of the CNN-based classifiers. Models 3 and 4 are designed to test Q2, which compares the CNN-based model with existing models. Q3 is tested by qualitatively analyzing the classification results of the CNN-based models and comparing them with the real-world distribution of restaurants. The descriptions and the purpose of the four classifier models are listed in Table 2.
Table 2.
Four classifier models used in the study.
In this study, urban data in the form of digital images are analyzed. The image data are analyzed using a CNN. A CNN is a widely used method for reading and analyzing image data (including photos and videos). Since a typical image includes millions of numerical values, a CNN reads images via numerical filters (named “kernels”) and gradually reduces the image size to efficiently process and extract the features of the data [79,80]. Using CNN model, highly complex characteristics of a city can be efficiently summarized via millions of parameters in a CNN model. MobileNet, which reduces operation amounts by applying “depthwise convolution” and “pointwise convolution”, is selected to efficiently train the model [81]. The structure of MobileNet is illustrated in Figure 2. Originally, MobileNet supported images with a minimum of 128 × 128 pixels (MobileNet-128); however, the model was modified to handle 64 × 64 images [82].
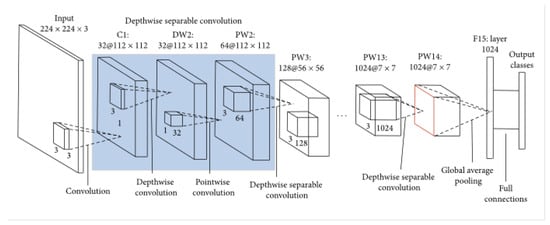
Figure 2.
Illustration of the structure of MobileNet [81].
The models’ detailed structures are listed in Table 3. In the CNN-only model, the classification layers are connected immediately after the MobileNet-64. Metadata variables are processed in MLP with layers of 200 cells and are directly connected to a classifier in the MLP model or concatenated with the flattened layer of MobileNet in the CNN-MLP model. In the classifier, a SoftMax function is applied to calculate the probability function.
Table 3.
Neural network structure of the study.
The classification data used in this study are highly imbalanced (only 6.4% of the samples are in the minority class), which means that the model could be biased to the majority class. To solve this problem, class weights are applied while learning the data. Class weights are calculated by the reciprocal of the class sample ratio, which is 14.65 for Class 1 when the weight of Class 0 is one. However, learning with class weights of 1:1 fails because the model repeatedly classifies all samples as Class 0.
The batch size is set to 256, which is the largest stable batch size with given GPU memory. Under the batch size of 256, optimal learning rate is set to 0.0002 to achieve the fastest convergence with stable learning. The number of epochs is set to 100 to achieve best accuracy with least validation loss. Detailed model configurations are described in Table 4.
Table 4.
Model Configurations.
2.4. Case Study Area: Residential Area in Seoul City
This study aimed to analyze the distribution of restaurants in residential areas. To achieve this goal, the study area should satisfy several criteria to avoid distorting the analytical results. First, the study area should have a sufficiently large sample size. Deep learning requires a large amount of training data to capture general trends and to avoid overfitting. Second, the entire study area should be urbanized and be similar in terms of urban planning conditions. Regions with different formation principles can obscure research findings, although the external validity of the analysis can be sacrificed to some extent.
Based on these criteria, Seoul, South Korea was selected as the case study area. This Asian megacity has a population of 9.5 million with over 100,000 restaurants distributed throughout the city. Demographic factors, such as age distribution and ethnicity, are mostly homogeneous by district, unurbanized areas are rare, and the characteristics of the built environment are relatively uniform. In addition, commercial facilities are distributed throughout the city.
However, only areas planned as residential areas by the Korean zoning codes were studied. In nonresidential areas (including commercial, industrial, and green areas), the location characteristics of restaurants are quite different; thus, limiting the study area was appropriate. In Korea, zoning codes in residential areas are divided into exclusive, general, and semi-residential zones; there are some exclusive residential areas, however, where certain types of commercial facilities can be flexibly located.
The temporal range of the study is a cross-section analysis of 16 September 2022. The latest data available at that time point were used in the analysis. The details of the case study area are shown in Table 5.
Table 5.
Basic information of the case study area.
Seoul is a polycentric city that is considered to have three business centers: old fortress (CBD), Gangnam (GBD), and Yeouido (YBD). While these three business centers include most workplaces, several subcenters are distributed throughout the city, such as the Mapo or Gasan Digital Complex (Figure 3) [83]. In terms of commercial centers, Seoul’s largest commercial centers are the Myeongdong, Gangnam, and Sinchon–Hongdae areas.
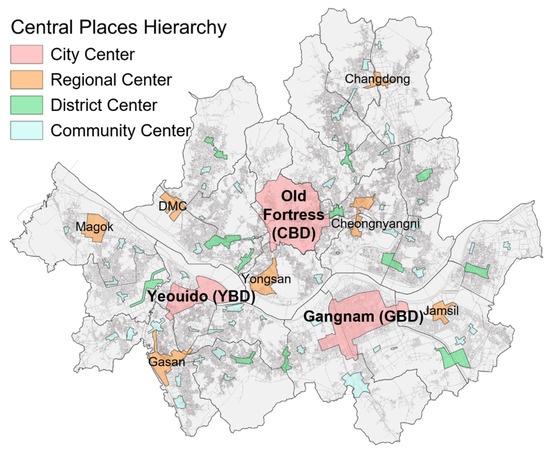
Figure 3.
Central places in Seoul.
However, in recent decades, Seoul has experienced commercial gentrification in its residential areas [84,85]. Newly formed restaurant streets are emerging, such as Seongsu-dong, Mangwon-dong, and Mullae-dong, and commercial centers are distributed throughout the city (Figure 3). These new commercial areas are becoming distinct substitutes for older commercial centers. This phenomenon has made native residents and old business owners vulnerable to replacement by classy restaurants and coffee shops [86]. Consequently, local policymakers seek solutions to support the sustainability of local shops. In addition, the outbreak of COVID-19 has made the business environment more dynamic, making Seoul a useful case study of the dynamic environment of the restaurant business in an Asian city.
3. Results
3.1. Performance Evaluation
The performance metrics of the classification models used in this study are listed in Table 6. The values considered were accuracy [68], precision, recall, F-1 score, area under the ROC curve (AUC) [87,88], training time, and prediction speed. Because the sample classes were imbalanced, the overall accuracy was significantly affected by the predicted ratio of Class 1 (classified as one or more restaurants located in the sample building). For example, a classifier that predicts all samples as Class 0 can reach an accuracy of 93.6% (because 93.6% of the buildings do not have restaurants), but the models are designed not to act in this way. The precision and recall values have a tradeoff relationship, and both metrics are affected by the classification threshold in the opposite manner. The F-1 score was calculated by first using the intact classification result (threshold = 0.5), and then by using the maximum F-1 value with varying threshold values. AUC is known to be a robust metric and is not affected by the threshold [89,90].
Table 6.
Performance metrics of classification models.
3.1.1. Performance Evaluation of CNN-Applied Models
The overall accuracy of Model 1 was 0.85, which is extremely high. However, the precision, recall, and F-1 scores were 0.169, 0.333, and 0.224, respectively, which means that it is far more difficult to accurately guess a building with a restaurant (Class 1) than one without. Although the predicted ratio of Class 1 was double the actual ratio, the precision and recall were very low. In terms of AUC, the model’s score was 0.732.
According to the metrics, Model 1 was less appropriate for accurately determining individual restaurant locations. Approximately 1/6 of the samples classified as Class 1 were correct. However, considering the highly imbalanced class and limited data of the building outline image, the classification result was good. The AUC score shows that the model predicts the labels to some degree, and that urban morphology reflects the characteristics of the city.
In Model 2, the accuracy, precision, recall, and F-1 were 0.845, 0.230, 0.606, and 0.334, respectively. The predicted ratio of Class 1 was higher than that of Model 1; however, their accuracies were similar. The precision, recall, and F-1 scores improved, although the absolute values were still not high. With the threshold of the maximum F-1 score, approximately one third (0.337) of the predicted restaurant locations were correct. The AUC score was 0.839. Using a CNN integrated with metadata, the machine learning model performed well when classifying the location.
3.1.2. Performance Comparison with Models without CNN
To achieve objective evaluation of the results, the models without a CNN should be compared. The accuracy, precision, recall, and F-1 values of Model 3 were 0.818, 0.202, 0.757, and 0.319, respectively. Some metrics of Model 2 were better than those of Model 3 while others were not. Because the predicted ratios of Class 1 were different, it was not appropriate to compare them directly. However, the maximum F-1 score (0.342) and AUC score (0.844) of Model 3 were not lower than those of the CNN-integrated model.
Compared to Model 4, Models 2 and 3 had clear advantages. Model 4 had an accuracy of 0.747, precision of 0.167, recall of 0.732, and F-1 score of 0.272. The maximum F-1 score was 0.300, and the AUC score was 0.802. In terms of the maximum F-1 and AUC scores, Model 2 exhibited a clear improvement. Because the performances of Models 2 and 3 were similar, this result shows the superiority of the neural network model compared to the statistical regression model.
Comparing Models 2 and 3, even though more data and a longer duration were used for training data, the classification performance did not improve with the adoption of the CNN. One possible reason for this result is overfitting. Because the training data contain numerous numerical values, it can memorize all the training data with the parameter [91]. In an imbalanced class problem, there is a greater need to address overfitting [92]. In this study, several techniques to reduce overfitting were applied; however, owing to the characteristics of the image representation method used in the study, applicable techniques were limited [93,94].
Another possible reason that the model may not have improved is that it may have reached maximum accuracy with the given data because the restaurant location is not absolutely decided by structural factors, but is instead decided by coincidence. Bid rent theory implies that various types of retail stores compete to occupy a location [11,95].
3.2. Analysis of Predicted Restaurant Distribution
3.2.1. Comparison to Real-World Distribution
The classification results are illustrated on a map (Figure 4) to compare the predicted distribution of restaurants with the real-world distribution. Detailed classification results of three typical commercial centers are illustrated in Figure 5. To conduct a fair comparison, the classification thresholds were adjusted to fix the ratio of the predicted samples to restaurants at 6.44%.
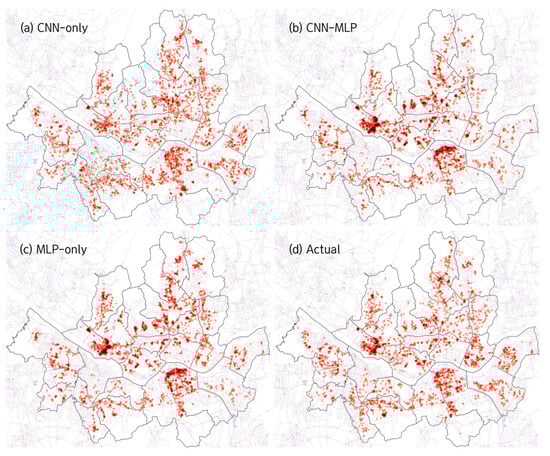
Figure 4.
Predicted and actual distribution of restaurants. (a) Predicted distribution of restaurants by Model 1 (CNN-only model). (b) Predicted distribution of restaurants by Model 2 (CNN-MLP model). (c) Predicted distribution of restaurants by Model 3 (MLP-only model). (d) Actual distribution of restaurants in Seoul.
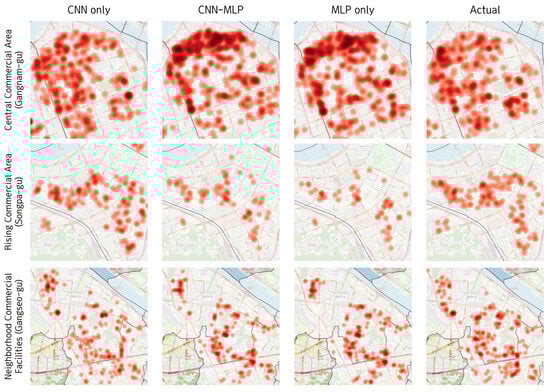
Figure 5.
Distribution of restaurants by type of commercial areas.
Model 1 predicts the broadest area as a potential restaurant location. In terms of regional distribution, Model 1 depicts the distribution of restaurants in a manner similar to the actual distribution. In terms of density, the model predicted a relatively even distribution of density by hierarchy, regardless of the context of the urban region.
Based on the hierarchy of commercial centers, Model 1 classified fewer buildings as restaurants in the central commercial areas (i.e., Cheongdam-dong) while predicting restaurants on the backside roads (the road behind the arterial roads). In the rising commercial areas, the model predicted the new commercial area in the regional center (i.e., Seokchon Lake), but did not perform well with the buildings far away from arterial roads, whose usage was changed from housing to restaurant (widely referred to as “commercially gentrified”). As the original usage of the areas was residential and the change in urban tissue was slower than the alteration of usage, the buildings in those areas tended to be classified as residential areas [96,97]. Meanwhile, the model identified neighborhood commercial centers in the periphery (i.e., Gangseo-gu), whereas Models 2 and 3 did not predict them well. However, the model did not capture the local context without data; for example, areas where a subway station is located were regarded as equal to other areas.
Model 2 predicted the distribution of restaurants that were highly focused on city centers. In terms of regional distribution, Model 2 predicted restaurant distribution only in limited regions. In terms of density, the model predicted the density of restaurants as denser in the dense areas. In the main commercial centers, the model classified more buildings as restaurants. In rising commercial areas, the model classified restaurants in newly rising commercial areas better than Model 3. In neighborhood centers, Model 2 predicted a very small number of restaurants.
Model 3 predicted the distribution of restaurants, similar to the CNN-MLP model. This model classified buildings in a limited area as restaurants and depicted areas with a high density of restaurants as dense. However, Model 3 could not accurately predict the restaurants in newly rising commercial centers and restaurants in the neighborhood centers.
In short, the results show that the model offers better accuracy of local distribution of restaurants with only limited data on building forms. Although the CNN-only model showed a lower classification performance, the visualized distribution of restaurants in the city was very similar to the actual distribution. Because commercial centers have many restaurants and a low risk of error, MLP-based models, which include data about the urban context, classify restaurants mostly in the central commercial areas. However, urban contexts that cannot be obtained via the urban form, such as the hierarchy of commercial areas or subway stations, should be complemented to achieve higher performance.
Meanwhile, the result of Model 2 is more similar to that of Model 3 than that of Model 1, which means that the decision power of the classification model leans more toward the MLP layers. This is because of the higher classification accuracy of the MLP model compared with that of the CNN model. To improve the classification performance, methods that take advantage of both models, such as boosting, should be designed.
3.2.2. Insight into Urban Morphology
In this study, the CNN-only model used building outlines as input data. Therefore, the classification results of the model imply a pure effect of urban form on the locations of commercial facilities. In this section, the predicted distribution of restaurants is interpreted using three types of urban areas: hierarchical blocks in the urban periphery, grid blocks in urban centers, and the periphery of large complexes.
In the hierarchical blocks in the urban periphery, streets with high connectivity that served nearby residents traveling to main roads or transit nodes were classified as having more restaurant locations. For example, Figure 6a shows the predicted restaurant locations for Yeokchon-dong and Eunpyeong-gu. The arterial road (blue lines) runs on the east and south sides of the block, and the roads connected to the arterial roads (red lines) connect individual houses to them. These roads have the most buildings with restaurants, and, according to the classification results, this type of road generally has a width of 6–15 m. This finding supports the results of previous studies that neighborhoods with hierarchical shapes have a high centrality of route choice and that neighborhood retail stores are mainly located on main service roads [51,98].
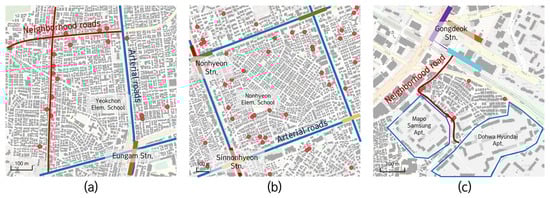
Figure 6.
Examples of predicted restaurant locations by CNN-only model. Red lines indicate neighborhood roads while blue lines indicate arterial roads. (a) Yeokchon-dong (Eunpyeong-gu). (b) Nonhyeon-dong (Gangnam-gu). (c) Dohwa-dong (Mapo-gu).
In the square-shaped superblocks in the downtown area, many buildings with restaurants are located in front of the service roads inside the blocks. Looking at Figure 6b, restaurants are located in the periphery of the block, but still inside the block. The west and south side strips of the block were designated as commercial areas and were excluded from the analysis, but only a few restaurants are located in that area. Buildings in front of arterial roads in downtown areas are more likely to be used for specialty stores and flagship stores for luxury brands. These buildings are not only used for instant consumption, but also as billboards for marketing a brand [99]. In contrast, restaurants in downtown areas tend to agglomerate to attract more customers, and buildings on internal roads with lower rents are more likely to be located there [100].
Another context that a CNN can read is the existence of a large facility or apartment complex. Many consumers come from large facilities or apartment complexes, and most of these facilities do not have sufficient services inside their territory. Restaurants are easily located in front of these facilities or along the access road to the main transit node of the area. Figure 6c shows a large area with multiple apartment complexes. In the map, the predicted restaurant locations are in front of apartment complexes and in the middle of the road to a nearby subway station.
However, there are several limitations in using building outlines as input data. As the input data only describe buildings and voids, some contexts not related to the urban form cannot be recognized by the model. A subway station is a good example of this. Because subway stations are generally located underground, the building outline data cannot reflect the existence of subway stations. Parks are difficult to distinguish from squares, and streams can be misunderstood as wide roads (for example, Figure 6a has both a subway station and a stream).
The extent of the input data of the CNN model was a 512 × 512 m square image. Regional contexts beyond this extent could not be considered in the model. Specifically, the urban forms of central commercial centers and sub-centers have fewer distinguishing features without a regional context. In recent decades, the geography of Seoul’s commercial streets has changed rapidly [85]. Because urban form is known to change more slowly than its usage, there is a mismatch between the location and its urban form.
4. Discussion
The field of urban studies has been examining the relationship between urban form and commercial facilities for many years. In particular, researchers have attempted to test the hypothesis that urban form affects commercial functions by converting urban forms into numerical parameters, such as block size [8,48,49,50] or street connectivity [51,101]. In addition, sophisticated algorithms that mathematically model the urban structure or operating principles of a city, such as space syntax and cellular automata, have been studied for over 20 years.
Conversely, the research methods mentioned above are mainly methods of numerating some part of the various attributes of a city. These numerated values are used as part of a statistical model along with other variables [23,42,45], but they only provide limited results because of their inflexible assumptions. To solve this problem, we developed a method to evaluate the location of commercial facilities by interpreting the shape of a city as image data using artificial neural networks.
The CNN-based model developed in this study has several implications. First, the new tool can read 2D images to understand urban settings. In the analysis, only the building outline image was used to train Model 1, and a fine level of classification accuracy was achieved. An AUC of 0.732 and 0.839 is comparable regarding the class imbalance when compared to those in land use classification tasks [87,88]. This means that the CNN can automatically extract the key features of urban form that are suitable for a restaurant.
Second, the new tool showed that urban form is significantly related to restaurant locations. Although the building form is not directly related to restaurant business, the form does indicate specific characteristics of the location. Third, the classification result can provide implications about urban form. The results of the study were visualized, thereby identifying the features that were common for restaurant locations. Because the input data do not include additional information beyond building form, the pure relationship between building form and restaurant location was found.
The research findings can be used in the following ways. First, using CNN, more complex urban data can be read by a computer. In the case of Model 1, no analytical framework or additional information was provided to the model, but the model interpreted the image for a specific purpose. If urban data other than urban form are provided in a 2D map image, further interpretation can be completed by artificial intelligence. Second, the novel method can be used by researchers to find relationships between attributes of urban spaces. In this study, the relation between building form and restaurant location can be interpreted by reverse-analyzing the prediction result. This process can be further used to develop XAI in the urban studies field [102].
Meanwhile, this study has some limitations as it presents a new method of analyzing cities. First, an overfitting problem seems to occur while training Models 2 and 3. Several techniques including image data augmentation (rotation, inversion, and Gaussian noise) and MLP dropout were used to reduce overfitting, but the improvements were small. Second, more than half of the original data were deleted and became missing data samples. These were mostly removed because they did not include building height as the buildings were relatively old and had fewer stories. Removing these buildings creates a risk of deleted missing data distorting the sample group. Still, the sample size is sufficiently large, and the effect to the model’s ability to accurately predict restaurant location may be small.
Third, the train set and test set of data might not completely be independent of each other. Since the train–test split was randomly performed for all samples, maps of adjacent regions may have been regularly included in the train and test sets. This problem extended the range of the input image and secured the number of training data. However, further investigation is needed to determine whether there is dependency between adjacent samples. Finally, the renewal period may have created some noise in the data, or there may have been an ambiguous declaration of the business category. To address this issue, the data should be cross-validated with other data sources, such as POI data from online map services.
In future research, model performance can be improved by improving data quality (addressing the missing data problem), using additional data (e.g., business sales data) or providing more regional context. Also, the overfitting problem could be solved by adding ensemble techniques [103,104], using cross-validation [105], or fine-tuning the parameters of the CNN model.
The research findings could be applied in several ways. First, the results of the classification model can be used for additional interpretations. Existing urban form indexes can be used to compare those interpretations with the urban form pattern found by CNN. Second, cities from different regions can be analyzed together rather than only using Seoul as a study area. Through this, the external validity of the CNN model can be tested, and cultural characteristics of each city can be analyzed.
5. Conclusions
This study proposed an approach for using 2D images to read urban forms using a neural network. The findings of the study are as follows: (1) urban form can be read by CNN in the form of 2D images and thereby predict features of urban data; (2) using CNN, restaurant location can be predicted to some extent with a limited data of the building outline; and (3) the prediction result can be interpreted to find implications in urban morphology.
This study shows the potential applications of CNN in urban informatics. The complexity of urban area and spatial relationships between elements in urban settings have been studied in urban modelling for many years. There are hundreds of indicators to summarize the characteristics of urban settings. However, using CNN, urban settings can be understood in the intact physical form of a map. The research findings can lead to further development of methods to better understand urban spaces and to be applied in complex tasks of urban engineering.
Author Contributions
Conceptualization, Jeyun Yang and Youngsang Kwon; methodology, Jeyun Yang; software, Jeyun Yang; validation, Jeyun Yang; formal analysis, Jeyun Yang; resources, Jeyun Yang; data curation, Jeyun Yang; writing—original draft preparation, Jeyun Yang; writing—review—editing, Jeyun Yang and Youngsang Kwon; visualization, Jeyun Yang; supervision, Youngsang Kwon; funding acquisition, Jeyun Yang and Youngsang Kwon. All authors have read and agreed to the published version of the manuscript.
Funding
This research was supported by the Ministry of Land, Infrastructure and Transport (Grant RS-2022-00143404) and the Ministry of Education and the National Research Foundation of the Republic of Korea (NRF-2021S1A5C2A03087287). The research was also supported by the Integrated Research Institute of Construction and Environmental Engineering and Institute of Engineering Research at Seoul National University.
Data Availability Statement
The code developed in this study can be downloaded at GitHub (https://github.com/gtbcard0/SeoulRestaurant (accessed on 8 June 2023)). The data used in this study are publicly available via Korea National Spatial Data Infrastructure Portal (NSDI) (http://www.nsdi.go.kr/ (accessed on 8 June 2023)) and LocalData portal by Korean Ministry of the Interior and Safety (MOIS) (https://www.localdata.go.kr/) (accessed on 8 June 2023). The prepared data cannot be publicly shared because of the copyright policy of Korean government.
Conflicts of Interest
The authors declare no conflict of interest.
References
- Jeon, H.; Lee, J.; Sohn, K. Artificial Intelligence for Traffic Signal Control Based Solely on Video Images. J. Intell. Transp. Syst. Technol. Plan. Oper. 2018, 22, 433–445. [Google Scholar] [CrossRef]
- Schürholz, D.; Kubler, S.; Zaslavsky, A. Artificial Intelligence-Enabled Context-Aware Air Quality Prediction for Smart Cities. J. Clean. Prod. 2020, 271, 121941. [Google Scholar] [CrossRef]
- Quan, S.J.; Park, J.; Economou, A.; Lee, S. Artificial Intelligence-Aided Design: Smart Design for Sustainable City Development. Environ. Plan B Urban Anal. City Sci. 2019, 46, 1581–1599. [Google Scholar] [CrossRef]
- Castro Pena, M.L.; Carballal, A.; Rodríguez-Fernández, N.; Santos, I.; Romero, J. Artificial Intelligence Applied to Conceptual Design. A Review of Its Use in Architecture. Autom. Constr. 2021, 124, 103550. [Google Scholar] [CrossRef]
- Jacobs-Crisioni, C.; Rietveld, P.; Koomen, E. The Impact of Spatial Aggregation on Urban Development Analyses. Appl. Geogr. 2014, 47, 46–56. [Google Scholar] [CrossRef]
- Chew, R.F.; Amer, S.; Jones, K.; Unangst, J.; Cajka, J.; Allpress, J.; Bruhn, M. Residential Scene Classification for Gridded Population Sampling in Developing Countries Using Deep Convolutional Neural Networks on Satellite Imagery. Int. J. Health Geogr. 2018, 17, 12. [Google Scholar] [CrossRef] [PubMed]
- Nachmany, Y.; Alemohammad, H. Detecting Roads from Satellite Imagery in the Developing World. In Proceedings of the IEEE/CVF Conference on Computer Vision and Pattern Recognition Workshops, Long Beach, CA, USA, 16–17 June 2019. [Google Scholar]
- Gan, X.; Huang, L.; Wang, H.; Mou, Y.; Wang, D.; Hu, A. Optimal Block Size for Improving Urban Vitality: An Exploratory Analysis with Multiple Vitality Indicators. J. Urban Plan. Dev. 2021, 147, 04021027. [Google Scholar] [CrossRef]
- Chen, L.F.; Tsai, C.T. Data Mining Framework Based on Rough Set Theory to Improve Location Selection Decisions: A Case Study of a Restaurant Chain. Tour. Manag. 2016, 53, 197–206. [Google Scholar] [CrossRef]
- Kim, S. Urban Vitality, Urban Form, and Land Use: Their Relations within a Geographical Boundary for Walkers. Sustainability 2020, 12, 10633. [Google Scholar] [CrossRef]
- Brown, S. Retail Location at the Micro-Scale: Inventory and Prospect. Serv. Ind. J. 1994, 14, 542–576. [Google Scholar] [CrossRef]
- Pearson, T.D. Location! Location! Location! What Is Location? Apprais. J. 1991, 59, 7–20. [Google Scholar]
- Christaller, W. Central Places in Southern Germany; Baskin, C.W., Translator; Original Work Published in 1933; Prentice Hall: Hoboken, NJ, USA, 1966. [Google Scholar]
- Reilly, W.J. The Law of Retail Gravitation; Knickerbocker Press: New York, NY, USA, 1933. [Google Scholar]
- Hotelling, H. Stability in Competition. Econ. J. 1929, 39, 41–57. [Google Scholar] [CrossRef]
- Huff, D.L. A Probabilistic Analysis of Shopping Center Trade Areas. Land Econ. 1963, 39, 81–90. [Google Scholar] [CrossRef]
- Colwell, P.F. Central Place Theory and the Simple Economic Foundations of the Gravity Model. J. Reg. Sci. 1982, 22, 541–546. [Google Scholar] [CrossRef]
- Brown, S. Retail Location Theory: Evolution and Evaluation. Int. Rev. Retail. Distrib. Consum. Res. 1993, 3, 185–229. [Google Scholar] [CrossRef]
- Litz, R.A.; Rajaguru, G. Does Small Store Location Matter? A Test of Three Classic Theories of Retail Location. J. Small Bus. Entrep. 2008, 21, 477–492. [Google Scholar] [CrossRef]
- Fingleton, B. A Factorial Approach to the Nearest Centre Hypothesis. Trans. Inst. Br. Geogr. 1975, 65, 131–139. [Google Scholar] [CrossRef]
- O’Kelly, M.E. A Model of the Demand for Retail Facilities, Incorporating Multistop, Multipurpose Trips. Geogr. Anal. 1981, 13, 134–148. [Google Scholar] [CrossRef]
- Lee, M.-L.; Pace, R.K. Spatial Distribution of Retail Sales. J. Real Estate Financ. Econ. 2005, 31, 53–69. [Google Scholar] [CrossRef]
- Yang, Y.; Roehl, W.S.; Huang, J.H. Understanding and Projecting the Restaurantscape: The Influence of Neighborhood Sociodemographic Characteristics on Restaurant Location. Int. J. Hosp. Manag. 2017, 67, 33–45. [Google Scholar] [CrossRef]
- Davies, R.L. Evaluation of Retail Store Attributes and Sales Performance. Eur. J. Mark. 1973, 7, 89–102. [Google Scholar] [CrossRef]
- Kim, J.; Lee, M.; Kwon, W.; Park, H.; Back, K.J. Why Am I Satisfied? See My Reviews—Price and Location Matter in the Restaurant Industry. Int. J. Hosp. Manag. 2022, 101, 103111. [Google Scholar] [CrossRef]
- Li, K.; Li, Y.N.; Yin, H.; Hu, Y.; Ye, P.; Wang, C. Visual Analysis of Retailing Store Location Selection. J. Vis. 2020, 23, 1071–1086. [Google Scholar] [CrossRef]
- Yoshimura, Y.; Santi, P.; Arias, J.M.; Zheng, S.; Ratti, C. Spatial Clustering: Influence of Urban Street Networks on Retail Sales Volumes. Environ. Plan B Urban Anal. City Sci. 2021, 48, 1926–1942. [Google Scholar] [CrossRef]
- Wang, W.; Wang, L.; Wang, X.; Wang, Y. Geographical Determinants of Regional Retail Sales: Evidence from 12,500 Retail Shops in Qiannan County, China. ISPRS Int. J. Geo-Inf. 2022, 11, 302. [Google Scholar] [CrossRef]
- Tzeng, G.-H.; Teng, M.-H.; Chen, J.-J.; Opricovic, S. Multicriteria Selection for a Restaurant Location in Taipei. Hosp. Manag. 2002, 21, 171–187. [Google Scholar] [CrossRef]
- Yıldız, N.; Tüysüz, F. A Hybrid Multi-Criteria Decision Making Approach for Strategic Retail Location Investment: Application to Turkish Food Retailing. Socio-Econ. Plan. Sci. 2019, 68, 100619. [Google Scholar] [CrossRef]
- Cagri Tolga, A.; Tuysuz, F.; Kahraman, C. A Fuzzy Multi-Criteria Decision Analysis Approach for Retail Location Selection. Int. J. Inf. Technol. Decis. Mak. 2013, 12, 729–755. [Google Scholar] [CrossRef]
- Lin, Y.H.; Chen, Y.C.; Chiu, S.M.; Lee, C.; Wang, F.C. Applying Check-In Data and User Profiles to Identify Optimal Store Locations in a Road Network. ISPRS Int. J. Geo-Inf. 2022, 11, 314. [Google Scholar] [CrossRef]
- Lynch, K. The Image of the City; The MIT Press: Cambridge, MA, USA, 1960; ISBN 978-0-26-262001-7. [Google Scholar]
- Alexander, C.; Ishikawa, S.; Silverstein, M.; Jacobson, M.; Fiksdahl-King, I.; Angel, S. A Pattern Language; Oxford University Press: Oxford, UK, 1977. [Google Scholar]
- Jacobs, J. The Death and Life of Great American Cities; Random House: New York, NY, USA, 1961; ISBN 978-0-67-974195-4. [Google Scholar]
- Gehl, J. Life between Buildings; Island Press: Washington, DC, USA, 1971; ISBN 978-1-59-726827-1. [Google Scholar]
- Lynch, K. A Theory of Good City Form; The MIT Press: Cambridge, MA, USA, 1981; ISBN 978-0-26-212085-2. [Google Scholar]
- Pereira, R.H.M.; Nadalin, V.; Monasterio, L.; Albuquerque, P.H.M. Urban Centrality: A Simple Index. Geogr. Anal. 2013, 45, 77–89. [Google Scholar] [CrossRef]
- Anas, A.; Arnott, R.; Small, K.A. Urban Spatial Structure. J. Econ. Lit. 1998, 36, 1426–1464. [Google Scholar]
- Garcia-López, M.À.; Moreno-Monroy, A.I. Income Segregation in Monocentric and Polycentric Cities: Does Urban Form Really Matter? Reg. Sci. Urban Econ. 2018, 71, 62–79. [Google Scholar] [CrossRef]
- Xu, N.; Cheng, Y.; Xu, X. Using Location Quotients to Determine Public-Natural Space Spatial Patterns: A Zurich Model. Sustainability 2018, 10, 3462. [Google Scholar] [CrossRef]
- Yoshida, H.; Omae, M. An Approach for Analysis of Urban Morphology: Methods to Derive Morphological Properties of City Blocks by Using an Urban Landscape Model and Their Interpretations. Comput. Environ. Urban Syst. 2005, 29, 223–247. [Google Scholar] [CrossRef]
- Hong, J.Y.; Jeon, J.Y. Relationship between Spatiotemporal Variability of Soundscape and Urban Morphology in a Multifunctional Urban Area: A Case Study in Seoul, Korea. Build Environ. 2017, 126, 382–395. [Google Scholar] [CrossRef]
- Yao, G.; Yuan, T.; Rui, Y.; Chen, W.; Duan, Z.; Sun, L.; Si, X.; Zhang, M.; Chen, K.; Zhu, Y.; et al. Research on the Scale of Pedestrian Space in Underground Shopping Streets Based on VR Experiment. J. Asian Archit. Build. Eng. 2021, 20, 138–153. [Google Scholar] [CrossRef]
- Xia, C.; Zhang, A.; Yeh, A.G.O. The Varying Relationships between Multidimensional Urban Form and Urban Vitality in Chinese Megacities: Insights from a Comparative Analysis. Ann. Am. Assoc. Geogr. 2022, 112, 141–166. [Google Scholar] [CrossRef]
- Sharmeen, N.; Houston, D. Urban Form, Socio-Demographics, Attitude and Activity Spaces: Using Household-Based Travel Diary Approach to Understand Travel and Activity Space Behaviors. Urban Sci. 2020, 4, 69. [Google Scholar] [CrossRef]
- Fathi, S.; Sajadzadeh, H.; Sheshkal, F.M.; Aram, F.; Pinter, G.; Felde, I.; Mosavi, A. The Role of Urban Morphology Design on Enhancing Physical Activity and Public Health. Int. J. Environ. Res. Public Health 2020, 17, 2359. [Google Scholar] [CrossRef]
- Sung, H.; Lee, S. Residential Built Environment and Walking Activity: Empirical Evidence of Jane Jacobs’ Urban Vitality. Transp. Res. D Transp. Environ. 2015, 41, 318–329. [Google Scholar] [CrossRef]
- Long, Y.; Huang, C.C. Does Block Size Matter? The Impact of Urban Design on Economic Vitality for Chinese Cities. Environ. Plan. B Urban Anal. City Sci. 2019, 46, 406–422. [Google Scholar] [CrossRef]
- Li, X.; Li, Y.; Jia, T.; Zhou, L.; Hijazi, I.H. The Six Dimensions of Built Environment on Urban Vitality: Fusion Evidence from Multi-Source Data. Cities 2022, 121, 103482. [Google Scholar] [CrossRef]
- Sevtsuk, A. Location and Agglomeration: The Distribution of Retail and Food Businesses in Dense Urban Environments. J. Plan. Educ. Res. 2014, 34, 374–393. [Google Scholar] [CrossRef]
- Kickert, C.; vom Hofe, R.; Haas, T.; Zhang, W.; Mahato, B. Spatial Dynamics of Long-Term Urban Retail Decline in Three Transatlantic Cities. Cities 2020, 107, 102918. [Google Scholar] [CrossRef]
- Gil, E.; Ahn, Y.; Kwon, Y. Tourist Attraction and Points of Interest (POIs) Using Search Engine Data: Case of Seoul. Sustainability 2020, 12, 7060. [Google Scholar] [CrossRef]
- Kim, D.; Seo, D.; Kwon, Y. Novel Trends in SNS Customers in Food and Beverage Patronage: An Empirical Study of Metropolitan Cities in South Korea. Land Use Policy 2021, 101, 105214. [Google Scholar] [CrossRef]
- Batty, M. Agents, Cells, and Cities: New Representational Models for Simulating Multiscale Urban Dynamics. Environ. Plan. A 2005, 37, 1373–1394. [Google Scholar] [CrossRef]
- Batty, M. Fifty Years of Urban Modeling: Macro-Statics to Micro-Dynamics. In The Dynamics of Complex Urban Systems: An Interdisciplinary Approach; Albeverio, S., Andrey, D., Eds.; Physica-Verlag Heidelberg: New York, NY, USA, 2008; pp. 1–20. ISBN 978-3-79-081936-6. [Google Scholar]
- White, R. Cities and Cellular Automata. Discret. Dyn. Nat. Soc. 1998, 2, 111–125. [Google Scholar] [CrossRef]
- Balmer, M.; Axhausen, K.W. Agent-Based Demand-Modeling Framework for Large-Scale Microsimulations. Transp. Res. Rec. 2006, 1985, 125–134. [Google Scholar] [CrossRef]
- Ejercito, P.M.; Nebrija, K.G.E.; Feria, R.P.; Lara-Figueroa, L.L. Traffic Simulation Software Review. In Proceedings of the 2017 8th International Conference on Information, Intelligence, Systems and Applications, IISA 2017, Larnaca, Cyprus, 27–30 August 2017. [Google Scholar] [CrossRef]
- Toparlar, Y.; Blocken, B.; Maiheu, B.; van Heijst, G.J.F. A Review on the CFD Analysis of Urban Microclimate. Renew. Sustain. Energy Rev. 2017, 80, 1613–1640. [Google Scholar] [CrossRef]
- Li, W.; Hsu, C.Y. GeoAI for Large-Scale Image Analysis and Machine Vision: Recent Progress of Artificial Intelligence in Geography. ISPRS Int. J. Geo-Inf. 2022, 11, 385. [Google Scholar] [CrossRef]
- Agonafir, C.; Lakhankar, T.; Khanbilvardi, R.; Krakauer, N.; Radell, D.; Devineni, N. A Machine Learning Approach to Evaluate the Spatial Variability of New York City’s 311 Street Flooding Complaints. Comput. Environ. Urban Syst. 2022, 97, 101854. [Google Scholar] [CrossRef]
- Xu, Y.; Zhou, B.; Jin, S.; Xie, X.; Chen, Z.; Hu, S.; He, N. A Framework for Urban Land Use Classification by Integrating the Spatial Context of Points of Interest and Graph Convolutional Neural Network Method. Comput. Environ. Urban Syst. 2022, 95, 101807. [Google Scholar] [CrossRef]
- Ilic, L.; Sawada, M.; Zarzelli, A. Deep Mapping Gentrification in a Large Canadian City Using Deep Learning and Google Street View. PLoS ONE 2019, 14, e0212814. [Google Scholar] [CrossRef]
- Jeon, J.; Woo, A. Deep Learning Analysis of Street Panorama Images to Evaluate the Streetscape Walkability of Neighborhoods for Subsidized Families in Seoul, Korea. Landsc. Urban Plan. 2023, 230, 104631. [Google Scholar] [CrossRef]
- Zhang, X.; Wang, L.; Su, Y. Visual Place Recognition: A Survey from Deep Learning Perspective. Pattern Recognit. 2021, 113, 107760. [Google Scholar] [CrossRef]
- Law, S.; Neira, M. An Unsupervised Approach to Geographical Knowledge Discovery Using Street Level and Street Network Images. In Proceedings of the 3rd ACM SIGSPATIAL International Workshop on AI for Geographic Knowledge Discovery, GeoAI 2019, Seattle, WA, USA, 5 November 2019; Association for Computing Machinery, Inc.: New York, NY, USA; pp. 56–65. [Google Scholar]
- Zhang, C.; Sargent, I.; Pan, X.; Li, H.; Gardiner, A.; Hare, J.; Atkinson, P.M. An Object-Based Convolutional Neural Network (OCNN) for Urban Land Use Classification. Remote Sens. Environ. 2018, 216, 57–70. [Google Scholar] [CrossRef]
- Yang, C.; Rottensteiner, F.; Heipke, C. Classification of Land Cover and Land Use Based on Convolutional Neural Networks. ISPRS Ann. Photogramm. Remote Sens. Spat. Inf. Sci. 2018, IV, 251–258. [Google Scholar] [CrossRef]
- Milojevic-Dupont, N.; Hans, N.; Kaack, L.H.; Zumwald, M.; Andrieux, F.; de Barros Soares, D.; Lohrey, S.; Pichler, P.P.; Creutzig, F. Learning from Urban Form to Predict Building Heights. PLoS ONE 2020, 15, e0242010. [Google Scholar] [CrossRef]
- Crivellari, A.; Beinat, E.; Caetano, S.; Seydoux, A.; Cardoso, T. Multi-Target CNN-LSTM Regressor for Predicting Urban Distribution of Short-Term Food Delivery Demand. J. Bus Res. 2022, 144, 844–853. [Google Scholar] [CrossRef]
- Wang, L.; Fan, H.; Wang, Y. Sustainability Analysis and Market Demand Estimation in the Retail Industry through a Convolutional Neural Network. Sustainability 2018, 10, 1762. [Google Scholar] [CrossRef]
- Güven, İ.; Şimşir, F. Demand Forecasting with Color Parameter in Retail Apparel Industry Using Artificial Neural Networks (ANN) and Support Vector Machines (SVM) Methods. Comput. Ind. Eng. 2020, 147, 106678. [Google Scholar] [CrossRef]
- Li, S.; Wang, Y.; Hao, M.; Jiang, D.; Zhang, X.; Zhou, R. Site Selection of Digital Signage in Beijing: A Combination of Machine Learning and an Empirical Approach. ISPRS Int. J. Geo-Inf. 2020, 9, 217. [Google Scholar] [CrossRef]
- Zhdanov, P.; Glukhov, G.; Derevitskii, I. Machine Learning Approach to Optimal Restaurant Location Search. In Proceedings of the 2022 IEEE 16th International Conference on Semantic Computing, Laguna Hills, CA, USA, 26–28 January 2022; Institute of Electrical and Electronics Engineers Inc.: Toulouse, France, 2022; pp. 263–268. [Google Scholar]
- Ouyang, J.; Fan, H.; Wang, L.; Yang, M.; Ma, Y. Site Selection Improvement of Retailers Based on Spatial Competition Strategy and a Double-Channel Convolutional Neural Network. ISPRS Int. J. Geo-Inf. 2020, 9, 357. [Google Scholar] [CrossRef]
- Chen, W.; Wu, A.N.; Biljecki, F. Classification of Urban Morphology with Deep Learning: Application on Urban Vitality. Comput. Environ. Urban Syst. 2021, 90, 101706. [Google Scholar] [CrossRef]
- Choi, J.H.; Kim, J.H. Spatial Information Data Construction and Data Mining Analysis for Topography Investigation of Land Characteristics. J. Korean Soc. Surv. Geod. Photogramm. Cartogr. 2019, 37, 507–516. [Google Scholar] [CrossRef]
- Krizhevsky, A.; Sutskever, I.; Hinton, G.E. ImageNet Classification with Deep Convolutional Neural Networks. In Advances in Neural Information Processing Systems 25 (NIPS-2012); Pereira, F., Burges, C.J., Bottou, L., Weinberger, K.Q., Eds.; Neural Information Processing Systems: Vancouver, BC, Canada, 2012; ISBN 9781627480031. [Google Scholar]
- O’Shea, K.; Nash, R. An Introduction to Convolutional Neural Networks. Int. J. Res. Appl. Sci. Eng. Technol. 2015, 10, 943–947. [Google Scholar] [CrossRef]
- Howard, A.G.; Zhu, M.; Chen, B.; Kalenichenko, D.; Wang, W.; Weyand, T.; Andreetto, M.; Adam, H. MobileNets: Efficient Convolutional Neural Networks for Mobile Vision Applications. arXiv 2017, arXiv:1704.04861. [Google Scholar] [CrossRef]
- Chaht01 GitHub—Chaht01/MobileNet. Available online: https://github.com/chaht01/MobileNet (accessed on 20 April 2023).
- The Seoul Institute. 2030 Seoul City Masterplan Regular Monitoring Results; Seoul Institute: Seoul, Republic of Korea, 2019.
- Lee, S.Y. Cities for Profit: Profit-Driven Gentrification in Seoul, South Korea. Urban Stud. 2018, 55, 2603–2617. [Google Scholar] [CrossRef]
- Yoon, Y.; Park, J. Stage Classification and Characteristics Analysis of Commercial Gentrification in Seoul. Sustainability 2018, 10, 2440. [Google Scholar] [CrossRef]
- Zukin, S.; Trujillo, V.; Frase, P.; Jackson, D.; Recuber, T.; Walker, A. New Retail Capital and Neighborhood Change: Boutiques and Gentrification in New York City. City Community 2009, 8, 47–64. [Google Scholar] [CrossRef]
- Samardžić-Petrović, M.; Dragićević, S.; Kovačević, M.; Bajat, B. Modeling Urban Land Use Changes Using Support Vector Machines. Trans. GIS 2016, 20, 718–734. [Google Scholar] [CrossRef]
- Lloyd, C.T.; Sturrock, H.J.W.; Leasure, D.R.; Jochem, W.C.; Lázár, A.N.; Tatem, A.J. Using GIS and Machine Learning to Classify Residential Status of Urban Buildings in Low and Middle Income Settings. Remote Sens. 2020, 12, 3847. [Google Scholar] [CrossRef]
- Ling, C.X.; Huang, J.; Zhang, H. AUC: A Better Measure than Accuracy in Comparing Learning Algorithms. In Canadian AI 2003: Advances in Artificial Intelligence; Xiang, Y., Chaib-draa, B., Eds.; Springer: Berlin, Germany, 2003; Volume 2671, pp. 329–341. ISBN 3540403000. [Google Scholar]
- Ferri, C.; Hernández-Orallo, J.; Flach, P.A. A Coherent Interpretation of AUC as a Measure of Aggregated Classification Performance. In Proceedings of the 28th International Conference on Machine Learning (ICML-11), Bellevue, DC, USA, 28 June–2 July 2011; pp. 657–664. [Google Scholar]
- Mutasa, S.; Sun, S.; Ha, R. Understanding Artificial Intelligence Based Radiology Studies: What Is Overfitting? Clin. Imaging 2020, 65, 96–99. [Google Scholar] [CrossRef]
- Li, Z.; Kamnitsas, K.; Glocker, B. Analyzing Overfitting under Class Imbalance in Neural Networks for Image Segmentation. IEEE Trans. Med. Imaging 2021, 40, 1065–1077. [Google Scholar] [CrossRef]
- O’gara, S.; Mcguinness, K. Comparing Data Augmentation Strategies for Deep Image Classification. In Proceedings of the IMVIP 2019: Irish Machine Vision & Image Processing, Technological University Dublin, Dublin, Ireland, 28–30 August 2019. [Google Scholar] [CrossRef]
- Shorten, C.; Khoshgoftaar, T.M. A Survey on Image Data Augmentation for Deep Learning. J. Big Data 2020, 119, 60. [Google Scholar] [CrossRef]
- Carter, C.C.; Vandell, K.D. Store Location in Shopping Centers: Theory and Estimates. J. Real Estate Res. 2005, 27, 237–265. [Google Scholar] [CrossRef]
- Scheer, B.C.; Petkov, M. Edge City Morphology: A Comparison of Commercial Centers. J. Am. Plan. Assoc. 1998, 64, 298–310. [Google Scholar] [CrossRef]
- Venerandi, A.; Zanella, M.; Romice, O.; Dibble, J.; Porta, S. Form and Urban Change—An Urban Morphometric Study of Five Gentrified Neighbourhoods in London. Environ. Plan. B Urban Anal. City Sci. 2017, 44, 1056–1076. [Google Scholar] [CrossRef]
- Omer, I.; Goldblatt, R. Spatial Patterns of Retail Activity and Street Network Structure in New and Traditional Israeli Cities. Urban Geogr. 2015, 37, 629–649. [Google Scholar] [CrossRef]
- Arrigo, E. The Role of the Flagship Store Location in Luxury Branding. An International Exploratory Study. Int. J. Retail. Distrib. Manag. 2015, 43, 518–537. [Google Scholar] [CrossRef]
- Prayag, G.; Landré, M.; Ryan, C. Restaurant Location in Hamilton, New Zealand: Clustering Patterns from 1996 to 2008. Int. J. Contemp. Hosp. Manag. 2012, 24, 430–450. [Google Scholar] [CrossRef]
- Shen, Y.; Karimi, K. Urban Function Connectivity: Characterisation of Functional Urban Streets with Social Media Check-in Data. Cities 2016, 55, 9–21. [Google Scholar] [CrossRef]
- Dazeley, R.; Vamplew, P.; Foale, C.; Young, C.; Aryal, S.; Cruz, F. Levels of Explainable Artificial Intelligence for Human-Aligned Conversational Explanations. Artif. Intell. 2021, 299, 103525. [Google Scholar] [CrossRef]
- Zhang, B.; Qi, S.; Monkam, P.; Li, C.; Yang, F.; Yao, Y.D.; Qian, W. Ensemble Learners of Multiple Deep Cnns for Pulmonary Nodules Classification Using Ct Images. IEEE Access 2019, 7, 110358–110371. [Google Scholar] [CrossRef]
- Milantev, S.; Olyunin, V.; Milanteva, N.; Bykov, I.; Bessmertny, I. Skin Lesion Analysis Using Ensemble of CNN with Dermoscopic Images and Metadata. In Proceedings of the 12th Majorov International Conference on Software Engineering and Computer Systems, Saint Petersburg, Russia, 10–11 December 2020. [Google Scholar]
- Domingo, J.D.; Aparicio, R.M.; Rodrigo, L.M.G. Cross Validation Voting for Improving CNN Classification in Grocery Products. IEEE Access 2022, 10, 20913–20925. [Google Scholar] [CrossRef]
Disclaimer/Publisher’s Note: The statements, opinions and data contained in all publications are solely those of the individual author(s) and contributor(s) and not of MDPI and/or the editor(s). MDPI and/or the editor(s) disclaim responsibility for any injury to people or property resulting from any ideas, methods, instructions or products referred to in the content. |
© 2023 by the authors. Licensee MDPI, Basel, Switzerland. This article is an open access article distributed under the terms and conditions of the Creative Commons Attribution (CC BY) license (https://creativecommons.org/licenses/by/4.0/).