

Site Selection Prediction for Coffee Shops Based on Multi-Source Space Data Using Machine Learning Techniques

Abstract
1. Introduction
2. Data and Methods
2.1. Study Area and Data
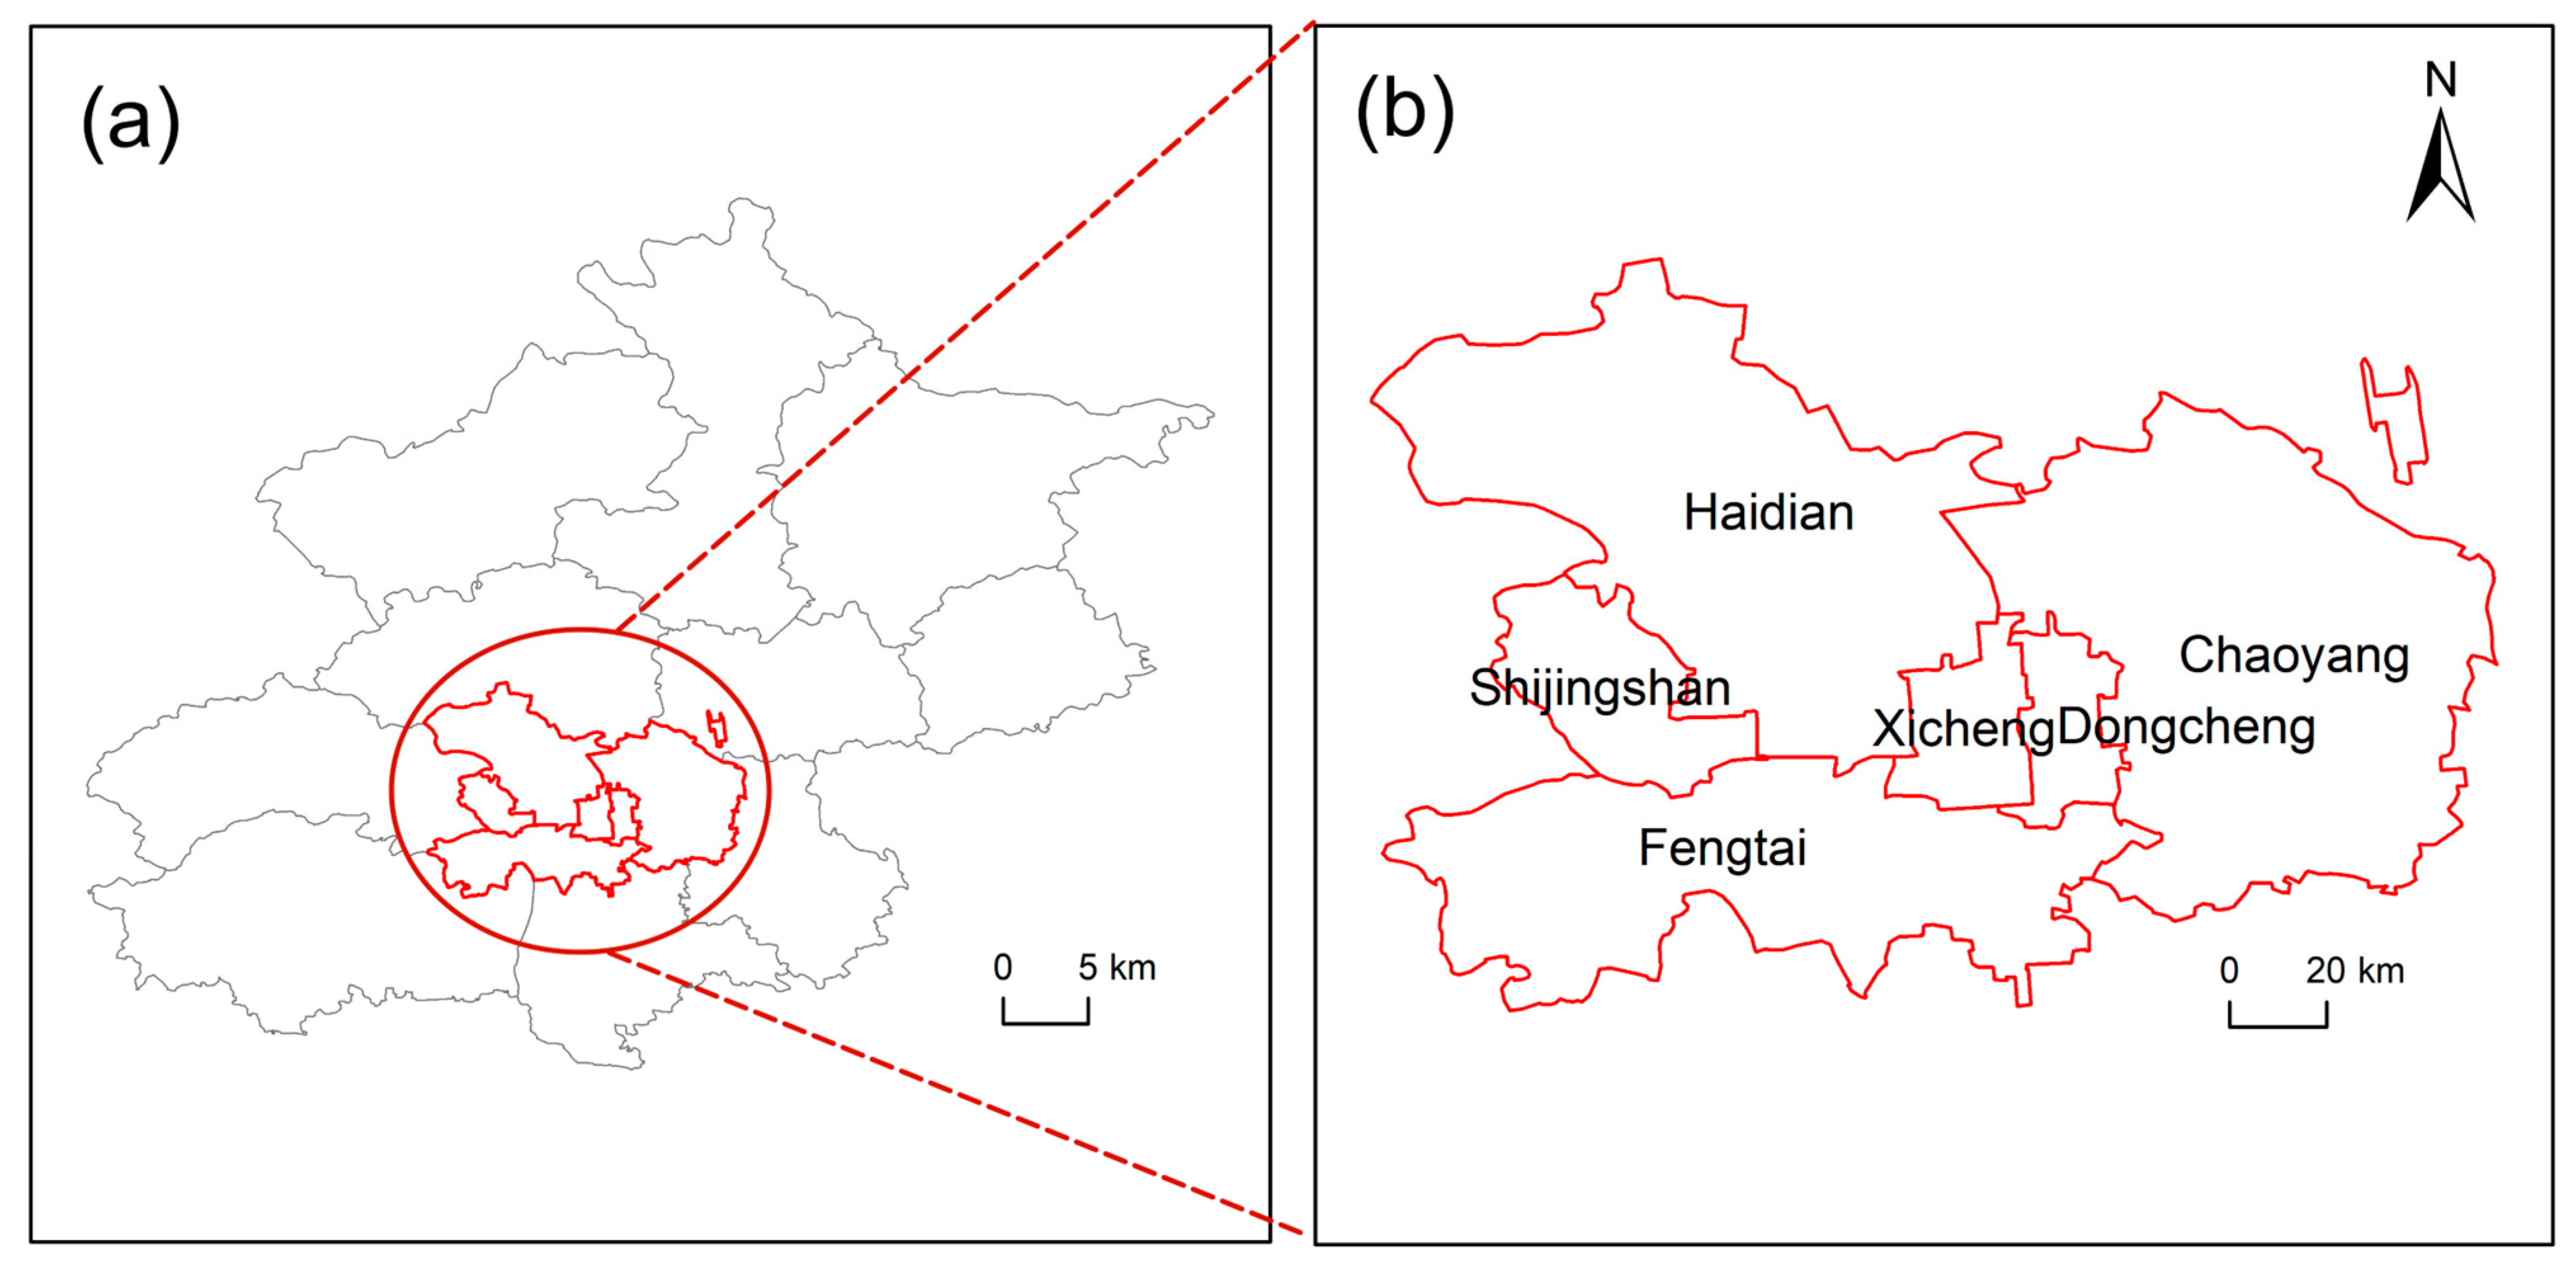
2.1.1. Overview of the Study Area
2.1.2. Data Collection
- Eliminate the “place-name and address information” that has no practical significance for prediction.
- Considering the data volume of the “automobile service”, “automobile sales”, and “automobile maintenance” categories, as well as the consistency of their impact on site prediction [23], we combined the points under these three categories into one category, called the “car-related” category.
- Under the category of “catering services”, because the study took the points under the category of “cafe” as the dependent variable, the subcategory of “cafe” was excluded.
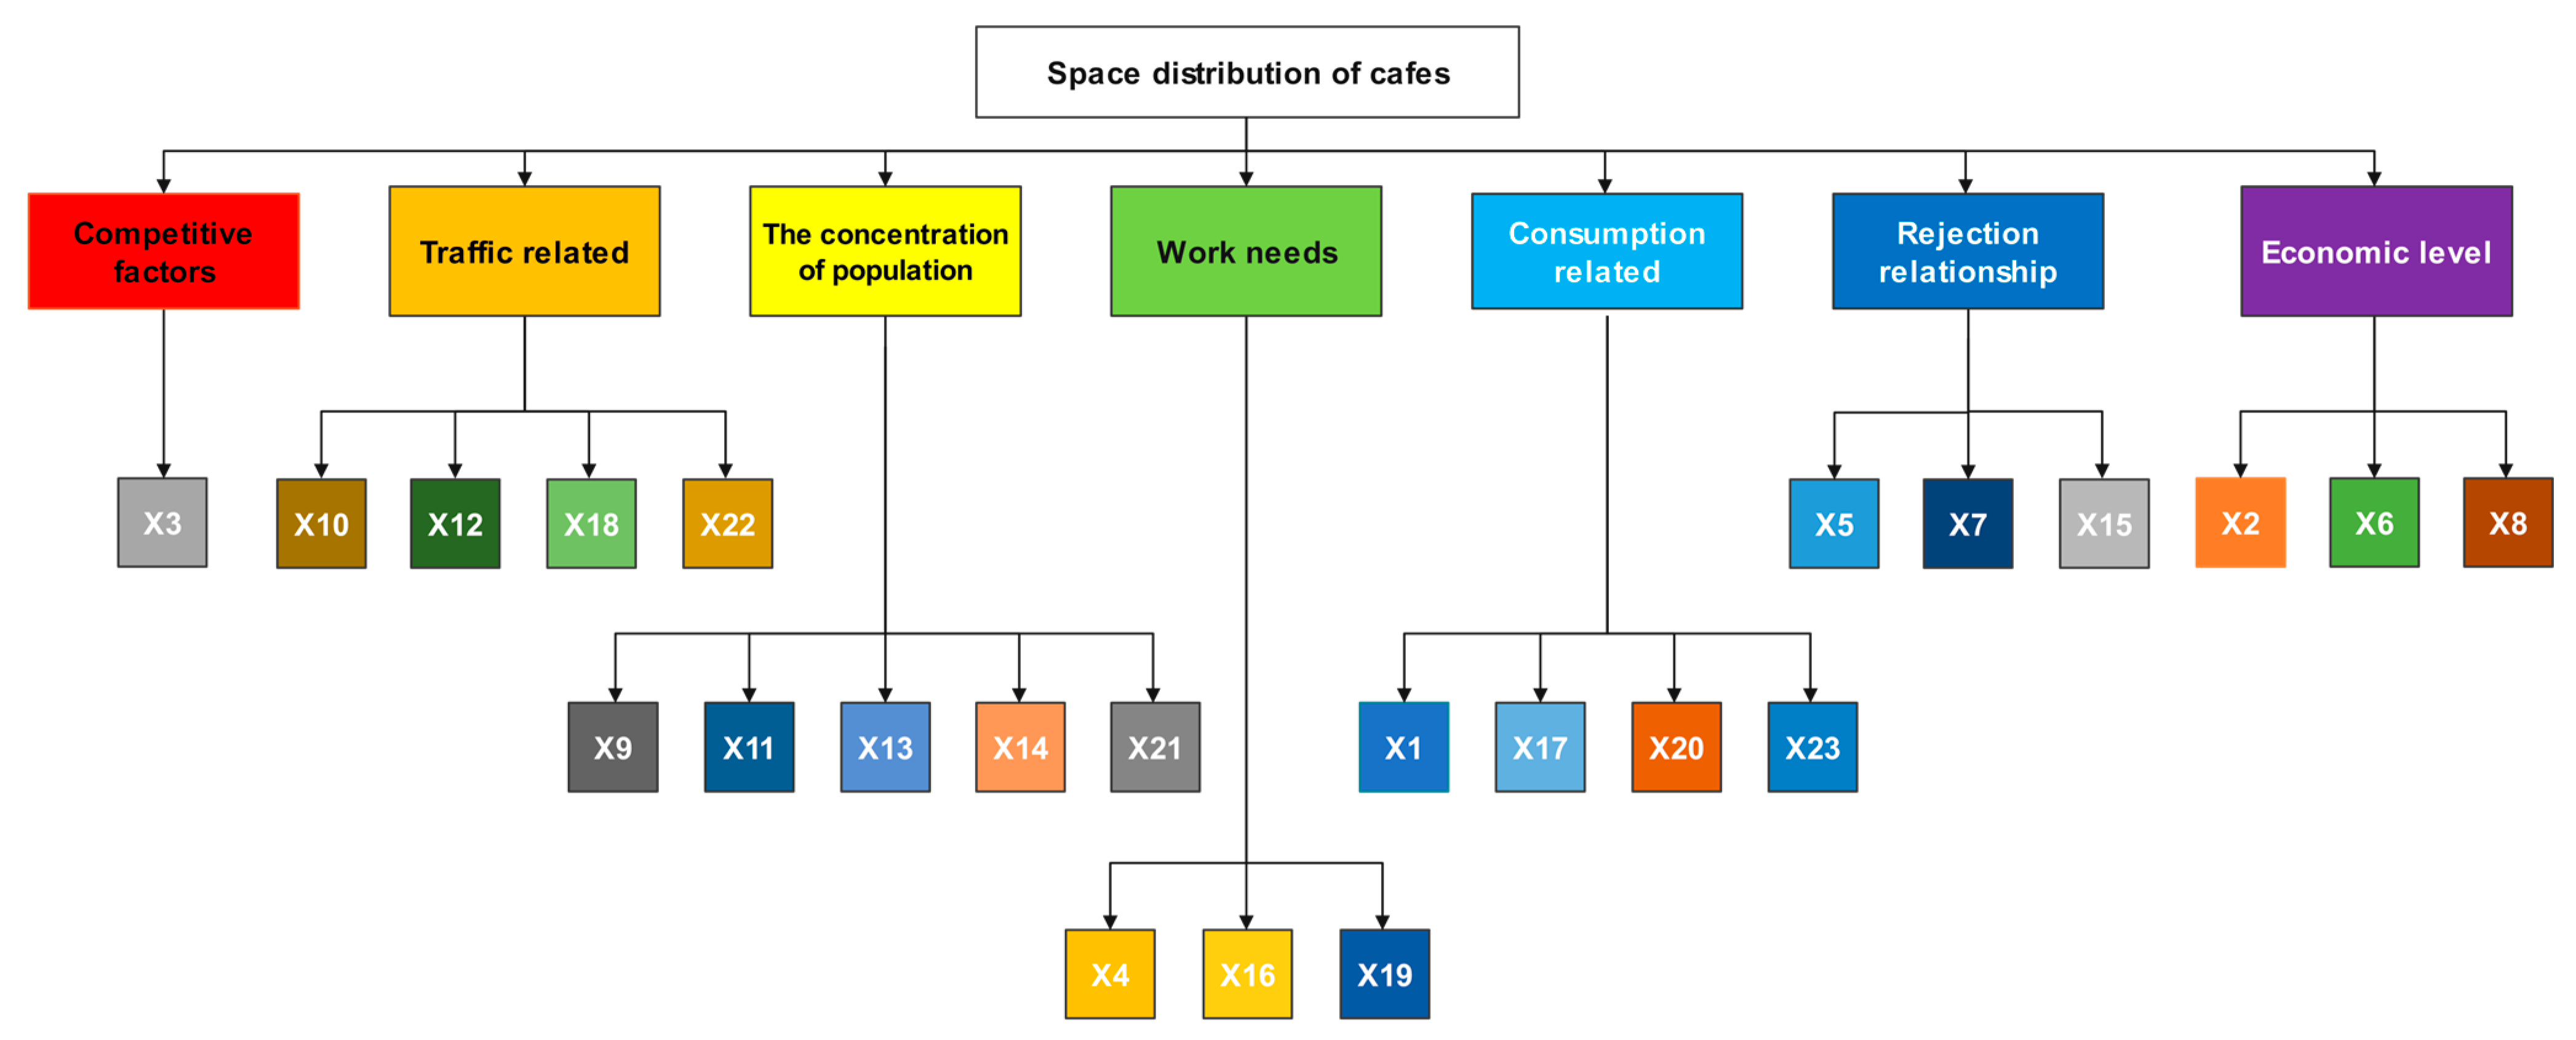
2.1.3. Construction of Impact Factors
- The kernel densities of the 20 types of POI data and coffee shop distribution data were estimated.
- Raw data on population density and night light were used.
- The average house prices were determined by Kriging interpolation.
2.1.4. Extraction of Sampling Points
2.2. Methods
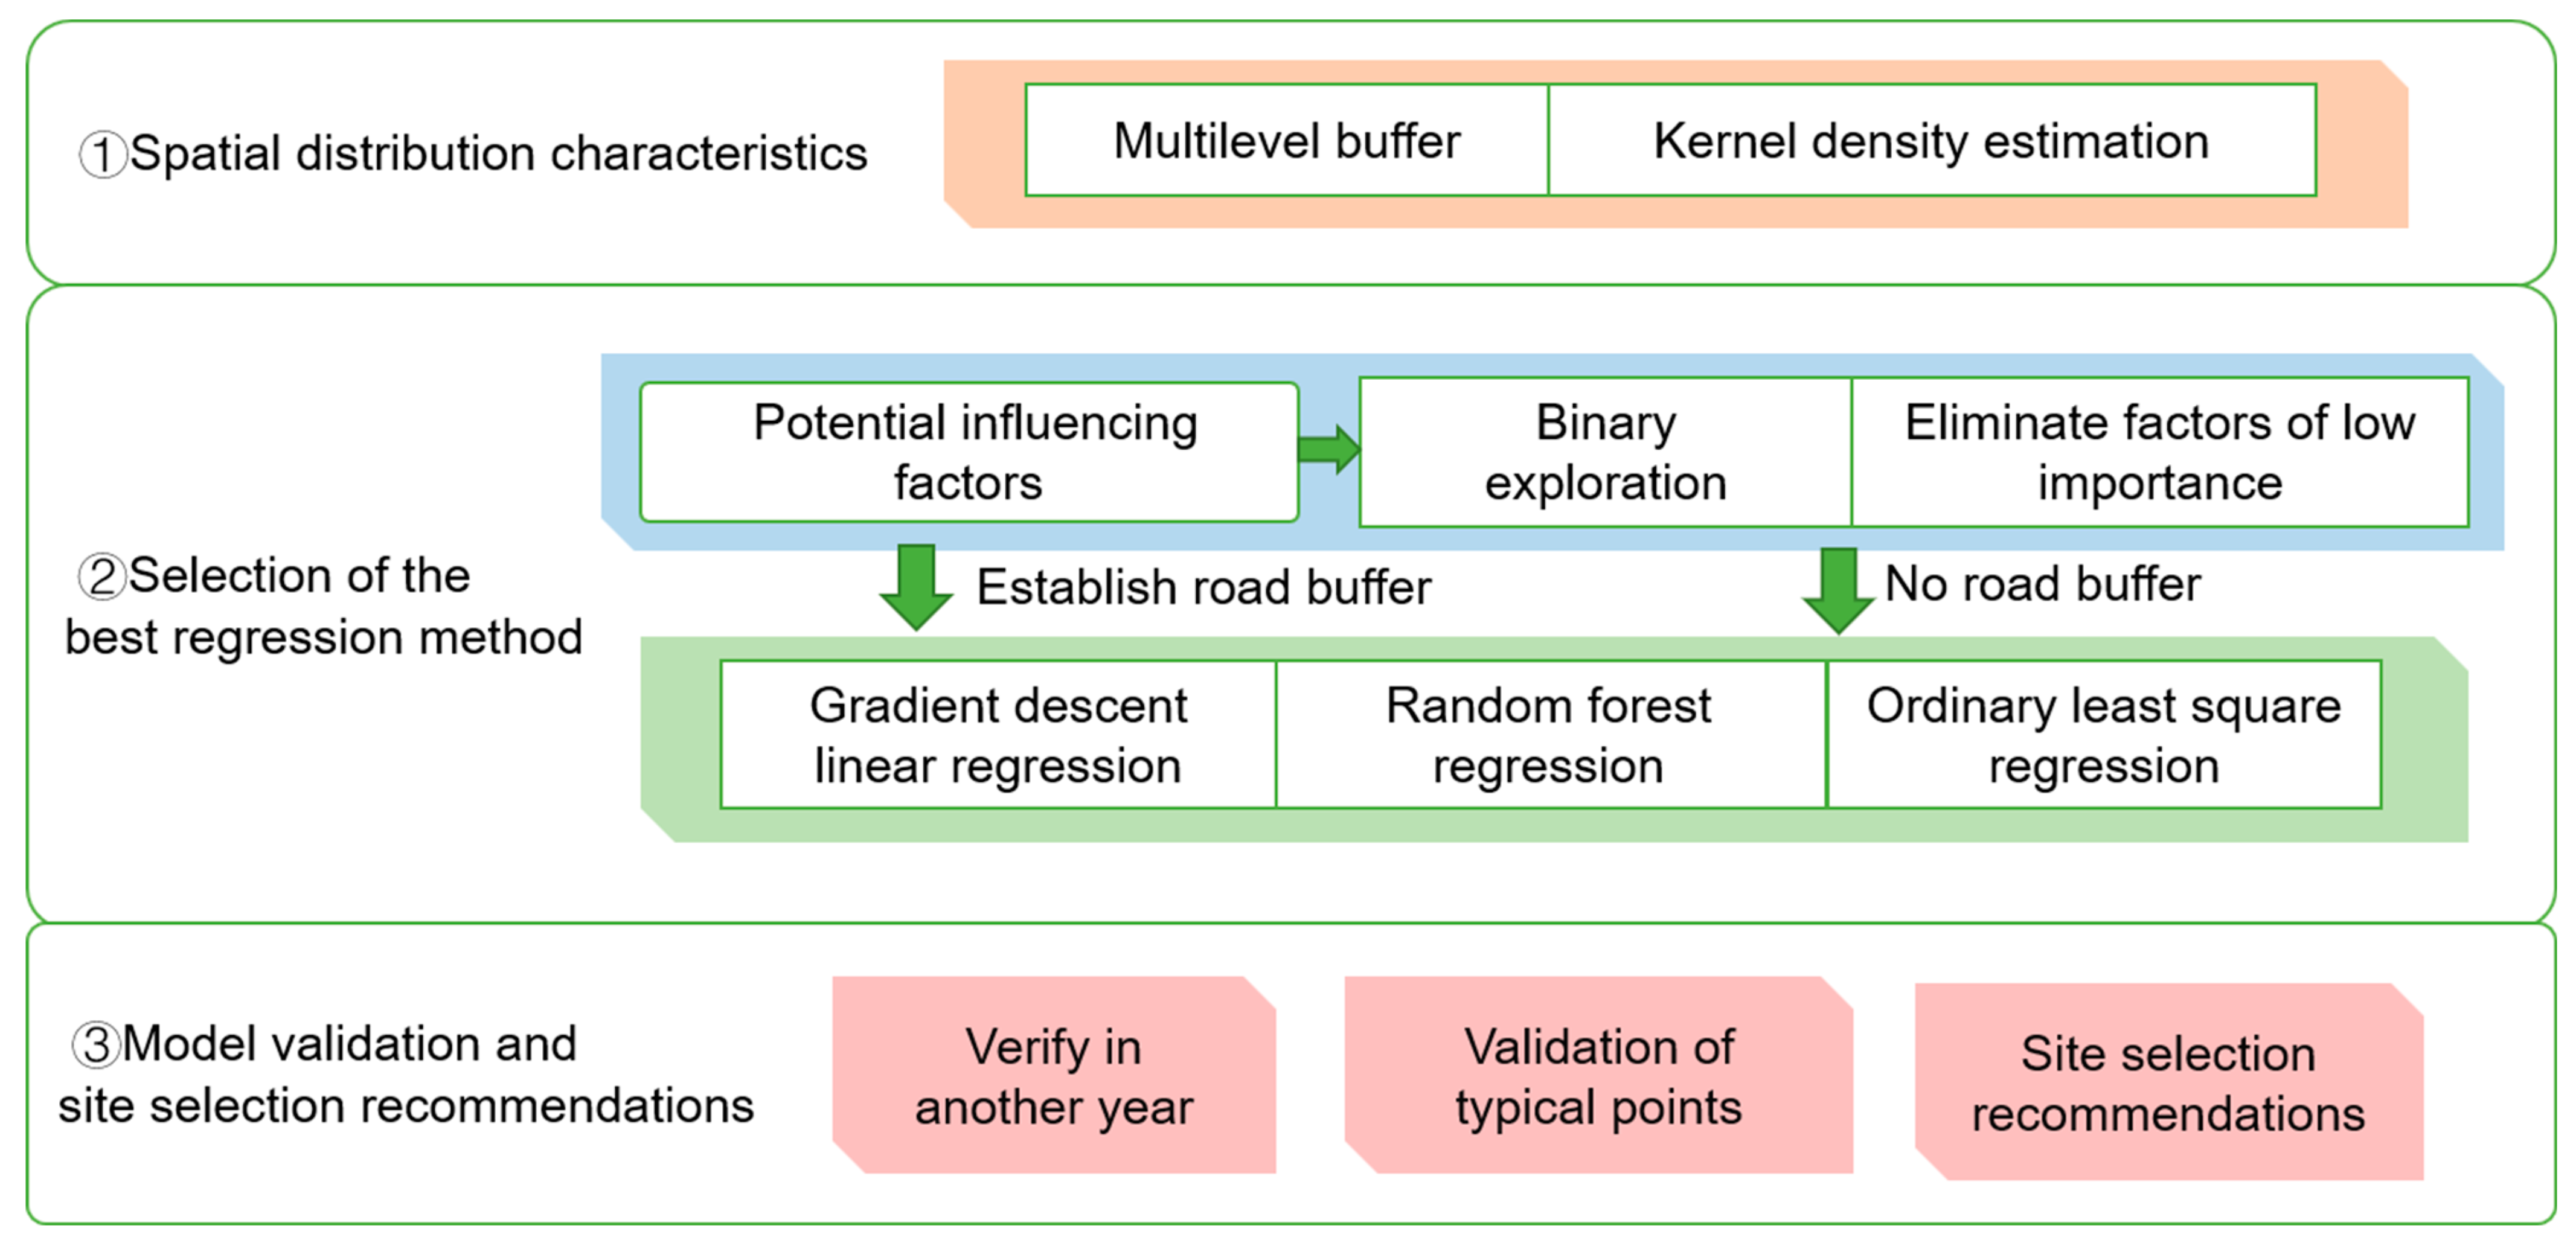
- Study of the spatial distribution characteristics of coffee shops: with the coffee shop KDE as the base map, an overlay analysis was carried out with the multilevel buffer zone established with Jingshan Park as the center point.
- Comparison of regression methods: on the basis of the construction of characteristic factors and binary classification exploration to determine whether there was a coffee shop in a grid, the regression accuracies of RF, GD, and OLS models were compared and analyzed to select the best model.
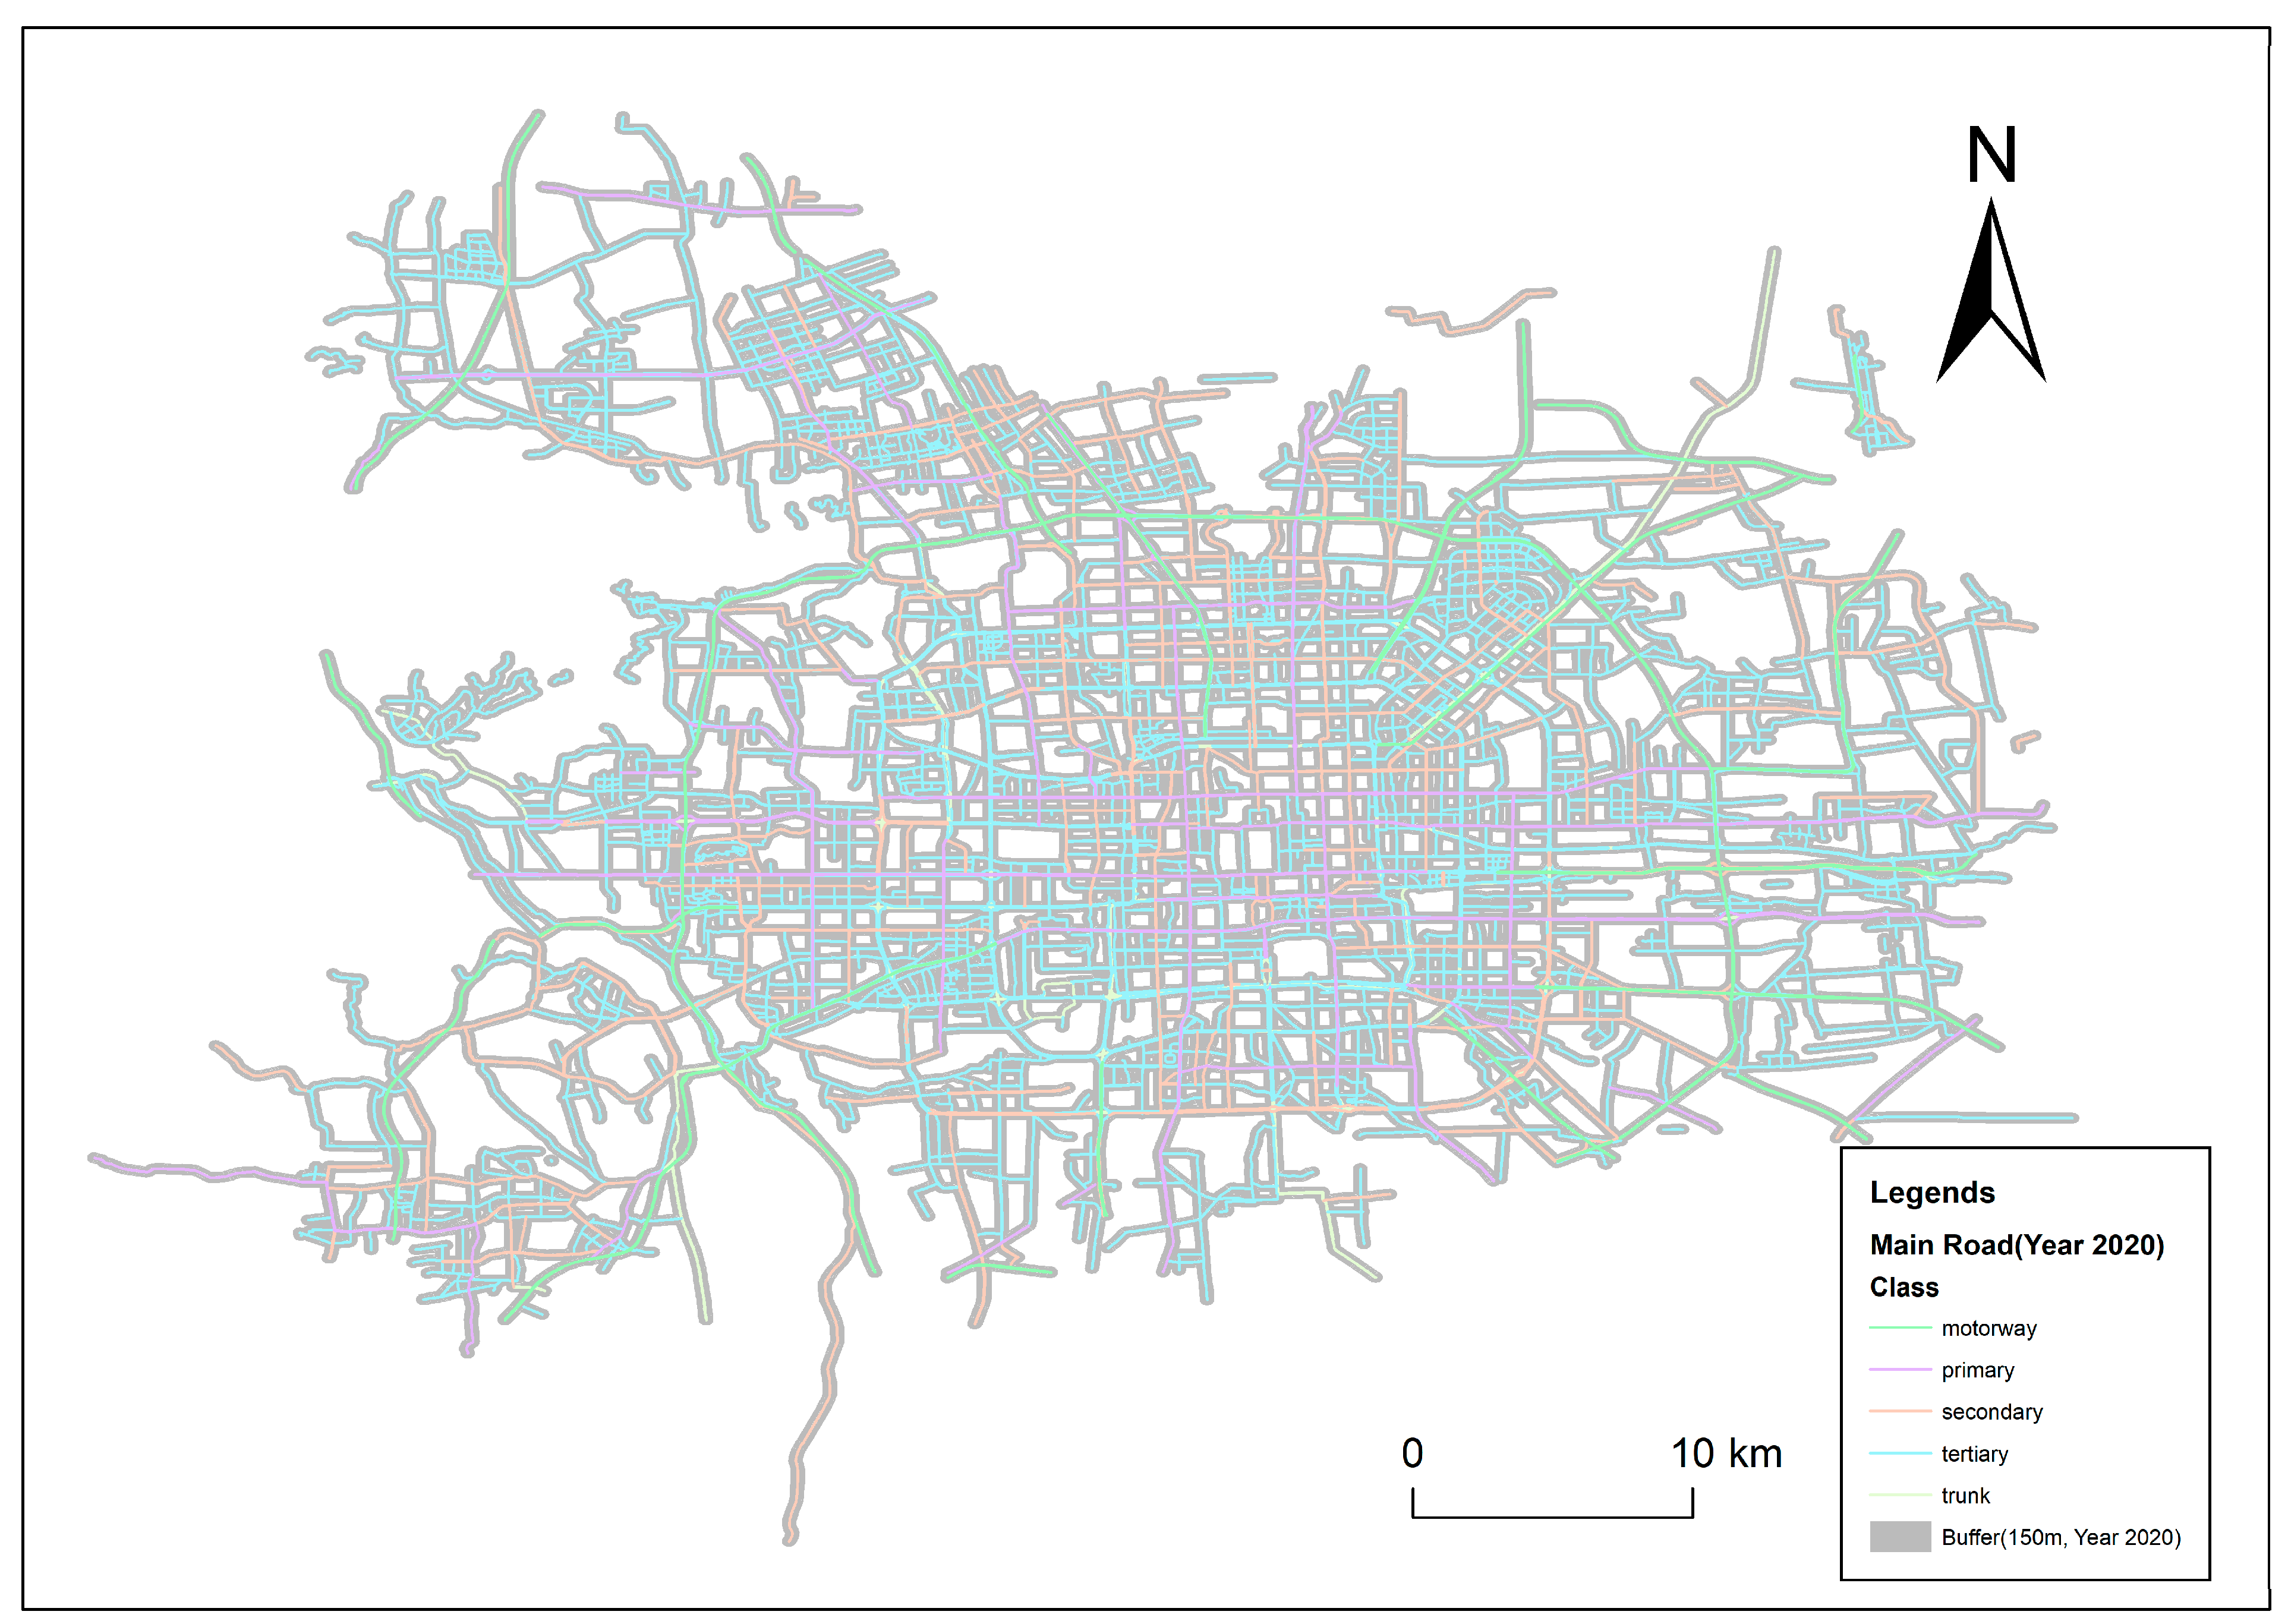
- Comparison of regression results considering road constraints: comparative analysis of the regression accuracy of the models before and after the main road buffer zone was established, and comparison and verification of the prediction success rate of the two models.
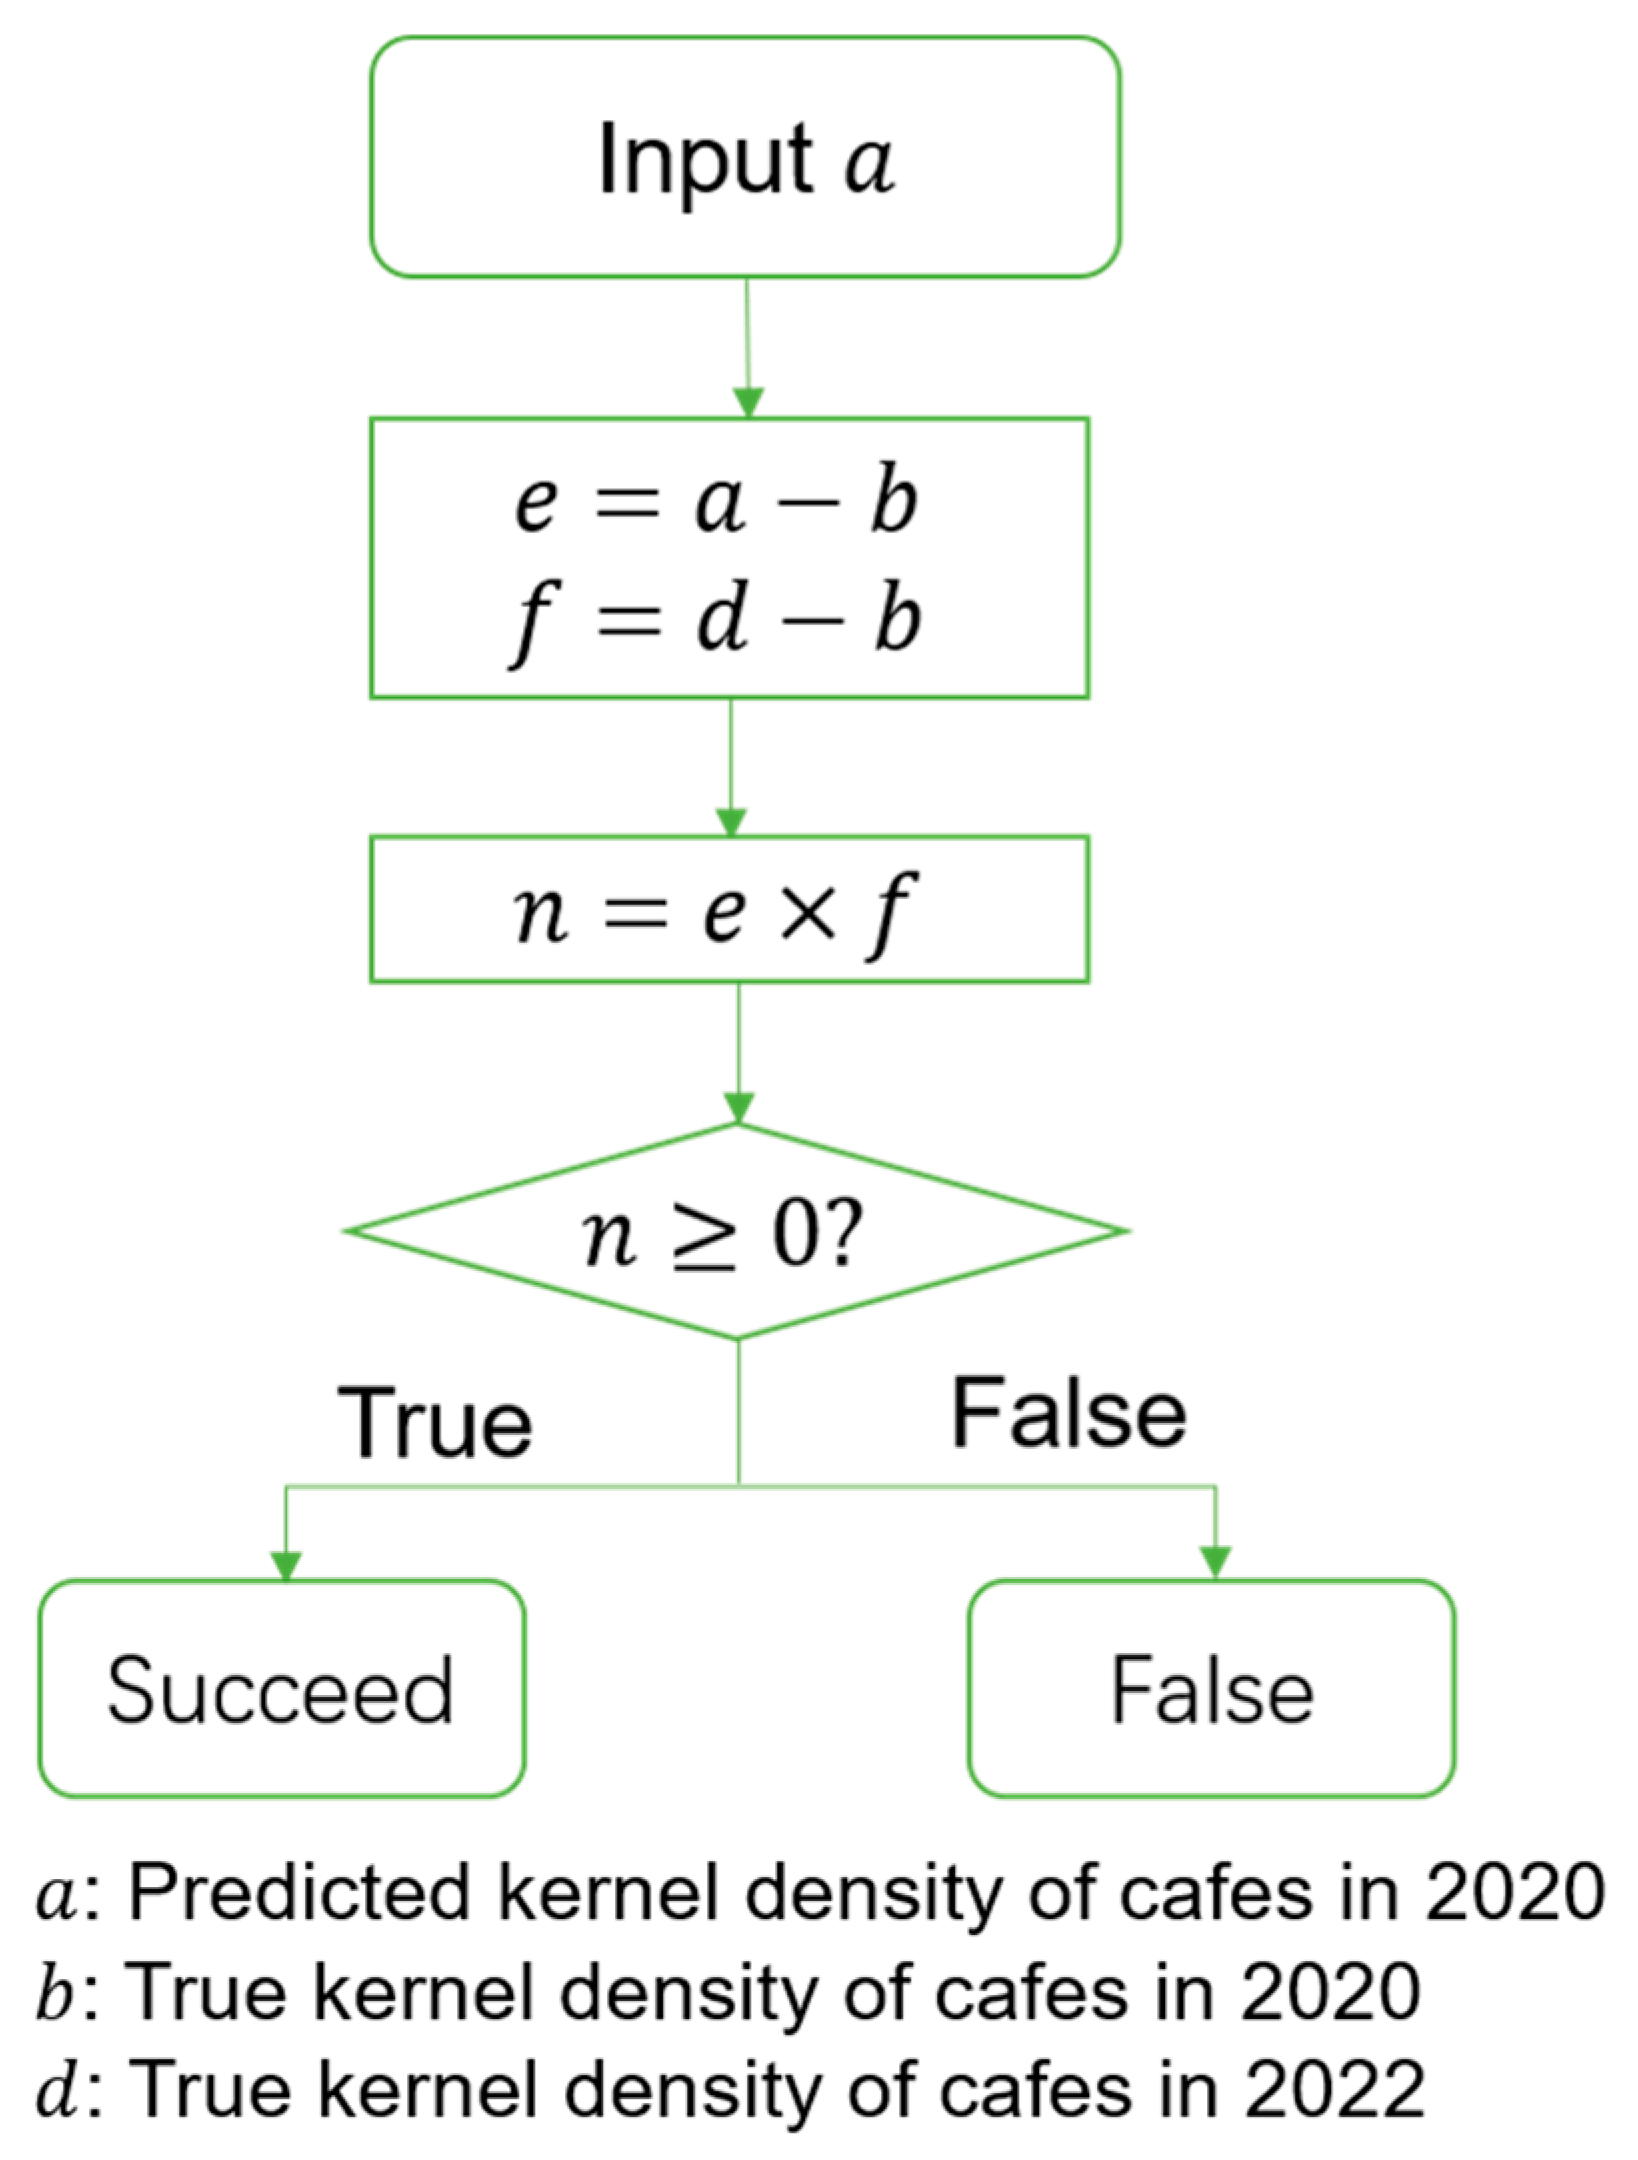
- Verify the accuracy of the model: by comparing the actual data of two time snapshots with the corresponding prediction results of coffee shop KDE, the probability that the actual trends of coffee shops are consistent with our prediction trend is obtained, thus verifying the accuracy of the prediction model selected in this paper from a practical point of view.
- On the basis of the above steps, the best prediction model is selected, and the evaluation and recommended location of a coffee shop in typical areas are given.
2.2.1. Study of Spatial Distribution Characteristics
2.2.2. Prediction Method
- (1)
- Random Forest Algorithm
- (2)
- Gradient descent algorithm
- (3)
- Ordinary least squares method
- (4)
- Construction of road buffer zone
- (5)
- Precision evaluation of the model
3. Results
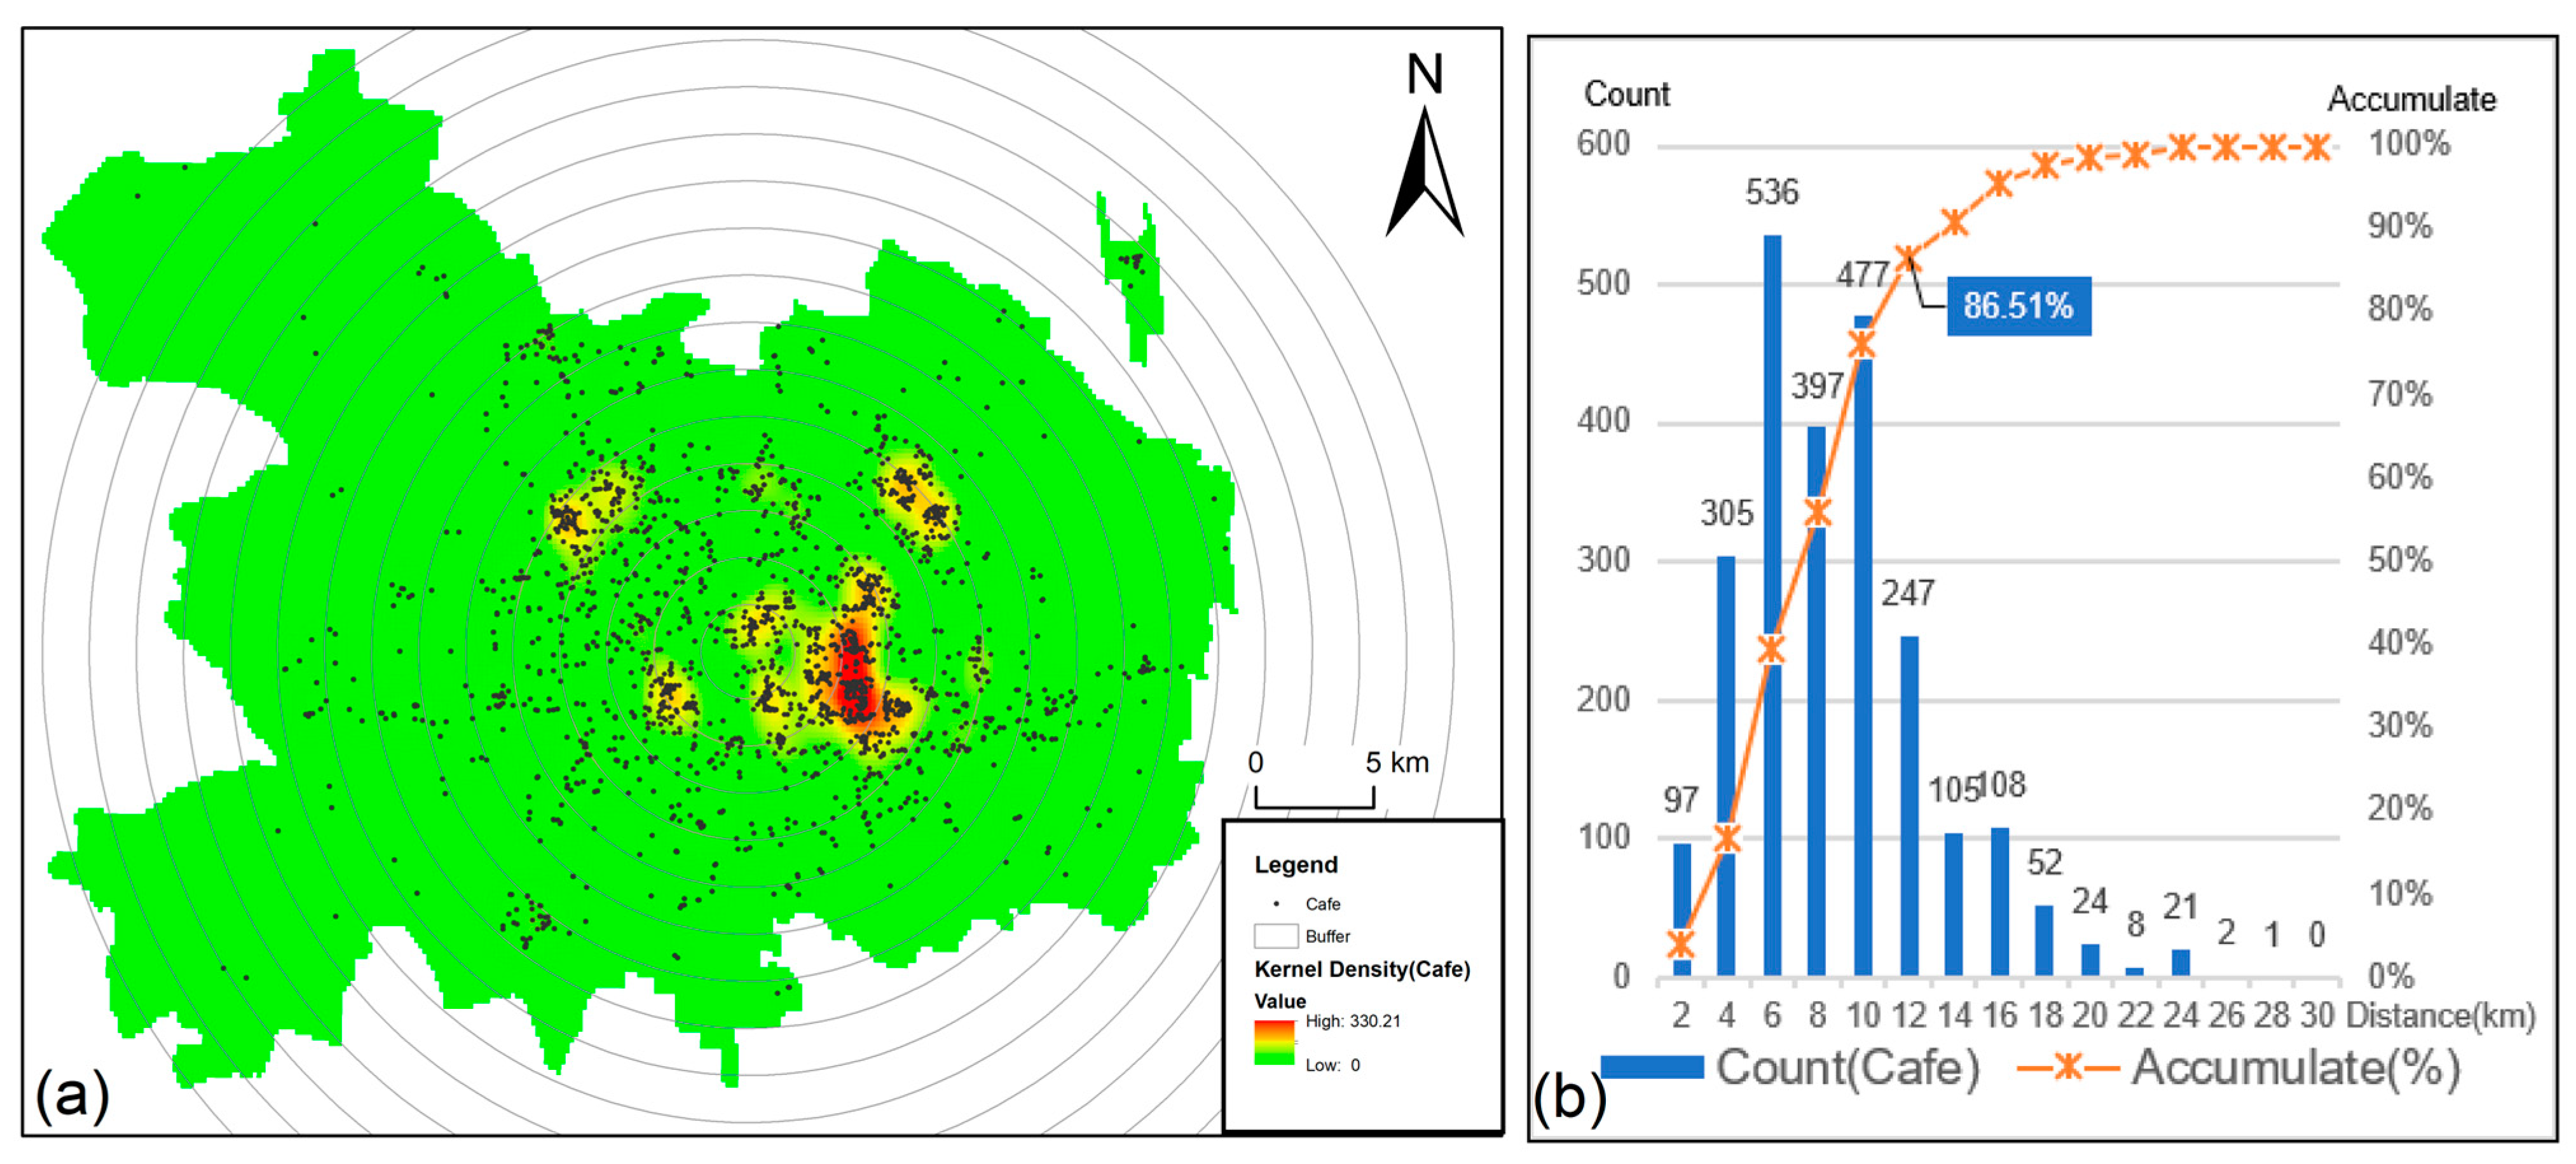
3.1. Spatial Distribution Characteristics
3.2. Binary Classification Exploration and Regression Method Selection
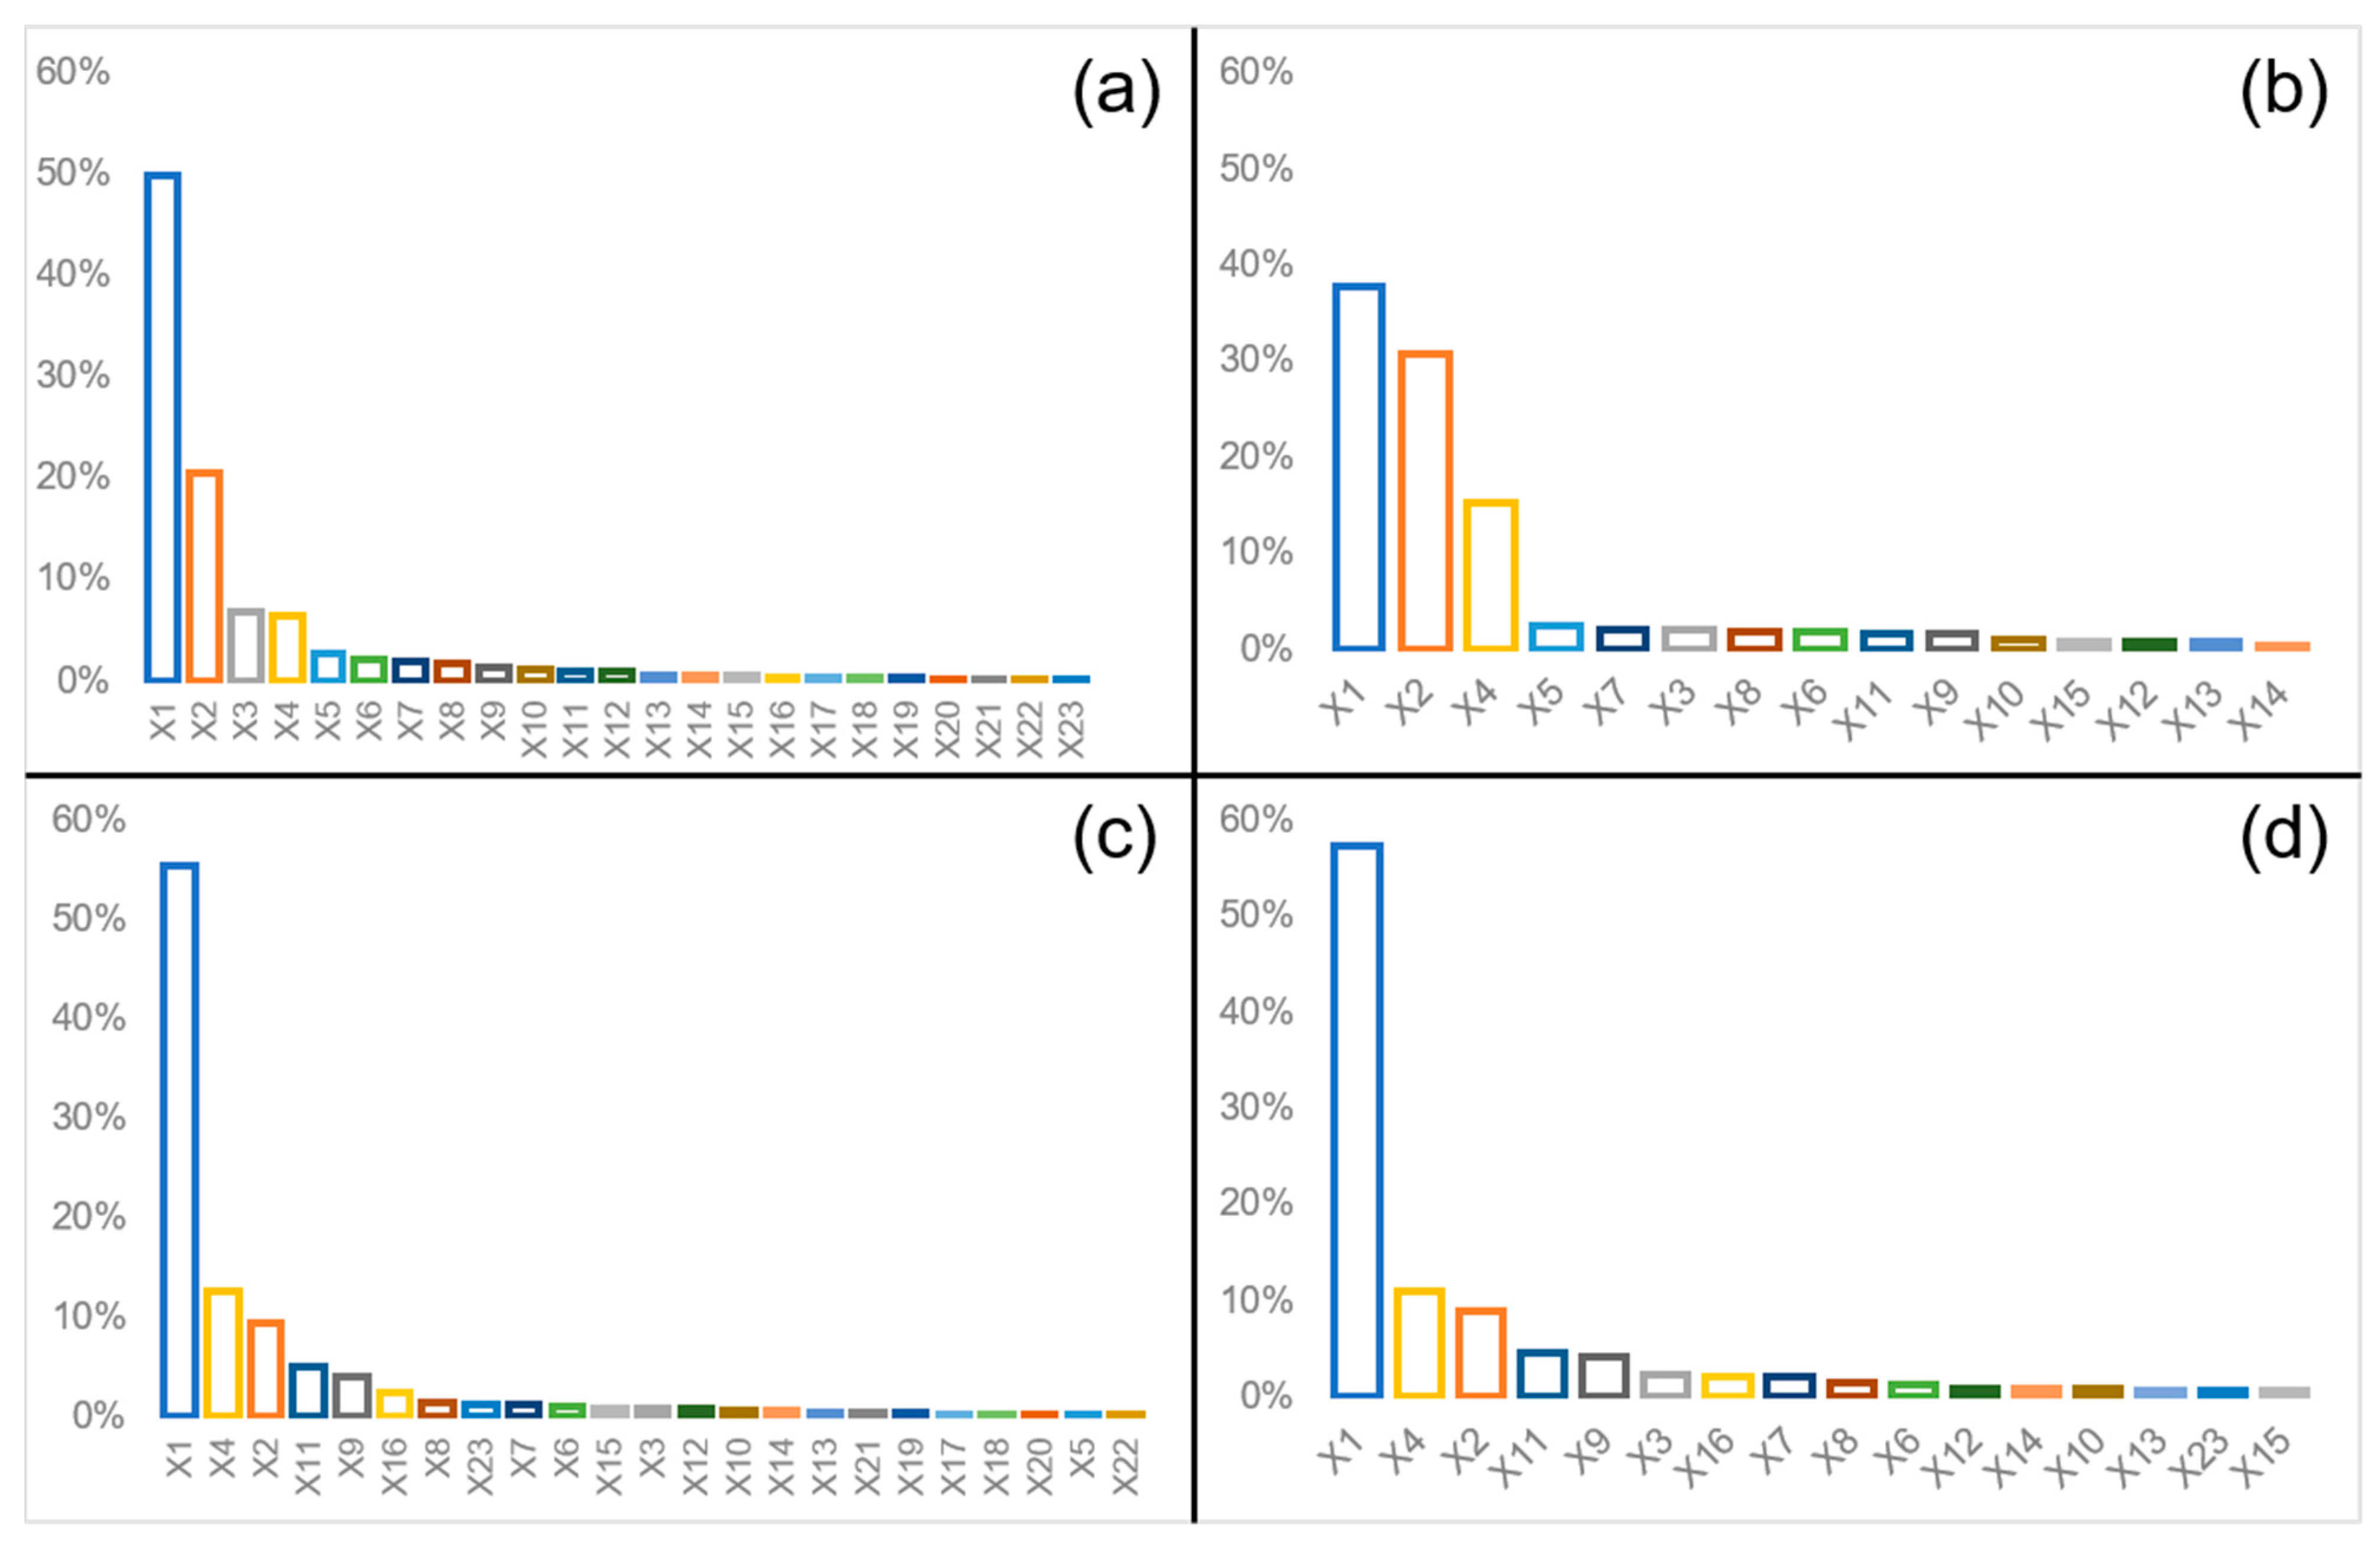
3.2.1. Exploratory Study Based on RF Classification
3.2.2. Comparison of Multivariate Regression Methods
3.2.3. Comparison of Multivariate Regression Accuracy of the Main Road Network Constraints
3.3. Practical Verification
3.3.1. Construction of the Site Selection Model in 2022
- (1)
- Comparison of exploratory studies based on RF
- (2)
- Precision of the RF model before and after establishment of buffer
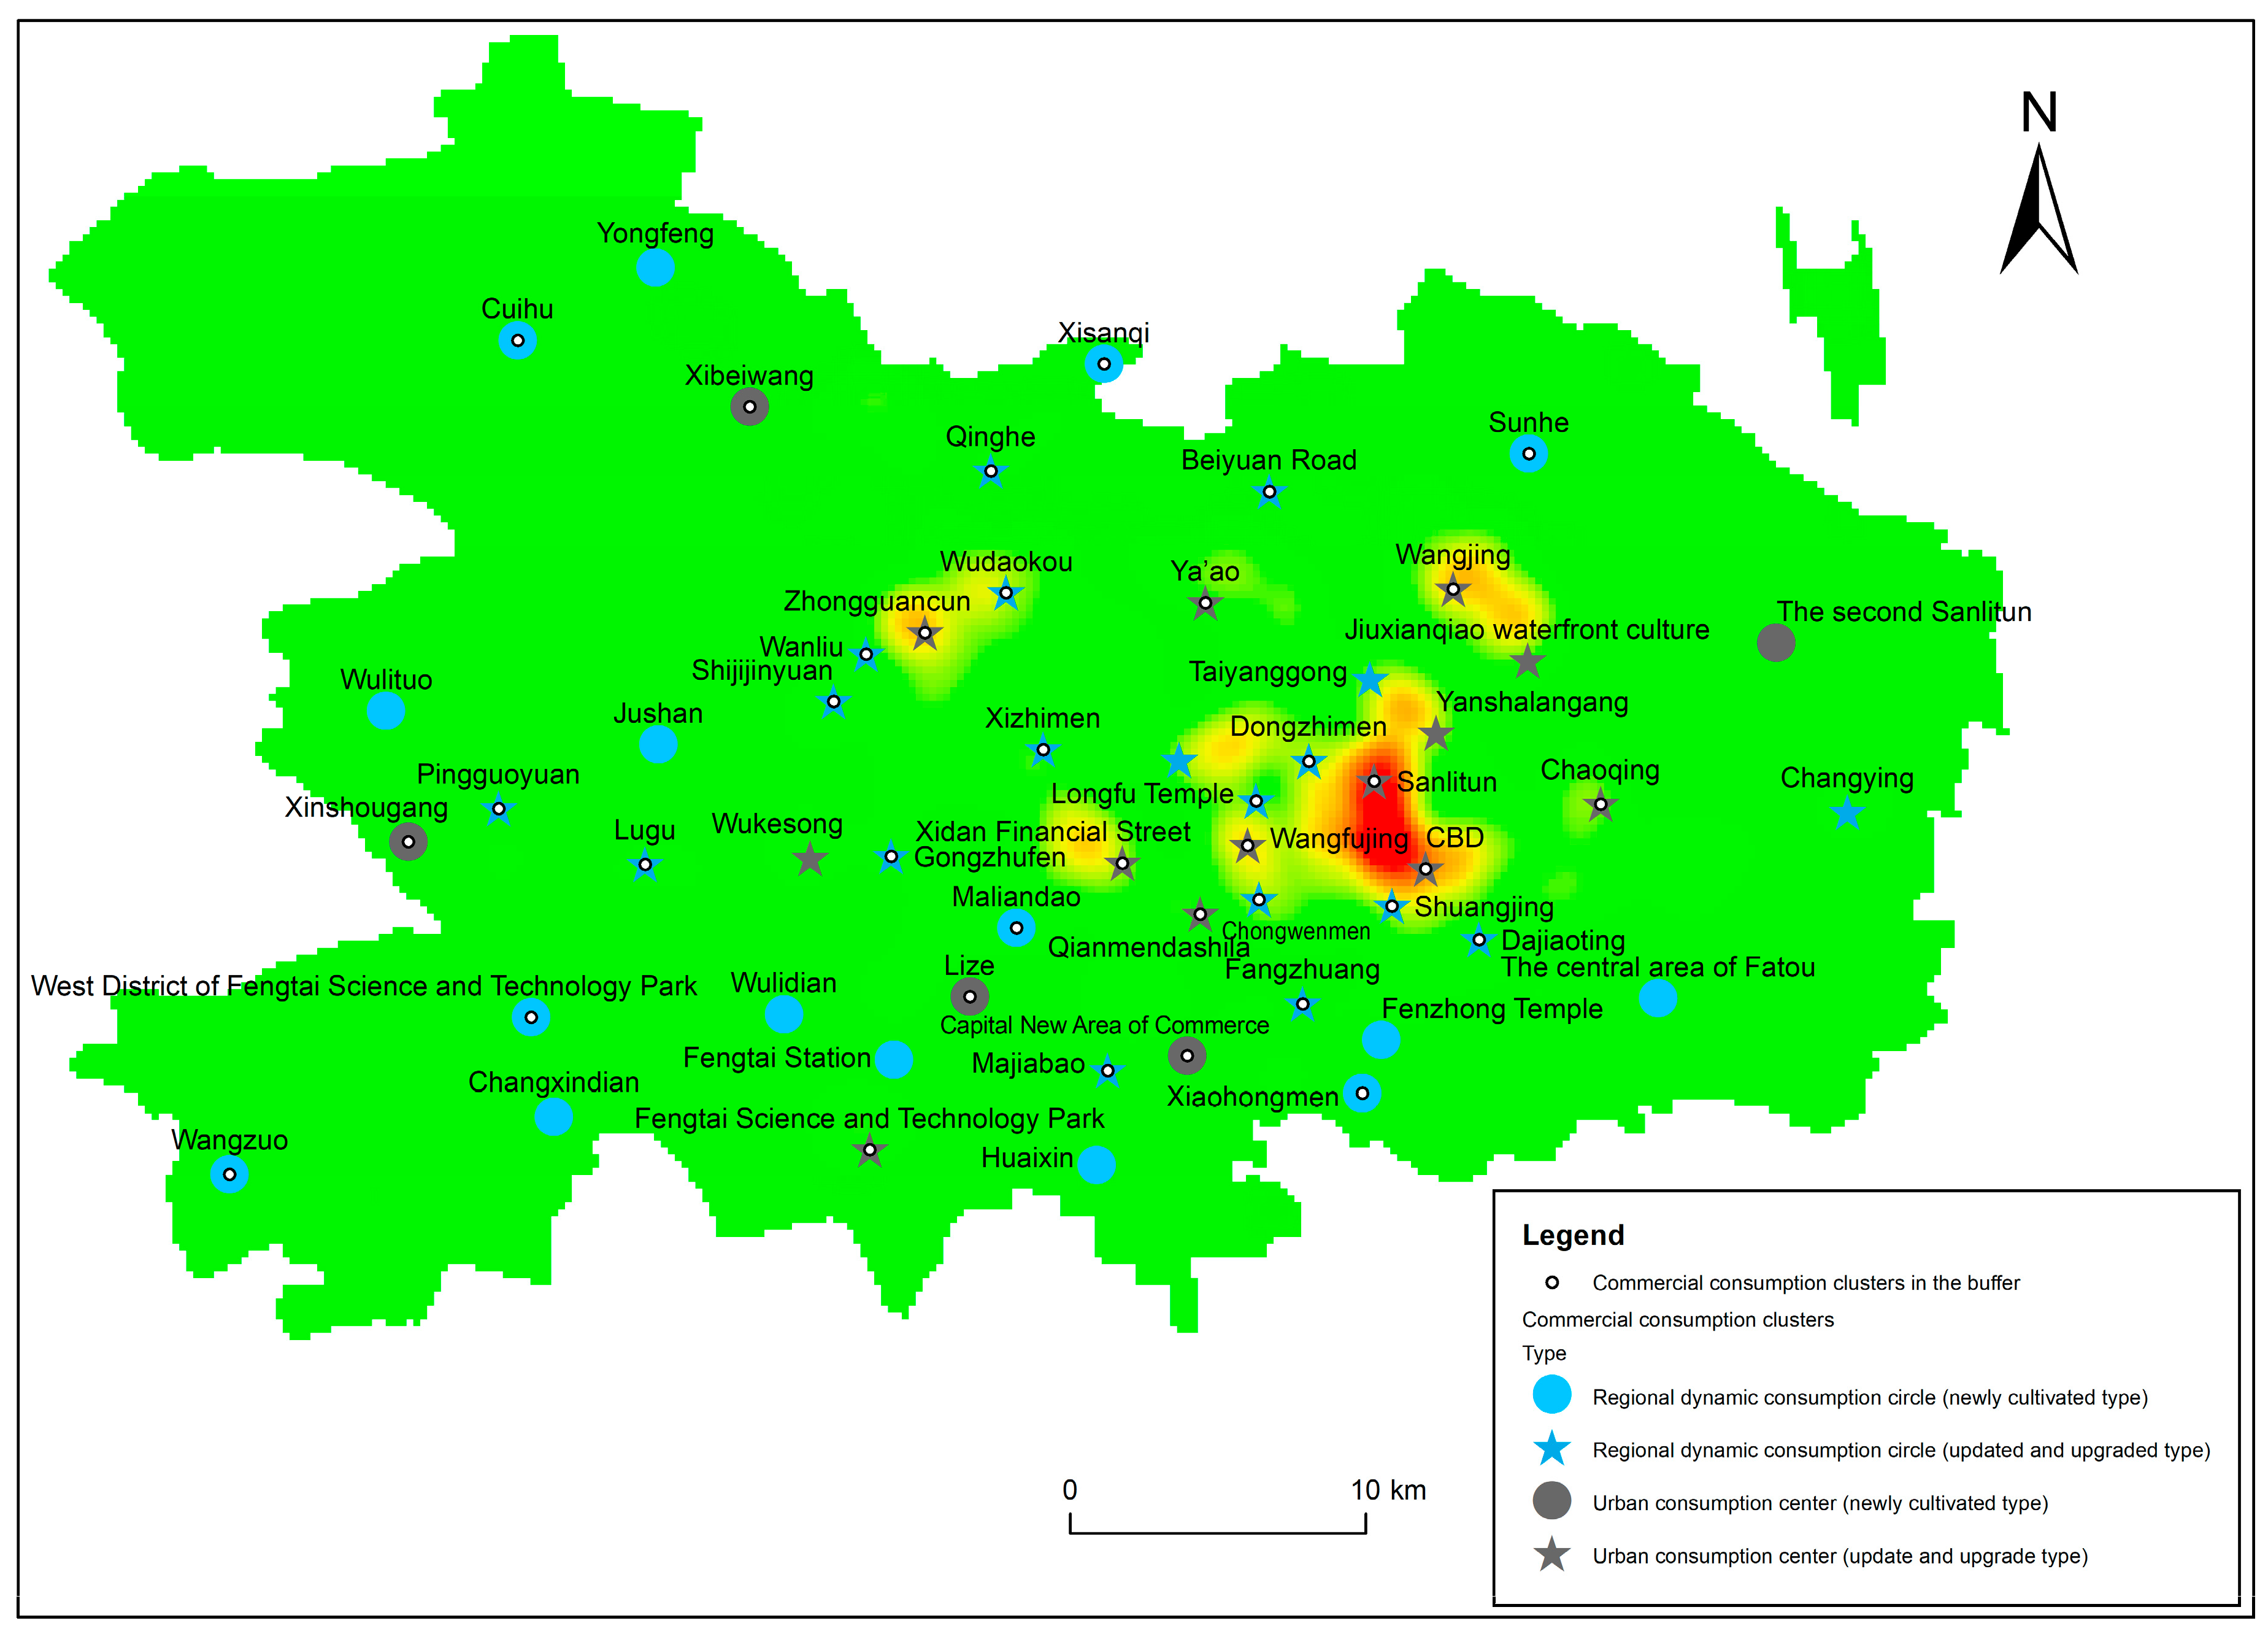
3.3.2. Forecast Results of Commercial Consumption Space
- (1)
- The distribution relationship between the commercial consumption agglomeration area and coffee shops
- (2)
- Predicting the success of commercial consumption clusters
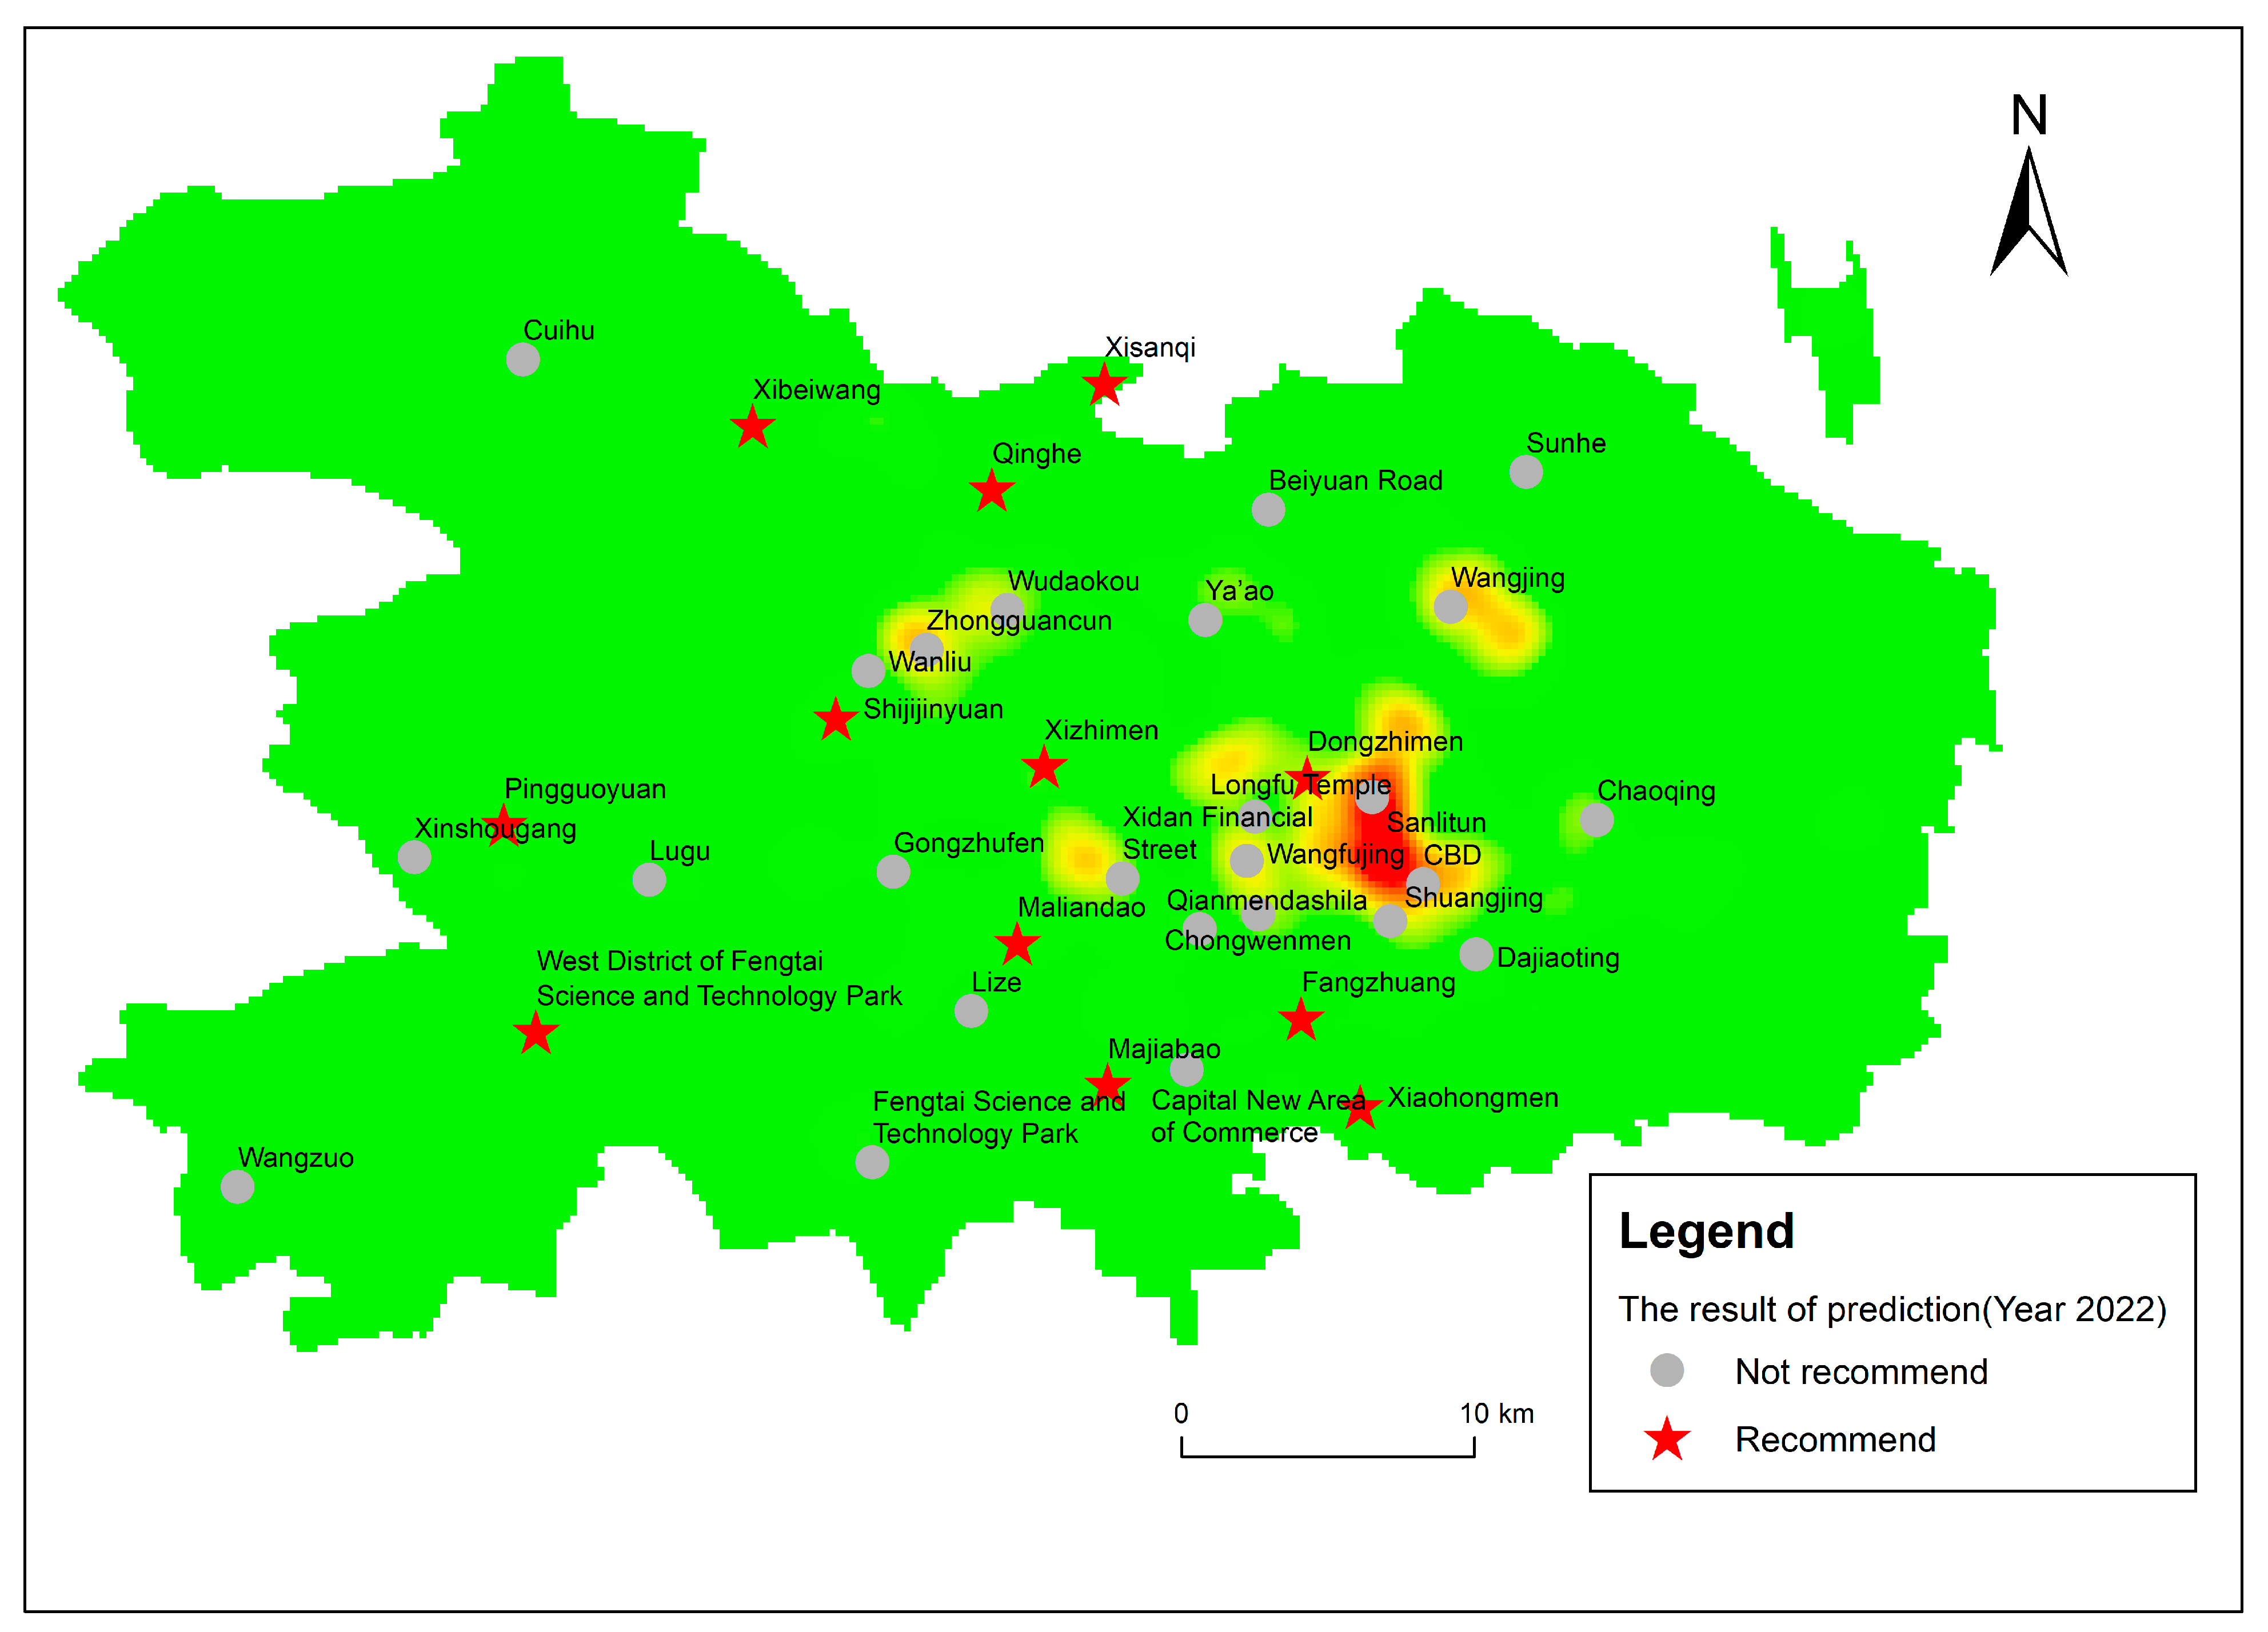
3.3.3. Site Selection Advice
4. Discussion
4.1. Effect of Feature Factors
4.2. Discussion on the Forecast Results of the Business Circle
4.3. Shortcomings of the Present Study
5. Conclusions and Recommendations
- Coffee shops in the main urban area of Beijing have obvious spatial distribution characteristics; they are mainly distributed in areas less than 12 km away from the center of the city and no more than 150 m away from the main roads. They have a high correlation with the relatively mature commercial consumption cluster areas and present a clustered distribution around the commercial consumption cluster areas.
- The RF model was the best model in this study before and after establishing the buffer zone; it outperformed the GD method and the OLS model in accuracy. Utilizing the collected multi-source geospatial data, the kernel density of coffee shops was predicted and accurately evaluated based on RF. The predicted value of the kernel density of each sampling point was obtained. After examination, the models had high accuracy for the data in different years. Taking 2020 as an example, the R2 with and without the buffer analysis was 0.929 and 0.915, respectively.
- The following conclusions are drawn based on the suitability and feasibility of the RF model. Without the RF model incorporating the main road buffer, the actual prediction success rate was 73.58%; with the RF model incorporating the main road buffer, the actual prediction success rate was 72.97%. In terms of the prediction success rate, there was little difference. However, considering that the buffer zone analysis had screened out a considerable part of the low-probability distribution areas of coffee shops, we believe that this method eliminated some areas that were not suitable locations for coffee shops. Therefore, we recommend using the RF model with the major road buffer analysis for site selection. For the success rate of site selection prediction, a business circle that is still in the development stage has a higher success rate in site selection prediction compared with a core business circle.
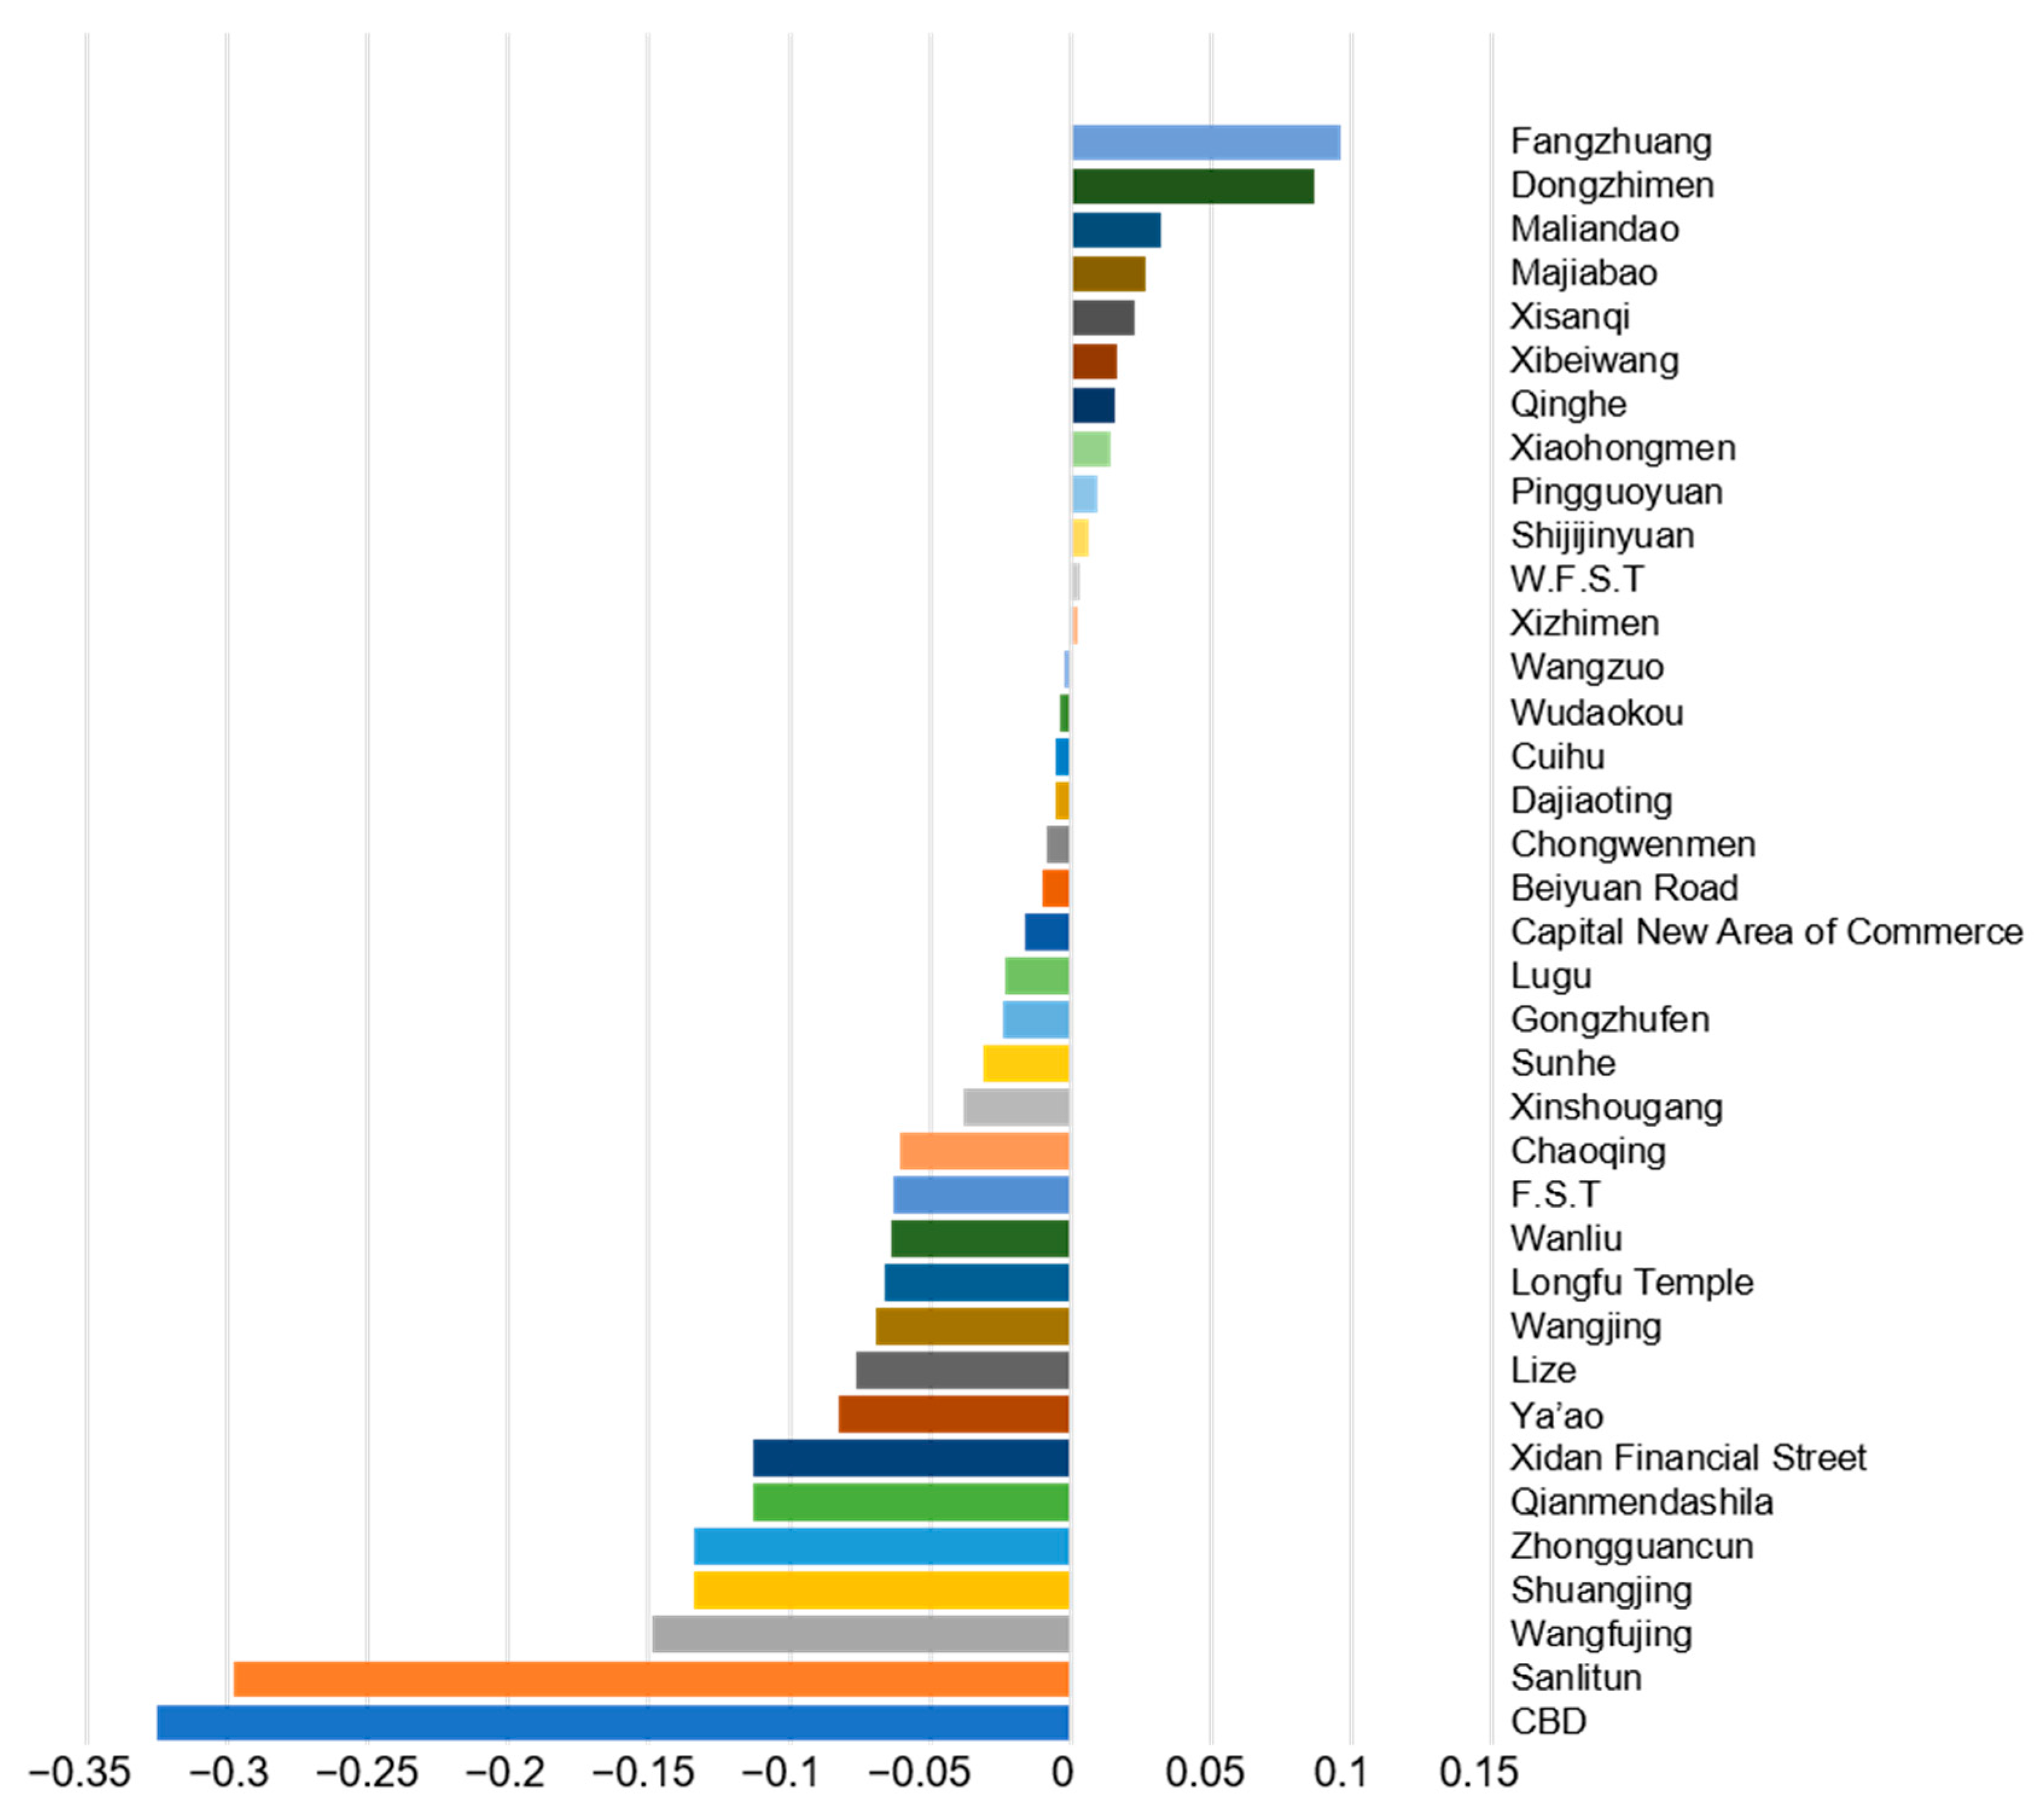
- The following conclusions were drawn after the suitability and feasibility of the RF model were demonstrated. Considering the research practicality, accuracy, and the feasibility of data acquisition, we decided to select the commercial consumption agglomeration area in 2022 for site selection analysis. The top 10 commercial consumption clusters were Fangzhuang, Dongzhimen, Malandao, Majiabao, Xisanqi, Xibeiwang, Qinghe, Xiaohongmen, Pingguoyuan, and Shijijinyuan.
- For more mature commercial areas, the kernel density of coffee shops has reached a fairly high level, and if they continue to be located in these areas, they may face great competitive pressure from peers. According to the commercial space planned by the city, the selection of new nurturing commercial spaces under construction with great development potential will be conducive to the development of new stores.
- For machine learning regression models such as RF and GD, the characteristic importance of different influencing factors can be given. We can first apply the possible influencing factors to the model training and then conduct the model training again after screening out the less important factors, so as to obtain the factors that have a greater impact on the location of a store and obtain higher model accuracy.
- As this model is a complex model established by multiple factors involving multi-source data, the model established under two time snapshots has been verified, and the accuracy testing of the model has obtained reliable results, so this model has strong portability. When the reader needs to use this model, the data under the latest time node of the research area can be used to obtain a better site selection effect.
- The location selection of commercial stores in the city will involve the influence of various factors in the city, such as the degree of commercial aggregation, distance from the road, market saturation, and other factors. In the construction of the location selection model, comprehensive consideration of the influence of these factors will improve the prediction accuracy of the model.
Author Contributions
Funding
Data Availability Statement
Conflicts of Interest
References
- Ferreira, J.; Ferreira, C. Challenges and opportunities of new retail horizons in emerging markets: The case of a rising coffee culture in China. Bus. Horiz. 2018, 61, 783–796. [Google Scholar] [CrossRef]
- Zheng, M.F.; Bai, Y.T.; Guo, X.Y.; Cui, L.X. Exploration of the Business Model of the Coffee Industry in the Context of New Retail: Taking Lucky Coffee as an Example. Chin. Mark. 2019, 17, 60–61. [Google Scholar] [CrossRef]
- Zheng, J.L.; Wang, X.Y.; Yang, Z.H.; Zhu, X.Q. The Chinese Coffee Market and Its Consumer Behavior. J. Huzhou Univ. 2022, 44, 84–89. [Google Scholar]
- Yi, P.; Li, W.; Zhang, D. Sustainability assessment and key factors identification of first-tier cities in China. J. Clean. Prod. 2021, 281, 125369. [Google Scholar] [CrossRef]
- Ferreira, J.; Ferreira, C.; Bos, E. Spaces of consumption, connection, and community: Exploring the role of the coffee shop in urban lives. Geoforum 2021, 119, 21–29. [Google Scholar] [CrossRef]
- Shi, Y.S.; Yang, F.L. Features of Spatial Distribution and Impacting Factors of Starbucks in Shanghai. Ecnomic Geogr. 2018, 38, 126–132. [Google Scholar] [CrossRef]
- Zhou, Y.; He, X.; Zikirya, B. Boba Shop, Coffee Shop, and Urban Vitality and Development—A Spatial Association and Temporal Analysis of Major Cities in China from the Standpoint of Nighttime Light. Remote Sens. 2023, 15, 903. [Google Scholar] [CrossRef]
- Barnes, T.; Minca, C. Nazi Spatial Theory: The Dark Geographies of Carl Schmitt and Walter Christaller. Ann. Assoc. Am. Geogr. 2013, 103, 669–687. [Google Scholar] [CrossRef]
- Narvaez, L.; Penn, A.; Griffiths, S. The social and economic significance of urban form: A configurative thinking using bid rent theory. In New Urban Configurations; IOS Press: Amsterdam, The Netherlands, 2014; pp. 551–558. [Google Scholar] [CrossRef]
- Kuo, R.J.; Chi, S.C.; Kao, S.S. A decision support system for selecting convenience store location through integration of fuzzy AHP and artificial neural network. Comput. Ind. 2002, 47, 199–214. [Google Scholar] [CrossRef]
- Hsieh, C.M.; Chang, H.J.; Yang, F.M. Acquiring an Optimal Retail Chain Location in China. In Proceedings of the 2nd International Conference on Information Science and Control Engineering, Shanghai, China, 24–26 April 2015; pp. 96–99. [Google Scholar]
- Dolega, L.; Pavlis, M.; Singleton, A. Estimating attractiveness, hierarchy and catchment area extents for a national set of retail centre agglomerations. J. Retail. Consum. Serv. 2016, 28, 78–90. [Google Scholar] [CrossRef]
- Nwogugu, M. Site selection in the US retailing industry. Appl. Math. Comput. 2006, 182, 1725–1734. [Google Scholar] [CrossRef]
- Church, R.L. Geographical information systems and location science. Comput. Oper. Res. 2002, 29, 541–562. [Google Scholar] [CrossRef]
- Hernandez, T. Enhancing retail location decision support: The development and application of geovisualization. J. Retail. Consum. Serv. 2006, 14, 249–258. [Google Scholar] [CrossRef]
- Lin, G.; Chen, X.; Liang, Y. The location of retail stores and street centrality in Guangzhou, China. Appl. Geogr. 2018, 100, 12–20. [Google Scholar] [CrossRef]
- Huang, Q.; Yang, B.; Xu, X.; Hao, H.; Liang, L.; Wang, M. Location Selection and Prediction of SexyTea Store in Changsha City Based on Multisource Spatial Data and Random Forest Model. J. Geo-Inf. Sci. 2022, 24, 723–737. [Google Scholar] [CrossRef]
- Yee, H.-J.; Ting, C.-Y.; Ho, C.C. Retail Site Selection using Machine Learning Algorithms. Int. J. Recent Technol. Eng. (IJRTE) 2019, 8, 2422–2431. [Google Scholar] [CrossRef]
- Wang, Y.X.; Li, S.; Zhang, X.; Jiang, D.; Hao, M.M.; Zhou, R. Site Selection of Digital Signage in Beijing: A Combination of Machine Learning and an Empirical Approach. ISPRS Int. J. Geo-Inf. 2020, 9, 217. [Google Scholar] [CrossRef]
- Xu, M.; Wang, T.; Wu, Z.; Zhou, J.; Li, J.; Wu, H. Demand Driven Store Site Selection via Multiple Spatial-temporal Data. In Proceedings of the 24th ACM SIGSPATIAL International Conference on Advances in Geographic Information Systems, Burlingame, CA, USA, 31 October–3 November 2016. [Google Scholar]
- Jin, A.; Li, G.; Wang, J.; Mehmood, M.S.; Yu, Y.; Lin, Z. Location choice and optimization of development of community- oriented new retail stores: A case study of Freshippo stores in Nanjing City. Prog. Geogr. 2020, 39, 2013–2027. [Google Scholar] [CrossRef]
- Beijing Municipal Bureau of Statistics, Beijing Survey Brigade of the National Bureau of Statistics. Beijing Regional Statistical Yearbook 2021; China Statistics Press: Beijing, China, 2021; p. 236. [Google Scholar]
- Zhen, F.; Yu, Y.; Wang, X.; Zhao, L. The Spatial Agglomeration Characteristics of Automotive Service Industry: A Case Study of Nanjing. Sci. Geogr. Sin. 2012, 32, 1200–1208. [Google Scholar] [CrossRef]
- Naixia, M.; Rongzheng, Y.; Tengfei, Y.; Hengcai, Z.; Jinwen, T.; Teemu, M. Exploring spatio-temporal changes of city inbound tourism flow: The case of Shanghai, China. Tour. Manag. 2019, 76, 103955. [Google Scholar]
- Zha, A.; Xu, N.; Hou, Z. Research on the suitability of micro-location of budget hotel: A case study on Jinjiang inn in Shanghai central city. Hum. Geogr. 2017, 32, 152–160. [Google Scholar] [CrossRef]
- Han, Z.; Cui, C.; Miao, C.; Wang, H.; Chen, X. Identifying Spatial Patterns of Retail Stores in Road Network Structure. Sustainability 2019, 11, 4539. [Google Scholar] [CrossRef]
- Yu, Y.; Li, G.; Jin, A.; Lin, Z.; Xiaoqing, S. Spatial distribution and influencing factors of community-oriented new retail stores: A case study of Freshippo stores in Chengdu city. J. Shaanxi Norm. Univ. (Nat. Sci. Ed.) 2021, 49, 86–97. [Google Scholar] [CrossRef]
- Borruso, G. Network Density Estimation: A GIS Approach for Analysing Point Patterns in a Network Space. Trans. GIS 2008, 12, 377–402. [Google Scholar] [CrossRef]
- Parvin, F.; Hashmi, S.N.I.; Ali, S.A. Appraisal of infrastructural amenities to analyze spatial backwardness of Murshidabad district using WSM and GIS-based kernel estimation. GeoJournal 2019, 86, 19–41. [Google Scholar] [CrossRef]
- Chainey, S.P. Examining the influence of cell size and bandwidth size on kernel density estimation crime hotspot maps for predicting spatial patterns of crime. Bull. Geogr. Soc. Liege 2013, 60, 7–19. [Google Scholar]
- Liu, X.N.; Wang, P.; Guan, L.; Lu, H.; Zhang, C.X. GIS Spatial Analysis; Science Press: Beijing, China, 2017; p. 259. [Google Scholar]
- Statistics, L.B.; Breiman, L. Random forests. Mach. Learn. 2001, 45, 5–32. [Google Scholar] [CrossRef]
- Wang, J.F.; Liao, Y.L.; Liu, X. A Tutorial on Spatial Data Analysis; Science Press: Beijing, China, 2019; p. 270. [Google Scholar]
- Li, X.H. Using “random forest”for classification and regression. Chin. J. Appl. Entomol. 2013, 50, 1190–1197. [Google Scholar] [CrossRef]
- SPSSPRO. Scientific Platform Serving for Statistics Professional 2021. Available online: https://www.spsspro.com (accessed on 3 April 2023).
- Zhou, Z.H. Machine Learning; Tsinghua University Press: Beijing, China, 2016. [Google Scholar]
- Wang, S.B. Solving Multiple Linear Regression Equation Based on Improved Gradient Descent Method. Math. Pract. Theory 2022, 52, 167–172. [Google Scholar]
- Pitalúa-Díaz, N.; Arellano-Valmaña, F.; Ruz-Hernandez, J.A.; Matsumoto, Y.; Alazki, H.; Herrera-López, E.J.; Hinojosa-Palafox, J.F.; García-Juárez, A.; Pérez-Enciso, R.A.; Velázquez-Contreras, E.F. An ANFIS-Based Modeling Comparison Study for Photovoltaic Power at Different Geographical Places in Mexico. Energies 2019, 12, 2662. [Google Scholar] [CrossRef]
- Peng, Z.Y.; Xia, H.Q. Linear regression-gradient descent algorithm for passive radar target tracking. Electron. Meas. Technol. 2019, 42, 1–6. [Google Scholar] [CrossRef]
- Teng, W. Point Pattern Analysis of the Commercial Facilities Vitality Based on Social Network. Ph.D. Thseis, Wuhan University, Wuhan, China, 2017. [Google Scholar]
- Tang, Q.S.; Xu, H. Model of the maximum number of people gathered in a bus terminal considering the non-linear effect of the built environment. J. Chongqing Univ. Technol. (Nat. Sci.) 2022, 36, 6. [Google Scholar] [CrossRef]
- Zhao, Y.S. Principles and Methods of Remote Sensing Application Analysis, 2nd ed.; Social Sciences Academic Press: Beijing, China, 2013. [Google Scholar]
- Kwan, C.; Chou, B.; Hagen, L.; Perez, D.; Shen, Y.; Li, J.; Koperski, K. Change detection using Landsat and Worldview images. In Proceedings of the SPIE—Algorithms, Technologies, and Applications for Multispectral and Hyperspectral Imagery XXV, Baltimore, MD, USA, 14–18 April 2019; Volume 10986. [Google Scholar] [CrossRef]
- Zhang, Y.J.; Zhao, Y.T. Spatial Layout Characteristics of Cafes from the Perspective of Urban Leisure Culture. J. Harbin Univ. 2021, 42, 107–110. [Google Scholar]
- Zhang, X.S. The Structural Transformation of Public Sphere in Vitorian Period. Master’s Thesis, Lanzhou University, Lanzhou, China, 2012. [Google Scholar]


| Item | Data Sources | Spatial Resolution | Data Description |
|---|---|---|---|
| POI data | Amap API Data Open Interface (https://lbs.amap.com) (accessed on 1 December 2020 and 1 December 2022) | - | Obtained 20 types of POI data in the main urban area |
| Population density data | LandScan (https://landscan.ornl.gov) (accessed on 1 December 2020 and 1 December 2021) | 1 km | Due to the limitation of data sources, the population density data in 2022 were replaced by the 2021 data |
| Housing price data | Beijing Lianjia Network (https://bj.lianjia.com) (accessed on 1 December 2022) | - | Obtained using crawler technology, the listing price/floor area, and interpolation |
| Night light data | The Earth Observation Group (https://eogdata.mines.edu/products/vnl/) (accessed on 1 December 2020 and 1 December 2022) | 15 arcseconds (Equator ~500 m) | In order to avoid the impact of COVID-19, monthly synthetic products were used, and September images were selected |
| Road network data | OpenStreetMap (OSM) (https://www.openstreetmap.org) (accessed on 1 December 2020 and 1 December 2022) | - | Five categories—primary, secondary, tertiary, motorway, and trunk—were identified as major urban roads, and the correlation between store distribution and roads was studied |
| Administrative division data | Beijing Municipal Geographic Information Public Service Platform (https://beijing.tianditu.gov.cn) (accessed on 5 December 2022) | - | Obtained the latest version of the Beijing city and the central city standard base map |
| Business layout planning data | Beijing Municipal People’s Government (https://www.beijing.gov.cn/) (accessed on 5 December 2022) | - | The special plan for commercial consumption space layout in Beijing (2022–2035) was used to obtain the dynamic consumption circle data of the urban consumption center of the main urban area |
| 2020 | 2022 | 2020 | 2022 | ||
|---|---|---|---|---|---|
| Catering services | 62,639 | 73,332 | Service for life | 92,156 | 89,043 |
| Road-affiliated facilities | 1380 | 91 | Event activities | 6 | 13 |
| Famous scenery | 5418 | 6991 | Inside plant | 11 | 7 |
| Communal facilities | 13,553 | 11,226 | Sports and leisure services | 14,512 | 17,974 |
| Incorporated business | 87,651 | 55,815 | Access facilities | 37,901 | 52,412 |
| Shopping services | 123,289 | 115,041 | Healthcare services | 15,339 | 17,919 |
| Transportation facilities services | 54,676 | 57,890 | Government agencies and social organizations | 33,123 | 31,300 |
| Financial insurance services | 12,891 | 10,017 | Accommodation services | 18,821 | 9919 |
| Science, education, and culture services | 48,400 | 38,959 | Car-related | 13,436 | 13,087 |
| Motorcycle service | 438 | 576 | Commercial residence | 33,940 | 25,332 |
| Sum | 669,580 | 626,944 |
| Feature | Name | Handling Method |
|---|---|---|
| X1 | Sports and leisure services | The result of KDE of POI data |
| X2 | Commercial residence | |
| X3 | Catering services | |
| X4 | Financial insurance services | |
| X5 | Motorcycle service | |
| X7 | Car-related | |
| X9 | Communal facilities | |
| X10 | Transportation facilities services | |
| X11 | Science, education, and culture services | |
| X12 | Road-affiliated facilities | |
| X13 | Famous scenery | |
| X14 | Event activities | |
| X15 | Healthcare services | |
| X16 | Incorporated business | |
| X17 | Service for life | |
| X18 | Inside plant | |
| X19 | Government agencies and social organizations | |
| X20 | Shopping services | |
| X22 | Access facilities | |
| X23 | Accommodation services | |
| X8 | Average house prices | The grid data are obtained by Kriging interpolation of discrete housing price points |
| X6 | Night lights | Use raw raster data |
| X21 | Density of population |
| Sampling Number | Recall | Precision | F1 | |
|---|---|---|---|---|
| Training set | 3854 | 0.924 | 0.922 | 0.921 |
| Test set | 1653 | 0.895 | 0.887 | 0.888 |
| MSE | RMSE | MAE | R2 | |
|---|---|---|---|---|
| Before pruning | 0.001 | 0.029 | 0.015 | 0.907 |
| MSE | RMSE | MAE | R2 | ||
|---|---|---|---|---|---|
| Before buffer analysis | RF | 0.001 | 0.029 | 0.015 | 0.915 |
| GD | 0.001 | 0.037 | 0.021 | 0.873 | |
| OLS | - | - | - | 0.859 | |
| Distance/m | (0,50) | (50,100) | (100,150) | (150,200) | (200,+∞) |
|---|---|---|---|---|---|
| Counts | 893 | 737 | 302 | 147 | 303 |
| Cumulative ratio | 37.49 | 68.43 | 81.11 | 87.28 | 100.00 |
| MSE | RMSE | MAE | R2 | ||
|---|---|---|---|---|---|
| After buffer analysis | RF | 0.001 | 0.035 | 0.021 | 0.929 |
| GD | 0.002 | 0.041 | 0.027 | 0.893 | |
| OLS | - | - | - | 0.872 |
| MSE | RMSE | MAE | R2 | |
|---|---|---|---|---|
| Before pruning | 0.001 | 0.03 | 0.016 | 0.907 |
| After pruning without buffer | 0.001 | 0.028 | 0.015 | 0.920 |
| After creating the buffer zone | 0.001 | 0.035 | 0.02 | 0.921 |
| Average Kernel Density | |
|---|---|
| Main urban area | 16.35 |
| Commercial consumption clusters | 49.21 |
| Commercial consumption clusters (updated and upgraded type) | 78.27 |
| Commercial consumption clusters (newly cultivated type) | 4.92 |
| 2020 | 2022 | ||
|---|---|---|---|
| Influencing factors | Incorporated business | - | 0.184 |
| Accommodation services | - | 0.065 | |
| Financial insurance services | 0.589 | 0.534 | |
| Sports and leisure services | 0.441 | 0.466 | |
| Catering services | 0.207 | 0.081 | |
| Communal facilities | 0.143 | 0.152 | |
| Commercial residence | 0.110 | 0.072 | |
| Science, education, and culture services | 0.099 | −0.008 | |
| Famous scenery | 0.056 | 0.060 | |
| Average house prices | 0.023 | 0.038 | |
| Event activities | 0.017 | −0.049 | |
| Night lights | −0.005 | 0.055 | |
| Road-affiliated facilities | −0.012 | 0.010 | |
| Car-related | −0.023 | −0.053 | |
| Motorcycle service | −0.034 | - | |
| Transportation facilities services | −0.151 | −0.226 | |
| Healthcare services | −0.183 | −0.146 | |
| Accuracy evaluation | MSE | 0.001 | 0.001 |
| RMSE | 0.037 | 0.037 | |
| MAE | 0.021 | 0.022 | |
| R2 | 0.873 | 0.879 |
Disclaimer/Publisher’s Note: The statements, opinions and data contained in all publications are solely those of the individual author(s) and contributor(s) and not of MDPI and/or the editor(s). MDPI and/or the editor(s) disclaim responsibility for any injury to people or property resulting from any ideas, methods, instructions or products referred to in the content. |
© 2023 by the authors. Licensee MDPI, Basel, Switzerland. This article is an open access article distributed under the terms and conditions of the Creative Commons Attribution (CC BY) license (https://creativecommons.org/licenses/by/4.0/).
Share and Cite
Zhao, J.; Zong, B.; Wu, L. Site Selection Prediction for Coffee Shops Based on Multi-Source Space Data Using Machine Learning Techniques. ISPRS Int. J. Geo-Inf. 2023, 12, 329. https://doi.org/10.3390/ijgi12080329
Zhao J, Zong B, Wu L. Site Selection Prediction for Coffee Shops Based on Multi-Source Space Data Using Machine Learning Techniques. ISPRS International Journal of Geo-Information. 2023; 12(8):329. https://doi.org/10.3390/ijgi12080329
Chicago/Turabian StyleZhao, Jiaqi, Baiyi Zong, and Ling Wu. 2023. "Site Selection Prediction for Coffee Shops Based on Multi-Source Space Data Using Machine Learning Techniques" ISPRS International Journal of Geo-Information 12, no. 8: 329. https://doi.org/10.3390/ijgi12080329
APA StyleZhao, J., Zong, B., & Wu, L. (2023). Site Selection Prediction for Coffee Shops Based on Multi-Source Space Data Using Machine Learning Techniques. ISPRS International Journal of Geo-Information, 12(8), 329. https://doi.org/10.3390/ijgi12080329