Abstract
South Manitou Island, part of Sleeping Bear Dunes National Lakeshore in northern Lake Michigan, is a post-glacial lacustrine landscape with substantial geomorphic changes including landslides, shoreline and bluff retreat, and sand dune movement. These changes involve interrelated processes, and are influenced to different extents by lake level, climate change, and land use patterns, among other factors. The utility of DEM of Difference (DoD) and other terrain analyses were investigated as a means of understanding interrelated geomorphologic changes and processes across multiple decades and at multiple scales. A 1m DEM was developed from 1955 historical aerial imagery using Structure from Motion Multi-View Stereo (SfM-MVS) and compared to a 2016 lidar-based DEM to quantify change. Landslides, shoreline erosion, bluff retreat, and sand dune movement were investigated throughout South Manitou Island. While the DoD indicates net loss or gain, interpretation of change must take into consideration the SfM-MVS source of the historical DEM. In the case of landslides, where additional understanding may be gleaned through review of the timing of lake high- and lowstands together with DoD values. Landscape-scale findings quantified cumulative feedbacks between interrelated processes. These findings could be upscaled to assess changes across the entire park, informing future change investigations and land management decisions.
1. Introduction
Geomorphic change has occurred more or less continually for thousands of years in the dynamic post-glacial surficial terrain of northern Michigan [1,2,3]. The region’s surficial geology consists of a variety of unconsolidated sediments deposited by ice and water during, and following, the last glacial maximum (LGM). Extreme climate changes at the end of the LGM caused episodic advance and retreat of the southern glacial margin, extreme high and low lake levels, and isostatic rebound from glacial retreat [1,2,4]. These drivers, together with a variety of physical processes, act upon the layers of unconsolidated glacial deposits, resulting in the present-day geomorphology of the Great Lakes. While others have documented this regional-scale geomorphology [2,5,6,7], local-scale geomorphology and contemporary terrain changes have not been mapped.
Post-Holocene drivers of geomorphic change on the islands of northern Lake Michigan include fluctuations in Lake Michigan’s water level [8], seasonal wind flow patterns [9], and annual lake ice extent [3]. While coastal geomorphic processes dominate today [5,10,11,12,13,14,15,16], other relevant environmental drivers such as extreme weather events [17], fluctuations in soil moisture (e.g., due to drought), and freeze-thaw patterns [18] may be linked to contemporary climate change trends [8,19,20]. A detailed, quantitative, and spatially distributed understanding of geomorphology and contemporary terrain changes is needed to map hazards, anticipate anthropogenic impacts, and plan for the potential ramifications of climate change [21,22].
This study seeks to quantitatively map geomorphic change in northern Lake Michigan for a multi-decadal time-period using remote sensing and geospatial analysis. Digital elevation model (DEM) differencing is a well-established method of quantifying net terrain change, wherein two raster-based elevation models covering the same geographic area are compared by subtracting one from the other; the values of the resultant raster indicate change in the elevation of the modeled surface [23,24]. The method has been widely used for a multitude of applications, including quantifying fluvial geomorphology [25,26,27,28], beach erosion [29,30], mass wasting [31,32], glacier mass balance [33,34], and anthropogenic geomorphic change in urban spaces [35], just to name a few. While the advent of Structure from Motion Multi-View Stereo (SfM-MVS, commonly referred to as just ‘SfM’) image processing [36] has made possible and approachable the creation of fine-resolution historical DEMs from archival aerial imagery [37,38,39,40,41], the accuracy and consistency of the derived DEMs may complicate the direct interpretation of change from (DEM of Difference) DoD results [36,42,43,44]. Nevertheless, remote sensing analysis of historical aerial photographs and derivative terrain data can enable quantitative, detailed, and spatially distributed investigations of change at a range of spatial scales and on a time scale relevant to human actions.
This paper presents an investigation of terrain changes on South Manitou Island, Michigan (Figure 1), as a case study in quantifying geomorphic change over multi-decadal timeframes in post-glacial terrain. A short review of the area’s geology is given to provide information about the longer, geologic-timeframe changes associated with the underlying stratigraphic landscape; these geologic details are also relevant to the surficial processes affecting South Manitou Island on contemporary timescales. The latter are also briefly described in the subsequent section, with a focus on the specific subset of factors that affect the island in the present. For this study, terrain change processes are categorized into four interrelated geomorphologic factors: (1) shoreline change, (2) coastal bluff retreat, (3) landslide activity, and (4) sand dune movement.
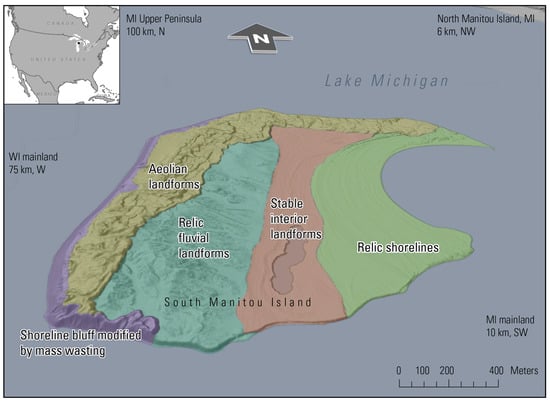
Figure 1.
Geomorphic regions of South Manitou Island, the westernmost of two islands in Sleeping Bear Dunes National Lakeshore, MI, located at the southwestern end of a chain of islands in northern Lake Michigan. The Michigan mainland is located 10 km to the southwest.
1.1. Geology of Northern Michigan, USA
The island’s surficial geology consists of glacial and post-glacial deposits. Though detailed mapping and descriptions of these units is still in progress, informative descriptions of the surficial geology on the nearby mainland are available [2]. Visualization of the island’s terrain (Figure 1) highlights specific regions of glacial- and post-glacial geomorphology. Across the entire extent of South Manitou Island, an approximately 100-m-thick sequence of late Wisconsin age glacial deposits [45,46] overlies deeply buried Devonian sedimentary rock units, likely composed of Traverse Group, Antrim Shale, and Ellsworth Shale [47]. The glacial deposits are mostly ice-contact deposits such as kames or kame terraces overlying diamicton at depth [48]. These glacial deposits are exposed at the surface in the fluvially eroded west-central interior of the island, where more recent alluvium fills stream valleys, and on denuded bluffs along on the south, west, and north shores of the island. Post-glacial deposits formed from fluctuations in Lake Michigan water levels following glacial retreat from the area and subsequent aeolian, fluvial, and mass-wasting processes. A north-trending scarp splits the island nearly in half and demarcates the coverage of glacial Lake Algonquin over the eastern part of the island. Eastern South Manitou Island is covered by a veneer of historical shoreline sediments and lacustrine deposits that range in age from 13,000 cal years B.P. (Algonquin) to present [1], the most notable landforms being the arcuate beach ridges that surround a prominent bay. Aeolian dunes and sheet sands cover most of the highland areas in the western and northern parts of the island. An ongoing pattern of dune-building and stabilization is believed to have initiated about 5000 14C years B.P. [1]. Alluvial fans occur in some locations along the shoreline of the island and are particularly persistent landforms where their source areas are drainage basin higher up in the bluff. Alluvial fans, as well as landslide and colluvial deposits, located at the base of the bluffs are more transitory in nature and are typically eroded or modified during lake highstands. Since the final deglaciation in the region, the island has experienced isostatic rebound and an assortment of geomorphic changes related to changing shoreline and climate. Isostatic rebound has led to an elevational increase of over 10 m on some parts of the island over the past 13,000 years and has resulted in the prominent hanging drainage basin observed in the southwestern corner of the island. Wave-cut action during glacial and post-glacial lake highstands eroded glacial headlands, collectively forming the bluffs that shape the perimeter of much of the current shoreline, and changed the morphology of the eastern part of the island. Inland scarps on South Manitou Island are associated with both glacial Lake Algonquin [9] and the Holocene (Nipissing) highstand at approximately 5000 14C years B.P. [49]. In the present, pluvials result in greater erosion of shoreline bluffs and subsequent shallow, mostly translational landslides in the lower slope. The historic highstand that occurred in October 1986 (177.5 m) was nearly surpassed by the penultimate height in July 2020 (177.46 m) (see Supplemental SA: lake levels over time) that resulted in new lower bluff slope failures. The denuded nature of the bluffs on the western edge of the island indicates that, in combination with landslide activity higher on the bluff slopes associated with hydrologic triggers, wave cutting is of sufficient magnitude and frequency to prevent revegetation.
1.2. Geomorphic Processes on South Manitou Island
At the intersection between the lake surface and the terrain surface, the shoreline is a linear feature that characterizes the transition from dry land to water, with the understanding that the terrain surface continues beneath the water [50]. Changes in water level can drastically modify the extent and location of the shoreline, with significant implications for land management and the built environment. Today, South Manitou Island’s shoreline is influenced by the presence of large, steeply sloped bluffs, unconsolidated shoreline sediments, wave and storm exposure [51,52,53,54,55], seasonal offshore currents that accelerate longshore sediment transport [56], episodically high lake levels, and the recent absence of lake ice during winter storms [3].
Bluff retreat and landslides are intrinsically tied to shoreline change and occur along much of Lake Michigan’s coastline [57], with significant implications for property and infrastructure damage [58]. Throughout this greater region, unconsolidated surface sediments are subject to wave erosion, fluvial erosion, precipitation events, local groundwater variability, and seasonal freeze-thaw cycles [3,18,56,59]. Wave erosion destabilizes the toe of the bluff and creates an upward-progressing scarp [60]. The top and middle portions of the bluff may experience erosion from gullying and groundwater seeps, further destabilizing the bluff face and exacerbating landslide activity [3,56,61,62]. The bluffs of South Manitou Island differ somewhat from other bluffs along Lake Michigan in their substantial sand content, with an upper sandy fluvial facies and a lower lacustrine facies with some fine silt and clay layers [63], potentially exacerbating their erosive potential.
Michigan’s sand dunes are commonly thought to have developed during the mid-Holocene [64] from aeolian erosion of glacial outwash sediments and subsequent deposition by westerly winds [5,63,64,65,66]. The dunes on South Manitou Island are perched along the top of coastal bluffs, and on contemporary timescales they propagate from the local sediments [9,17,57,67,68]: increased erosion at the toe of the bluff during highstands initiates a cascade of erosive events, disaggregating glacial deposit sediments, which are subsequently deposited as a mantle of colluvial and alluvial landforms easily erodible by wind. During lowstands, a greater extent of this disaggregated colluvial and alluvial mantle is exposed above the water surface, potentially resulting in a greater rate of aeolian erosion. Aeolian accretion occurs on the eastern, downwind side of the island, where lighter and variable winds deposit sediments eroded from the bluff face and sand dunes [6,15,69].
2. Materials and Methods
2.1. Study Area
South Manitou Island is the southernmost and westernmost island of Sleeping Bear Dunes National Lakeshore, located off the western coast of Michigan, USA, in northern Lake Michigan (Figure 1). The island was initially occupied in the 1830s to supply cord wood for lake steamships and grew into an agricultural community. Today, it is uninhabited and is managed by the U.S. National Park Service (NPS) (the U.S. National Park Service (NPS) was created in 1916 to preserve and manage the ecological, cultural, and historical integrity of national parks, monuments, and other natural, historical, and recreational properties [42]), but its picturesque vistas, cultural heritage including a historic lighthouse and farm buildings, unique sand dunes, old growth white cedars [70], and hiking and camping opportunities attract a large number of visitors annually.
2.2. Data
This study aims to determine the extent to which geomorphic landforms and changes can be identified and quantified using remotely sensed datasets. Thus, the described methods rely substantially on available high-resolution orthoimagery (HRO) and on DEMs created from both lidar and historical aerial imagery. Geospatial data delineating landslides and related features [71] were used to investigate the degree to which such features are present and can be discerned from DoD analysis. The landslide dataset, developed and published by the U.S. Geological Survey on Sciencebase.gov, maps and characterizes recently active landslides, denuded slopes, and related features. It was developed through expert visual interpretation of the high-resolution aerial imagery available in Google Earth Pro. It establishes a general chronology of slope failures, as well as delineation of detailed landslides and related features. Units and features mapped as part of the inventory include landslide deposits and complexes, alluvial fans, scarps, and source areas. Supplemental SB shows a table of the mapped landslide feature units and their abbreviations [71]. Several additional dates of aerial imagery were available in Google Earth Pro (Table 1) and were used to investigate the erosive and depositional processes on the South Manitou Island bluff face, and as qualitative verification of terrain changes quantified by the DoD.

Table 1.
Dates of aerial imagery; SfM-MVS: Structure from Motion Multi-View Stereo.
2.2.1. Horizontal and Vertical Reference Data
High-resolution orthoimagery acquired in Spring 2017 [72] provided the horizontal reference for the study. The imagery was acquired at 6-inch ground spacing distance resolution in color infrared (CIR) and natural color (RGB). The vertical reference for the study was based on 2016 lidar data, which had a vertical accuracy of 0.045 m or better at the 95% confidence level [73]. The 1 m digital terrain model (DTM) created from the lidar ground returns was acquired from NationalMap.gov and is hereafter referred to as 2016DTM.
2.2.2. Historical Digital Terrain Model (DTM)
A high-resolution DTM and orthoimage were created from 1:17,000 scale historical aerial imagery collected on April 1, 1955. The film images were digitally scanned at 25 microns (1000 dpi) using a geometric calibration to correct for scan-based distortions [74], which scans were downloaded from the U.S. Geological Survey Aerial Photo Single Frame Archive (https://earthexplorer.usgs.gov). A DTM was generated from the stereo aerial imagery using SfM analysis in Agisoft Metashape (version 1.8.3). After an initial photo alignment, the camera calibration model was improved by gradually removing matched points with high reprojection error, reconstruction uncertainty, and/or projection inaccuracy. Camera alignment was optimized following each successive removal of points to update the estimated error of the calibrated model. The model was loosely georeferenced by adding image centerpoint coordinates in World Geodetic Survey (WGS) 1984 and altitude above ground level (AGL) in meters. These coordinates were determined from the imagery’s metadata on EarthExplorer.gov and were specified to be accurate to within 200 m to roughly georeference the matched point cloud without introducing error to the camera calibration. The modeled terrain was then transformed to a projected coordinate system with orthometric heights by adding ground control points (GCPs) at visibly unchanged locations (table of GCPs available in Supplemental SD). These GCPs were provided with X, Y coordinates in North American Datum 1983 Universal Transverse Mercator zone 15N and orthometric Z values taken from the 2016 lidar dataset. A dense point cloud was extracted, and then ground points were classified as those within a max angle of 20.0 degrees and a max distance of 2 m from the digital terrain surface, with a cell size of 25. A DTM was built from the ground points of the dense point cloud and can be accessed through the U.S. Geological Survey ScienceBase catalog [75]. The DTM was edited in Catalyst Focus to remove any remaining noise or elevation values belonging to above-ground features such as buildings and vegetation, then resampled to 1m and snapped to the grid of 2016DTM through bilinear interpolation. The accuracy of the historical DTM, hereafter referred to as 1955DTM, was assessed by comparing it to 2016DTM at points distributed randomly within open fields of the stable interior geomorphic area. From this comparison, 1955DTM was determined to have a root mean squared error (RMSE) of 1.22 m. Finally, an orthoimage was extracted from the (unfiltered) dense point cloud with a horizontal spatial resolution of 0.44 m.
Vertical change was quantified by subtracting 1955DTM from 2016DTM to generate a DoD raster, wherein positive values indicate elevation gain and negative values indicate elevation loss. An analysis of error propagation was performed on ‘unchanged’ areas of the DoD, following [76]. From this analysis, the spatial correlation of error was assessed using a semi-variogram and found to have a lag of 40.5 m with a 0.09 m sill. These terms were used to compute a mean elevational uncertainty of 0.02 m at the 95% confidence level. This uncertainty can be used to characterize the potential error associated with DoD calculations of net area or volumetric changes across the island. A second, more straightforward metric for visualizing change that exceeds the noise and inaccuracies of the input DTMs is the Root of Sum in Quadrature (RSiQ) method [38,76,77]. The RSiQ value indicates the threshold for which the combined possible error in the differenced DTMs is visually quantified. The RSiQ for the 1955-2016 DoD was calculated to be 1.22 m.
2.3. Landform Scale Analysis
Each of the four geomorphologic change factors of shoreline change, coastal bluff retreat, landslide activity, and sand dune movement was investigated through DoD analysis, with the DoD’s 1 m spatial resolution enabling quantification of fine-scale changes. However, investigation of the spatial distribution of these changes across the island necessitated a complementary broader perspective analysis. A combination of landform-scale and landscape-scale analyses enabled quantification of a variety of geomorphologic changes across the entirety of the island.
In addition to quantification of terrain change from the DoD, geomorphic change in landslide areas along the bluff was evaluated using imagery available in Google Earth Pro together with a detailed timeline of lake-level based erosive or aggradation conditions. This served to provide additional information about the landslide features recorded in [71] and acted as an accuracy check of change quantification from the DoD. For example, positive DoD values on individual and coalesced alluvial fans at the base of the bluffs demonstrate that aggradation dominated for that specific area over the multi-decadal time captured by the DoD, or at least for the time-period following the erosive conditions of the 1986 highstand.
2.3.1. Shoreline
South Manitou Island’s shoreline was delineated manually at 1:1,000 scale from 1955 and 2017 orthoimagery. The shoreline was identified as the edge of the waterline, where above-water sandy alluvium and colluvium bore a distinct, higher reflectance signature than below the waterline. This increase in tone was relatively uniform for the shoreline around the island in both the 1955 and the 2017 HROs. Horizontal shoreline change was quantified by converting the 1955 and 2017 polylines each to a set of points distributed at a 10m interval and calculating the Euclidean distance (m) between each pair (1955–2017) of nearest points.
2.3.2. Bluff Top
The bluff top for 1955 was automatically delineated from 1955DTM using the cliff metric tool iBluff [78,79,80]. Given a DTM, the cliff metric tool generates orthogonal transects and profiles, and extracts cliff toe and top x, y, z coordinates for each based on major inflections along the profile. For this analysis, transects were cast at 3 m intervals to maximize the detail produced from the fine-resolution DTMs. The iBluff tool produces a point demarcating the bluff-top break in slope for each transect. The resultant points, which run along the edge of the bluff top, were converted to a polyline. The bluff top for 2016 was delineated similarly from 2016DTM. As with the shoreline analysis, points were distributed at a 10 m interval along each bluff top line (1955 and 2016) and the Euclidean distance (m) between each pair of nearest points was calculated.
2.3.3. Landslides
Landslide features [71] were used to calculate change statistics from the DoD. The magnitude of each landslide feature was calculated as the volume of net change within the mapped feature.
2.3.4. Sand Dunes
The western side of South Manitou Island is covered by large areas of sand that are devoid of vegetation and it exhibits several distinctive sand dunes. These sandy areas are exposed to the full range of aeolian and fluvial erosive processes, and thus have likely experienced substantial geomorphic changes. In these areas, dune movement and other terrain changes were visually identified by a characteristic DoD ‘shadow’ pattern: elevation gain immediately adjacent to similar areas of elevation loss, indicating a lateral shift in a terrain feature, appears as a very bright area next to a very dark area. The presence of this visual cue prompted additional terrain change analysis to specifically target changes in these dune landforms.
Changes in the position or shape of sand dunes were evaluated and mapped by comparing the results of terrain feature classification from each date [81,82] together with understandings of prevailing wind direction (see Supplemental C). Geomorphons is a computationally efficient method of classifying landforms through machine learning and pattern recognition of common terrestrial geometries [81]. While not designed specifically for sand dune analysis, the ‘summit’ and ‘shoulder’ units from the geomorphons classification were found to be analogous to dune ‘crest’ and ‘ridge’ features in the South Manitou Island landscape. The geomorphons classification was computed separately for 1955 DTM and 2016DTM. The results were filtered to isolate large (greater than 100 m2) summit and shoulder units within sandy or bare areas, as interpreted from the 1955 or 2017 orthoimage. The filtered result for 1955DTM was reclassified so that summit and shoulder units were indicated by a value of ‘10,’ and all other units, including NoData areas, were given a value of 0. Likewise, the filtered result for 2016DTM was reclassified so that summit and shoulder units were indicated by a value of ‘1’ and all other values were 0. The reclassified results were added together to map changed and unchanged dune features.
2.4. Landscape Scale Analysis
Each geomorphologic factor (Table 2) was analyzed at a broader scale using a grid spaced at 250 m. Within a gridcell, the landform scale metric for each geomorphologic factor was aggregated, typically using a mean value, except in the case of dune migration. Table 1 shows the method of aggregation for each factor, as well as the values used to reclassify the aggregated gridcell results. Ultimately these standard-deviation-based categories yield a comparable landscape scale metric for each geomorphologic factor.
The aggregated grid results for each factor were then reclassified into standard-deviation-based scores to characterize the relative contribution of the factor to geomorphic change across South Manitou Island. Scores of Not applicable (0), low (1), medium (2), and high (3) were calculated as:
where:
is the minimum value of each geomorphic proxy within a gridcell
is the maximum value of each geomorphic proxy within a gridcell
is the average value of a geomorphic proxy within a gridcell
is the standard deviation of a geomorphic proxy within a gridcell
Table 2.
Aggregation of landform-scale results for landscape-scale analysis.
Table 2.
Aggregation of landform-scale results for landscape-scale analysis.
| Reclassification of Landform-Scale Results to Landscape-Scale | |||||
|---|---|---|---|---|---|
| Geomorphological Factor | Method of Aggregation to Gridcell | 0–N/A | 1–Low | 2–Medium | 3–High |
| Shoreline change | Mean distance between nearest-point pairs | Shoreline not present | 2.4–4.6 m | 4.7–19.5 m | 19.6–39.8 m |
| Bluff change | Mean distance between nearest-point pairs | Bluff not present | 0.3–4.9 m | 5.0–17.9 m | 18.0–66.3 m |
| Landslide activity | Mean of landslide volumes | Landslides not present | −15.1–−8.5 m3 | −8.4–−2.9 m3 | −2.8–6.8 m3 |
| Sand dune movement | Percent change in area of crest or ridge landforms between 1955 and 2016 | Bare sand or sand dunes not present | −6.4–−1.2% | −1.1–1.8% | 1.9–4.4% |
The scores for each of the 4 factors were summed within each gridcell to indicate the cumulative effect of geomorphic changes within that gridcell.
3. Results
3.1. Chronology of Erosion and Deposition, 1955–2022
With respect to Lake Michigan high- and lowstands, the August 1952 highstand (177.28m) is ranked 6th since 1918. The 3rd, 5th, and 7th ranked highstands (July 2020, June–July 1973, and June 1985) are subsidiary highs during pluvials, resulting in higher lake levels for July 2020, July 1974, and October 1986, respectively. The January–February 1959 lowstand is ranked 10th lowest since 1918, but several others (1963 and 1995, for example), immediately followed (are subsidiary to) other lowstands (1964 and 1996, respectively). Aggradational deposits and features likely reach their maximum extent and size during the 1964 lowstand, but the subsidiary lowstands may have resulted in similar depositional conditions.
Thus, the 1952 highstand likely had an equivalent impact on the South Manitou Island bluffs as the 1974, 1986, and 2020 highstands, the latter of which can be reviewed in aerial imagery. During highstands, lake-level erosion is greatest, and is complexly intertwined with other processes of geomorphic change due to the destabilization of bluff face sediments. While erosion due to lake-level is lower during lowstands, the greater expanses of bare sand along the shoreline are subject to aeolian processes and may contribute to inland geomorphic changes. Other noteworthy lake-level events include the July 1974 highstand (177.32 m), which was preceded by the June-July 1973 highstand (177.30 m). These back-to-back highs likely induced considerable lower bluff erosion and subsequent shallow landsliding. This was a lengthy pluvial (>9 years), resulting in the largest rise in lake level at the time (1.74 m), surpassed only by the recent 2013–2020 pluvial. These prolonged wet conditions may have induced numerous slope failures in the upper bluff.
The timing of lake high- and lowstands is plotted together with the dates of available imagery and elevation data in Figure 2. A total of 13 dates of aerial imagery, including the 1955 SfM-MVS orthoimage and the 2017 high-resolution orthoimagery, were used to understand geomorphic changes caused by erosion and deposition across the intervening 6 decades. Each date gives a ‘snapshot’ look at the state and relative location of geomorphic units, providing a general idea of the amount of change that may have occurred for a given feature between imagings. Where features, such as scarps or depositional fans, look nearly the same – with similar shape, tone, and shadowing—as in their previous imaging, it is likely that they have not experienced significant change. Likewise, any increase in vegetation on a geomorphic feature may indicate that, at the time of imaging, it had reached some degree of homeostasis since the previous imaging. Conversely, substantial visible changes between image snapshots suggests that geomorphic change has occurred. Additional insight regarding geomorphic change is gained by considering the erosional and depositional environment with respect to lake level at the time of imaging.
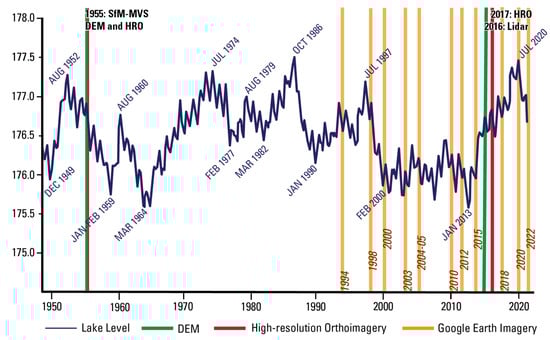
Figure 2.
Timeline describing occurences of lake level high- and lowstands compared to dates of available aerial imagery and digital elevation models (DEMs).
Examples are shown in Figure 3 of landslide features on the northwest and southwest points of the island. In the April 1998 imagery, the features visible have been shaped by the July 1997 highstand (177.19 m) as well as a long-lasting low-magnitude pluvial that eroded the lower bluff. The lake level dropped relatively low by 2000, and remained low for thirteen years, reaching a historic lowstand in January 2013 (175.57 m). Within the 2003 imagery, the example 1 headscarp that was visible in 1998 is buried under a new apron of loose sediment in the lower bluff (right side), and by 2012 alluvial fans have formed at the base of the bluff (right), and scarps have formed in the lower center soil block. Example 2 exhibits growth of the southern-most alluvial fan in the 2003 imagery, with the additional formation of a second fan to the north. New deposition onto and growth of these two prominent alluvial fans, as well as rill erosion across the fans is evident in 2012 imagery.
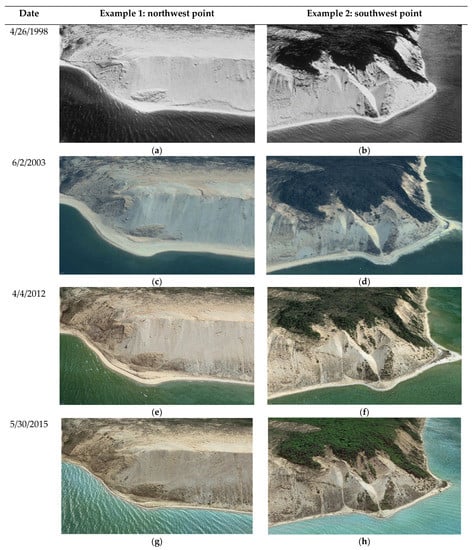
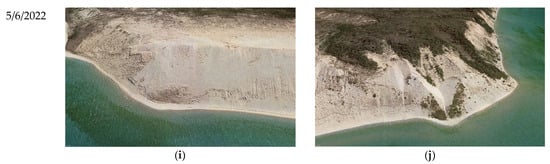
Figure 3.
Snapshot view of landslide features visible in each date of imagery for two example areas on the northwest (example 1) and southwest (example 2) points of South Manitou Island; (a,b) April 26, 1998; (c,d) June 2, 2003; (e,f) April 4, 2012; (g,h) May 30, 2015; (i,j) May 6, 2022.
By December 2014, a rise in lake level had resulted in localized erosion in the lower bluff and had induced some shallow slope failures. Example 1 exhibits erosion along the shoreline (left side), as well as a slight enlargement of the alluvial fans at the base of the bluff. In example 2, the distal edges of the two prominent alluvial fans have eroded, and changes are observed in the headscarps of the upper bluff, suggesting increased precipitation may have initiated scarp slope failures and sloughing. The most recent pluvial corresponded to an initially rapid, then gradual rise in lake level reaching near record levels (177.46 and 177.37 m) in the summers of 2019 and 2020. The total rise in lake level during this period was 1.84 m, higher than during any previous pluvial. Following this most recent highstand, example 1 shows further enlargement of the pre-existing northwest slope landslide and the recent scars associated with wave erosion and slope failures in the lowermost bluff are partly buried by loose material (right side). In example 2, the northernmost alluvial fan has been eroded away, although some new flow deposition is visible. An incised channel cuts the alluvial fan remnant and new deposition is observed lakeward of the 2020 pluvial scarp formed in the alluvial fan. A continuous landslide area has developed to the north of the remaining alluvial fan remnant.
3.2. DoD Quantification of Change
The DoD values represent the net vertical terrain change that occurred between 1955 and 2016 on South Manitou Island (Figure 4). This change ranged from −23.3 m to 26.1 m, with an average of 0.3 m and a standard deviation of 2.6 m. Three-dimensional (3D) visualization of DoD high and low values (more than 3 standard deviations from the mean) is shown in Figure 4 (bottom). Figure 4 also shows the extents (black boxes) of focus areas highlighting changes specific to various geomorphologic factors, as well as the locations of transects showing profiles of the DEMs. The landform-scale results for each geomorphologic factor are given in Section 3.3, while the aggregated landscape-scale results are shown in Section 3.4.
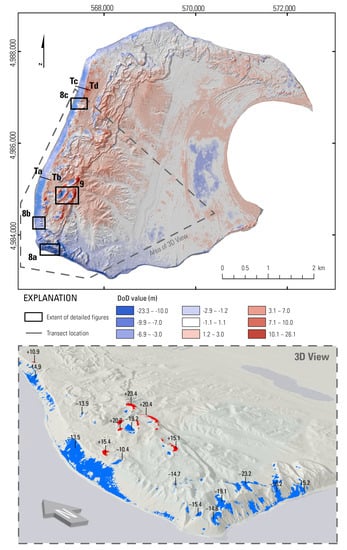
Figure 4.
(Top) Digital elevation model (DEM) of Difference (DoD) showing net terrain change between 1955 and 2016; blue indicates negative values (elevation loss) and red indicates positive values (elevation gain); DoD values have been categorized and thresholded with the RSiQ value to improve visualization of change; black boxes in top figure show extent of detailed figures, as well as transects Ta-Tb and Tc-Td; (Bottom) three-dimensional visualization of DoD values, with blue (negative change) or red (positive change) color indicating only DoD values more than 3 standard deviations from the mean.
3.3. Landform Scale Results
3.3.1. Shoreline Change
Changes in South Manitou Island’s shoreline are shown in Figure 5, with the largest changes occurring on the western and southeastern parts of the island. The western shoreline (Figure 5a) retreated inland by an average of 14.0 m, with a maximum retreat distance of 34.7 m. The eastern shoreline (Figure 5b) retreated by an average of 14.5 m, with a maximum change of 61.3 m. Some changes pushed the island outwards into Lake Michigan (Figure 5b), but in most areas the shoreline retreated inland (Figure 5a).
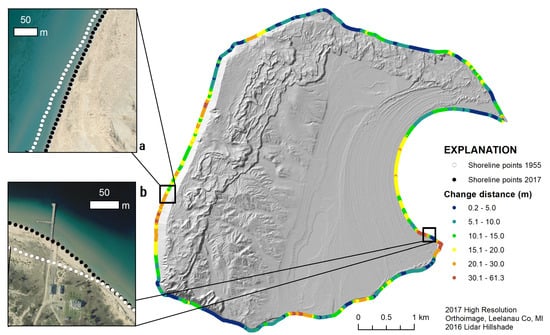
Figure 5.
Shoreline change mapped from the 1955 orthoimage and the 2017 orthoimage; (a), large-scale map showing the location of the 1955 shoreline (white dotted line) and the 2017 shoreline (black dotted line) and exemplative of the 14.0 m average change in shoreline on the west coast; (b), large-scale map showing 1955 shoreline and the 2017 shoreline showing extension of shoreline into the lake.
3.3.2. Bluff Change
Bluff changes are shown in Figure 6. The distance of change for the bluff edge varied from 0.3 m to 66.3 m, with an average of 11.5 m and a standard deviation of 8.7 m. This change occurred almost exclusively as a retreat of the bluff edge inland away from the shoreline. The transect results shown in Figure 7 display the retreat of the shoreline and bluff face inland.
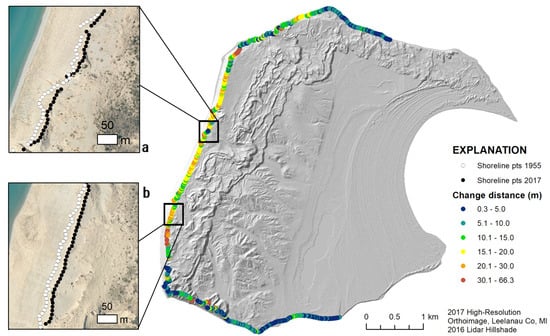
Figure 6.
Bluff retreat mapped from 1955DTM and 2016DTM; (a), large-scale map showing the location of the 1955 shoreline (white dotted line) and the 2017 shoreline (black dotted line) in an area of variable bluff retreat; (b), large-scale map showing an area of relatively uniform bluff retreat.
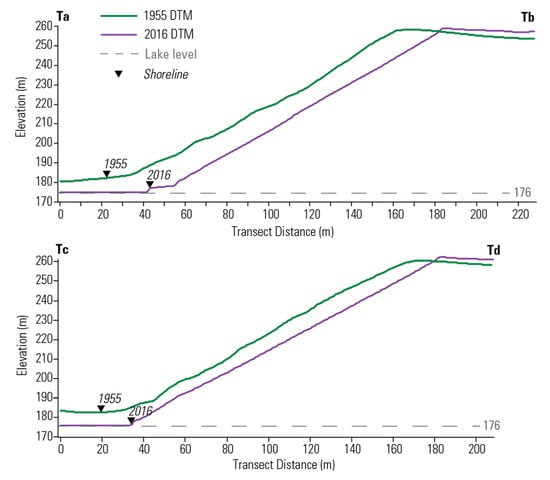
Figure 7.
Transects Ta-Tb and Tc-Td show profiles of the bluff in 1955 (green line) and 2016 (purple line), with the approximate shoreline location (based on distance along transect) indicated by black triangle and the lake level shown as a gray dashed line; NOTE: 1955 lake level was 176.4 m MSL and 2016 lake level was 176.6 m MSL—the 0.2 m difference is not distinguishable on the y-axis, so both the lake levels for both dates are shown as a single gray line.
Figure 7 shows profiles of 1955DTM and 2016DTM at two different locations along the western bluff. Transects Ta-Tb and Tc-Td both stretch from the water just beyond the shoreline (transect start) up and across the bluff top (transect end).
3.3.3. Landslide Activity
Examples of landslide features overlain on the DoD are shown in Figure 8 (see Supplemental SB for landslide unit descriptions). The DoD values almost universally indicated elevation loss along the bluff face and western shoreline, both for erosional features such as landslide source areas (FSASLC) and flow paths (FTPC) and for depositional features (RADAAF).
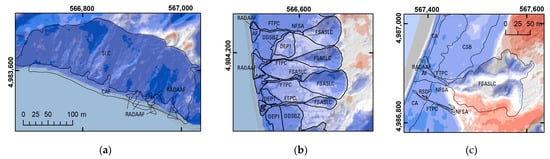
Figure 8.
Example areas of landslide features overlain on the digital elevation model (DEM) of Difference (DoD), with blue indicating elevation loss and red indicating elevation gain. The location of (a–c), along with explanation color ramp is shown in Figure 4; (a) example of elevation loss within the SLC unit, CAF unit, and RADAAF units; (b) example of varying magnitudes of elevation loss in source areas (FSASLC and others) and deposition areas (RADAAF, CAF, DEP1, and others); (c) example of both elevation gain and loss occurring within an erosional feature (FSASLC). For complete landslide unit descriptions, see Supplemental SB: Landslide unit descriptions.
3.3.4. Sand Dune Movement
Substantial differences were found in the extent of crest and ridge features (geomorphons classes summit and shoulder, respectively) between 1955DTM and 2016DTM. A prominent example of these differences is shown in Figure 9. The pattern of large negative DoD values (dark blue) indicating elevation loss immediately adjacent to large positive DoD values (dark red) indicating elevation gain can be seen in Figure 9A. This pattern is characteristic of the lateral movement of a tall terrain feature, where the large negative DoD values indicate the feature’s original position, and the large positive values indicate its new location.
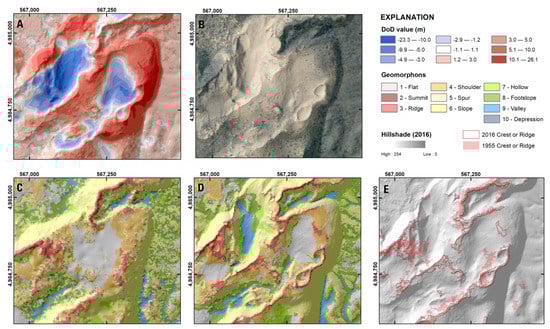
Figure 9.
Example areas of sand dune movement; (A) digital elevation model (DEM) of Difference (DoD) overlain on 2016 digital terrain model (DTM) hillshade: blue indicates elevation loss and red indicates elevation gain; (B) 2017 high resolution orthoimagery (HRO) of the area shows mostly bare sand with some areas of vegetation; (C) result of geomorphons analysis using 1955DTM; (D) result of geomorphons analysis using 2016DTM; (E) comparison of crest or ridge features from the two geomorphons analyses: pink indicates 1955 and red outline indicates 2016.
Figure 9B confirms that the area is composed primarily of bare sand or sandy soil and is mostly absent vegetation. The geomorphons classification results for 1955DTM and 2016DTM are shown in Figure 9C,D, respectively. The combined crest and ridge classes are then overlain on the 2016DTM hillshade in Figure 9E to allow direct comparison of these features.
The results of the feature-based change analysis are shown in Figure 10, where yellow indicates the crest or ridge features classified from 1955DTM and red indicates the crest or ridge features of 2016DTM. Areas of overlap, shown in orange, indicate where crest or ridge features have not changed between 1955 and 2016. In general, there is a large amount of overlap between the crest or ridge features classified for each date (Figure 10a,c). However, many areas exhibit distinctive dune crest or ridge differences between 1955 and 2016 (Figure 10b); it may be surmised that the dune morphology has changed in these areas.
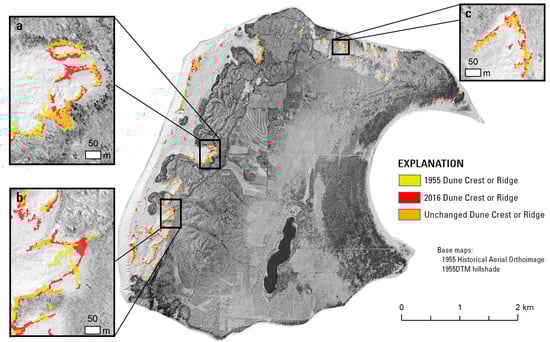
Figure 10.
Crest or ridge geomorphons classes from 1955 (yellow) are compared to those from 2016 (red). The comparison is limited to bare sand, as interpreted from the 1955 orthoimage (shown) and the 2017 orthoimage (not shown), where aeolian processes result in movement of sand dunes. Areas where the sand dune features have not changed are indicated by orange; (a) example area of unchanged dune features (orange); (b) example area showing large differences between the 1955 and 2016 crest or ridge features; (c) example area of sand dune features with similar size and shape, but shifted position.
3.4. Landscape Scale Results
The landscape scale results for each geomorphologic factor are shown in Figure 11. Shoreline change (Figure 11a) is highest along the southeastern tip of the island and along the western coastline. While bluff retreat (Figure 11b) is limited to the western side of the island, it is spatially variable along that front—areas of substantial bluff retreat occur next to areas of (comparatively) little bluff retreat. Landslide changes (Figure 11c) occur around much of the island’s perimeter, but larger magnitude changes have occurred on the north shore and the southwest corner of the island. The largest amount of dune movement (Figure 11d) occurs immediately downwind (to the east) of western bluff retreat, but dune movement was also observed along the northeastern coast.
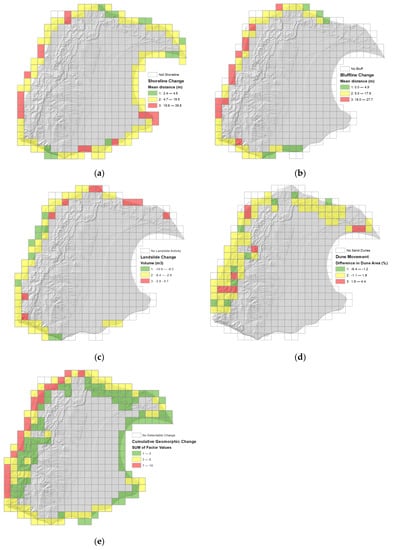
Figure 11.
Landscape scale quantification of terrain change by geomorphologic factor: (a) shoreline change; (b) bluff change; (c) landslide change; (d) dune movement; (e) cumulative geomorphic change.
The map of cumulative geomorphic change (Figure 11e) confirms that significant amounts of geomorphologic changes have occurred along the west coast of South Manitou Island. This map also draws attention to other areas of the island, such as the northeastern coastline, that have experienced above-average changes over the past 61 years. By including less-visible geomorphologic factors, such as dune movement, the cumulative geomorphologic map provides a more comprehensive understanding of the spatial distribution of terrain changes on the island.
4. Discussion
This study completed various geospatial analyses of a historical DTM and lidar DTM, including a DoD, to understand landform-scale and landscape-scale changes in South Manitou Island’s terrain over 61 years. Moreover, it integrated this evaluation of geomorphic change quantified from DTMs and DoD together with the timing of erosive and depositional events of lake level. A detailed discussion of DoD utility for landslide activity analysis and for quantitative characterization of other geomorphic factors follows, as well as discussion of multi-scalar analysis of terrain change, and the challenges and potential limitations of change analysis using historical SfM DTMs.
4.1. DoD Quantification of Landslides
The utility of a DoD in characterizing the extent and processes of landslide activity hinges substantially, and perhaps unsurprisingly, on the magnitude of vertical change associated with the activity; landslides that result primarily in horizontal displacement of surface materials will be less evident in the DoD. Within the mapped Shallow Landslide Complexes (SLC) (Figure 8a), DoD values indicate elevation loss throughout the landslide area, consistent with the mass wasting observed in high resolution orthoimagery. The SLC exhibits aggradation in the recent fan deposition (RADAAF), armored by a coalesced alluvial fan (CAF). This was likely enhanced by the shoreline advance during the recent 2013 lowstand. Landslide flow source areas (FSASLC and NFSA units), particularly along the lengths of drainage channels (Figure 8b), exhibit both negative and positive values. Negative values clearly capture the anticipated elevation loss due to mass wasting, and potentially indicate that runoff-related channel erosion is a primary contributor to flow initiation on South Manitou Island over the past 61 years. Consistent with other findings [83,84], these high-slope areas of the SfM DTM likely experience higher error than low-slope areas, and thus the DoD values in these areas may be less accurate. The complex processes occurring within these features may be teased apart through a review of mapped features overlain on the DoD in conjunction with consideration of the timing of lake level changes. Even within mapped features wherein substantial vertical change has occurred, the DoD may not reflect the expected terrain change if the recent erosive or depositional environment overrides the preceding terrain change. Thus, the timing of elevation change or known erosion events with respect to the dates of elevation data sources—in this case the timing of highstands—is also of primary importance for characterizing DoD-based terrain change analysis.
4.2. DoD Quantification of Other Geomorphic Factors
While the DoD was of limited utility in quantifying shoreline change, bluff change, and sand dune movement, changes specific to each of these factors could be quantified through comparison of the DTMs or their derivatives. In the case of shoreline change, edge artifacts along both 1955DTM and 2016DTM precluded automatic delineation of shoreline through slope-break transect analysis. Manual delineation of the shorelines for the two dates was completed through visual analysis of HROs, and the results (Figure 5) highlight the variability of shoreline change around the island. This high variability occurs even within geomorphic zones comparatively free of terrain changes (such as the eastern shoreline), and irrespective of water current [82] and wind direction [85] (see Supplemental C). Conceptually, shoreline change is fundamentally linked to the bathymetry of the near-shore areas, as areas of gentle submarine slope would logically exhibit greater shoreline change than steep submarine areas. However, the observed 1-to-2 km spacing between areas of large shoreline change suggests that bathymetric slope may not be a dominant driver of shoreline change on South Manitou Island. Future studies could aim to integrate bathymetry in the terrain data to investigate this potential.
Interestingly, the bluff line changes (Figure 6) did not exhibit the same 1–2 km spacing that was observed in the shoreline change. The iBluff tool successfully demarcated bluff edges, with some areas of false-positive bluff edge identified. Generally, these false-positives occurred in areas where sand dunes were located immediately adjacent to the edge of the bluff face, as well as along the northern and southern coasts, which do not exhibit a true bluff. In these areas, where the terrain gently flattened out at or near the northeastern and southeastern shorelines, points identified as bluff by the tool were removed from the analysis. Along the western coast, the bluff edge detected by the tool was remarkably consistent between the two DTMs evaluated. This would seem to suggest that, even in areas of steep terrain, the DTM developed using SfM methods are comparable to those from lidar. The general similarity of the terrain modeled by these two different data sources can be seen in the transects across the bluff face (Figure 7). Despite the steepness of this area, a factor which is known to increase the potential error of elevation models [85], the slope of the bluff face in 1955DTM is similar to the slope of the face in 2016DTM (Figure 7). In both examples, the crests of the 1955 and 2016 bluffs occur at nearly the same elevation, further supporting the validity of lidar-SfM comparison.
However, both transects indicate a horizontal ‘inland’ shift of 2016DTM by 10–15 m. This distance is arguably unrealistic, given the moderate amount of bluff erosion that occurred along its northwestern and southwestern points (Figure 3) between 1994 and 2022. While this visual analysis covers only 28 years (1994–2022, see Supplemental B for full figure) compared to the 61 years of change indicated by the DoD (1955–2016), the depositional and erosive environment of 1955 was likely similar to that observed in 2022, and evidence of 10+ m of erosion should be, but is not, visible. The magnitude of terrain loss suggested by the DoD is substantially greater than the expected moderate erosion and depositional features that are evident in 2022. Moreover, the transects show the shoreline and the bluffline to have moved inland by 10+ m. This amount of terrain change would entail substantial erosion that was not evident in visual interpretation. Finally, the water level indicated by the 1955DTM (Figure 7, little to no slope from 0 to ~20 m transect distance) is consistently 4–5 m above that of the 2016DTM, despite a recorded lake level difference of only 0.2 m (176.8 m in April of 1955 and 176.6 m in March of 2016) [86]. Considered together, these inconsistencies are possibly evidence of the limitations of SfM for elevation modeling in the specific geographic and topographic situation of South Manitou Island’s west coastline. The specifics of this situation are further discussed in Section 4.4.
The broad sandy expanses on the western side of the island exhibit several distinct areas of sand dunes, and include parabolic, star, and blowout dune features [87]. The DoD highlights the few areas where there was substantial change in dune position as a characteristic shadow pattern (visible in Figure 4 and Figure 9A). A dune blow-out is visible in Figure 9, (near 567,150 East, 4,984,850 North), exhibiting the characteristic shadow pattern in the pseudocolor ramp of blue to red. The 1955DTM and resultant geomorphons analysis (Figure 9C) exhibit a flatness of slope in this area, which becomes concave in the 2016DTM and resultant geomorphons analysis (Figure 9D). While it is possible that the SfM matching process was less successful in this concave area of highly reflective sand, leading to interpolation of sparse elevation values, there is remarkable similarity between the crest and ridge features of the 1955 and 2016 geomorphons analysis in the rest of the example area.
While some crest or ridge features appear to shift somewhat in position or transform (as in the dune blowout), others remain remarkably fixed in place. The geomorphons analysis enables broader comparison of the dune features mapped from each date of DTM. Figure 10 allows for direct comparison between the dune crest/ ridgelines mapped from each DTM. In most areas of the island, there is substantial similarity between the dune features between 1955 and 2016, indicating that South Manitou Island’s sand dunes are relatively static, despite the liberation of sand by bluff and shoreline change, and the large bare sand expanses. This finding also highlights the comparable nature of the two DTMs, despite their difference in source data and modeling.
However, this is a broader challenge for terrain change quantification, as some degree of disparity occurs between all elevation data sources [88] and should be robustly accounted for using DoD-based error metrics [76,77]. The general similarity between the 1955 and 2016 crest or ridges indicates that the island’s sand dunes are relatively static, despite the liberation of sand by bluff and shoreline change, and the large bare sand expanses.
4.3. Multi-Scale Understanding of Terrain Change through Gridcell Approach
Quantification of terrain change through DEM differencing has progressed substantially over the past decade(s) with improvements in the spatial scale and accuracy of grid-based elevation models [88,89,90,91]. Previously, a significant and limiting challenge of terrain change quantification was the temporal sparsity of elevation data, as well as the spatial resolution and accuracy of available datasets. These factors typically caused high amounts of error in the resultant DoD, limiting the amount and types of terrain change that are detectable and quantifiable. The ever-increasing coverage and availability of lidar data, as well as the computational power to process it, greatly increases the utility of high resolution DEMs for contemporary change analyses. However, the advent of SfM-MVS routines that implement image matching based on photogrammetric principles creates potential for the development of high resolution DEMs from archived historical aerial photography. These new potential datasets could greatly improve temporal resolution of available elevation data, and therefore the potential for terrain change analysis. This analysis demonstrated the utility of comparing one such historical SfM-MVS DTM to a lidar-based DTM for the quantification of moderate-scale geomorphic changes.
A significant advantage of DoD methods for terrain change purposes is the uniformity of coverage inherent in raster-based analyses. Other methods of terrain change analysis might focus on specific landforms [24,92] or processes [93], with the potential for inconsistent coverage or omission of interrelated landforms and processes. Because the DoD is inherently a raster-based, continuous dataset, it provides a consistent and complete framework for quantification of terrain change that is independent from specific processes and landforms [91]. This quality also presents a challenge, because some amount of ‘change,’ whether consequential or not, will be quantified throughout the study area. This challenge of needing to ‘see the forest for the trees’ is addressed by considering the DoD as just one of many tools for investigating geomorphic change—not the end product indicative of that change. By integrating the DoD with additional data and understandings regarding landform-specific processes, terrain change can be fully mapped and characterized.
However, integration of DoD and other datasets is complicated by the large range of spatial and temporal scales by which the physical processes of erosion and aggradation operate. A second advantage of DoD methods is their multi-scalar potential. This analysis presented one potential method of introducing multiple scales of geomorphic change analysis: separate, but related quantification of landform- and landscape-scale changes through the lens of the DoD. At the landform scale, the fine spatial resolution of the DoD enables detailed investigation of terrain loss and gain, as well as of the timing of these processes, within each landform. Landscape-scale analysis using the DoD highlights the cumulative loss and gain patterns across processes and landforms and enables visualization of these patterns across larger geographic areas. The findings of landform-scale analysis provide synoptic understanding of geomorphic change that can be useful to park management to help mitigate hazards to the island’s visitors, plan for long term infrastructure needs, and potentially determine the future impacts of climate-related trends.
4.4. Critique of DoD Analysis Using Historical SfM DEMs
In addition to quantifying geomorphic change on South Manitou Island, the findings of this study speak to the degree to which DEM differencing using a historical SfM-MVS elevation model and a lidar-based DEM can characterize multiple decades of geomorphic change and processes. The use of these methods to assess changes in specific landforms, or to link quantified change to geomorphologic processes, is the next step in terrain change analysis. In this study, the DoD facilitated investigation of different types of terrain change, which varied in their spatial extent, vertical magnitude, and temporal rate of change. Various methods were used to analyze the DoD and the two DTMs to quantify the magnitude of change for geomorphologic factors at the landform scale. These results were then used to investigate the interrelated factors at the landscape scale. While the 4 geomorphologic factors investigated are specific to South Manitou Island, there is broader applicability in understanding the extent to which DoD-based terrain change can be used to characterize dynamic geomorphic features and physical processes.
Many DoD analyses utilize similar elevation data sources (e.g. lidar to lidar comparison). While this reduces the error associated with differencing, it limits the time-period for which terrain change may be investigated. This study sought to tap into the longer timeframe covered by archival stereographic aerial imagery by developing a DEM using SfM [94,95,96]. A noteworthy challenge of creating historical DEMs using SfM (or any photogrammetric methods) is the need for well-distributed, consistently identifiable ground control in areas that have not changed. While a multitude of potential GCP locations are visible at road intersections and farm field corners in the 1955 imagery, only a fraction of these points were identifiable in the returned-to-natural South Manitou Island landscape visible in 2017 HRO. While not extensively investigated for historical DEM development, the number and distribution of GCPs was found to have significant implications for SfM-MVS model error in UAS studies [97]. A challenge of analyzing lidar together with SfM-MVS or other DEM data is that results must be interpreted with consideration for the inaccuracies of other elevation data. While the RMSE of the 1955 SfM-MVS DTM (1.55 m) is roughly average for SfM-derived DEMs [39], it is substantially larger that of the lidar-based 2016DTM (0.015 m). More importantly, this accuracy value is computed from a second independent set of GCPs recognizable in both the historical and reference orthoimagery. Thus, the RMSE of the SfM-MVS DEM may not be a good accuracy indicator for areas of change—such as the landslide, bluff, and sand dune areas of South Manitou Island. Analysis of error propagation using the DoD [76] indicates the error (0.2 m) that should be considered in 2D or 3D calculations of change, but this analysis must also be performed in areas that have not changed.
In order to address the accuracy of the DoD results in areas of change, such as the landslide-prone bluff and shoreline of western South Manitou Island, this study qualitatively assessed the likely magnitude of change from visual interpretation of specific geomorphic features visible in multitemporal imagery between 1994 and 2022. The combination of multiple geomorphic factors in this part of the island, including shoreline changes associated with lake level change, bluff line retreat, and landslide activity, potentially result in substantial terrain change. However, it should also be considered whether 1955DTM simply has larger than average amounts of error in this part of the South Manitou Island. Several characteristics of this area potentially result in greater error: (1) the waters of Lake Michigan not only preclude the distribution of GCPs on the far western side of the imagery block (which extends well into the lake), but also negatively impact the success of pixel matching due to refraction [98]; (2) this area exhibits some of the most substantial change across South Manitou Island, precluding a robust spatial distribution of GCPs; (3) the comparatively bright reflectance of the sand dune, bluff, and shoreline areas further exacerbates pixel matching difficulties [99], and in some areas no key point matches were identified in the initial alignment; and (4) the steep slope of the bluff face presents a general challenge to elevation modeling [88,100]. While the bluffs of South Manitou Island have experienced substantial geomorphic changes, the 10+ m horizontal displacement of shoreline and bluff, and 10+m of elevation loss indicated by the transect analysis and DoD may overestimate actual geomorphic changes. Finally, the 3–5 m higher shoreline elevation of the 1955DTM compared to 2016DTM (Figure 7) is an additional indication of potential inaccuracy in the 1955DTM. Thus, while SfM methods offer the potential to derive DEMs from historical aerial imagery with comparable spatial resolution to lidar-based DEMs, careful analysis of accuracy, particularly in areas of change, is necessary. Even in cases where the SfM DEM exhibits reasonable accuracy overall, the terrain surface modeled through SfM methods may incorporate spatially variable amounts of error that should be considered in analysis of change.
5. Conclusions
This study investigated the terrain changes and geomorphic processes that have occurred on South Manitou Island in Sleeping Bear Dunes National Lakeshore through geospatial analysis of DEMs and a DoD, together with a detailed map of landslide features. Specifically, the study focused on shoreline change, bluff line change, landslide activity, and sand dune movement as geomorphic factors affecting terrain change on the island. Change related to each of these factors was quantified at the landform- and at the landscape scale to facilitate both nuanced understanding of interconnected geomorphic processes as well as comprehensive mapping of geomorphic changes across the island. Qualitative analysis of geomorphic features using multitemporal imagery in was completed as a check on these methods. Based on this visual analysis, the DoD may somewhat overestimate the actual amount of terrain change that has occurred on the western part of the island due to 1955DTM inaccuracies linked to the large expanse of water, limited ground control, surface brightness, and steep slopes.
While most of South Manitou Island’s geomorphic change occurred along the western coast, the study identified moderate changes occurring in other parts of the island. These changes include shifts in the location or extent of sand dunes due to blowouts and aeolian processes, and changes in the shoreline on the southeastern point of the island. The processes associated with these terrain changes are complex and interrelated, and the vertical changes associated with each factor cannot be entirely separated. However, in the absence of additional dates of terrain data, the geomorphic changes quantified by the DoD for 61 years between 1955 and 2016 can still be used to inform understanding of factor-specific geomorphic changes. The multi-scale methods used by this study are one potential solution to address the disparate spatial and vertical scales of change occurring across the island. In this way, the more substantial vertical changes that occur where multiple geomorphic processes coincide can be considered together with subtle vertical changes occurring over larger areas. Ultimately, landscape-scale analysis of the DoD provides a roadmap for future investigation and management initiatives, as it provides an aggregated view of where the largest magnitude changes occur across the entire island. Results of the landform-scale analysis could be used to for a variety of detailed geomorphic change investigations, such as the effect of the island’s changing vegetation and management practices in stabilizing surficial sediments in areas of dune movement and bluff retreat, the impact of foot trails on dune migration, or investigation of seepage zones on the bluff face.
Supplementary Materials
The following supporting information can be downloaded at: https://www.mdpi.com/article/10.3390/ijgi12040173/s1.
Author Contributions
Conceptualization, Jessica D. DeWitt and Francis X. Ashland; methodology, Jessica D. DeWitt; software, Jessica D. DeWitt; validation, Jessica D. DeWitt and Francis X. Ashland; formal analysis, Jessica D. DeWitt and Francis X. Ashland; data curation, Jessica D. DeWitt; writing—original draft preparation, Jessica D. DeWitt and Francis X. Ashland; writing—review & editing, Jessica D. DeWitt; visualization, Jessica D. DeWitt; project administration, Francis X. Ashland; funding acquisition, Francis X. Ashland and Jessica D. DeWitt. All authors have read and agreed to the published version of the manuscript.
Funding
This research was funded by U.S. Geological Survey (USGS) Natural Resources Preservation Program, grant number GX.22.LP00.0AZ03.00, and the USGS Community for Data Integration (CDI) grant number GX.22.LP00.CDI01.00.
Data Availability Statement
Datasets developed for analysis of terrain change at Sleeping Bear Dunes National Lakeshore were published [75] and are freely available at https://doi.org/10.5066/P938WSV3 (accessed on 14 April 2023), including the 1955 historical digital elevation model (DEM) and DEM of Difference (DoD). Inventory of landslides and related features on South Manitou Island in Sleeping Bear Dunes National Lakeshore [71] is available at https://doi.org/10.5066/P9SQWQ37 (accessed on 14 April 2023).
Acknowledgments
The authors would like to recognize the helpful suggestions and guidance of Pete Chirico (USGS) in methods development and preliminary review of findings; Monica Palaseanu-Lovejoy (USGS) for assistance implementing automated bluff delineation; Marissa Alessi (USGS), Kara Moran (USGS), and three anonymous peer reviewers for helpful and constructive reviews of the manuscript’s content; Rob Stamm (USGS) for valuable review and copy editing of the manuscript and associated data releases; Kevin Kincare for kindly providing detailed information and data regarding the region’s geology; Any use of trade, firm, or product names is for descriptive purposes only and does not imply endorsement by the U.S. Government.
Conflicts of Interest
The authors declare no conflict of interest.
References
- Arbogast, A.F.; Hansen, E.C.; Van Oort, M.D. Reconstructing the Geomorphic Evolution of Large Coastal Dunes along the Southeastern Shore of Lake Michigan. Geomorphology 2002, 46, 241–255. [Google Scholar] [CrossRef]
- Kincare, K.A.; Larson, G.J. Glacial Geology of the Sleeping Bear Dunes National Lakeshore: Guidebook for the Michigan State University College of Natural Science Alumni Fieldtrip; Michigan Geological Survey: East Lansing, MI, USA, 2008; p. 40. [Google Scholar]
- Larson, G.; Schaetzl, R. Origin and Evolution of the Great Lakes. J. Great Lakes Res. 2001, 27, 518–546. [Google Scholar] [CrossRef]
- Hansel, A.K.; Mickelson, D.M.; Schneider, A.F.; Larsen, C.E. Late Wisconsinan and Holocene History of the Lake Michigan Basin. In Quaternary evolution of the Great Lakes; Karrow, P.F., Calkin, P.E., Eds.; Geological Association of Canada Special Paper 30; Geological Association of Canada: St. John’s, Canada, 1985. [Google Scholar]
- van Dijk, D.V. Contemporary Geomorphic Processes and Change on Lake Michigan Coastal Dunes: An Example from Hoffmaster State Park, Michigan. Mich. Acad. 2004, 35, 23. [Google Scholar]
- Kilibarda, Z.; Kilibarda, V. Seasonal Geomorphic Processes and Rates of Sand Movement at Mount Baldy Dune in Indiana, USA. Aeolian Res. 2016, 23, 103–114. [Google Scholar] [CrossRef]
- Kilibarda, Z.; Shillinglaw, C. A 70year History of Coastal Dune Migration and Beach Erosion along the Southern Shore of Lake Michigan. Aeolian Res. 2015, 17, 263–273. [Google Scholar] [CrossRef]
- Wilcox, D.A.; Thompson, T.A.; Booth, R.K.; Nicholas, J.R. Lake-Level Variability and Water Availability in the Great Lakes; Circular: Reston, VA, USA, 2007; 25p. [Google Scholar]
- Marsh, W.M. Nourishment of Perched Sand Dunes and the Issue of Erosion Control in the Great Lakes. Environ. Geol. Water Sci 1990, 16, 155–164. [Google Scholar] [CrossRef]
- Davidson-Arnott, R.G.D.; Bauer, B.O. Controls on the Geomorphic Response of Beach-Dune Systems to Water Level Rise. J. Great Lakes Res. 2021, 47, 1594–1612. [Google Scholar] [CrossRef]
- van Dijk, D. Foredune Dynamics at a Lake Michigan Site during Rising and High Lake Levels. J. Great Lakes Res. 2021, 47, 1581–1593. [Google Scholar] [CrossRef]
- Lancaster, N. Dune Morphology and Dynamics. In Geomorphology of Desert Environments; Parsons, A.J., Abrahams, A.D., Eds.; Springer Netherlands: Dordrecht, The Netherlands, 2009; pp. 557–595. ISBN 978-1-4020-5718-2. [Google Scholar]
- Mattheus, C.R.; Braun, K.N.; Theuerkauf, E.J. Great Lakes Urban Pocket-Beach Dynamics: A GIS-Based Analysis of Infrastructure-Design Influences on Geomorphic Development. J. Great Lakes Res. 2022, 48, 68–83. [Google Scholar] [CrossRef]
- Theuerkauf, E.J.; Braun, K.N.; Nelson, D.M.; Kaplan, M.; Vivirito, S.; Williams, J.D. Coastal Geomorphic Response to Seasonal Water-Level Rise in the Laurentian Great Lakes: An Example from Illinois Beach State Park, USA. J. Great Lakes Res. 2019, 45, 1055–1068. [Google Scholar] [CrossRef]
- Yurk, B.; Hansen, E. Effects of Wind Patterns and Changing Wind Velocities on Aeolian Drift Potential along the Lake Michigan Shore. J. Great Lakes Res. 2021, 47, 1504–1517. [Google Scholar] [CrossRef]
- Zhang, P.; Sherman, D.J.; Li, B. Aeolian Creep Transport: A Review. Aeolian Res. 2021, 51, 100711. [Google Scholar] [CrossRef]
- Barnhardt, W.A.; Jaffe, B.E.; Kayen, R.E.; Cochrane, G.R. Influence of Near-Surface Stratigraphy on Coastal Landslides at Sleeping Bear Dunes National Lakeshore, Lake Michigan, USA. J. Coast. Res. 2004, 202, 510–522. [Google Scholar] [CrossRef]
- Zoet, L.K.; Rawling, J.E. Analysis of a Sudden Bluff Failure along the Southwest Lake Michigan Shoreline. J. Great Lakes Res. 2017, 43, 999–1004. [Google Scholar] [CrossRef]
- Mortsch, L.D. Assessing the Impact of Climate Change on the Great Lakes Shoreline Wetlands. Clim. Change 1998, 40, 391–416. [Google Scholar] [CrossRef]
- Zhang, L.; Zhao, Y.; Hein-Griggs, D.; Janes, T.; Tucker, S.; Ciborowski, J.J.H. Climate Change Projections of Temperature and Precipitation for the Great Lakes Basin Using the PRECIS Regional Climate Model. J. Great Lakes Res. 2020, 46, 255–266. [Google Scholar] [CrossRef]
- Abdel-Fattah, S.; Krantzberg, G. A Review: Building the Resilience of Great Lakes Beneficial Uses to Climate Change. Sustain. Water Qual. Ecol. 2014, 3–4, 3–13. [Google Scholar] [CrossRef]
- Bartolai, A.M.; He, L.; Hurst, A.E.; Mortsch, L.; Paehlke, R.; Scavia, D. Climate Change as a Driver of Change in the Great Lakes St. Lawrence River Basin. J. Great Lakes Res. 2015, 41, 45–58. [Google Scholar] [CrossRef]
- Williams, R. DEMs of Difference. Geomorphol. Tech. 2012, 2. [Google Scholar]
- Etzelmüller, B. On the Quantification of Surface Changes Using Grid-based Digital Elevation Models (DEMs). Trans. GIS 2000, 4, 129–143. [Google Scholar] [CrossRef]
- Hooke, J.M. Decades of Change: Contributions of Geomorphology to Fluvial and Coastal Engineering and Management. Geomorphology 1999, 31, 373–389. [Google Scholar] [CrossRef]
- R. Grove, J.; Croke, J.; Thompson, C. Quantifying Different Riverbank Erosion Processes during an Extreme Flood Event. Earth Surf. Process. Landf. 2013, 38, 1393–1406. [Google Scholar] [CrossRef]
- Brunier, G.; Fleury, J.; Anthony, E.J.; Pothin, V.; Vella, C.; Dussouillez, P.; Gardel, A.; Michaud, E. Structure-from-Motion Photogrammetry for High-Resolution Coastal and Fluvial Geomorphic Surveys. In Proceedings of the 16th Young Geomorphologists Days, Bad Kreuznach, Germany, 24–26 June 2022; Volume 22, pp. 147–161. [Google Scholar]
- Llena, M.; Vericat, D.; Smith, M.W.; Wheaton, J.M. Geomorphic Process Signatures Reshaping Sub-humid Mediterranean Badlands: 1. Methodological Development Based on High-resolution Topography. Earth Surf. Process. Landf. 2020, 45, 1335–1346. [Google Scholar] [CrossRef]
- Chen, B.; Yang, Y.; Wen, H.; Ruan, H.; Zhou, Z.; Luo, K.; Zhong, F. High-Resolution Monitoring of Beach Topography and Its Change Using Unmanned Aerial Vehicle Imagery. Ocean Coast. Manag. 2018, 160, 103–116. [Google Scholar] [CrossRef]
- Montreuil, A.-L.; Chen, M.; Brand, E.; Verwaest, T.; Houthuys, R. Post-Storm Recovery Assessment of Urbanized versus Natural Sandy Macro-Tidal Beaches and Their Geomorphic Variability. Geomorphology 2020, 356, 107096. [Google Scholar] [CrossRef]
- Kokelj, S.V.; Kokoszka, J.; van der Sluijs, J.; Rudy, A.C.A.; Tunnicliffe, J.; Shakil, S.; Tank, S.E.; Zolkos, S. Thaw-Driven Mass Wasting Couples Slopes with Downstream Systems, and Effects Propagate through Arctic Drainage Networks. Cryosphere 2021, 15, 3059–3081. [Google Scholar] [CrossRef]
- Kotsi, E.; Vassilakis, E.; Diakakis, M.; Mavroulis, S.; Konsolaki, A.; Filis, C.; Lozios, S.; Lekkas, E. Using UAS-Aided Photogrammetry to Monitor and Quantify the Geomorphic Effects of Extreme Weather Events in Tectonically Active Mass Waste-Prone Areas: The Case of Medicane Ianos. Appl. Sci. 2023, 13, 812. [Google Scholar] [CrossRef]
- Kociuba, W.; Gajek, G.; Franczak, Ł. A Short-Time Repeat TLS Survey to Estimate Rates of Glacier Retreat and Patterns of Forefield Development (Case Study: Scottbreen, SW Svalbard). Resources 2020, 10, 2. [Google Scholar] [CrossRef]
- Korsgaard, N.J.; Schomacker, A.; Benediktsson, Í.Ö.; Larsen, N.K.; Ingólfsson, Ó.; Kjær, K.H. Spatial Distribution of Erosion and Deposition during a Glacier Surge: Brúarjökull, Iceland. Geomorphology 2015, 250, 258–270. [Google Scholar] [CrossRef]
- Tarolli, P.; Sofia, G. Human Topographic Signatures and Derived Geomorphic Processes across Landscapes. Geomorphology 2016, 255, 140–161. [Google Scholar] [CrossRef]
- Micheletti, N.; Chandler, J.H.; Lane, S.N. Structure from Motion (SfM) Photogrammetry. In Geomorphological Techniques; British Society for Geomorphology: London, UK, 2015; Chapter 2. [Google Scholar]
- Bakker, M.; Lane, S.N. Archival Photogrammetric Analysis of River-Floodplain Systems Using Structure from Motion (SfM) Methods. Earth Surf. Process. Landf. 2017, 42, 1274–1286. [Google Scholar] [CrossRef]
- Chirico, P.G.; Bergstresser, S.E.; DeWitt, J.D.; Alessi, M.A. Geomorphological Mapping and Anthropogenic Landform Change in an Urbanizing Watershed Using Structure-from-Motion Photogrammetry and Geospatial Modeling Techniques. J. Maps 2021, 17, 241–252. [Google Scholar] [CrossRef]
- Chirico, P.; DeWitt, J.; Bergstresser, S. Evaluating Elevation Change Thresholds between Structure-from-Motion DEMs Derived from Historical Aerial Photos and 3DEP LiDAR Data. Remote Sens. 2020, 12, 1625. [Google Scholar] [CrossRef]
- Westoby, M.J.; Brasington, J.; Glasser, N.F.; Hambrey, M.J.; Reynolds, J.M. ‘Structure-from-Motion’ Photogrammetry: A Low-Cost, Effective Tool for Geoscience Applications. Geomorphology 2012, 179, 300–314. [Google Scholar] [CrossRef]
- Mölg, N.; Bolch, T. Structure-from-Motion Using Historical Aerial Images to Analyse Changes in Glacier Surface Elevation. Remote Sens. 2017, 9, 1021. [Google Scholar] [CrossRef]
- Smith, M.W.; Carrivick, J.L.; Quincey, D.J. Structure from Motion Photogrammetry in Physical Geography. Prog. Phys. Geogr. Earth Environ. 2016, 40, 247–275. [Google Scholar] [CrossRef]
- Meinen, B.U.; Robinson, D.T. Mapping Erosion and Deposition in an Agricultural Landscape: Optimization of UAV Image Acquisition Schemes for SfM-MVS. Remote Sens. Environ. 2020, 239, 111666. [Google Scholar] [CrossRef]
- Lewińska, P.; Głowacki, O.; Moskalik, M.; Smith, W.A.P. Evaluation of Structure-from-Motion for Analysis of Small-Scale Glacier Dynamics. Measurement 2021, 168, 108327. [Google Scholar] [CrossRef]
- Farrand, W.R.; Bell, D.L. Quaternary Geology of Southern Michigan; Michigan Department of Natural Resources: Lansing, MI, USA, 1982. [Google Scholar]
- Horton, J.D.; San Juan, C.A.; Stoeser, D.B. The State Geologic Map Compilation (SGMC) Geodatabase of the Conterminous United States; USGS numbered series: Reston, VA, USA, 2017. [Google Scholar]
- Kincare, K.A. Surficial Geology of Northern Leelanau County; Michigan Geological Survey: East Lansing, MI, USA, 2003. [Google Scholar]
- Kincare, K.A. Verbal Communication about the Geology of Sleeping Bear Dunes and Northern Lake Michigan. 2021. [Google Scholar]
- Hough, J.L. The Prehistoric Great Lakes of North America. Am. Sci. 1963, 54, 84–109. [Google Scholar]
- Bloom, A.L. Geomorphology: A Systematic Analysis of Late CEnozoic Landforms, 3rd ed.; Waveland Press, Inc.: Long Grove, IL, USA, 2004; ISBN 1-57766-354-3. [Google Scholar]
- Dilley, R.S.; Rasid, H. Human Response to Coastal Erosion: Thunder Bay, Lake Superior. J. Coast. Res. 2022, 6, 11. [Google Scholar]
- Highman, T.A.; Shakoor, A. Role of Soil Joints in Causing Bluff Erosion along the Lake Erie Shoreline. Environ. Eng. Geosci. 1998, 4, 195–207. [Google Scholar] [CrossRef]
- LaMoe, J.P.; Winters, H.A. LaMoe_1989_Wave Energy Estimates Lake Michigan.Pdf. Prof. Geogr. 1989, 41, 349–359. [Google Scholar] [CrossRef]
- May, S.K.; Dolan, R.; Hayden, B.P. Erosion of U.S. Shorelines. Eos Trans. AGU 1983, 64, 521. [Google Scholar] [CrossRef]
- Rasid, H.; Dilley, R.S.; Baker, D.; Otterson, P. Coping with the Effects of High Water Levels on Property Hazards: North Shore of Lake Superior. J. Great Lakes Res. 1989, 15, 205–216. [Google Scholar] [CrossRef]
- Lawrence, P.L. Natural Hazards of Shoreline Bluff Erosion: A Case Study of Horizon View, Lake Huron. Geomorphology 1994, 10, 65–81. [Google Scholar] [CrossRef]
- Edil, T.B. Erosion of Coastal Slopes and Landslides. In Proceedings of the Geo-Congress 2013; American Society of Civil Engineers: San Diego, CA, USA, 2013; pp. 1320–1334. [Google Scholar]
- Sataer, G.; Sultan, M.; Emil, M.K.; Yellich, J.A.; Palaseanu-Lovejoy, M.; Becker, R.; Gebremichael, E.; Abdelmohsen, K. Remote Sensing Application for Landslide Detection, Monitoring along Eastern Lake Michigan (Miami Park, MI). Remote Sens. 2022, 14, 3474. [Google Scholar] [CrossRef]
- Jibson, R.W.; Odum, J.K.; Staude, J.-M. Rates and Processes of Bluff Recession Along the Lake Michigan Shoreline in Illinois. J. Great Lakes Res. 1994, 20, 135–152. [Google Scholar] [CrossRef]
- Pelletier, J.D.; DeLong, S.B.; Al-Suwaidi, A.H.; Cline, M.; Lewis, Y.; Psillas, J.L.; Yanites, B. Evolution of the Bonneville Shoreline Scarp in West-Central Utah: Comparison of Scarp-Analysis Methods and Implications for the Diffusion Model of Hillslope Evolution. Geomorphology 2006, 74, 257–270. [Google Scholar] [CrossRef]
- Jibson, R.W.; Staude, J.-M. Bluff Recession Rates along the Lake Michigan Shoreline in Illinois. Bull. Assoc. Eng. Geol. 1991, 29, 103–117. [Google Scholar]
- Mickelson, D.M.; Edil, T.B.; Guy, D.E. Erosion of Coastal Bluffs in the Great Lakes. In Formation, Evolution, and Stability of Coastal Cliffs—Status and Trends; Professional Paper; U.S. Geological Survey: Reston, VA, USA, 2004; pp. 107–123. [Google Scholar]
- Hazlett, B.T. The Terrestrial Vegetation and Flora of the Mainland Portion of Sleeping Bear Dunes National Lakeshore, Benzie and Leelanau Counties, Michigan; University of Michigan Biological Station: Pellston, MI, USA, 1986; 115p. [Google Scholar]
- Dorr, J.A.; Eschman, D.F. Geology of Michigan; University of Michigan Press: Ann Arbor, MI, USA, 1970. [Google Scholar]
- Arbogast, A.F.; Loope, W.L. Maximum-Limiting Ages of Lake Michigan Coastal Dunes: Their Correlation With Holocene Lake Level History. J. Great Lakes Res. 1999, 25, 372–382. [Google Scholar] [CrossRef]
- Olson, J.S. Rates of Succession and Soil Changes on Southern Lake Michigan Sand Dunes. Bot. Gaz. 1958, 119, 125–170. [Google Scholar] [CrossRef]
- Edil, T.B. Landslide Cases in the Great Lakes: Issues and Approaches. Transp. Res. Rec. 1992, 1343, 87–94. [Google Scholar]
- Marsh, W.M.; Marsh, B.D. Wind Erosion and Sand Dune Formation on High Lake Superior Bluffs. Geogr. Annular. Ser. A Phys. Geogr. 1987, 69, 379–391. [Google Scholar] [CrossRef]
- Jackson, N.L.; Nordstrom, K.F. Aeolian Sediment Transport and Landforms in Managed Coastal Systems: A Review. Aeolian Res. 2011, 3, 181–196. [Google Scholar] [CrossRef]
- Ghost Towns of South Manitou Island. Available online: https://www.nps.gov/slbe/learn/historyculture/southmanitoughost.htm (accessed on 7 December 2021).
- Ashland, F. Preliminary Reconnaissance Inventory Map Data of Landslides and Related Features, South Manitou Island, Sleeping Bear Dunes National Lakeshore, Michigan. U.S. Geol. Surv. Data Release 2022. [Google Scholar] [CrossRef]
- Vexcel Michigan Statewide Authoritative Imagery and Lidar Program. Available online: https://www.michigan.gov/dtmb/services/maps/misail (accessed on 14 April 2023).
- Sanborn. LiDAR Campaign Report; Michigan LiDAR 2015; State of Michigan: Lansing, MI, USA, 2016. [Google Scholar]
- USGS EROS Customer Services USGS EROS Archive—Aerial Photography—Aerial Photo Single Frames. Available online: https://doi.org/10.5066/F7610XKM (accessed on 18 March 2020).
- DeWitt, J.D. Geospatial Datasets Associated with Topographic Change Analysis in Sleeping Bear Dunes National Lakeshore; U.S. Geological Survey Data Release: Reston, VA, USA, 2022. [Google Scholar] [CrossRef]
- Anderson, S.W. Uncertainty in Quantitative Analyses of Topographic Change: Error Propagation and the Role of Thresholding. Earth Surf. Process. Landf. 2019, 44, 1015–1033. [Google Scholar] [CrossRef]
- Wheaton, J.M.; Brasington, J.; Darby, S.E.; Sear, D.A. Accounting for Uncertainty in DEMs from Repeat Topographic Surveys: Improved Sediment Budgets. Earth Surf. Process. Landf. 2010, 35, 136–156. [Google Scholar] [CrossRef]
- Palaseanu-Lovejoy, M. IBluff: An Open-Source R Package for Geomorphic Analysis of Coastal Bluffs/Cliffs. SoftwareX 2023, 21, 101325. [Google Scholar] [CrossRef]
- Palaseanu-Lovejoy, M.; Danielson, J.; Thatcher, C.; Foxgrover, A.; Barnard, P.; Brock, J.; Young, A. Automatic Delineation of Seacliff Limits Using Lidar-Derived High-Resolution DEMs in Southern California. J. Coast. Res. 2016, 76, 162–173. [Google Scholar] [CrossRef]
- Palaseanu-Lovejoy, M. IBluff—Geomorphic Analysis of Coastal Bluffs/Cliffs; USGS Organization: Reston, VA, USA, 2021. [Google Scholar]
- Jasiewicz, J.; Stepinski, T.F. Geomorphons — a Pattern Recognition Approach to Classification and Mapping of Landforms. Geomorphology 2013, 182, 147–156. [Google Scholar] [CrossRef]
- Conrad, O.; Bechtel, B.; Bock, M.; Dietrick, H.; Fischer, E.; Gerlitz, L.; Wehberg, J.; Wichmann, V.; Böhner, J. System for Automated Geoscientific Analyses (SAGA); SAGA: Hamburg, Germany, 2015. [Google Scholar]
- Lane, S.N.; James, T.D.; Crowell, M.D. Application of Digital Photogrammetry to Complex Topography for Geomorphological Research. Photogramm. Rec. 2000, 16, 793–821. [Google Scholar] [CrossRef]
- Pulighe, G.; Fava, F. DEM Extraction from Archive Aerial Photos: Accuracy Assessment in Areas of Complex Topography. Eur. J. Remote Sens. 2013, 46, 363–378. [Google Scholar] [CrossRef]
- USDA NRCS Wind Rose Dataset. Available online: https://www.wcc.nrcs.usda.gov/climate/windrose.html (accessed on 8 June 2021).
- NOAA Great Lakes Data Dashboard: Water Levels Dataset, 1918-Present Coordinated. Available online: https://www.glerl.noaa.gov/data/wlevels/ (accessed on 8 February 2022).
- DeWitt, J.D.; Warner, T.A.; Conley, J.F. Comparison of DEMS Derived from USGS DLG, SRTM, a Statewide Photogrammetry Program, ASTER GDEM and LiDAR: Implications for Change Detection. GIScience Remote Sens. 2015, 52, 179–197. [Google Scholar] [CrossRef]
- Rayburg, S.; Thoms, M.; Neave, M. A Comparison of Digital Elevation Models Generated from Different Data Sources. Geomorphology 2009, 106, 261–270. [Google Scholar] [CrossRef]
- Abd Rahman, M.F.; Md Din, A.H.; Mahmud, M.R.; Pa’suya, M.F. A Review on Global and Localised Coverage Elevation Data Sources for Topographic Application. IOP Conf. Ser. Earth Environ. Sci. 2022, 1051, 012014. [Google Scholar] [CrossRef]
- Alganci, U.; Besol, B.; Sertel, E. Accuracy Assessment of Different Digital Surface Models. IJGI 2018, 7, 114. [Google Scholar] [CrossRef]
- Maune, D.F.; Nayegandhi, A. Digital Elevation Model Technologies and Applications: The DEM Users Manual, 3rd ed.; ASPRS: Bethesda, MD, USA, 2019; ISBN 1-57083-102-5. [Google Scholar]
- Begin, Z.B.; Schumm, S.A. Gradational Thresholds and Landform Singularity: Significance for Quaternary Studies. Quat. Res. 1984, 21, 267–274. [Google Scholar] [CrossRef]
- Xiong, L.; Li, S.; Tang, G.; Strobl, J. Geomorphometry and Terrain Analysis: Data, Methods, Platforms and Applications. Earth-Sci. Rev. 2022, 233, 104191. [Google Scholar] [CrossRef]
- Knuth, F.; Shean, D.; Bhushan, S.; Schwat, E.; Alexandrov, O.; McNeil, C.; Dehecq, A.; Florentine, C.; O’Neel, S. Historical Structure from Motion (HSfM): Automated Processing of Historical Aerial Photographs for Long-Term Topographic Change Analysis. Remote Sens. Environ. 2023, 285, 113379. [Google Scholar] [CrossRef]
- Grottoli, E.; Biausque, M.; Rogers, D.; Jackson, D.W.T.; Cooper, J.A.G. Structure-from-Motion-Derived Digital Surface Models from Historical Aerial Photographs: A New 3D Application for Coastal Dune Monitoring. Remote Sens. 2020, 13, 95. [Google Scholar] [CrossRef]
- Carvalho, R.C.; Kennedy, D.M.; Niyazi, Y.; Leach, C.; Konlechner, T.M.; Ierodiaconou, D. Structure-from-motion Photogrammetry Analysis of Historical Aerial Photography: Determining Beach Volumetric Change over Decadal Scales. Earth Surf. Process. Landf. 2020, 45, 2540–2555. [Google Scholar] [CrossRef]
- Villanueva, J.K.S.; Blanco, A.C. Optimization of Ground Control Point (GCP) Configuration for Unmanned Aerial Vehicle (UAV) Survey Using Structure from Motion (SFM). Int. Arch. Photogramm. Remote Sens. Spat. Inf. Sci. 2019, XLII-4/W12, 167–174. [Google Scholar] [CrossRef]
- Shmutter, B.; Bonfiglioli, L. Orientation Problem in Two-Medium Photogrammetry. Photogramm. Eng. 1967, 33, 1421–1428. [Google Scholar]
- Gonçalves, J.A.; Henriques, R. UAV Photogrammetry for Topographic Monitoring of Coastal Areas. ISPRS J. Photogramm. Remote Sens. 2015, 104, 101–111. [Google Scholar] [CrossRef]
- Su, J.; Bork, E. Influence of Vegetation, Slope, and Lidar Sampling Angle on DEM Accuracy. Photogramm. Eng. Remote Sens. 2006, 72, 1265–1274. [Google Scholar] [CrossRef]
Disclaimer/Publisher’s Note: The statements, opinions and data contained in all publications are solely those of the individual author(s) and contributor(s) and not of MDPI and/or the editor(s). MDPI and/or the editor(s) disclaim responsibility for any injury to people or property resulting from any ideas, methods, instructions or products referred to in the content. |
© 2023 by the authors. Licensee MDPI, Basel, Switzerland. This article is an open access article distributed under the terms and conditions of the Creative Commons Attribution (CC BY) license (https://creativecommons.org/licenses/by/4.0/).