Article

The Potential Impact of Cycling on Urban Transport Energy and Modal Share: A GIS-Based Methodology

by
João Monteiro
1,
Nuno Sousa
2,3,
Eduardo Natividade-Jesus
2,4 and
João Coutinho-Rodrigues
2,5,*
1
Research Centre for Territory, Transports and Environment (CITTA), 4200-465 Porto, Portugal
2
Institute for Systems Engineering and Computers of Coimbra (INESCC), 3030-790 Coimbra, Portugal
3
Department of Sciences and Technology, Universidade Aberta, 1269-001 Lisbon, Portugal
4
Department of Civil Engineering, Polytechnic Institute of Coimbra, 3045-093 Coimbra, Portugal
5
Department of Civil Engineering, University of Coimbra, 3004-531 Coimbra, Portugal
*
Author to whom correspondence should be addressed.
ISPRS Int. J. Geo-Inf. 2023, 12(2), 48; https://doi.org/10.3390/ijgi12020048
Submission received: 26 October 2022 / Revised: 29 January 2023 / Accepted: 30 January 2023 / Published: 1 February 2023

Abstract

:
This article presents a methodology to estimate the maximum potential impact of a well-built and conserved cycling infrastructure, measured as modal share for accessibility trips, as well as the associated transport energy that can be saved in those trips. The methodology uses Geographic Information Systems (GIS) to estimate active trip probabilities, from which the output variables can be obtained. It was applied to a case study of a mid-sized city in Southern Europe, and results show that an adequate cycling infrastructure can achieve cycling mode share in that city on par with the world’s most cycling-friendly cities. Concerning transport energy, a full-cycling scenario is estimated to reduce fossil energy intensity by approximately 20%, mainly by inducing a mode change for residents on the closest outskirts. It is also argued that cycling investment in commuting routes will have the most impact on reducing fossil transport energy.

1. Introduction

Rising concerns over traffic congestion in cities, greenhouse gas emissions (GHG), transport energy spending, and related health issues have led to a surge of interest in active mobility from academics, practitioners, and policymakers [1,2,3,4,5,6,7,8,9,10]. Cycling, in particular, has been a prominent research topic in both transport and spatial planning, with many studies highlighting its importance and benefits as a means of transport and commuting solution. Cycling is a promising mode of transport for urban mobility, ideal for trips up to 5 km [11,12], has low energy intensity and near-zero emissions, and thus has been increasingly recognized as a cleaner, healthier, and overall more sustainable mode of transportation [12,13,14,15,16,17]. Cycling is also an affordable, low-congestion, and readily available mobility option, which can cover large areas and daily movements when urban areas are dense enough [18]. Commuting by bicycle also has important indirect health benefits for surrounding inhabitants [19,20].
The benefits of cycling prompted major international authorities, such as the Organization for Economic Co-operation and Development (OECD), the European Commission (EC), and national and municipal authorities, to promote, invest in, and create the necessary infrastructure for it to become a viable daily means of transport [18,21,22,23,24,25,26,27,28,29,30,31,32,33,34]. Furthermore, the unexpected SARS-CoV-2 (COVID-19) pandemic has also played an important role in the last years, with climate-friendly transportation solutions that indirectly enforce social distancing starting to be seen as pandemic-resistant solutions as well [35,36,37]. This realization led to an even bigger push for cycling as a means of transport in urban areas, with cities such as London, Paris, Barcelona, Milan, Brussels, Bogotá, Berlin, Seoul, and Budapest promoting cycling and improving and creating infrastructure at a faster rate [38,39,40,41].
Nevertheless, cycling infrastructure needs to be properly implemented, as evidence has emerged that failure to meet cyclists’ concerns highly deters people from choosing that transport mode [42]. Moreover, because the investment needed to promote, create, and adequately maintain cycling infrastructure is typically high, it is an arduous task to achieve, especially in consolidated cities which, over the last decades, prioritized motorized transportation. Therefore, to properly analyze the cost–benefit relation of cycling infrastructure investments, the need arises to estimate the maximum potential impact of those investments. This article proposes a methodology to provide an initial estimation of that impact, measured by modal share and transport energy use. It relies on evaluating active trip probability for accessibility trips to urban facilities and jobs, which constitute a high percentage of all urban trips [43] and uses Geographic Information Systems (GIS) to execute the city-scale calculations required.
The methodology allows for a comparison between a base scenario, where cycling is not considered as a feasible means of transport (i.e., it has near-zero modal share), and a scenario in which cycling infrastructure has been implemented in the best possible way, following all engineering codes of practice and along pleasant environments. Such implementation means segregation of the cycle mode from other modes (pedestrian and motorized), with cycle tracks of adequate lane width, quality and well-maintained pavement, cycle parking facilities, safety measures against motorized traffic, and placement of mechanical aid devices for the case of hilly cities. Codes of practice for cycle tracks can be found in [44] and placement of aid devices in [45]. For quality and maintenance issues (including safety), see, e.g., [46,47]. The methodology output gives municipal authorities valuable preliminary data to analyze the cost–benefit relationship of retrofitting their cities to include large-scale provisions for the cycling mode. The city of Coimbra, Portugal, a city with considerable urban sprawl and almost nonexistent cycling modal share, was used as a case study to demonstrate the concept. Results show that with adequate cycling infrastructure, Coimbra can aspire to have active modal shares on par with top-tier cities, such as Amsterdam or Copenhagen. To the best of the authors’ knowledge, this is the first quantitative methodology to estimate the potential impact of a full-cycling scenario at various levels and one of the first case studies thereof.
Note that while an adequate cycling infrastructure removes the most important barriers to cycling (see, e.g., [48,49,50] for a list), promotional measures may be needed. These can be, for example, implementation of bike-sharing systems, institutional advertising, provisions for bicycle storage in public transport (multimodal approach), incentives to bicycle acquisition, or the creation of congestion taxes and restricted access areas. These factors may increase cycle mode share, but the study of their effect is beyond the scope of this article, which focuses on accessibility.

2. Literature Review

The large-scale impact of cycling on an urban area can be studied and evaluated in various ways. Modal share and transport energy spending are commonly used measures in transport planning as evaluators of mobility [51,52,53,54] and indicators of the impact of the creation or redevelopment of infrastructure [27,37,55,56]. Likewise, those indicators were used to evaluate the effects of new cycling-related policies or the reform of old ones [27,54,56,57,58], the implementation of various mobility-related services, e.g., bike-sharing [59,60,61], and combinations of policies and services [62,63]. Modal shift towards cycling has, in turn, socio-economic, travel behavior, and overall mobility impacts [64,65,66]. At a more general level, modal share and transport energy spending were also used as evaluators of the momentum towards renewable and non-polluting sources of energy [67,68,69,70,71,72,73].
The various studies mentioned above focused on the impact of one or two cycling-fostering policies or services, or infrastructural improvements of limited scope. None estimated the potential impact that a full-scale intervention on the cycling infrastructure could have, one which would leave citizens with no excuse not to opt for the cycling mode, except trip distance. It is to fill this literature gap that the present research is presented. The only study in the literature that is similar in objective to this article is that of Raustorp and Koglin [51]. However, those authors studied only commuting trips, at a different, regional level, and focused on health benefits. No trips to urban facilities were considered, and energy impacts were not estimated.
It is worth noting that during the COVID-19 pandemic, factors came into play which created fluctuations in cycle use [74]: lockdowns decreased overall ridership, but recreational/exercise trips increased. Cycling commuting trips also rose when economic activities resumed, feeding mostly from a modal shift of public transport users to cycling [75,76]. Being a low-contagion mode, the need to quickly create cycling infrastructure led to the appearance of dedicated planning tools [77] and the subsequent investments were made on the field infrastructure, which is likely to generate sustainable increases in the cycling modal share into the future [37,78], possibly to levels not expected so soon, had the pandemic not occurred. The present article presents a way to estimate what the maximum expectable share might be.

3. Materials and Methods

The methodology is based on the ideas below. These describe the procedure in broad brush strokes, after which finer details are given.
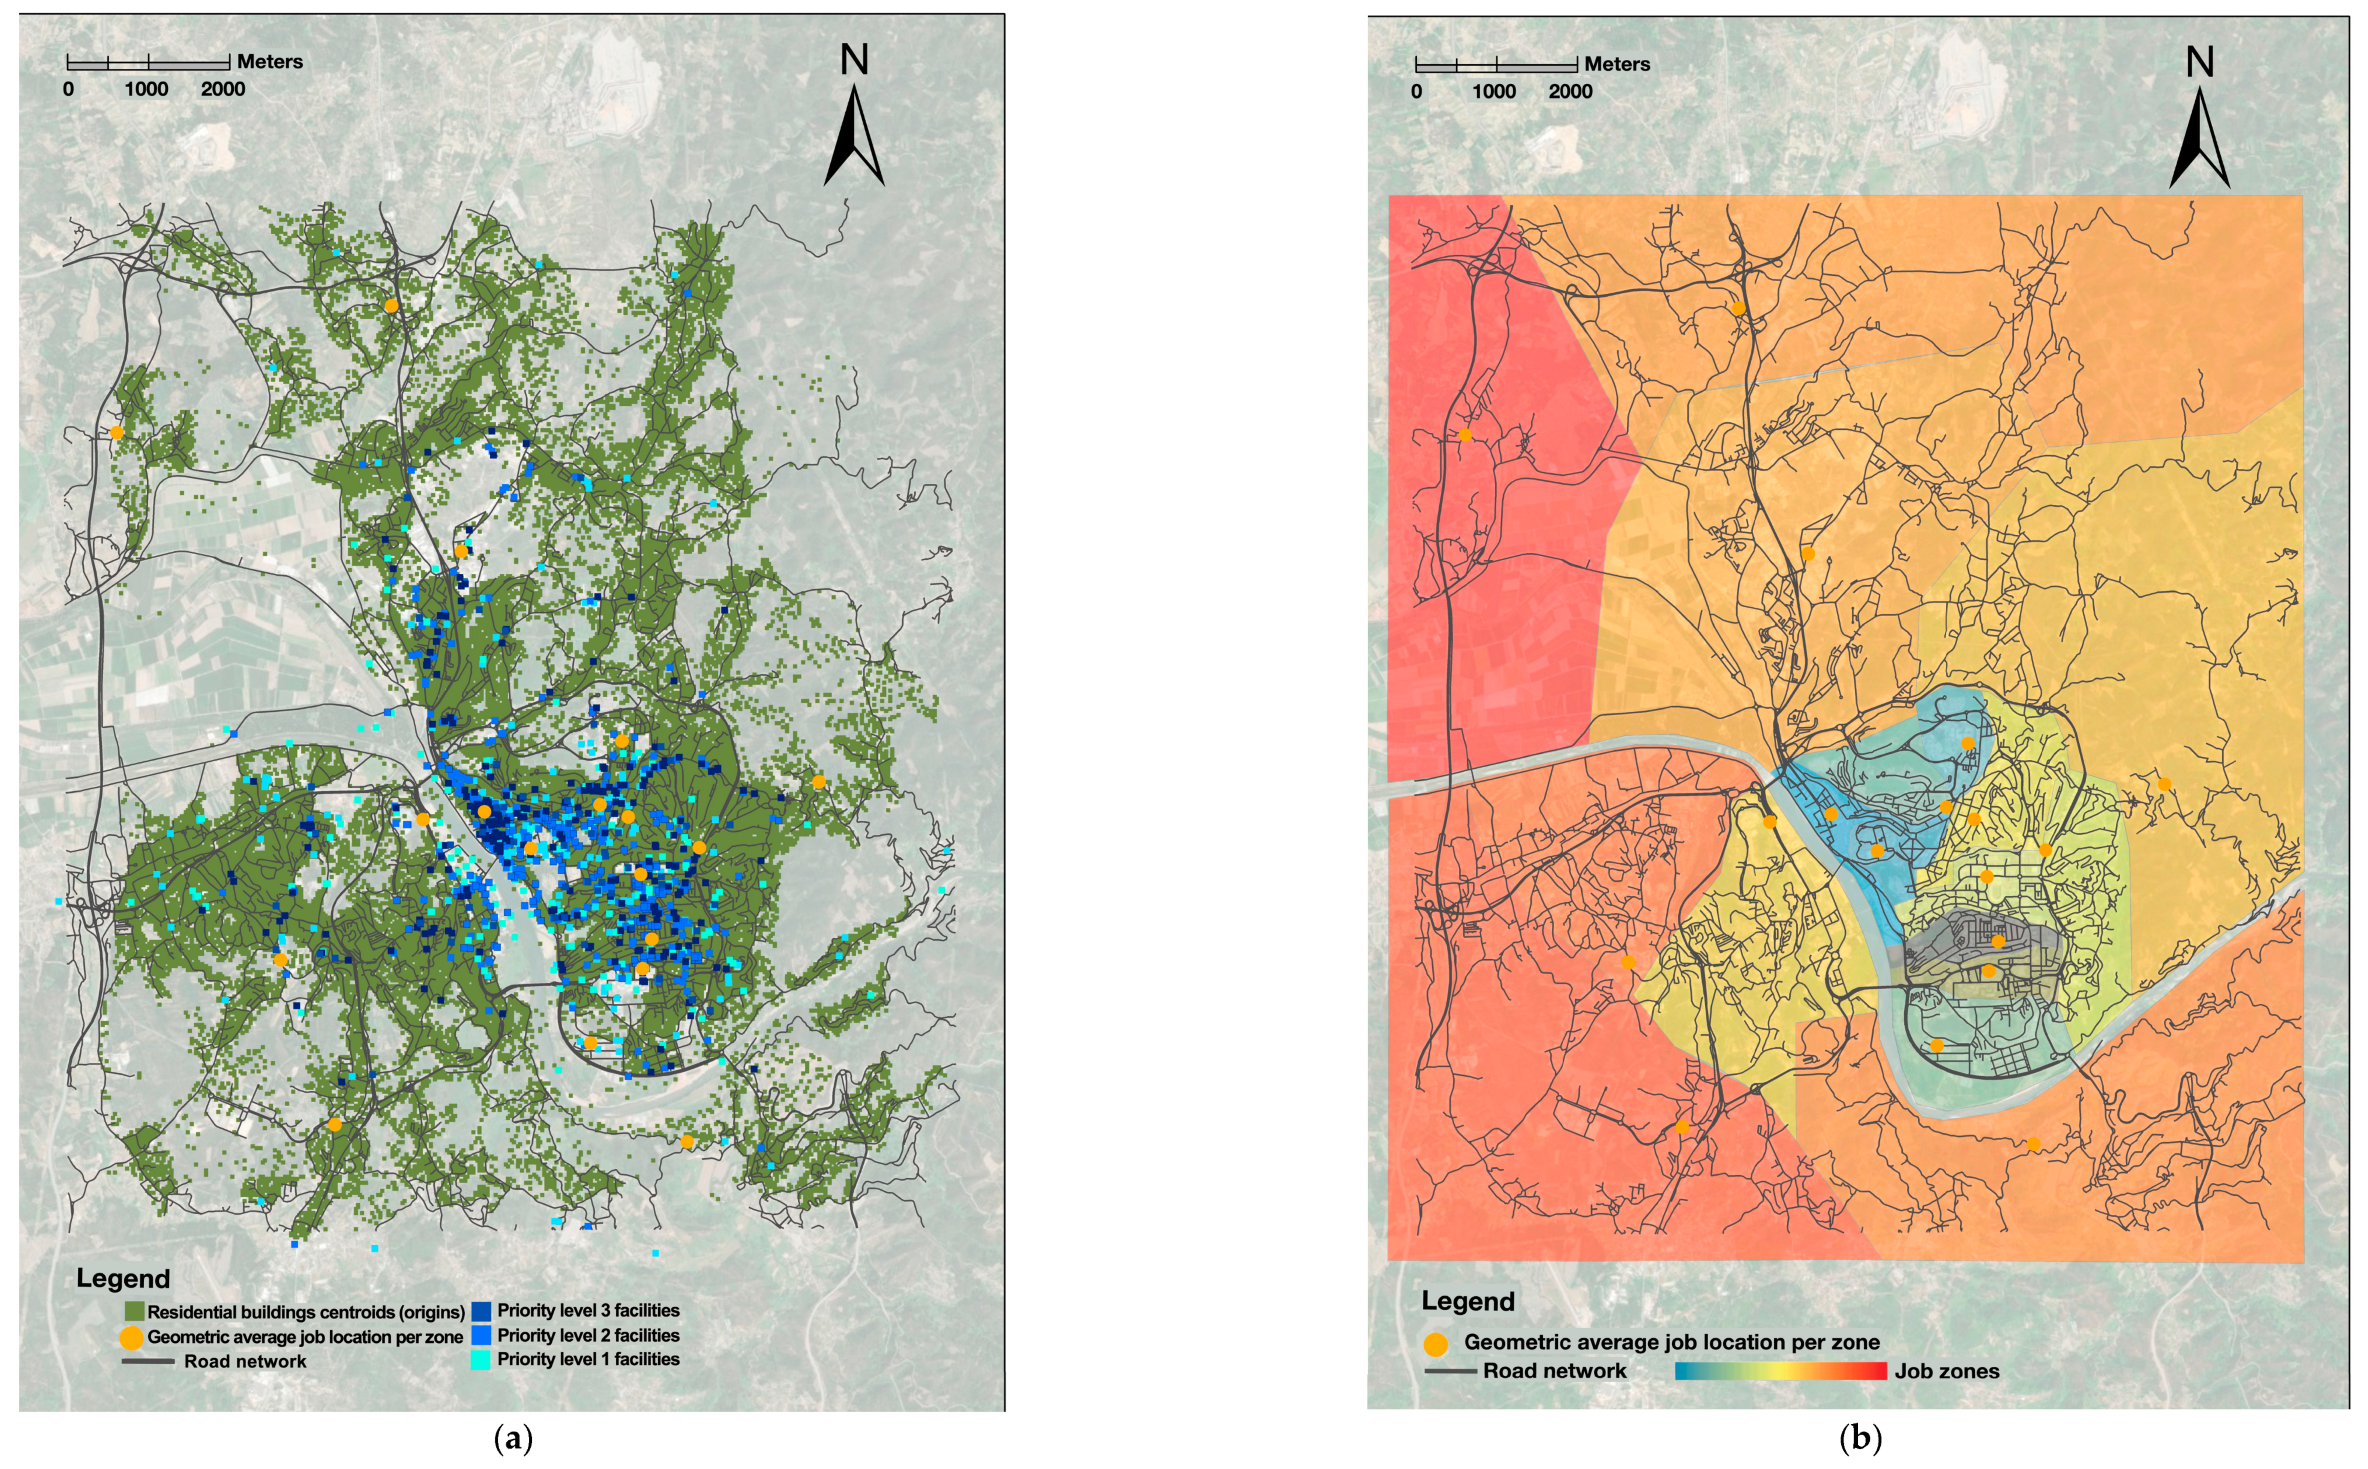
  • An urban area is selected for study. Three datasets are collected and curated into a GIS environment: origins (O), destinations (D), and road network. Origins represent demand (for trips) and are the centroids of residential buildings over the study area. Destinations represent supply and consist of urban facilities and centroids of job zones. The road network connects origins to destinations.
  • For each origin, network distances are evaluated in GIS to (a) the nearest urban facilities of each kind and (b) the centroid of each job zone.
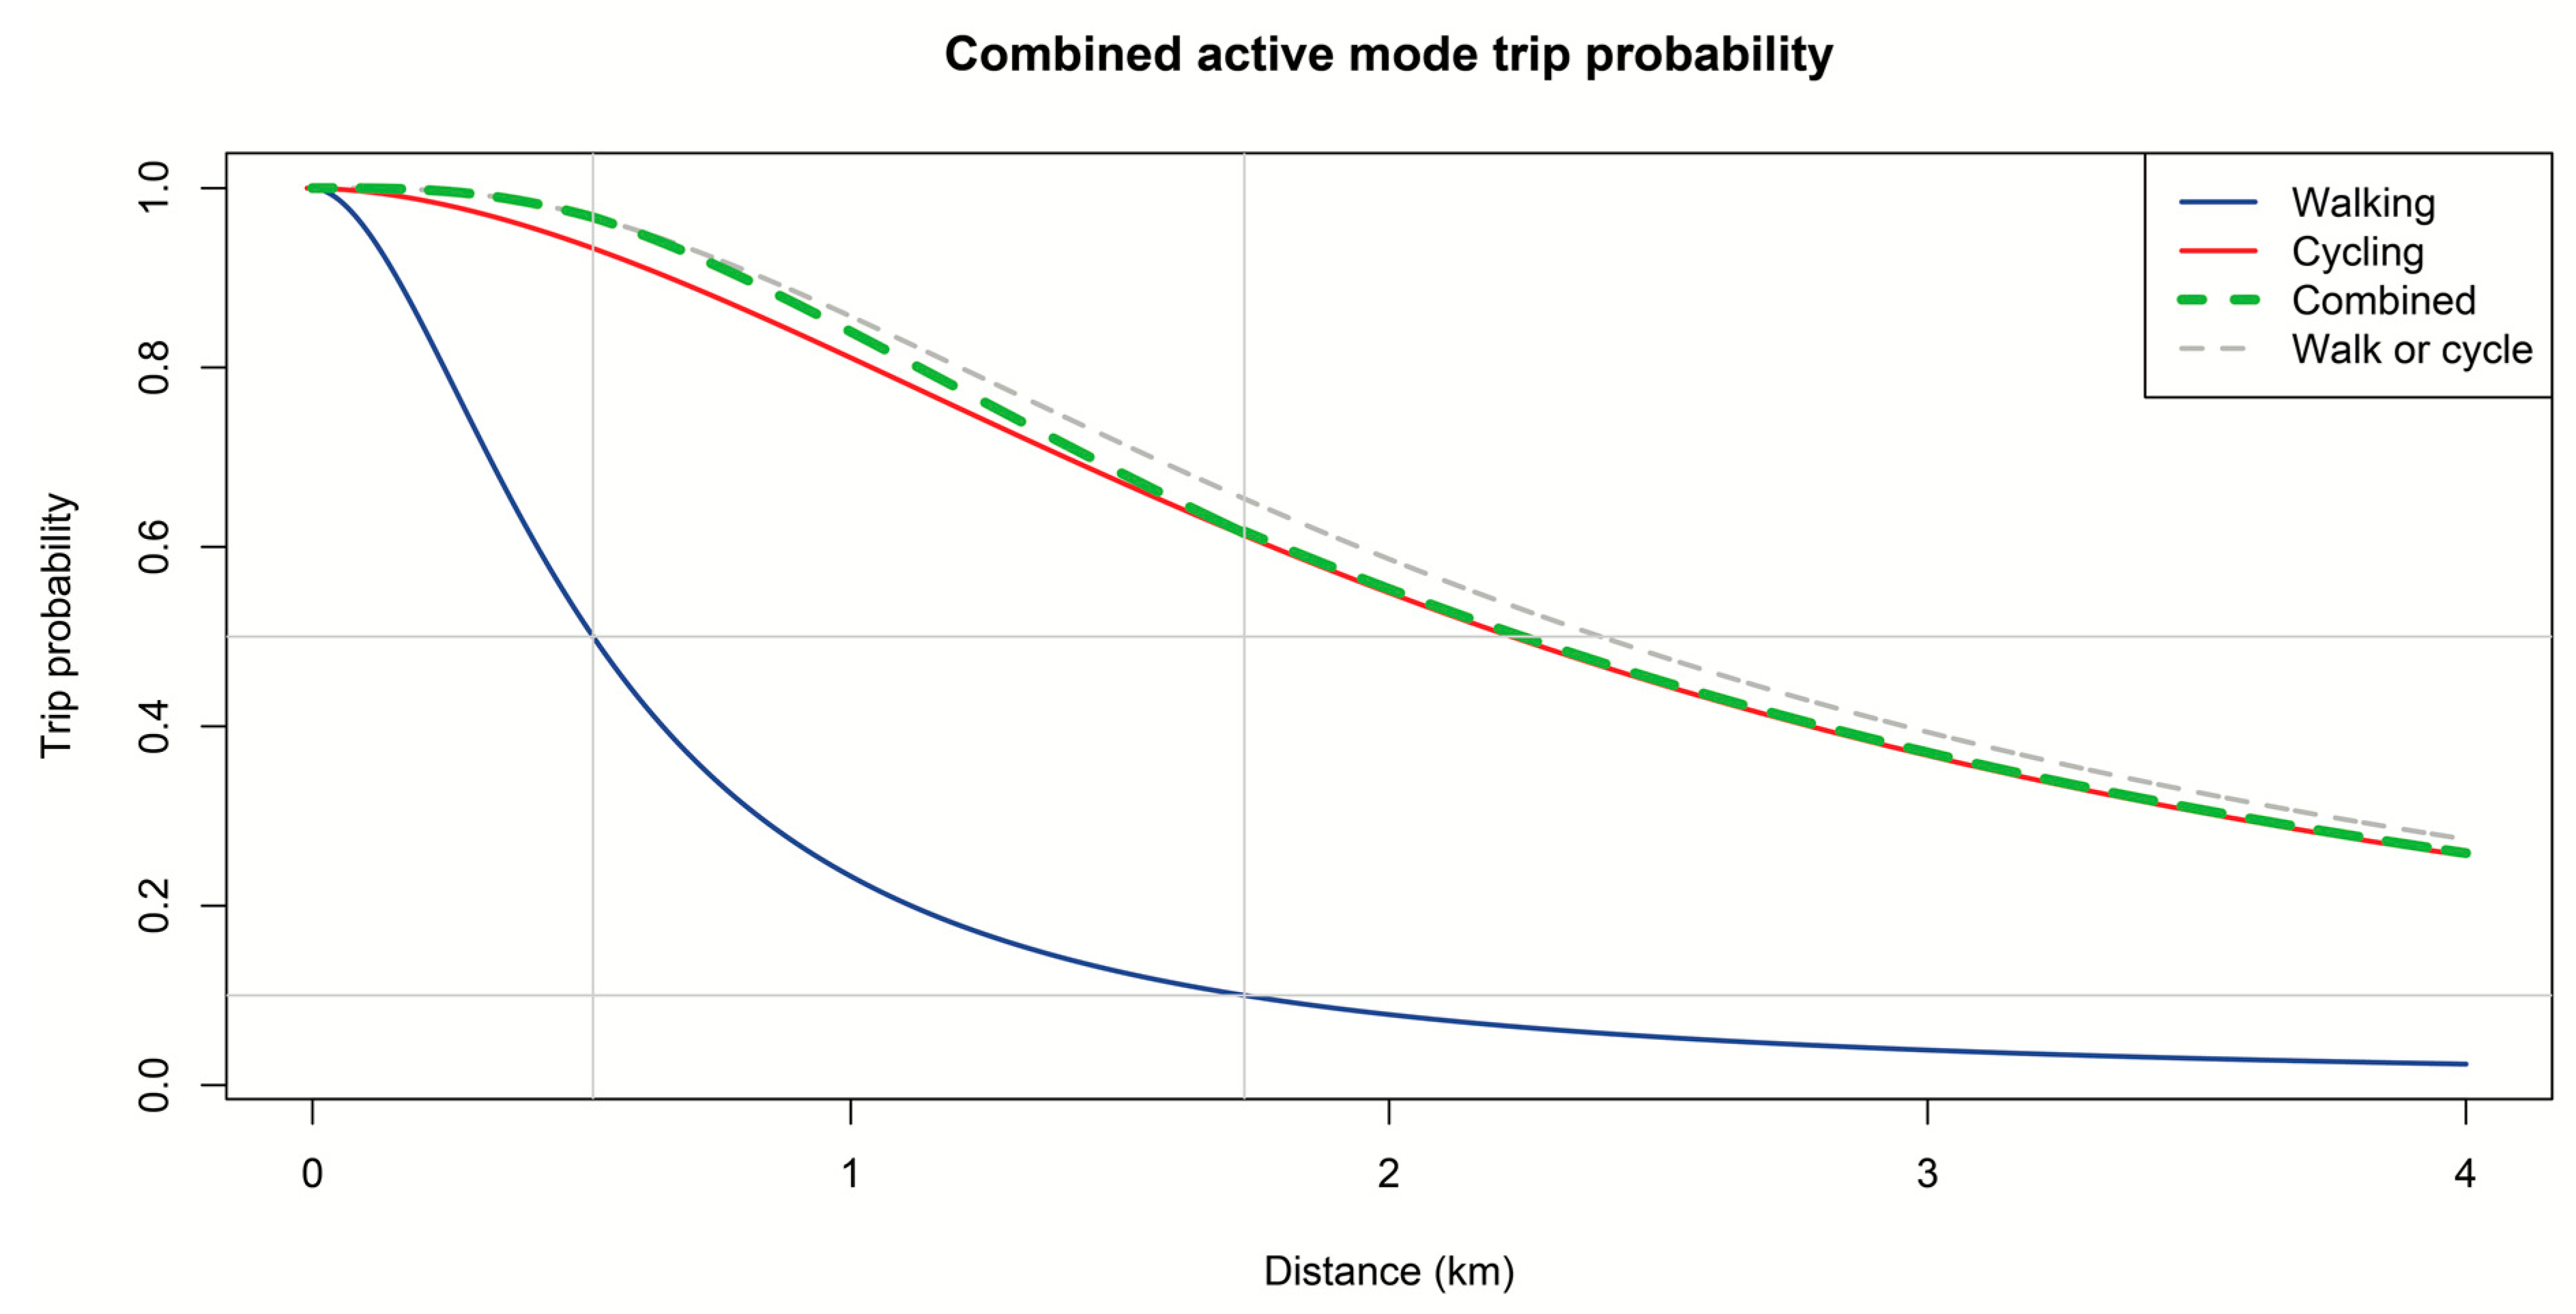
  • The following transport modes are considered: walking, cycling, private motorized transportation, and public transport. For each OD pair, trip probabilities for all those modes are obtained. The cycling mode is, however, considered only in one scenario (see #4 below). If it is considered, the trip probability for walking and cycling modes is evaluated as a function of distance and combined into a single active modal probability.
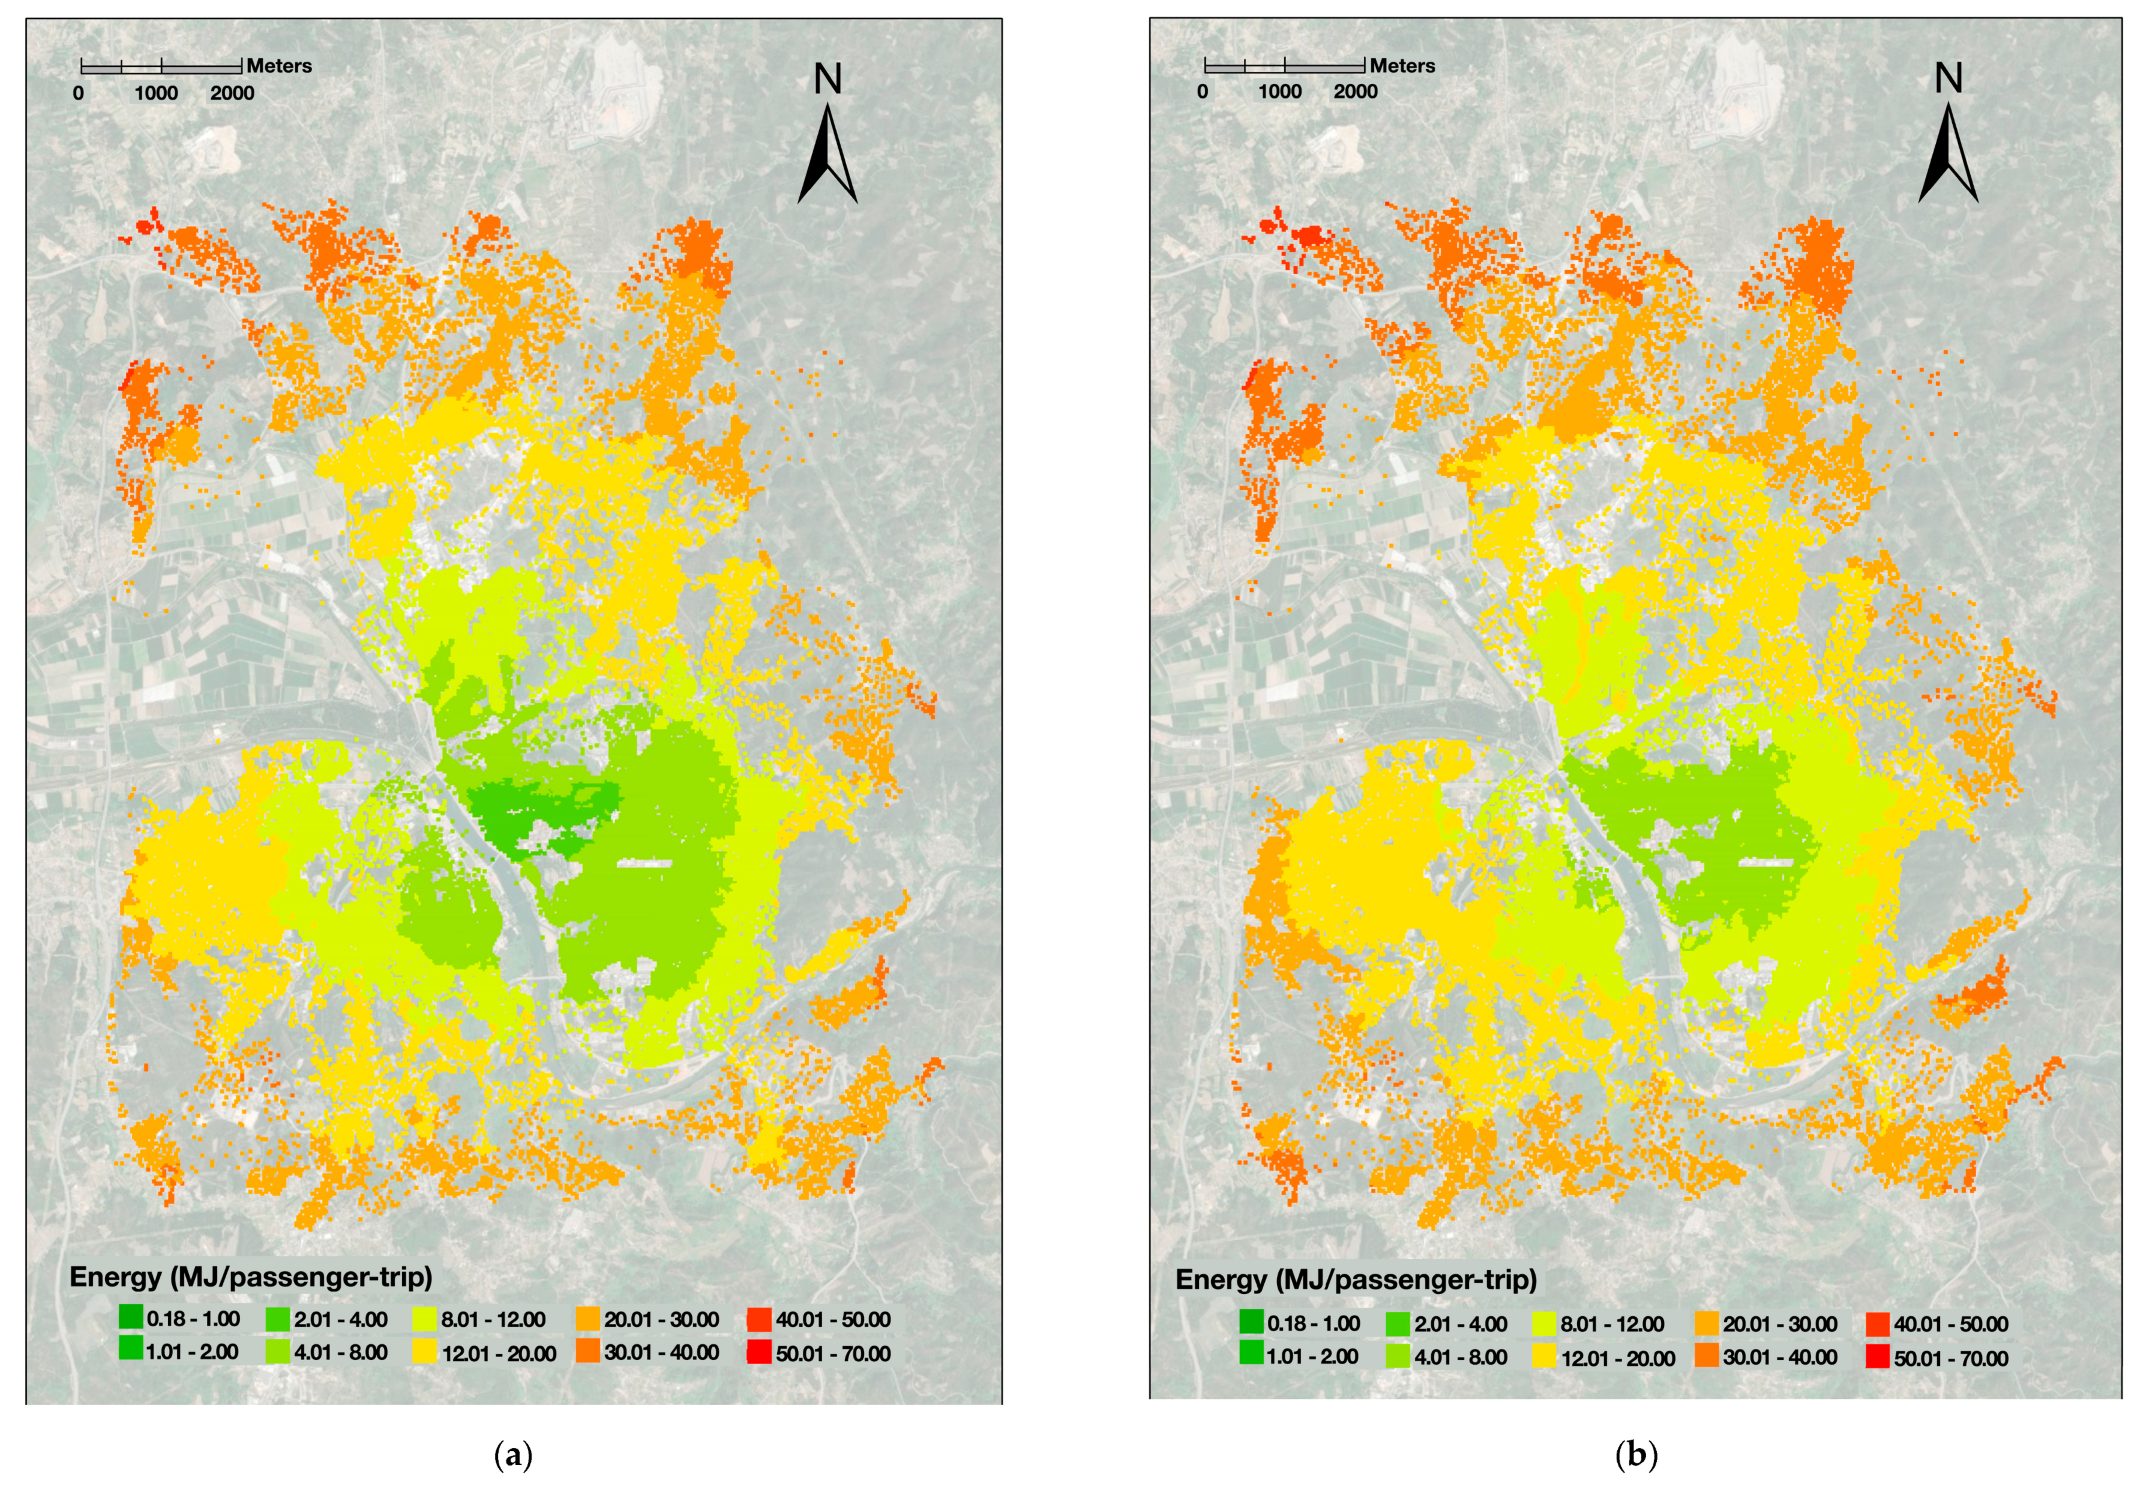
  • Two scenarios are evaluated: a first scenario, where cycling is not considered as a means of transport (i.e., cycling modal share set to 0%; only three transport modes are considered), and a second scenario, where cycling is included. Modal share distribution and the associated transport energy spending are calculated for each scenario.
The four transport modes indicated above are comprehensive categories. This division has been considered in recent urban mobility analyses [79,80,81,82] and simulations [83]. The cycling mode includes any type of cycle, including pedelec cycles. However, for simplicity, this research considered only the most common type, the bicycle. Private motorized transportation refers to private vehicles which do not require human muscular energy for locomotion, such as cars, motorcycles, scooters, etc. Public transport refers to any form of public transportation. Again, for simplicity, this research considered only the car for private motorized transportation and assumes this has an internal combustion engine (ICE). Likewise, for public transport, only ICE busses were considered.
The trips considered in the methodology are accessibility-related, with accessibility defined in the classic sense of the ease to reach destinations, i.e., interaction opportunities. Accessibility trips constitute the majority of trips in the urban environment and can be modeled in GIS as one-way or round trips to predefined destinations, subject to supply attractiveness and demand intensity.
The subsections below present implementation details and their rationale. Some GIS details are presented using the ArcGIS 10.8 tools language, but any other GIS environment can be used, provided its toolset can execute the operations described herein.

3.1. Defining the Datasets

As to what concerns dataset definition and curation, the methodological approach follows previously validated work by Monteiro et al. [83].

3.1.1. Origins

Centroids of residential buildings are given population information in their associated table. For large study areas, where route computational times might be too large, the alternative is to create a square mesh over the study area. The mesh size is tuneable, usually between 25 × 25 m and 100 × 100 m (smaller sizes yield greater precision but lead to longer computational times). Implementation involves creating the mesh and their centroids feature classes and then erasing centroids which lie a certain distance away from the road network, e.g., 50 to 100 m, together with their associated square polygons. Each mesh centroid is then given population information in its associated table using GIS Join tools. Finally, mesh squares and mesh centroids with zero population are erased.

3.1.2. Destinations: Urban Facilities

Destinations of the urban facility type consist of point feature classes. Facilities are divided into types, according to Table 1 below, and a feature class is created for each type. The points represent either building centroids or main entries. Destination attractiveness or weight needs to be considered when studying accessibility [84,85], and facility weights depend on their type. Following Monteiro et al. [83], this research proposes an empirical 1-2-3 Likert scale for weights, based on trip frequency, where 3 denotes the most frequent. Higher weights mean trips to the corresponding destinations are likely to be more frequent. For urban facilities, the above weights are consistent with the trip frequencies per facility type found by Gov.UK [43]. Some trips to facilities are naturally two-way trips, i.e., round trips, where the person returns to the origin soon after reaching the destination (e.g., supermarkets or post offices), while others are one-way, implying a long stay at the destination (e.g., entertainment). Because of the feeling of a longer distance when permanence time at a destination is short, distance to facilities which are likely to generate two-way trips is doubled in active trip probability calculations. Another point is that multiple opportunities should be considered in accessibility [86], as a person usually wants to have the option to reach, for example, several nearby restaurants or shopping centers. However, for some facility types, the person usually goes to the closest one, e.g., pharmacies or post offices. Consequently, multiple facilities need to be considered only for facility types for which freedom of choice is relevant. As an example, Martínez and Viegas [87] considered freedom of choice to the five closest facilities, as well as facilities without such freedom. Table 1 below shows the facility types considered in this research and summarizes the above considerations. In the Case Study section a map is shown with the spatial distribution of those facilities over the study area.

3.1.3. Destinations: Jobs

Destinations of the job type require a different approach; as a person usually has only one job, the concept of “nearest job” does not apply. In addition, precise job destination figures require knowing where the people from each origin work, which, in turn, requires large scale surveys, which are, in general, unavailable. Thus, this research uses traffic zone analysis [88,89] to approach job accessibility. This is implemented as follows [83]: identify job locations and employee count; assign these to a ‘jobs’ point feature class; divide the city into zones and create a ‘job zones’ polygon feature class; count jobs in each zone (intersect ‘jobs’ and ‘job zones’); and find the geometric average job location of each zone (GIS Mean Center spatial statistics tool). Finally, for each origin, calculate the distance to each job zone geometric average. Jobs are considered one-way facilities and their weight is proportional to the percentage of commuting trips within the study area. All job zones centroids are considered as destinations, and a ponderation by the fraction of jobs in each zone is later applied (see Section 3.4 below for details).

3.1.4. Road Network

The road network is the one existing on the field, with the addition of walking and cycling dedicated infrastructure, where it exists. Because of dedicated infrastructure, distance to facilities may depend on the transport mode, although the differences are usually small.

3.2. Obtaining GIS Distances

For deriving distances to facilities, the ArcGIS Closest Facility tool is used. The maximum snapping distance, i.e., straight-line distance from the network to a destination (or origin) point is the same used to remove faraway origins (usually 50–100 m). If a destination lies inside the study area but sits more than the snapping distance away from the network, then the snapping distance can be increased for that facility type. Motorized, walk, and cycle OD distances are obtained by solving Closest Facility problems for each facility type and transport mode. For facilities where freedom of choice is relevant, the distance to the K -closest facilities is calculated. For other facilities and jobs, K is always 1. For two-way facilities, OD distances are multiplied by two (if many one-way streets exist, separate towards and away distances can be calculated separately and added). All the OD distances obtained are stored in the origins feature class associated tables.

3.3. Estimating Modal Split

3.3.1. Individual Walking and Cycling Trip Probabilities

On the basis of the OD distance, a probability for carrying out the trip in active mode (walking or cycling) is calculated as follows. First, trip probability for individual walking and cycling modes is modelled via a log-logistic distribution:
p x = 1 1 + exp a + b ln x
where a and b are parameters, and x the network distance for the respective travel mode. The log-logistic function was chosen because it provides a good fit to experimental data, as recognized by Hilbers and Verroen [90] and Geurs and van Wee [86], and is not sensitive to small x instabilities that other trip probability models exhibit. However, log-logistic parameters for the walk and cycle modes are, in general, not available so for this research, they were obtained indirectly from the results of Yang and Diez-Roux [91] for the walk mode. Those authors presented walking trip frequency as a function of distance and trip purpose using a negative exponential law. Evaluating the distances for which the Yang and Diez-Roux law yields 10% and 90% walk probabilities, equating these benchmarks to Equation (1), and solving for a and b allows the log-logistic to be calibrated for the walk mode and for each destination type. This yields the parameters shown in Table 2 below:
For the cycling mode, users typically spend a similar time buffer in cycling trips as in walking trips [82]. However, the distance ridden by a bicycle is greater due to its higher speed. Walking speed can be modelled by, for example, Tobler’s hiking function [92], and cycling speed is available from Parkin and Rotheram [93]. Similar speeds, albeit slightly smaller, were found [94,95,96]. For zero slope, the Tobler walking speed is 1.4 m/s, whereas cyclist speed sits at approximately 6.0 m/s. The ratio of the two is approximately 0.233, which can be used as a multiplier for x for cycling trips while keeping the same a and b values of Table 2. A very similar ratio of walk/bike average distance was also found by Ton et al. [82].

3.3.2. Individual Walking and Cycling Trip Probabilities

The second step in obtaining an active trip probability requires combining walking and cycling probabilities into one single probability. This can be accomplished considering two ansätze: #1 for short distances, one has the choice either to walk or to use a bicycle. Thus, the probability p A of making the trip using an active mode can be modelled by the probability of walking ( p W ) or cycling ( p C ) to the destination. Mathematically, this can be expressed by p A = 1 1 p W 1 p C , where p W and p C are obtained by applying Equation (1) for distances x and 0.233 x , respectively. The above reasoning can be extended to all x , but active trip probabilities modelled by distance–decay functions can be optimistic at large x , and, therefore, p A above could lead to even more optimistic probabilities, possibly excessive, unrealistic ones (see [82,97] for examples regarding long distances lead to no use of active modes). For this reason, Ansatz #2 comes into play; for long enough distances, it is assumed that all active mode trips are of the cycling type. Defining what constitutes short and long distances is subject to decision-maker judgment; in this research, the following guideline is proposed: short trips are those for which p W 0.50 , and long trips have p W 0.10 . Trips in between are modelled by a linear interpolation between the two ansätze. The mathematical expression for the unified active trip probability is then:
p A x = 1 1 p W 1 p C p W 0.50 p C + 1 1 p W 1 p C p C 0.5 0.1 p W 0 , 1 0.10 p W 0.50 p C p W 0.10
Recall that p W and p C depend on destination type j , so the active trip probability may read p A j x to reflect this dependence. Equation (2) can be implemented in ArcGIS using the Field Calculator tool. Figure 1 below shows a graphical depiction of the trip probability curve for post-office access as a function of distance, x . In it, the p W (blue) and p C (red) curves are shown, along with the curve for walking or cycling following Ansatz #1 (dashed gray). The green curve is the interpolation result, Equation (2). The intersection of gray lines with the walking curve indicates the distances for which the walk probability is 50 and 10%.

3.3.3. Motorized Modal Split

Whenever a trip is not carried out actively, the person is assumed to resort to a motorized mode, which has consequences in terms of fossil energy spending and GHG emissions. The remaining probability is split between the private car and public transport (this split is equal for both scenarios). This research proposes a split based on the actual modal share for the study area, but other estimations of the modal split can be applied. Once the split is defined, fossil energy spending is evaluated. Walking and cycling are considered to spend zero fossil energy, and for private car and public motorized transport, average values per person can be assumed. In evaluating fossil energy spending, motorized trips are all two-way, as they in reality are.

3.4. Scenario Evaluation

Two indicators are obtained for comparing the no-cycling and full-cycling scenarios, namely active mode share and fossil energy spending.

3.4.1. Active Modal Share to All Destinations

The first indicator, active modal share, is obtained for every origin i by weighting active trip probabilities from that origin to all destinations by frequency and facility choice. This is accomplished using:
M i = j k w j L k j p A i j k j w j k L k j
where
  • M i : active modal share of origin i ;
  • i : 1 , , I number of origins;
  • j : 1 , , J number of types of destinations;
  • k : 1 , , K number of closest destinations of each type;
  • p A i j k : active trip probability from origin i to the k -th closest destination of type j ;
  • w j : attractiveness weight of destination of type j ;
  • L k j : choice factor for the k -th closest destination of type j; L k j > L k + 1 , j .
The p A i j k are obtained by applying Equation (2) for facility type j . Note that facilities of the “closest only” type have L k j = 0 for k > 1 . The normalization factors in the denominator ensure that M i values sit between 0 and 1 and can be interpreted as the doubly weighted average probabilities of performing accessibility trips with an active mode. The M i values can then be displayed on a map.
For jobs, p A i j k is obtained by a weighted-sum procedure over all job zones:
p A i j k = z f z p A i z ,     j : jobs
where
  • z : 1 , , Z number of job zones;
  • f z : fraction of total jobs in zone z ;
  • p A i z : active trip probability from origin i to the z -th job zone centroid.
As for p A i j k , the p A i z are obtained by applying Equation (2).

3.4.2. Fossil Energy Spending

Equation (5) is used to estimate the fossil energy spending associated to origin i :
E i = j k w j L k j 1 p A i j k p car F car + p pub F pub d i j k + d i j k j w j k L k j
where
  • p car : fraction of motorized trips made using a private car;
  • p pub : fraction of motorized trips made using public transportation;
  • F car : private car average fuel economy (MJ/passenger.km);
  • F pub : public transportation average fuel economy (MJ/passenger.km);
  • d i j k , d i j k : one-way distances from origin i towards/away, respectively, the k -th closest destination of type j .
The value 1 p A i j k represents the left-over probability that an accessibility trip is carried out by motorized modes, which is then split into private and public transport. The normalization denominator results in Equation (5) the interpretation of the (again, doubly weighted) average fuel spending in accessibility trips, as measured in MJ/passenger-trip. As with M i , the E i values can be displayed on a map.

3.4.3. No-Cycling vs. Full-Cycling Scenarios

Equations (3) and (5) represent the full-cycling scenario. For the no-cycling scenario, it is sufficient to replace p A i j k by p W i j k , the latter representing walk probability from origin i to the k -th closest destination of type j , a quantity that is directly available in GIS from intermediate steps (likewise, p A i z is replaced by p W i z ). Equations (3) and (5) and their no-cycling counterparts can be implemented in the ArcGIS environment using Field Calculator, and the results are stored in the origins feature class associated table.

4. Case Study

The methodology was applied to the city of Coimbra, Portugal, a mid-size city with approximately 104,000 inhabitants [98]. Data from Metro Mondego [99] disclose that the active modal share is approximately 22%, of which an abysmal 0.2% is cycling. The empirical motorized share splits as p car = 0.7 and p pub = 0.3 , and the share of commuting trips is 37% (survey data), leading to w j = 22 ,   j : jobs . Concerning fuel economy, IEA [100] averages were used, namely 1.8 MJ/passenger.km for private cars and 0.7 MJ/passenger.km for public transport. For non-closest facilities, a choice parameter of K = 3 was considered, and two sets of L k j were used for sensitivity analysis, namely L k j = 70 , 20 , 10 and L k j = 50 , 35 , 15 . Results concerning the latter are presented in the supplemental material.
For generating datasets, building centroids could be used as origins, so there was no need to create a mesh feature class. The official Portuguese GIS databases were used to distribute the population by the buildings. The location and type of urban facilities in Coimbra were obtained from existing datasets, as well as job locations and employee count. Job zones were manually drawn in GIS, considering population density, buildings, job density, and orography. The detailed road network of Coimbra was obtained from OpenStreetMap. Figure 2a depicts the mesh centroids after empty and faraway polygon removal, facility locations, and road network. Figure 2b depicts job zones and their geometric average job locations, as well as specific job locations with over 100 employees. All maps were derived in the ArcGIS environment, with background imagery provided by that platform (World Map Layer).

5. Results and Discussion

Applying the methodology to the case study data yielded the results of Table 3 and Table 4 and Figure 3 and Figure 4. In Table 3 and Table 4, the statistical calculations were carried out over mesh centroid data, except for the Average per inhabitant row whose statistics are related to centroid population, h i , via the formulas i M i h i i h i and i E i h i i h i and are the main result of this article. The outcome shows that realizing the full cycling potential of Coimbra has a large impact on the cycling share for accessibility trips, more than doubling it, both for facilities and facilities plus jobs, putting it at the level of the world’s most cycling-friendly cities, such as Amsterdam (61% active share) or Copenhagen (47% active share) [80,81]. Interestingly, the model–theoretical walking share for no cycling is 16.8%, which sits below the observed 22% [99]. This may be due to Coimbra having higher education as one of its main economic activities, which attracts many young people who typically resort to walking more often than older people. It may also be related to the effects of chained trips, i.e., trips to multiple destinations, and trips not related to accessibility, which were included in the survey [99] but which the present research could not consider.
With respect to energy spending, the impact of full cycling is a reduction of approximately 23% for accessibility to urban facilities and of 18% for facilities plus jobs. This impact is not as high as that for the modal share because Coimbra has a high urban sprawl. Fossil energy spending comes mostly from long-distance trips and faraway inhabitants, which are the biggest contributors to this spending, and have little chance to exercise a modal shift towards cycling. On the other hand, inhabitants near the center have better conditions for a shift towards cycling, but those inhabitants were already meager fossil fuel spenders. That full cycling has a high potential for modal shift but a lesser one for energy spending can also be seen from Figure 2 and Figure 3, which graphically exhibit a larger discrepancy for the former. The differential maps of the supplemental material (Figure S7a,b) add visual insights: the modal share differential map shows that the most potential for a change towards active travel lies in the central regions, up to 2–3 km away from the city center, whereas for transport energy, the most savings appear in a ring-like area around that center.
Referring back to Table 4, for transport energy spending, the full/no cycling differential is larger for facilities plus jobs (2.32 MJ/passenger-trip) than for facilities only (1.37 MJ/passenger-trip), revealing that a significant portion of fossil energy spending comes from trips to jobs. This is due to longer average distances to jobs and their high daily frequency and is confirmed by Table S3 of the supplemental material, which shows a differential of 4.22 MJ/passenger-trip if job-only trips are considered. Such importance of commuting trips suggests municipal authorities should first concentrate financial efforts in constructing good commuting routes which can foster bicycle use for this type of destination.
Another noticeable insight from Table 3 and Table 4 is that the full cycling scenario has lower dispersion measures, thus reducing the differences between those who live close to most facilities and jobs and those who live far away from those opportunities. This suggests cycling has a positive impact on equity in urban areas.
Despite the positive impact that cycling can have on both active modal share and transport energy spending, results show that urban sprawl still has a large impact, in line with similar results in the literature [101]. While cycling is known to be competitive compared with the private car in terms of time up to 5 km [11], this sprawling distance is inferior to that of the faraway regions of Coimbra, reducing the cycling potential for inhabitants of the outskirts and pushing them to the motorized modes. For these inhabitants, a way to reduce energy spending could be to promote a multimodal approach, e.g., transport of cycles on public transport, cyclists switching to busses when near the center.
A sensitivity analysis with L k j = 50 , 35 , 15 for non-closest only facilities was also carried out, statistical results being presented in the supplemental material. As per Equations (3) and (5), modal share and transport energy spending indicators degrade as L 1 j decreases, but other than that, results do not significantly deviate from those of Table 3 and Table 4; hence, no additional maps were generated.

Impact on City Planning

The above discussion leads to some conclusions with respect to city planning for the cycling mode. First and foremost, it was seen that even relatively sprawled urban environments (as Coimbra is) can aspire to high active modal shares, comparable to the world’s top cycling-friendly cities. However, achieving a full cycling scenario is not an easy task [102], as there are several strong deterrents to cycling that need to be addressed, with safety from motorized traffic and hilliness as the top concerns [103,104,105,106,107,108]. Hilliness is a topographical limitation and cannot be easily overcome, but mitigation measures exist, such as the placement of mechanical assistance devices in critical locations [109] or electrical assistance of the cycles themselves (pedelec cycles). Safety from traffic can be achieved with the construction of dedicated cycling infrastructure or adequate retrofitting of existing roads. Indeed, the correct implementation of a cycling network will greatly mitigate safety concerns. However, due to the financial costs of such endeavors, it is not realistic to expect a quick change from the no-cycling scenario to the full-cycling one. This is where the evidence gathered in this research becomes relevant, as the expected fossil energy savings suggest that authorities should prioritize a cycling network for commuting routes. Several proposals exist in the literature regarding how to obtain the best routes [110,111,112,113,114], which can be implemented by municipal decision-makers.
Another conclusion is that urban sprawl considerably limits the potential energy savings of a full-cycling scenario. This suggests that compactification of urban space is a possible way to reach that scenario, or at least come closer to it. Compactification can be achieved in practice, for example, by urbanizing unused space within cities or regenerating derelict zones. Such actions typically appeal to the private sector, which sees to their execution. If conducted in a cycling-friendly way, compactification increases cycling network connectivity and directness, which was recognized by Dingil et al. [115] as a factor which may persuade users to shift to this mode.
It should be noted that constructing or retrofitting complete walking and cycling networks, following all engineering, safety, and level of service requirements, is typically very expensive and requires many years of execution. To maximize the return on investment, municipalities will want to prioritize certain routes, especially cycling ones, as these are more expensive to implement. Recent research on route selection includes [116], which proposed an infrastructure building information model (I-BIM) for cycle path design, and [117], where a cycling traffic model was presented, aiming at sustainable urban mobility planning. This model was applied to a case study where optimal improvement locations were identified.

6. Summary and Future Work

In this article, a methodology to evaluate the potential impact of cycling on cities on the basis of active trip probability to urban facilities and jobs is presented. This impact is measured by comparing active modal share and fossil energy spending in two scenarios; one where urban areas have yet not adopted cycling and another where cycling is a well-established means of transport. However, providing cycling with all the prerequisite conditions requires a collective effort from municipal authorities, from creating the adequate infrastructure for cycling to promoting cycling as an alternative. The methodology outputs are important preliminary data to evaluate the cost–benefit relationship of undergoing such constructive and financial efforts.
The methodology was applied to the city of Coimbra, a mid-sized city exhibiting considerable sprawl, that has an almost nonexistent cycling modal share. Results showed the distanced-based potential of cycling in Coimbra, with the full-cycling scenario having an expected increase of active modal share between 25.8 and 30.6% and a reduction of transport energy spending between 1.37 and 2.32 MJ/passenger-trip. These provide clear evidence of the impact that cycling can have on urban areas, creating better mobility conditions, less automotive traffic, improved health conditions, and overall higher sustainability. A finer-grained analysis revealed interesting planning insights, such as the recommendation to prioritize commuting routes or compactification of the city (if/where possible). Although the latter conclusions are based on the case study alone, the authors expect them to be general enough to constitute planning guidelines in their own right. The model has the limitation that it considers only accessibility-related trips. However, since these constitute a very significant fraction of urban trips, the results should not differ considerably from reality (i.e., all trips).
Applying the methodology to other cities or urban neighborhoods and comparing results with Coimbra is a natural first step for future work. Other extensions of this work include analyzing the effect of chained trips on the results, whereby multiple destinations on each sortie are considered (e.g., home–work–shop–home), evaluating how effectively hilliness can be mitigated by pedelec cycles or mechanical aid devices, investigating the effects of weather on the results [118], or considering a multimodal approach (e.g., cycling plus public transport). On the technical side, the methodology requires some assumptions for estimating the active modal share and overall GIS parameterizing. In this article an ansatz for estimating the active modal share and a mean citizen approach for parameters were followed. It would be interesting in the future to validate the ansatz and to conduct a sensitivity analysis by segmentation of the population, e.g., by age group or socioeconomic status, which could affect destination weights and/or p A x parameters to investigate what differences might arise. It is also worth noting that the active mode probabilities do not consider issues of interaction with motorized transport supply/demand, e.g., high motorized congestion might increase active trip probability. Investigating the impact of such interactions is another possible follow-up. We hope to pursue some of these lines of research in the near future.

Supplementary Materials

The following supporting information can be downloaded at: https://www.mdpi.com/article/10.3390/ijgi12020048/s1, 1. Sensitivity Analysis on Lkj and job data statistics: Table S1; Active modal share summarizing statistics: Table S2. Modal share and fossil energy spending to jobs only. Table S3. Modal share and fossil energy spending to jobs only. 2. Full maps for Lkj = 70/20/10: (Figure S1a) Full cycling modal share to urban facilities; (Figure S1b) No cycling modal share to urban facilities; (Figure S2a) Full cycling modal share to urban facilities plus jobs; (Figure S2b) No cycling modal share to urban facilities plus jobs; (Figure S3a) Full cycling modal share to jobs; (Figure S3b) No cycling modal share to jobs; (Figure S4a) Full cycling fossil energy spending to urban facilities; (Figure S4b) No cycling fossil energy spending to urban facilities; (Figure S5a) Full cycling fossil energy spending to urban facilities plus jobs; (Figure S5b) No cycling fossil energy spending to urban facilities plus jobs; (Figure S6a) Full cycling fossil energy spending to jobs; (Figure S6b) No cycling fossil energy spending to jobs; (Figure S7a) Full cycling/no cycling modal share differential to urban facilities plus jobs; (Figure S7b) Full cycling/no cycling fossil energy spending differential to urban facilities plus jobs.

Author Contributions

Conceptualization, João Monteiro and Nuno Sousa; methodology, Nuno Sousa; software, João Monteiro and Nuno Sousa; validation, João Monteiro and Nuno Sousa; formal analysis, Nuno Sousa; investigation, João Monteiro; resources, João Coutinho-Rodrigues; data curation, João Monteiro; writing—original draft preparation, João Monteiro; writing—review and editing, Nuno Sousa, Eduardo Natividade-Jesus, and João Coutinho-Rodrigues; visualization, João Monteiro and Eduardo Natividade-Jesus; supervision, João Coutinho-Rodrigues; project administration, João Coutinho-Rodrigues; funding acquisition, Eduardo Natividade-Jesus and João Coutinho-Rodrigues. All authors have read and agreed to the published version of the manuscript.

Funding

This research was funded by the Portuguese Foundation for Science and Technology (FCT), grant numbers UIDB/00308/2020 and PD/BD/150589/2020.

Data Availability Statement

Not applicable.

Conflicts of Interest

The authors declare no conflict of interest. The funders had no role in the design of the study; in the collection, analyses, or interpretation of data; in the writing of the manuscript; or in the decision to publish the results.

References

  1. Li, X.; Xu, Y.; Chen, Q.; Wang, L.; Zhang, X.; Shi, W. Short-Term Forecast of Bicycle Usage in Bike Sharing Systems: A Spatial-Temporal Memory Network. IEEE Trans. Intell. Transp. Syst. 2021, 23, 10923–10934. [Google Scholar] [CrossRef]
  2. Holienčinová, M.; Kádeková, Z.; Holota, T.; Nagyová, L. Smart Solution of Traffic Congestion through Bike Sharing System in a Small City. Mob. Netw. Appl. 2020, 25, 868–875. [Google Scholar] [CrossRef]
  3. Bucher, D.; Buffat, R.; Froemelt, A.; Raubal, M. Energy and greenhouse gas emission reduction potentials resulting from different commuter electric bicycle adoption scenarios in Switzerland. Renew. Sustain. Energy Rev. 2019, 114, 109298. [Google Scholar] [CrossRef]
  4. de Nazelle, A.; Nieuwenhuijsen, M.J.; Antó, J.M.; Brauer, M.; Briggs, D.; Braun-Fahrlander, C.; Cavill, N.; Cooper, A.R.; Desqueyroux, H.; Fruin, S.; et al. Improving health through policies that promote active travel: A review of evidence to support integrated health impact assessment. Environ. Int. 2011, 37, 766–777. [Google Scholar] [CrossRef] [PubMed]
  5. Lindsay, G.; Macmillan, A.; Woodward, A. Moving urban trips from cars to bicycles: Impact on health and emissions. Aust. J. Public Health 2010, 35, 54–60. [Google Scholar] [CrossRef]
  6. Haslam, D.W.; James, W.P. B-type natriuretic peptide in cardiovascular disease. Lancet 2005, 366, 1197–1209. [Google Scholar] [CrossRef] [PubMed]
  7. Pucher, J.; Buehler, R.; Basset, D.; Dannenberg, L. Walking and cycling to health: A comparative analysis of city, state, and international data. Am. J. Public Health 2010, 100, 1986–1992. [Google Scholar] [CrossRef]
  8. Pisano, C. Strategies for Post-COVID Cities: An Insight to Paris En Commun and Milano. Sustainability 2020, 12, 5883. [Google Scholar] [CrossRef]
  9. Sun, S.; Wang, B.; Li, A. Shared bicycle study to help reduce carbon emissions in Beijing. Energy Rep. 2020, 6, 837–849. [Google Scholar] [CrossRef]
  10. Hamilton, T.L.; Wichman, C.J. Bicycle infrastructure and traffic congestion: Evidence from DC’s Capital Bikeshare. J. Environ. Econ. Manag. 2018, 87, 72–93. [Google Scholar] [CrossRef]
  11. Dekoster, J.; Schollaert, U. Cycling: The Way Ahead for Towns and Cities; Office for Official Publications of the European Communities: Luxembourg, Germany, 1999; ISBN 92-828-5724-7. Available online: https://ec.europa.eu/environment/archives/cycling/cycling_en.pdf (accessed on 23 January 2020).
  12. ECMT. National Policies to Promote Cycling, Brussels: European Conference of Ministers of Transport. 2004. Available online: http://www.internationaltransportforum.org/pub/pdf/04Cycling.pdf (accessed on 28 January 2023).
  13. Banerjee, A.; Łukawska, M.; Jensen, A.F.; Haustein, S. Facilitating bicycle commuting beyond short distances: Insights from existing literature. Transp. Rev. 2021, 42, 526–550. [Google Scholar] [CrossRef]
  14. Rosas-Satizábal, D.; Guzman, L.A.; Oviedo, D. Cycling diversity, accessibility, and equality: An analysis of cycling commuting in Bogotá. Transp. Res. Part D Transp. Environ. 2020, 88, 102562. [Google Scholar] [CrossRef]
  15. Dinu, M.; Pagliai, G.; Macchi, C.; Sofi, F. Active commuting and multiple health outcomes: A systematic review and meta-analysis. Sports Med. 2018, 49, 437–452. [Google Scholar] [CrossRef] [PubMed]
  16. Handy, S.L.; Van Wee, B.; Kroesen, M. Promoting cycling for transport: Research needs and challenges. Transp. Rev. 2014, 34, 4–24. [Google Scholar] [CrossRef]
  17. Buehler, R.; Pucher, J. Cycling to sustainability in Amsterdam. Sustain. J. Environ. Sustain. Issues 2010, 21, 36–40. Available online: https://ralphbu.files.wordpress.com/2015/03/sustain-21.pdf (accessed on 28 January 2023).
  18. International Transport Forum Cycling, Health and Safety; OECD Publishing/ITF: Paris, France, 2013. [CrossRef]
  19. Avila-Palencia, I.; Panis, L.I.; Dons, E.; Gaupp-Berghausen, M.; Raser, E.; Götschi, T.; Gerike, R.; Brand, C.; de Nazelle, A.; Orjuela, J.P.; et al. The effects of transport mode use on self-perceived health, mental health, and social contact measures: A cross-sectional and longitudinal study. Environ. Int. 2018, 120, 199–206. [Google Scholar] [CrossRef]
  20. Celis-Morales, C.A.; Lyall, D.M.; Welsh, P.; Anderson, J.; Steell, L.; Guo, Y.; Maldonado, R.; Mackay, D.F.; Pell, J.P.; Sattar, N.; et al. Association between active commuting and incident cardiovascular disease, cancer, and mortality: Prospective cohort study. BMJ Clin. Res. Ed. 2017, 357, j1456. [Google Scholar] [CrossRef]
  21. Mairie de Paris. Paris Dévoile Son Plan Vélo 2015–2020; Dossier de Presse: Paris, France, 2015; pp. 1–11. Available online: http://actionbarbes.blogspirit.com/media/02/02/4293917239.pdf (accessed on 28 January 2023).
  22. La Ville de Paris, Le Plan Vélo de Paris. Available online: https://www.paris.fr/pages/paris-a-velo-225 (accessed on 9 September 2022).
  23. Buehler, R.; Pucher, J. COVID-19 impacts on cycling, 2019–2020. Transp. Rev. 2021, 41, 393–400. [Google Scholar] [CrossRef]
  24. European Commission. 2020. Available online: https://ec.europa.eu/transport/themes/clean-transport-urban-transport/cycling_en (accessed on 31 July 2020).
  25. Buehler, R.; Dill, J. Bikeway Networks: A Review of Effects on Cycling. Transp. Rev. 2015, 36, 9–27. [Google Scholar] [CrossRef]
  26. Goeverdem, K.; Nielsen, K.; Harder, T.; Nes, R. Interventions in bicycle infrastructure: Lessons from Dutch and Danish cases. Transp. Res. Procedia 2015, 10, 403–412. [Google Scholar] [CrossRef] [Green Version]
  27. Caulfield, B. Re-cycling a city—Examining the growth of cycling in Dublin. Transp. Res. Part A Policy Pract. 2014, 61, 216–226. [Google Scholar] [CrossRef]
  28. Mayor of London. London Cycling Design Standards; Mayor of London: London, UK, 2014. Available online: https://content.tfl.gov.uk/lcds-chapter1-designrequirements.pdf (accessed on 28 January 2023).
  29. Benedini, D.J.; Lavieri, P.S.; Strambi, O. Understanding the use of private and shared bicycles in large emerging cities: The case of Sao Paulo, Brazil. Case Stud. Transp. Policy 2020, 8, 564–575. [Google Scholar] [CrossRef]
  30. Rosas-Satizábal, D.; Rodriguez-Valencia, A. Factors and policies explaining the emergence of the bicycle commuter in Bogotá. Case Stud. Transp. Policy 2018, 7, 138–149. [Google Scholar] [CrossRef]
  31. IMT—Instituto da Mobilidade e dos Transportes. Ciclando: Plano de Promoção da Bicicleta e Outros Modos Suaves. 2012. Available online: https://www.imt-ip.pt/sites/IMTT/Portugues/Planeamento/DocumentosdeReferencia/PlanoNacionalBicicleta/Documents/PPBOMS_Final.pdf (accessed on 28 January 2023). (In Portuguese).
  32. IMT—Instituto da Mobilidade e dos Transportes. Promoção da Bicicleta e Outros Modos Suaves. 2013. Available online: https://www.imt-ip.pt/sites/IMTT/Portugues/BibliotecaeArquivo/RepertorioIMT/ComunicacoeseArtigos/Documents/Promocao_da_bicicleta_e_outros_modos_suaves.pdf (accessed on 28 January 2023). (In Portuguese).
  33. IMT—Instituto da Mobilidade e dos Transportes. Regulamento Geral do Projeto U-Bike Portugal. 2016. Available online: https://www.imt-ip.pt/sites/IMTT/Portugues/Noticias/Documents/2015/IMT_PropostaRegulamentoProjeto_U_BikePortugal_vfinal_imp.pdf (accessed on 28 January 2023). (In Portuguese).
  34. National Transport Authority. National Cycle Manual; National Transport Authority: Dublin, Ireland, 2011. [Google Scholar]
  35. Buehler, R.; Pucher, J. Cycling through the COVID-19 pandemic to a more sustainable transport future: Evidence from case studies of 14 large bicycle-friendly cities in Europe and North America. Sustainability 2022, 14, 7293. [Google Scholar] [CrossRef]
  36. Schwarz, L.; Keler, A.; Krisp, J.M. Improving urban bicycle infrastructure-an exploratory study based on the effects from the COVID-19 lockdown. J. Urban Mobil. 2022, 2, 100013. [Google Scholar] [CrossRef]
  37. Kraus, S.; Koch, N. Provisional COVID-19 infrastructure induces large, rapid increases in cycling. Proc. Natl. Acad. Sci. USA 2021, 118, e2024399118. [Google Scholar] [CrossRef] [PubMed]
  38. Kwak, J.; Oh, H.; Jeong, I.; Shin, S.; Ku, D.; Lee, S. Changes in shared bicycle usage by COVID-19. Chem. Eng. Trans. 2021, 89, 169–174. [Google Scholar] [CrossRef]
  39. Raposo, F. Smart Cities. 2020. Available online: http://smart-cities.pt/arquitectura-e-urbanismo/barcelona-3004desconfinamentomobilidade/ (accessed on 1 August 2020).
  40. Davies, N.; Smith, G. The Print. 2020. Available online: https://theprint.in/world/how-cities-are-promoting-walking-cycling-to-reach-work-post-covid/427091/ (accessed on 1 August 2022).
  41. Kuebler, M. How Coronavirus is Changing Urban Mobility. 2020. Available online: https://www.dw.com/en/coronavirus-inspires-cities-to-push-climate-friendly-mobility/a-53390186 (accessed on 1 August 2020).
  42. Packham, A. ‘I Will NEVER Ride a Bike Again’: Why People Are Giving up on Cycling, The Guardian. 2022. Available online: https://amp.theguardian.com/lifeandstyle/2022/sep/01/i-will-never-ride-a-bike-again-why-people-are-giving-up-on-cycling (accessed on 12 September 2022).
  43. GOV.UK. NTS0403: Average Number of Trips, Miles and Time SPENT Travelling by TRIP Purpose: England, Statistical Data Set—Purpose of Travel. Available online: https://www.gov.uk/government/statistical-data-sets/nts04-purpose-of-trips (accessed on 9 September 2022).
  44. Parkin, J. Designing for Cycle Traffic: International Principles and Practice; ICE Publishing: London, UK, 2018; ISBN 978-0-7277-6349-5. [Google Scholar]
  45. Tralhão, L.; Sousa, N.; Ribeiro, N.; Coutinho-Rodrigues, J. Design of bicycling suitability maps for hilly cities. Proc. Inst. Civ. Eng. Munic. Eng. 2015, 168, 96–105. [Google Scholar] [CrossRef]
  46. Monteiro, J.; Sousa, N.; Natividade-Jesus, E.; Coutinho-Rodrigues, J. Metodologia Multicritério para Avaliação da Adequabilidade da Infraestrutura Viária Urbana à Bicicleta, 8º Congresso Luso-Brasileiro para o Planeamento Urbano, Regional, Integrado e Sustentável 2018, Article 1640. Available online: https://www.dec.uc.pt/pluris2018/Paper1640.pdf (accessed on 28 January 2023).
  47. Pais, F.; Monteiro, J.; Sousa, N.; Coutinho-Rodrigues, J.; Natividade-Jesus, E. A multicriteria methodology for maintenance planning of cycling infrastructure. Proc. Inst. Civ. Eng.—Eng. Sustain. 2022, 175, 248–264. [Google Scholar] [CrossRef]
  48. Codina, O.; Maciejewska, M.; Nadal, J.; Marquet, O. Built environment bikeability as a predictor of cycling frequency: Lessons from Barcelona. Transp. Res. Interdiscip. Perspect. 2022, 16, 100725. [Google Scholar] [CrossRef]
  49. Fowler, S.L.; Berrigan, D.; Pollack, K.M. Perceived barriers to bicycling in an urban U.S. environment. J. Transp. Health 2017, 6, 474–480. [Google Scholar] [CrossRef]
  50. Pearson, L.; Gabbe, B.; Reeder, S.; Beck, B. Barriers and enablers of bike riding for transport and recreational purposes in Australia. J. Transp. Health 2023, 28, 101538. [Google Scholar] [CrossRef]
  51. Raustorp, J.; Koglin, T. The potential for active commuting by bicycle and its possible effects on public health. J. Transp. Health 2019, 13, 72–77. [Google Scholar] [CrossRef]
  52. Barberan, A.; Monzon, A. How did Bicycle Share Increase in Vitoria-Gasteiz? Transp. Res. Procedia 2016, 18, 312–319. [Google Scholar] [CrossRef]
  53. Zhang, H.; Shaheen, S.; Chen, X. Bicycle evolution in China: From the 1900s to the present. Int. J. Sustain. Transp. 2013, 8, 317–335. [Google Scholar] [CrossRef]
  54. Lovelace, R.; Beck, S.; Watson, M.; Wild, A. Assessing the energy implications of replacing car trips with bicycle trips in Sheffield, UK. Energy Policy 2011, 39, 2075–2087. [Google Scholar] [CrossRef]
  55. Pritchard, R.; Bucher, D.; Frøyen, Y. Does new bicycle infrastructure result in new or rerouted bicyclists? A longitudinal GPS study in Oslo. J. Transp. Geogr. 2019, 77, 113–125. [Google Scholar] [CrossRef]
  56. Goetzke, F.; Rave, T. Bicycle use in Germany: Explaining differences between municipalities with social network effects. Urban Stud. 2010, 48, 427–437. [Google Scholar] [CrossRef]
  57. Lanzendorf, M.; Busch-Geertsema, A. The cycling boom in large German cities—Empirical evidence for successful cycling campaigns. Transp. Policy 2014, 36, 26–33. [Google Scholar] [CrossRef]
  58. Rietveld, P.; Daniel, V. Determinants of bicycle use: Do municipal policies matter? Transp. Res. Part A Policy Pract. 2004, 38, 531–550. [Google Scholar] [CrossRef]
  59. Teixeira, J.F.; Silva, C.; e Sá, F.M. Empirical evidence on the impacts of bikesharing: A literature review. Transp. Rev. 2020, 41, 329–351. [Google Scholar] [CrossRef]
  60. Félix, R.; Cambra, P.; Moura, F. Build it and give ‘em bikes, and they will come: The effects of cycling infrastructure and bike-sharing system in Lisbon. Case Stud. Transp. Policy 2020, 8, 672–682. [Google Scholar] [CrossRef]
  61. Murphy, E.; Usher, J. The Role of Bicycle-sharing in the City: Analysis of the Irish Experience. Int. J. Sustain. Transp. 2014, 9, 116–125. [Google Scholar] [CrossRef]
  62. Buck, M.; Nurse, A. Cycling in an ‘ordinary city’: A practice theory approach to supporting a modal shift. Int. J. Sustain. Transp. 2023, 17, 65–76. [Google Scholar] [CrossRef]
  63. Oakil, A.T.; Ettema, D.; Arentze, T.T.; Timmermans, H.H. Bicycle commuting in the Netherlands: An analysis of modal shift and its dependence on life cycle and mobility events. Int. J. Sustain. Transp. 2014, 10, 376–384. [Google Scholar] [CrossRef]
  64. Owen, A.; Levinson, D.M. Modeling the commute mode share of transit using continuous accessibility to jobs. Transp. Res. Part A Policy Pract. 2015, 74, 110–122. [Google Scholar] [CrossRef]
  65. Barton, H.; Horswell, M.; Grant, M. Suburban solutions: The other side of the story. In Town & Country Planning; July/August Issue; Liverpool University Press: Liverpool, UK, 2011; pp. 339–345. [Google Scholar]
  66. Birr, K. Mode Choice Modeling for Urban Areas. Ph.D. Thesis, Cracow University of Technology, Kraków, Poland, 2018. [Google Scholar]
  67. Kaza, N. Urban form and transportation energy consumption. Energy Policy 2019, 136, 111049. [Google Scholar] [CrossRef]
  68. Midenet, S.; Côme, E.; Papon, F. Modal shift potential of improvements in cycle access to exurban train stations. Case Stud. Transp. Policy 2018, 6, 743–752. [Google Scholar] [CrossRef]
  69. Haghshenas, H.; Vaziri, M.; Gholamialam, A. Evaluation of sustainable policy in urban transportation using system dynamics and world cities data: A case study in Isfahan. Cities 2015, 45, 104–115. [Google Scholar] [CrossRef]
  70. Santos, G.; Maoh, H.; Potoglou, D.; von Brunn, T. Factors influencing modal split of commuting journeys in medium-size European cities. J. Transp. Geogr. 2013, 30, 127–137. [Google Scholar] [CrossRef]
  71. den Boer, E.; van Essen, H.; Brouwer, F.; Pastori, E.; Moizo, A. Potential of Modal Shift to Rail Transport Study on the Projected Effects on GHG Emissions and Transport Volumes; CE Delft: Delft, The Netherlands, 2011; Publication: No. 11.4255.15; pp. 1–119. Available online: https://www.worldtransitresearch.info/research/3953/ (accessed on 28 January 2023).
  72. Cervero, R.; Radisch, C. Travel choices in pedestrian versus automobile oriented neighborhoods. Transp. Policy 1996, 3, 127–141. [Google Scholar] [CrossRef]
  73. Pucher, J. Urban Travel Behavior as the Outcome of Public Policy: The Example of Modal-Split in Western Europe and North America. J. Am. Plan. Assoc. 1988, 54, 509–520. [Google Scholar] [CrossRef]
  74. Hu, S.; Xiong, C.; Liu, Z.; Zhang, L. Examining spatiotemporal changing patterns of bike-sharing usage during COVID-19 pandemic. J. Transp. Geogr. 2021, 91, 102997. [Google Scholar] [CrossRef] [PubMed]
  75. Nikiforiadis, A.; Ayfantopoulou, G.; Stamelou, A. Assessing the impact of COVID-19 on bike-sharing usage: The case of Thessaloniki, Greece. Sustainability 2020, 12, 8215. [Google Scholar] [CrossRef]
  76. Teixeira, J.F.; Lopes, M. The link between bike sharing and subway use during the COVID-19 pandemic: The case-study of New York’s Citi Bike. Transp. Res. Interdiscip. Perspect. 2020, 6, 100166. [Google Scholar] [CrossRef]
  77. Campisi, T.; Moslem, S.; Al-Rashid, M.A.; Tesoriere, G. Optimal urban planning through the best–worst method: Bicycle lanes in Palermo, Sicily. Proc. Inst. Civ. Eng. Transp. 2022, 1–11. [Google Scholar] [CrossRef]
  78. Jiao, J.; Lee, H.K.; Choi, S.J. Impacts of COVID-19 on bike-sharing usages in Seoul, South Korea. Cities 2022, 130, 103849. [Google Scholar] [CrossRef]
  79. Giuliano, G.; Hanson, S. The Geography of Urban Transportation; Guildford Press: New York, NY, USA, 2017; pp. 1–400. ISBN 9781462529650. [Google Scholar]
  80. Dixon, S.; Irshad, H.; Pankratz, M.; Bornstein, J. The 2019 Deloitte City Mobility Index: Gauging Global Readiness for the Future of Mobility. Deloitte Insights: Amsterdam, The Netherlands, 2019. Available online: https://www2.deloitte.com/content/dam/insights/us/articles/4331_Deloitte-City-Mobility-Index/Amsterdam_GlobalCityMobility_WEB.pdf (accessed on 28 January 2023).
  81. Dixon, S.; Irshad, H.; Pankratz, M.; Bornstein, J. The 2019 Deloitte City Mobility Index: Gauging Global Readiness for the Future of Mobility. Deloitte Insights: Copenhagen, Denmark, 2019. Available online: https://www2.deloitte.com/content/dam/insights/us/articles/4331_Deloitte-City-Mobility-Index/Copenhagen_GlobalCityMobility_WEB.pdf (accessed on 28 January 2023).
  82. Ton, D.; Duives, D.C.; Cats, O.; Hoogendoorn-Lanser, S.; Hoogendoorn, S.P. Cycling or walking? Determinants of mode choice in the Netherlands. Transp. Res. Part A Policy Pract. 2018, 123, 7–23. [Google Scholar] [CrossRef]
  83. Monteiro, J.; Sousa, N.; Natividade-Jesus, E.; Coutinho-Rodrigues, J. Benchmarking City Layouts—A Methodological Approach and an Accessibility Comparison between a Real City and the Garden City. Sustainability 2022, 14, 5029. [Google Scholar] [CrossRef]
  84. Handy, S. Is accessibility an idea whose time has finally come? Transp. Res. Part D: Transp. Environ. 2020, 83, 102319. [Google Scholar] [CrossRef]
  85. Schläpfer, M.; Dong, L.; O’Keeffe, K.; Santi, P.; Szell, M.; Salat, H.; Anklesaria, S.; Vazifeh, M.; Ratti, C.; West, G.B. The universal visitation law of human mobility. Nature 2021, 593, 522–527. [Google Scholar] [CrossRef] [PubMed]
  86. Geurs, K.T.; van Wee, B. Accessibility evaluation of land-use and transport strategies: Review and research directions. J. Transp. Geogr. 2003, 12, 127–140. [Google Scholar] [CrossRef]
  87. Martínez, L.M.; Viegas, J.M. A new approach to modelling distance-decay functions for accessibility assessment in transport studies. J. Transp. Geogr. 2013, 26, 87–96. [Google Scholar] [CrossRef]
  88. Miller, E. Traffic Analysis Zone Definition: Issues & Guidance. In Travelling Modelling Group; University of Toronto: Toronto, ON, Canada, 2021; pp. 1–22. Available online: https://tmg.utoronto.ca/files/Reports/Traffic-Zone-Guidance_March-2021_Final.pdf (accessed on 28 January 2023).
  89. Martínez, L.M.; Viegas, J.M.; Silva, E.A. A traffic analysis zone definition: A new methodology and algorithm. Transportation 2009, 36, 581–599. [Google Scholar] [CrossRef]
  90. Hilbers, D.; Verroen, J. Measuring accessibility, a key factor for successful transport and land-use planning strategies. In Proceedings of the 21st PTRC Summer Annual Meeting, University of Manchester, Manchester, UK, 13–17 September 1993; ISBN 0860502511. [Google Scholar]
  91. Yang, Y.; Diez-Roux, A.V. Walking Distance by Trip Purpose and Population Subgroups. Am. J. Prev. Med. 2012, 43, 11–19. [Google Scholar] [CrossRef]
  92. Tobler, W. Three presentations on geographical Analysis and modeling: Non-isotropic geographic modeling speculations on the geometry of geography and global spatial analysis. Natl. Cent. Geogr. Inf. Anal. 1993, 93, 1–26. Available online: https://escholarship.org/uc/item/05r820mz (accessed on 28 January 2023).
  93. Parkin, J.; Rotheram, J. Design speeds and acceleration characteristics of bicycle traffic for use in planning, design and appraisal. Transp. Policy 2010, 17, 335–341. [Google Scholar] [CrossRef]
  94. Clarry, A.; Imani, A.F.; Miller, E.J. Where we ride faster? Examining cycling speed using smartphone GPS data. Sustain. Cities Soc. 2019, 49, 101594. [Google Scholar] [CrossRef]
  95. Flügel, S.; Hulleberg, N.; Fyhri, A.; Weber, C.; Ævarsson, G. Empirical speed models for cycling in the Oslo road network. Transportation 2017, 46, 1395–1419. [Google Scholar] [CrossRef]
  96. Strauss, J.; Miranda-Moreno, L.F. Speed, travel time and delay for intersections and road segments in the Montreal network using cyclist Smartphone GPS data. Transp. Res. Part D Transp. Environ. 2017, 57, 155–171. [Google Scholar] [CrossRef]
  97. Rijsman, L.; van Oort, N.; Ton, D.; Hoogendoorn, S.; Molin, E.; Teijl, T. Walking and bicycle catchment areas of tram stops: Factors and insights. In Proceedings of the 6th International Conference on Models and Technologies for Intelligent Transportation Systems (MT-ITS), Kraków, Poland, 5–7 June 2019; pp. 1–5. [Google Scholar] [CrossRef]
  98. INE—Instituto Nacional de Estatística. 2021. Available online: https://www.ine.pt/scripts/db_censos_2021.html (accessed on 30 September 2022). (In Portuguese).
  99. Metro Mondego. Avaliação e Estudo da Zona Urbana de Coimbra para a Criação de um Metro de Superfície, Metro Mondego, Coimbra. 2011. Available online: https://www.metromondego.pt/pt (accessed on 28 January 2023). (In Portuguese).
  100. International Energy Agency. 2020. Available online: https://www.iea.org/data-and-statistics/charts/energy-intensity-of-passenger-transport-modes-2018 (accessed on 15 July 2020).
  101. Tannier, C.; Vuidel, G.; Houot, H.; Frankhauser, P. Spatial accessibility to amenities in fractal and nonfractal urban patterns. Environ. Plan. B: Plan. Des. 2012, 39, 801–819. [Google Scholar] [CrossRef]
  102. Lock, O.; Pettit, C. Developing participatory analytics techniques to inform the prioritisation of cycling infrastructure. ISPRS Int. J. Geo-Inform. 2022, 11, 78. [Google Scholar] [CrossRef]
  103. Tscharaktschiew, S.; Müller, S. Ride to the hills, ride to your school: Physical effort and mode choice. Transp. Res. Part D Transp. Environ. 2021, 98, 102983. [Google Scholar] [CrossRef]
  104. Müller, S.; Mejia-Dorantes, L.; Kersten, E. Analysis of active school transportation in hilly urban environments: A case study of Dresden. J. Transp. Geogr. 2020, 88, 102872. [Google Scholar] [CrossRef]
  105. Kaplan, S.; Vavatsoulas, K.; Prato, C.G. Aggravating and mitigating factors associated with cyclist injury severity in Denmark. J. Saf. Res. 2014, 50, 75–82. [Google Scholar] [CrossRef]
  106. Kaplan, S.; Prato, C.G. “Them or Us”: Perceptions, cognitions, emotions and overt behavior associated with cyclists and motorists sharing the road. Int. J. Sustain. Transp. 2014, 10, 193–200. [Google Scholar] [CrossRef]
  107. Nordback, K.; Marshall, W.E.; Janson, B.N. Bicyclist safety performance functions for a U.S. city. Accid. Anal. Prev. 2014, 65, 114–122. [Google Scholar] [CrossRef]
  108. Werner, C.; Resch, B.; Loidl, M. Evaluating Urban Bicycle Infrastructures through Intersubjectivity of Stress Sensations Derived from Physiological Measurements. ISPRS Int. J. Geo-Inform. 2019, 8, 265. [Google Scholar] [CrossRef]
  109. Sousa, N.; Coutinho-Rodrigues, J.; Gonçalves, A. Pedelec on a hilly city: A case study in Coimbra. In Proceedings of the Energy for Sustainability International Conference, Funchal, Island of Madeira, Portugal, 8–10 February 2017; Available online: http://hdl.handle.net/10400.2/6201 (accessed on 28 January 2023).
  110. Chen, C.-Y.; Yan, S.; Tseng, H.-T. A model with a solution algorithm for the improvement of an existing bikeway network. Proc. Inst. Civ. Eng. Munic. Eng. 2020, 173, 3–13. [Google Scholar] [CrossRef]
  111. Steinacker, C.; Storch, D.-M.; Timme, M.; Schröder, M. Demand-driven design of bicycle infrastructure networks for improved urban bikeability. Nat. Comput. Sci. 2022, 2, 655–664. [Google Scholar] [CrossRef]
  112. Suzuki, K.; Kanda, Y.; Doi, K.; Tsuchizaki, N. Proposal and Application of a New Method for Bicycle Network Planning. Procedia Soc. Behav. Sci. 2012, 43, 558–570. [Google Scholar] [CrossRef]
  113. Pritchard, R.; Frøyen, Y.; Snizek, B. Bicycle Level of Service for Route Choice—A GIS Evaluation of Four Existing Indicators with Empirical Data. ISPRS Int. J. Geo-Inform. 2019, 8, 214. [Google Scholar] [CrossRef]
  114. Costa, M.; Marques, M.; Moura, F. A Circuity Temporal Analysis of Urban Street Networks Using Open Data: A Lisbon Case Study. ISPRS Int. J. Geo-Inform. 2021, 10, 453. [Google Scholar] [CrossRef]
  115. Dingil, A.E.; Rupi, F.; Stasiskiene, Z. A Macroscopic analysis of transport networks: The influence of network design on urban transportation performance. Int. J. Transp. Dev. Integr. 2019, 3, 331–343. [Google Scholar] [CrossRef]
  116. Campisi, T.; Acampa, G.; Marino, G.; Tesoriere, G. Cycling Master Plans in Italy: The I-BIM Feasibility Tool for Cost and Safety Assessments. Sustainability 2020, 12, 4723. [Google Scholar] [CrossRef]
  117. Oskarbski, J.; Birr, K.; Żarski, K. Bicycle Traffic Model for Sustainable Urban Mobility Planning. Energies 2021, 14, 5970. [Google Scholar] [CrossRef]
  118. Thomas, T.; Jaarsma, R.; Tutert, B. Exploring temporal fluctuations of daily cycling demand on Dutch cycle paths: The influence of weather on cycling. Transportation 2012, 40, 1–22. [Google Scholar] [CrossRef] [Green Version]
Figure 1. Combined active mode trip probability function for accessibility to post-offices.
Ijgi 12 00048 g001
Figure 2. (a) Coimbra origins, urban facilities, and road network; (b) Coimbra job zones and main job locations.
Ijgi 12 00048 g002
Figure 3. (a) Active modal share for full cycling: facilities and jobs; (b) Active modal share for no cycling: facilities and jobs.
Ijgi 12 00048 g003
Figure 4. (a) Fossil energy spending for full cycling: facilities and jobs; (b) Fossil energy spending for no cycling: facilities and jobs.
Ijgi 12 00048 g004
Table 1. Facility types and jobs weights.
Weight 1 FacilitiesWeight 2 FacilitiesWeight 3 Facilities
Post offices *,2High schools 1Kindergartens *,2
Sports facilities 2Shopping centers 2Primary schools *,2
Cultural organizations 1Entertainment sites 1Middle schools *,1
Universities and institutes 1Primary healthcare services *,1Grocery stores 2
Elderly care centers 1Pharmacies *,2Supermarkets 2
Churches 1Restaurants 1Bakeries and pastry shops 2
Parks and green areas *,1
* Closest only, 1 One-way facility, 2 Two-way facility.
Table 2. Log-logistic parameters for walking.
Destination Typeaj (Distance: Km)bj (Distance: Km)
Post offices1.192251.83021
Sports facilities0.055741.83013
Cultural organizations1.003441.82990
Universities and institutes1.077751.82989
Elderly care centers1.192251.83021
Churches1.003441.82990
High schools1.077751.82989
Shopping centers1.192251.83021
Entertainment sites1.003441.82990
Primary healthcare services1.192251.83021
Pharmacies1.192251.83021
Restaurants1.462151.83009
Parks and green areas1.003441.82990
Kindergartens1.462151.83009
Primary schools1.462151.83009
Middle schools1.462151.83009
Grocery stores1.192251.83021
Supermarkets1.192251.83021
Bakeries and pastry shops1.462151.83009
Jobs0.896271.83017
Table 3. Active modal share summarizing statistics.
Active Modal Share Per Inhabitant (%)Urban FacilitiesUrban Facilities and Jobs
L k j Measurefull cyclingno cyclingfull cyclingno cycling
70/20/10Min3.30.53.50.4
Max94.371.873.748.0
Average45.818.635.612.7
Average per inhabitant55.324.742.616.8
Standard deviation24.915.918.710.6
Coefficient of variation54%90%52%87%
Table 4. Fossil energy spending summarizing statistics.
Active Modal Share Per Inhabitant (%)Urban FacilitiesUrban Facilities and Jobs
L k j Measurefull cyclingno cyclingfull cyclingno cycling
70/20/10Min0.190.693.295.32
Max35.3736.3446.1647.59
Average6.708.1813.5415.88
Average per inhabitant4.535.9010.6913.01
Standard deviation6.176.217.977.69
Coefficient of variation92%76%59%48%
Disclaimer/Publisher’s Note: The statements, opinions and data contained in all publications are solely those of the individual author(s) and contributor(s) and not of MDPI and/or the editor(s). MDPI and/or the editor(s) disclaim responsibility for any injury to people or property resulting from any ideas, methods, instructions or products referred to in the content.

