Abstract
Three-dimensional city models are increasingly being used for analyses and simulations. To enable such applications, it is necessary to standardise semantically richer city models and, in some cases, to connect the models with external data sources. In this study, we describe the development of a new Swedish specification for 3D city models, denoted as 3CIM, which is a joint effort between the three largest cities in Sweden—Stockholm, Gothenburg, and Malmö. Technically, 3CIM is an extension of the OGC standard CityGML 2.0, implemented as an application domain extension (ADE). The ADE is semantically thin, mainly extending CityGML 2.0 to harmonise with national standards; in contrast, 3CIM is mainly based on linkages to external databases, registers, and operational systems for the semantic part. The current version, 3CIM 1.0, includes various themes, including Bridge, Building, Utility, City Furniture, Transportation, Tunnel, Vegetation, and Water. Three test areas were created with 3CIM data, one in each city. These data were evaluated in several use-cases, including visualisation as well as daylight, noise, and flooding simulations. The conclusion from these use-cases is that the 3CIM data, together with the linked external data sources, allow for the inclusion of the necessary information for the visualisation and simulations, but extract, transform, and load (ETL) processes are required to tailor the input data. The next step is to implement 3CIM within the three cities, which will entail several challenges, as discussed at the end of the paper.
1. Introduction
Three-dimensional (3D) city models are becoming increasingly common and, in many parts of the world, most large- and medium-sized cities possess such models. Earlier 3D city models were primarily created and used for visualisation, but such models are now being increasingly used for analysis and simulations. The latter applications impose requirements on semantically richer models and, in some cases, require connections to external geospatial databases, registers, and operational systems. To support the development of increasingly complex 3D city models, there is a need for standardisation. The most common open standard for 3D city models is CityGML, developed by the Open Geospatial Consortium (OGC). CityGML is a comparatively thin and generic model, which can be extended for various purposes such as harmonisation with other national standards [1,2,3,4,5,6,7].
This paper details an ongoing work to standardise 3D city models in Sweden. In 2020, Stockholm, Gothenburg, and Malmö—the three largest cities in Sweden—together with Lund University, started the 3CIM project with the aim of defining a national profile based on CityGML. The main trigger for the project was that the three cities had identified an increasing demand—both internally (i.e., within the city administration) and externally—for 3D geodata, as well as the future need for digital twins of the cities [8]. Such situations have also been identified in pioneering cities such as Helsinki [9,10], Singapore [11], and Zurich [12]. The current and future needs impose requirements for good 3D city models. Another early observation was that the needs were similar in the three cities and, therefore, it would be beneficial for them to work together on the standardisation of the 3D city models; furthermore, it was foreseen that the work could be utilised by other cities/municipalities in Sweden. There was also a desire not to use a vendor-specific solution, in order to avoid lock-in effects. Therefore, to enable all municipalities/cities to use the national profile, it was decided to use the open standard CityGML as a basis for the specifications in the project. These specifications are denoted as the 3CIM specifications in the following.
The aim of this paper is to describe and evaluate the Swedish 3D city model specifications denoted 3CIM. The paper starts with a short overview of 3D city model applications, with a focus on identifying example applications that should be supported by 3CIM. Then, a description of the standardisation of 3D city models is provided. The main part of the article deals with the 3CIM specifications, including the motivation of the main design principles, the creation of test data, and evaluation of the specifications and the test data. The paper ends with discussions and concluding remarks.
The main contribution of this study is the 3D city model specifications, as well as the process followed to create these specifications; in particular, we describe how we have combined user needs, specification design, test data creation, and evaluation of the specifications and test data in an iterative process.
2. Review of the Literature
2.1. Applications of 3D City Models
A national profile for 3D city models, such as the 3CIM specification, should support not only visualisation but also the most common analysis and simulation applications. For example, it should support climate and environmental simulations, such as noise [13], urban energy [14,15], daylight [16], and wind comfort simulations [17]. In addition to supporting input to the simulations, the 3D city models should facilitate visualisation of the simulation results together with the city model data [18,19].
Three-dimensional city models have a key role in the built environment process. To facilitate this role, city models should support versioning (life-cycle data) and integration with other data used in the built environment processes, such as Building Information Models (BIM). This integration—which is often denoted GeoBIM [20]—is important in, for example, the building permit process [21,22,23] and the cadastral process [24,25]; however, such integration is technically challenging [26,27].
There has also been a recently increasing demand for the combination of geospatial city data with dynamic information—mainly data from sensors [28]—to create so-called city digital twins [29]. These digital twins are still mainly used for visualisation of dynamic sensor information with the 3D model as a geographic reference (e.g., for monitoring of real-time traffic information), but there are also examples in which analyses of the sensor data have been conducted (see, for example, [30]). The digital twins may be linked to smart city services. The concept of smart cities is used in a wide context; however, quite often, the geographic context is important, which can be realised by a digital twin. There are also several initiatives—both national and international—which aim to accelerate the use of city models in the context of smart cities [31,32,33,34]. It is hard to predict which direction the smart city initiatives will follow, and whether they are useful at all in a sustainable context (see, for example, [35]), but it is reasonable to assume that various smart city services will be developed, and that several of which will be based on digital twins and 3D city models.
2.2. Standardisation of 3D City Models
2.2.1. CityGML/CityJSON
CityGML is an open standard for the storage and exchange of semantic 3D city models developed by the Open Geospatial Consortium (OGC) [36,37,38]. It is used to represent the geometries and semantics of the features in a city, and it supports modelling of a city’s appearance. At present, most local and national profiles are based on CityGML 2.0 [36], even though the CityGML 3.0 conceptual model has been released [38,39]. It is likely that CityGML 3.0 will be increasingly used in the future, but the description below is based on CityGML 2.0 (as this version is used in the 3CIM specifications).
CityGML consists of a core module, which defines the base classes from which the other classes inherit attributes; and thematic modules for different types of city objects (e.g., Building, Bridge, CityFurniture, LandUse, and Tunnel). The city objects can be represented in several Levels of Detail (LoDs), both regarding geometry and semantics, thus supporting multi-resolution modelling of a city, from simple surface models to detailed models including interior features.
The data exchange format for CityGML 2.0 is XML/GML (GML 3.1.1 with some restriction) [36]. The XML encoding is verbose, and its hierarchical and complex structure results in large files that can become heavy to handle. As an alternative encoding, the open-source 3D City Database (3DCityDB) has been developed [40]. Implemented as a relational database schema, 3DCityDB enables efficient querying of the 3D city model, and includes tools for importing and exporting data.
The complex and hierarchical structure of CityGML, as well as interoperability issues (see [23]), have led to the development of CityJSON [41]. CityJSON is a JSON implementation of a subset of CityGML 2.0, and it has been an OGC community standard since 2021. There is an ongoing work to adjust CityJSON to the CityGML 3.0 conceptual model.
2.2.2. Extending CityGML
Even though CityGML is a semantically rich standard, it cannot meet all the requirements for a national specification of a 3D city model, or when considering specific applications. There are, however, possibilities to extend CityGML with additional attributes and object types. This can be done in two ways: either by using generic city objects and attributes, or by creating an Application Domain Extension (ADE) [36]. Creating generic city objects and attributes is an ad hoc solution that does not require a schema, but with the disadvantage that the generic objects and attributes in a data set cannot be validated against a schema. An ADE is created as a new schema, with its own namespace, where new classes (that inherit from existing CityGML classes) and additional attributes to existing CityGML classes are included [36]. Several ADEs have been developed for applications such as urban energy simulations [42,43], noise simulations [36,44], and cadastre applications [45,46]; for further information, see [47] for an overview. ADEs have also been used for harmonisation of CityGML with national standards; for example, in the Netherlands [3] and Sweden [4].
CityGML ADEs and generic city objects facilitate semantically rich 3D city models which can be populated with data from external data sets (as proposed in, for example, [48]), but CityGML also provides another possibility to extend the semantics. By using CityGML External References, it is possible to link CityGML features to data stored in external data sets, registers, and operational systems, using a Uniform Resource Identifier (URI) or similar. Such external references are interesting to implement to, for example, road databases (e.g., to conduct noise modelling), BIMs [49], and building permit operational systems [50].
2.2.3. Swedish National Specifications for Geodata
There is an ongoing work in Sweden to standardise geodata on a national level, in order to facilitate the exchange of geodata between different actors [51]. Parts of this work aim to develop an overall framework for the information architecture (e.g., what geometries to allow and how to describe metadata) and national specifications for different geodata themes (e.g., buildings). This work is conducted by several national agencies and regional/local authorities, and is coordinated by the Swedish mapping, cadastral, and land registration authority (swe. Lantmäteriet).
Several themes in these national specifications are of interest for a 3D city model. However, the work on the national specifications is in an early stage, and only two themes have (almost) completed specifications: Buildings and detailed development plans. Of these two themes, the Building theme is of substantial interest for the 3CIM specifications. The Building theme in the national specifications is not based on CityGML, for several reasons. One reason is that the national specifications should support a wide range of applications for many actors (e.g., The National Mapping Agency; The National Board of Housing, Building, and Planning; cadastral authorities; tax authorities; local and regional authorities; and so on), all with specific demands on the semantic content of the building specifications. To incorporate such a model in CityGML would entail an extensive ADE. Furthermore, the national specifications are written in Swedish, which entails problems (e.g., regarding the compulsory attributes in CityGML). However, it is stated that it should be possible to map data according to the national specifications of geodata to CityGML. In practice, this implies that the object structure, attribute selection, and geometry definition in the national specifications are, to a certain degree, harmonised with CityGML.
2.3. Measuring Guidelines
The CityGML specifications, including ADEs, do not specify in detail which information should be stored in the data sets. Therefore, these specifications must be complemented with measuring guidelines that provide detailed specifications of the data sets, both for producers and users; for example, by specifying threshold values for sizes of features to be included in the city model and geometric accuracy requirements. A measuring guideline, which is the basis for several other guidelines, has been created by SIG3D Quality Working Group [52]. Measuring guidelines are also included in the technical specifications of the Dutch 3D IMGeo-CityGML model [53]. In Sweden, there is ongoing work to create national measuring guidelines for buildings, partly based on previous work in SIG3D and IMGeo-CityGML [51].
3. Motivation and Specifications of 3CIM
3.1. Motivation to Develop the 3CIM Specifications
To facilitate the diverse use of geospatial data, at present, the Swedish cities mainly have two products: (1) 2D base maps (with a level of detail corresponding to around the scale of 1:1000), which are continuously maintained; and (2) 3D models, which mainly contain building data and are not updated on a regular basis. The 3D models are chiefly used for visualisation, and have few or no connections to the municipality-level 2D base maps, other geospatial data sets, or operating systems within the city.
To improve various applications within the cities, new 3D city models with better connections to other information resources are required. One example, from the city of Stockholm, is a building planning application. This application shows a proposed project from the planning process imported into the 3D model and 360° images are produced from the result (Figure 1). While useful for visualising the new building in its environment, there is currently no additional information connected to the service. If there had been a semantic 3D city model, it would be possible to analyse, for example, how the project contributes to the area in terms of housing and green structure. The 360° images could also contain labels with useful information from the objects in the 3D city model.
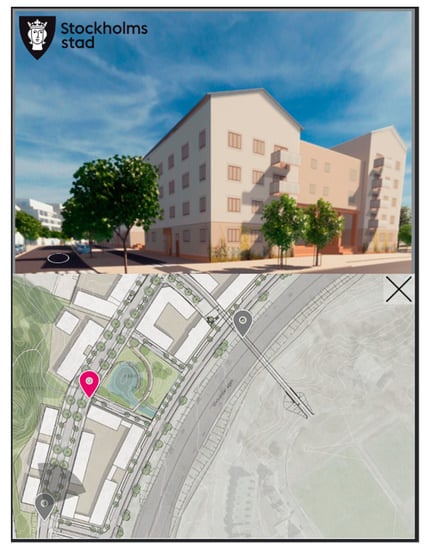
Figure 1.
Two 360° images of a proposed building project in the context of the 3D city model in Stockholm.
Another example comes from Gothenburg. As the City of Gothenburg is aiming for a full digital twin with metaverse applications by the end of the 2020s, the need for structured data describing the physical environment and its corresponding thematic data is urgent. To be able to connect different data sources from within the municipality with the digital twin, the base geodata must be modelled and structured in a standardised way. The digital twin is built on parametric (semantic) modelling (Figure 2) and every object, such as buildings and assets, will eventually be linked with further information for analysis and visualisation in the twin.
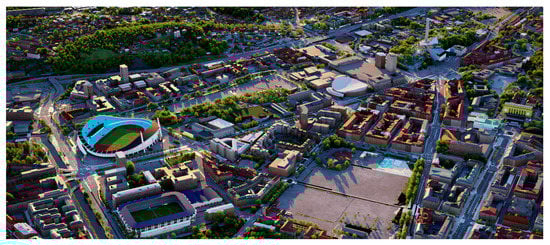
Figure 2.
Part of the current 3D model in Gothenburg. The model is constructed by parametric design, but does not yet have any connection to external databases within the city.
Malmö is currently exploring the opportunities provided through the use of a 3D base map (e.g., to provide better visualisation for planners), as well as better external databases and operational systems that could potentially be connected to the 3D base map (e.g., the actual size and extent of objects, such as buildings, trees, vegetation, and so on). To fulfil this, standardised data, along with a modern and well-developed data model, thus providing better structure and possibilities for data analysis, are required. These data can be used in standardised analyses, which are harmonised between different municipalities. Furthermore, the data itself should not only be comparable within the municipality, but also between municipalities, providing advantages in that nearby municipalities can be easily compared, or cities of similar size can exchange information between one another.
In all of the considered cities, there is a need to store roads as polygons, instead of lines, which is the typical geometry of geographical road data in Sweden at present. Linear road data do not include information (or, in rare cases, have scarce information) regarding the actual size of the road or lanes. This road representation poses a limitation for the cities in performing analyses such as traffic flow and flooding analysis, as well as for visualisation.
Based on their internal and external application needs, the cities of Stockholm, Gothenburg, and Malmö have concluded that the current two geospatial products (2D base maps and current 3D models) are not sufficient. To satisfy their needs, the cities must create and continuously maintain semantic 3D city models. They also need to update several products in the built environment processes from 2D to 3D, such as the cadastral index maps and the base maps for the detailed development plans. As the example from Gothenburg above also reveals, the cities foresee the future demand for digital twins of the cities. Exactly which requirements will be set by the future digital twins are hard to predict, but it is reasonable to assume that they would at least require an up-to-date 3D city model that has linkages to external databases (including the city operational systems), as well as to dynamic sensor data (for further discussions on this, see [29,54]).
The efficient creation and maintenance of geospatial products require proper information models. To date, each municipality/city in Sweden has developed and used their own internal information models, regarding both 2D and 3D geospatial data. With the newly emerging products and applications, there is both a need to include 3D geospatial data and to harmonise the models between the cities. To facilitate this, there exist international standards (mainly CityGML) and, at the national level, there is the ongoing work to define national specifications for geospatial data (see Section 2.2.3). The three cities have discovered that CityGML alone is not sufficient to satisfy their specification needs, nor could the national specifications of geodata satisfy these needs; therefore, they decided to together develop their own specifications, denoted 3CIM.
3.2. Methodology for Designing the 3CIM Specifications
The 3CIM specifications were developed in an iterative process, where a version of the specifications was developed during a series of workshops with participants from all three cities. On average, there were two workshops per theme, resulting in more than ten workshops in total. Test data were then created, according the current version of the specifications, in order to perform practical testing of the information model. The test data creation and practical testing were followed by a new series of workshops based on feedback from the practical test, and the information model was updated to a new version, which could also include new themes. The test data were then updated, according to the new version of the specifications, and new practical tests were performed and evaluated. In addition to the workshop within 3CIM, around ten workshops were held together with Lantmäteriet (the Swedish NMA), in order to guarantee harmonisation between 3CIM and the Swedish national specifications for geodata, especially concerning common measuring guidelines.
Technically, 3CIM was implemented by creating UML diagrams of the 3CIM specifications using the Enterprise Architect software (Sparx Systems (https://www.sparxsystems.eu/, Accessed on 5 December 2022)) with a new namespace of 3CIM for the ADE elements. The UML diagram for the transportation theme is shown in Figure 3 (original UML diagrams for all themes can be found in [55]). The ADE attributes are added below the namespace <<3CIM>> in the existing classes in CityGML, and the ADE class marking has the namespace <<3CIM>> included before the name of the class. The XSD schema files were created by manually editing the CityGML 2.0 schema file, based on XSD schemas for existing ADEs.
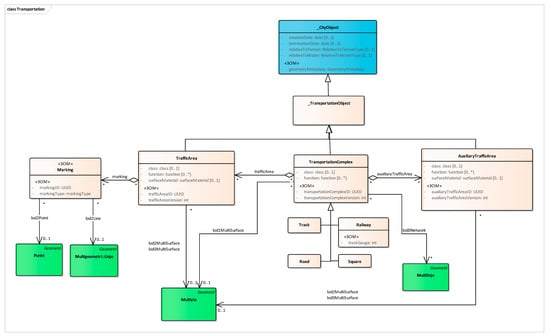
Figure 3.
UML diagram of the transportation theme ADE. The ADE attributes are added below the namespace <<3CIM>> in the CityGML classes, and the ADE class marking has the namespace <<3CIM>> added before the class name.
3.2.1. CIM Design Decisions
Several design decisions were made during the development of the 3CIM specifications, as described below.
3.2.2. Usage of CityGML 2.0
At an early stage, it was decided to base 3CIM on CityGML 2.0. The main reason for this is that CityGML 3.0 had not been formally approved at the time of the start of the 3CIM project, and also that it will take time before the necessary tools are adapted for CityGML 3.0. However, there are several features of CityGML 3.0 that are of interest within the 3CIM project (see Section 6.3 below).
3.2.3. Linkages to Operational Systems and External Data Sets/Registers
As noted above, several CityGML ADEs have been developed for supporting various applications. As 3CIM should support a variety of applications, which are known or unknown at this stage, it requires several ADEs, which is technically challenging. The software support for CityGML ADEs is weak (see, for example, [20,47]). Furthermore, maintaining a semantically rich city model would require extensive work to keep the information up-to-date and consistent with, for example, operational systems. Therefore, it was decided that 3CIM should not be based on application-oriented ADEs. Instead, it was decided that 3CIM should, in itself, be a semantically thin model, but should also facilitate connections to several operational systems (e.g., building permit system, cadastre system) and external registers (e.g., The National Road Database, tree/vegetation databases); see Figure 4. These linkages are implemented using the CityGML External References class.
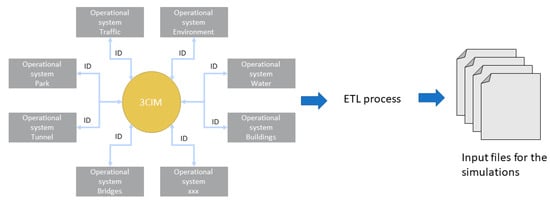
Figure 4.
As 3CIM connects to external databases/operational systems, this approach requires a process to generate input data to applications (e.g., simulations). ETL: extract, transform, and load.
It should be noted that 3CIM has an ADE, but this ADE is mainly for harmonising 3CIM to national standards and for tailoring data to facilitate references to external databases (see, for example, Section 4.2.3 below). The implication of the selected approach is that, for simple applications that do not need data from external databases, the 3CIM files can be read directly; meanwhile, for more demanding applications where external data is required, an additional step to generate the input files is required (Figure 4).
3.2.4. Connection to the National Specifications of Geodata
As the development of the national specifications is in an early stage, it has not yet been possible to establish connections between the national specifications and the individual themes in 3CIM. Of the currently (almost) developed themes in the national specifications, only the building theme is of substantial interest with respect to the 3CIM specifications. As the Buildings theme in the national specifications is not based on CityGML (Section 2.2.3), the 3CIM specifications do not follow the national specifications; however, 3CIM was an active partner in the development of the building theme to facilitate harmonisation between the two standards.
However, on a more general level, 3CIM has made several decisions to harmonise with the national specifications; for example, (1) it was decided to follow the geometry and geometry metadata specifications as described in the framework for the national specifications; (2) if possible, the same code lists should be used for attributes; and (3) 3CIM and the national specifications will be based on the same measuring guidelines (for the themes where measuring guidelines are available). In practice, the 3CIM project has acted as a partner in developing the measuring guidelines for the building theme, and future cooperation between actors at the national level and the cities in development of the forthcoming measuring guidelines is foreseen. Common measuring guidelines will facilitate fairly easy mapping between the national specifications and 3CIM, which has been practically evaluated for the building theme [56].
3.2.5. Only Physical Objects Are Included in 3CIM
In this first version of 3CIM, only physical features are included. In later versions of 3CIM, the plan is to include more administrative features (e.g., 3D cadastre). This issue is linked to a (possible) later change of 3CIM to base it on CityGML 3.0, which has a better support for administrative units (i.e., using the logical space class).
3.2.6. No Versioning in This Version of 3CIM
The long-term goal is that 3CIM should support versioning; however, the version of 3CIM developed in this project only has a simple versioning capability (an attribute on the object level that states which version it is). The main reason for this is that the support for versioning in CityGML 2.0 is weak, implying that a lot of additions (in the ADE) would be required to implement versioning. Furthermore, none of the tools we are using will be able to natively handle these data. We have previously conducted a study on versioning in this context [57], and found that the versioning capabilities in CityGML 3.0 [38,58] would satisfy the versioning requirements of the (investigated) city applications. Therefore, we made the pragmatic decision that it is most economical to wait to implement versioning in 3CIM in a later version, possibly based on CityGML 3.0. At that time, we also anticipate that there will be more software support for CityGML 3.0 (including versioning).
3.2.7. Language and Attribute Value Lists
Object and attribute names are in English, but the language for attribute values is Swedish. The latter values are taken from current national or municipal code lists and the national specifications for geodata [51]. In the future, some code list might also be based on the national classification system for the built environment denoted CoClass [59].
The values in the code lists (gml:name) consist of five digits, to enable a hierarchical structure for the attributes Class and Function, where the first digit gives the more general level (class) and the later digits describe the more specialised levels for function (cf. the four-digit values in the suggested code lists for CityGML (https://www.citygmlwiki.org/index.php?title=CityGML_Code_Lists; Accessed on 5 December 2022)). This enables 3CIM to use the same code lists as the national specifications.
3.2.8. Land-Cover Data
The theme Landuse in CityGML 2.0 allows for modelling both land-use and land-cover. In 3CIM, it was decided to only model land-cover, as the municipalities do not store and maintain data regarding land-use. However, when creating the first version of the test data (according to 3CIM ver 0.1), it proved difficult in many cases to decide whether an area should be modelled as Land-Cover or another theme—such as Transportation, Water, or Vegetation—to avoid overlapping polygons. As a consequence, it was decided to exclude Land-Cover in 3CIM ver. 1.0, with the main aim to model areas in other themes (mainly Transportation, Water, or Vegetation). Area types that are not modelled will then be identified, and can be included as Land-Cover in later versions of 3CIM.
3.2.9. Elevation Data
CityGML 2.0 includes the thematic module Relief for storing elevation (terrain) data in five different LoDs. Elevation can be stored as raster/grid, triangulated irregular network (TIN), break lines, and/or mass points—it is possible to use a single type of representation or combine the different types in the same 3D city model. The Relief module does, however, have limitations [60], and the requirements of the elevation data—both when it comes to LoD and representation type—differ with the considered application; hence, it was decided to not include elevation data in 3CIM ver. 1.0.
3.3. Overview of the 3CIM Specifications
The version described in this paper is 3CIM ver. 1.0 (when it is not explicitly mentioned as another version). This version was released in December 2022, and includes the CityGML themes Bridge, Building, CityFurniture, Transportation, Tunnel, Waterbody, and Vegetation, as well as the theme Utility, which is defined in the 3CIM ADE. Below, we briefly describe the Core module and some of the themes; for complete descriptions, see [55], in which the XML schema file and UML diagrams for the 3CIM ADE are also available. It is important to note that 3CIM does not exclude any themes included in CityGML 2.0. Themes that are not explicitly described in 3CIM can still be used.
3.3.1. Core Module
The Core module of CityGML defines classes and attributes that are inherited by all the thematic modules; therefore, extensions that are valid for all the thematic classes should be implemented in the Core module. The Core module was extended with a data type GeometryMetadata (as an ADE), thus enabling 3CIM to follow the national specifications [51], including code lists, for geometry metadata. Among others, the geometry metadata include quality elements, such as time for observation of geometry, time for control of geometry, measurement technique, and absolute positional accuracy.
A central part of the 3CIM specifications is the linkage to operational systems and external data sets/registers. Such linkages are implemented using the data type External Reference in the CityGML Core module.
3.3.2. Building Theme
The Building theme in 3CIM is identical to that in CityGML 2.0, except for some additional attributes that were added as an ADE (namespace = 3CIM). The two attributes ID and Version, common for all themes in 3CIM, are added to Building, and the attribute Status is added to BuildingPart, which states whether the building part is, for example, planned or existing. The building objects are modelled with refined sub-levels, according to Biljecki et al. [61]. Details of the sub-levels are specified in the measuring guidelines.
To facilitate a mapping between buildings in 3CIM and the national specifications, it was decided that the same measuring guidelines as the national specifications [51] should be used within 3CIM. Therefore, 3CIM has cooperated with The National Mapping Agency to develop the measuring guidelines to provide detailed information about how to model Buildings, BuildingParts, and BuildingInstallations in different LoDs. Minimum sizes of objects to models are given, as well as details about what objects (e.g., canopies and dormers) should be modelled as Building/BuildingPart or BuildingInstallation. One example is given in Table 1; for further details, see [51].

Table 1.
Generalisation rules for building installations (airborne collection). x stands for compulsory data collection and (x) stands for data collection if needed. According to the specifications, the data should be collected with a positional accuracy on dm-level.
3.3.3. Transportation Theme
In LoD0, the transportation network in 3CIM is modelled as a linear network; for LoD1 and higher, the street space is modelled using multisurface geometries with higher granularity for higher LoD. In LoD1, the entire transportation objects are modelled as TransportationComplex; for higher LoD, the TransportationComplexes are sub-divided thematically into TrafficAreas (e.g., vehicle lanes, biking paths, pedestrian areas) and AuxiliaryTrafficAreas (e.g., kerbstones and green areas).
It should be noted, however, that studies have identified limitations and insufficient specifications for the transportation module in CityGML 2.0 [62,63]; hence, substantial updates have been implemented in the transportation module of CityGML 3.0 [38,39]. One update is the introduction of the classes Section and Intersection, which makes it possible to sub-divide traffic objects into segments (Section), where the segments may be sections of roads that are connected by junctions or roundabouts (Intersection).
The transportation theme in 3CIM is based on CityGML 2.0, but with additional guidelines to follow the concept of sections and intersections in CityGML 3.0. The main reason for sub-dividing traffic objects into sections is to facilitate a linkage with The National Road Database (NVDB (https://www.nvdb.se/sv/about-nvdb/; Accessed on 5 December 2022)), which consists of road links that are topologically connected with nodes. The aim is to sub-divide the traffic areas in 3CIM such that one section corresponds to one road link in The National Road Database. A new class, Marking, was also added into 3CIM, which is in line with CityGML 3.0.
Another guideline that was added to the transportation theme in 3CIM is that only multi-surface geometries are allowed, which means that only LoD1–3 are used. The exception is railways, which must be modelled as lines (i.e., LoD0) where the theoretical centre line is used for modelling.
The attributes Class and Function follow the same hierarchical structure as the thematic sub-division of traffic objects in the different LoDs. The attribute Class is used on the most general level only, and it is common for TransportationComplex, TrafficArea, and AuxilliaryTrafficArea to state the type of traffic object (e.g., road, rail, air, or water traffic). The attribute Function, on the other hand, is only allowed for TrafficArea and AuxilliaryTrafficArea, and is used to describe more specific types of transportation objects. A five-digit code is used as the attribute value for both Class and Function.
As an example, a motorway has the code 10000 for the attribute Class in LoD1 (TransportationComplex), where the first digit stands for road traffic. In LoD2, the TrafficArea that represents the lane for driving will have the code 10100 for the attribute Function, where the second and third digits (01) stand for driving lane. In LoD3, the TrafficArea has the code 10103 for the attribute Function, where the last two digits (03) stand for motorway.
For the attribute Function, more than one value is allowed; for example, a pedestrian crossing over a street with car traffic in LoD3 will have the attribute values 10,107 (street—car traffic) and 10,204 (pedestrian crossing).
3.3.4. Vegetation Theme
The Vegetation theme includes SolitaryVegetationObject, which can be modelled as point objects (e.g., solitary trees) or line features (e.g., hedges), and PlantCover, which can be modelled as surfaces or solids. SolitaryVegetationObject has attributes for height, trunk diameter, and crown diameter (as in CityGML) to support visualisation and analyses, and it is allowed to use implicit geometries to represent solitary vegetation objects. LoD1–2 are allowed, and the attribute Function is used to decide the LoD in a hierarchal manner. As an example, a solitary coniferous tree in a park has the code 10500 for Function in LoD1, where the first digit (1) is for park, and the second and third digits (05) are for tree. In LoD2, the value for Function is 10501, where the last two digits (01) stand for coniferous tree. Compare with CityGML 2.0, where the suggested code lists for the attribute Function consist of the Latin names of the species. In 3CIM, the Latin names are stored in an external database linked to the geometry in 3CIM (Figure 4), in order to keep the 3CIM data semantically thin, while speciesPopularName is added as attribute to the ADE.
4. Creation of 3CIM Test Data
Test data for 3CIM were created for one area in each of the three cities. The areas are introduced in Section 4.1, and the test data are available at the 3CIM website [55]. In this paper, we only describe the data in Malmö in detail (Section 4.2). It should be noted that the test data follow 3CIM ver. 0.2, but the difference with respect to ver. 1.0 are small.
4.1. Study Areas in the Three Cities
The Stockholm test area is located in the eastern part of the city centre, near the Royal Institute of Technology (Figure 5). The area contains a railway, complex road surfaces with lanes for different types of vehicles and pedestrian crossings, a tunnel, and some blocks of large residential apartment buildings.
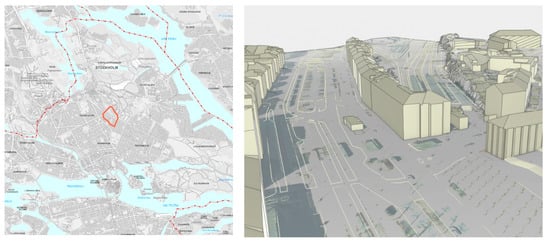
Figure 5.
The area in Stockholm where the 3CIM test data were created marked in red (left) and the data visualised in SketchUp with a DTM and transparent orthophoto (right). © Stockholms stadsbyggnadskontor, Stockholm stad.
The test area in Gothenburg is a 1 × 1 km2 area located in the central part of the city (Figure 6). The area was chosen as most of the 3CIM themes are represented in the area (Bridge, Building, Utility, City Furniture, Transportation, Tunnel, Vegetation, and Water).
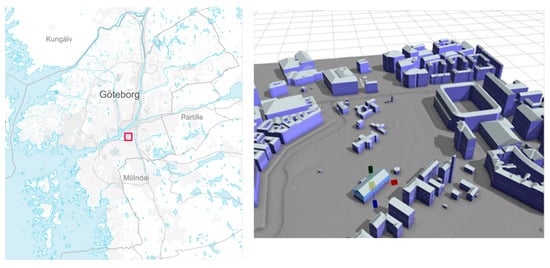
Figure 6.
The test area in Gothenburg where the 3CIM test data were created (left) and data visualised in CityEngine to the (right). © Göteborgs stadsbyggnadskontor, Göteborgs stad.
The test area in Malmö is the neighbourhood Lorensborg–Bellevue (Figure 7), which has a size of around 0.5 km2. The area consists mainly of large residential apartment buildings, with some green areas in between and two larger streets. There is a planned densification of the area, with around 30 new buildings. One reason for selecting this area was the possibility to simulate the effect of this densification.
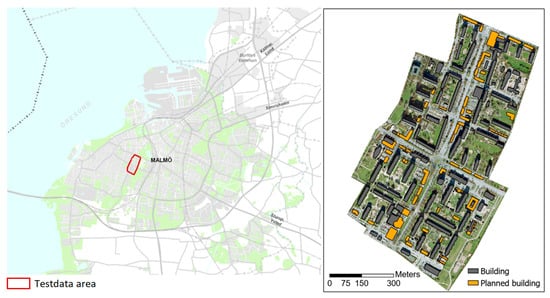
Figure 7.
The test area (Lorensborg–Bellevue) in Malmö, for which the 3CIM test data were created. © Malmö Stadsbyggnadskontor, Malmö stad.
4.2. Creation of 3CIM Ver. 0.2 Data in Malmö
The following data sets were used for the creation of the 3CIM test data: (1) Municipality 2D base map (corresponding to scale 1:1000) in dwg-format; (2) orthophotos; (3) a digital terrain model (DTM) with a spatial resolution of 1 m; (4) 3D buildings (created in 2020 from aerial images taken from 1000 m) in CityGML 2.0, LoD 2.3; and (5) planned buildings in LOD1–2 in SketchUp format. In addition, window data were collected to support daylight simulations (see Section 5.4 below).
4.2.1. Building Theme
What differs in the building theme in 3CIM compared to CityGML 2.0 is that the two attributes ID and Version, common for all themes in 3CIM, are added to Building, and that the attribute Status is added to BuildingPart. Hence, for existing buildings, the available 3D building data in CityGML 2.0 format could be re-used with only the following modifications: (1) Add values for ID and Version on the buildings where the unique ID was created with the UUID generator in the extract, transform, and load tool Feature Manipulation Engine (FME) from SAFE Software (https://www.safe.com/; Accessed on 5 December 2022) and set the attribute Version to 1 for all buildings; and (2) create one building part for each building and set the attribute Status to “gällande” (existing).
The planned buildings were available in Trimble Sketchup format, together with existing buildings and an orthophoto. The data were obtained in a local engineering coordinate system (not georeferenced), and had to be transformed to the Malmö municipal system. The geodetic transformation program Gtrans [64] was used to derive the transformation parameters of a unitary transformation. A total of eight control points obtained from five existing buildings were used to derive the transformation parameters, resulting in a standard error of 0.40 m. The main reason for the relatively high standard error was that the existing buildings were modelled slightly differently in the two data sets; however, for the purposes of the test data, the standard error was considered acceptable. Finally, the transformation was performed in FME and building parts were created to conform to 3CIM, with the value of the attribute Status set to “planerad” (planned).
4.2.2. Window Data
For the test area in Malmö, we required window information for the southern part of the area (consisting of 21 buildings; see Figure 7) for daylight simulations, in order to study the effect of the planned densification.
Window information for city models can be collected from BIM [65] or from street view images [66,67]; however, for the test area, no BIM models were available and the available street view images did not have complete coverage for façades not facing the streets. Therefore, we decided to collect façade images on our own.
In early 2022, a total of 634 façade images were taken using a system camera (Pentax K200D with a Pentax-Da 16–50mm F2.8 ED AL). Lens correction was applied to reduce the barrel/pincushion distortion using Adobe Photoshop, and perspective distortion correction was performed using OpenCV (https://opencv.org/; Accessed on 5 December 2022) (see Figure 8). For a few façades, the images were collected by retrieving images from a video taken by an iPhone 11 Pro Max; these images were corrected using the same methods.
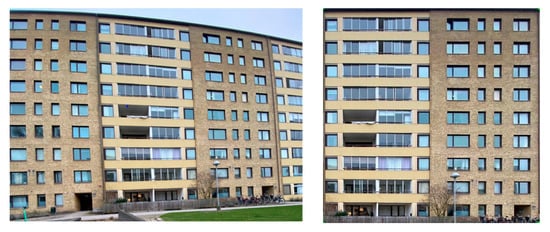
Figure 8.
Façade images before and after barrel/pincushion and perspective distortion correction.
Based on the corrected façade images and the 3D buildings (see Section 4.2.1 above), interactive 3D modelling was conducted using Blender (https://www.blender.org/; Accessed on 5 December 2022). In the first part of the 3D modelling, the building façade surfaces were simplified and split based on the arrangement of windows (taken from the façade images). This arrangement typically follows equal spacing, in relation to adjacent windows. The arrangement is also usually in a grid-like system. As an equal spacing and grid system was followed, a proportional relationship could be calculated. After this, each sub-grid space was divided, based on its proportional relationship between the window and its spacing. Finally, the windows were extracted from the surface, spatially referenced, and saved into a CityJSON file using the program Up3date (https://github.com/cityjson/Up3date; Accessed on 5 December 2022) (Figure 9). Strictly speaking, we did not follow the 3CIM specifications for the windows, which would have required the creation of CityGML LoD3 buildings.
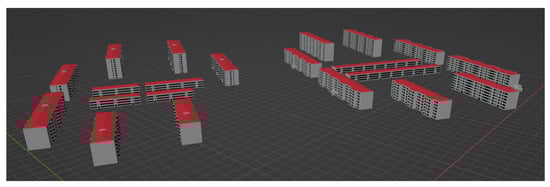
Figure 9.
The building and window information (stored in CityJSON, shown in Blender).
4.2.3. Transportation Theme
The test data for the transportation theme was created by manually digitising polygons based on the base map from Malmö city and interpretation of the available orthophoto. It was the most labour-intensive part of the test data creation, and was not feasible to automate within this project due to the structure of the base map. The base map was created more as a cartographic product that contains linear features to build the borders of the streets, biking paths, parking spaces, and so on (see Figure 10).
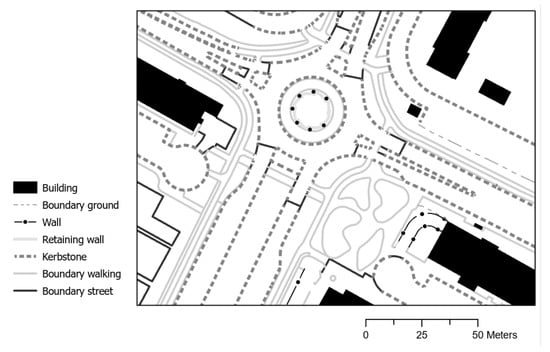
Figure 10.
Part of the base map from Malmö city with line features that were used to digitise the transportation polygons in the area shown. Buildings are included for illustration, as some line features are connected to the buildings.
In the base map, there are no links between the line features to facilitate the creation of the polygons to represent streets, biking paths, and so on as objects in 3CIM (Figure 11a). In addition, the linear features used to build the boundary of polygons were of different types, such as street border, kerbstone, retaining walls, biking path borders, with no topological connections or semantics stating that they belong to, for example, a street with car traffic. This situation is not unique to Malmö—most cities in Sweden have their transport data represented by unstructured line objects. Furthermore, 3CIM states that the transportation theme should be divided into sections according to CityGML 3.0, with the aim to have one section for each road link in The National Road Database (NVDB) of the Swedish transport administration [68]. The line features in the base map do not follow this division into sections; hence, the end-points of the lines that build the polygons will not coincide with the end-points of the line features in the base map. For the test data, this division into sections was carried out for traffic areas with car traffic only, and the unique road link ID from the NVDB was manually added as an external reference to each TrafficArea with car traffic. For streets, it was possible to have a 1:1 mapping between road links in the NVDB and sections in the test data; however, in the NVDB, roundabouts are split into several road links, with one link between each connecting road link. As an example, the roundabout in Figure 11b is split into six road links in NVDB, but modelled as one roundabout in the 3CIM test data.
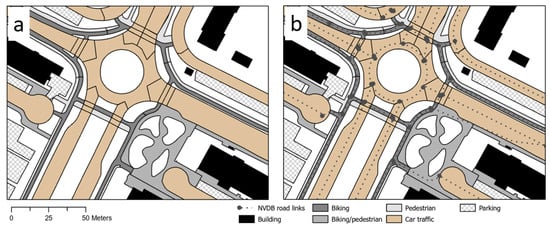
Figure 11.
Traffic areas from the transportation theme according to 3CIM without (a) and including (b) the road links from The National Road Database (NVDB). Buildings are included for illustration purposes.
Another consideration when creating the transportation theme was to decide which features should belong to the transportation theme. Figure 12 illustrates an example of an area (“1” in panel a) modelled as transportation in panel b, but not in panel a. The area consists of narrow pedestrian areas that connect to pedestrian and biking paths with smaller areas with grass and trees (green; AuxilliaryTrafficArea).
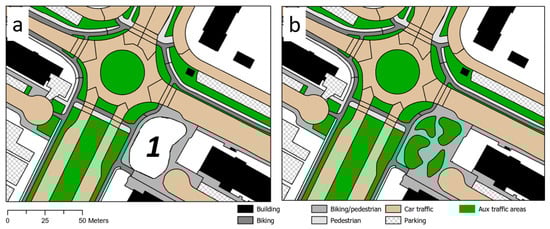
Figure 12.
Transportation theme according to 3CIM, including both traffic areas and auxiliary traffic areas. Buildings are included for illustration purposes. The area “1” in panel (a) is modelled as transportation in (b).
4.2.4. Vegetation Theme
Polygons were digitised based on line features in the municipality base map to create PlantCover object. The plant cover was interpreted from the orthophoto, and attribute values were populated with values according to the code lists for PlantCover. SolitaryVegetationObjects were created based on data from two sources: (1) Trees included in the municipality base map, and (2) trees from a tree database from the park management in Malmö city. The trees in the base map were measured with high (geometric) accuracy, but no information about tree species, height, and so on was included. The trees from the tree database, on the other hand, include detailed information about the trees (e.g., stem diameter, tree species, and so on), but had lower geometric accuracy. In addition, several trees were not included in both data sets. To create the test data according to 3CIM, a spatial join was performed (search radius = 2 m) for the two data sets, and all matching trees took their position from the base map and attribute values from the tree database. Trees with no match were kept as in the original data sets; that is, trees from the base map have a position (with high geometric accuracy), but no attributes, while the trees from the tree database possess attributes, but lower geometric accuracy.
5. Evaluation of the 3CIM Specifications and the Test Data
There is no generally agreed-upon model for the evaluation of 3D city models. Lei et al. [69] have recently evaluated 40 city models using 47 criteria, but even from such an extensive number of criteria, it is difficult to draw conclusions regarding whether a city model is useful for its intended purpose. Therefore, to evaluate the 3CIM specifications and the test data, we performed some feasibility application studies. A main aim of these studies was to study if the 3CIM design decisions (Section 3.3) were good from the application perspective. This especially concerns issues such as the strategy of linking external databases/operational systems and usage of CityGML 2.0 (rather than 3.0). In this section, we describe the feasibility studies performed regarding storing, visualising, and performing simulations with the 3CIM test data. The outcome of the feasibility studies indicates the applicability of the 3CIM model for certain tasks, in terms of how difficult it is to tailor the 3CIM data for use in visualisation and simulation tools, and also to determine whether there are shortcomings in the 3CIM specifications and/or data (as further discussed in Section 6). However, it should be noted that we did not perform a more detailed analysis focused on the quality of the simulation result. Such a study would require larger tests with more tools, in which various LODs and classification schemas in the CityGML and 3CIM specifications are considered.
5.1. Storage of the 3CIM Data
It is crucial to have efficient methods for storage, retrieval, and updating of a 3D city model. Therefore, methods to store the 3CIM test data in 3DCityDB [40] were tested, even if such storage is not part of the 3CIM specifications. However, time constraints did not allow us to save the 3CIM test data to 3DCityDB before the visualisation and simulation verifications were performed, as 3DCityDB must be extended to handle the 3CIM ADE. Instead, the development of the extension of 3DCityDB was conducted in parallel with the verifications. The input data to the verifications were delivered as CityGML XML files.
We installed 3DCityDB on top of a PostGIS database, and the free ADE manager plugin (https://3dcitydb-docs.readthedocs.io/en/release-v4.2.3/impexp/plugins/ade-manager.html; Accessed on 5 December 2022) was used to extend the database with the 3CIM ADE. The free Importer/Exporter available for 3DCityDB does not support ADEs; instead, a workflow where the Importer/Exporter was used together with FME to extend the functionality of 3DCityDB was developed (Figure 13).
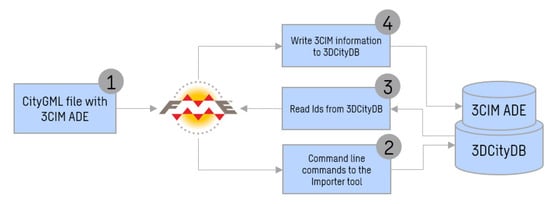
Figure 13.
Workflow to save 3CIM data to 3DCityDB with an FME script and the Importer/Exporter tool in 3DCityDB. The numbers provide the order the process is executed.
The 3CIM test data were saved as a CityGML ADE file (1), and an FME script was used to save the 3CIM data to 3DCityDB. The FME script first (2) calls the Importer/Exporter to save the part of the 3CIM data that are in accordance with CityGML 2.0 (i.e., excluding the 3CIM ADE attributes and feature types). Then, (3) FME calls 3DCityDB to obtain the internal database IDs for the objects that were written to the database and which have additional attributes according to the 3CIM ADE. Finally, (4) the values of the 3CIM ADE attributes are written to the ADE tables. Objects of the feature type that were added in the 3CIM ADE (Utility) are directly written to 3DCityDB with FME, as no connections have to be made to existing CityGML 2.0 tables.
5.2. Visualisation
It is essential that 3CIM can be visualised in various platforms. Below, we illustrate two examples in which the test data from Malmö were visualised, using a game engine (Unreal Engine) and a web viewer (Digital Twin City Viewer).
5.2.1. Visualisation in Unreal Engine
The 3CIM test data in Malmö was, among others, visualised in Unreal Engine (UE). The starting point for this visualisation was to create 3D meshes for the visualisation. We performed this by using the extent of the surfaces in the 3CIM data to cut a DTM into new surfaces while retaining the attributes. The attribute Function was used to group the surfaces and save the created meshes as separate files. For objects represented by vectors, the breakpoints (vertices) were moved to the level of the terrain, converted and extruded to a generalised height for each type of object (e.g., walls, fences), and saved in the same manner. For point objects (e.g., trees, street walls), the position and visually useful attributes were written to a CSV file, which was used during visualisation as a data source (instead of creating a visual representation of the object at this stage). Finally, prior to writing the files, all data were transformed to a local coordinate system, in order to simplify the process in UE. All data processing prior to importing into UE was handled with FME.
The next step was to import all data into UE. As we saved the meshes according to their function, we could easily discern what the objects represent by their name. To place them correctly in relation to each other, we just entered the same position of all the objects. For the objects that had their attributes saved to a CSV file, we created a “Data Structure” within UE, allowing us to properly read these files. Then, the visualisation was generated by adding a fairly correct sun position and applying textures to the surfaces (generalised after Function or from other attributes). Finally, we also included surrounding 3D building objects (3D buildings from CityGML that are located outside the area with test data for 3CIM) and an orthophoto to generate the final visualisation (Figure 14).
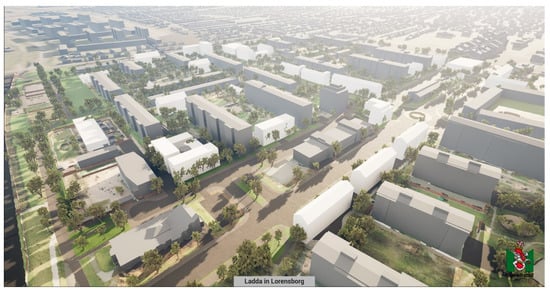
Figure 14.
Visualisation of the 3CIM test data for Malmö in Unreal Engine. The white buildings are planned buildings. Viewing from north-east.
5.2.2. Visualisation in Digital Twin City Viewer
Semantic 3D city models (e.g., CityGML/3CIM) are essential for digital twin city visualisations, where additional dynamic data sources can be streamed onto the 3D features. The semantic nature of CityGML/3CIM makes this a powerful approach, where the (static) city model data can be combined with the dynamic data to enable users to customise the visualisation in a flexible way using queries and filters. To investigate this application of 3CIM data, the test data from Malmö were visualised in the Digital Twin City Viewer (DTCV) (https://www.digitaltwincityviewer.com/; Accessed on 5 December 2022), which is an open-source (MIT) web viewer specialised in city-level data visualisations of digital twins. The DTCV project (2022–2024) is an initiative started as part of the Digital Twin Cities Centre (DTCC) hosted by Chalmers University of Technology, Gothenburg, Sweden (https://dtcc.chalmers.se/; Accessed on 5 December 2022last). DTCV is a web-based approach that should be seen as a complementary means of digital twin visualisation to the use of game engines, as the web is more suitable for semantic web technologies and combining data sets dynamically (which is a requirement for Digital Twins), rather than creating a realistic (but static) rendering.
In this example, the 3CIM data were parsed on-the-fly into the DTCV viewer from a CityGML file on the viewer server (Figure 15). The file was first converted into CityJSON and then sorted into categories, depending on the different types of CityObjects. The graphical elements were merged into mesh data and the semantic features were saved in a data structure for later retrieval, with mappings to the respective part of the mesh. The CityGML schema files were also loaded together with the 3CIM ADE, to be used for validation in the viewer. No external tool was used, and the pipeline runs on the viewer server and client given the raw CityGML files or a potential connection to the 3DCityDB. The code is written in TypeScript.
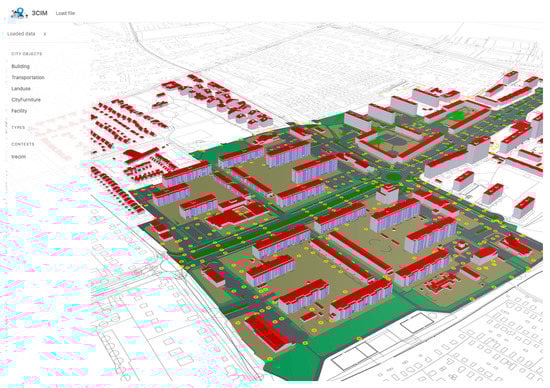
Figure 15.
Visualisation of the 3CIM test data in Malmö in the Digital Twin City Viewer. The planned buildings are not visualised here. Viewing from south-east. For areas outside the 3CIM test area some data from the Malmö base maps are shown.
To support the loading of much larger CityGML data sets, there is ongoing work to convert the data into 3D Tiles, an OGC standard as used in many 3D viewers (e.g., Cesium and Unreal) to load huge GIS data sets. A possible extension here is the new proposal for 3D Tiles Next, an extension to the 3D Tiles format more suitable for dynamic digital twin data sources, given a more flexible tiling mechanism and metadata indexing.
5.3. Noise Simulations
Noise simulations are an important part of the urban planning process, and there exist statutory requirements for monitoring noise in cities according to an EU directive (2002/49/EC). In Europe, these simulations are based on the model CNOSSOS-EU [70]. Simplified, this model consists of two parts: Noise sources and propagation of noise. City models are interesting for the modelling of such propagation, as they potentially contain information about the nature of both horizontal and vertical surfaces (distinguishing between hard and soft surfaces is essential for modelling the propagation of noise) and about 3D objects (e.g., buildings, walls, noise boards) that prevent noise propagation (see, for example, [71,72]).
Our study of how 3CIM data can function together with external road databases as input data for noise simulations is described below. The simulations were conducted in the test area in Malmö in three steps: (1) The properties of the 3CIM road polygons were extracted from the road database; (2) the input data for the simulations were tailored; and (3) the simulations were performed. In the first step, we utilised the linkage between 3CIM data and The National Road Database (NVDB; cf. Figure 4), where the NVDB road links have attributes for properties of the roads, such as speed limit and surface material (cf. Figure 16). By linking to a municipality database, we were also able to obtain the modelled traffic load for the 3CIM road objects.
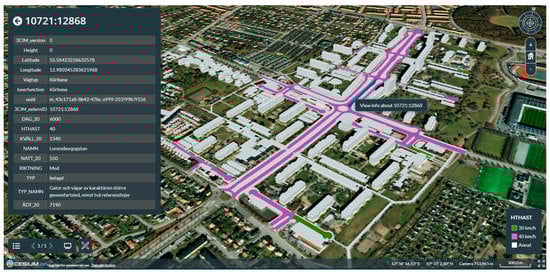
Figure 16.
The transportation theme and buildings in Malmö visualised in Cesium. Streets with car traffic are coloured according to the speed limit (HTHAST) derived from NVDB. The attributes—some extracted from external road databases (NVDB and municipality)—for one selected traffic area (road link id = 10,721:12,868) are shown in the upper left part.
In the next step, the input data to the noise simulations were generated in FME for the noise modelling tool SoundPlan (https://www.soundplan.eu/en/; Accessed on 5 December 2022) (which implements the CNOSSOS-EU model). The simulation used only car traffic as a noise source. The noise levels were simulated on the building façades in accordance with the regulations in the CNOSSOS-EU specifications. As input, the following 3CIM themes were utilised: Transport (AuxilaryTrafficArea), Vegetation (PlantCover and SolitaryVegetationObject), City Furniture (Walls), and Building (BuildingPart). The traffic intensity information was retrieved from a Malmö municipality database. The result of the modelling is illustrated in Figure 17. It should be noted that the input data to the simulations were only used for the study area and, therefore, the estimated noise levels in the border regions were not correct.
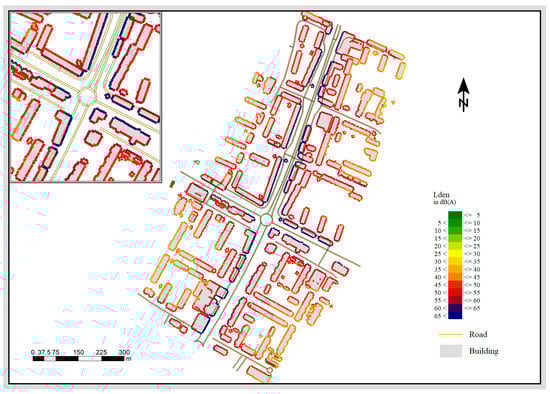
Figure 17.
Result of noise simulations in the Lorensborg–Bellevue area in Malmö. The simulations were performed in SoundPlan in accordance with the CNOSSOS-EU model. Lden is a descriptor of noise level over a whole day, with a penalty of 5 dB(A) for evening noise (19.00–23.00) and a penalty of 10 dB(A) for night-time noise (23.00–7.00). It should be noted that this simulation was performed with some planned buildings included; therefore, there is some overlap between current roads and building objects.
5.4. Daylight Simulations
Daylight simulations are an important part of the urban planning process as support for estimating that the requirements for daylight are achieved in the context of a new construction (e.g., in the case of urban densification). There are several metrics used for these daylight simulations [73] and, most commonly, these simulations are conducted using architectural tools (for newly built houses) or, alternatively, with interactive (or manual) methods. To enable improved simulations, even for existing buildings, it is important that the 3D city models, including 3CIM models, support such simulations. In an ongoing study, Pantazatou et al. [74] have investigated the requirements of 3D city models, with a focus on 3CIM, to be appropriately used for daylight simulations regulated in Swedish legislation.
The example of daylight estimation here is solar irradiation at window level before and after a planned densification in the Lorensborg–Bellevue area in Malmö (cf. Figure 7). The simulations were performed by the QGIS plugin UMEP [75,76], with an additional Python script for handling windows [77]. The input data for the simulations were created by preparing the 3CIM building objects in FME. The buildings were then imported to QGIS-UMEP together with a DTM. The QGIS-UMEP process then starts by creating a surface model including buildings, which is later used for the solar irradiation estimations (together with meteorological data). The output from QGIS-UMEP is raster files that store modelled solar irradiation levels on roofs and walls in grid format. Finally, the Python script of [77] is used to paste these grid values onto the 3CIM model and estimate the solar irradiation values at window level (Figure 18). The results revealed a mean loss of 4% of solar irradiation at window level on an annual basis, due to the planned densification, with an annual loss of almost 20% for the most affected buildings. Further details of this study have been provided in [78].
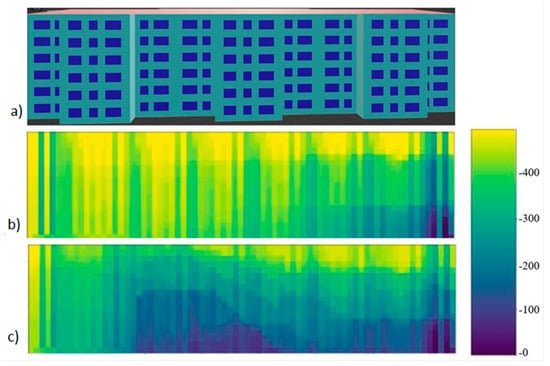
Figure 18.
(a) Façade of one building in the Lorensborg–Bellevue 3CIM test area in Malmö; (b) raster representation of how much solar irradiance (kWh) the façade in (a) receives per year before the planned buildings are added; and (c) raster representation of how much solar irradiance (kWh) the façade in (a) receives per year after the planned buildings are added.
5.5. Flood Simulations
Flood simulations are of significant interest in urban areas [79], and semantic 3D city models can contribute to these simulations in several ways. For the input to the simulations, it is mainly information about the 3D objects (e.g., buildings, walls, and so on) that are of interest, together with information about ground roughness and infiltration capacity (if available in the city model). The 3D city models are also of interest for visualisation of the flood simulation results. On the other hand, 3D city models are not really tailored for the hydrological modelling that is the basis of flood simulations, which is based on flow routing algorithms that require homogenous raster DTMs, where it is essential that the surface is continuous and without data gaps.
For our test, in the Malmö study area, the elevation data for flood simulations was not present in the 3CIM test data but, instead, was retrieved from Malmö municipality from a LIDAR-derived DTM with 1 m spatial resolution. The buildings in LoD2 were retrieved from the 3CIM data in vector format, then rasterised and added to the DTM. LoD2 was required as the roof elevations and angles are crucial in order to simulate the flow off roofs. The only data needed for the urban flow accumulation simulation is a DTM with buildings. In this study, both static and dynamic hydrological modelling was conducted. In the dynamic modelling, where an outcome with water depths and water velocity is produced, a realistic result is obtained only if infiltration and surface friction (i.e., roughness) are included when simulating the physical processes. Infiltration and friction are dependent on several parameters, but can be generalised for permeable and impermeable areas based on rasterised vectors from the 3CIM themes of Building, Transportation, and Vegetation.
The simulation was performed in TFM-DYN [80], based on the raster DTM (including buildings) as well as the infiltration and friction values. The simulation results are multiple raster files, presenting water depth and velocity, from different temporal steps during the event. Figure 19 shows the water depths on top of the 3CIM data, after a one-hour rain event with a 50-year return period intensity.
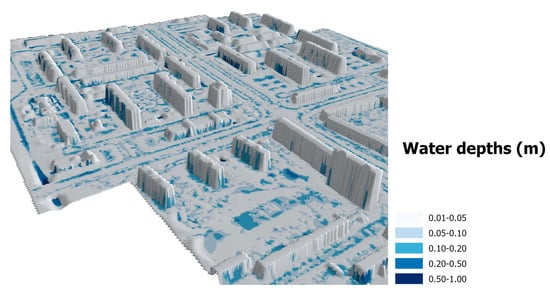
Figure 19.
Water depth after a one-hour 50-year return period rain event in the Malmö test area. The raster rendering causes water close to the walls to appear on the walls, which is really standing water right by the building. The area and visualisation direction are the same as shown in Figure 14.
6. Discussion
6.1. The 3CIM Specifications
The version of 3CIM described in this paper is ver. 1.0, which was released in December 2022 (https://www.smartbuilt.se/projekt/informationsinfrastruktur/3cim/; Accessed on 5 December 2022), and includes the CityGML themes Bridge, Building, CityFurniture, Transportation, Tunnel, Waterbody, and Vegetation, as well as the theme Utility (defined as a CityGML ADE). Landcover data are not included in 3CIM ver. 1.0, with the main motivation of substantial overlap with other themes. This approach was used to determine what types of land-cover could not be modelled in other themes (mainly Transportation, Vegetation, or Water). As foreseen, this resulted in gaps in the data; mainly paved surfaces that did not belong to the transportation theme, such as paved areas around residential buildings or in gardens/parks. These “holes” in the test data had implications for the flood simulations, where no gaps are allowed and it is important to know the surface properties (e.g., friction, imperviousness), as well as for visualisation, where no gaps are accepted. Further work is required to model these areas, either as Land-Cover or using themes specifically describing them as objects.
Elevation data (terrain) is also not included in 3CIM ver. 1.0, but some tests have been performed on data from the test area in Stockholm together with a LiDAR point cloud, in order to obtain an indication about what LoD to recommend and what requirements to impose on the elevation data. Even though the application strongly influences what LoD is required, it is likely that LoD2 (according to [81]) is sufficient for the more general requirements of a municipality. The tests also showed that Terrain Intersection Curves (TIC) are required to accurately model the connections between terrain and city objects, such as buildings. The iterative development of 3CIM is planned to continue after the project has ended, and both land-cover and elevation will likely be studied further, in order to determine how they can best be implemented in 3CIM.
The development of the 3CIM specifications will be affected by which applications are used and prioritised at the municipality level. These applications vary between municipalities, partly due to traditions and the size of the municipality. To investigate this, an interview study has been performed in three municipalities/cities: Stockholm (large), Älmhult (small), and Ulricehamn (small); see Table 2. In this 3CIM article, we have addressed all the current and planned applications, apart from the Building permit process. This application would require linkages between the building permit operational systems and the 3CIM city model. Such a linkage is within the development plan of 3CIM, but has not yet been realised in practice. It should be noted that the building permit process in the Älmhult and Ulricehamn cases mainly refers to checking whether already-existing buildings (and other constructions) are according to granted permits (and detailed development plans), and to visually assess the surroundings when applications for new building permits are received. It should also be noted that the result in Table 2 should not be interpreted as a long-term plan for the municipalities. If, for example, it would be easy to use noise simulation tools (e.g., implementing the CNOSSOS-EU model) utilising 3D city models, the municipalities would likely start to use them.
Table 2.
Current applications (X) and planned future applications (F) of 3D city models in three Swedish municipalities/cities.
As noted in Section 3.2, the plan is for the 3CIM specifications to be developed in an iterative process. One substantial challenge with iterative development is accepting the constant change of data structure and versions. The continuously increased amounts of data collected means more potential insights from digital tools and products that should be consumed by decision makers as soon as possible. Should all the 3CIM data be updated to the latest version of the respective schemas before further consumption when a new version is released? Or should later 3CIM versions be consumed at the same time that different parts of the city data are updated? There is a risk that these changes become overwhelming and that city model investments are not planned for needed continuity. This can result in more legacy systems where data is outdated and a following technical depth burden. The main driver of 3D city models, as well as Digital Twins, should be the “right-time” access to data and following insights from the connected tools. Ideally, the model would change continuously and instantly from ongoing data collection. To conclude, the change management and cost of data acquisition in continuously changing data structures should be further taken into account into the tooling that surrounds the development of the 3CIM specifications. The tools must be continuously developed—even customised under full control—and several versions should be run in parallel in order to combine several versions of the different formats and data structures. Manual work in the data acquisition processes should be transparently accounted for, as part of the feasibility of the developed procedures and as a priority for future work.
Mainly, 3CIM is a thin model, where most attributes are stored in external databases/operational systems (using ExternalReference). However, some class attributes are added to the 3CIM model using an ADE. When we created 3CIM, we had a strategy to store classes/attributes in the ADE for adherence to national standards, as well as to include a few attributes that are commonly used in many applications. However, overall, few attributes have actually been added in the ADE. The practical implementation and use of 3CIM will provide feedback whether our strategy is effective, and we see this as a part of the iterative development.
In this study, the ADE was generated manually from the UML using a reverse engineering approach (looking at other examples), and several tests indicated that the ADE was correct. This approach was possible as the ADE was thin. Initial work was performed using the ShapeChange tool (https://shapechange.net/; Accessed on 5 December 2022) (in a similar manner as used in, for example, [4]), but this work was terminated due to technical problems. In future work, we aim to develop a more automated solution for ADE generation.
6.2. International Standards
It was decided early that 3CIM should be based on CityGML 2.0. One question that should be raised is whether this choice was good, in terms of the applications supported (see Section 2.1). We can conclude that 3CIM, in its current version, does not fully support applications in the built environment process, chiefly due to the fact that versioning is not included. Another limitation with 3CIM for these applications is that it only models physical features; that is, administrative features are not modelled. This implies that vital features, such as (3D) cadastre information, are not included. Both of these limitations could be resolved in a later version of 3CIM, if it is based on CityGML 3.0. This new version of CityGML introduces a new versioning mechanism [57], as well as the possibility to model logical spaces [38].
Many simulations, such as some daylight metrics (cf. [73]), require indoor information, and 3CIM allows indoor information to be stored as it allows CityGML LoD4 buildings (for details, see [36]). However, LoD4 buildings require much modelling, which might not be of interest in this context. CityGML 3.0 has a more flexible LoD definition, which allows indoor information to be stored in lower LoDs (see, for example, [38,82]), which is potentially beneficial for the 3CIM specifications. The above aspects suggest that CityGML 3.0 would be preferable as a basis for 3CIM.
On the other hand, it has been shown that CityGML2.0 has interoperability challenges, due to its complexity and possibility to handle several geometric types [20], and these challenges could be increased with the new possibilities provided in version 3.0. A question is whether it would have been better to use another international standard as a basis for 3CIM. The CityJSON standard is similar to CityGML, in terms of information model, but has removed some parts to improve the interoperability [41]. The new CityJSON ver. 1.1 (https://www.cityjson.org/conformance/v30/; Accessed on 5 December 2022) supports the CityGML 3.0 information model, apart from some specific features, which potentially could make it more interoperable. Hence, CityJSON 1.1 could be an interesting option for later 3CIM versions.
It should be noted here that the main interest for selecting international standards as a basis for 3CIM is the information model, and not the data format. It is hard to predict which information model will be the best in the long term. Apart from the fact that the information model must support common applications, the choice of information model also depends on the development of tools and, especially, the development of database tools (including appropriate import and export tools). As 3CIM was designed as a semantically thin model that depends on external data sources for attribute information, it will always rely on ETL processes to generate input data for most analyses and simulations. In this respect, the main requirement is that the data model used can be imported into an ETL tool.
6.3. Creating 3CIM Test Data
In total, the creation of the test data in Malmö took 2–3 full-time working months for an area of 0.5 km2. This time included some learning parts, and would be substantially lower in a production stage. However, the methods used require much interactive and even manual work, especially concerning the polygonisation of the road data (in the Transport theme) and the linking of the 3CIM road data with The National Road Database. It should also be noted that we did not create any linkages between the 3CIM building data and any operational system (e.g., the building permit system) in the Malmö test data. This linkage will likely be time-consuming, as several building operational systems (including the building permit system) are not based on physical buildings (as used in 3CIM) but, instead, are based on the cadastral system. The conclusion from this is that the creation of 3CIM data—and especially the linkage to other databases/operational systems (Figure 4)—will require a substantial amount of work.
For CityFurniture objects, there is an attribute for relative height (above ground) that can be used to support visualisation, as well as simulations, such as noise. However, in the test data, no value could be given for the relative height, as this information was missing from the municipality base map. Instead, a generalised height, common for all objects of the same type, was used in the visualisation, which means that, for example, all fences had the same height in the visualisation, regardless of their actual height. If the relative heights had been available, a more realistic visualisation could be created.
According to 3CIM ver. 0.2, the polygons in the transportation theme are 3D surfaces. In the test data from Malmö, the height coordinates were set to zero, as the base map was in 2D. Attempts were made to create 3D surfaces by draping the transportation polygons on the DTM to obtain the ground elevation, but this resulted in errors, such as leaning biking paths, especially along slopes where the break lines were not accurately represented in the DTM. One solution to this would be to introduce a DTM with break lines for important objects, such as building footprints (cf. the LoD2 model in [81]).
An alternative solution to generate the 3D buildings with façade elements, such as doors and windows (e.g., for daylight simulations), is to use the interactive platform developed by [83], where windows and doors are detected automatically using a deep learning-based approach [67] and reconstructed in 3D by manually aligning images with footprints for georeferencing.
6.4. Evaluation of the Applications
6.4.1. Storage of the 3CIM Data
Even though data storage is not directly a part of the 3CIM specifications, we performed tests to store the 3CIM test data in 3DCityDB, as it is crucial to have efficient methods to store, retrieve, and update a 3D city model, and 3DCityDB is a free database for storing CityGML 2.0 data, with additional functionalities available as commercial products from Virtual City Systems (https://vc.systems/en/; Accessed on 5 December 2022). Two main limitations of the free version of 3DCityDB, regarding 3CIM, is that it does not support ADEs and the updating of the data.
To support storage of an ADE with the free ADE manager plugin, 3DCityDB can be extended, but the Importer/Exporter does not support ADE extensions. A free Java ADE API (https://3dcitydb-docs.readthedocs.io/en/version-2022.1/plugins/ade-manager/impexp-ade-extension.html; Accessed on 5 December 2022) is available to add functionality to the Importer/Exporter, in order to support an ADE; however, this requires development in Java. Hence, it was decided to develop a workflow in FME for importing and exporting the 3CIM data to/from 3DCityDB (Figure 13). The main motivation for this is that FME is commonly used in GIS departments in municipalities in Sweden, while there is generally limited Java expertise. The FME script created does not support all extensions in the 3CIM ADE, but the tests demonstrated that the workflow can be used to import and export data to/from 3DCityDB.
No extensive tests were performed regarding updating the 3CIM data in 3DCityDB. The main focus in the project was to develop and test the specifications and, as versioning is not included in this version of 3CIM, it was not required to update the data to perform such verification. However, it is nonetheless important to have a functionality to update the database. A potential way forward is to update 3CIM ADE attributes in 3DCityDB using FME with the workflow developed for importing and exporting data (Figure 13, steps 3–4). Updating geometries would require a more extensive work, and no methodology has yet been developed for 3CIM ver. 0.2. One option to update data, including geometries, would be to delete the existing object in 3DCityDB and write the new version to the database. There exists functionality to delete objects in the free version of 3DCityDB, but it is important to ensure that the ADE attributes are also deleted in order to maintain database integrity. To facilitate the wider usage of 3CIM within municipalities in Sweden, support for the 3CIM ADE in 3DCityDB could be developed and released in an open-source manner.
6.4.2. Visualisation
Creating the 3CIM data-driven visualisation did have its own set of challenges. One such challenge—which is still not entirely resolved—is representing the correct height for adjacent surfaces to avoid gaps (in elevation) between a surface and its neighbouring surfaces, which was especially apparent in the game engine visualisations. This is due to a combination of how the surfaces are represented in the data itself and the method used to create the meshes representing the ground surfaces (e.g., roads, grass). For visualisation of this type, this is generally not a problem as we can employ multiple methods to hide these imperfections (if they are even noticeable at all). However, for other types of visualisations, such as those for liquid simulations, which utilises the collision/surface of the geometry, this would have obvious effects, as the liquid would have places to “escape”. One solution to this would be to introduce a DTM with break lines for important objects.
In the visualisation using Unreal engine, the presentation of some point objects was performed using libraries within the program. This was necessary as we had not created any implicit geometries (specified in the CityGML core) for these objects in the Malmö test data. However, this procedure was tested in Gothenburg, where we used point geometries representing lamp posts in the City Furniture theme and connected them to a 3D model of a lamp post. The functionality of Implicit Geometry is carried out by specifying a referencePoint as the insertion point for the model to be visualised and three attributes that must be specified (mimeType, transformationMatrix, and libraryObject). More work is required to evaluate this approach in practice (e.g., in visualisation tools).
The visualisation in the web-based Digital Twin City Viewer (DTCV) also entailed some challenges with respect to the test data. One such issue is that a WallSurface should be a logical surface, instead of a random part of a wall. This result is very hard to spot in pure rendering if the surface is not clickable, and it is also a risk that the tool will try to fix the problem by calculating and processing the data further. This will not help as, when the data is read into the next tool, the problem persists. This creates pressure on the tool developers to “work” as good as the other tool, creating an unsustainable situation. The same problem has been seen during the past decades when using the IFC format between applications; where (specifically large and dominant) software vendors have introduced problems into file exports that the rest of the market must adjust to. It should be noted that this problem is due to how the 3D building objects were created originally before they were converted to 3CIM. Neither the 3CIM specifications, nor CityGML, specify how these wall surfaces should be modelled.
6.4.3. Simulations
For the noise simulation tests, the connection between the 3CIM data and The National Road Database (NVDB) worked well, and the data could be prepared for and imported to the noise simulation tool (SoundPlan). However, there were several issues that need to be addressed in the next version of 3CIM. For a noise simulation, it is important to have a complete partition that describes the acoustic properties (i.e., hard and soft surfaces) of the ground. This implies that the Land-Cover theme is required to fill the “holes” in the current test data, and that the Land-Cover theme supports the classification of acoustic properties.
For daylight estimations, several of the metrics—including some legally required in Sweden—require knowledge about windows. The locations of the windows are known for new buildings (e.g., from a BIM model); however, for existing buildings, these locations are most commonly known only for some landmark buildings. This implies difficulties in evaluating the daylight conditions for existing buildings in, for example, a city densification project. The 3CIM specifications allow for the representation of buildings using CityGML 2.0 LoD3 buildings. In this context, it may be advantageous to use CityGML 3.0, as this version is more flexible in terms of information content in the LoDs. Another advantage of CityGML 3.0 for daylight simulations is the possibility to include indoor information in lower LoDs, which is a requirement for some daylight metrics. In the study reported in this paper, we added window information in a CityJSON file, which worked well with the simulation tools used (plugins of QGIS). In an ongoing study [74], we have investigated more details of the requirements of the 3CIM specifications and measuring guidelines for daylight simulations. Preliminary conclusions from this study are specific requirements for the modelling of roof structures and balconies.
The 3CIM test data utilised in the flood simulations were the Building, Transportation, and Vegetation themes. Furthermore, the City Furniture theme could potentially be used (e.g., walls), but was not included in our study. The buildings were good enough from a geometric perspective (as they were in LoD2; LoD1 buildings are not recommended as they cannot handle the direction of flow on roofs). One aspect of 3CIM, compared to the current 2D municipality maps, is that 3CIM is based on 2D surfaces, and not only lines. This makes it easier to model roughness and infiltration for the ground. However, in many cases, the surfaces require extra attributes that describe these properties to improve the flood modelling performance.
6.5. Data Quality Issues
The 3CIM specifications include both rules to guarantee that the data is of good quality and possibilities to store quality information at the object level. The data quality rules are provided in the measurement guidelines. Among others, these guidelines state which measurement techniques should be used. The detailed measurement procedures are then specified in the national measurement manuals (HMK (https://www.lantmateriet.se/sv/geodata/Handbok-i-mat--och-kartfragor-HMK/; Accessed on 5 December 2022)) provided by The Swedish Mapping, Cadastral, and Land Registration Authority. These manuals state that urban data (e.g., 3D city models) should have positional accuracy at the dm level.
All 3CIM objects have data quality elements enforced by the ADE (cf. Section 3.2.3). In our study, we tested populating the City Furniture elements with values taken from data production systems (applied to the Stockholm test data).
What remains to be evaluated is whether the quality specifications in the measurement guidelines and the data quality elements together support common applications of the 3CIM data. Early results from Pantazatou et al. [74] have revealed that the positional accuracy recommendations are sufficient for daylight simulations, but more studies are required in the future.
6.6. Linking 3CIM to External Data—Using Linked Data
Linking 3CIM data to external data sources requires technical and organisational solutions for handling unique object identifiers. Technically, these identifiers can be handled as UUIDs, which was also tested in this study (cf. Section 4.2). However, we set our own UUIDs, without considering interoperability with other systems. What is really required are rules at the national level, regarding which organisation (foremost, a national agency or a city) is responsible to set a unique identifier for a certain object type. There is an ongoing work, coordinated by the Swedish Agency for Digital Government (https://www.digg.se/en; Accessed on 5 December 2022), to define data requirements for the base data in Sweden; ideally, this work should lead to rules regarding the responsibilities of setting unique identifiers. These rules are essential to enable the linkages between 3CIM data and external data sources (cf. Figure 4).
The 3CIM project does not use linked data (RDF data) in terms of how it is used in the semantic web. However, it is quite likely that this technique could be used in the future to link city models and external registers/databases/operational systems, but this would require that the external data are stored as (or, at least, are easy to convert to) linked data (RDF data). Furthermore, substantial work on developing ontologies (for work on CityGML ontologies see, for example, [84]), aligning ontologies, and improving RDF stores to handle geospatial data (see, for example, [85,86]) is still required. The important aspect for the current design decision is that 3CIM uses a data model (where objects are linked using unique ID-numbers) that, later on, may be transformed to a linked data solution. This design decision is expected to make it possible to use the linked data paradigm in the future without too much modelling and data collection effort.
7. Concluding Remarks
The main contributions of this study are the 3D city model specifications, denoted as 3CIM; the process to create these specifications in a collaborative manner; and the creation and evaluation of the test data. During this study, we encountered several design decisions and challenges.
We decided, before the project started, that 3CIM should be based on an international standard. The design decision was then to use CityGML 2.0. Since then, we have seen that several features added into the CityGML 3.0 conceptual model would be interesting for a future version of 3CIM (especially the handling of versions and logical spaces); however, the considered cities regard the tools available for CityGML 3.0 as not yet mature enough for production use.
Another design solution was to use a thin extension of CityGML (ADE), instead linking to external databases and operational systems. This approach was evaluated for road data (e.g., connecting 3CIM to external road databases) and noise simulations. The main advantage of this approach is that it will be easier to maintain the data in a production environment; meanwhile, the challenges are that it is more complicated to create the city model data (as its object structure must be coherent with the external data), and that an ETL process is required to generate input data (e.g., for simulations). We have been able to cope with both these challenges.
The specifications in this paper are based on 3CIM ver. 1.0, the first official version of 3CIM. However, as noted above, 3CIM needs to be developed further. Themes that must be addressed in the next version likely include Land-Use and Height/Relief. Another important issue is that the 3CIM model must be harmonised with the National Specifications of Geodata, which are also currently under development.
In the project, we created test data for three study areas, one in each city. The main sources for the 3CIM data were 2D municipality maps, 3D building models, and some additional municipality models. The creation process was, to a large degree, interactive and even manual, which made it labour-intensive. This calls for further studies regarding the automation of the 3CIM data creation based on available data sources, and especially automated methods to connect 3CIM data to external databases and operational systems.
It is important that tools exist to handle the 3CIM data. As part of the study, we created many visualisations of the 3CIM data. Two examples of visualisations of the Malmö data were included in this paper, and three more visualisation tools have been used in the other cities. Our experience here is that the 3CIM data are appropriate for the most common visualisation tools. We also showed that the 3CIM data can be utilised in several simulation tools (with the utilisation of an ETL process to generate input data). The main challenge, from a tool perspective, is to find a good storage environment which includes import and export functionalities, as well as supports updates. We tested the spatial database 3DCityDB (on top of PostGIS) and would like to continue to use this tool. More work is, however, needed to extend the 3DCityDB with functionality to handle the 3CIM ADE. In the future, we also need to extend the database solution with better versioning capabilities; hopefully, this could come together with the implementation of CityGML 3.0 in 3DCityDB.
To create the 3CIM specifications, test data and the evaluations have been an extensive project spanning two and a half years, with a workload corresponding to a full-time equivalent of about four years. It is important that this investment can be paid off through the practical use of 3CIM. The current main obstacle to implementing the 3CIM model in Stockholm, Gothenburg, and Malmö, as well as in other Swedish cities, is likely the time and cost burdens related to creating and maintaining the 3CIM data.
One main strength of the 3CIM model is that it was developed by the three largest cities in Sweden, in cooperation with Lund University. The fact that these four organisations have created this common ground together has paved the road for other Swedish cities to work with city information models in a standardised manner.
Author Contributions
Maria Uggla lead the 3CIM project; Lars Harrie and Perola Olsson led the writing of the manuscript; Gabriel Hirsch and Maria Uggla led the modelling and specification work; Barzan Abdi, Matthew Calvert, Ulrika Christensen, Daniel Gardevärn, Eric Jeansson, Zuhret Kadric, Jonas Lord, Maria Sjöberger, Ola Setterby, Lars Harrie, and Perola Olsson participated in the modelling and specification work; Björn Axelsson and Gabriel Hirsch made scripts for the data storage; Perola Olsson and Barzan Abdi created the test data; Axel Loreman, Paul Stewart, and Andreas Rudenå performed the visualisations; Andreas Persson and Karolina Pantazatou performed the flood simulations; Hang Li, Hongchao Fan, and Gefei Kong collected the window information; Kendall Hartman and Karolina Pantazatou performed daylight simulations; Mikael Bauner, Perola Olsson, and Wenjing Liu performed the noise simulations; Andreas Ahlström made the municipality survey. All authors have read and agreed to the published version of the manuscript.
Funding
The 3CIM project is part of the Smart Built Environment programme funded by Formas, Sweden’s Innovation Agency Vinnova, and the Swedish Energy Agency, grant number Formas-2020-00261. The simulations in this paper are performed in cooperation with the project: Increase the potential for energy and noise simulations when planning urban densification, funded by Formas 2020-01460. The Digital Twin City Viewer (DTCV) is funded by Sweden’s Innovation Agency Vinnova as part of the Digital Twin Cities Centre (DTCC) hosted by Chalmers University of Technology (also funded by Vinnova). Financial support has also been provided by the cities of Stockholm, Gothenburg, and Malmö, as well as by Lund University (Sweden) and NTNU (Norway).
Data Availability Statement
The specifications, XML-schemas and the test data sets are available at https://www.smartbuilt.se/projekt/informationsinfrastruktur/3cim/; Accessed on 5 December 2022.
Acknowledgments
Thanks to Maria Andersson, Helen Eriksson, and Thomas Lithén at Lantmäteriet for fruitful discussions about the linkage between 3CIM specifications and the National Specifications of Geodata. Thanks also to Kristoffer Mattisson, Lund University, for guidance of how to use Soundplan. A free student license for SoundPlan is acknowledged as well as an academic user license of FME (in Lund). Thanks to Mårten Spanne and his colleges at Malmö stad for providing traffic information for the noise simulations as well as good guidance.
Conflicts of Interest
The authors declare no conflict of interest.
References
- Stoter, J.; van Den Brink, L.; Beetz, J.; Ledoux, H.; Reuvers, M.; Janssen, P.; Penninga, F.; Vosselman, G.; Oude Elberink, S. Three-dimensional modeling with national coverage: Case of The Netherlands. Geo-Spat. Inf. Sci. 2013, 16, 267–276. [Google Scholar] [CrossRef]
- Gruber, U.; Riecken, J.; Seifert, M. Germany on the Way to 3D-Cadastre. In Proceedings of the FIG Congress, Kuala Lumpur, Malaysia, 16–21 June 2014. [Google Scholar]
- Van den Brink, L.; Stoter, J.; Zlatanova, S. Establishing a national standard for 3D topographic data compliant to CityGML. Int. J. Geogr. 2013, 27, 92–113. [Google Scholar] [CrossRef]
- Eriksson, H.; Johansson, T.; Olsson, P.-O.; Andersson, M.; Engvall, J.; Hast, I.; Harrie, L. Requirements, Development, and Evaluation of A National Building Standard—A Swedish Case Study. ISPRS Int. J. Geo-Inf. 2020, 9, 78. [Google Scholar] [CrossRef]
- Stoter, J.E.; Ledoux, H.; Penninga, F.; van den Brink, L.; Reuvers, M.; Vermeij, M.; Wiersma, M.G. Towards a generic 3D standardisation approach for the Netherlands supporting different applications and encodings. In The International Archives of the Photogrammetry, Remote Sensing and Spatial Information Sciences, Proceedings of 14th 3D GeoInfo Conference, Singapore, 24–27 September 2019; Copernicus GmbH: Göttingen, Germany, 2019; Volume XLII-4/W15, pp. 89–96. [Google Scholar]
- Ates Aydar, S.; Yomralıoglu, T.; Demir Ozbek, E. Modeling Turkey National 2D Geo-Data Model as a CityGML Application Domain Extension in UML. Int. J. Environ. Geoinform. 2016, 3, 1–10. [Google Scholar] [CrossRef]
- Liamis, T.; Mimis, A. Establishing Semantic 3D City Models by GRextADE: The Case of the Greece. J. Geovis. Spat. Anal. 2022, 6, 15. [Google Scholar] [CrossRef]
- Jeansson, E. Virtual Gothenburg–A Digital Twin of the City. 2019. Available online: https://geospatialworldforum.org/speaker/presentions2019/Virtual-Gothenburg-A-digital-twin-of-the-city-Eric_Jeansson.pdf (accessed on 7 December 2022).
- Helsinki. The Kalasatama Digital Twins Project, the Final Report of the KIRA-Digi Pilot Project. 2019. Available online: https://www.hel.fi/static/liitteet-2019/Kaupunginkanslia/Helsinki3D_Kalasatama_Digital_Twins.pdf (accessed on 6 June 2022).
- Ruohomäki, T.; Airaksinen, E.; Huuska, P.; Kesäniemi, O.; Martikka, M.; Suomisto, J. Smart city platform enabling digital twin. In Proceedings of the 2018 International Conference on Intelligent Systems (IS), Funchal, Portugal, 25–27 September 2018; pp. 155–161. [Google Scholar] [CrossRef]
- Singapore. Virtual Singapore. Government of Singapore. 2021. Available online: https://www.nrf.gov.sg/programmes/virtual-singapore (accessed on 6 June 2022).
- Schrotter, G.; Hürzeler, C. The digital twin of the City of Zurich for urban planning. PFG–Journal of Photogrammetry. Remote Sens. Geoinf. Sci. 2020, 88, 99–112. [Google Scholar] [CrossRef]
- Kumar, K.; Ledoux, H.; Commandeur, T.J.F.; Stoter, J.E. Modelling urban noise in CityGML ADE: Case of the Netherlands. In ISPRS Annals of the Photogrammetry, Remote Sensing and Spatial Information Sciences, Proceedings of ISPRS 12th Geoinfo Conference, Melbourne, Australia, 26–27 October 2017; Copernicus GmbH: Göttingen, Germany, 2017; Volume IV-4/W5, pp. 73–81. [Google Scholar]
- Wate, P.; Coors, V. 3D data models for urban energy simulation. Energy Procedia 2015, 78, 3372–3377. [Google Scholar] [CrossRef]
- Ang, Y.Q.; Berzolla, Z.; Reinhart, C. From concept to application: A review of use cases in urban building energy modeling. Appl. Energy 2020, 279, 115738. [Google Scholar] [CrossRef]
- Kanters, J.; Gentile, N.; Bernardo, R. Planning for solar access in Sweden: Routines, metrics, and tools. Urban Plan. Transp. Res. 2021, 9, 348–368. [Google Scholar] [CrossRef]
- Reiter, S. Assessing wind comfort in urban planning. Environ. Plan. B 2010, 37, 857–873. [Google Scholar] [CrossRef]
- Charlton, J.; Giddings, B.; Thompson, E.M.; Peverett, I. Understanding the interoperability of virtual city models in assessing the performance of city centre squares. Environ. Plan. A 2015, 47, 1298–1312. [Google Scholar] [CrossRef]
- Harrie, L.; Kanters, J.; Mattisson, K.; Nezval, P.; Olsson, P.-O.; Pantazatou, K.; Kong, G.; Fan, H. 3D City models for supporting simulations in city densifications. Int. Arch. Photogramm. Remote Sens. Spat. Inf. Sci. 2021, XLVI-4/W4-2021, 73–77. [Google Scholar] [CrossRef]
- Noardo, F.; Arroyo Ohori, K.; Biljecki, F.; Ellul, C.; Harrie, L.; Krijnen, T.; Eriksson, H.; van Liempt, J.; Pla, M.; Ruiz, A.; et al. Reference study of CityGML software support: The GeoBIM benchmark 2019—Part II. Trans. GIS 2021, 25, 842–868. [Google Scholar] [CrossRef]
- Van Berlo, L.; Dijkmans, T.; Stoter, J. Experiment for integrating Dutch 3D spatial planning and BIM for checking building permits. In ISPRS Annals of the Photogrammetry, Remote Sensing and Spatial Information Sciences, Proceedings of ISPR 8th 3DGeoInfo Conference & WG II/2 Workshop, Istanbul, Turkey, 27–29 November 2013; Copernicus GmbH: Göttingen, Germany, 2013; Volume II-2/W1, pp. 279–284. [Google Scholar]
- Olsson, P.; Axelsson, J.; Hooper, M.; Harrie, L. Automation of building permission by integration of BIM and geospatial data. ISPRS Int. J. Geo-Inf. 2018, 7, 307. [Google Scholar] [CrossRef]
- Noardo, F.; Ellul, C.; Harrie, L.; Oveland, I.; Shariat, M.; Stoter, J.; Arroyo Ohori, K. Opportunities and Challenges for GeoBIM in Europe: Developing a building permits use-case to raise awareness and examine technical interoperability challenges. J. Spat. Sci. 2019, 65, 209–233. [Google Scholar] [CrossRef]
- Sun, J.; Mi, S.; Olsson, P.-O.; Paulsson, J.; Harrie, L. Utilizing BIM and GIS for Representation and Visualization of 3D Cadastre. ISPRS Int. J. Geo-Inf. 2019, 8, 503–527. [Google Scholar] [CrossRef]
- Kalogianni, E.; van Oosterom, P.; Dimopoulou, E.; Lemmen, C. 3D Land Administration: A Review and a Future Vision in the Context of the Spatial Development Lifecycle. ISPRS Int. J. Geo-Inf. 2020, 9, 107. [Google Scholar] [CrossRef]
- Liu, X.; Wang, X.Y.; Wright, G.; Cheng, J.C.P.; Li, X.; Liu, R. A State-of-the-Art Review on the Integration of Building Information Modeling (BIM) and Geographic Information System (GIS). ISPRS Int. J. Geo-Inf. 2017, 6, 52. [Google Scholar] [CrossRef]
- Stouffs, R.; Tauscher, H.; Biljecki, F. Achieving Complete and Near-Lossless Conversion from IFC to CityGML. ISPRS Int. J. Geo-Inf. 2018, 7, 355. [Google Scholar] [CrossRef]
- Chaturvedi, K.; Kolbe, T.H. Towards Establishing Cross-Platform Interoperability for Sensors in Smart Cities. Sensors 2019, 19, 562. [Google Scholar] [CrossRef]
- Ketzler, B.; Naserentin, V.; Latino, F.; Zangelidis, C.; Thuvander, L.; Logg, A. Digital Twins for Cities: A State of the Art Review. Built Environ. 2020, 46, 547–573. [Google Scholar] [CrossRef]
- Mohammadi, N.; Taylor, J. Knowledge discovery in smart city digital twins. In Proceedings of the 53th Hawaii International Conference on System Sciences, Maui, HI, USA, 7–10 January 2020. [Google Scholar]
- Nam, T.; Pardo, T.A. Conceptualizing Smart City with Dimensions of Technology, People, and Institutions. In Proceedings of the 12th Annual International Digital Government Research Conference: Digital Government Innovation in Challenging Times, College Park, MD, USA, 12–15 June 2011; pp. 282–291. [Google Scholar] [CrossRef]
- Lim, C.; Kim, K.-J.; Maglio, P.P. Smart cities with big data: Reference models, challenges, and considerations. Cities. 2018, 82, 86–99. [Google Scholar] [CrossRef]
- Sarker, I.H. Smart City Data Science: Towards data-driven smart cities with open research issues. Internet Things 2022, 19, 100528. [Google Scholar] [CrossRef]
- Ruggedised. Project Webpage. 2019. Available online: https://ruggedised.eu/home/ (accessed on 25 May 2022).
- Colding, J.; Colding, M.; Barthel, S. The smart city model: A new panacea for urban sustainability or unmanageable complexity? Environ. Plan. B 2020, 47, 179–187. [Google Scholar] [CrossRef]
- Gröger, G.; Kolbe, T.H.; Nagel, C.; Häfele, K.H. (Eds.) OGC City Geography Markup Language (CityGML) Encoding Standard, Ver 2.0. 2012. Available online: http://www.opengeospatial.org/standards/citygml (accessed on 25 May 2022).
- Gröger, G.; Plümer, L. CityGML–Interoperable semantic 3D city models. ISPRS J. Photogramm. Remote Sens. 2012, 71, 12–33. [Google Scholar]
- Kolbe, T.H.; Kutzner, T.; Smyth, C.S.; Nagel, C.; Roensdorf, C.; Heazel, C. (Eds.) OGC City Geography Markup Language (CityGML) Part 1: Conceptual Model Standard, Ver 3.0.0. 2021. Available online: http://www.opengeospatial.org/standards/citygml (accessed on 25 May 2022).
- Kutzner, T.; Chaturvedi, K.; Kolbe, T.H. CityGML 3.0: New Functions Open Up New Applications. PFG. PFG 2020. [Google Scholar] [CrossRef]
- Yao, Z.; Nagel, C.; Kunde, F.; Hudra, G.; Willkomm, P.; Donaubauer, A.; Adolphi, T.; Kolbe, T.H. 3DCityDB-a 3D geodatabase solution for the management, analysis, and visualization of semantic 3D city models based on CityGML. Open Geospat. Data Softw. Stand. 2018, 3, 5. [Google Scholar] [CrossRef]
- Ledoux, H.; Arroyo Ohori, K.; Kumar, K.; Dukai, B.; Labetski, A.; Vitalis, S. CityJSON: A compact and easy-to-use encoding of the CityGML data model. Open Geospat. Data Softw. Stand. 2019, 4, 4. [Google Scholar] [CrossRef]
- Nouvel, R.; Bahu, J.M.; Kaden, R.; Kaempf, J.; Cipriano, P.; Lauster, M.; Haefele, K.H.; Munoz, E.; Tournaire, O.; Casper, E. Development of the CityGML Application Domain Extension Energy for Urban Energy Simulation. In Proceedings of the 14th Conference of International Building Performance Simulation Association, Hyderabad, India, 7–9 December 2015; pp. 559–564. [Google Scholar]
- Agugiaro, G.; Benner, J.; Cipriano, P.; Nouvel, R. The Energy Application Domain Extension for CityGML: Enhancing interoperability for urban energy simulations. Open Geospat. Data Softw. Stand. 2018, 3, 13. [Google Scholar] [CrossRef]
- Czerwinski, A.; Sandmann, S.; Elke, S.-M.; Plümer, L. Sustainable SDI for EU noise mapping in NRW–best practice for INSPIRE. Int. J. Spat. Data Infrastruct. Res. 2007, 2, 90–111. [Google Scholar]
- Gózdz, K.; Pachelski, W.; van Oosterom, P.J.M.; Coors, V. The possibilities of using CityGML for 3D representation of buildings in the cadastre. In Proceedings of the 4th International Workshop on 3D Cadastres. Dubai: International Federation of Surveyors (FIG), Dubai, United Arab Emirates, 9–11 November 2014; pp. 339–362. [Google Scholar]
- Li, L.; Wu, J.; Zhu, H.; Duan, X.; Luo, F. 3D modeling of the ownership structure of condominium units. Comput. Environ. Urban Syst. 2016, 59, 50–63. [Google Scholar] [CrossRef]
- Biljecki, F.; Kumar, K.; Nagel, C. CityGML Application Domain Extension (ADE): Overview of developments. Open Geospat. Data Softw. Stand. 2018, 3, 13. [Google Scholar] [CrossRef]
- Billen, R.; Cutting-Decelle, A.-F.; Marina, O.; Almeida, J.-P.d.M.C.; Falquet, G.; Leduc, T.; Métral, C.; Moreau, G.; Perret, J.; Rabin, G.; et al. 3D City Models and Urban Information: Current Issues and Perspectives. In European COST Action TU080; EDP Sciences: Les Ulis, France, 2014. [Google Scholar]
- El-Mekawy, M.; Östman, A.; Hijazi, I. A Unified Building Model for 3D Urban GIS. ISPRS Int. J. Geo-Inf. 2012, 1, 120–145. [Google Scholar] [CrossRef]
- Eriksson, H.; Harrie, L. Versioning of 3D City Models for Municipality Applications: Needs, Obstacles and Recommendations. ISPRS Int. J. Geo-Inf. 2021, 10, 55. [Google Scholar] [CrossRef]
- Lantmäteriet. National Specifications. 2022. Available online: https://www.lantmateriet.se/en/national-geodata-platform/data-sets-in-the-platform/specifications-and-instructions/ (accessed on 6 October 2022).
- SIG3D Quality Working Group. Modeling Guide for 3D Objects Part2: Modeling of Buildings (LoD1, LoD2 and LoD3), Version 2.0.1 EN. 2017. Available online: https://files.sig3d.org/file/ag-qualitaet/201711_SIG3D_Modeling_Guide_for_3D_Objects_Part_2.pdf (accessed on 7 June 2022).
- Blaauboer, J.; Goos, J.; Ledoux, H.; Penninga, F.; Reuvers, M.; Stoter, J.; Vosselman, G.; Commandeur, T. Technical Specifications for the Construction of 3D IMGeo-CityGML, Version 2.1. Available online: https://www.geonovum.nl/uploads/documents/20170102Guidetotender3DCityGMLIMGeo_v2.1_0.pdf (accessed on 7 June 2022).
- Lei, B.; Janssen, P.; Stoter, J.; Biljecki, F. Challenges of urban digital twins: A systematic review and a Delphi expert survey. Autom. Constr. 2023, 147, 104716. [Google Scholar] [CrossRef]
- 3CIM. The 3CIM Project. 2022. Available online: https://www.smartbuilt.se/projekt/informationsinfrastruktur/3cim/ (accessed on 6 October 2022).
- Bendiksen, T. Creating a Workflow of 3D Building Data in a Municipality Context. Master’s Thesis, Dept of Physical Geography and Ecosystem Science, Lund University, Lund, Sweden, 2021. [Google Scholar]
- Eriksson, H.; Sun, J.; Tarandi, V.; Harrie, L. A comparison of versioning methods to improve the flow of building information in the planning and building processes. Trans. GIS 2021, 25, 134–163. [Google Scholar] [CrossRef]
- Chaturvedi, K.; Smyth, C.S.; Gesquière, G.; Kutzner, T.; Kolbe, T.H. Managing versions and history within semantic 3D city models for the next generation of CityGML. In Advances in 3D Geoinformation, Lecture Notes in Cartography and Geoinformation; Abdul-Rahman, A., Ed.; Springer: Berlin/Heidelberg, Germany, 2016. [Google Scholar]
- CoClass. Swedish Digital Construction Classification System for Built Environment. 2022. Available online: https://byggtjanst.se/tjanster/coclass/ (accessed on 18 October 2019).
- Kumar, K.; Ledoux, H.; Stoter, J. A CityGML Extension for Handling Very Large Tins. ISPRS Ann. Photogramm. Remote Sens. Spat. Inf. Sci. 2016, IV-2/W1, 137–143. [Google Scholar] [CrossRef]
- Biljecki, F.; Ledoux, H.; Stoter, J. An improved LOD specification for 3D building models. Comput. Environ. Urban Syst. 2016, 59, 25–37. [Google Scholar] [CrossRef]
- Beil, C.; Kolbe, T.H. Citygml and the Streets of New York-a Proposal for Detailed Street Space Modelling. ISPRS Ann. Photogramm. Remote Sens. Spat. Inf. Sci. 2017, 44W5, 9. [Google Scholar] [CrossRef]
- Beil, C.; Ruhdorfer, R.; Coduro, T.; Kolbe, T.H. Detailed Streetspace Modelling for Multiple Applications: Discussions on the Proposed CityGML 3.0 Transportation Model. ISPRS Int. J. Geo-Inf. 2020, 9, 603. [Google Scholar] [CrossRef]
- Lantmäteriet. 2022. Available online: https://www.lantmateriet.se/sv/geodata/gps-geodesi-och-swepos/Transformationer/gtrans/ (accessed on 13 August 2022).
- Huang, W.; Olsson, P.O.; Kanters, J.; Harrie, L. Reconsiling city models with BIM in knowledge graphs: A feasibility study of data integration for solar energy simulation. ISPRS Ann. Photogramm. Remote Sens. Spat. Inf. Sci. 2021, VI-4/W1-2020, 93–99. [Google Scholar] [CrossRef]
- Dogan, T.; Knutins, M. CitySeek: Towards Urban Daylight Models Based on GIS Data and SemiAutomated Image Processing. In Proceedings of the Symposium on Simulation for Architecture and Urban Design, Delft, The Netherlands, 5–7 June 2018; SIMAUD ‘18. [Google Scholar]
- Kong, G.; Fan, H. Enhanced Facade Parsing for Street-Level Images Using Convolutional Neural Networks. IEEE Trans. Geosci. Remote Sens. 2021, 59, 10519–10531. [Google Scholar] [CrossRef]
- Trafikverket. Introduktion Till NVDBs Vägnät Och Företeelser, Dokumentdatum: 2021-02-12 Version: 1.0. 2022. Available online: https://bransch.trafikverket.se/dataproduktspecifikationer-vag/ (accessed on 15 November 2022).
- Lei, B.; Stouffs, R.; Biljecki, F. Assessing and benchmarking 3D city models. Int. J. Geogr. Inf. Sci. 2022. [Google Scholar] [CrossRef]
- Kephalopoulos, S.; Paviotti, M.; Anfosso-Lédée, F. Common Noise Assessment Methods in Europe (CNOSSOS-EU); Publications Office of the European Union: Brussels, Belgium, 2012. [Google Scholar]
- Kumar, K.; Ledoux, H.; Schmidt, R.; Verheij, T.; Stoter, J. A harmonized data model for noise simulation in the EU. ISPRS Int. J. Geo-Info. 2020, 9, 121. [Google Scholar] [CrossRef]
- Stoter, J.; Peters, R.; Commandeur, T.; Dukai, B.; Kumar, K.; Ledoux, H. Automated reconstruction of 3D input data for noise simulation. Comput. Environ. Urban Syst. 2020, 80, 101424. [Google Scholar] [CrossRef]
- Czachura, A.; Kanters, J.; Gentile, N.; Wall, M. Solar performance metrics in urban planning: A review and taxonomy. Buildings 2022, 12, 393. [Google Scholar] [CrossRef]
- Pantazatou, K.; Kanters, J.; Olsson, P.O.; Harrie, L. Input data requirements for daylight simulations in urban densifications. Under Review. 2022. [Google Scholar]
- Lindberg, F.; Jonsson, P.; Honjo, T.; Wästberg, D. Solar energy on building envelopes–3D modelling in a 2D environment. Sol. Energy 2015, 115, 369–378. [Google Scholar] [CrossRef]
- Lindberg, F.; Wallenburg, N.; Tang, Y.; Grimmond, S.; Sun, T.; Solar Energy-Introduction to SEBE. Solar Energy-Introduction to SEBE-UMEP Tutorial Documentation. 2018. Available online: https://umep-docs.readthedocs.io/projects/tutorial/en/latest/Tutorials/SEBE.html#irradiance-on-building-envelopes (accessed on 7 February 2022).
- Nezval, P. Design, Implementation and Evaluation of a Daylight Estimation Tool Using 3D City Model Data. Master’s Thesis, Lund University, Lund, Sweden, 2021. [Google Scholar]
- Hartman, K. Modelling Solar Access at the Window Level of Buildings–A Case Study for Urban Densification Simulations in Sweden. Master’s Thesis, Lund University, Lund, Sweden, 2022. [Google Scholar]
- Salvadore, E.; Bronders, J.; Batelaan, O. Hydrological Modelling of Urbanized Catchments: A Review and Future Directions. J. Hydrol. 2015, 529, 62–81. [Google Scholar] [CrossRef]
- Nilsson, H.; Pilesjö, P.; Hasan, A.; Persson, A. Dynamic spatio-temporal flow modeling with raster DEMs. Trans. GIS. 2021, 26, 1572–1588. [Google Scholar] [CrossRef]
- Kumar, K.; Labetski, A.; Ledoux, H.; Stoter, J. An improved LOD framework for the terrains in 3D city models. ISPRS Ann. Photogramm. Remote Sens. Spat. Inf. Sci. 2019, IV-4/W8, 75–82. [Google Scholar] [CrossRef]
- Löwner, M.-O.; Gröger, G.; Benner, J.; Biljecki, F.; Nagel, C. Proposal for a new LOD and Multi-Representation Concept for CityGML. In ISPRS Ann. Photogramm. Remote Sens. Spatial Inf. Sci., Proceedings of ISPRS 11th Geoinfo Conference, Athens, Greece, 20–21 October 2016; Copernicus GmbH: Göttingen, Germany, 2016; Volume IV(2/W1), pp. 3–12. [Google Scholar]
- Fan, H.; Kong, G.; Zhang, C. An Interactive platform for low-cost 3D building modeling from VGI data using convolutional neural network. Big Earth Data 2021, 5, 49–65. [Google Scholar] [CrossRef]
- Chadzynski, A.; Krdzavac, N.; Farazi, F.; Lim, M.Q.; Li, S.; Grisiute, A.; Herthogs, P.; von Richthofen, A.; Cairns, S.; Kraft, M. Semantic 3D City Database—An enabler for a dynamic geospatial knowledge graph. Energy AI 2021, 6, 100106. [Google Scholar] [CrossRef]
- Huang, W.; Raza, S.A.; Mirzov, O.; Harrie, L. Assessment and Benchmarking of Spatially-Enabled RDF Stores for the Next Generation of Spatial Data Infrastructure. ISPRS Int. J. Geo-Inf. 2019, 8, 310–329. [Google Scholar] [CrossRef]
- Li, W.; Wanga, S.; Wu, S.; Gu, Z.; Tian, Y. Performance benchmark on semantic web repositories for spatially explicit knowledge graph applications. Comput. Environ. Urban Syst. 2022, 98, 101884. [Google Scholar] [CrossRef]


Disclaimer/Publisher’s Note: The statements, opinions and data contained in all publications are solely those of the individual author(s) and contributor(s) and not of MDPI and/or the editor(s). MDPI and/or the editor(s) disclaim responsibility for any injury to people or property resulting from any ideas, methods, instructions or products referred to in the content. |
© 2023 by the authors. Licensee MDPI, Basel, Switzerland. This article is an open access article distributed under the terms and conditions of the Creative Commons Attribution (CC BY) license (https://creativecommons.org/licenses/by/4.0/).