Article

A Comparison of Several UAV-Based Multispectral Imageries in Monitoring Rice Paddy (A Case Study in Paddy Fields in Tottori Prefecture, Japan)

Geography Department, University of Indonesia, Depok 16424, Indonesia
*
Author to whom correspondence should be addressed.
ISPRS Int. J. Geo-Inf. 2023, 12(2), 36; https://doi.org/10.3390/ijgi12020036
Submission received: 8 October 2022 / Revised: 6 January 2023 / Accepted: 11 January 2023 / Published: 21 January 2023
(This article belongs to the Special Issue Geomatics in Forestry and Agriculture: New Advances and Perspectives)

Abstract

:
In recent years, unmanned aerial vehicles (UAVs) have been actively applied in the agricultural sector. Several UAVs equipped with multispectral cameras have become available on the consumer market. Multispectral data are informative and practical for evaluating the greenness and growth status of vegetation as well as agricultural crops. The precise monitoring of rice paddy, especially in the Asian region, is crucial for optimizing profitability, sustainability, and protection of agro-ecological services. This paper reports and discusses our findings from experiments conducted to test four different commercially available multispectral cameras (Micesense RedEdge-M, Sentera Single NDVI, Mapir Survey3, and Bizworks Yubaflex), which can be mounted on a UAV in monitoring rice paddy. The survey has conducted in the typical paddy field area located in the alluvial plain in Tottori Prefecture, Japan. Six different vegetation indices (NDVI, BNDVI, GNDVI, VARI, NDRE and MCARI) captured by UAVs were also compared and evaluated monitoring contribution at three different rice cropping phases. The results showed that the spatial distribution of NDVI collected by each camera is almost similar in paddy fields, but the absolute values of NDVI differed significantly from each other. Among them, the Sentera camera showed the most reasonable NDVI values of each growing phase, indicating 0.49 in the early reproductive phase, 0.62 in the late reproductive stage, and 0.38 in the ripening phase. On the other hand, compared to the most commonly used NDVI, VARI which can be calculated from only visible RGB bands, can be used as an easy and effective index for rice paddy monitoring.

1. Introduction

The use of remote sensing in agriculture is expected to enable precise and intelligent agriculture, such as fertilization management based on crop growth [1,2,3,4,5,6,7]. It also offers the possibility to study a crop from an unusual point of view, observing some peculiarities of field coverage hardly visible from the ground [8]. Satellite remote sensing is useful for monitoring the status of the plant community at the time when the data are acquired. The increasing spatial and temporal resolution of globally available satellite images, such as those provided by Sentinel-2, creates new possibilities for generating accurate datasets on various types of crop [9]. However, the observation timing depends on the satellite’s return days and cloud cover condition with satellite remote sensing. Especially in monsoon Asia, where it is a humid area and rice paddy rice cultivation is widely distributed, the cloud cover is a constraint of the satellite remote sensing by the optical sensor. On the other hand, the unmanned aerial vehicle (UAV) can freely observe the paddy fields according to the rice paddy growing stage and acquire sufficient spatial resolution data. Nowadays, some of UAVs are able to collect multispectral imagery at cm-level resolution and offer great possibilities in the precision agriculture. UAVs allow us to perform many interesting and quantitative observations at better spatial and temporal resolution and lower costs. Moreover, a field can be frequently surveyed to study ongoing phenomena and different phonological developments. All information produced from UAV surveys helps farmers in decision-making processes, improving agricultural production and optimizing the resource utilization [10]. Therefore, it would be an excellent tool to effectively monitor physiological and ecological information about various agricultural crops.
Precision agriculture is becoming a new keyword of modern agriculture, which can take advantage of current data and machinery to make farming as precise, efficient, and productive as possible. Under this circumstance, a multispectral camera mounted on UAV has become available at a relatively low price. An excellent tool for monitoring the growth of plants and crops is being prepared. The precise monitoring method of paddy fields is highly expected for optimizing profitability, sustainability, and protection of agro-ecological services [7,8,9,10]. So, the target of this study is to clarify the relationship between the multispectral information taken by UAVs and the physiological and ecological information of rice paddy. We also comprehensively compare the performance of four types of multispectral or near infrared cameras mounted on UAVs. We believe that the results of these comparative studies of relatively easy-to-available cameras will provide meaningful information to potential UAV users in the future and contribute to the implementation of efficient and practical smart agriculture. The specific objectives and elements of verification are the following.
(1)
Confirmation of the relationship between the growth parameters of rice paddy and the vegetation index: Temporal observations using UAV-based multispectral cameras are conducted on a rice paddy, and then clarify the relationship between the observed data, physiological and ecological information.
(2)
Recommendation of monitoring the growth process of rice paddy: By identifying the optimum index for monitoring the growth process of paddy rice, we propose a reasonable method for rice paddy growth monitoring.

2. Materials and Methods
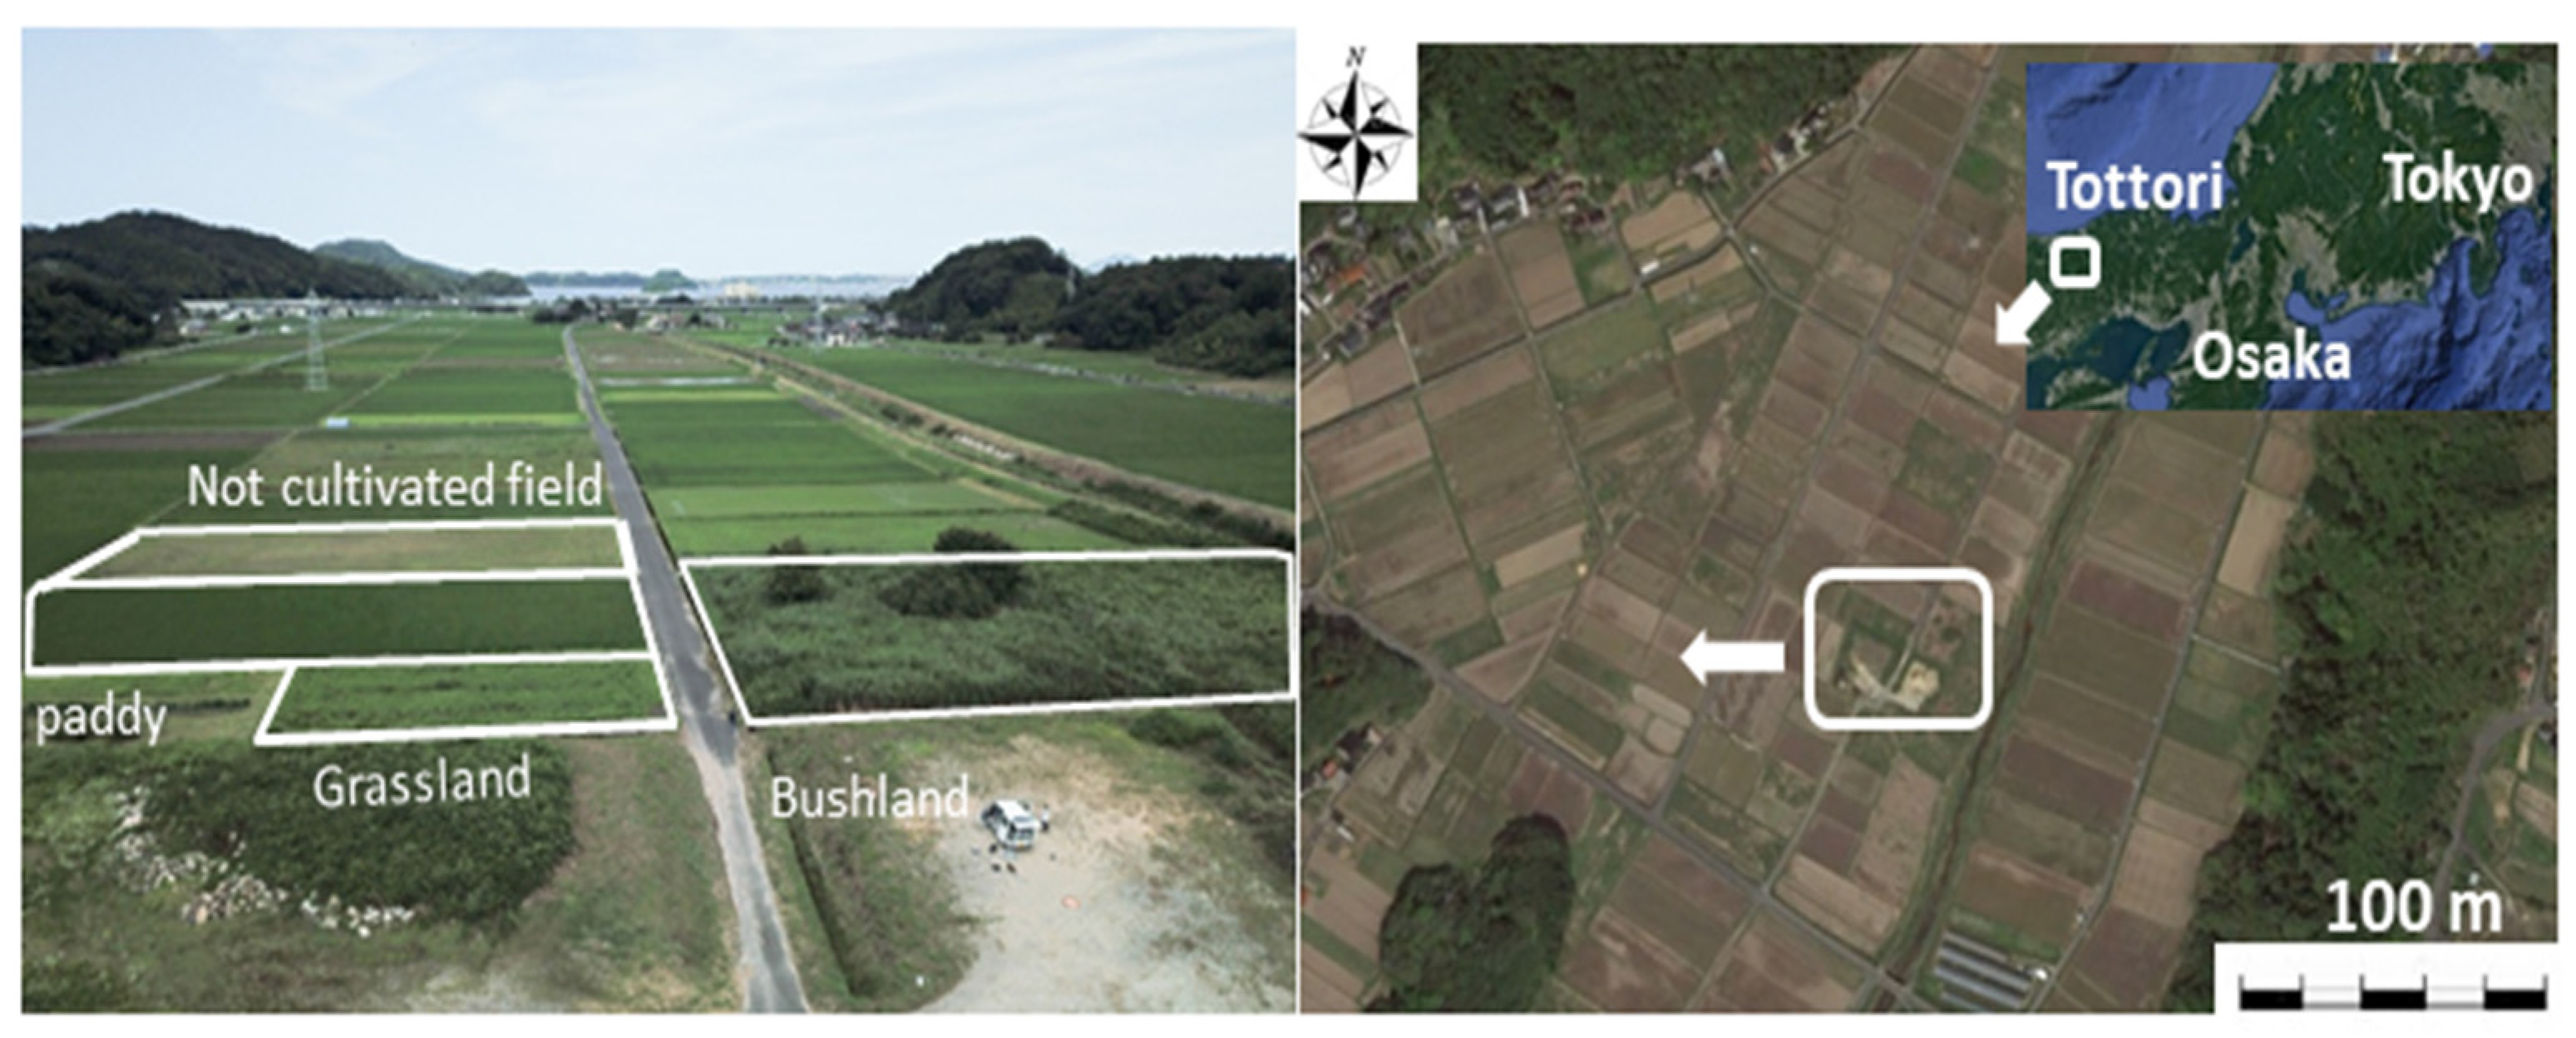
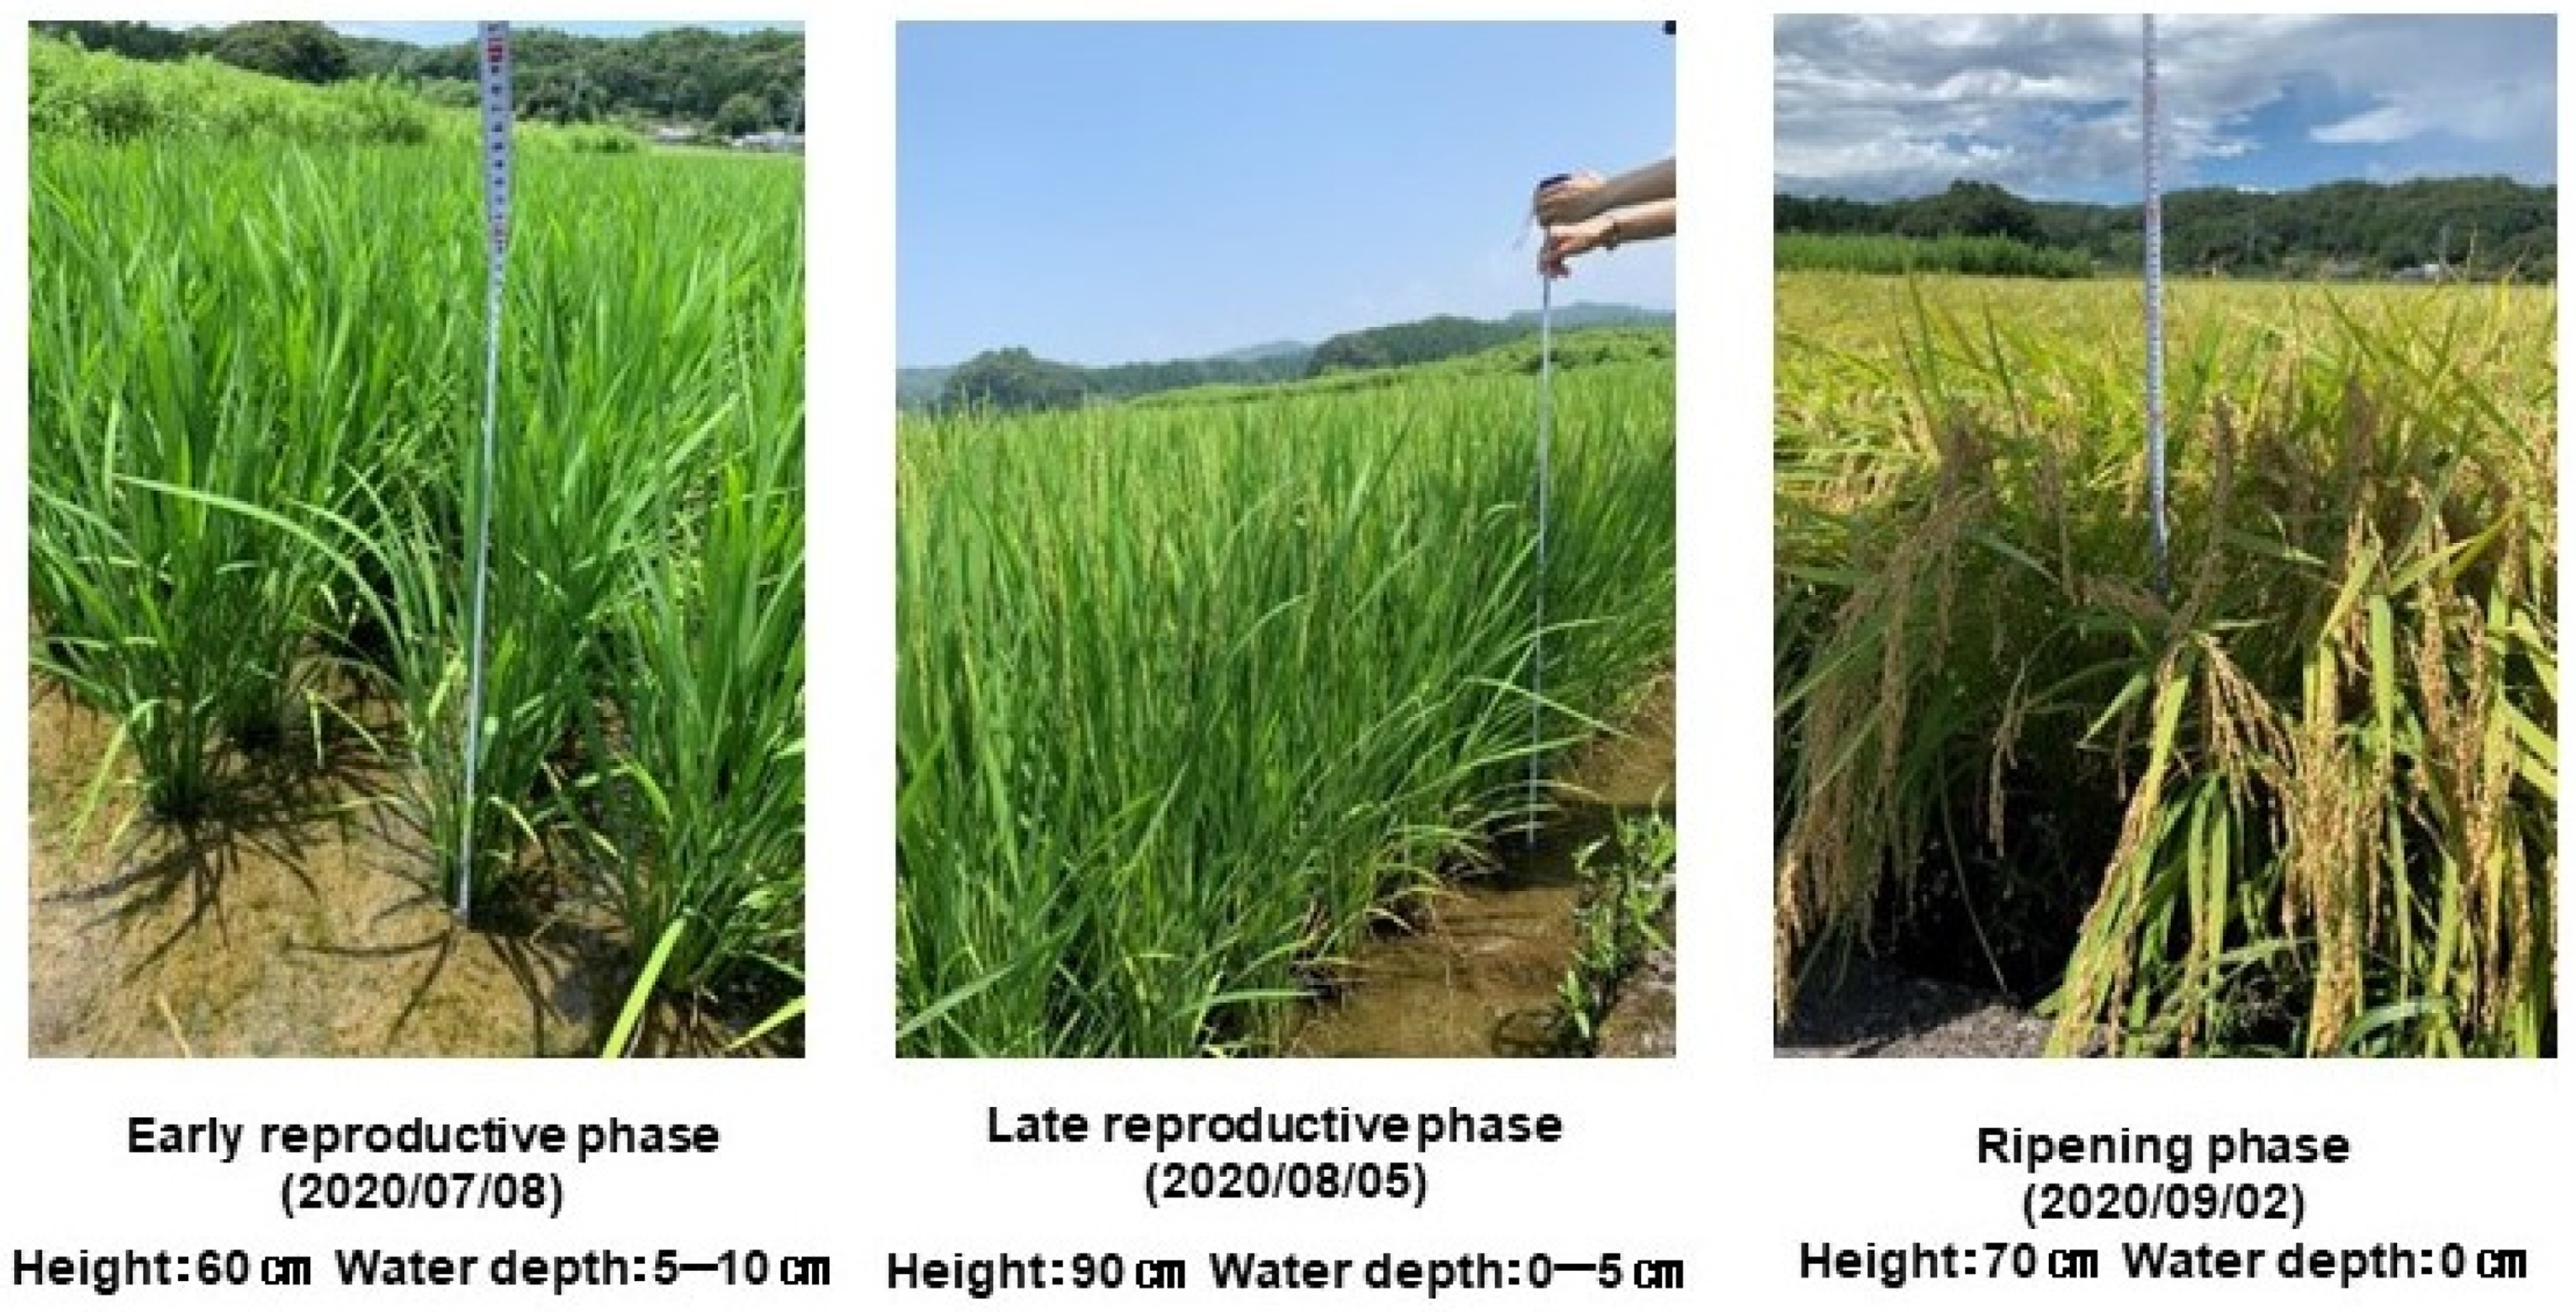
2.1. Study Site

The target site of this study is a paddy field in the low flat alluvial plain located in Tottori City, Tottori Prefecture (135°29′13″ E, 35°07′24″ N, altitude: 6 m). Although the average annual temperature in this area is 15.2 degrees Celsius, the average temperature in early June, the season of transplanting rice paddy, is 23.5 degrees Celsius. Then the rice paddy’s heading stage reaches 27.5 degrees Celsius in early August. The annual rainfall is 1930 mm, but the rainy season begins immediately after planting from early June to late July. The average monthly rainfall from July to July is about 290 mm. Rice paddy cultivation in this area is a single crop in which rice is planted in late May and harvested in late September. In recent years, much abandoned cultivated land has appeared in agricultural areas in Japan, where broad and homogeneous paddy fields are disappearing, and this target area is no exception. As shown in Figure 1, the surrounding grass and bush are abandoned paddy fields. In the present study, we focus on performing an intensive analysis on a single paddy farm (parcel) because paddy cultivation is carried out in extremely intensive land use, and the growth conditions and varieties of rice often differ from field to field. The farming style is also small-scale management, and we believe that it is important to accumulate data in units of one field (parcel) and standardize methods for crop growth monitoring, which is expected in smart agriculture for paddy cultivation in Asian regions. In addition, by widening the target range, we are afraid that other land cover and farming styles will be mixed, which will affect the acquisition of pure pixel values.

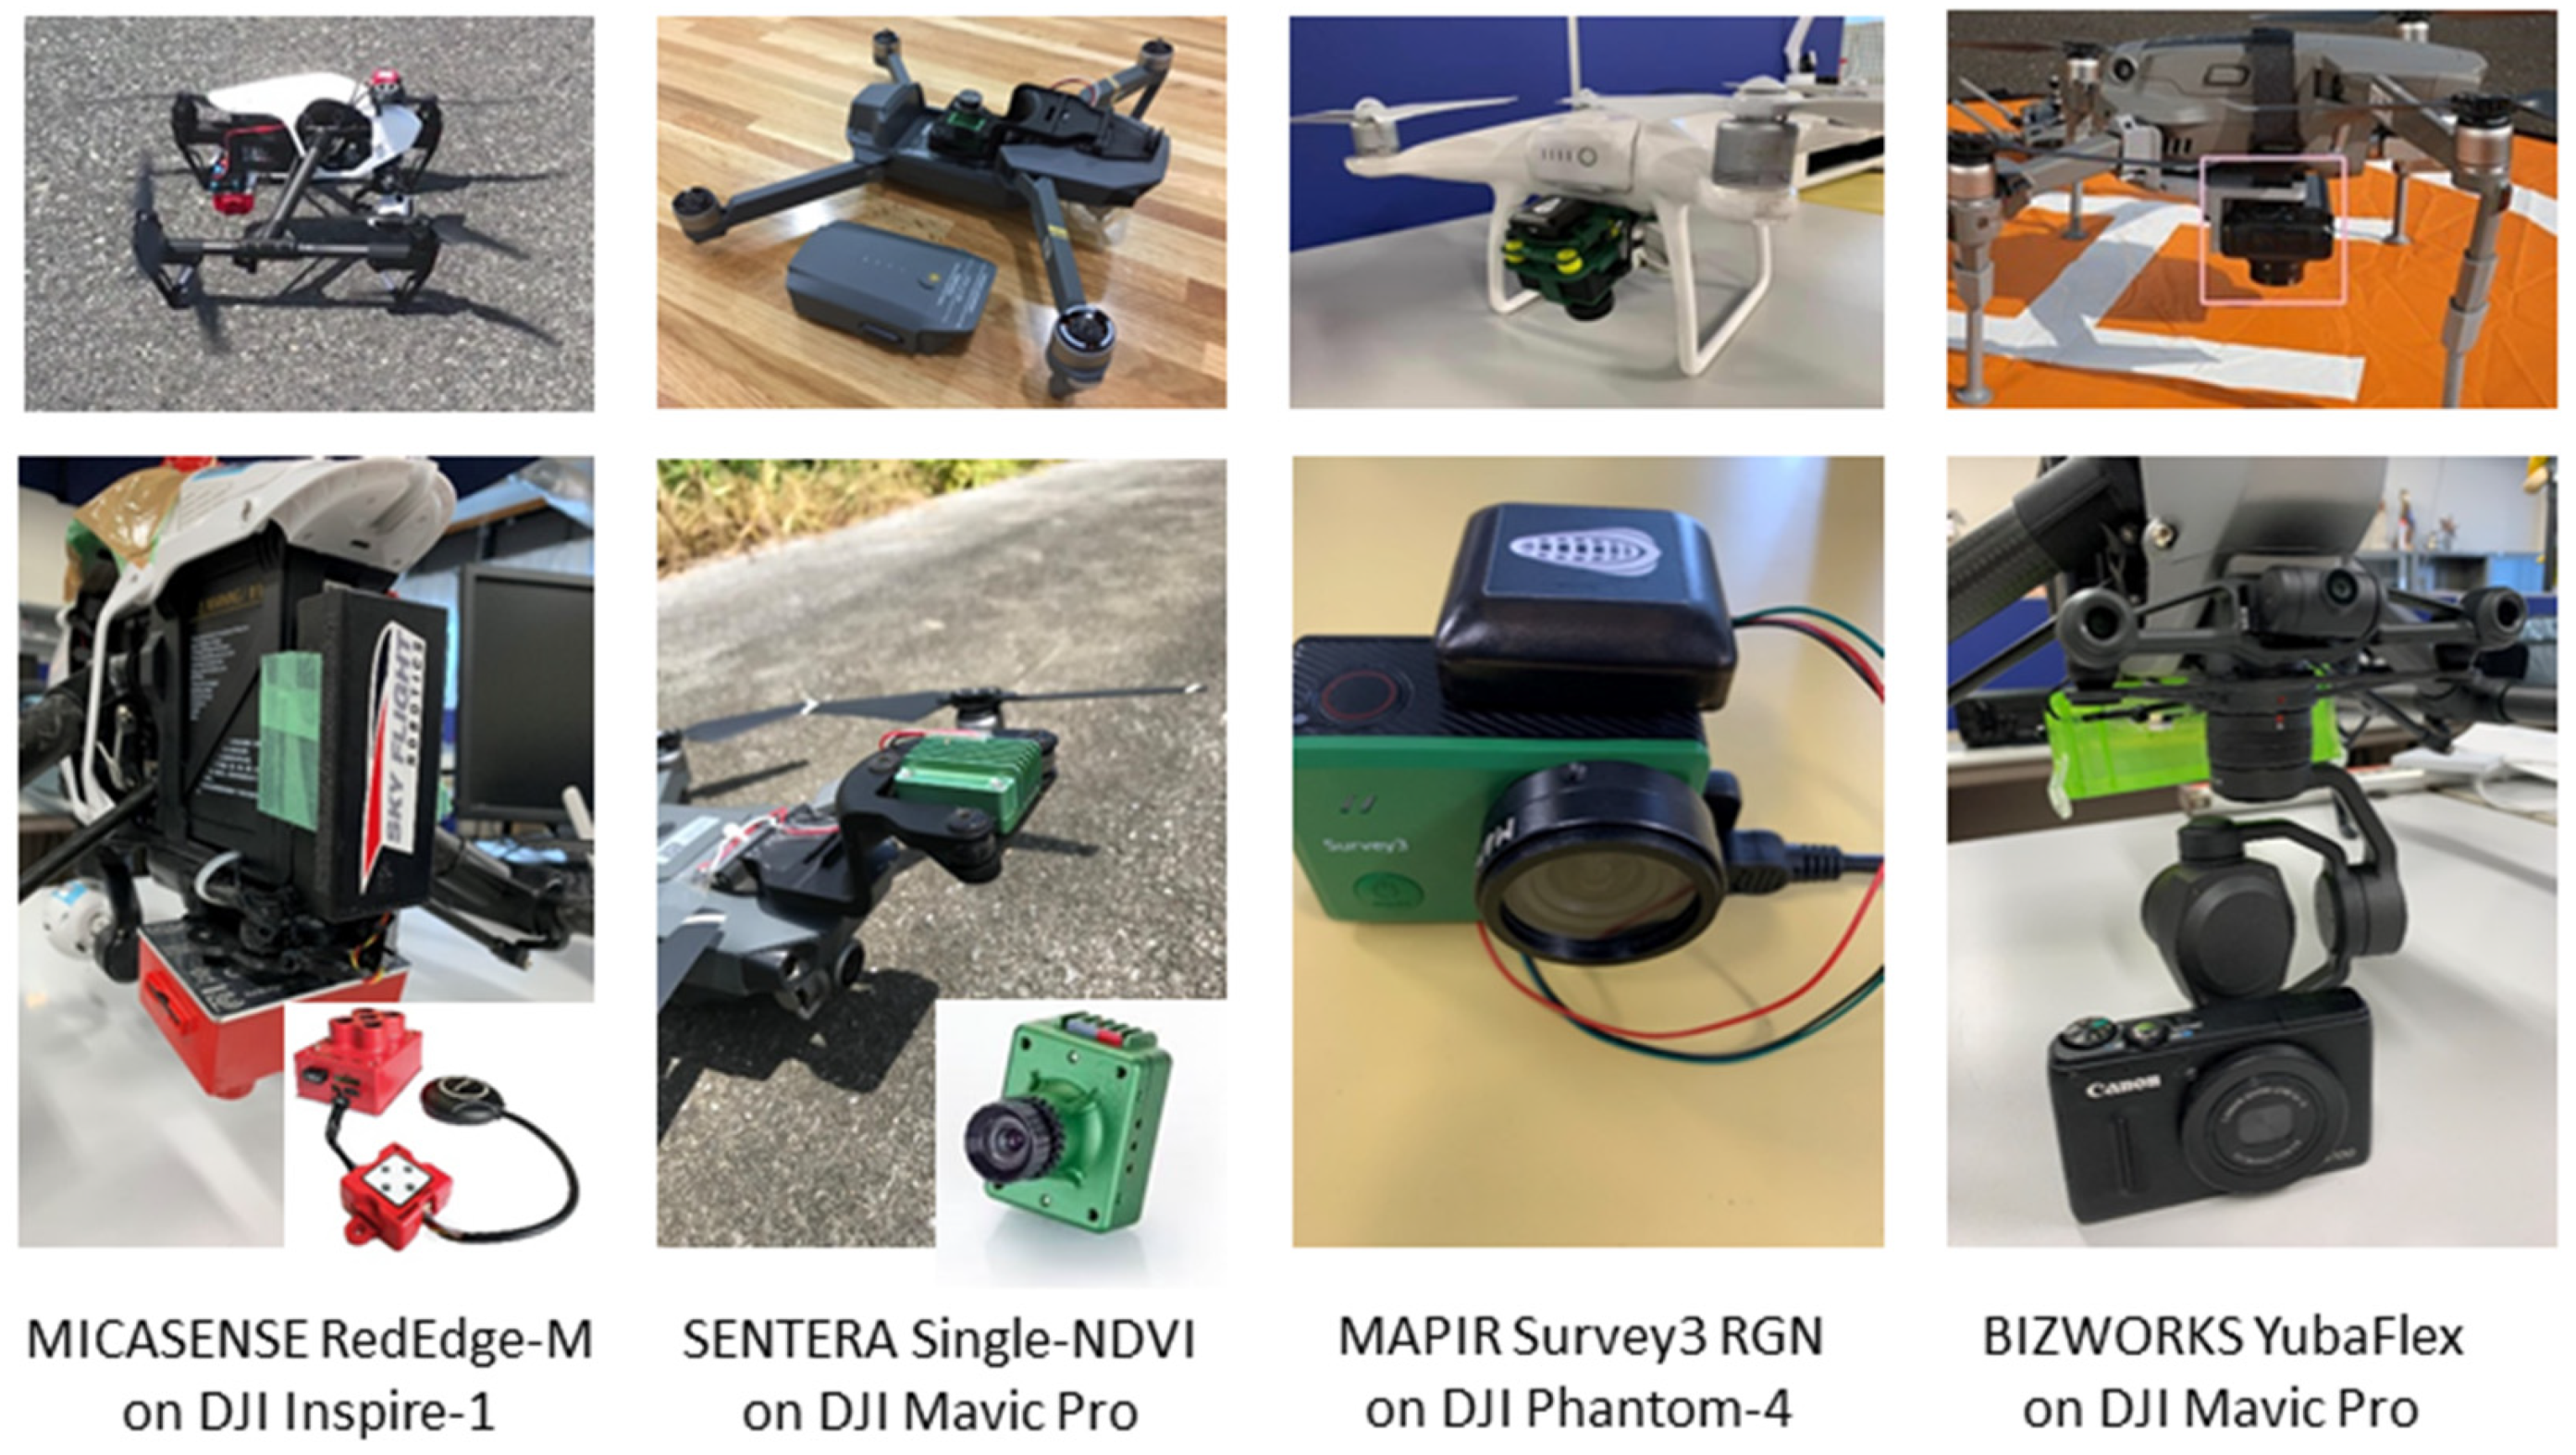
2.2. Multispectral UAV Images Acquisition

The growing process of typical rice paddy is generally divided into three phases: vegetative, reproductive, and ripening. Based on previous comprehensive study-reviews, it has become clear that the specific temporal dynamics of vegetation greenness shows the maximum value at the heading stage at the end of the reproductive phase of rice paddy [11,12,13,14]. Therefore, observing the growth time around this heading stage for rice paddy growth monitoring and yield prediction is essential. In this study, UAV surveys were conducted three times good enough to match each growth stage of rice paddy condition (Figure 2). The temporal images were taken on 8 July, 5 August, and 2 September. Each corresponds to the late vegetative phase/early reproductive phase, late reproductive phase, and ripening phase. All images for each phase were taken around 10:00–11:00 am to ensure sufficient solar altitude. The weather at the time of observation was sunny all three times. We consider that the flight altitude varies depending on the regional locality, weather condition, and target (object) to be analyzed. In this research, the optimum altitude was examined by trial and error by changing the flight altitude to 30 m, 50, and 100 m. As a result, at low altitudes, the ears of rice were largely affected by the wind, and the shadows appeared large, making it unsuitable for analysis. Because of this, the final flight altitude was set to 100 m with an overlap of 80% in our study.
The aerial surveys were carried out using four different cameras mounted on 3 different UAVs, as shown in Figure 3. Those are readily available in the Asian consumer market. Among them, MICASENSE RedEdge-M (hereinafter called Micasense) is the only multispectral camera that has five discrete spectral bands: Blue (475 nm), Green (8560 nm), Red (668 nm), Near IR (840 nm), and Red Edge (717 nm) equipped with the downwelling light sensor (DLS) capable of correcting light changes during a flight. The other three cameras, SENTERA Single NDVI sensor (hereinafter called as Sentera), MAPIR Survey3 (hereinafter called as Survey3), and BIZWORKS Yubaflex (hereinafter called as Yubaflex), use near-infrared filters. The device, referred to as NDVI sensors, is measuring visible red and NIR light to derive the NDVI value. Of these, it has been reported that the red band of Yubaflex is somewhat sensitive to near-infrared, and the difference in radiance between red and near-infrared is slight, so the NDVI value becomes small [15,16].

2.3. Image Processing and Index Analysis

Ortho images were created using Pix4Dmapper. Because of comparing the images taken from different UAV platforms, each ortho image needed to be geometrically rectified. The verification points were measured so as to surround the target paddy field on the ortho image, compared with the coordinates of 20 ground control points measured by the RTK method, and the residual error at the verification points was calculated. As the rectified ortho images of the four types of camera have a horizontal accuracy of 3 to 5 cm and a height accuracy of 5 to 10 cm, these values were assessed as having sufficient position accuracy in this study, and for the comparison of vegetation index acquired by different cameras, a size 1 m fishnet was used on over the paddy field, then the average values were calculated for the following analysis.
The vegetation index can be calculated by multispectral data operation and set into a single value on an image. Diversity of vegetation indices offers a lot of redundancy in UAV-based analysis of vegetation/greenness activity [17,18,19]. Table 1 shows the list of vegetation indices that can be generated from a UAV-based multispectral camera using the index calculator of Pix4Dmapper. In this study, normalized difference vegetation index (NDVI), the most widely used and best-known vegetation index, was primarily used as a standard indicator for comparing the multispectral image taken by four different types of cameras in terms of growing process of rice paddy. The comparison was made by examining the spatial distribution of the mapped NDVI values by visual interpretation and also examining the averaged statistical values (mean value, standard deviation, and range) for each 1 m fishnet in each growth stage of rice paddy.

3. Results

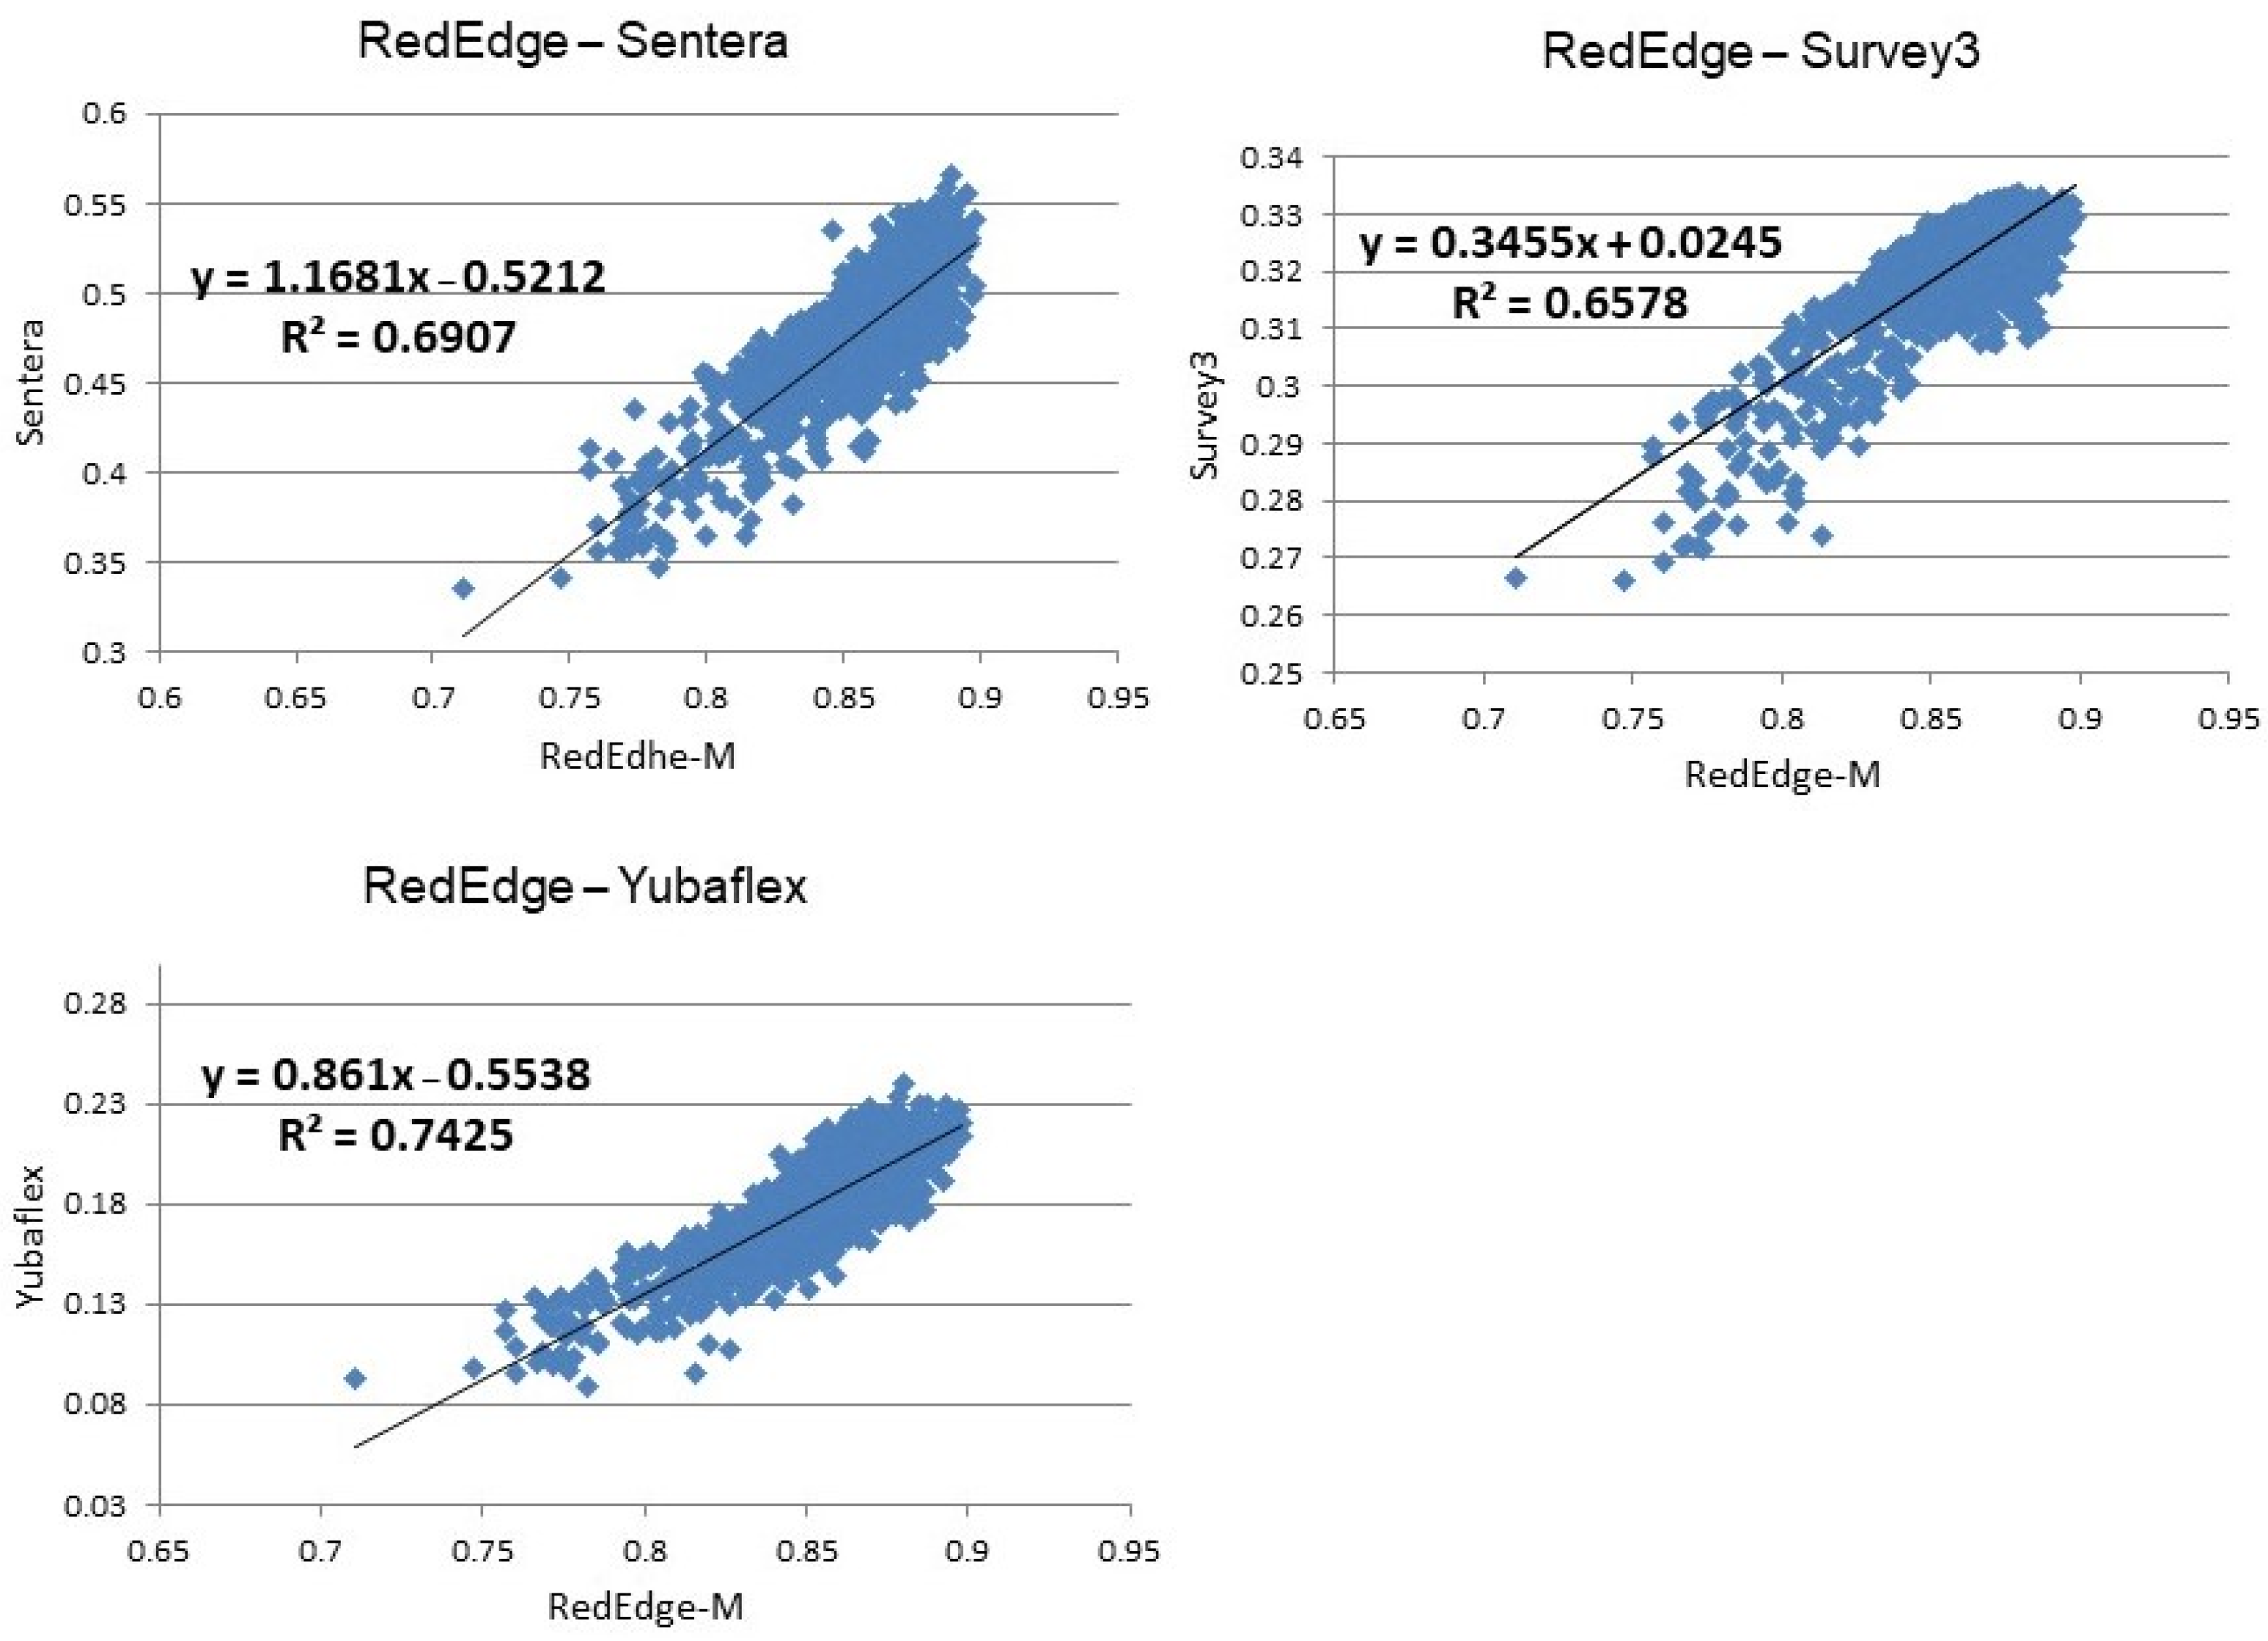
3.1. Comparison of Multispectral Cameras

Figure 4 shows the NDVI maps on 5 August, which is in the heading stage when the greenness activity of rice paddy is highest and compares the results of four different cameras. The highest NDVI value measured is 0.89 for Micasense, 0.59 for Sentera, 0.35 for Survey3, and 0.29 for Yubaflex. The latter two models of cameras show low NDVI values. Regarding this matter, the manufacturers have explained that the difference in radiance between visible red and near-infrared is small, so the NDVI value tends to be low. Although there are differences in absolute values of NDVI as shown above, some correlation has been observed between the values of each camera. Figure 5 illustrates the correlation of the NDVI values obtained by the Micasense camera with the other three cameras. Micasense was considered a reference because it is the only camera with a multispectral lens, which has a downwelling light sensor (DLS) on board and acquires images with radiometric correction. Therefore, the correlations were fairly good, and the determination coefficient (R2) ranged from 0.65 to 0.74.
Next, we examined the temporal changes in NDVI acquired by each camera as shown in Figure 6. The trend of rice field NDVI increases during the reproductive phase and indicates its maximum value at the time of heading stage, and then it falls slowly during the ripening phase. The changes of NDVI from the reproductive stage to the ripening stage showed a very similar trend in Micasense, Sentera, and Yubaflex. Still, in Survey3, the difference between the maximum and the minimum value is very small, and the growing phase of rice paddy is relatively difficult to track. The most extensive NDVI values between the three periods were identified on Sentera images, indicating 0.49 in the early reproductive phase, 0.62 in the late reproductive stage, and 0.38 in the ripening step.

3.2. Comparison of Various Vegetation Indices

Figure 7 illustrates six different VIs maps at the late reproductive phase (heading stage) of rice paddy, and each VI is shown as an average value on the 1 m size fishnet. Table 2 also shows the correlation coefficient of VIs for each of the three phases of rice paddy. In this study, a comparison was carried out based on images taken by the Micasense, which only can acquire five-band multispectral data. Comparing the other five VIs with NDVI as standard, GNDVI and BNDVI are very similar to NDVI.
As shown on Table 2, The correlation coefficient is 0.92 or more in the reproductive phase and 0.72 or more even in the ripening stage, where the correlation between VIs is not clear. GNDVI and BNDVI measure visible green and blue spectral instead of the visible red spectrum. The former is helpful for measuring rates of photosynthesis and assessing the moisture content and nitrogen concentration in plant leaves. The latter is effective for areas sensitive to chlorophyll content [20,21,22]. The regression model for the NDRE and MCRI were not significant and therefore left out of the discussion in this study.
On the other hand, we focused on this study’s visual atmospheric resistance index (VARI). The VARI is designed to emphasize vegetation in the spectrum’s visible portion (RGB) while mitigating illumination differences and atmospheric effects [20,21,22,23]. Although this VI does not use NIR information, a clear correlation is observed with NDVI. Its correlation coefficient is 0.894 for the early reproductive phase, 0.713 for the late reproductive stage, and 0.605 for the ripening phase of rice paddy (Figure 8). Furthermore, the temporal changes of VARI are very similar to NDVI, and it can be said to accurately capture the phenological shift in rice paddy (Figure 9).

4. Discussion

The primary aim of this study to discuss a comparison between images derived from four different multispectral cameras. The comparison was based on the NDVI values and the effects they may have on phenology according to the growth stages [10]. Then, based on the images acquired by Micasense, we calculated five different VIs in addition to NDVI and examined the appropriate VI for the phenology analysis of rice paddy.
Regarding the comparison of multispectral cameras, it was possible to grasp the phenology changes by NDVI analysis using any commercially available multispectral cameras and confirmed that the absolute value of NDVI differs greatly depending on the specifications of each camera [13]. As shown on Figure 4, the spatial pattern of each NDVI inside the paddy field seems to be distributed with a similar trend, but the NDVI values derived from each camera image are significantly different. This is because a specification of the sensor’s definition for visible R and near-infrared may differ in terms of the bandwidth used to calculate the NDVI. The difference in the spectral bandwidth of each camera significantly influences the importance of NDVI. Still, some cameras did not clarify detailed bandwidth information, especially those using the NIR filter. Because of this, by comparing the NDVI values obtained with the existing satellite sensor, we examined the NDVI values acquired by each camera and their temporal changes. The NDVI observed by Micasense showed an extremely high value of around 0.9 in the paddy field at the heading stage and for rice paddy at the heading stage and a high value of about 0.8 even at the ripening phase, that is, the range of NDVI fluctuation was relatively small. According to the camera specifications published by the manufacturer (Table 3), the red band of Micasense is in a somewhat more extended wavelength range than that of Sentera, and its bandwidth is narrow. Since the NIR band wavelength is almost the same for both cameras, it is highly possible that the difference in visible red reflectance has an effect on the NDVI value.
To compare the different VIs in terms of rice production monitoring, the data used were taken by Micasense, and Pix4Dmapper processed the images. Because, in Micasense with a narrow multispectral bandwidth for each of the five bands, the data are highly sensitive and convenient for comparing Vis [22]. In addition, the radiometric collection essential for analyzing temporary changes can be easily performed using the calibration model of Pix4D mapper [22]. In this study, we want to focus on the efficacy of VARI as one of the RGB-based vegetation index to derive the growing phase from rice cultivation. The spatial distribution pattern of VARI values in paddy fields is very similar to NDVI, and it is highly correlated at each growth stage. VARI is used initially to estimate the fraction of vegetation with minimal sensitivity to atmospheric effects [23,24]. The addition of blue-band data in the equation is to minimize atmospheric effects [25]. It can detect changes due to biomass accumulation and is sensitive to the amount of chlorophyll in the leaves. Significantly, RGB-based VARI may be used for growth monitoring in paddy rice as well as NDVI.

5. Conclusions

The overall results showed that the spatial distribution of NDVI collected by each camera is almost similar in paddy fields, but the absolute values of NDVI differ significantly from each other. Among them, the Sentera camera showed the most reasonable NDVI values and temporal change patterns during each rice growing stage. On the other hand, compared to the most commonly used NDVI, VARI which can be calculated from only visible RGB bands, can be used as an easy and effective index for rice paddy monitoring. In this study, the availability of time-series data acquired by consumer level UAVs was demonstrated, and further dissemination at the practical level of agriculture is expected in the future. Rice is the most important agricultural crop in the monsoon Asia region, and also securing a stable supply of rice has great implications for global food security. Monitoring of rice cultivation in the paddy area shown in this research is one of the important issues of smart agriculture in Asia, and we believe that accumulation of similar data in other Asian regions is urgently needed.

Author Contributions

Ryota Nagasawa doing Research and design the manuscript; Muhammad Dimyati wrote publications; Supriatna Supriatna took care of the publication and became the Corresponding Author; Rizki Pramayuda helped in compiling and editing this paper; Fajar Dwi Pamungkas and Rizki Pramayuda doing the administration process. All authors have read and agreed to the published version of the manuscript.

Funding

This study was funded by the Directorate of Research and Development, the University of Indonesia, under Hibah PUTI 2022 (Grant No. NKB-662/UN2.RST/HKP.05.00/2022).

Institutional Review Board Statement

Not Applicable.

Informed Consent Statement

Not Applicable.

Data Availability Statement

Related data are available upon reasonable request.

Acknowledgments

Thank you to the former Prof Nagasawa’ Laboratory of Tottori University for providing support for the completion of this study.

Conflicts of Interest

The authors declare no conflict of interest.

References

  1. Weiss, M.; Jacob, F.; Duveiller, G. Remote sensing for agricultural applications: A meta-review. Remote Sens. Environ. 2020, 236, 111402. [Google Scholar] [CrossRef]
  2. Sishodia, R.P.; Ray, R.L.; Singh, S.K. Applications of Remote Sensing in Precision Agriculture: A Review. Remote Sens. 2020, 12, 3136. [Google Scholar] [CrossRef]
  3. Zhang, C.; Kovacs, J.M. The application of small unmanned aerial systems for precision agriculture: A review. Precis. Agric. 2012, 13, 693–712. [Google Scholar] [CrossRef]
  4. Singh, K.; Frazier, A.E. A meta-analysis and review of unmanned aircraft system (UAS) imagery for terrestrial applications. Int. J. Remote Sens. 2019, 39, 5078–5098. [Google Scholar] [CrossRef]
  5. Maes, W.H.; Steppe, K. Perspectives for Remote Sensing with Unmanned Aerial Vehicles in Precision Agriculture. Trends Plant Sci. 2019, 24, 152–164. [Google Scholar] [CrossRef] [PubMed]
  6. Hama, A.; Tanaka, K.; Chen, B.; Kondou, A. Examination of appropriate observation time and correction of vegetation index for drone-based crop monitoring. J. Agric. Meteorol. 2021, 7, 200–209. [Google Scholar] [CrossRef]
  7. Shi, Y.; Thomasson, J.A.; Murray, S.C.; Pugh, N.A.; Rooney, W.L.; Shafian, S.; Rajan, N.; Rouze, G.; Morgan, C.L.S.; Neely, H.L.; et al. Unmanned aerial vehicles for high-throughput phenotyping and agronomic research. PLoS ONE 2016, 11, e0159781. [Google Scholar] [CrossRef] [Green Version]
  8. Radoglou-Grammatikis, P.; Sarigiannidis, P.; Lagkas, T.; Moscholios, I. A compilation of UAV applications for precision agriculture. Comput. Netw. 2020, 172, 107148. [Google Scholar] [CrossRef]
  9. Belgiua, M.; Csillikb, O. Sentinel-2 cropland mapping using pixel-based and object-based time-weighted dynamic time warping analysis. Remote Sens. Environ. 2018, 204, 509–523. [Google Scholar] [CrossRef]
  10. Candiago, S.; Remondino, F.; De Giglio, M.; Dubbini, M.; Gattelli, M. Evaluating Multispectral Images and Vegetation Indices for Precision Farming Applications from UAV Images. Remote Sens. 2015, 7, 4026–4047. [Google Scholar] [CrossRef]
  11. Perros, N.; Kalivas, D.; Giovos, R. Spatial Analysis of Agronomic Data and UAV Imagery for Rice Yield Estimation. Agriculture 2021, 11, 809. [Google Scholar] [CrossRef]
  12. Mosleh, M.; Hassan, Q.; Chowdhury, E. Application of Remote Sensors in Mapping Rice Area and Forecasting Its Production: A Review. Sensors 2015, 15, 769–791. [Google Scholar] [CrossRef] [Green Version]
  13. Kuenzera, C.; Knauerb, K. Remote sensing of rice crop areas. Int. J. Remote Sens. 2013, 34, 2101–2139. [Google Scholar] [CrossRef]
  14. Mostofialmamaleki, M.; Shafri, H.; Mansor, S.; Azarkerdar, A. A review: Monitoring of rice production by using applications of remote sensing. IOP Conf. Ser. Earth Environ. Sci. 2019, 357, 012037. [Google Scholar] [CrossRef] [Green Version]
  15. Tokunaga, K.; Moriyama, M. Radiometric calibration method of the general purpose digital camera and its application for the vegetation monitoring. SPIE Asia-Pasific Remote Sens. 2012, 8524, 85241Y1–85241Y10. [Google Scholar]
  16. Hama, A.; Tanaka, K.; Den, H.; Kondoh, K. Comparison and consideration of near-infrared cameras for drones: RedEdge and Yubaflex. J. Remote Sens. Soc. Jpn. 2018, 38, 451. [Google Scholar]
  17. Wan, L.; Li, Y.; Cen, H.; Zhu, J.; Yin, W.; Wu, W.; Zhu, H.; Sun, D.; Zhou, W.; He, Y. Combining UAV-Based Vegetation Indices and Image Classification to Estimate Flower Number in Oilseed Rape. Remote Sens. 2018, 10, 1484. [Google Scholar] [CrossRef] [Green Version]
  18. Messina, G.; Peña, J.; Vizzari, M.; Modica, G. A Comparison of UAV and Satellites Multispectral Imagery in Monitoring Onion Crop. An Application in the ‘Cipolla Rossa di Tropea’ (Italy). Remote. Sens. 2020, 12, 3424. [Google Scholar] [CrossRef]
  19. Kusnandar, T.; Surendro, K. Camera-Based Vegetation Index from Unmanned Aerial Vehicles. In Proceedings of the 6th International Conference on Sustainable Information Engineering and Technology, Malang, Indonesia, 13–14 September 2021; pp. 173–178. [Google Scholar]
  20. Fu, W.; Jing, H.; Yan-lin, T.; Xiu, W. New Vegetation Index and Its Application in Estimating Leaf Area Index of Rice. Rice Sci. 2007, 14, 195–203. [Google Scholar]
  21. Qiu, C.; Liao, G.; Tang, H.; Liu, F.; Liao, X.; Zhang, R.; Zhao, Z. Derivative Parameters of Hyperspectral NDVI and Its Application in the Inversion of Rapeseed Leaf Area Index. Appl. Sci. 2018, 8, 1300. [Google Scholar] [CrossRef] [Green Version]
  22. Pix4D, Vegetation Indices: A Key Tool in Precision Agriculture. Pix4D News. 2018. Available online: https://www.pix4d.com/blog/pix4dfields-vegetation-indices-for-precision-agriculture (accessed on 14 June 2020).
  23. McKinnon, T.; Hoff, P. Comparing RGB-Based Vegetation Indices with NDVI For Drone Based Agricultural Sensing. AGBX021, 17. 2017. Available online: Agribotix.com (accessed on 14 June 2020).
  24. Lussem, U.; Bolten, A.; Gnyp, M.L.; Jasper, J.; Bareth, G. Evaluation of RGB-Based Vegetation Indices from UAV Imagery to Estimate Forage Yield in Grassland. In Proceedings of the International Archives of the Photogrammetry, Remote Sensing and Spatial Information Sciences 2018, Beijing, China, 7–10 May 2018; pp. 1215–1219. [Google Scholar] [CrossRef] [Green Version]
  25. Eng, L.; Ismail, R.; Hashim, W.; Baharum, A. The Use of VARI, GLI, and VIgreen Formulas in Detecting Vegetation in Aerial Images. Int. J. Technol. 2019, 10, 1385–1394. [Google Scholar] [CrossRef]
Figure 1. Study Site.
Ijgi 12 00036 g001
Figure 2. Rice paddy growth phase.
Ijgi 12 00036 g002
Figure 3. Multispectral cameras used for this analysis.
Ijgi 12 00036 g003
Figure 4. NDVI 1 m fishnet map by four different cameras (5 August 2020, late reproductive phase).
Ijgi 12 00036 g004
Figure 5. Correlation of NDVI values of paddy field for each camera (5 August 2020 late reproductive phase <heading stage>).
Ijgi 12 00036 g005
Figure 6. NDVI temporal changes of paddy field by four different cameras.
Ijgi 12 00036 g006
Figure 7. Comparison of six different index images of paddy field (5 August 2020, heading stage).
Ijgi 12 00036 g007
Figure 8. Correlation of temporal NDVI-VARI value of paddy field. (Micasense images).
Ijgi 12 00036 g008
Figure 9. Temporal changes of each index value of rice paddy. (Micasense images).
Ijgi 12 00036 g009
Table 1. Vegetation Indices calculated from UAV-based Multispectral camera referred from Pix4D Documentation (2020).
INDEXDESCRIPTIONFORMULA
BNDVI—Blue Normalized Difference Vegetation IndexNDVI index without red channel availability, for areas sensitive to chlorophyll content.(NIR − BLUE)/(NIR + BLUE)
GNDVI—Green Normalized Difference Vegetation indexNDVI index without red channel availability, for areas sensitive to chlorophyll content.(NIR − GREEN)/(NIR + GREEN)
MCARI—Modified Chlorophyll Absorption in Reflective Index Index used to measure chlorophyll concentration including variations in the Leaf Area Index.1.2 * (2.5 * (NIR − RED) − 1.3 * (NIR − GREEN)/(normalized to the maximum value of RED, GREEN and NIR bands).
NDRE—Normalized Difference Vegetation IndexIndex sensitive to chlorophyll content in leaves against soil background effect. This index can only be formulated when the red edge band is available.(NIR − REDEDGE)/(NIR + REDEDGE)
NDVI—Normalized Different Vegetation IndexGeneric index used for leaf coverage and plant health.(NIR − RED)/(NIR + RED)
VARI—Visible Atmospherically Resistant IndexRGB index for leaf coverage.(GREEN − RED)/(GREEN + RED − BLUE)
Table 2. Correlation matrix of six vegetation indices of paddy field in 8 July 2020 (early reproductive phase) (a), 5 August 2020 (late reproductive stage) (b), and 2 September 2020 (ripening phase) (c).
NDVIBNDVIGNDVIVARINDREMCARI
NDVI10.980.930.950.880.8
BNDVI0.9810.950.890.910.78
GNDVI0.930.9510.750.960.66
VARI0.950.890.7810.720.86
NDRE0.880.910.980.7210.62
MCARI0.80.780.660.890.621
(a)
NDVIBNDVIGNDVIVARINDREMCARI
NDVI10.990.920.930.730.57
BNDVI0.9910.910.900.690.58
GNDVI0.920.9110.780.910.32
VARI0.930.900.7810.590.69
NDRE0.730.690.910.5910.02
MCARI0.570.580.320.690.021
(b)
NDVIBNDVIGNDVIVARINDREMCARI
NDVI10.890.720.780.730.5
BNDVI0.8410.890.380.770.24
GNDVI0.720.8710.130.910.01
VARI0.780.380.1310.240.69
NDRE0.730.770.910.2410.01
MCARI0.50.240.010.690.011
(c)
Table 3. Spectral wavelength band specification of each camera.
Spectral BandMicasenseSenteraSurvey 3Yubaflex
Blue475 nm
Band width: 20 nm
---
Green560 nm
Band width: 20 nm
-550 nm520~600 nm
Red668 nm
Band width: 10 nm
625 nm
Band width: 100 nm
660 nm600~780 nm
Red Edge717 nm
Band width: 10 nm
---
Near Infra-red840 nm
Band width: 40 nm
850 nm
Band width: 40 nm
850 nm780~1000 nm
Disclaimer/Publisher’s Note: The statements, opinions and data contained in all publications are solely those of the individual author(s) and contributor(s) and not of MDPI and/or the editor(s). MDPI and/or the editor(s) disclaim responsibility for any injury to people or property resulting from any ideas, methods, instructions or products referred to in the content.

