Abstract
The Jakarta metropolitan region (the Jakarta megacity), located in the fourth most populous country in the world (Indonesia), is the largest urban agglomeration in the Global South—continues to grow, especially in its outer suburbs (Bekasi Regency). The governments (Central and Local) tend to implement an urban-biased policy (UBP) to connect Bekasi Regency into global production networks and boost Bekasi Regency’s income. However, previous case studies of China and Vietnam have revealed that the UBP increases economic disparities between urban and rural areas. Therefore, this study probes urban–rural economic disparities and their characteristics at a microregional level (desa/kelurahan) in the Bekasi Regency. The methods applied in this study are geographically weighted regression (GWR), RULT index, and quantitative zoning. The results show that almost all desa/kelurahan in the high poverty (HPv) cluster are rural neighborhoods (desa/kelurahan with rural characteristics). By contrast, only 5% of desa/kelurahan with urban characteristics are HPvs, while the remainder are in the low poverty (LPv) cluster. Rural neighborhoods with HPv tend to have a high percentage of households dependent on agriculture. Thus, empirical results (with a case of a Global South megacity suburb) further support previous evidence that the UBP has caused urban–rural economic disparities.
1. Introduction
Over the past few decades, many cities in the Global South, especially in East Asia (excluding Japan and South Korea) and Southeast Asia, have experienced immense growth in their populations and the extent of urban land; thus, new megacities (with populations exceeding 10 million) have been born [1,2,3,4,5]. Southeast and East Asia were home to 7 out of the 27 megacities in the world as of 2010 [6], while no megacities existed in these two macroregions in 1980 [2]. The number of megacities in the two macroregions is predicted to reach 11 by 2030, while in Japan (Global North), the number of megacities has remained constant for the past 60 years at 2 (Tokyo and Osaka) [2]. Industrialization and urban settlements development in suburban areas, rapid urban expansion, the transformation of rural areas into urban areas, agricultural land conversion, and intensive land-use changes in suburban areas are the main characteristics of most Asian megacities (Global South) development [7,8,9,10,11,12,13].
While China (East Asia) has several megacities, which indicates that the core of China’s economic activities is not concentrated in one region, Indonesia (Southeast Asia), for its part, has only one, namely the Jakarta metropolitan region—the largest urban agglomeration (megacity) in the Global South [7,14,15]. The Jakarta Special Capital Region (SCR), the core area of the Jakarta megacity, is the capital of Indonesia and the center of the Indonesian economy [16,17]. The Jakarta SCR is the top contributor to Indonesia’s gross domestic product (GDP) (17.7% share), although it accounted for only about 3.89% of the Indonesian population in 2020 [18]. For decades, the Jakarta SCR has attracted migrants looking to find work and a better life [8,16,19]; the city hosts many corporate headquarters and public institutions, which also play a gateway role for international trade and foreign direct investment [17,19]. These factors have caused an expansion of the need for urban land beyond the Jakarta SCR, which cannot provide sufficient land or space for industrial land development and urban settlement, making rapid urban expansion and development inevitable in suburban Jakarta [16,20,21].
Besides the factors mentioned earlier, rapid urban expansion and development in the Jakarta megacity’s outer suburbs (JMOS) (Figure 1) are also driven by urban-biased policy (UBP) [8,15]. The emergence of the term urban-biased begins with Myrdal’s criticism of developing countries that apply an anti-rural bias in their development policies [22]; then, the term urban bias was widely introduced by Lipton through his book "Why Poor People Stay Poor" in 1977 [23]. The UBP has been implemented for a long time by developing countries to respond to their lags in development [24,25]; the UBP is characterized by focused development in urban economic activities and urban areas, depleting rural natural resources for urban areas, and changing agricultural development to industrial development [23,24,26]. Massive conversion of agricultural land into built-up areas, numerous poor farmers, numerous farmers losing their land, and the agricultural sector (including its products) not being connected with the market and industry [27,28] became an evidence series that the development policies implemented in the JMOS (including Bekasi Regency) are the UBP.
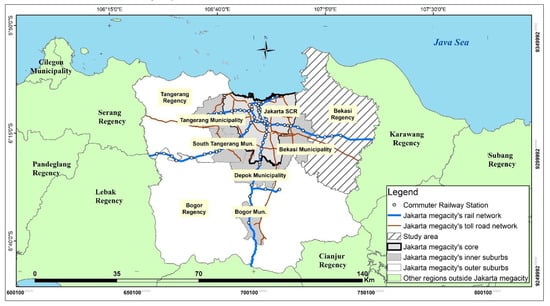
Figure 1.
Bekasi Regency’s location in the Jakarta megacity and its surrounding areas.
Implementing UBP, especially in their land development policies, has created many new towns (urban settlements) and large-scale industrial estates/parks (LSIEP) in Bekasi Regency [15,21,29,30,31,32,33]. The central government is playing the leading actor in the industrialization by making Bekasi Regency an industrial powerhouse of Jakarta megacity—as an agenda for connecting Bekasi Regency into the Global Production Networks [33]. The manufacturing sector was responsible for 77.20% of the Bekasi Regency’s GDP in 2020 [34]; at the same time, the GDP per capita of Bekasi Regency was higher than other regencies that are less manufacturing-dependent in the JMOS [15]. Many scholars have found that manufacturing development has contributed to increasing the GDP and improving the economy of Bekasi Regency in aggregate [29,35].
Nevertheless, the question remains whether implementing UBP in Bekasi Regency (representative of the most industrial-dominated suburbs in JMOS) can reduce regional economic disparities (especially between urban and rural neighborhoods). Several studies have found that UBP only leads to a high disparity in economic performance between rural and urban neighborhoods, and it has led to high levels of poverty in rural areas of China [22,26,36,37] and Vietnam [38]. Implementing UBP to land development and government spending structures that are more profitable for urban residents has increased income inequality between urban and rural residents in China [22,26]. Investment imbalance (including incentives) between industrial and agricultural development, and political pressure from urban communities, are the primary background of the urban-rural inequality in Vietnam [38]. The land owned by farmers tends to be stable and even decreases due to increasing land prices and rampant land speculation—one of the symptoms is that the implementation of the UBP in the JMOS does not favor rural communities (farmers) [7,28]. Moreover, the lack of education and adaptability skills of farmers, especially non-horticultural farmers, negatively affects agricultural development and activities in JMOS (including Bekasi Regency) [27,28].
Implementing the UBP ignores that many parts of the JMOS are still agricultural-based rural areas, especially in Bekasi Regency [39,40,41]. Furthermore, agriculture–based rural areas and also forest areas in JMOS must be maintained because the Jakarta megacity faces unsustainable development issues, such as environmental degradation and unsustainable food production [39,41,42]. The main purpose of this study is to indicate/investigate whether the UBP causes economic disparities in rural–urban neighborhoods (at the microregional level: village/desa/kelurahan) in the Bekasi Regency.
A bibliometric analysis (using the Scopus 2022 database) showed that the Jakarta megacity’s development studies (156 articles) rarely discussed economic disparities between the urban and rural areas in the Jakarta megacity suburb; analyses conducted at the microregional level are scarce. By using keywords analysis (a bibliometric analysis), most of the Jakarta megacity’s development studies discuss urban development (35 articles), urban planning (25 articles), urbanization (17 articles), and urban growth (17 articles); only a few studies address topics related to disparities or inequality [27,43,44]. Previous work on this topic did not investigate whether the UBP causes urban–rural (regional) economic disparities. For instance, Suhartini et al. [43] discuss high poverty rates in rural areas in one of the JMOS regency (Bogor), while Rukmana and Ramadhani [44] discuss changes in socioeconomic segregation between regions (subdistrict/kecamatan) in the Jakarta megacity. In addition, Pribadi and Pauleit [27] focused on how peri-urban agriculture could overcome poverty in rural areas and increase food security in the Jakarta megacity.
The investigation was divided into two sections: (1) delimitation of urban and rural neighborhoods of the Bekasi Regency and their characteristics, and (2) urban and rural neighborhoods’ economic disparities in the Bekasi Regency and their characteristics. Together with the development of spatial analysis methods and techniques, this paper discusses development issues by utilizing spatial analysis combined with spatial statistics (quantitative zoning method) at the microregional level (desa/kelurahan). In the case of the Bekasi Regency, analysis at the microregional level is needed because its development is dynamic and scattered [15,20,39].
2. Materials and Methods
The delimitation of the urban and rural neighborhoods used in this study is based on the rural–urban land transformation (RULT) index analysis, developed by Kurnia et al. [15]. The RULT index is based on an analytical hierarchical process to derive weights for each land-use/cover (LUC) class, drawing on the preferences of eight experts in urban/regional planning and development. In this approach, the LUC is, to some extent, a physical representation of the socioeconomic conditions in an area [16,45].
Compared to other methods (see a study by Saradar and Hazra [46] for a comprehensive list), the advantage of the RULT index for differentiation between the urban and rural areas does not only depend on the share of the built-up area or agricultural area see [8,16,40]. The weight for each LUC class is different, developed in response to a level of significance to transform an area into an urban/rural neighborhood (according to Indonesia’s urban/rural characteristics)—see Equation (1) [15]. The equation of the RULT index is formed by the weight and relationship direction (+/−) of each LUC class/criterion [15]. Each desa/kelurahan with a RULT index value > 0 was classified as an urban neighborhood, and with a RULT index value < 0 was classified as a rural neighborhood.
where the positive sign (+) means that the LUC criterion is in line with the rural-to-urban neighborhood transformation, while the negative sign (−) means the reverse; TA is the total area of LUC calculated in the index in each desa/kelurahan; i is the desa/kelurahan of i; ITS, SA, DBL, WAL, FR, and MP are the LUC classes; ITS is industry, trade, and services; SA is settlement area; DBL is dry land (including bare land); WAL is wet agricultural land (including paddy field areas); FR is forest area (including mangrove); and MP is mixed plantation.
The data used for the RULT index analysis are the LUC data of Bekasi Regency in 2018 that were sourced from the study of Kurnia et al. [39]. However, it is a question of to what extent the RULT index, relying solely on the LUC data, can capture actual demographic and socioeconomic conditions in the Bekasi Regency. Therefore, this study examines values of the 2018 RULT index with population density (PD) and percentage of households depending on agriculture (PHDA). PD and PHDA are the main socioeconomic values that distinguish between urban and rural areas/neighborhoods in Indonesia [39,41]. A Pearson-product moment (PPM) correlation test (see Equation (2) [47]) was used to test the 2018 RULT index value with PD and PHDA data.
where is the correlation coefficient between variable (PD or PHDA) and variable (2018 RULT index); is the value of variable in observation of desa/kelurahan i; is the value of variable in observation of desa/kelurahan i; is the mean of the values of the variable ; is the mean of the values of the variable ; and is the number of observations (187 desa/kelurahan).
This study applies ordinary least squares (OLS) and geographically weighted regression (GWR) to identify the characteristics of urban and rural neighborhoods globally and locally. Multiple linear regression (MLR) using OLS analysis was performed to obtain the global characteristics of urban and rural neighborhoods. The selection of variables suspected of being the determinants for the rural–urban neighborhood is based on previous studies [39,48,49]. All list data used in the analysis of urban and rural neighborhoods determinants/characteristics are presented in Table 1.

Table 1.
A list of data used in this study.
In addition to obtaining the driving factor globally, MLR using OLS generates estimators by keeping down the residual sum of squares [50,51]. Furthermore, the variables entering the OLS analysis should be normally distributed, with no multicollinearity between the independent variables [52]. In addition, OLS analysis can also illustrate the direction and degree of the relationship between a dependent variable and a set of independent variables [53].
Some studies use OLS and GWR analyses to obtain the determinants/characteristics (globally and locally) in explaining an urban/regional development issue/phenomenon [51,53,54,55]. OLS estimated the effects of predictors on the dependent variable; then, GWR analysis (see Equation (3)) was performed to obtain local determinants/characteristics for urban and rural neighborhoods and the spatial patterns of local R2 in each desa/kelurahan. An R2 value that is close to 1 means that the predictors (x) perfectly explain the issue/phenomenon (predicted variable/y) being studied, while an R2 value that is close to 0 explains the opposite [51,53,54,55].
where is the dependent variable for observation j; is the independent variable at location j; is a coordinate point for the location of observation j, is the intercept for observation j, and is the regression coefficient or local parameter estimate for the independent variable at location j.
Studies of regional disparities in economic performance usually adopt income per capita, GDP per capita, poverty rate, and/or expenditures per capita data [37,44,51,56]. None of these data is available for Indonesia’s microregional level (desa/kelurahan). However, the statistical agency of Bekasi Regency released poverty (poor households) rate data at the desa/kelurahan level for 2018. Poverty describes the condition of someone/household with insufficient income and low purchasing power, in which purchasing power (consumption) and income are prominent indicators in measuring economic performance [57]. This poverty rate (poor households) data, combined with demographic and socioeconomic data (PD, PHDA, and PGR), are used to discuss regional economic disparities in the Bekasi Regency.
After the standardization of all data was performed—standardization of all data is necessary because the units of each data are different; see Equation (4), quantitative zoning analysis was conducted to produce an economic disparities typology in the Bekasi Regency. The quantitative zoning method (QZM) can be used for zoning based on multiple variables [58]. The QZM used in this study is Rustiadi’s spatial clustering 1 [58], which leads to compact and contiguous zoning areas, allowing for more effective and efficient regional development [39,48,59].
Rustiadi’s spatial clustering 1 succeeded in zoning creation, in which the members of each cluster/zone have almost the same characteristics; the zoning results also identified compact and contiguous [39], especially in spatial weight () = 1 (one) [39,48]. At a spatial weight () > 1, the cluster generated by this method is somewhat biased because spatial aspects/variables are more influential than variables for regional characteristics [39,48]. Therefore, this study uses spatial weight () = 1 (one); the equation of Rustiadi’s spatial clustering 1 method is presented in Equation (5) [58]. To ensure the previous studies’ results related to Rustiadi’s spatial clustering 1, this study compares the coefficient of variation (CV) value—the ratio of the standard deviation of population (σ) to the mean of population (µ), between zoning with spatial weight () = 1 (one) and without spatial weight; CV comparison was performed to find the best zoning method [39,58].
where Xi.j is the value to be standardized from the ith row and jth column contingency matrix; mean (xi) is the average value of a contingency matrix in the ith row (the row where the data will be standardized); st.dev (xi) is the standard deviation of the contingency matrix in line i (the row where the data will be standardized); Dij refers to the Euclidean distance value between objects i and j; zi and zj are the location attribute values of i and j (in the univariate case); zmi and zmj are the location attribute values of i and j for zm variable (in the multivariate case); zmi’ and zmj’ are the standardized value of zmi and zmj; βW is spatial weight; X is the standardized value of the longitude coordinates; Y is the standardized value of the latitude coordinate.
Following this, overlay analysis was conducted between the economic disparities typology and the regional (urban and rural neighborhoods) typology; both typologies have been generated in the previous analysis. This analysis was used to analyze the economic disparities between urban and rural neighborhoods in Bekasi Regency, which were then analyzed descriptively based on the development area (DA)/wilayah pengembangan (WP). The rule of overlay analysis for determining types of neighborhoods in the regional economic disparities typology is described in Table 2.
Table 2.
Criteria for determining types of neighborhoods in the regional economic disparities’ typology.
3. Results
3.1. Urban and Rural Neighborhoods of the Bekasi Regency and Their Characteristics
The PPM correlation test result shows that 2018 RULT index values are strongly correlated with PD and PHDA values (Table 3). This strong correlation was obtained as the priority/weighting in the RULT index for each LUC class/criterion depends on the level of significance for transforming a region into an urban/rural neighborhood. The negative correlation between PHDA and the RULT index is because the urban area (marked by a high RULT index value) of the Jakarta megacity is characterized by only a tiny population that depends on the agricultural sector [39,41]. These results confirm that the RULT index analysis can be used to distinguish/delimitate the urban and rural neighborhoods in the Bekasi Regency, as it represents the socioeconomic and demographic features of the urban and rural neighborhoods.
Table 3.
PPM correlation test results.
Kurnia et al. [15] distinguished urban and rural neighborhoods in Bekasi Regency in 2015; this study confirms two main urban areas in Bekasi Regency: Cikarang and Tambun. Cikarang is home to seven LSIEPs registered by the Ministry of Industry, while the Tambun urban area is the result of urban expansion from the Bekasi municipality and the Jakarta SCR [15,39]. In 2018, the boundary between Cikarang and Tambun urban areas became borderless, and the desa/kelurahan around both urban areas were transformed into urban neighborhoods (Figure 2). Moreover, urban areas were expanded, leading to DA 2 and 3 (Figure 2), of which DA 3 is designated for agricultural development. Furthermore, there is an expansion of the urban areas that led around primary roads (such as Setu–Cileungsi and Cikarang-Cibarusah streets) and far from the previously formed urban areas/neighborhoods, such as in the Tarumajaya subdistrict, which is close to an LSIEP location (Marunda Center industrial park/estate) [15].
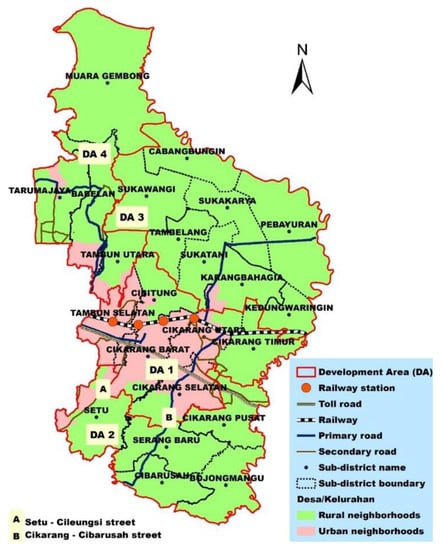
Figure 2.
Delimitation of urban and rural neighborhoods of the Bekasi Regency in 2018.
According to the results of urban and rural neighborhoods delimitation in 2018 generated by this study, 76.5% of the desa/kelurahan of the Bekasi Regency are rural neighborhoods, while the rest are urban neighborhoods. Furthermore, desa/kelurahan with rural characteristics (rural neighborhoods) covered 82.9% of the total area of Bekasi Regency. However, the people of Bekasi Regency live somewhat more in urban areas, accounting for 51.4% of Bekasi Regency’s population living in urban areas; the rest live in rural areas.
After the data were transformed and OLS analysis was performed, 7 out of 11 variables met the best linear unbiased estimator (Table 4). The data from these seven variables were normally distributed, with no heteroscedasticity and no multicollinearity (tolerance value > 0.2 and VIF < 5 [60]) between the explanatory variables (Table 4). The seven variables could significantly explain 66.3% of the determinants of the urban and rural neighborhoods in Bekasi Regency (p < 0.05), and other factors outside the model explained the rest (Table 4).
Table 4.
OLS regression results summary.
At the same significance level (1%), variables X6, X3, and X9 were the strongest determinants for urban and rural neighborhoods in Bekasi Regency. All variables of economic facilities/infrastructure (X6, X9, and X10) had a positive effect on the increase in the RULT index, meaning that urban neighborhoods in Bekasi Regency are the locations of numerous economic facilities, such as minimarkets/supermarkets and banks. On the other hand, social facilities, such as public schools (X5), had a negative effect on the increase in the RULT index; this occurred because the land in urban neighborhoods is limited, and the price is somewhat high; thus, land in urban neighborhoods will be more profitable for the development of economic facilities or profitable social facilities (including private schools) [59].
The results of the GWR analysis show that the seven determinants can better explain the characteristics of the urban and rural neighborhoods in the central region, although they are slightly weaker in the northernmost and southeastern parts of Bekasi Regency; this can be seen in the R2 value of the central part ranging from 0.69 to 0.74, while in the northernmost and southeastern parts, it ranged from 0.55 to 0.66 (Figure 3). The central part of Bekasi Regency is the location of numerous LSIEPs, paddy-field areas, and settlements. In contrast, the northernmost part of Bekasi Regency is dominated by mangrove areas and rural settlements, and the southeastern part is a hilly area dominated by mixed plantations and rural settlements [15,39,61]. Furthermore, each explanatory (independent) variable has a different degree or significance (coefficient/β) value for each desa/kelurahan (Figure 4).
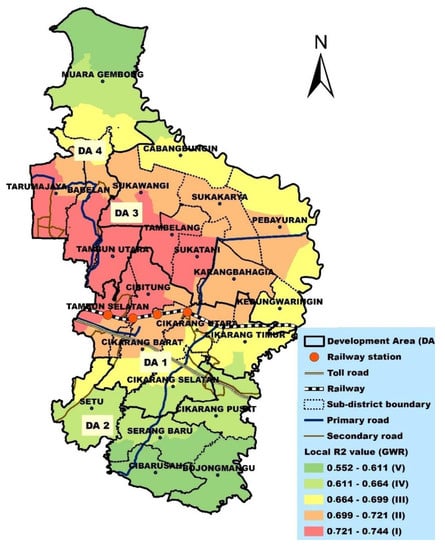
Figure 3.
Local R2 value of GWR analysis results for each desa/kelurahan in 2018.
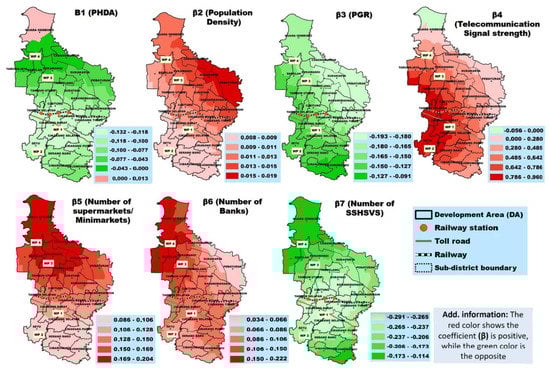
Figure 4.
Distribution of the GWR coefficient (β) value of each variable for each desa/kelurahan.
3.2. Urban and Rural Neighborhoods Economic Disparities of the Bekasi Regency and Their Characteristics
This study applies the QZM to split desa/kelurahans in the Bekasi Regency into two clusters: low poverty (LPv) and high poverty (HPv). As a result, it was found that the CV value of zoning with spatial weight (βW) was lower than that without spatial weight (Table 5). The lower CV value indicates the best zoning results because the characteristics of members in each cluster/zone are more homogeneous/similar [39]. Furthermore, these results further strengthen the Rustiadi spatial clustering I method with spatial weight (βW) = 1 as the best option for zoning, in which the resulting zoning is also compact and contiguous.
Table 5.
The CV value of each cluster (LPv and HPv) and overall for each zoning method.
The demographic and socioeconomic characteristics for each cluster (LPv and HPv cluster) of economic disparities typology are based on the mean of all members’ values (after being standardized) of each variable for each cluster (Figure 5). Most regions (desa/kelurahan) with low poverty (LPv) are associated with low PHDA, accompanied by relatively high PGR and PD; by contrast, HPv is associated with high PHDA, accompanied by relatively low PGR and PD (Figure 5). The LPv region chiefly covers DA 1, DA 2, and the southern part of DA 4 (Figure 6); this area is home to almost all of the LSIEP and the new town of Bekasi Regency [15]. For their part, DA 1 and DA 2 are designated for developing industrial estates/parks and urban settlements [62]. By contrast, almost all desa/kelurahan of DA 3 are found in the HPv cluster (Figure 6); DA 3 features much wet agricultural land, specifically paddy fields [15]. For its part, DA 3 is designated for agricultural development, especially crops [62].
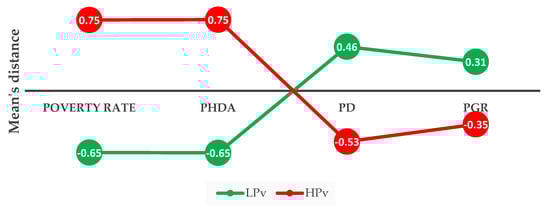
Figure 5.
Mean of all members’ values (after being standardized) of each variable for each cluster (LPv and HPv).
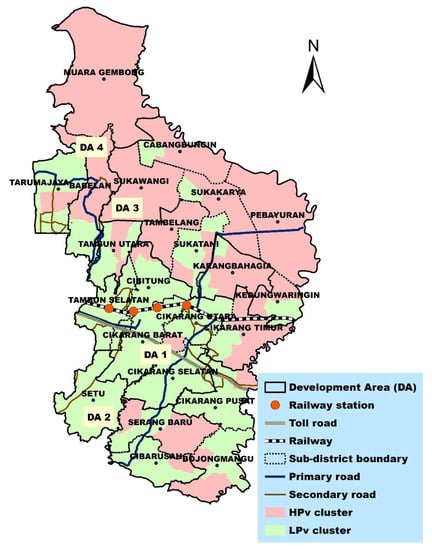
Figure 6.
Spatial pattern of the desa/kelurahans for LPv and HPv clusters in 2018.
In 2018, the mean poverty (poor households) rate of the desa/kelurahan in the HPV cluster reached 29.5% of the total households, while in the LPv cluster, only 8.6%. In total, 87 out of 187 desa/kelurahan (46.5%) were included in the HPv cluster, with the remainder belonging to the LPv cluster. Then, 98% of the members of the HPv cluster are rural neighborhoods; only two desa/kelurahan (urban neighborhoods) are within the HPv cluster (Figure 7). More than half (59%) of desa/kelurahan (rural neighborhoods) fall within the HPv cluster, while only 5% of desa/kelurahan (urban neighborhoods) fall within the HPv cluster (Figure 7).
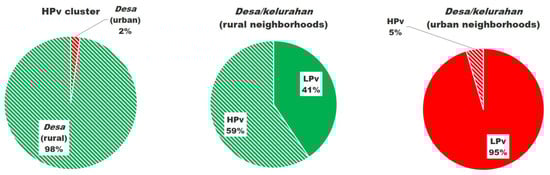
Figure 7.
Percentage (composition) of desa/kelurahan for the HPv and LPv clusters.
Most rural neighborhoods of the HPv cluster are clustered in the northern part of Bekasi Regency, particularly in DA 3 (Figure 8). All subdistricts in DA 3 and DA 4 have desa/kelurahans in Type IV (HPv cluster and rural neighborhood) (Figure 8). Interestingly, four subdistricts, all of which are rural neighborhoods, are included in the HPv cluster, namely Muara Gembong (DA 4), Pebayuran (DA 3), Tambelang (DA 3), and Sukawangi (DA 3) (Figure 8). Two desa/kelurahan (urban neighborhoods) that belong to the HPv cluster are located in the center of urban areas (Cikarang Utara subdistrict), and one is in the Tambun Utara subdistrict (Figure 8). Interestingly, there is one subdistrict in DA 1 where all desa/kelurahan are all urban neighborhoods and belong to the LPv cluster, namely, Tambun Selatan (Figure 8).
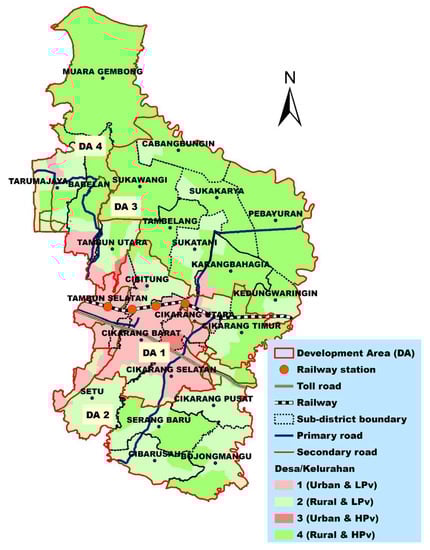
Figure 8.
Delimitation and spatial patterns of economic disparities across urban and rural neighborhoods in 2018.
4. Discussion and Conclusions
This study investigates an outer suburban area of a Global South megacity and finds that almost all desa/kelurahan/neighborhoods that feature HPv are rural neighborhoods, in which 3 out of 10 (average) households in the HPv cluster are poor. This study’s results further support previous evidence indicating a relatively high poverty rate in rural areas/neighborhoods of JMOS [27,43]. Moreover, almost all desa/kelurahan with urban characteristics (urban neighborhoods) in Bekasi Regency are in the LPv cluster, supporting the findings of earlier work that the UBP increases economic disparities between urban and rural areas (neighborhoods), as occurred for the cases of China and Vietnam [22,26,36,37,38].
In the Jakarta megacity suburb (including Bekasi Regency), the implementation of the UBP has influenced their land development policy, marked by the development of LSIEP and urban settlements (new towns) on land that was formerly agricultural land (paddy-field area) [8,15]; what occurred in the Bekasi Regency is similar to many metropolitan’s suburbs in China [63,64]. Implemented UBP on land development policy is usually characterized by rural land expropriation (agricultural land) to urban land (belonging to developers/urban residents) with inadequate compensation for rural residents (farmers) [22,65]. The implementation of UBP in Indonesia and China’s metropoles (Global South) tends not to pay attention to the equity, urban–rural linkage, and agricultural sector (the primary income for rural residents) [22,27,41].
Besides, implementation of the UBP had placed pressure on agricultural land, which has become smaller and more fragmented due to the farmers’ powerlessness and limited financial capacity to maintain the land [16,27,28,41,61,66,67]. DA 3 is currently an agricultural (paddy field) area [15,39,40,61] and is expected to be used for agricultural development [62,68]. However, most of its area (DA 3) shows high levels of poverty (according to this study’s results), being under pressure from the urban expansion of Cikarang [15]. To summarize, the development conducted by the governments (central and local) does not significantly improve the prosperity of Bekasi regency’s rural residents.
As a hinterland/suburban region of Jakarta megacity, Bekasi Regency is directed to maintain agricultural areas and green space (based on Bekasi Regency spatial planning) [62,68]. Previous studies [39,41,42] show that the sustainability of the agricultural-based rural areas in JMOS must be maintained to keep the ecological balance and food security of the Jakarta megacity. Thus, our results and the conditions mentioned above have led Bekasi Regency further from the development goals stated in the Jakarta megacity’s and Bekasi Regency’s spatial planning.
This study also found that most of the rural neighborhoods with high poverty in Bekasi Regency are characterized by a lack of economic facilities and weak telecommunication signals. Moreover, rural neighborhoods with HPv tend to have a high PHDA, relatively low PD, and relatively low population growth. Therefore, the government should invest in developing socioeconomic infrastructure and telecommunication/internet networks in poor rural neighborhoods; substantial secondary/higher education investment is also needed. Fostering the links between agriculture (farm products), manufacturing of food products, and traditional/modern markets can be the way to improve the prosperity of rural residents in Jakarta’s megacity suburb (including Bekasi regency) [27].
Issues of poverty in rural areas/neighborhoods and economic disparities between urban and rural areas/neighborhoods in Indonesia’s metropolitan areas, especially in the Jakarta megacity, have rarely been discussed. Most studies or discussions of the Jakarta megacity’s development focus on urban and industrial development see [8,15,29,30,39] and urban expansion and land use changes see [16,21,40,41].
Thinking about the possibilities of future research, it is necessary to consider limitations resulting from the case selection, data, and methods. Limited data availability at the desa/kelurahan level (especially indicators covering economic performance and detailed economic structure) constrains the explanatory power of models estimating in explaining economic disparities between urban and rural neighborhoods. Moreover, the unavailability of the microregional data in time series restricts the possibility of drawing causal effects between the socioeconomic status and the neighborhood’s urbanity/rurality. Future research should address improving regional disparities indicators/estimators, especially on household/regional economic indicators (such as expenditure/income per capita)—which can examine in more depth how the UBP causes disparities between urban and rural areas.
Author Contributions
Data collection, conceptualization, field survey conduction, data curation, formal analysis, methodology, investigation, validation, visualization, and writing—original draft: Adib Ahmad Kurnia; investigation, methodology, supervision, validation, writing—review and editing: Ernan Rustiadi, Akhmad Fauzi, Andrea Emma Pravitasari and Jan Ženka. All authors have read and agreed to the published version of the manuscript.
Funding
This research received no external funding.
Data Availability Statement
The data presented in this study are available on request from the corresponding author. Some of the raw data used in this study can be accessed on the website of Bekasi Regency’s statistics agency (https://bekasikab.bps.go.id/publication.html, accessed on 7 June 2022).
Acknowledgments
We would like to thank the anonymous reviewers for their valuable and constructive comments and the Ministry of Education, Culture, Research and Technology, the Republic of Indonesia, for its valuable support to our first author by providing a PMDSU scholarship during his Ph.D. study.
Conflicts of Interest
The authors declare no conflict of interest.
References
- Hudalah, D.; Firman, T. Mega-Suburbanization in Jakarta Mega-Urban Region. In Mega-Urbanization in the Global South; Datta, A., Shaban, A., Eds.; Routledge: London, UK, 2016; pp. 151–168. [Google Scholar] [CrossRef]
- Rukmana, D. The Routledge Handbook of Planning Megacities in the Global South; Routledge: London, UK, 2020. [Google Scholar] [CrossRef]
- Xu, G.; Jiao, L.; Liu, J.; Shi, Z.; Zeng, C.; Liu, Y. Understanding Urban Expansion Combining Macro Patterns and Micro Dynamics in Three Southeast Asian Megacities. Sci. Total Environ. 2019, 660, 375–383. [Google Scholar] [CrossRef] [PubMed]
- Hall, T.; Barrett, H. Urban Geography; Routledge: London, UK, 2018. [Google Scholar] [CrossRef]
- Firman, T. The Urbanisation of Java, 2000–2010: Towards ‘the Island of Mega-Urban Regions’. Asian Popul. Stud. 2017, 13, 50–66. [Google Scholar] [CrossRef]
- Kennedy, C.; Stewart, I.D.; Ibrahim, N.; Facchini, A.; Mele, R. Developing a Multi-Layered Indicator Set for Urban Metabolism Studies in Megacities. Ecol. Indic. 2014, 47, 7–15. [Google Scholar] [CrossRef]
- Firman, T. The Continuity and Change in Mega-Urbanization in Indonesia: A Survey of Jakarta-Bandung Region (JBR) Development. Habitat Int. 2009, 33, 327–339. [Google Scholar] [CrossRef]
- Rustiadi, E.; Pravitasari, A.E.; Setiawan, Y.; Mulya, S.P.; Pribadi, D.O.; Tsutsumida, N. Impact of Continuous Jakarta Megacity Urban Expansion on the Formation of the Jakarta-Bandung Conurbation over the Rice Farm Regions. Cities 2021, 111, 103000. [Google Scholar] [CrossRef]
- Shen, J.; Wu, F. The Suburb as a Space of Capital Accumulation: The Development of New Towns in Shanghai, China. Antipode 2017, 49, 761–780. [Google Scholar] [CrossRef]
- Song, Y.; Stead, D.; de Jong, M. New Town Development and Sustainable Transition under Urban Entrepreneurialism in China. Sustain. 2020, 12, 5179. [Google Scholar] [CrossRef]
- Lad, K.S.; Petkar, A.S. Assessing Transformations in Peri-Urban Areas Using GIS: A Case of Pune City, India. Geoscape 2022, 16, 80–92. [Google Scholar] [CrossRef]
- Tiwari, P. Dynamics of Peri Urban Areas of Indian Cities. Int. J. Sci. Eng. Res. 2019, 10, 131–141. [Google Scholar]
- Sharma, S. The Landuse Dynamics of Peri Urban: A Case of Amritsar Metropolitan. Int. J. Civ. Eng. Technol. 2017, 8, 1360–1366. [Google Scholar]
- Martinez, R.; Masron, I.N. Jakarta: A City of Cities. Cities 2020, 106, 102868. [Google Scholar] [CrossRef]
- Kurnia, A.A.; Rustiadi, E.; Fauzi, A.; Pravitasari, A.E.; Saizen, I.; Ženka, J. Understanding Industrial Land Development on Rural-Urban Land Transformation of Jakarta Megacity’s Outer Suburb. Land 2022, 11, 670. [Google Scholar] [CrossRef]
- Rustiadi, E.; Pribadi, D.O.; Pravitasari, A.E.; Indraprahasta, G.S.; Iman, L.S. Jabodetabek Megacity: From City Development Toward Urban Complex Management System. In Urban Development Challenges, Risks and Resilience in Asian Mega Cities; Springer: Tokyo, Japan, 2015; pp. 421–445. [Google Scholar] [CrossRef]
- Indraprahasta, G.S.; Derudder, B. World City-Ness in a Historical Perspective: Probing the Long-Term Evolution of the Jakarta Metropolitan Area. Habitat Int. 2019, 89, 102000. [Google Scholar] [CrossRef]
- Statistics Agency of Indonesia. Gross Regional Domestic Product of Regencies/Municipalities in Indonesia 2017–2021; BPS-Statistics Indonesia: Jakarta, Indonesia, 2021.
- Winarso, H.; Hudalah, D.; Firman, T. Peri-Urban Transformation in the Jakarta Metropolitan Area. Habitat Int. 2015, 49, 221–229. [Google Scholar] [CrossRef]
- Rustiadi, E.; Panuju, D.R. Spatial Pattern of Suburbanization and Land-Use Change Process: Case Study in Jakarta Suburb. In Land Use Changes in Comparative Perspective; Informa UK Limited: Colchester, UK, 2002; pp. 47–66. [Google Scholar] [CrossRef]
- Kurnia, A.A.; Rustiadi, E.; Pravitasari, A.E. Cluster Analysis and Spatial Pattern Approaches in Identifying Development Pattern of Bodebek Region, West Java. In Proceedings of the Sixth International Symposium on LAPAN-IPB Satellite, Bogor, Indonesia, 24 December 2019; Volume 11372. [Google Scholar] [CrossRef]
- Wang, S.; Tan, S.; Yang, S.; Lin, Q.; Zhang, L. Urban-Biased Land Development Policy and the Urban-Rural Income Gap: Evidence from Hubei Province, China. Land Use Policy 2019, 87, 104066. [Google Scholar] [CrossRef]
- Jones, G.A.; Corbridge, S.; Jones, G.A. The Continuing Debate about Urban Bias: The Thesis, Its Critics, Its Influence and Its Implications for Poverty-Reduction Strategies. Prog. Dev. Stud. 2010, 10, 1–18. [Google Scholar] [CrossRef]
- Lipton, M. Urban Bias in World Development. Afr. Econ. Hist. 1977, 73, 467. [Google Scholar]
- Pierskalla, J.H. The Politics of Urban Bias: Rural Threats and the Dual Dilemma of Political Survival. Stud. Comp. Int. Dev. 2016, 51, 286–307. [Google Scholar] [CrossRef]
- Lu, M.; Chen, Z. Urbanization, Urban-Biased Policies, and Urban-Rural Inequality in China, 1987–2001. Chinese Econ. 2006, 39, 42–63. [Google Scholar] [CrossRef]
- Pribadi, D.O.; Pauleit, S. Peri-Urban Agriculture in Jabodetabek Metropolitan Area and Its Relationship with the Urban Socioeconomic System. Land Use Policy 2016, 55, 265–274. [Google Scholar] [CrossRef]
- Pribadi, D.O.; Zasada, I.; Müller, K.; Pauleit, S. Multifunctional Adaption of Farmers as Response to Urban Growth in the Jabodetabek Metropolitan Area, Indonesia. J. Rural Stud. 2017, 55, 100–111. [Google Scholar] [CrossRef]
- Hudalah, D.; Firman, T. Beyond Property: Industrial Estates and Post-Suburban Transformation in Jakarta Metropolitan Region. Cities 2012, 29, 40–48. [Google Scholar] [CrossRef]
- Hudalah, D.; Viantari, D.; Firman, T.; Woltjer, J. Industrial Land Development and Manufacturing Deconcentration in Greater Jakarta. Urban Geogr. 2013, 34, 950–971. [Google Scholar] [CrossRef]
- Firman, T.; Fahmi, F.Z. The Privatization of Metropolitan Jakarta’s (Jabodetabek) Urban Fringes: The Early Stages of “Post-Suburbanization” in Indonesia. J. Am. Plan. Assoc. 2017, 83, 68–79. [Google Scholar] [CrossRef]
- Zhu, J.; Simarmata, H.A. Formal Land Rights versus Informal Land Rights: Governance for Sustainable Urbanization in the Jakarta Metropolitan Region, Indonesia. Land Use Policy 2015, 43, 63–73. [Google Scholar] [CrossRef]
- Indraprahasta, G.S.; Derudder, B.; Hudalah, D. Local Institutional Actors and Globally Linked Territorial Development in Bekasi District: A Strategic Coupling? Singap. J. Trop. Geogr. 2019, 40, 219–238. [Google Scholar] [CrossRef]
- Bekasi Regency’s Statistical Agency [BPS]. Gross Regional Domestic Product of Bekasi Regency 2016–2020; Bekasi Regency’s Statistical Agency [BPS]: Bekasi Regency, Indonesia, 2021. [Google Scholar]
- Talitha, T. Rethinking Metropolitan Governance: A Shift towards Urban Entrepreneuralism in Decentralized Indonesia. The Case of Jakarta Metropolitan Region. 2016. Available online: https://thesis.eur.nl/pub/37321/TTalitha_MA_2015_16_GPPE.pdf (accessed on 10 May 2022).
- Tao Yang, D. Urban-Biased Policies and Rising Income Inequality in China. Am. Econ. Rev. 1998, 89, 306–311. [Google Scholar] [CrossRef]
- Guo, D.; Jiang, K.; Xu, C.; Yang, X. Clustering, Growth and Inequality in China. J. Econ. Geogr. 2020, 20, 1207–1239. [Google Scholar] [CrossRef]
- Fesselmeyer, E.; Le, K.T. Urban-Biased Policies and the Increasing Rural-Urban Expenditure Gap in Vietnam in the 1990s. Asian Econ. J. 2010, 24, 161–178. [Google Scholar] [CrossRef]
- Kurnia, A.A.; Rustiadi, E.; Pravitasari, A.E. Characterizing Industrial-Dominated Suburban Formation Using Quantitative Zoning Method: The Case of Bekasi Regency, Indonesia. Sustainability 2020, 12, 8094. [Google Scholar] [CrossRef]
- Kurnianti, D.N.; Rustiadi, E.; Baskoro, D.P.T. Land Use Projection for Spatial Plan Consistency in Jabodetabek. Indones. J. Geogr. 2015, 47, 124–131. [Google Scholar] [CrossRef]
- Pribadi, D.O.; Pauleit, S. The Dynamics of Peri-Urban Agriculture during Rapid Urbanization of Jabodetabek Metropolitan Area. Land Use Policy 2015, 48, 13–24. [Google Scholar] [CrossRef]
- Pribadi, D.O.; Vollmer, D.; Pauleit, S. Impact of Peri-Urban Agriculture on Runoff and Soil Erosion in the Rapidly Developing Metropolitan Area of Jakarta, Indonesia. Reg. Environ. Chang. 2018, 18, 2129–2143. [Google Scholar] [CrossRef]
- Suhartini, T.; Sadik, K.; Indahwati, I. Proporsi Kemiskinan Di Kabupaten Bogor. Sosio Inf. 2015, 1, 160–174. [Google Scholar] [CrossRef]
- Rukmana, D.; Ramadhani, D. Income Inequality and Socioeconomic Segregation in Jakarta. In Socio-Economic Segregation and Income Inequality; Springer: Cham, Switzerland, 2021. [Google Scholar]
- Tao, Y.; Ye, R. Analysis of the Spatio-Temporal Characteristics of Nanjing’s Urban Expansion and Its Driving Mechanisms. ISPRS Int. J. Geo-Inform. 2022, 11, 406. [Google Scholar] [CrossRef]
- Saradar, J.; Hazra, S. Application of Multi Criteria Analysis in Delineation of Peri-Urban Area: A Case Study of North 24 Parganas District, West Bengal. Int. J. Sci. Res. 2015, 4, 96–100. [Google Scholar]
- Zinzendoff Okwonu, F.; Laro Asaju, B.; Irimisose Arunaye, F. Breakdown Analysis of Pearson Correlation Coefficient and Robust Correlation Methods. IOP Conf. Ser. Mater. Sci. Eng. 2020, 917, 012065. [Google Scholar] [CrossRef]
- Supriyatin, R.; Pravitasari, A.E.; Pribadi, D.O. Pemetaan Karakteristik Wilayah Urban Dan Rural Di Wilayah Bandung Raya Dengan Metode Spatial Clustering. J. Geogr. 2020, 12, 125. [Google Scholar] [CrossRef]
- Hu, Z.; Wang, Y.; Liu, Y.; Long, H.; Peng, J. Spatio-Temporal Patterns of Urban-Rural Development and Transformation in East of the “Hu Huanyong Line”, China. ISPRS Int. J. Geo-Inf. 2016, 5, 24. [Google Scholar] [CrossRef]
- Li, J.; Jia, K.; Liu, Y.; Yuan, B.; Xia, M.; Zhao, W. Spatiotemporal Distribution of Zika Virus and Its Spatially Heterogeneous Relationship with the Environment. Int. J. Environ. Res. Public Health 2021, 18, 290. [Google Scholar] [CrossRef]
- Pravitasari, A.E.; Rustiadi, E.; Priatama, R.A.; Murtadho, A.; Kurnia, A.; Mulya, S.P.; Saizen, I.; Widodo, C.E. Spatiotemporal Distribution Patterns and Local Driving Factors of Regional Development in Java. ISPRS Int. J. Geo-Inf. 2021, 10, 812. [Google Scholar] [CrossRef]
- Cao, J.; Chen, Y.; Wilson, J.P.; Tan, H.; Yang, J.; Xu, Z. Modeling China’s Prefecture-Level Economy Using VIIRS Imagery and Spatial Methods. Remote Sens. 2020, 12, 839. [Google Scholar] [CrossRef]
- Yang, C.; Li, R.; Sha, Z. Exploring the Dynamics of Urban Greenness Space and Their Driving Factors Using Geographically Weighted Regression: A Case Study in Wuhan Metropolis, China. Land 2020, 9, 500. [Google Scholar] [CrossRef]
- de la Luz Hernández-Flores, M.; Otazo-Sánchez, E.M.; Galeana-Pizaña, M.; Roldán-Cruz, E.I.; Razo-Zárate, R.; González-Ramírez, C.A.; Galindo-Castillo, E.; Gordillo-Martínez, A.J. Urban Driving Forces and Megacity Expansion Threats. Study Case in the Mexico City Periphery. Habitat Int. 2017, 64, 109–122. [Google Scholar] [CrossRef]
- Yang, S.; Hu, S.; Wang, S.; Zou, L. Effects of Rapid Urban Land Expansion on the Spatial Direction of Residential Land Prices: Evidence from Wuhan, China. Habitat Int. 2020, 101, 102186. [Google Scholar] [CrossRef]
- Wei, Y.D.; Wu, Y.; Liao, F.H.; Zhang, L. Regional Inequality, Spatial Polarization and Place Mobility in Provincial China: A Case Study of Jiangsu Province. Appl. Geogr. 2020, 124, 102296. [Google Scholar] [CrossRef]
- Haughton, J.; Khandker, S.R. Handbook on Poverty and Inequality; The International Bank for Reconstruction and Development/The World Bank: Washington, DC, USA, 2009; Volume 4. [Google Scholar]
- Rustiadi, E.; Kobayashi, S. Contiguous Spatial Classification: A New Approach on Quantitative Zoning Method. J. Geogr. Educ. 2000, 43, 122–136. [Google Scholar]
- Rustiadi, E.; Saefulhakim, S.; Panuju, D.R. Perencanaan Dan Pengembangan Wilayah; Crespent Press: Bogor, Indonesia, 2018. [Google Scholar]
- Kim, J.H. Multicollinearity and Misleading Statistical Results. Korean J. Anesthesiol. 2019, 72, 558–569. [Google Scholar] [CrossRef] [PubMed]
- Santosa, S.; Rustiadi, E.; Mulyanto, B.; Murtilaksono, K.; Rachman, N.F.; Resources, L.; Sciences, C. Modeling on Establishment of Sustainable Paddy Field Zone in Bekasi Regency, Indonesia. J. Environ. Earth Sci. 2015, 5, 79–90. [Google Scholar]
- Bekasi Regency Government. Bekasi Regency’s Spatial Plan 2011–2031; Bekasi Regency Government: Bekasi, Indonesia, 2011; pp. 1–41.
- Liu, J.; Liu, Y.; Yan, M. Spatial and Temporal Change in Urban-Rural Land Use Transformation at Village Scale—A Case Study of Xuanhua District, North China. J. Rural Stud. 2016, 47, 425–434. [Google Scholar] [CrossRef]
- Wang, Y.; Liu, Y.; Li, Y.; Li, T. The Spatio-Temporal Patterns of Urban-Rural Development Transformation in China since 1990. Habitat Int. 2016, 53, 178–187. [Google Scholar] [CrossRef]
- Firman, T. Major Issues in Indonesia’s Urban Land Development. Land use policy 2004, 21, 347–355. [Google Scholar] [CrossRef]
- Putra, A.S.; Tong, G.; Pribadi, D.O. Food Security Challenges in Rapidly Urbanizing Developing Countries: Insight from Indonesia. Sustain. 2020, 12, 9550. [Google Scholar] [CrossRef]
- Gandharum, L.; Hartono, D.M.; Karsidi, A.; Ahmad, M. Monitoring Urban Expansion and Loss of Agriculture on the North Coast of West Java Province, Indonesia, Using Google Earth Engine and Intensity Analysis. Sci. World J. 2022, 2022, 3123788. [Google Scholar] [CrossRef] [PubMed]
- Republic of Indonesia Government. Rencana Tata Ruang Kawasan Perkotaan Jakarta, Bogor, Depok, Tangerang, Bekasi, Puncak, Dan Cianjur “Jakarta Megacity’s Spatial Planning”; Republic of Indonesia Government: Jakarta, Indonesia, 2020; pp. 1–105.
Disclaimer/Publisher’s Note: The statements, opinions and data contained in all publications are solely those of the individual author(s) and contributor(s) and not of MDPI and/or the editor(s). MDPI and/or the editor(s) disclaim responsibility for any injury to people or property resulting from any ideas, methods, instructions or products referred to in the content. |
© 2023 by the authors. Licensee MDPI, Basel, Switzerland. This article is an open access article distributed under the terms and conditions of the Creative Commons Attribution (CC BY) license (https://creativecommons.org/licenses/by/4.0/).