Abstract
Geotechnical investigation, in hilly areas, for high-rise projects, becomes a problematic issue and costly process due to difficulties in mobilization and assembling the drilling equipment on mountainous terrains. The objective of this study is to map soil properties of study areas, especially at inaccessible sites, for reconnaissance. Digital soil maps for Tehsil Murree, Pakistan, have been developed using the emerging Geographical Information System (GIS). The research work involved the creation of an exhaustive database, by collecting and rectifying geotechnical data, followed by the digitization of the acquired data through integration with GIS, in an attempt to visualize, analyze and interpret the collected geotechnical information spatially. The soil data of 205 explanatory holes were collected from the available geotechnical investigation (GI) reports. The collection depth of soil samples, which were initially used for the design of deep and shallow foundations by different soil consultancies in the Murree area, was approximately 50 ft. below ground level. Appropriate spatial interpolation methods (i.e., the Kriging) were applied for the preparation of smooth surface maps of soil standard penetration tester number values, soil type and plasticity index. The accuracy of developed SPT N value and plasticity maps were then evaluated using the linear regression method, in which the predicted values of soil characteristics from developed maps and actual values were compared. SPT N value maps were developed up to a depth of 9.14 m below ground level and at every 1.52 m interval. The depth of refusal was considered in the developed maps. Soil type and plasticity maps were generated up to 15.24 m depth, again at every 1.52 m intervals, using color contours, considering the maximum predicted foundation depth for high-rise projects. The study has implications for academics and practitioners to map the soil properties for inaccessible sites using GIS, as the resulting maps have high accuracy.
1. Introduction
The characterization of sub-surface conditions and properties is one of the most essential activities required for the successful planning, design, and construction of engineering structures. Risks related to improper ground conditions commonly represent the greatest concern in many infrastructure projects [1]. Most of these risks are directly, or indirectly, affected by the quantity and quality of subsurface investigations [1,2]. Therefore, in order to eliminate these risks, it is of great importance to increase the density of ground investigation data and improve the site sub-surface characterization to reduce the probability of encountering unexpected soil conditions during the construction phase and the likelihood of an excessive over-design which often leads to increased costs and delays. Sufficient site investigations also increase the reliability of estimates of characteristic soil and rock properties and geotechnical design parameters which, in turn, can reduce the likelihood of performance failure and/or allow designers to achieve the target reliability for a lesser cost [3]. The application of geotechnical data is not limited to structures and civil engineering projects. It is widely used in other disciplines, including infrastructure, environmental and risk analysis [4].
In most cases, geotechnical data are displayed and managed using traditional and ineffective methods, unlike geographic and geomorphologic data that are available in spatial data infrastructures (SDIs). As a result, geotechnical data are not readily available on a decent spatial resolution for many developed areas.
Subsurface soil data exploration can be done by geophysical methods, such as Ground-penetrating radar (GPR) and SPT. However, geotechnical investigation, especially in hilly areas for high-rise projects, becomes a problematic issue and costly process, due to the difficulties in mobilization and assembling the drilling equipment on mountainous terrains. For this purpose, soil mapping can be done with readily available geotechnical data using GIS for inaccessible sites, such as the top of a hill or the bottom of a valley. However, the data explored by these conventional techniques are often unorganized, heterogeneous, and not properly archived. Geographic Information System (GIS) technology can be used as an efficient tool to store, organize, analyze and display this type of data in the form of digital layers and maps [5]. In geotechnical practice, GIS can be used in at least four ways: data integration, data visualization and analysis, planning and summarizing site activities, and data presentation [5]. GIS provides promising tools for integrating multiple data types, such as raster format data (e.g., photos and scanned maps), vector format data (e.g., Shapefiles or computer-aided drafting (CAD) files) and it may consist of open-access information, such as soil surveys, topographic maps and borehole log data [6]. In addition, the exploration of subsurface soil is often an expensive task and geotechnical engineers deal with uncertainty by interpolating data from limited sources [7]. The problems associated with this poor data management have been recognized by many engineering agencies and organizations, and have prompted researchers to explore recent advancements in information technology, such as Web GIS platforms, in order to utilize them for exchanging geotechnical data. These data have to be collected, validated and stored within a unified spatial database to establish stratigraphy and pertinent properties of the soil at a specific site [8].
GIS is well-known for its capacity to integrate the capabilities of spatial analysis, database management and graphic visualization. The detailed geotechnical investigations can be pared down to only sensitive projects with access to preliminary data. By paring down the most suitable options, based on examples of existing surrounding structures, early soil type judgments can help plan risk mitigation strategies and improve design capabilities. These geotechnical soil type maps can be used to guide future infrastructure development. Examples of applications of GIS in the geotechnical field can be soil survey planning to soil management in addition to hydrologic response unit generation. Orhan and Tosun developed maps for Turkey to check the feasibility of foundations in residential areas, However, at site-specific scale, where local geological features alter, they may be less useful. [9]. Local authorities in South Africa, Palestine, Turkey and Thailand have all developed geotechnical mapping and they continue to update and improve their databases, but all these studies are restricted to shallow depth [10,11,12,13]. As another example, geotechnical characteristics were assessed using spatial modeling of geotechnical parameters by developing 3D models for the development of the Lavrion Technological [14]. A study was conducted to develop interpolated soil maps for Najaf, Iraq, using Kriging and Ordinary Kriging. The study is limited to soil USCS classification of Najaf, Iraq. [15]. ArcGIS was also used to map the organic composition of the soil in Najaf city [16]. For Baghdad, a GIS-based database of soil parameters has been created [17]. Another study was conducted for Wasit city, to map shear strength, consolidation parameters, and groundwater level to aid in the preliminary design phase, but this study is also limited to a depth of 10 m [18].
Since soil properties are highly variable spatially [19], and in order to provide an accurate estimate of characteristic values, continuous variability should be considered. The traditional method of soil analysis and interpretation is laborious, and time-consuming, hence, becoming expensive [20].
Geostatistical techniques (Kriging) are widely recognized as an important spatial interpolation technique in land resource inventories [21,22]. Several research studies have been conducted focusing on different interpolation methods of soil characteristics [23,24,25,26]. For example, the study done by (Srivastava et al. 2019) revealed that, for soil moisture data, kriging with external drift (KED) is performing better than ordinary kriging (OK), inverse distance weighting (IDW) and Spline methods, in terms of model accuracy and performance using cross-validation techniques. However, the performance of spatial interpolation techniques depends on several parameters, such as sample size, sampling design, sample spatial distribution, data (density and variation), surface type, data quality, input data uncertainty, and poor choice or implementation techniques. Thus, it is difficult to assign spatial interpolation methods as the “best practices” based on a given dataset without a prior investigation of their accuracy [27]. In our study, the KED interpolation method was adopted in order to develop continuous geotechnical spatial maps for the studied area. Kriging was the interpolation technique used, in which a linear combination of observations from close sampled sites were used to produce predictions at unsampled sites of Tehsil Murree, Pakistan. Kriging addresses several of the limitations of standard interpolation techniques used in GIS.
The aim of this study was to fill a gap by providing GIS soil characterization spatial maps for the area of Tehsil Murree in Pakistan. In fact, for a hilly area such as Tehsil Murree, it was not easy to collect the soil samples from the top of the mountain and difficult to set up the soil sampling equipment. To address this, spatial interpolation of the available geotechnical data was used to develop continuous soil maps. The created maps were used to show the variation in soil type, SPT N values, and Plasticity index.
The contribution of this study is to add to the geotechnical database of the country by making soil maps of one of Teshil Muree, which is the most developed tourist site of Pakistan. Geotechnical mapping of inaccessible sites is done using GIS so that these maps can be used in reconnaissance survey and table study for projected development in the future.
2. Materials and Methods
2.1. Study Area
The Tehsil Murree is one of the renowned hill stations of the Rawalpindi district with coordinates of 33.9078 N and 73.3915 E at an elevation of about 7500 feet. The Digital Elevation Model (DEM) of the study area was used to determine the elevation required at any given location. Figure 1a shows the DEM of the study region, whereas Figure 1b shows the study area’s location.
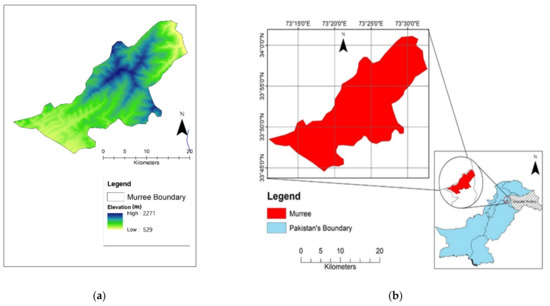
Figure 1.
(a) Digital elevation model of the study area (b) Map showing the location of the study area in Pakistan.
The neighboring districts of the study area are Haripur and Abbottabad. Both of these districts are located in Khyber Pakhtunkhwa, on the northern and western sides, and the Jhelum River on the eastern side. Kotli Satian, on the other hand, is found on the southern side of Murree. The soil formation of Muree Tehsil is characterized by lower Miocene sandstone and claystone. The sandstone is often reddish grey to purple-grey in color, thick-bedded, fine to medium-grained, micaceous, cross-bedded, and calcareous [24]. The location of the study area was in the sub-Himalayan mountainous region. According to the Ministry of Housing and Works of Pakistan, Murree was classified to be in earthquake zone 3, which falls in the class of moderate hazard. The hill slopes in the Murree area are rather steep, ranging from 17° to 30°. As the slope gets steeper, the shear force increases, which may result in landslides. One of the main reasons that may cause landslides in Muree Tehsil is rapid development, such as the construction of road networks and immature geology with disturbed slopes [25]. Therefore, land sliding is a common occurrence, especially with steep slopes, such as along highways, streams and disturbed slopes.
2.2. Methodology
Geotechnical reports of 112 sampling sites for deep and shallow foundation designs from four soil investigation firms in the Muree Tehsil area were collected. The available data were used to develop soil maps for the study area covering a maximum depth of 15.24 m below ground level. The methodology adopted consisted of six steps as shown in Figure 2.
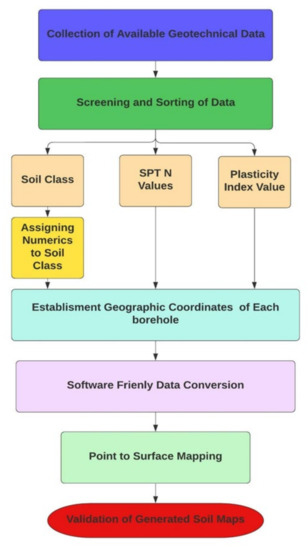
Figure 2.
Flowchart of methodology.
From collected geotechnical data soil classification, borehole coordinates, plasticity index and SPT N values were extracted at 1.52 m intervals and up to the level of 15.24 m below ground level. The classification of the soil type was performed, based on the USCS soil classification system [28]. Plasticity Index of soil samples collected from a borehole was determined by Atterberg’s limit test [29].
The extracted soil classification data was used to develop soil type maps by assigning an ascending wise numeric value to each soil class according to their gradation size, as listed in Table 1.

Table 1.
Soil sample classes and assigned values to be used in the GIS environment.
Regarding soil investigation reports in which borehole coordinates were not given, the coordinates of these boreholes were established by Google Earth by identifying the site on which the soil investigation was held. The extracted data, such as soil classification, SPT N value and plasticity index, were transformed into MS excel to make the data compatible with the ArcGIS format. The goal was to develop 1.52 m. interval soil maps using the retrieved data for Tehsil Murree. For this purpose, ArcGIS 10.3 was used to develop continuous interpolated maps. Ordinary Kriging interpolation technique was used to develop the continuous maps for soil classification, SPT N and plasticity index data. Kriging is a multiphase procedure that comprises interpretive statistical data analysis, variogram modeling, surface creation, and (optionally) variance surface exploration. Kriging creates an approximated surface from a scattering of z-valued points. Kriging is based on the assumption that the direction or distance between sample points implies a spatial correlation that may be utilized to explain surface variation using Equation (1).
Kriging interpolation can reliably be used for interpolation of geotechnical databases into continuous maps [30]. The validation of developed soil maps was done at 52 points using 8 boreholes in which generated values of maps were compared with the actual value of soil investigation reports that were not used in initial map making. The regression method, using MATLAB, was used for determining the accuracy of SPT N maps.
3. Results
The geotechnical data collection points and location of the study area are shown in Figure 3.
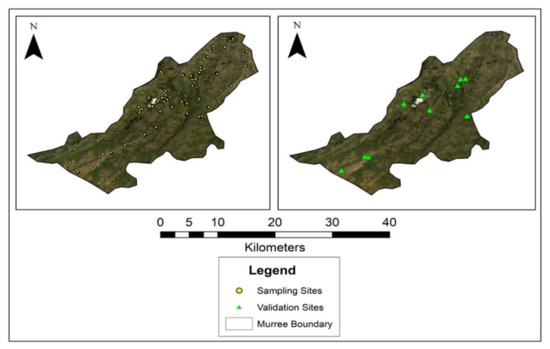
Figure 3.
Sampling sites map and validation sites map (locations of the boreholes).
In this study, interpolated maps of SPT N values were elaborated for Tehsil Murree at an interval of 1.52 m to a depth up to 9.14 m below ground level. Since the study area was hilly, there was mostly refusal after 9.14 m depth. The SPT N was represented by the color range in the legends and the red color represents the refusal. Figure 4 shows the SPT N value maps. It can be noticed that with an increase in depth, N values increased throughout the region. Refusal in the southern region was evident throughout the depth. At shallow depth, the N value was low because of the presence of peat and clayey soil and at a greater depth the N value increased because of the presence of Murree formation, which consists of consolidated sandstone and foothills of Margalla lie [26].
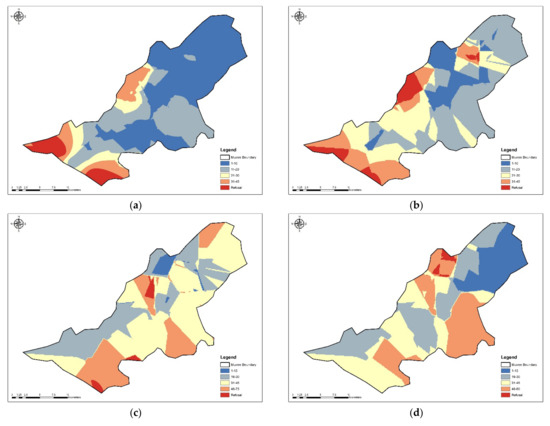
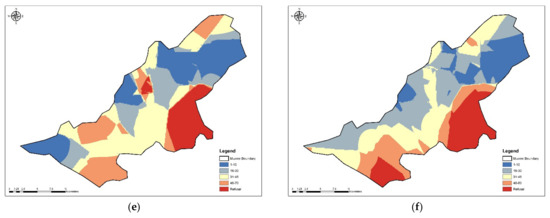
Figure 4.
SPT N maps at (a) 1.52 m depth, (b) 3.05 m depth, (c) 4.57 m depth, (d) 6.10 m depth, (e) 7.62 m depth and (f) 15.2 mdepth.
The accuracy of interpolated N value maps was determined by 52 points obtained from field investigations which were compared with predicted SPT N values at the same point in the study area. These additional 52 points were not used in the generation of SPT N value maps. Figure 5 depicts a statistical comparison of created and measured cell values. Regression analysis was done in which the R2 coefficient of determination was calculated. The acquired results by regression analysis demonstrated that the kriging approach maps the geotechnical parameters, and that these values were comparable to the original data. The coefficient of determination (R2) was 0.8233. The coefficient of correlation being greater than 0.8 indicated a strong correlation between the two variables [31].
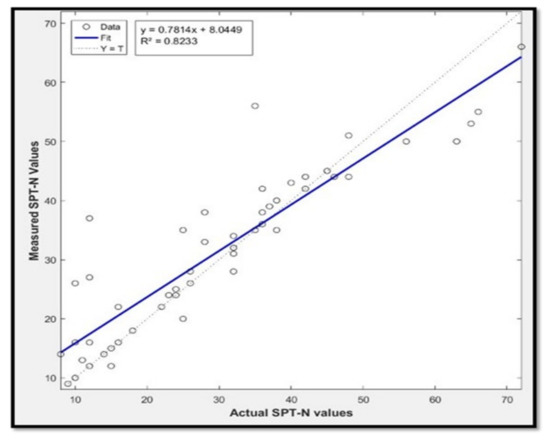
Figure 5.
Validation of generated soil maps.
The plasticity Index is the range of moisture content in which soil remains in a plastic state while in transition from a semi-solid state to a liquid state. The plasticity index indicates the degree of plasticity of the soil. Thematic maps were used to show the variation of plasticity index up to 50 ft. depth of soil strata at different locations of Tehsil Murree. Interpolated maps of the plasticity index were developed at the interval of 5 ft. The variation in plasticity index is represented by the color range in legends, as shown in Figure 5. Interpolated maps show that the majority of the areas of Murree represent medium-range plastic soils, due to the presence of clay and silty clay.
For the preparation of soil type maps, soil in the bore sites was classified using the Unified soil classification system. The soil types were digitized according to the gradation size listed in Table 1. At the shallow depths, a higher density and detailed maps were available because there was a large amount of data available at shallow depths. Also, most of the residential buildings’ bore logs were limited to a shallow depth which was almost 6.1–9.14 m depth. At shallow depth, the types of soil found were mainly MH, CL, CL-ML, ML, SC, SC-SM, SM, GC, GC-GM, GM, GW-GM, Shale and Sandstone. However, the dominant soil types were mostly CL, CL-ML, ML, and GC and, in some areas, MH, SC, SC-SM, shale, and sandstone were also found. As the depth increased the variation in soil types decreased. The major reason for this was that as the depth increased mostly uniform soil was found and the other reason was that a lesser amount of data was available at greater depth. The data acquired at greater depth were for large-scale projects, such as high-rise buildings.
The soils found at greater depths of the study area were usually clayey gravels, shale, and sandstone. However, clay and silty clay were also found in some specific areas. The following maps were developed by using the Kriging interpolation technique at intervals of 1.52 m up to 15.24 m depth, showing the identified soil types.
The generated soil maps could be used for feasibility studies at the preliminary investigation level, and rough cost estimation, especially at the inaccessible site. The accuracy of generated soil maps was checked by validating the SPT N value maps. The technique was used to assess the validity of the created maps for the predicted data by collecting samples from ten field survey sites and comparing the actual test outcomes in relation to the developed maps. Figure 5 depicts a statistical comparison of generated and measured cell values. The acquired results indicated that the maps developed by the Kriging technique were able to predict the geotechnical parameters accurately and that these values were comparable to the original data. Using generated maps, the cost of ground investigations for the development projects could be reduced. This research aimed to create soil maps, especially for inaccessible sites, and ready-to-use maps that bring useful ground information for geotechnical engineering projects. It is recommended to prepare similar maps for additional geotechnical properties, such as uniaxial compressive strength, effective cohesion and the angle of internal friction using the accurate interpolation techniques.
4. Discussions
In this study, the significance of GIS in geotechnical engineering was shown, specifically in the field of soil mapping. SPT N value has a direct relation with allowable bearing capacity. So, the higher the SPT N value, the higher will be the bearing capacity. The generated SPT N maps depicted the lower SPT N value in the northeastern area which indicated lower bearing capacity in that area than the remaining part of the study area. Similarly, in soil type maps the presence of clay gravels, gravels, shale and sandstone indicated harder strata, as there was the refusal of SPT. Figure 6 shows the generated maps of P.I which are linked with soil type maps of Figure 7. The plasticity index was mostly determined by the quantity of clay present. It signified the soil’s fineness and ability to change form without changing volume. A high PI implied that the soil contained too much clay or colloids. So, for the areas where fine soil was present, the observed value of P.I was higher and vice versa. When the PL was more than, or equal to, the LL, it had no value. So, for the areas where fine soil was present, the observed value of P.I was higher and vice versa. GIS software was used to analyze the study work, demonstrating the potential of GIS software in the geotechnical engineering area. The primary goal of this study was to ascertain the scope of GIS and its adaptability to map the soil properties at inaccessible sites. The produced maps to estimate the soil characteristics were easy to understand as they were built upon basic statistical principles. The end-user community of these maps could be engineers, employers and even researchers who are interested in exploring the economic and deliberate value of GIS, due to the benefits of this rapidly growing technology. Further to the economic aspects, the other fundamental advantages of GIS to produce such geotechnical maps can be generalized as (1) easy to visualize the spatial information by GIS output maps with clear legends and different groups of coloring and patterns (2) GIS can be applied to site selection, zoning, planning, and conservation measures (3) any other available data, like geophysical parameters on the subsurface conditions, can be incorporated with spatial data to validate the prediction and increase the precision of maps (4) it is possible to update/modify and refine datasets, data models, and the relation between attributes to produce better future maps if needed. For example, this study did not include data about the southeastern part of the Tehsil Murree, as there is no development in this area. However, the maps could be updated in the future when more sampling data becomes available. In the current research effort, we only used the ordinary Kriging interpolation method. Future research could compare the accuracy of different Kriging methods in the ArcGIS software platform.
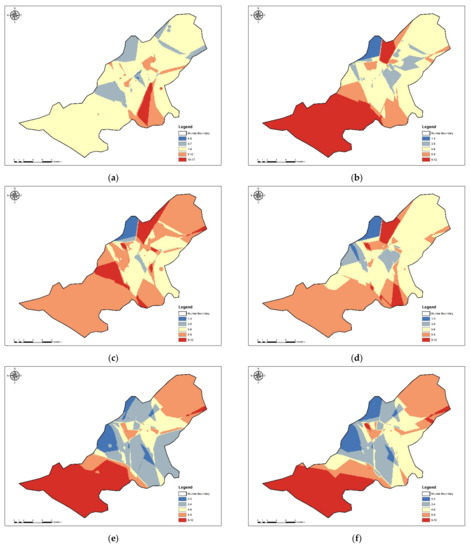
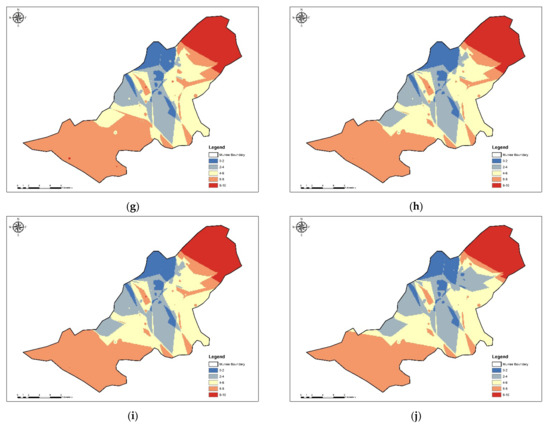
Figure 6.
Plasticity maps at (a) 1.52 m depth, (b) 3.05 m depth, (c) 4.57 m depth, (d) 6.10 m depth, (e) 7.62 m depth and (f) 9.14 m depth, (g) 10.67 m depth, (h) 12.19 m depth and (i) 13.72 m depth, (j) 15.24 m depth.
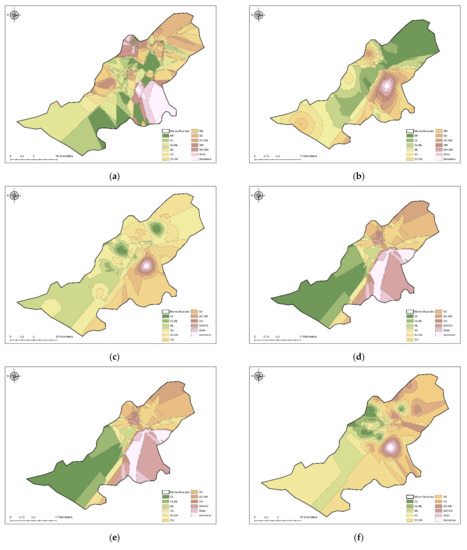
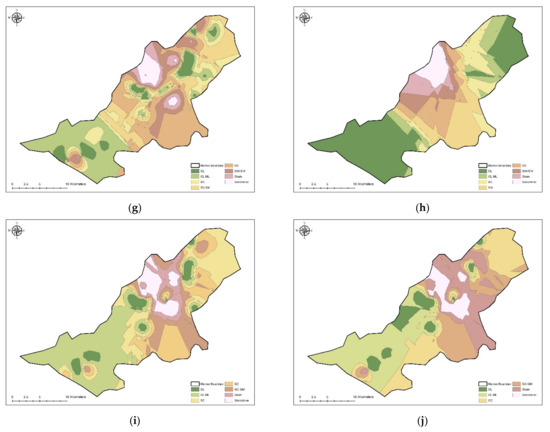
Figure 7.
Plasticity maps at (a) 1.52 m depth, (b) 3.05 m depth, (c) 4.57 m depth, (d) 6.10 m depth, (e) 7.62 m depth and (f) 9.14 m depth, (g) 10.68 m depth, (h) 12.19 m depth and (i) 13.72 m depth, (j) 15.24 depth.
Although the use of GIS-based methods for the prediction of geotechnical parameters can generally be beneficial, there are disadvantages that might increase the risk of over- or under-estimation of the strength parameters of the soil. Accuracy and precision, as the main challenging points, are the functions of the scale at which a map (paper or digital) is created. Inaccuracies may result from mistakes of many sorts, for example, regression models cannot work properly if the input data has errors (that is poor quality data). If the data preprocessing is not performed well to remove missing values or redundant data, outliers or imbalanced data distribution, the validity of the regression model suffers. Regression models are susceptible to collinear and nonlinearity problems and as the number of variables increases, the reliability of the regression models decreases. To assure the workability and prediction power of the regression models, several checks should be required. Some diagnostic tests and techniques make it possible to examine the data and evaluate the model assumptions and investigate whether or not there are observations with a large, undue influence on the analysis. Testing the assumptions of linear regression was not included in this research. However, it would be beneficial to test the four principal assumptions of linear regression, which would justify the use of linear regression models for purposes of prediction of geotechnical parameters in future research: (i) linearity and additivity of the relationship between dependent and independent variables, (ii) statistical independence of the errors, (iii) homoscedasticity (constant variance) of the errors and (iv) normality of the error distribution).
Empirical Bayesian Kriging (EBK) is an alternative method that could be used to achieve a straightforward and robust method of data interpolation and prediction. EBK automatically configures the construction process of Kriging to help reduce the uncertainties. The method allows modeling of the relationship between geotechnical properties and co-variables and to capture the nonstationary aspects of these parameters. The biggest advantage is that EBK takes into consideration the semi-variogram error. This leads to the best spatial distribution performance among the most common interpolation techniques. It is recommended to run an EBK analysis and compare the results with the estimated spatial distribution of SPTs over the study area. It is also very important for the end-users to know the uncertainty of the modeled spatial distribution of geotechnical maps in order to determine the reliability of maps that might be used in different applications. An uncertainty map is inherently produced in the spatial distribution generated by EBK.
5. Conclusions
Based on the previous use of GIS in geotechnical engineering, this paper proposed a promising method to predict soil properties for inaccessible sites using GIS. The resulted interpolated soil maps showed that geotechnical properties of soil, such as SPT N values, plasticity index, and soil types, could be mapped accurately using GIS. This would save a considerable amount of money spent on initial ground investigation steps.
The SPT N values, plasticity index and soil types were mapped using the Kriging interpolation technique with ArcGIS 10.3. The software was sourced from University of Tartu, Estonia. The SPT N value-interpolated maps for Tehsil showed that the N values were directly related to the depth. As the depth increased the larger were the N values observed. Usually, at the greater depths, the bedrock was found to consist of shale and sandstone. Similarly, interpolated plasticity index maps showed the range of plasticity index of subsurface soil, which represented medium range plastic soils with a degree of plasticity at shallow depth. The map of interpolated soil types exhibited the variation of soil strata for depths up to 15.24 m below ground level.
Using these maps, soil characteristics for inaccessible sites could be estimated. The developed soil maps are important for preliminary design and hazard identification, such as landslides, especially at the preliminary investigation level. The SPT N value maps and plasticity index maps play an important role in the determination of the bearing capacity of foundations. The SPT N values can also be used to evaluate soil strength and designers can use these maps for the selection of suitable types of foundation and depths of excavation. These developed soil maps represent the continuous and smooth surface of geotechnical parameter values using the Kriging technique, which reduces the probability of negligence of geotechnical hazards.
Author Contributions
Conceptaulization, Tariq Ahmed Awan, Muhammad Usman Arshid and Malik Sarmad Riaz; methodology, Tariq Ahmed Awan, Muhammad Usman Arshid and Muhammad Shahkar; validation, Malik Sarmad Riaz; data collection, Tariq Ahmed Awan, Muhammad Usman Arshid and Muhammad Shahkar; data curation Tariq Ahmed Awan, Muhammad Usman Arshid; writing—original draft prepration, Tariq Ahmed Awan, Malik Sarmad Riaz; writing—reviewing and editing, Malik Sarmad Riaz, Moustafa Houda, Mirvat Abdallah, Mirsina Mousavi Aghdam and Marc Azab; visualization Tariq Ahmed Awan, Muhammad Usman Arshid, Malik Sarmad Riaz and Muhammad Shahkar; supervision Moustafa Houda, Mirvat Abdallah, Mirsina Mousavi Aghdam and Marc Azab; project administration, Moustafa Houda, Mirvat Abdallah, Mirsina Mousavi Aghdam and Marc Azab. All authors have read and agreed to the published version of the manuscript.
Funding
This research received no external funding.
Institutional Review Board Statement
Not applicable.
Informed Consent Statement
Not applicable.
Data Availability Statement
Data will be available on demand.
Acknowledgments
The authors thank Engr Abdullah Tauqeer (University of Tartu) for helping with the ArcGIS software provision to the authors.
Conflicts of Interest
The authors declare no conflict of interest.
References
- Clayton, C.R. Managing Geotechnical Risk: Improving Productivity in UK Building and Construction; Thomas Telford: Southampton, UK, 2001. [Google Scholar]
- Hoek, E.; Palmieri, A. Geotechnical Risks on Large Civil Engineering Projects. 1998. Available online: https://www.rocscience.com/assets/resources/learning/hoek/Geotechnical-Risks-on-Large-Civil-Engineering-Projects-1998.pdf (accessed on 21 January 2022).
- Loehr, J.E.; Ding, D.; Likos, W.J. Effect of Number of Soil Strength Measurements on Reliability of Spread Footing Designs. Transp. Res. Rec. 2015, 2511, 37–44. [Google Scholar] [CrossRef]
- Zand, A.G. Enabling Geotechnical Data for Broader Use by the Spatial Data Infrastructures; University of Southern California: Los Angeles, CA, USA, 2011. [Google Scholar]
- Player, R.S.V. Geographic Information System (GIS) Use in Geotechnical Engineering; American Society of Civil Engineers: Reston, VA, USA, 2006. [Google Scholar]
- Singh, A.; Noor, S.; Chitra, R.; Gupta, M. Applications of GIS in Geotechnical Engineering: Some Case Studies. Int. J. Sci. Eng. Sci. 2018, 2, 34–38. [Google Scholar]
- Bardet, J.-P.; Zand, A. Spatial Modeling of Geotechnical Information Using GML. Trans. GIS 2009, 13, 125–165. [Google Scholar] [CrossRef]
- Dodagoudar, G.R. An integrated geotechnical database and GIS for 3D subsurface modelling: Application to Chennai City, India. Appl. Geomat. 2018, 10, 47–64. [Google Scholar]
- Orhan, A.; Tosun, H. Visualization of geotechnical data by means of geographic information system: A case study in Eskisehir city (NW Turkey). Environ. Earth Sci. 2010, 61, 455–465. [Google Scholar] [CrossRef]
- Jardaneh, I. Geotechnical Map for the City of Nablus-Palestine. An-Najah Univ. J. Res. A (Nat. Sci.) 2007, 21, 201–219. [Google Scholar]
- Kolat, Ç.; Doyuran, V.; Ayday, C.; Süzen, M.L. Preparation of a geotechnical microzonation model using Geographical Information Systems based on Multicriteria Decision Analysis. Eng. Geol. 2006, 87, 241–255. [Google Scholar] [CrossRef]
- Suwanwiwattana, P.; Chantawarangul, K.; Mairaing, W.; Apaphant, P. The Development of Geotechnical Database of Bangkok Subsoil Using GRASS-GIS; Citeseer: Princeton, NJ, USA, 2001. [Google Scholar]
- Kleinhans, I. A Critical Appraisal of Regional Geotechnical Mapping in South Africa; University of Pretoria: Pretoria, South Africa, 2006. [Google Scholar]
- Sotiropoulos, N.; Benardos, A.; Mavrikos, A. Spatial modelling for the assessment of geotechnical parameters. Procedia Eng. 2016, 165, 334–342. [Google Scholar] [CrossRef]
- Al-Mamoori, S.K.; Al-Maliki, L.A.J.; Al-Sulttani, A.; El-Tawil, K.; Hussain, H.M.; Al-Ansari, N. Horizontal and vertical geotechnical variations of soils according to USCS classification for the city of An-Najaf, Iraq using GIS. Geotech. Geol. Eng. 2020, 38, 1919–1938. [Google Scholar] [CrossRef] [Green Version]
- Al-Mamoori, S.K.; Al-Maliki, L.A.; Hussain, H.M.; Al-Ali, M.J. Distribution of sulfate content and organic matter in AN-najaf and al-kufa cities’soil using gis. Kufa J. Eng. 2018, 9, 92–111. [Google Scholar] [CrossRef] [Green Version]
- Ahmed, B.A.; Yahya, A.Y.; Mohammed, A.H. Database for Baghdad Soil Using GIS Techniques. J. Eng. 2012, 18, 1307–1324. [Google Scholar]
- Aldefae, A.H.; Mohammed, J.; Saleem, H.D. Digital maps of mechanical geotechnical parameters using GIS. Cogent Eng. 2020, 7, 1779563. [Google Scholar] [CrossRef]
- Burrough, P.A. Soil variability: A late 20th century view. Soils Fert. 1993, 56, 529–562. [Google Scholar]
- Shit, P.K.; Bhunia, G.S.; Maiti, R. Spatial analysis of soil properties using GIS based geostatistics models. Modeling Earth Syst. Environ. 2016, 2, 107. [Google Scholar] [CrossRef] [Green Version]
- Bhunia, G.S.; Shit, P.K.; Maiti, R. Comparison of GIS-based interpolation methods for spatial distribution of soil organic carbon (SOC). J. Saudi Soc. Agric. Sci. 2018, 17, 114–126. [Google Scholar] [CrossRef] [Green Version]
- Hengl, T.; Rossiter, D.G.; Stein, A. Soil sampling strategies for spatial prediction by correlation with auxiliary maps. Soil Res. 2003, 41, 1403–1422. [Google Scholar] [CrossRef]
- Arshid, M.U.; Shabbir, F.; Hussain, J.; Elahi, A. Assessment of variation in soil parameters, for design of lightly loaded structural foundations. Life Sci. J. 2013, 10, 217–220. [Google Scholar]
- Critelli, S.; Garzanti, E. Provenance of the lower Tertiary Murree redbeds (Hazara-Kashmir Syntaxis, Pakistan) and initial rising of the Himalayas. Sediment. Geol. 1994, 89, 265–284. [Google Scholar] [CrossRef]
- Khan, A.N.; Collins, A.E.; Qazi, F. Causes and extent of environmental impacts of landslide hazard in the Himalayan region: A case study of Murree, Pakistan. Nat. Hazards 2011, 57, 413–434. [Google Scholar]
- Williams, V.S.; Pasha, M.K.; Sheikh, I.M. Geologic Map of the Islamabad-Rawalpindi Area, Punjab, Northern Pakistan. The Survey. 1999. Available online: https://pubs.usgs.gov/of/1999/0047/report.pdf (accessed on 10 January 2022).
- Yao, X.; Fu, B.; Lü, Y.; Sun, F.; Wang, S.; Liu, M. Comparison of four spatial interpolation methods for estimating soil moisture in a complex terrain catchment. PloS ONE 2013, 8, e54660. [Google Scholar] [CrossRef]
- Standard, A.J.A.I. D2487-17; Standard Practice for Classification of Soils for Engineering Purposes (Unified Soil Classification System). ASTM: West Conshohocken, PA, USA, 2018.
- 4318–00, (2003); Standard Test Methods for Liquid Limit, Plastic Limit, and Plasticity Index of Soils. American Society For Testing: West Conshohocken, PA, USA, 2018; Volume 4, pp. 582–595.
- Arshid, M.U.; Kamal, M.A. Regional geotechnical mapping employing kriging on electronic geodatabase. Appl. Sci. 2020, 10, 7625. [Google Scholar] [CrossRef]
- Smith, M. Neural Networks for Statistical Modeling; Thomson Learning: New York, NY, USA, 1993. [Google Scholar]
Publisher’s Note: MDPI stays neutral with regard to jurisdictional claims in published maps and institutional affiliations. |
© 2022 by the authors. Licensee MDPI, Basel, Switzerland. This article is an open access article distributed under the terms and conditions of the Creative Commons Attribution (CC BY) license (https://creativecommons.org/licenses/by/4.0/).