Article

Combining Temporal and Multi-Modal Approaches to Better Measure Accessibility to Banking Services

GIS Research Centre, Wales Institute of Social and Economic Research and Data (WISERD), Faculty of Computing, Engineering and Science, University of South Wales, Pontypridd CF37 1DL, UK
*
Author to whom correspondence should be addressed.
ISPRS Int. J. Geo-Inf. 2022, 11(6), 350; https://doi.org/10.3390/ijgi11060350
Submission received: 29 April 2022 / Revised: 9 June 2022 / Accepted: 14 June 2022 / Published: 16 June 2022

Abstract

:
The UK, as elsewhere, has seen an accelerating trend of bank branch closures and reduced opening hours since the early 2000s. The reasons given by the banks are well rehearsed, but the impact assessments they provide to justify such programs and signpost alternatives have been widely criticized as being inadequate. This is particularly so for vulnerable customers dependent on financial services who may face difficulties in accessing remaining branches. There is a need whilst analyzing spatial patterns of access to also include temporal availability in relation to transport opportunities. Drawing on a case study of potential multi-modal accessibility to banks in Wales, we demonstrate how open-source tools can be used to examine patterns of access whilst considering the business operating hours of branches in relation to public transport schedules. The inclusion of public and private travel modes provides insights into access that are often overlooked by a consideration of service-side measures alone. Furthermore, findings from the types of tools developed in this study are illustrative of the additional information that could be included in holistic impact assessments, allowing the consequences of decisions being taken to close or reduce the operating hours of bank branches to be more clearly communicated to customers.

1. Introduction

There is a longstanding and wide-ranging base in the literature concerned with investigating associations between the location of different social groups and their potential or realized access to facilities and services via transport systems. The inclusion of multimodal accessibility metrics and the need to comprehend temporal changes in spatial accessibility have been recognized as key advancements within the overall approach taken to measure access [1]. Transportation systems play a critical role in influencing patterns of accessibility by helping socio-economically disadvantaged groups overcome the constraints caused by physical separation of services from potential demand. As a corollary, poor public transport provision or limited access to private transport can exacerbate such problems. Challenges remain, however, with respect to incorporating public transport schedules into studies seeking to understand the impacts of spatial variations in accessibility levels to service opportunities on potential inequalities in provision.
Recently in the UK, retail bank branch closures are having a profound influence on the vitality of town centers and significant potential impacts upon customers who are dependent upon the types of financial services that they offer. Similar concerns regarding diminishing access to banking services and potential financial exclusion for socio-economically disadvantaged individuals or households have been expressed in other international contexts [2,3,4,5,6,7,8,9,10,11]. In the UK, the impact assessments provided by banks to justify a branch closure and signpost alternative sources of provision have been criticized by some commentators in evidence to parliamentary enquiries as being “after the horse has bolted” type statements that lack any true public input into decision-making processes leading up to an announced closure [12]. In terms of future service arrangements, the information provided is often limited to signposting the nearest post office branch offering limited financial services, the level of broadband availability in the local vicinity, and the extra distance or time needed to reach the next closest branch of that bank. Some include information on the availability, frequency, and duration of a bus service or other public transport options needed to reach replacement facilities, but most do not.
Previous research has highlighted how geographical approaches can be used to gauge service loss impacts upon communities, at least from the perspective of the extra travel required to reach remaining branches and the reduction of choice that often results [13,14,15]. However, an acknowledged limitation relates to the common assumption of a single transport mode, which ignores the impact of service changes for socio-economic groups with no access to a car. Furthermore, the opening hours of facilities within the time constraints imposed by public transport are also often overlooked, leading some to question approaches to measuring access to services based on a “static concept of physical proximity” that fails to incorporate temporal facets of accessibility [16] (p. 81). The primary aim of the current study was to address these limitations by adopting a multi-modal analysis in which a nation-wide assessment of public transport availability, and bank-branch opening hours were also considered. We contend that such research is needed to further understand the implications of banking service reconfiguration on spatial patterns of accessibility which are largely overlooked in the current impact-assessment procedures.
A wide range of methods exist for estimating accessibility; we utilized floating catchment area (FCA) techniques to implement multimodal transport models and to compute place-based accessibility measures that also encompass the granularity of spatiotemporal information on bank opening times as they interact with bus service timetables both during the week and at weekends. To our knowledge, this study represents the first attempt to include a temporal multi-modal framework based on floating catchment models to examine variations in access to banking facilities.
The study first considered the limitations of previous studies that have often ignored variables such as the quality and temporal quantity (i.e., opening hours) of service provision, as well as temporal–spatial constraints imposed by the use of public transport. Secondly, we tested the hypothesis that the impact felt in areas where branches are closing and residents are dependent on a regular and accessible public transport service is likely to be underestimated in studies confined to single mode transport and the assumption of unlimited temporal availability. Thus, we aimed to respond to the call by commentators such as Park and Goldberg [17] for research to explore the inclusion of dynamic variables within accessibility studies so that they can better inform future policy-making concerned with planning service provision. The transport opportunities available to different social groups impact upon their ability to reach financial services, but this is often neglected by those responsible for decisions regarding bank branch closures. By including such considerations alongside the spatial distribution and operating hours of branches, this study aimed to draw attention to the need for service providers to take account of their impacts on those most reliant on the types of financial services provided via physical branch networks.

2. Methods

2.1. Multi-Modal and Temporal Accessibility Approaches

Conventional place-based approaches to measuring accessibility have often involved calculating straight-line or network-based times/distances from fixed demand centers to static service supply points or have computed the number of opportunities located within a given drive-time threshold [18,19,20,21,22]. However, the networking capabilities of GIS and wider availability of demand, supply, and network datasets (many openly available) have led to a burgeoning base of the literature concerning approaches that move beyond static measures of accessibility toward those more analogous to real service-use behavior [23]. Such efforts have been reinforced by information available from social media, smart card data, phone records, or GPS tracking sources that enable real travel routes to be traced and access to points-of-interest data to be measured during a typical day to account for temporally dynamic variations in available opportunities [24,25,26].
Data on opening hours obtained from suppliers’ websites or third-party search engines, using the types of web-scraping tools utilized in this paper, have also enabled researchers to incorporate temporal dimensions and address concerns that accessibility fluctuates over time. Various studies have attempted to incorporate weekday and weekend opening hours and changes in the state of the transport network [27,28,29,30,31,32,33]. Such work has benefitted from the calculation of travel times by using timetables held in General Transit Feed Specification (GTFS) formats that enable time-continuous measures to evaluate service availability across specific user-defined intervals [17,34,35].
The implications of incorporating multiple transport modes and temporal elements have been relatively well studied in the context of grocery shopping and the possible existence of so-called “food deserts” [36]. Widener et al. [37] demonstrated how access measures can be calculated for automobile commuting residents that also consider the time available to access grocery shops. A follow-up study demonstrates how transit schedules can be included to examine how public transport access to supermarkets varies by time of day [38]. Others have included walking distances and times within a multi-modal framework for a wide variety of supply-side/destination types [39,40]. Zhang and Mao [41] focused on the modal-split populations used within multi-modal frameworks and compared spatial patterns in multi-modal access to those derived from single-modal measures.
Such studies have variously shown how including opening hours and travel schedule data can impact on disparities in accessibility and may indeed exacerbate the problems faced by individuals reliant on specific transport modes. To date, however, few studies have incorporated opening hours or temporal aspects of transport availability when considering access to banks. Sonea and Westerholt [42] have included opening hours when studying access to banking services offered at UK post offices. They attached a capacity measure based on the proportion of time that services were provided at post offices compared to those offered at static bank branches. Isochrones were generated around post offices with different capacity measures to reflect the perceived accessibility of these locations. However, their findings draw attention to the need to further consider temporal elements of service supply, as well as geographical distances and the time of travel. However, as recognized by the authors, their work primarily focused on supply-side variables used to examine the efficacy of the government’s set accessibility targets and did not consider public-transport opportunities nor the potential population demand arising during workdays or at the weekends.
Others have shown how temporal changes in public-transport provision can be integrated with opening hours alongside other supply-side characteristics. Järv et al. [43] considered access to food-shopping opportunities to illustrate how commonly adopted “static” location-based accessibility models generally overestimate access and argue for the use of temporal models that consider changing population distribution, transport schedules, and facility opening hours to yield a more realistic picture of social disparities in access. Farber et al. [34] considered public transport access to healthy food opportunities, estimating travel times from census blocks to the nearest supermarket at different times of the day. More recently, multi-modal approaches have been explored to measure potential accessibility to other types of services. Kotavaara et al. [44], for example, compared private car access to primary health services in Finland with multimodal walk–ride–walk trip chains, using openly available data on public transport schedules.
Such research is being facilitated by an increasing availability of temporal data relating to people, transport, and services that can potentially be incorporated into multi-modal network models and access measures [45,46,47,48,49,50,51]. Whilst data are still attached to aggregated areas in many studies, the temporal variability in scores permit such measures to be associated with socio-economic data to provide a more realistic impression of trends in accessibility. Floating catchment area (FCA) models have been widely applied to investigate potential accessibility. In the next section, we briefly review previous efforts to incorporate temporal and multi-modal aspects into FCA models before demonstrating their utility in studying access to banking services in Wales, UK.

2.2. Floating Catchment Area Models Incorporating Multi-Modal Approaches

FCA approaches are essentially gravity models that simultaneously integrate demand, supply, and distance components. Early implementations—for example, by Luo and Wang [52]—were concerned with measuring access to primary-care physicians. Their formulation is widely described in previous publications [53,54], and a worked example is provided by Langford et al. [55] in the context of access to childcare provision. FCA models involve two key steps: In the first, a supply-to-demand ratio is calculated for each facility by dividing its service capacity by the potential demand arising from within a specified threshold distance. The second step involves the calculation of a distance-weighted sum of these ratios within a specified threshold distance of each population demand unit (typically a population weighted centroid of a census tract/administrative area).
Subsequent research has spawned a wide range of variants and enhancements built upon the initial methodology. Xia et al. [56] highlight four main methodological developments:
  • Inclusion of distance-decay weights [57];
  • Adjustment of catchment sizes based on demand/supply-side considerations or population remoteness [58,59];
  • Accounting for competition between providers [60];
  • Incorporating multiple transport modes [61,62,63,64,65].
It is the latter types of enhancements, those that consider multiple transport modes and public transport timetables, that are of particular interest in this study. An assumption of universal private transport (car) is made in many FCA-based studies. Mao and Nekorchuk [61] presented an early attempt to develop a multi-modal approach while considering access to hospitals in Florida by bus and car. They incorporated varying catchment areas, which, in the absence of detailed service utilization patterns for each facility, are based on assumptions regarding the threshold time/distance beyond which a particular mode of transport is not suitable, but also argue that travel times could be empirically derived from regional travel surveys if available.
Data are also needed on the usage of each mode of transport at each population demand point. Mao and Nekorchuk [61] used vehicle ownership at the census-block level to derive a dichotomous split between two subgroups that were both traveling via the same transport network. Travel by bus was crudely modeled by imposing slower travel speeds as compared to cars; no account was taken of routes, locations of stops, or actual timetables and schedules. Their findings revealed differences between single-mode scores (car only) and an equivalent multi-mode score. For example, lower average accessibility was seen in urban areas (with reversals in this trend in rural areas) due to the assumptions made regarding travel mode which then impact upon the population denominators.
Much the same approach was adopted by Yin [66] to examine prenatal care in the state of Georgia for two time slices and allowing travel by car and bus. Limitations in their approach relate to the lack of inclusion of a walking mode and the effectiveness with which public transport modes are incorporated. For example, they assumed a uniform bus speed and access to the entire road network rather than modeling the fixed routes and timetables typical of public transport provision.
Langford et al. [63] enhanced the sophistication of multimodal FCA by incorporating separate car and public transport networks, with timetable-derived travel speeds on the latter, but did not model specific times of travel. These adaptations lead to a separate accessibility score being recorded for each traveling subgroup identified at each demand zone. More recently, attempts have been made to include the detailed public transport schedules alluded to previously within a multi-modal FCA framework to further enhance the realism of its outputs. This can be facilitated by constructing an origin/destination (OD) travel matrix based on actual routes, times of travel, and temporal traffic conditions associated with each travel mode. Such multi-modal FCA approaches are increasingly being used to investigate variations in accessibility in a range of thematic areas. For example, Dony et al. [67] compared access across four modes of transport—bicycle, car, public transit, and walking—to public parks. The patterns revealed amongst travel modes and with comparison to scores derived from single-mode travel prompted them to suggest that “caution must be adopted when choosing a spatial access model and interpreting the resulting spatial patterns of accessibility” [67] (p. 90). There should also be flexibility to change threshold distances if empirical data regarding service use by each mode of transport become available. However, assumptions on threshold times as applied to different modes are still common in multi-modal FCA studies; Tao et al. [68], for example, used arbitrary thresholds when including driving and walking modes to COVID-19 testing sites.
Others have incorporated databases holding information in general transit feed specification (GTFS) to account for door-to-door routing; this includes walking to the public transport access point, travel on the service, and walking to the destination. In some instances, census or household travel-use surveys can be used to gauge the demand for different services by population cohorts. These can provide potentially more accurate estimates of the numbers likely to use each travel mode. Furthermore, some limitations of earlier studies have been addressed by combining detailed network datasets and public transport timetable data to develop real-time FCA models to a variety of different services [69,70,71,72,73,74]. Authors such as Ma et al. [75] and Tao and Cheng [76] have used Google Map or Baidu Map’s application programming interfaces (APIs) to derive accurate travel times for cars and public transport inside a multi-mode FCA approach. This is claimed to better account for the likely modes of transport adopted by groups such as the elderly when accessing health facilities.
Recent research has considered the inclusion of active travel modes into multi-modal FCA. Zhou et al. [77] and Xiao et al. [78], for example, adopted four modes (car, walking, public transport, and bicycle), using data derived from a web mapping platform. Khakh et al. [79] drew on detailed configurations of sidewalks, trails, and pathways to create a walkable network and included walking catchments alongside private and multimodal transit (bus and rail) in a study of access to primary healthcare in Calgary, Canada. As is the case in the current study, researchers have also used GTFS data to calculate travel times by bus and have set different catchment sizes for each mode to derive different access scores for each cohort [80]. Guida and Carpentieri [81] used multi-modal FCA to examine variations in access for the elderly to primary healthcare in Milan during the COVID-19 pandemic. Park et al. [82] introduced temporal elements to both demand and supply, as well as the dynamic nature of traffic scenarios to calculate temporal FCA scores to electric-vehicle-charging stations. Xing et al. [65] considered access to green spaces and the implications of different travel modes, with parks being assigned catchment sizes dependent upon the travel mode.
Despite this considerable research activity, few studies to date have included the opening times of facilities as in the current study. Li et al. [70] considered access via walking and public transport to multiple services in Xiamen, China, and adopted separate weighted decays and thresholds based on a household travel survey; however, facility opening hours were not addressed in their study. Fransen et al. [83] formulated a commuter-based FCA approach that included trip-chaining and suggested differences in access scores between an original model; this enhanced version is a consequence of accounting for more complex travel behavioral patterns. Paul and Edwards [84] adapted FCA models to consider time windows (i.e., doctor’s hours at health facilities). Although the work presented in this study still does not fully address the call for “dynamic, temporally-aware versions of the floating catchments” to encapsulate commuting behavior, operating hours, and temporal travel speeds [23] (p. 23), it does demonstrate the need to include temporal elements into FCA models and draws attention to their importance in determining service access amongst population groups reliant on public transport who are often overlooked when considering impacts of high street bank closures.

2.3. Methodology and Data Acquisition

This research presents a comparative analysis of spatial patterns in accessibility arising from various configurations and degrees of sophistication of FCA modeling, as summarized in Table 1. All of the models implemented here adopt a multi-modal approach, whereby the population recorded at demand sites is split into separate cohorts that then travel via independent public and private transport networks toward a common set of service delivery points, namely the bank and building society branches. Private-mode travel assumes all road links are usable, with travel time to traverse these links determined by speed limits associated with national road classifications. Public-mode travel uses only road links associated with recorded bus routes, with the travel time between access nodes (bus stops) established from timetable data. All models use the population-weighted centroids of the UK’s smallest census tracts (Output Areas) as the demand sites, each of which typically represents around 125 households.
Model 1 is a use case widely seen in conventional FCA approaches whereby the assumption is made that supply sites are always available (i.e., open). Furthermore, although private and public modes of travel use independent networks and speeds, no temporal constraints are imposed. Specifically, when traveling by bus, the fastest possible route between a demand and supply pair is passed on to the FCA model, regardless of the time of day or day of the week on which this journey takes place. Bus routes do however incorporate, where needed, walking elements to (a) reach a bus stop, (b) traverse between stops while switching routes, and (c) reach the destination point. Finally, in this model the supply points only record the presence of a bank or building society branch. This means that the supply sites are undifferentiated in terms of their capacities or service levels, and resultant FCA scores report the number of reachable sites per person within the chosen catchment threshold.
Although Model 1 is the baseline scenario considered in this analysis, it nevertheless represents an advancement on many previously reported FCA studies where a single mode of travel, unitary site counts, and always-available network travel are commonly adopted. As Table 1 indicates, Model 1 already offers improved sophistication through the adoption of multi-modal travel and also by incorporating bus network travel speeds derived from real-world timetables.
Model 2 further raises the level of sophistication by using the total opening hours of bank and building society branches as a supply-side variable. The aggregated hours per week is recorded for each site, thereby adding a temporal capacity element into the modeling process. This, in turn, allows the FCA outputs, which now report access to available banking hours per person, to reflect situations such as the widely reported reductions in opening hours of branches even when the sites themselves remain nominally open. Nevertheless, assumptions regarding the branches being always open and, therefore, available, regardless of the actual travel time, remain; this is a limitation that Model 3 aims to directly address.
In Model 3, the representation of the service supply is further developed to take account of the specific opening times, day by day, at each branch site. Thus, a temporal availability constraint is added to the temporal capacity consideration. In the case of determining private mode access, for example, a specific time of travel can now be specified, and although branches will remain always reachable by car, they would not contribute toward an FCA accessibility score unless also identified as being open at the time when the car traveler arrives. This sophistication is further magnified in the case of the public transport FCA scores because interaction between branch opening times and timetabled bus services is fully considered. This means that bus routes are only deemed “viable” if they can provide an arrival time at a branch site within its specified opening hours, or, alternatively, a less rigorous temporal constraint may be set to include only those bus routes in the FCA calculation that deliver residents to supply sites between the most commonly adopted weekday branch opening hours. As Table 1 indicates, Model 3 has thus added further sophistication to all three key elements of the Two-Step Floating Catchment Area methodology.
By incorporating public-transport timetable information into FCA models, we aim to show how reported accessibility patterns can vary when compared with simpler models that assume private-only transport. We also aim to identify which locations in our chosen study area express inequalities in accessibility that result from the combination of bus service provision and temporal variations in opening hours. To implement such models as just described requires several key data resources and software capabilities. First, the temporal availability and spatial location of bank and building society branches (Figure 1). Second, the distribution and magnitude of demand populations, with an estimate of the split adopting private and public transport modes. Third, a network capable of supporting analyses of routes for both car and bus travel. Fourth, detailed public transport timetable data. Finally, a software environment that facilitates the integration of all these data and provides the capability to trace network routes within temporal constraints. Each of these requirements and the solutions adopted are described briefly below.

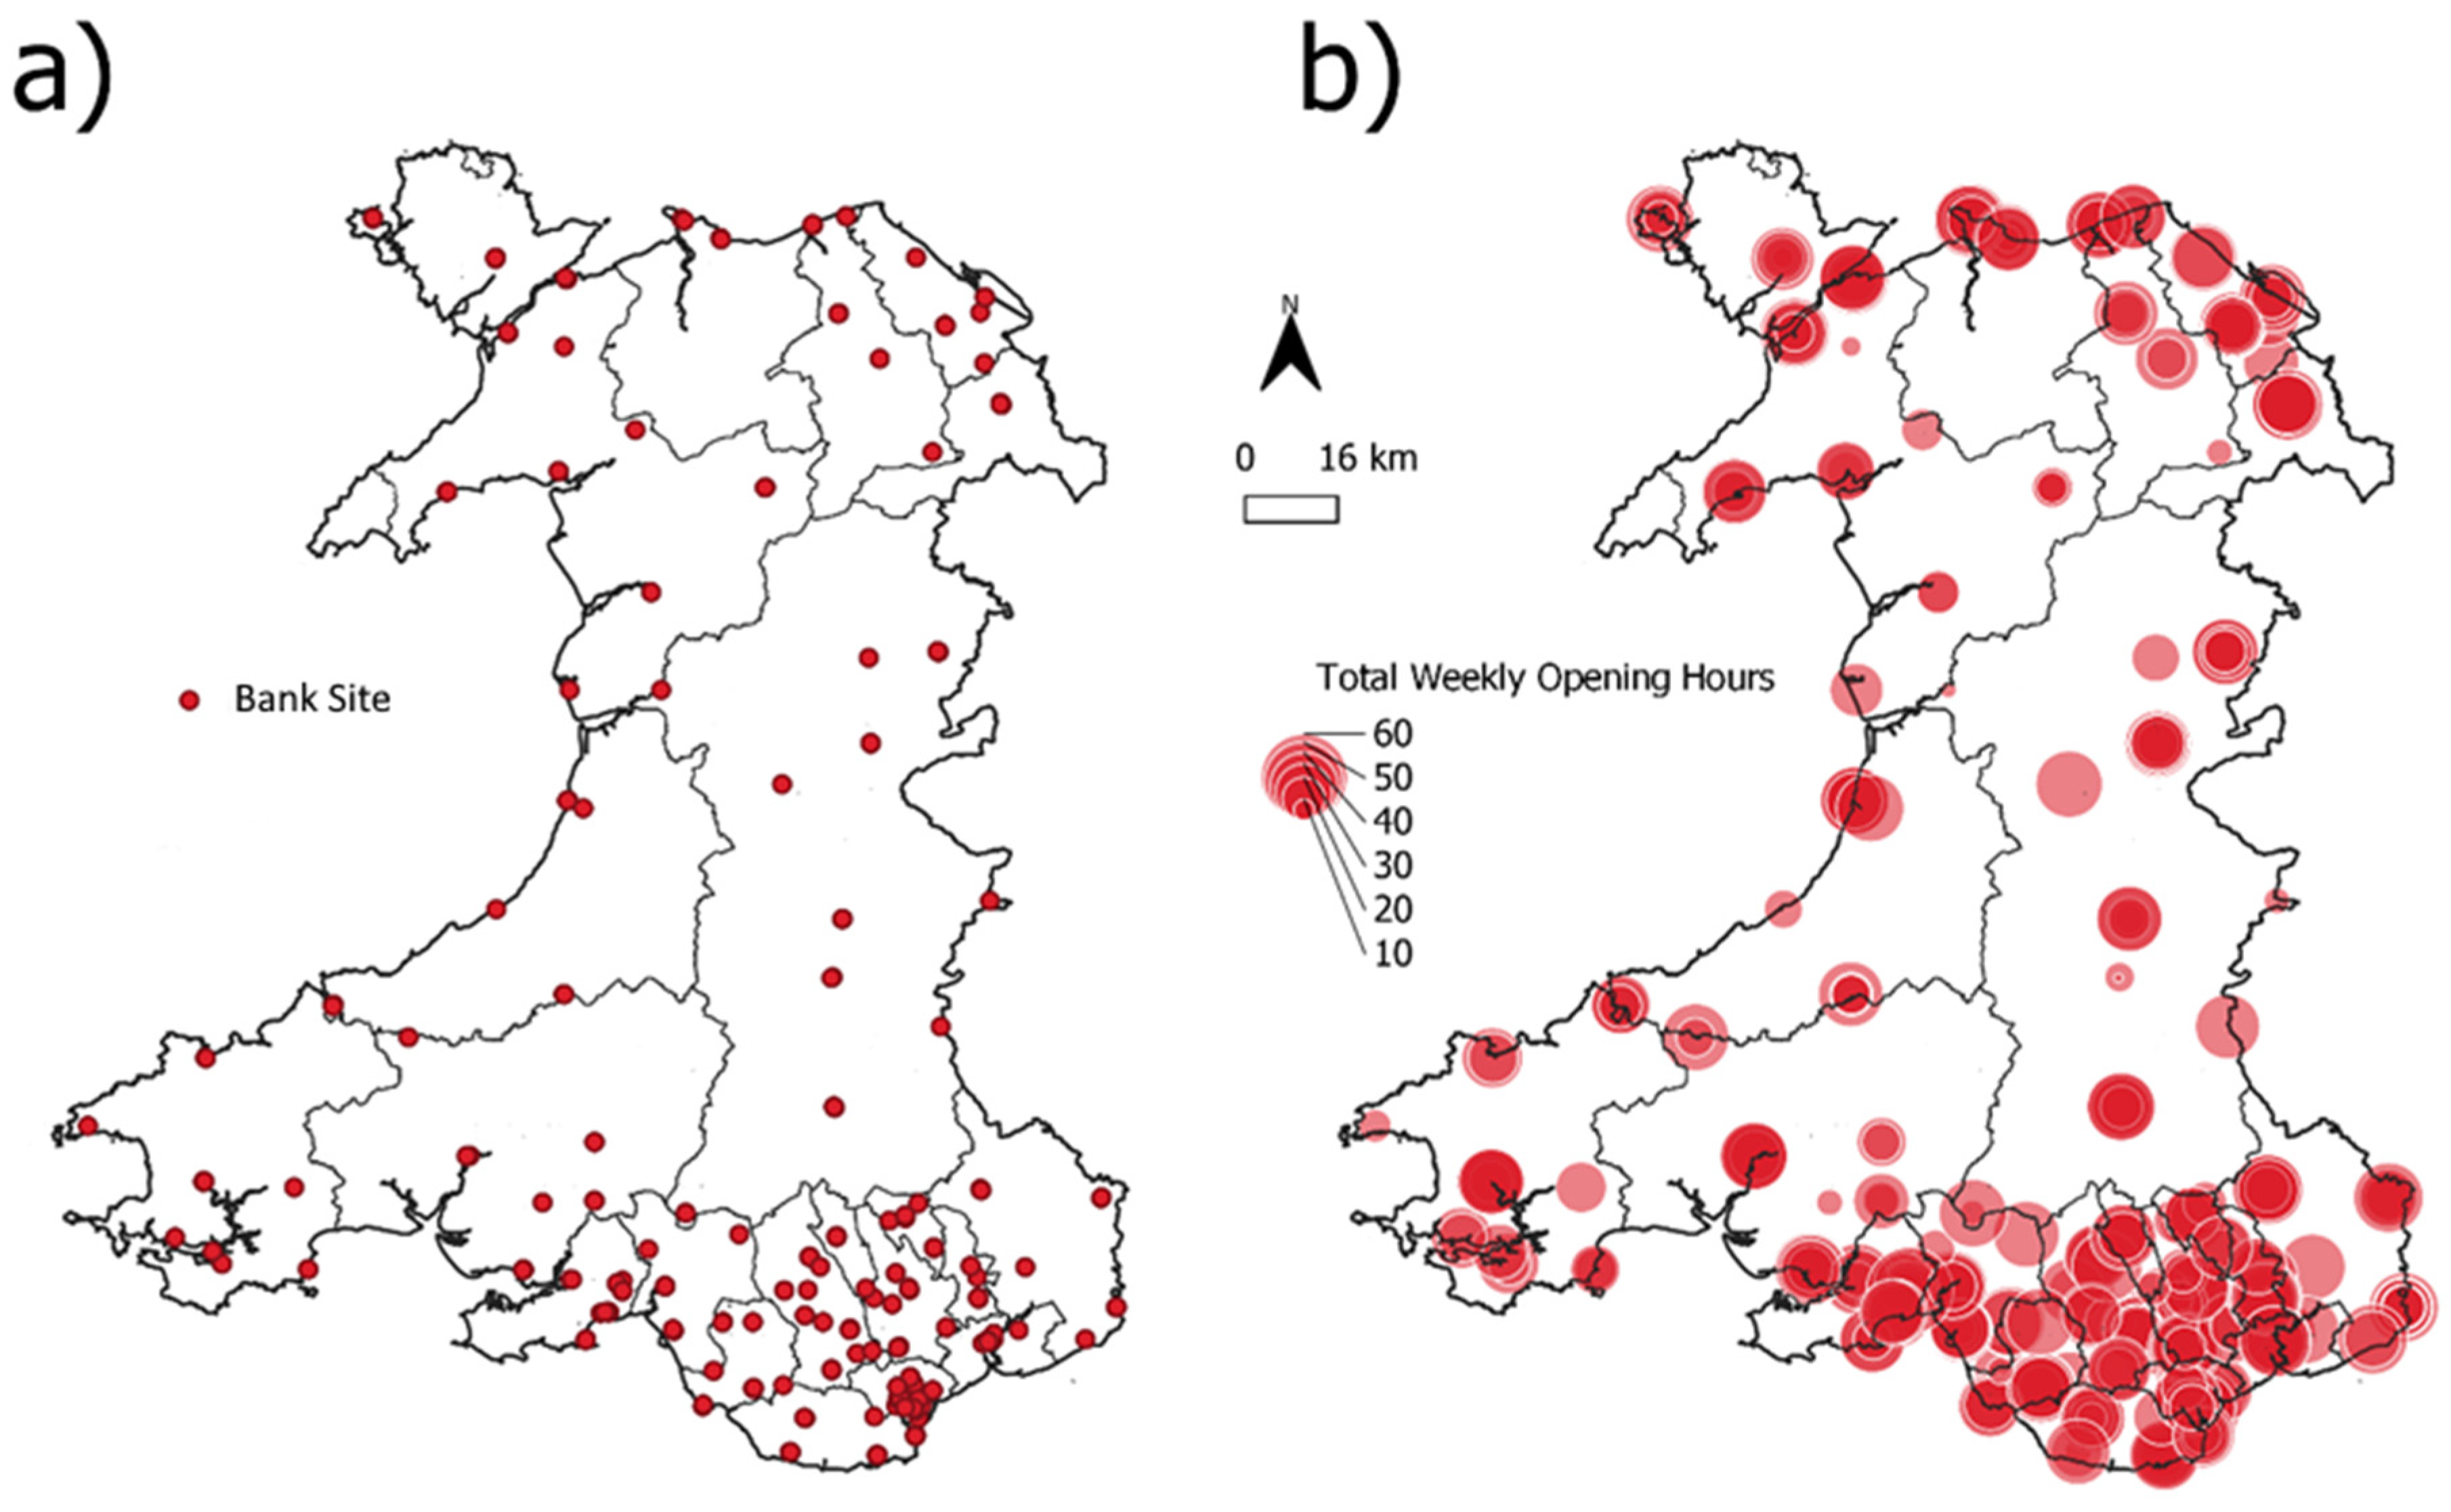
2.3.1. Branch Opening Hours

At the time of study, no freely available dataset existed in the UK to provide information on branch opening hours. Services such as the Google Platform API [85] can provide this data at a set cost per query, but alternative approaches are available that avoid such cost implications. In this instance, it is possible to obtain branch opening hours through each bank brand’s dedicated “branch finder” website, or alternatively via websites that provide collective information [86,87,88]. We chose to adopt a web scraping solution to gather data from these sites whilst adhering to the terms and conditions of each website and respecting the ethical concerns outlined in previous studies [89].
A URL is required to direct the script to the desired page from which data are to be sourced. Ideally, webpages fed into the script adhere to a consistent structure, as this allows the system to methodically work through a set rather than requiring each page to be individually presented. The site used to gather bank opening hours suited this approach, using a single URL which is then adapted to navigate incrementally through the entire site, driven by a Python script. Although no further information was gathered through scraping, if it were available in a consistent manner, then additional supply-side variables could be incorporated into our FCA models to further elucidate the quality or range of service offered at each provision point. Once extracted and consigned to a database, the total number of weekly hours was then assigned as a supply-side variable in the multi-modal FCA model described previously. The sort of information that is acted upon by this process and the potential variability in branch opening times is illustrated in Figure 2.

2.3.2. Population Demand and Modal Split

To execute multi-modal FCA models, it is necessary to determine a demand population associated with each travel mode. The method proposed by Langford et al. [63] was adopted, based on household car ownership reported in the 2011 UK Census of Population. This assumes that residents in Output Areas (OAs) with low car ownership levels are more likely to use public transport, with a modal split computed by applying Equations (1) and (2) to each OA:
P o p p u b l i c = ( P × A ) + ( 0.25 × P × B )
P o p p r i v a t e = P P o p p u b l i c
where P o p p u b l i c   and P o p p r i v a t e are the modal population counts, P is the total resident population, A is the percentage of households reported as having no car or van, and B the percentage of households reported as having just one car or van. It thus assumes that all residents in households with no access to a car will travel to nearby banks via public transport. Furthermore, 25% of those with just one car will also do so, founded upon the notion that a single car is not always available. These data, based on subjective decisions, could be replaced by information obtained from household behavioral surveys if this were to become available. Total population, P, was a mid-year population estimate obtained for 2020, but household car-ownership levels could only be derived from the 2011 census.

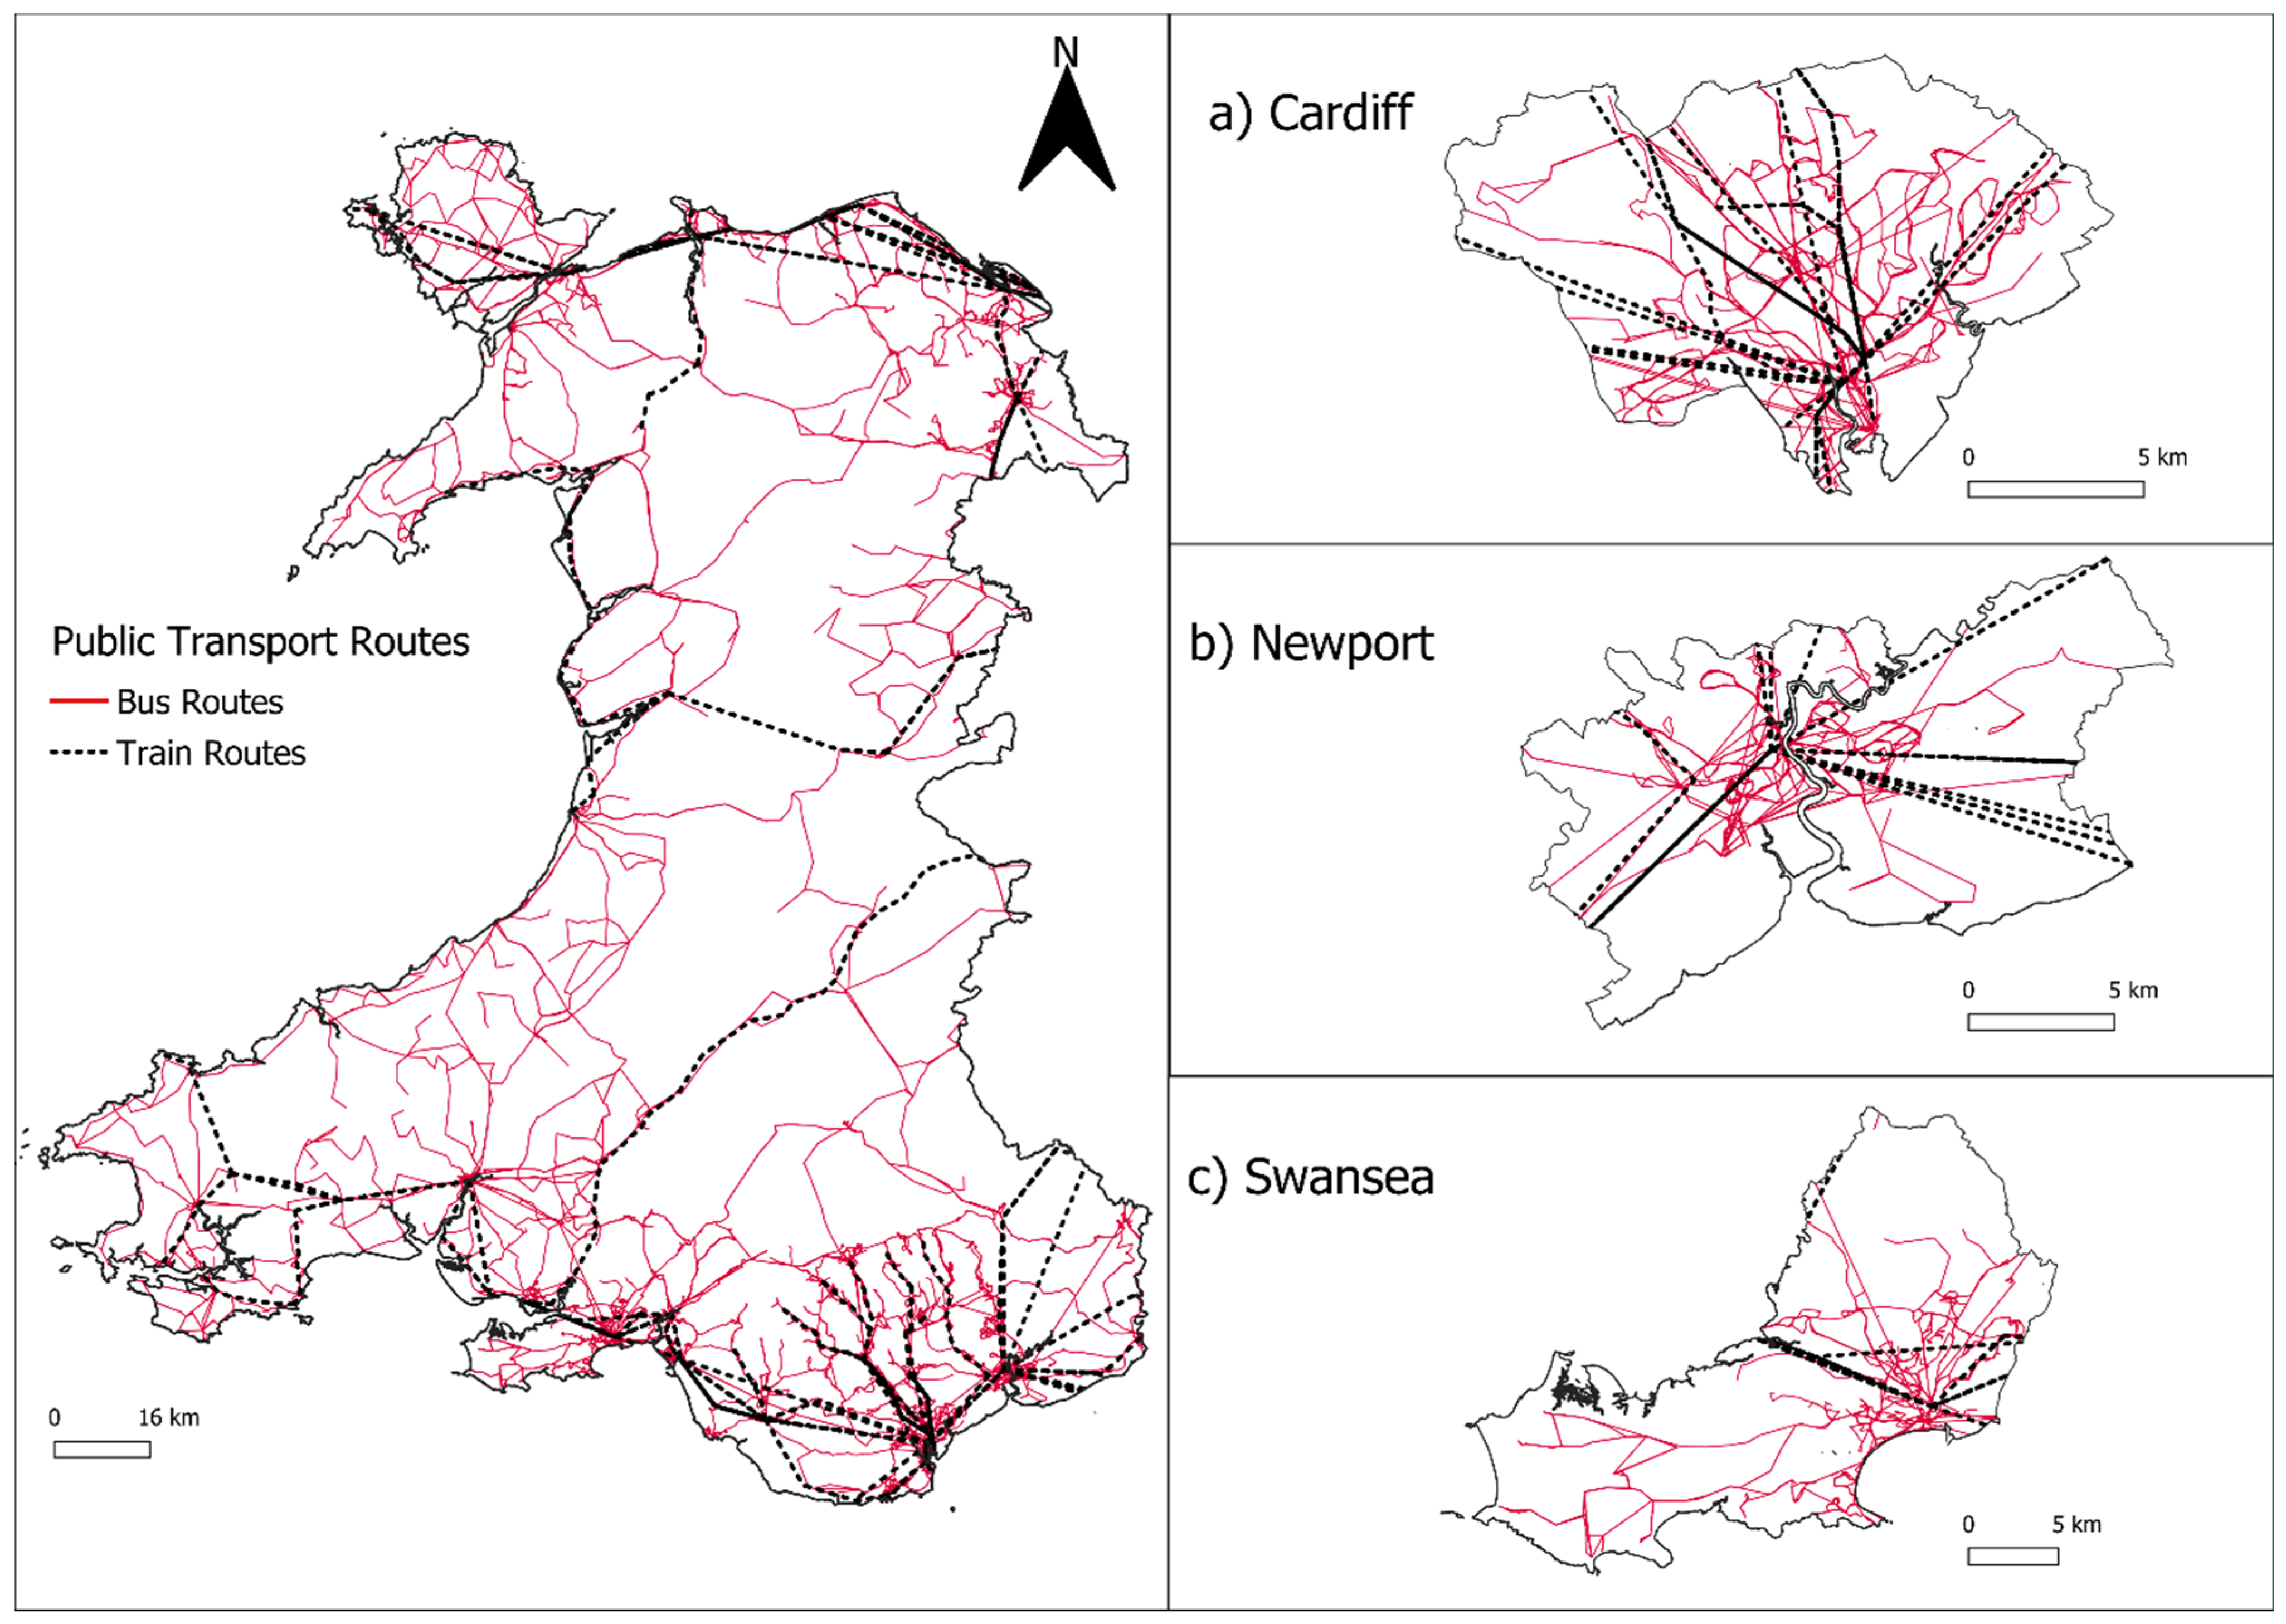
2.3.3. Public Transport Timetables

This information is critical in developing the temporal elements of the FCA models described above, as well as for facilitating multi-modal travel. In fact, three data components are required to achieve these objectives: a topological encoding of the road and path network; the location of all bus stops and train stations which act as access points for public travel; and a full account of all routes, trips and schedules associated with currently operating bus and rail services. The acquisition, encoding, and utilization of this information is a non-trivial task, as briefly described below, the elements of which also relate to the adopted software solution environment, Open Trip Planner (OTP), which is discussed in further detail afterward.
Information regarding public transport schedules was acquired from two sources and dated August 2021. Bus data were downloaded from TravelineData [90] in TransXChange format. Heavy rail, which offers a convenient public transport solution between major cities and towns, was downloaded from Rail Delivery Group [91] in CIF format. Both sources required reformatting into the General Transit Feed Specification (GTFS), and this was accomplished by using an R package, UK2GTFS [92]. GTFS is an open data format encoding public-transport stops, stop times, routes, agencies services, and timetables/calendar dates such that it can be used to build a full public transport network. This information is linked to a detailed road and path network downloaded from OpenStreetMap, all of which are used to create a graph to be acted upon by the routing engine of Open Trip Planner.
Figure 3 illustrates the public transport network derived from GTFS data that was then utilized by Open Trip Planner to compute travel times between supply and demand sites, as required for FCA modeling. Examples of route schedules are demonstrated in Figure 4. A total of 900 bus and light rail services and 439 heavy rail services operated across Wales at the time of the study. All had fixed routes and scheduled operating times that imposed constraints on the possible routes existing between OA demand centers and bank and building society branches at specific times of the day or week. Furthermore, when OTP is asked to compute a route, a maximum walking distance is specified in respect to reaching a transit stop, possible interchange between services, and getting to the final destination point as alluded to earlier. Based on findings from previous research [93,94,95,96], we adopted a value of 5 min or 400 m for this parameter. In other words, trip times are only returned by OTP if they do not exceed this limit within any of the three situations listed above.

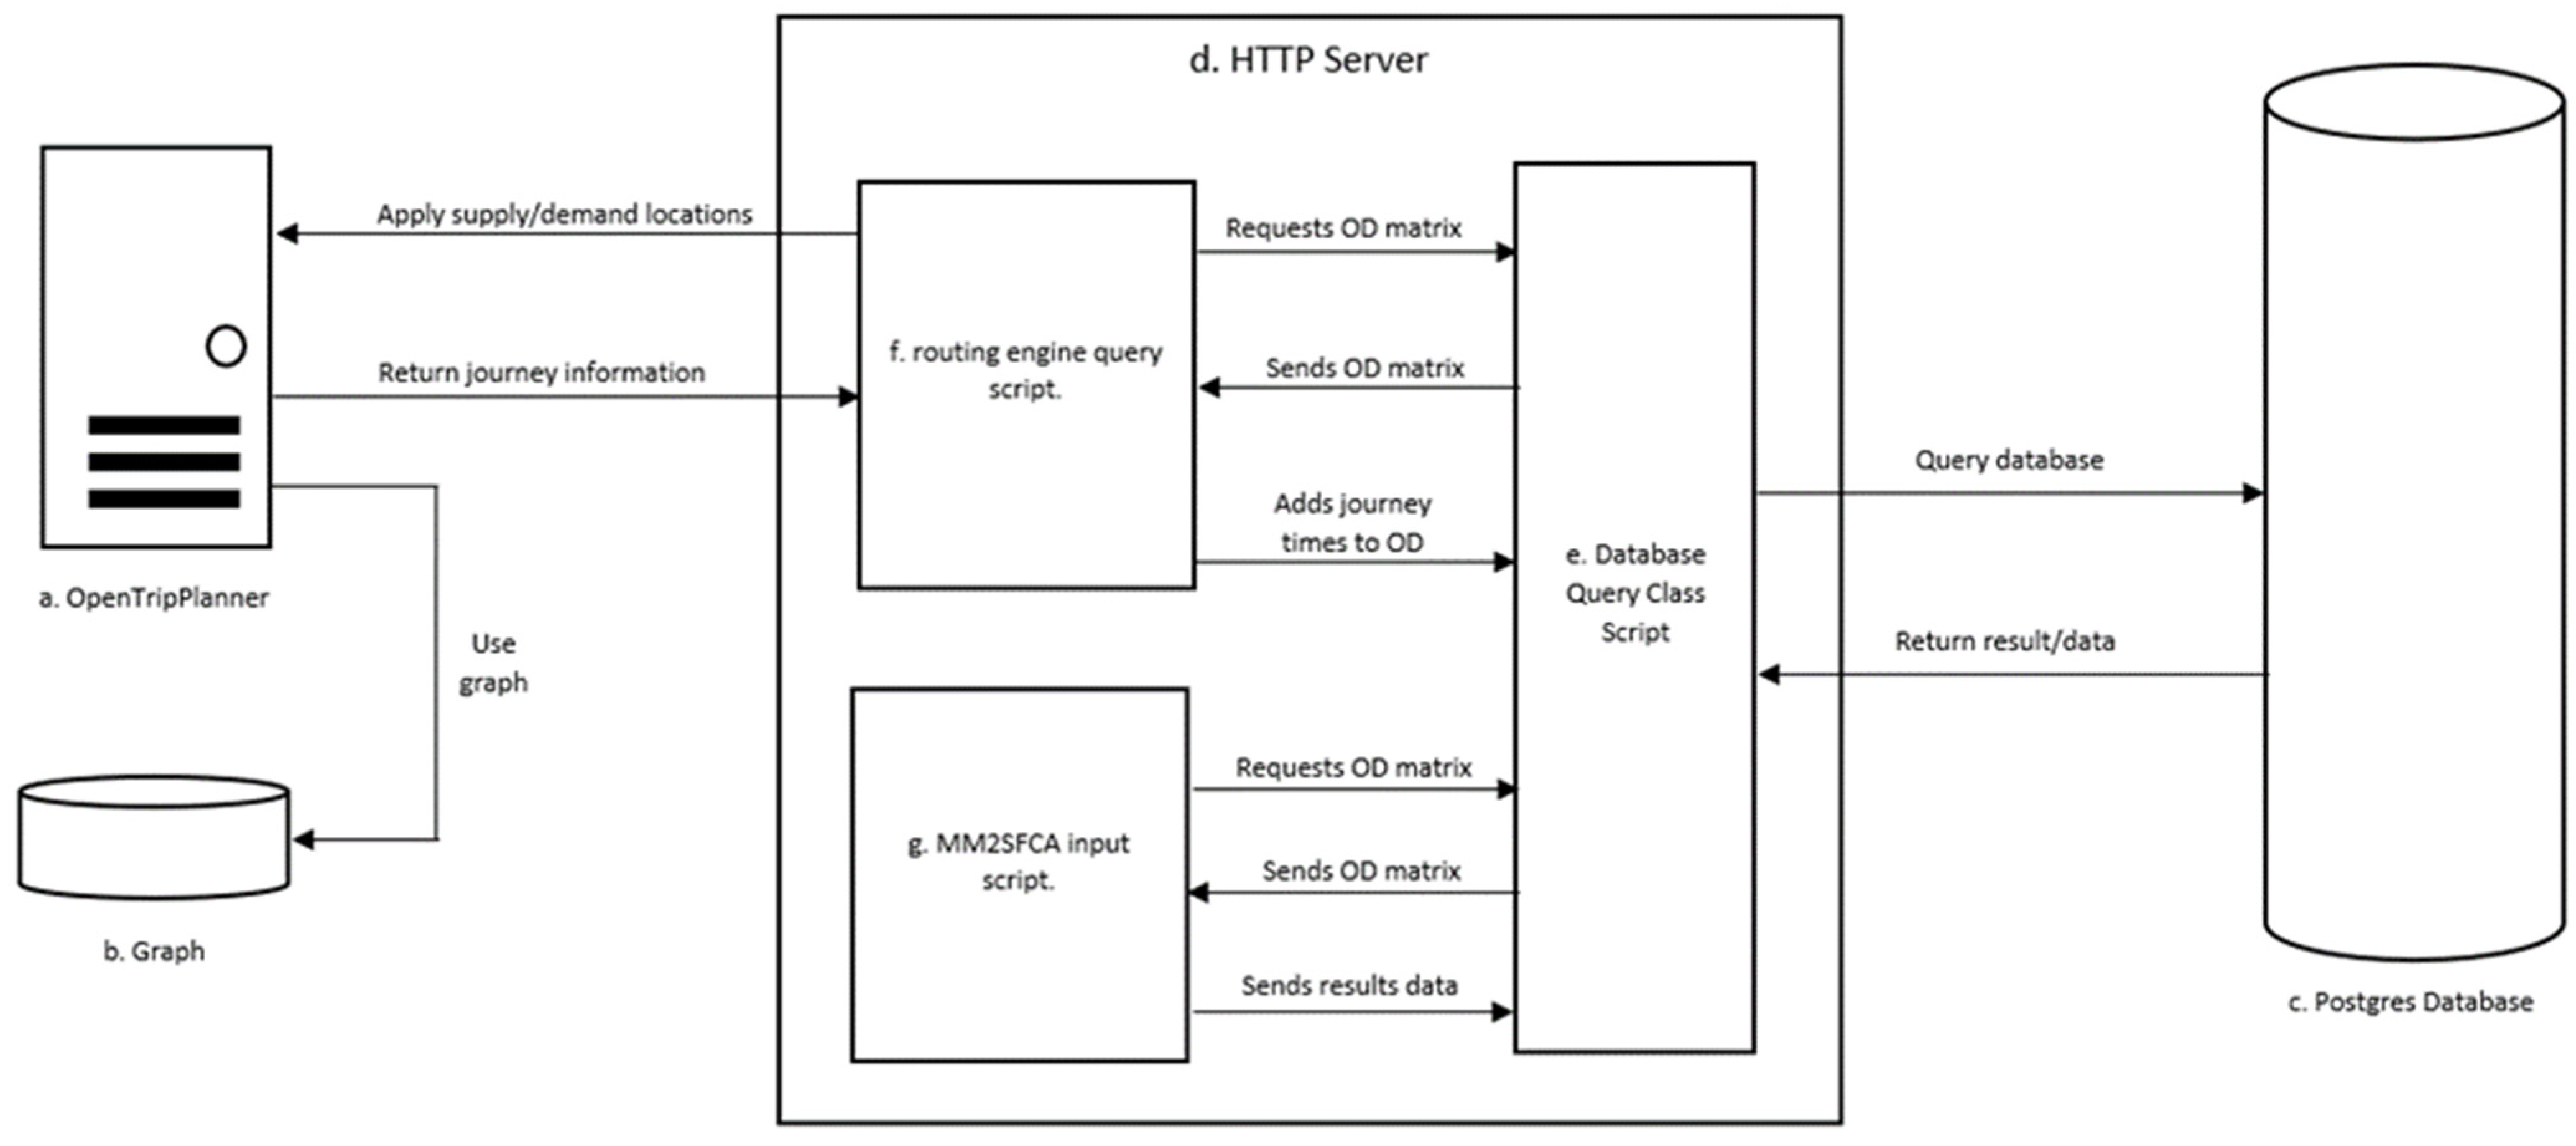
2.3.4. Software Environment
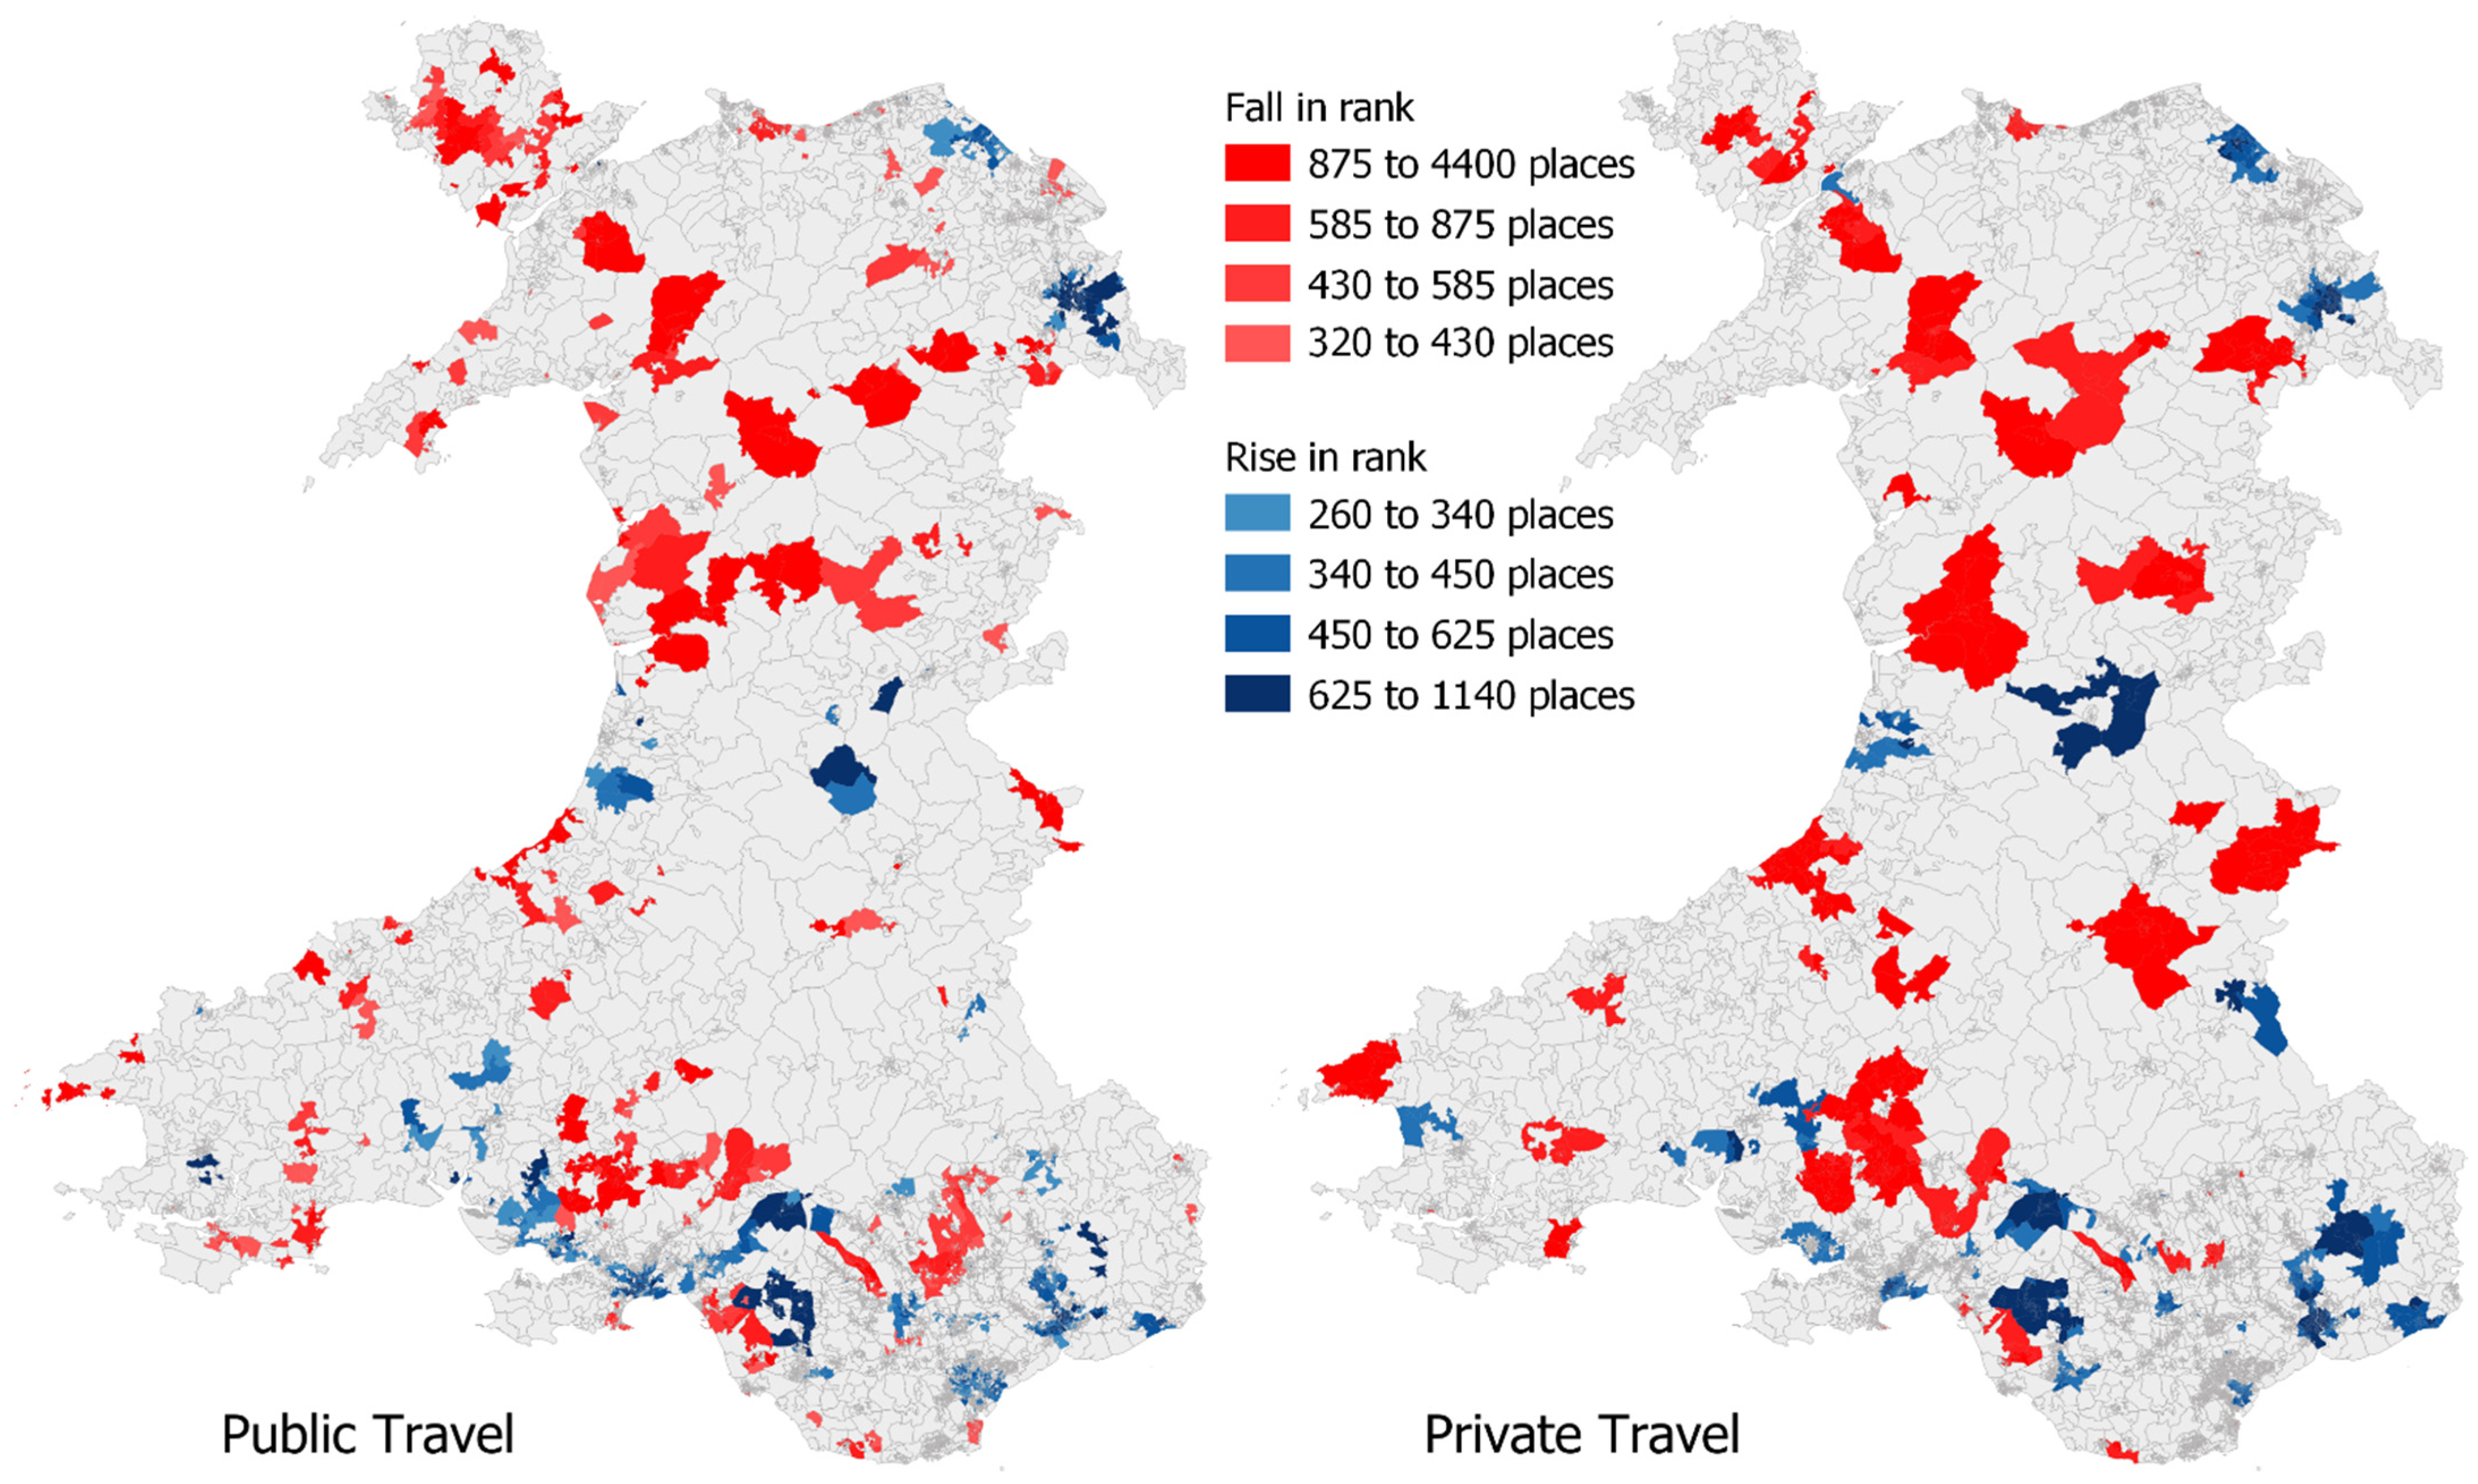
All FCA models were executed by using a software solution built on open-source software and operating through a client–server infrastructure, the key components of which are illustrated in Figure 5. Its design, associated data flows, and detailed mode of operation are more fully explored and explained elsewhere [97], thus only a summary is presented here.
The most critical component of the system is the routing engine (item a in Figure 5) that constitutes a part of Open Trip Planner (OPT). OTP is free and open-source software (FOSS) that can be used to calculate routes and journeys from origin to destination for multiple transport modes [98]. Given sufficient information, OTP can compute results for private car; walking and cycling; and for public transport via bus, light rail, heavy rail, and tram. OTP analyzes a graph (item b in Figure 5), which is a topological network it constructs for itself from public transport data supplied in GTFS format and from a network of roads and footpaths sourced from OpenStreetMap [99]. Once fully configured, viable routes are returned for queries issued through its RESTful API. These are obtained by submitting URLs carrying parameters to identify the desired mode of travel; the journey start and end points; and any time constraints, such as the need for departure or arrival within a stated timeframe. Computed routes are based on Dijkstra’s algorithm and the A-star algorithm. Journey times for private car are based on road speeds supplied in OpenStreetMap data, and no account is made for potential congestion. Journey times for public transport are computed directly from the GTFS timetables.
The second key component is the PostgreSQL [100] database with PostGIS [101] spatial extension (item c in Figure 5). The database stores information such as the OA population-weighted centroids, bank and building society branches, results of FCA modeling outcomes, and various intermediate items of data used during the modeling process. An HTTP server (item d in Figure 5) holds control scripts, source codes, and support libraries which, together, control and drive interactions between the routing engine and the spatial database. FCA models are executed by using a combination of PHP coding, SQL queries issued to the spatial database, and HTTP GET requests issued to the OTP routing engine.
When applying the FCA models, it was recognized that travelers would typically expect the time taken to reach a branch when traveling by public transport to be greater than if traveling by car. To account for this, the floating catchment size specified for public transport was set to 30 min, while that for private-car travel was set at 15 min. Furthermore, all models would include trips where a branch could be reached through walking alone, subject to the 400 m limit described previously. All routes and times between demand centers and reachable branches derived from OTP are subject to a distance-decay function when fed into the FCA computation (the “enhanced” two-step floating catchment area method of Luo and Qi [57]). A simple linear decay function was used, as no empirical evidence was available to suggest any more appropriate alternative.

3. Results

The outcomes of applying Model 1 and Model 2, as described above, are traditionally presented though the display of a choropleth map, which is used to visualize how FCA scores vary geographically across the region. Of particular concern in this study is an understanding of how the additional refinement of Model 2 (i.e., using a temporal capacity as the supply-side variable) might influence such outcomes. Unfortunately, drawing meaningful conclusions through a visual comparison between their respective choropleth maps is difficult because each model reports a different property: Model 1 returns the number of available branch sites per population, while Model 2 returns the available branch opening hours per population. When displayed as choropleth maps, both scores show broadly similar patterns, and determining if differences between themat are of genuine significance or simply artifacts arising from the chosen class boundaries is problematic.
To better isolate and focus upon the impact of the additional temporal capacity refinement, all FCA scores were first ranked, and then the difference in ranking between the models was determined. Those OAs whose rank increased or decreased the most when a temporal capacity was introduced were identified and mapped (see Figure 6) to highlight where such impacts were the greatest. OAs exhibiting a substantial drop in rank were found to be almost exclusively located in remote rural areas of Wales. This evidence supports the suggestion that, although some rural branches may have remained open rather than closing altogether over recent years, their increasingly limited operating hours have most likely impacted upon the quality-of-service provision being experienced within rural communities. Whilst some differences are evident between private-transport and public-transport users, with public travel tending to show impacts in the more remote areas, the overriding pattern remains much the same, and this is reasonable given that both cohorts seek access to a common set of service delivery points offering the same hours of service. OAs showing a substantial rise in rank were concentrated in major urban areas and town centers; this is what might be expected, suggesting that the most generous branch opening hours occur where the population base is most able to sustain this high level of service provision. Overall, patterns displayed in Figure 6 highlight the potential bias that may exist in previous FCA studies that fail to account for service operating hours, and they also clearly suggest a rural–urban divide in respect to this issue.
The types of analysis and information obtainable from the application of Model 3 where temporal restrictions are further developed is presented in Figure 7. When using this model, a specific time of the day and day of week for which to report FCA accessibility scores are specified. During the computation of the scores, any candidate supply site must meet the following requirements: (a) be open at the time of arrival—this constraint affects both private and public modes of travel; and (b) be reachable—that is, have a viable public transport trip that can deliver residents to the site whilst it is open. Private travel is unaffected by the second constraint, as car travel can take place at any time.
To illustrate potential outcomes, we selected three different time periods on three different days—, Tuesday at 11 a.m., Friday at 2 p.m., and Saturday at 11 a.m. The first is a time when most branches were known to be open, the second is a time when it was anticipated that the restricted workday hours of some branches would be likely to have an impact, and the third was selected to help illuminate the limited availability of banking services on the weekend. Simultaneously, public transport schedules and frequencies are also likely to play a significant role in the third scenario. We focused the maps upon the Pembrokeshire peninsular to better depict the level of detail revealed at the OA level. A common legend is used for the set of public-transport FCA scores (Figure 7a–c), and again for the set of private transport scores (Figure 7d–f); however, the breakpoints vary between the two modes.
Clearly, and unsurprisingly, lower accessibility scores are returned in respect to public transport as compared to traveling by private car. It has been noted before [64] that, in a multi-modal FCA model private transport, scores may increase when compared to a unimodal model, as they benefit from the modeled lower demand placed upon supply points from public-transport users. This interaction is prevalent throughout the results, such that wherever private transport scores increase/decrease this may be attributable either to a diminished/enhanced capacity of public transport uses to reach the supply sites or to direct variance in supply site capacity and availability. For example, private-travel FCA scores vary notably in the extreme northwest peninsular between the Tuesday and Friday cases—this appears to be attributable to the opening hours of local branches in this instance, along with difficulties for public transport travelers to reach these services at these times. Overall, the patterns of accessibility recorded for public transport for Tuesday at 11 a.m. and Friday at 2 p.m. were quite similar, while those for private transport are less so, thus suggesting that varying operating hours are driving the results for private transport and that opportunities that become available for car travelers are not equally available to public-transport users due to the transport constraints imposed upon them by scheduled services. While there is evidence that branch opening hours are an important element of temporal accessibility (of the 464 branches in Wales, the number identified as open at 11 a.m. on Tuesday was 443, dropping to 339 at 2 p.m. on Friday and 170 at 11 a.m. on Saturday), this example illustrates that the inability of public transport uses to reach those branches that are open is also a significant factor in determining the accessibility to services that they experience.
Such interactions between opening hours and transport availability are also highlighted in the analysis of scores determined for weekend services (Figure 7c,f). As noted above, only around on-third of branches are open on a Saturday morning, and this inevitably leads to reduced FCA scores. Even for private travelers, accessibility contracts to those areas located around market towns, with no service available within a 15-min drive time for many rural communities. With the added limitations imposed by public transport services, access for those reliant on travel by bus is severely limited, with the remaining pockets focused on market town centers and along primary bus routes. The lack of branches remaining open in rural communities, together with the difficulties experienced in reaching those that remain open in market towns, leads to the poor provision illustrated in Figure 7c.

4. Discussion and Conclusions

4.1. Strengths of Adopted Approaches

This study was conducted in the context of the types of information currently being relayed to potential customers after a decision to close a bank branch has been made. Often this is restricted to the signposting of alternative locations at which services for that bank are available to existing customers and some basic information on how far individuals will need to travel or whether public transport may or may not be available to access such sites. Such assessments do not routinely consider the operating hours of those services that remain following reconfiguration in relation to public transport schedules, factors that may disproportionally impact on vulnerable members of the community or those more reliant on public transport services who need to travel further to access face-to-face banking services. In this paper, the aim was to highlight how accessibility measures (based on floating catchment area tools) can be used to examine such impacts. The weekday and weekend travel-time scenarios are illustrative of the types of analysis that can be used to examine potential access on chosen days/times and go beyond what is currently provided by banks to assess impacts on accessibility.
Another key advancement proposed in this study was the inclusion of detailed public-transport timetable information within a methodological framework that has enabled a consideration of the needs of customers who may be more dependent on such modes of transport. By incorporating such information in conjunction with the opening times and availability of banking services, the FCA measures developed have provided more insights into the types of factors that need to be fully considered and communicated to customers prior to decisions being made to close a bank or building society branch. The impact assessments used to defend programs of closures or changes in hours of opening need to include a holistic assessment of the accessibility implications of the reconfiguration of banking facilities that includes, if necessary, changes in the timetables of service delivery. Furthermore, they also need to develop measures that can easily understood in terms of the supply-to-demand ratios and geographical scales that have been routinely used in previous attempts at measuring accessibility.
For this paper, we attempted a nation-wide study that incorporates opening times of banking facilities with public transport data timetables and a census-based estimate of bus/car travelers that addresses some of the limitations of previous approaches to measuring accessibility and which points the way to the types of analysis that provide a more comprehensive assessment of the impacts of proposed or implemented closure programs at detailed spatial scales. We posit that such visual (map) representations could be easily included in the material provided to customers but may also aid the initial decision-making process regarding banks’ reconfiguration programs regarding which bank closures would have the least impact in terms of overall accessibility nationally.

4.2. Enhancements to This Approach

There are several ways in which the analysis presented here could be enhanced. Firstly, in common with many of the previous studies in this field, we have assumed that demand originates from census-derived population weighted centroids and therefore that demand is based on residential nighttime population totals summarized at a single reference point. The potential drawbacks of using population weighted centroids in potential accessibility applications have been reiterated in a recent study examining access to GPs in Newcastle [102]. The implications of using different representations of population distribution in floating catchment area modeling were discussed by Langford and Higgs [103], and the emergence of new data sources that could enable more detailed estimates of population to be included at finer spatial scales within multimodal approaches has been highlighted in a more recent study of access to several different types of services/facilities in three US cities [48]. The implications of using ambient populations that take account of changes in daytime population distribution when examining temporal variations in accessibility by using public transport data schedules have been alluded to in previous studies [104].
Furthermore, we have no information on trip chaining behavior, trip purpose, real-time traffic conditions, and wider aspects of the quality of transport provision. It is likely that people are combining trips to bank branches with other sorts of daily activities and are often accessing such facilities from their workplace during a typical working day. This has been shown to impact on accessibility scores in other contexts, for example, in relation to access to supermarket opportunities by using a measure of cumulative opportunity [105]. Previous studies have shown how these types of factors can be incorporated within spatial–temporal approaches to measure patterns of accessibility to these types of non-work destinations [106].
Such research can be further enhanced by incorporating traffic information available from routing and public transit APIs which may more accurately represent the disparity between road and transit times when accessing facilities [76,107,108]. Aligned to this is the need to incorporate temporal variations in transit accessibility associated with travel time uncertainty to provide a more realistic estimate of public-transport travel times [50,109]. Because of the ethical and privacy considerations, we have no information on the actual banks used by customers nor the percentage of residents visiting banks by modal choice, so we have resorted to proxies that involves measuring access for all people to the bank and building society branches in the threshold times considered.
Individual activity patterns that include travel behaviors and information about customer needs and patronage would enhance the types of analysis presented in these types of studies, including the choice of parameters used in the FCA models (e.g., the thresholds adopted or the calibration of distance-decay functions by mode of transport). For example, such research could be enhanced by considering refined measures of modal splits and variable threshold distance or travel times, based on origins and/or travel mode, used to implement the models, perhaps drawing on detailed household travel surveys collected by relevant organizations [41]. This could further guide the choice of distance-decay function parameters to be used in the FCA models, which have been shown to vary by transport mode and purpose [110]. Should the modal split of customers to these types of facilities be made available, recent studies have shown how transport modes such as cycling, for example, can be considered within multi-modal GIS approaches [111]. Additional assumptions relate to the use of assumed speeds through the road network used to estimate time taken to access facilities and the need to incorporate congestion and other factors related to the state of the transport network.

4.3. Future Developments

Further research could involve a sensitivity analysis using other population-demand geographies such as postcodes or by using different distance metrics when accessing public transport. In this study, we assumed that people will walk, on average, 400 m (a five-minute walk) to access bus routes—a standard based on the findings from previous studies, as well as UK Department for Transport (DfT) public-transport planning guidance. Others have used alternative cutoff thresholds; for example, Kotavaara et al. [44] used 1 km to access bus stops. Moreover, a recent review of international case studies has questioned the use of this conventionally assumed threshold when analyzing access to bus stops by drawing attention to the types of influences that may impact on the actual distances people are prepared to walk to access public transport [112].
Access to services through cycling have not been considered here, but it could be included as part of refinements of the approach described in the present study. This may become important, as active travel is increasingly promoted as a potential contributor to the need to move toward sustainable net-zero transport solutions, and as dedicated cycle paths become increasingly available. Factors such as the intervening topography between a trip origin or destination and public transport stops and stations, weather conditions, the perceived safety surrounding such stops, and other transport related issues could be considered here especially for potentially vulnerable groups such as the elderly [113,114]. Another relatively under-researched area relates to the demographic (e.g., age, gender, economic, and health status) and attitudinal characteristics of individuals using public transport, as such characteristics have been shown to influence the walking capacity to access public-transport stops [115,116].
Finally, the emphasis here is on physical access to bank and building society branches and not accessibility by virtual means (e.g., online banking), the delivery of banking services through mobile units, or banking services available through other facilities, such as post offices. Such factors need to be considered to give a more complete picture of the impact of bank closures on local communities. Whilst recognizing the longstanding importance of including access measures that consider potential impacts for vulnerable groups [117], we have not at present attempted to relate these scores back to the socio-economic characteristics of potential customers. Previous research has highlighted the need to identify “public transport gaps” based on “whether the system brings people to desired activity locations within an acceptable travel time at the desired time of day” [118] (p. 176). The ways in which such temporal variations can be considered as part of an overall equity assessment of social and financial patterns of exclusion will form the basis of our ongoing research program.

Author Contributions

Mitchel Langford and Gary Higgs proposed the methodology; Andrew Price downloaded data from open data sources and implemented the models; Andrew Price and Mitch Langford generated the GIS visualizations; all three authors were responsible for drafting and editing the paper. All authors have read and agreed to the published version of the manuscript.

Funding

This paper is based on research supported by the Wales Institute of Social and Economic Research and Data (WISERD). Funded by the Economic and Social Research Council (ESRC), WISERD is a collaborative venture between the Universities of Aberystwyth, Bangor, Cardiff, South Wales, and Swansea (Grant Number: ES/S012435/1).

Institutional Review Board Statement

Not applicable.

Informed Consent Statement

Not applicable.

Data Availability Statement

The datasets used are from open sources; links are provided in the Reference list to each of these sources.

Acknowledgments

We acknowledge the following sources of data: The Traveline National Dataset (TNDS) (Wales) contains public sector information licensed under the Open Government License v3.0. OpenStreetMap data was downloaded from https://www.geofabrik.de/, (accessed on 28 April 2021) and these data are licensed under terms of the Open Database License (https://www.openstreetmap.org/copyright). Office for National Statistics, 2011 Census: Aggregate data (England and Wales) (computer file). UK Data Service Census Support. Downloaded from https://www.nomisweb.co.uk. These data are licensed under terms of the Open Government License (http://www.nationalarchives.gov.uk/doc/open-governmants-licence/version/2) (all accessed on 28 April 2021).

Conflicts of Interest

The authors declare no conflict of interest.

References

  1. Siddiq, F.; Taylor, B.D. Tools of the trade? Assessing the progress of accessibility measures for planning practice. J. Am. Plan. Assoc. 2021, 87, 497–511. [Google Scholar] [CrossRef]
  2. Alamá, L.; Tortosa-Ausina, E. Bank Branch Geographic Location Patterns in Spain: Some Implications for Financial Exclusion. Growth Chang. 2012, 43, 505–543. [Google Scholar] [CrossRef] [Green Version]
  3. Argent, N.; Rolley, F. Financial Exclusion in Rural and Remote New South Wales, Australia: A Geography of Bank Branch Rationalisation, 1981–1998. Aust. Geogr. Stud. 2000, 38, 182–203. [Google Scholar] [CrossRef]
  4. Carbo, S.; Gardener, E.P.M.; Molyneux, P. Financial Exclusion in Europe. Public Money Manag. 2007, 27, 21–27. [Google Scholar] [CrossRef]
  5. Dunham, I.M.; Foster, A. Proximate Landscapes of Economic Inclusion in Southeastern Pennsylvania. Prof. Geogr. 2014, 67, 132–144. [Google Scholar] [CrossRef]
  6. Hegerty, S.W. Commercial bank locations and “banking deserts”: A statistical analysis of Milwaukee and Buffalo. Ann. Reg. Sci. 2015, 56, 253–271. [Google Scholar] [CrossRef]
  7. Hegerty, S.W. “Banking Deserts,” Bank Branch Losses, and Neighborhood Socioeconomic Characteristics in the City of Chicago: A Spatial and Statistical Analysis. Prof. Geogr. 2019, 72, 194–205. [Google Scholar] [CrossRef]
  8. Kashian, R.D.; Tao, R.; Drago, R. Bank deserts in the USA and the Great Recession: Geography and demographics. J. Econ. Stud. 2018, 45, 691–709. [Google Scholar] [CrossRef]
  9. Leyshon, A.; French, S.; Signoretta, P. Financial exclusion and the geography of bank and building society branch closure in Britain. Trans. Inst. Br. Geogr. 2008, 33, 447–465. [Google Scholar] [CrossRef] [Green Version]
  10. Martin-Oliver, A. Financial exclusion and branch closures in Spain after the Great Recession. Reg. Stud. 2018, 53, 562–573. [Google Scholar] [CrossRef]
  11. Morrison, P.S.; O’Brien, R. Bank branch closures in New Zealand: The application of a spatial interaction model. Appl. Geogr. 2001, 21, 301–330. [Google Scholar] [CrossRef]
  12. House of Commons Scottish Affairs Committee. Royal Bank of Scotland Branch Closures, Third Report of Session 2017-19; HC 682; House of Commons: London, UK, 2018; Available online: https://publications.parliament.uk/pa/cm201719/cmselect/cmscotaf/682/682.pdf (accessed on 28 April 2021).
  13. French, S.; Leyshon, A.; Meek, S. The Changing Geography of British Bank and Building Society Branch Networks, 2003–2012; Working Paper; University of Nottingham: Nottingham, UK, 2013; Available online: https://nottingham-repository.worktribe.com/output/716960/the-changing-geography-of-british-bank-and-building-society-branch-networks-2003-2012 (accessed on 28 April 2021).
  14. French, S.; Leyshon, A.; Signoretta, P.E. “All Gone Now”: The Material, Discursive and Political Erasure of Bank and Building Society Branches in Britain. Antipode 2008, 40, 79–101. [Google Scholar] [CrossRef]
  15. Langford, M.; Higgs, G.; Jones, S. Understanding Spatial Variations in Accessibility to Banks Using Variable Floating Catchment Area Techniques. Appl. Spat. Anal. Policy 2020, 14, 449–472. [Google Scholar] [CrossRef]
  16. Neutens, T.; Delafontaine, M.; Scott, D.; De Maeyer, P. An analysis of day-to-day variations in individual space–time accessibility. J. Transp. Geogr. 2012, 23, 81–91. [Google Scholar] [CrossRef] [Green Version]
  17. Park, J.; Goldberg, D. A Review of Recent Spatial Accessibility Studies That Benefitted from Advanced Geospatial Information: Multimodal Transportation and Spatiotemporal Disaggregation. ISPRS Int. J. Geo-Inf. 2021, 10, 532. [Google Scholar] [CrossRef]
  18. Handy, S.L.; Niemeier, D.A. Measuring Accessibility: An Exploration of Issues and Alternatives. Environ. Plan. A Econ. Space 1997, 29, 1175–1194. [Google Scholar] [CrossRef]
  19. Geurs, K.T.; De Montis, A.; Reggiani, A. Recent advances and applications in accessibility modelling. Comput. Environ. Urban Syst. 2015, 49, 82–85. [Google Scholar] [CrossRef] [Green Version]
  20. Kwan, M.-P. Space-Time and Integral Measures of Individual Accessibility: A Comparative Analysis Using a Point-based Framework. Geogr. Anal. 2010, 30, 191–216. [Google Scholar] [CrossRef]
  21. Neutens, T.; Schwanen, T.; Witlox, F.; De Maeyer, P. Equity of Urban Service Delivery: A Comparison of Different Accessibility Measures. Environ. Plan. A Econ. Space 2010, 42, 1613–1635. [Google Scholar] [CrossRef]
  22. Talen, E.; Anselin, L. Assessing Spatial Equity: An Evaluation of Measures of Accessibility to Public Playgrounds. Environ. Plan. A Econ. Space 1998, 30, 595–613. [Google Scholar] [CrossRef] [Green Version]
  23. Neutens, T. Accessibility, equity and health care: Review and research directions for transport geographers. J. Transp. Geogr. 2015, 43, 14–27. [Google Scholar] [CrossRef]
  24. Cui, J.; Liu, F.; Janssens, D.; An, S.; Wets, G.; Cools, M. Detecting urban road network accessibility problems using taxi GPS data. J. Transp. Geogr. 2016, 51, 147–157. [Google Scholar] [CrossRef]
  25. García-Albertos, P.; Picornell, M.; Salas-Olmedo, M.H.; Gutiérrez, J. Exploring the potential of mobile phone records and online route planners for dynamic accessibility analysis. Transp. Res. Part A Policy Pract. 2019, 125, 294–307. [Google Scholar] [CrossRef]
  26. Guan, J.; Zhang, K.; Shen, Q.; He, Y. Dynamic Modal Accessibility Gap: Measurement and Application Using Travel Routes Data. Transp. Res. Part D Transp. Environ. 2020, 81, 102272. [Google Scholar] [CrossRef]
  27. Allen, J. Mapping differences in access to public libraries by travel mode and time of day. Libr. Inf. Sci. Res. 2019, 41, 11–18. [Google Scholar] [CrossRef]
  28. Chen, X.; Clark, J. Measuring Space–Time Access to Food Retailers: A Case of Temporal Access Disparity in Franklin County, Ohio. Prof. Geogr. 2015, 68, 175–188. [Google Scholar] [CrossRef]
  29. Delafontaine, M.; Neutens, T.; Schwanen, T.; Van de Weghe, N. The impact of opening hours on the equity of individual space–time accessibility. Comput. Environ. Urban Syst. 2011, 35, 276–288. [Google Scholar] [CrossRef] [Green Version]
  30. Neutens, T.; Schwanen, T.; Witlox, F.; de Maeyer, P. Evaluating the Temporal Organization of Public Service Provision Using Space-Time Accessibility Analysis. Urban Geogr. 2010, 31, 1039–1064. [Google Scholar] [CrossRef]
  31. Neutens, T.; Delafontaine, M.; Schwanen, T.; Van de Weghe, N. The relationship between opening hours and accessibility of public service delivery. J. Transp. Geogr. 2012, 25, 128–140. [Google Scholar] [CrossRef] [Green Version]
  32. Wang, Y.; Chen, B.Y.; Yuan, H.; Wang, D.; Lam, W.H.; Li, Q. Measuring temporal variation of location-based accessibility using space-time utility perspective. J. Transp. Geogr. 2018, 73, 13–24. [Google Scholar] [CrossRef]
  33. Weber, J.; Kwan, M.-P. Bringing Time Back In: A Study on the Influence of Travel Time Variations and Facility Opening Hours on Individual Accessibility. Prof. Geogr. 2002, 54, 226–240. [Google Scholar] [CrossRef]
  34. Farber, S.; Morang, M.Z.; Widener, M.J. Temporal variability in transit-based accessibility to supermarkets. Appl. Geogr. 2014, 53, 149–159. [Google Scholar] [CrossRef]
  35. Goliszek, S. GIS tools and programming languages for creating models of public and private transport potential accessibility in Szczecin, Poland. J. Geogr. Syst. 2021, 23, 115–137. [Google Scholar] [CrossRef]
  36. Tenkanen, H.; Saarsalmi, P.; Järv, O.; Salonen, M.; Toivonen, T. Health research needs more comprehensive accessibility measures: Integrating time and transport modes from open data. Int. J. Health Geogr. 2016, 15, 23. [Google Scholar] [CrossRef] [Green Version]
  37. Widener, M.J.; Farber, S.; Neutens, T.; Horner, M.W. Using urban commuting data to calculate a spatiotemporal accessibility measure for food environment studies. Health Place 2013, 21, 1–9. [Google Scholar] [CrossRef] [Green Version]
  38. Widener, M.J.; Minaker, L.; Farber, S.; Allen, J.; Vitali, B.; Coleman, P.C.; Cook, B. How do changes in the daily food and transportation environments affect grocery store accessibility? Appl. Geogr. 2017, 83, 46–62. [Google Scholar] [CrossRef]
  39. Klumpenhouwer, W.; Huang, W. A flexible framework for measuring accessibility with destination bundling. J. Transp. Geogr. 2021, 91, 102949. [Google Scholar] [CrossRef]
  40. Mavoa, S.; Witten, K.; McCreanor, T.; O’Sullivan, D. GIS based destination accessibility via public transit and walking in Auckland, New Zealand. J. Transp. Geogr. 2012, 20, 15–22. [Google Scholar] [CrossRef]
  41. Zhang, J.; Mao, L. Integrating multiple transportation modes into measures of spatial food accessibility. J. Transp. Health 2019, 13, 1–11. [Google Scholar] [CrossRef]
  42. Sonea, A.; Westerholt, R. Geographic and Temporal Access to Basic Banking Services Offered through Post Offices in Wales. Appl. Spat. Anal. Policy 2021, 14, 879–905. [Google Scholar] [CrossRef]
  43. Järv, O.; Tenkanen, H.; Salonen, M.; Ahas, R.; Toivonen, T. Dynamic cities: Location-based accessibility modelling as a function of time. Appl. Geogr. 2018, 95, 101–110. [Google Scholar] [CrossRef]
  44. Kotavaara, O.; Nivala, A.; Lankila, T.; Huotari, T.; Delmelle, E.; Antikainen, H. Geographical accessibility to primary health care in Finland—Grid-based multimodal assessment. Appl. Geogr. 2021, 136, 102583. [Google Scholar] [CrossRef]
  45. Djurhuus, S.; Hansen, H.S.; Aadahl, M.; Glümer, C. Building a multimodal network and determining individual accessibility by public transportation. Environ. Plan. B Plan. Des. 2015, 43, 210–227. [Google Scholar] [CrossRef]
  46. Hu, S.; Song, W.; Li, C.; Lu, J. A multi-mode Gaussian-based two-step floating catchment area method for measuring acces-sibility of urban parks. Cities 2020, 105, 102815. [Google Scholar] [CrossRef]
  47. Lei, T.L.; Church, R.L. Mapping transit-based access: Integrating GIS, routes and schedules. Int. J. Geogr. Inf. Sci. 2010, 24, 283–304. [Google Scholar] [CrossRef]
  48. Logan, T.; Williams, T.; Nisbet, A.; Liberman, K.; Zuo, C.; Guikema, S. Evaluating urban accessibility: Leveraging open-source data and analytics to overcome existing limitations. Environ. Plan. B Urban Anal. City Sci. 2017, 46, 897–913. [Google Scholar] [CrossRef]
  49. Ma, L.; Luo, N.; Wan, T.; Hu, C.; Peng, M. An Improved Healthcare Accessibility Measure Considering the Temporal Dimension and Population Demand of Different Ages. Int. J. Environ. Res. Public Health 2018, 15, 2421. [Google Scholar] [CrossRef] [Green Version]
  50. Zhang, T.; Dong, S.; Zeng, Z.; Li, J. Quantifying multi-modal public transit accessibility for large metropolitan areas: A time-dependent reliability modeling approach. Int. J. Geogr. Inf. Sci. 2018, 32, 1649–1676. [Google Scholar] [CrossRef]
  51. Zheng, Z.; Xia, H.; Ambinakudige, S.; Qin, Y.; Li, Y.; Xie, Z.; Zhang, L.; Gu, H. Spatial Accessibility to Hospitals Based on Web Mapping API: An Empirical Study in Kaifeng, China. Sustainability 2019, 11, 1160. [Google Scholar] [CrossRef] [Green Version]
  52. Luo, W.; Wang, F. Measures of Spatial Accessibility to Health Care in a GIS Environment: Synthesis and a Case Study in the Chicago Region. Environ. Plan. B Plan. Des. 2003, 30, 865–884. [Google Scholar] [CrossRef] [Green Version]
  53. Delamater, P.L. Spatial accessibility in suboptimally configured health care systems: A modified two-step floating catchment area (M2SFCA) metric. Health Place 2013, 24, 30–43. [Google Scholar] [CrossRef] [PubMed]
  54. Plachkinova, M.; Vo, A.; Bhaskar, R.; Hilton, B. A conceptual framework for quality healthcare accessibility: A scalable approach for big data technologies. Inf. Syst. Front. 2016, 20, 289–302. [Google Scholar] [CrossRef]
  55. Langford, M.; Higgs, G.; Dallimore, D.J. Investigating spatial variations in access to childcare provision using network-based Geographic Information System models. Soc. Policy Adm. 2018, 53, 661–677. [Google Scholar] [CrossRef]
  56. Xia, Z.; Li, H.; Chen, Y.; Yu, W. Integrating Spatial and Non-Spatial Dimensions to Measure Urban Fire Service Access. ISPRS Int. J. Geo-Inf. 2019, 8, 138. [Google Scholar] [CrossRef] [Green Version]
  57. Luo, W.; Qi, Y. An enhanced two-step floating catchment area (E2SFCA) method for measuring spatial accessibility to primary care physicians. Health Place 2009, 15, 1100–1107. [Google Scholar] [CrossRef]
  58. Luo, W.; Whippo, T. Variable catchment sizes for the two-step floating catchment area (2SFCA) method. Health Place 2012, 18, 789–795. [Google Scholar] [CrossRef]
  59. McGrail, M.; Humphreys, J.S. Measuring spatial accessibility to primary health care services: Utilising dynamic catchment sizes. Appl. Geogr. 2014, 54, 182–188. [Google Scholar] [CrossRef]
  60. Wan, N.; Zou, B.; Sternberg, T. A three-step floating catchment area method for analyzing spatial access to health services. Int. J. Geogr. Inf. Sci. 2012, 26, 1073–1089. [Google Scholar] [CrossRef]
  61. Mao, L.; Nekorchuk, D. Measuring spatial accessibility to healthcare for populations with multiple transportation modes. Health Place 2013, 24, 115–122. [Google Scholar] [CrossRef]
  62. Langford, M.; Fry, R.; Higgs, G. Measuring transit system accessibility using a modified two-step floating catchment technique. Int. J. Geogr. Inf. Sci. 2012, 26, 193–214. [Google Scholar] [CrossRef]
  63. Langford, M.; Higgs, G.; Fry, R. Multi-modal two-step floating catchment area analysis of primary health care accessibility. Health Place 2016, 38, 70–81. [Google Scholar] [CrossRef] [PubMed]
  64. Ni, J.; Liang, M.; Lin, Y.; Wu, Y.; Wang, C. Multi-Mode Two-Step Floating Catchment Area (2SFCA) Method to Measure the Potential Spatial Accessibility of Healthcare Services. ISPRS Int. J. Geo-Inf. 2019, 8, 236. [Google Scholar] [CrossRef] [Green Version]
  65. Xing, L.; Liu, Y.; Liu, X. Measuring spatial disparity in accessibility with a multi-mode method based on park green spaces classification in Wuhan, China. Appl. Geogr. 2018, 94, 251–261. [Google Scholar] [CrossRef]
  66. Yin, P. Urban–rural inequalities in spatial accessibility to prenatal care: A GIS analysis of Georgia, USA, 2000–2010. GeoJournal 2018, 84, 671–683. [Google Scholar] [CrossRef]
  67. Dony, C.C.; Delmelle, E.M.; Delmelle, E.C. Re-conceptualizing accessibility to parks in multi-modal cities: A Variable-width Floating Catchment Area (VFCA) method. Landsc. Urban Plan. 2015, 143, 90–99. [Google Scholar] [CrossRef]
  68. Tao, R.; Downs, J.; Beckie, T.M.; Chen, Y.; McNelley, W. Examining spatial accessibility to COVID-19 testing sites in Florida. Ann. GIS 2020, 26, 319–327. [Google Scholar] [CrossRef]
  69. Xu, W.; Ding, Y.; Zhou, J.; Li, Y. Transit accessibility measures incorporating the temporal dimension. Cities 2015, 46, 55–66. [Google Scholar] [CrossRef]
  70. Li, Y.; Lin, Y.; Geertman, S.; Hooimeijer, P.; Xu, W. Accessibility-Based Equity of Public Facilities: A Case Study in Xiamen, China. Appl. Spat. Anal. Policy 2021, 14, 947–968. [Google Scholar] [CrossRef]
  71. Qian, T.; Chen, J.; Li, A.; Ang, L.; Shen, D. Evaluating Spatial Accessibility to General Hospitals with Navigation and Social Media Location Data: A Case Study in Nanjing. Int. J. Environ. Res. Public Health 2020, 17, 2752. [Google Scholar] [CrossRef]
  72. Qin, J.; Liu, Y.; Yi, D.; Sun, S.; Zhang, J. Spatial Accessibility Analysis of Parks with Multiple Entrances Based on Real-Time Travel: The Case Study in Beijing. Sustainability 2020, 12, 7618. [Google Scholar] [CrossRef]
  73. Tao, Z.; Yao, Z.; Kong, H.; Duan, F.; Zhuolin, T. Spatial accessibility to healthcare services in Shenzhen, China: Improving the multi-modal two-step floating catchment area method by estimating travel time via online map APIs. BMC Health Serv. Res. 2018, 18, 345. [Google Scholar] [CrossRef] [PubMed] [Green Version]
  74. Wang, F.; Xu, Y. Estimating O–D travel time matrix by Google Maps API: Implementation, advantages, and implications. Ann. GIS 2011, 17, 199–209. [Google Scholar] [CrossRef]
  75. Ma, X.; Ren, F.; Du, Q.; Liu, P.; Li, L.; Xi, Y.; Jia, P. Incorporating multiple travel modes into a floating catchment area framework to analyse patterns of accessibility to hierarchical healthcare facilities. J. Transp. Health 2019, 15, 100675. [Google Scholar] [CrossRef]
  76. Tao, Z.; Cheng, Y. Modelling the spatial accessibility of the elderly to healthcare services in Beijing, China. Environ. Plan. B Urban Anal. City Sci. 2018, 46, 1132–1147. [Google Scholar] [CrossRef]
  77. Zhou, X.; Yu, Z.; Yuan, L.; Wang, L.; Wu, C. Measuring Accessibility of Healthcare Facilities for Populations with Multiple Transportation Modes Considering Residential Transportation Mode Choice. ISPRS Int. J. Geo-Inf. 2020, 9, 394. [Google Scholar] [CrossRef]
  78. Xiao, W.; Wei, Y.D.; Wan, N. Modeling job accessibility using online map data: An extended two-step floating catchment area method with multiple travel modes. J. Transp. Geogr. 2021, 93, 103065. [Google Scholar] [CrossRef]
  79. Kaur Khakh, A.; Fast, V.; Shahid, R. Spatial Accessibility to Primary Healthcare Services by Multimodal Means of Travel: Synthesis and Case Study in the City of Calgary. Int. J. Environ. Res. Public Health 2019, 16, 170. [Google Scholar] [CrossRef] [Green Version]
  80. Lin, Y.; Wan, N.; Sheets, S.; Gong, X.; Davies, A. A multi-modal relative spatial access assessment approach to measure spatial accessibility to primary care providers. Int. J. Health Geogr. 2018, 17, 33. [Google Scholar] [CrossRef]
  81. Guida, C.; Carpentieri, G. Quality of life in the urban environment and primary health services for the elderly during the Covid-19 pandemic: An application to the city of Milan (Italy). Cities 2020, 110, 103038. [Google Scholar] [CrossRef]
  82. Park, J.; Kang, J.-Y.; Goldberg, D.W.; Hammond, T.A. Leveraging temporal changes of spatial accessibility measurements for better policy implications: A case study of electric vehicle (EV) charging stations in Seoul, South Korea. Int. J. Geogr. Inf. Sci. 2021, 36, 1185–1204. [Google Scholar] [CrossRef]
  83. Fransen, K.; Neutens, T.; De Maeyer, P.; Deruyter, G. A commuter-based two-step floating catchment area method for measuring spatial accessibility of daycare centers. Health Place 2015, 32, 65–73. [Google Scholar] [CrossRef] [PubMed]
  84. Paul, J.; Edwards, E. Temporal availability of public health care in developing countries of the Caribbean: An improved two-step floating catchment area method for estimating spatial accessibility to health care. Int. J. Health Plan. Manag. 2018, 34, e536–e556. [Google Scholar] [CrossRef] [PubMed] [Green Version]
  85. Google Platform. Google Maps Platform. Available online: https://mapsplatform.google.com/ (accessed on 28 April 2022).
  86. Datafic Sp z o.o. Bank Opening Times Home. Available online: https://www.bank-opening-times.co.uk/ (accessed on 28 April 2022).
  87. Bank Opening Times. Welcome to Bank-Opening-Times.co.uk. Available online: https://www.bankopeningtimes.co.uk (accessed on 28 April 2022).
  88. Enterprises, T. Opening Hours UK. Available online: https://www.opening-hours-uk.co.uk/store/bank (accessed on 28 April 2022).
  89. Han, S.; Anderson, C.K. Web Scraping for Hospitality Research: Overview, Opportunities, and Implications. Cornell Hosp. Q. 2020, 62, 89–104. [Google Scholar] [CrossRef]
  90. Traveline. Traveline Data. Available online: https://www.travelinedata.org.uk/ (accessed on 28 April 2022).
  91. Rail Delivery Group. Rail Industry Data. Available online: http://data.atoc.org/rail-industry-data (accessed on 28 April 2022).
  92. Morgan, M. UK2GTFS. Computer Software. Available online: https://itsleeds.github.io/UK2GTFS/index.html (accessed on 28 April 2022).
  93. Murray, A.; Davis, R.; Stimson, R.; Ferreira, L. Public transportation access. Transp. Res. D 1998, 3, 319–328. [Google Scholar] [CrossRef] [Green Version]
  94. Ivan, I.; Horak, J.; Zajíčková, L.; Burian, J.; Fojtík, D. Factors Influencing Walking Distance to the Preferred Public Transport Stop in selected urban centres of Czechia. GeoScape 2019, 13, 16–30. [Google Scholar] [CrossRef] [Green Version]
  95. Wu, B.M.; Hine, J.P. A PTAL approach to measuring changes in bus service accessibility. Transp. Policy 2003, 10, 307–320. [Google Scholar] [CrossRef]
  96. Zhao, F.; Chow, L.-F.; Li, M.-T.; Ubaka, I.; Gan, A. Forecasting Transit Walk Accessibility: Regression Model Alternative to Buffer Method. Transp. Res. Rec. J. Transp. Res. Board 2003, 1835, 34–41. [Google Scholar] [CrossRef] [Green Version]
  97. Price, A.; Langford, M.; Higgs, G. Computing geographical access to services: The design of a client–server solution that incorporates multiple transport modes. Trans. GIS 2021, 25, 1849–1867. [Google Scholar] [CrossRef]
  98. OpenTripPlanner.org. Computer Software. Available online: http://www.opentripplanner.org/ (accessed on 28 April 2022).
  99. OpenStreetMap.org. Computer Software. Available online: https://www.openstreetmap.org/ (accessed on 28 April 2022).
  100. PostgreSQL. Computer Software. Available online: https://www.postgresql.org/ (accessed on 28 April 2022).
  101. PostGIS. Computer Software. Available online: https://postgis.net/ (accessed on 28 April 2022).
  102. Wu, C.; Powe, N.A.; Copeland, A. Minimizing aggregation errors when measuring potential access to services for social groups at the city scale. Environ. Plan. B Urban Anal. City Sci. 2020, 48, 2206–2220. [Google Scholar] [CrossRef]
  103. Langford, M.; Higgs, G. Measuring Potential Access to Primary Healthcare Services: The Influence of Alternative Spatial Representations of Population. Prof. Geogr. 2006, 58, 294–306. [Google Scholar] [CrossRef]
  104. Bok, J.; Kwon, Y. Comparable Measures of Accessibility to Public Transport Using the General Transit Feed Specification. Sustainability 2016, 8, 224. [Google Scholar] [CrossRef] [Green Version]
  105. Widener, M.J.; Farber, S.; Neutens, T.; Horner, M. Spatiotemporal accessibility to supermarkets using public transit: An interaction potential approach in Cincinnati, Ohio. J. Transp. Geogr. 2015, 42, 72–83. [Google Scholar] [CrossRef] [Green Version]
  106. Niedzielski, M.A.; Kucharski, R. Impact of commuting, time budgets, and activity durations on modal disparity in accessibility to supermarkets. Transp. Res. Part D Transp. Environ. 2019, 75, 106–120. [Google Scholar] [CrossRef]
  107. Duffy, C.; Newing, A.; Górska, J. Evaluating the Geographical Accessibility and Equity of COVID-19 Vaccination Sites in England. Vaccines 2021, 10, 50. [Google Scholar] [CrossRef]
  108. Swayne, M.R.; Lowery, B.C. Integrating transit data and travel time into food security analysis: A case study of San Diego, California. Appl. Geogr. 2021, 131, 102461. [Google Scholar] [CrossRef]
  109. Chen, B.Y.; Yuan, H.; Li, Q.; Wang, D.; Shaw, S.-L.; Chen, H.-P.; Lam, W.H.K. Measuring place-based accessibility under travel time uncertainty. Int. J. Geogr. Inf. Sci. 2016, 31, 783–804. [Google Scholar] [CrossRef]
  110. Chen, X.; Jia, P. A comparative analysis of accessibility measures by the two-step floating catchment area (2SFCA) method. Int. J. Geogr. Inf. Sci. 2019, 33, 1739–1758. [Google Scholar] [CrossRef]
  111. Capodici, A.; D’Orso, G.; Migliore, M. A GIS-Based Methodology for Evaluating the Increase in Multimodal Transport between Bicycle and Rail Transport Systems. A Case Study in Palermo. ISPRS Int. J. Geo-Inf. 2021, 10, 321. [Google Scholar] [CrossRef]
  112. van Soest, D.; Tight, M.R.; Rogers, C.D.F. Exploring the distances people walk to access public transport. Transp. Rev. 2019, 40, 160–182. [Google Scholar] [CrossRef]
  113. Daniels, R.; Mulley, C. Explaining walking distance to public transport: The dominance of public transport supply. J. Transp. Land Use 2013, 6, 5–20. [Google Scholar] [CrossRef]
  114. Hess, D.B. Walking to the bus: Perceived versus actual walking distance to bus stops for older adults. Transportation 2011, 39, 247–266. [Google Scholar] [CrossRef]
  115. Chia, J.; Lee, J.; Kamruzzaman, M. Walking to public transit: Exploring variations by socioeconomic status. Int. J. Sustain. Transp. 2016, 10, 805–814. [Google Scholar] [CrossRef] [Green Version]
  116. Ribeiro, J.; Fontes, T.; Soares, C.; Borges, J.L. Accessibility as an indicator to estimate social exclusion in public transport. Transp. Res. Procedia 2021, 52, 740–747. [Google Scholar] [CrossRef]
  117. Neutens, T.; Delafontaine, M.; Scott, D.M.; De Maeyer, P. A GIS-based method to identify spatiotemporal gaps in public service delivery. Appl. Geogr. 2012, 32, 253–264. [Google Scholar] [CrossRef] [Green Version]
  118. Fransen, K.; Neutens, T.; Farber, S.; De Maeyer, P.; Deruyter, G.; Witlox, F. Identifying public transport gaps using time-dependent accessibility levels. J. Transp. Geogr. 2015, 48, 176–187. [Google Scholar] [CrossRef] [Green Version]
Figure 1. (a) Branch locations and (b) total weekly opening hours.
Ijgi 11 00350 g001
Figure 2. Temporal availability of branches. Opening and closing times vary amongst branches, and sometimes at the same branch between days. Few sites offer Saturday opening.
Ijgi 11 00350 g002
Figure 3. Public transport network consisting of bus routes and light and heavy rail. Insert maps (ac) illustrate further details within three major cities.
Ijgi 11 00350 g003
Figure 4. Examples of bus route schedules: Routes and departure times associated with a stop located in an inner city LSOA (Birchgrove, left) and in a rural LSOA (Llan Festiniog, right).
Ijgi 11 00350 g004
Figure 5. Computing environment and infrastructure used to execute FCA models.
Ijgi 11 00350 g005
Figure 6. Difference in FCA score rankings between Model 1 and Model 2. A large fall (red) or rise (blue) in the ranking implies a notably lower or higher accessibility level, respectively, when branch operating hours are also taken into consideration.
Ijgi 11 00350 g006
Figure 7. Comparison of FCA scores in the Pembrokeshire peninsular when temporal restrictions relating to travel (bus timetables) and service availability (branch opening hours) are modeled. Series (ac) report access via public transport on Tuesday at 11 a.m., Friday at 2 p.m., and Saturday at 11 a.m., respectively. Series (df) are equivalent maps based on travel by private transport.
Ijgi 11 00350 g007
Table 1. A typology of FCA models adopted in this study.
Available Travel ModesService Supply DetailNetwork Travel Constraints
‘standard’ E2SFCA (this model is not implemented, but is used as a comparison for those listed below)single travel mode (i.e., private car only)simple unitary site counts
supply points are assumed to be always open/available
car: can use any road link travelling at national speed limits and at any time
Model 1multiple travel modes
both private car
and public bus
as abovecar: as above
bus: only via those links associated with published bus routes, using timetable derived speeds, and on ANY timetabled service
Model 2as abovetotal weekly opening hours used as a service capacity constraint
supply points are assumed to be always open/available
car: as above
bus: as above
Model 3as abovetotal weekly opening hours used as a service capacity constraint
supply points are only available during their stated opening hours
car: as above
bus: only via those links associated with published bus routes, using timetable derived speeds, and ONLY using those services that can reach
a supply point during its stated opening hours
Publisher’s Note: MDPI stays neutral with regard to jurisdictional claims in published maps and institutional affiliations.

