Article

Quality Assurance for Spatial Research Data

1
Center for Information Services and High Performance Computing (ZIH), Technische Universität Dresden, Helmholtzstr. 10, 01062 Dresden, Germany
2
Working Group Geo UX, German UPA, Technische Universität Dresden, Helmholtzstr. 10, 01062 Dresden, Germany
*
Author to whom correspondence should be addressed.
ISPRS Int. J. Geo-Inf. 2022, 11(6), 334; https://doi.org/10.3390/ijgi11060334
Submission received: 23 March 2022 / Revised: 24 May 2022 / Accepted: 1 June 2022 / Published: 3 June 2022

Abstract

:
In Earth System Sciences (ESS), spatial data are increasingly used for impact research and decision-making. To support the stakeholders’ decision, the quality of the spatial data and its assurance play a major role. We present concepts and a workflow to assure the quality of ESS data. Our concepts and workflow are designed along the research data life cycle and include criteria for openness, FAIRness of data (findable, accessible, interoperable, reusable), data maturity, and data quality. Existing data maturity concepts describe (community-specific) maturity matrices, e.g., for meteorological data. These concepts assign a variety of maturity metrics to discrete levels to facilitate evaluation of the data. Moreover, the use of easy-to-understand level numbers enables quick recognition of highly mature data, and hence fosters easier reusability. Here, we propose a revised maturity matrix for ESS data including a comprehensive list of FAIR criteria. To foster the compatibility with the developed maturity matrix approach, we developed a spatial data quality matrix that relates the data maturity levels to quality metrics. The maturity and quality levels are then assigned to the phases of the data life cycle. With implementing openness criteria and matrices for data maturity and quality, we build a quality assurance (QA) workflow that comprises various activities and roles. To support researchers in applying this workflow, we implement an interactive questionnaire in the tool RDMO (research data management organizer) to collaboratively manage and monitor all QA activities. This can serve as a blueprint for use-case-specific QA for other datasets. As a proof of concept, we successfully applied our criteria for openness, data maturity, and data quality to the publicly available SPAM2010 (crop distribution) dataset series.

1. Introduction

Spatial data quality is a core sub discipline in Earth System Science (ESS) indicating the relevance of providing detailed quality information for scientific data results [1]. The knowledge of data quality, and thus the availability of meaningful quality information, is key to facilitate data use and reuse, in particular for decision-making and providing FAIR data [2,3]. Scientific data creation and manipulation workflows meet high-quality standards [4]. However, monitoring and reporting adequate quality information is still a pressing challenge in research data management (RDM). Quality information is often created and provided only at the end of the research data life cycle (cp. [2]), or in an extra phase of the data life cycle [5]. Thus, relevant quality information is lacking for interim results and problems, e.g., in applied methods or implementations, and can only be detected in final stages. To foster transparency, replicability, and the provision of open and FAIR data, the provision of quality information for such interim results and workflow steps is essential, in particular for complex scientific workflows. However, to avoid information loss and mistakes when creating the quality information, automation aspects should be considered. Current approaches on (semi) automated quality information management often lack in providing structured, in best case standardized, quality information to be used in further digital processes (cp. [2,4,6,7]). That leads among other things to the revision and new development of standards, e.g., ISO 19157-1 [8] and ISO 19157-3.
While approaches for openness and FAIRness indicators already exist, disciplinary quality concepts or combined approaches including disciplinary and general aspects can hardly be found or do not meet researcher’s needs for high-quality information. For instance, GeoDCAT-AP [9] provides a modern linked data application profile for spatial data’s metadata including several quality aspects. However, the implementation of a comprehensive list of quality elements (e.g., from ISO 19157:2013 [10]) is still at the beginning. In ESS, researchers need quality measures for spatial data to evaluate potential input data, e.g., for fitness for use, and research outputs, e.g., to check validity.
Quality assurance (QA) in data-oriented scientific projects focuses on ensuring and reporting that applied data creation and manipulation workflows result in appropriate data quality [11]. Therefore, we propose a generic QA workflow to monitor and report quality information for spatial data from the beginning on. Our QA workflow concept uses the research data life cycle as the underlying concept to structure general and disciplinary QA activities, related roles, and to link indicators and measures (Figure 1). We include well-known and proven interdisciplinary concepts, such as FAIR indicators and Tim Berners-Lee’s 5-Star Open Data approach, and implement a simplified role model focusing on a data provider, data curator, and data publisher. Further, we adapt and combine these approaches with disciplinary concepts, such as a data maturity matrix model and the concept of data quality for geographic information. Thus, we provide a detailed workflow concept with specific activities for each phase of the data life cycle and structured measures to monitor and report data quality with respect to aspects, such as automation and compatibility to multidisciplinary approaches.
A simplified research data life cycle contains the following phases: collection, processing, analysis, publication, archiving, and reuse (applied for ESS projects in [12]). From a scientific project’s perspective, the collection phase is the starting point for RDM activities, and the archiving of the data represents the endpoint. The reuse phase typically marks the start of a new life cycle iteration, i.e., running the collection phase of a second research project using the published or archived data from the first project. Figure 1 comprises all components of the developed QA workflow concept related to the research data life cycle.

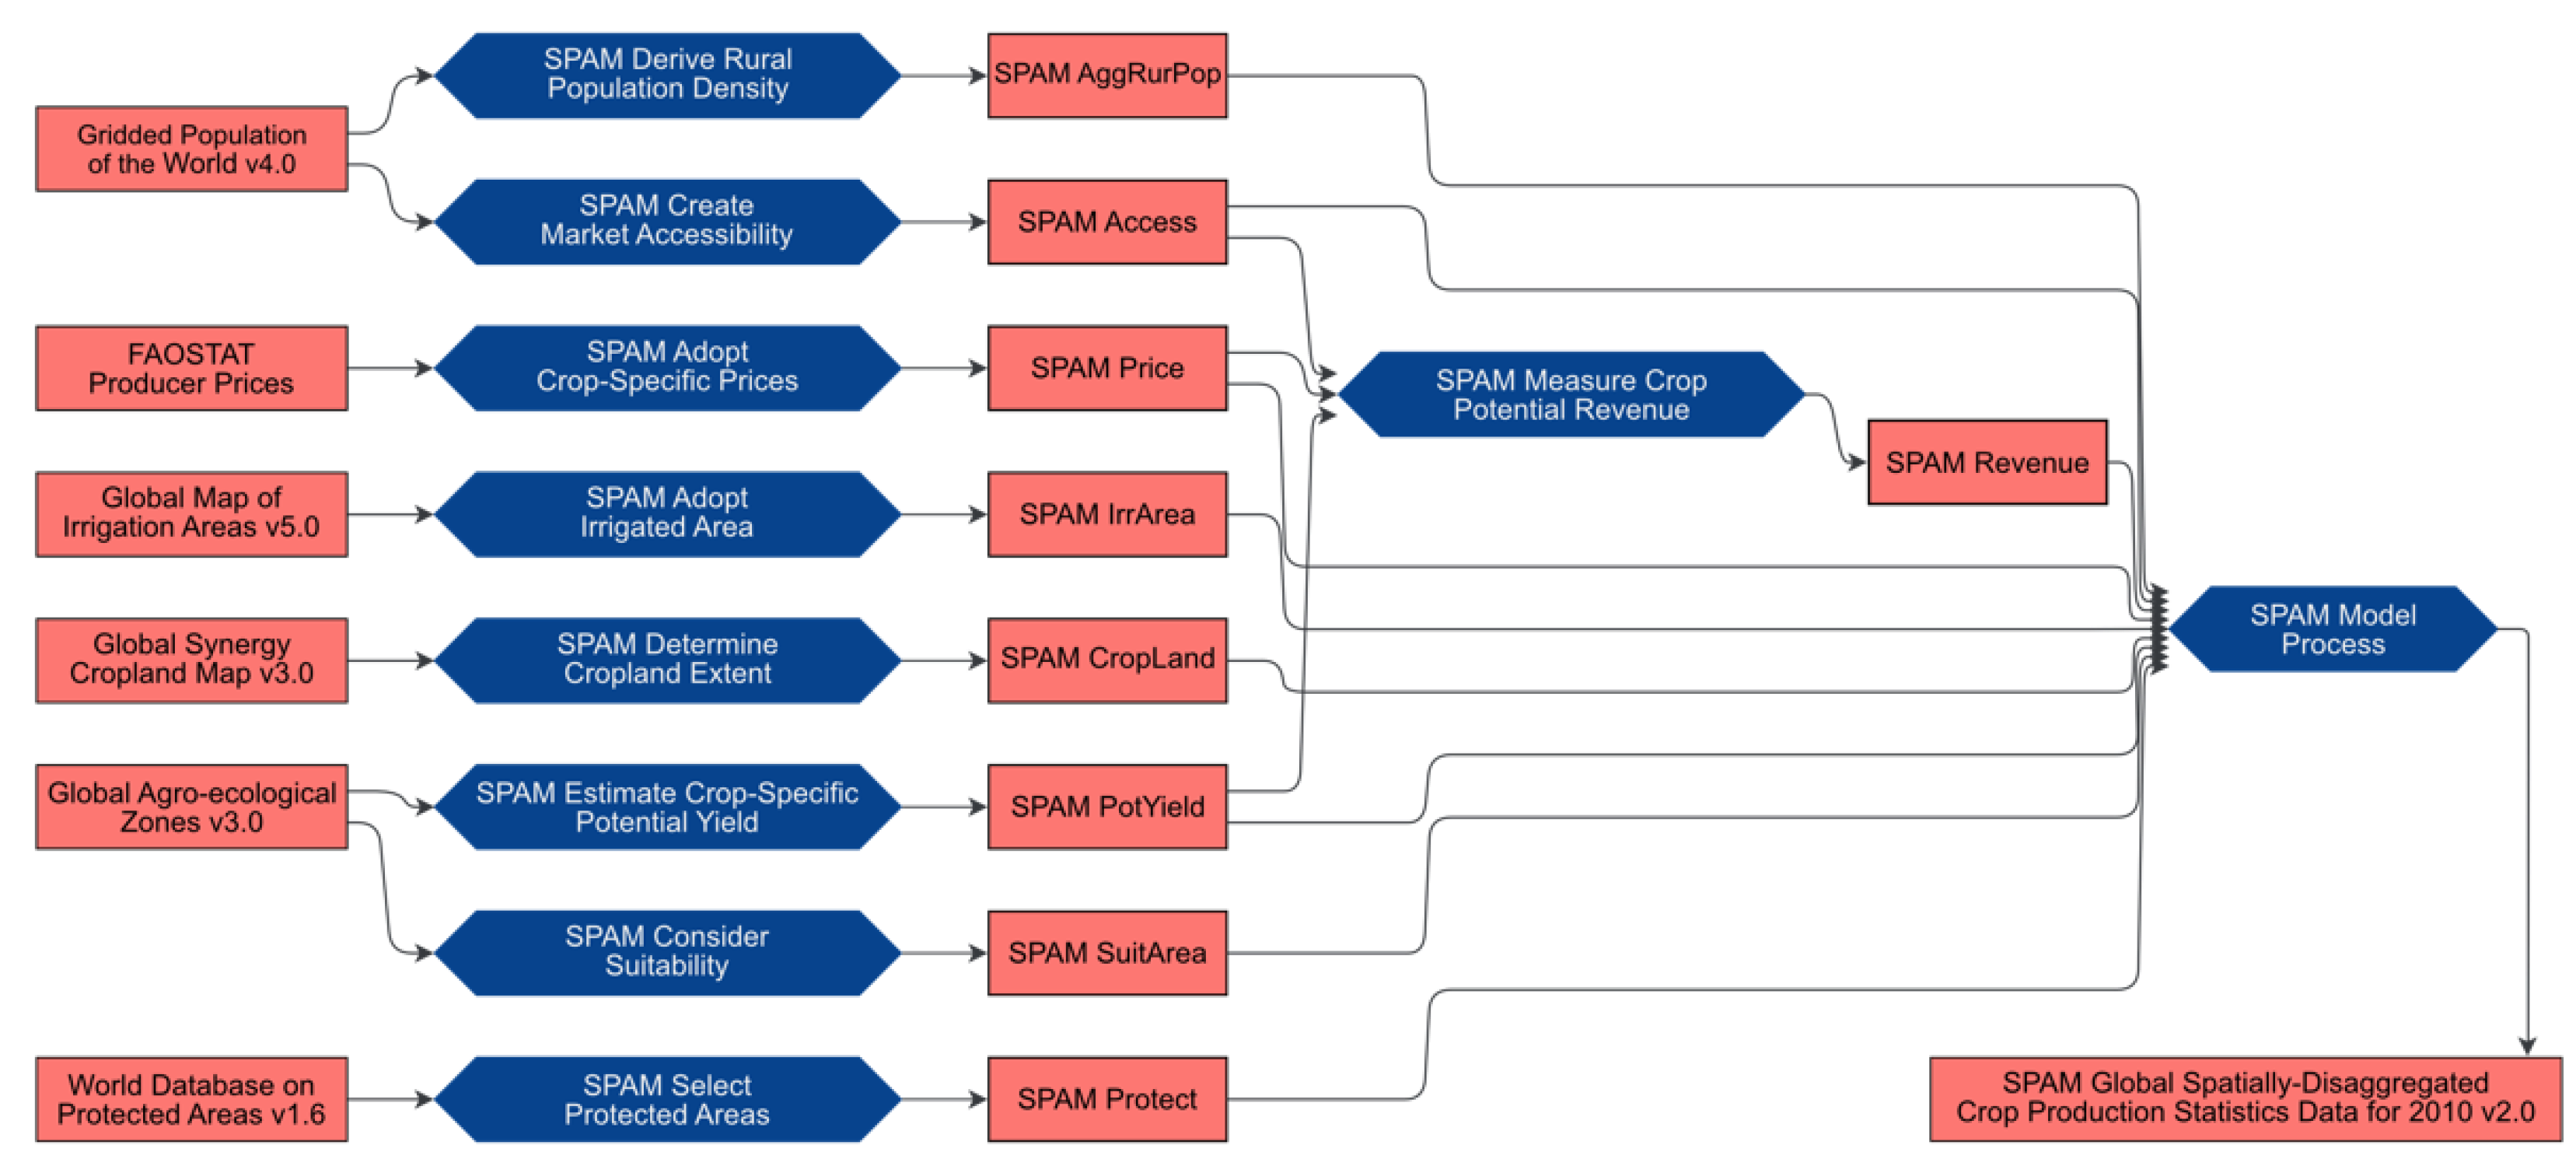
1.1. Example Dataset

We use the well-known Spatial Production Allocation Model (SPAM) 2010 dataset as a common example dataset for ESS [13,14]. The SPAM dataset series describes a community-driven data product that disaggregates crop statistics with different farming systems (Figure 2): irrigated high inputs production, rainfed high inputs production, rainfed low inputs production, and rainfed subsistence production. By using several inputs and a cross-entropy approach, the model output results in a global 5 arcmin grid of:
  • Physical area: area for a crop in the grid cell;
  • Harvested area: physical area multiplied with crop intensity to take into account possible multiple harvests per plot;
  • Yield: crop production per harvested area—the total yield is the weighted average of the four different farming systems;
  • Production: harvested area multiplied with yield—is equal to the whole yield biomass;
  • Value of production: crop price per grid cell—prices are globally harmonized and taken from average international crop prices of the Food and Agriculture Organization (FAO).
The paper and supplement in [15] describe detailed information about SPAM2010 and the dataset’s provenance and quality and provides a comparison to other regional datasets. Figure 2 describes the complex workflow of creating the SPAM2010 dataset as a simplified provenance graph. The SPAM model uses several open access input datasets, such as FAO-STAT producer prices [16] or World Database Protected Areas [17], as inputs. All of these input datasets (Figure 2, red rectangles on the left) are pre-processed, e.g., transformed, filtered, or aggregated (Figure 2, blue boxes next to inputs). The resulting datasets (Figure 2, middle; red boxes starting with name “SPAM” + <topic>) serve as input for the SPAM model (blue box on the right) that creates the SPAM2010 data series.

1.2. Related Work and Concepts

As the promise of quality serves as the basis for science, in cases of applying accepted methods and approaches to create high-quality data, data quality is closely related to openness, FAIRness, and data maturity [2,4,18]. Here, we describe these concepts as building blocks for our ESS-specific QA workflow starting with interdisciplinary concepts, followed by disciplinary concepts such as ISO quality measures.

1.2.1. Openness Measures

The openness of data can be evaluated with the 5-star deployment scheme for open data by Tim Berners-Lee [19]. First, it covers the data’s license, e.g., data usage requires citation of the source, or usage is limited to viewing, and modifying is not allowed. A well-known example for classifying data licenses is the creative commons licenses [20]. Second, it covers the provision of data including links to other resources facilitating machine-readable interlinked information gathering, and in the end facilitates evaluation of the data context. The five stars are defined as follows, whereas a dataset fulfilling the requirements for several stars also fulfils the conditions defined for less stars:
*Data available on the Web under an open license;
**Data provided as structured data;
***Data available in a non-proprietary open format;
****Usage of URIs to denote things, so that links to the data are possible;
*****Link the data to other data to provide context.

1.2.2. FAIR Indication

While the Berners-Lee concept focuses on semantic aspects such as structure, use of URIs, and linking, the FAIR principles cover further aspects. The FAIR principles—findability, accessibility, interoperability, and reusability—define a minimum of practices to foster the usability of data [21]. The RDA FAIR Data Maturity Model Working Group [22] proposes a maturity model referring to the FAIR principles consisting of indicators, priorities, and evaluation methods. The model includes 41 indicators classified by priorities into either essential, important, or useful. To enable the evaluation of progress for each indicator, the working group developed five indicator maturity levels, summarized the indicators and priorities to the FAIR areas (F, A, I, R), and proposed six compliance levels from level 0 (not FAIR) to level 5 (demand is fully met). Based on that concept, the FAIRsFAIR project [23] uses a subset of RDA FAIR indicators and developed 17 metrics addressing aspects such as automated measuring and the FAIR ecosystem (Table 1) [24]. Although their work is still in progress, the FAIR metrics are a valuable starting point from the ESS perspective.

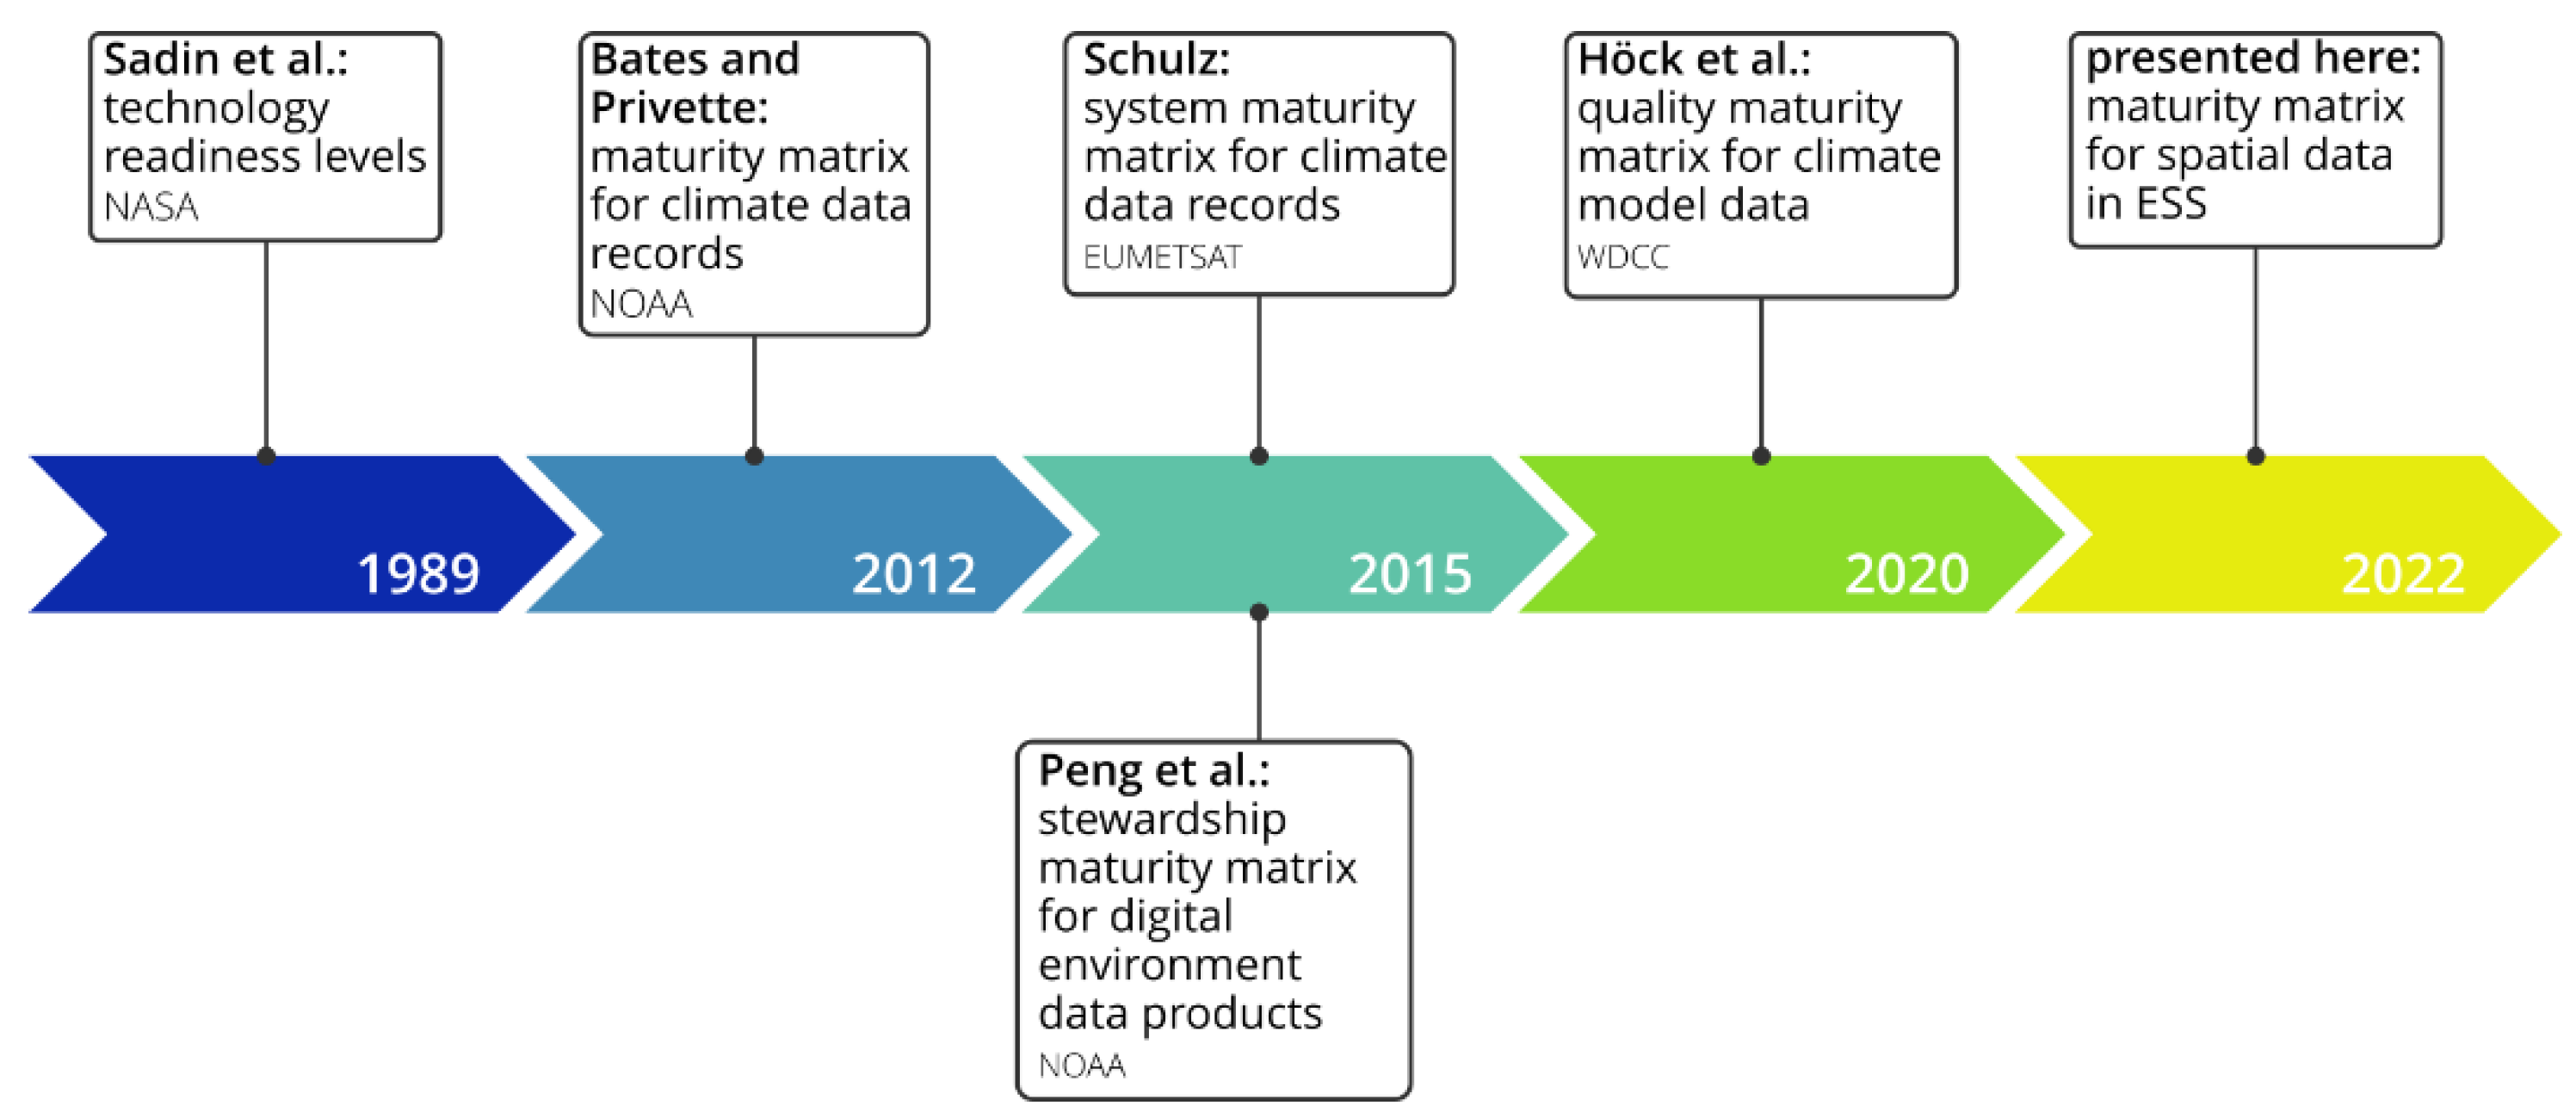
1.2.3. Data Maturity Modelling

A sound and usable QA concept as part of good RDM practices needs measurable parameters of the data’s maturity. Data maturity is an established concept for making results of QA evaluation visible. In several cases, researchers use data maturity as a central part in their basic workflow for curating and disseminating data quality information [18], and implement maturity as a part of the QA reports, e.g., for climate datasets [25]. Moreover, maturity modelling concepts are evolving from ad hoc approaches to managed processes [26]. The same author provides an overview of various maturity perspectives of data stewardship activities, activities that preserve and improve content, accessibility, and usability of data and its metadata [27]. As we focus on spatial data, three of the maturity perspectives fit best: dataset science maturity, dataset product maturity, and dataset stewardship maturity.
Figure 3 shows all considered maturity model approaches including our concept. The NASA technology readiness levels (TRL) serve as a basis and include an early attempt for a matrix built on maturity levels and associated descriptions. Refs. [28,29] describe the first and updated version considering levels and according descriptions of hard- and software. Ref. [30] adapted this concept and proposed a maturity matrix to assess the completeness of climate data records and implement the concept for multi-decadal climate data [31]. The matrix describes six categories (“thematic areas”)—software readiness, metadata, documentation, product validation, public access, and utility—in six maturity levels (rows). The levels 1 and 2 are associated with analysis and research purposes. In levels 3 and 4 an initial operational capability is achieved, including first usage in decision-making. Levels 5 and 6 (full operational capability) shall be reached to make reliable decisions based on the data. Ref. [32] uses this concept for an adapted use case (system maturity matrix) and develops a detailed sub-matrix for uncertainty that is based on product validation. Ref. [33] also uses the maturity matrix concept from [30] for a stewardship maturity matrix with a 5-level structure and broadened thematic areas (the authors call it key components). By streamlining the system maturity matrix in [32], ref. [34] developed the quality maturity matrix (QMM) for the needs of the German Climate Computing Centre long-term archive. They focus on dataset description and reduce the matrix to five maturity levels—concept, production/processing, project collaboration/intended use, long-term archiving, and impact/reuse stages. Furthermore, they describe metrics that facilitate evaluating the fitness for use following the FAIR data principles and other related standards and recommendations. The KomFor centre of competence for research data in the earth and environmental sciences [35] uses almost the same maturity level terms, and thus they indicate the relevance for Earth System Sciences.

1.2.4. Data Quality Measures

Data quality is one of the key aspects in proper data usage. Following [1], one of the major achievements for spatial research data is the raising awareness of data quality and its importance, considered by an increasing number of research projects that evaluate the fitness for use and external quality. Although [1] identified significant problems in evaluating the fitness for use by using available metadata, ref. [36] underpins these findings by interviewing spatial data users. They underline the necessity of data quality measures in metadata—although typically not applied in practice—and emphasize the importance of using standards and schemas, such as ISO 19xxx series or Dublin Core [37].
Appropriate data quality measures facilitate the content-based evaluation of the fitness for use. ISO 19157:2013 [10] provides a structured implementation of data quality measures for spatial data, often implemented in related XML-based schemas. However, data quality can also be described as linked data, e.g., by using the data quality vocabulary (DQV [38]). The advantage of the DQV is its extendible and open characteristics being flexible enough for several use cases. However, it is common data that quality vocabulary and spatial aspects such as positional accuracy or topological consistency must be added and described as the DQV profile.

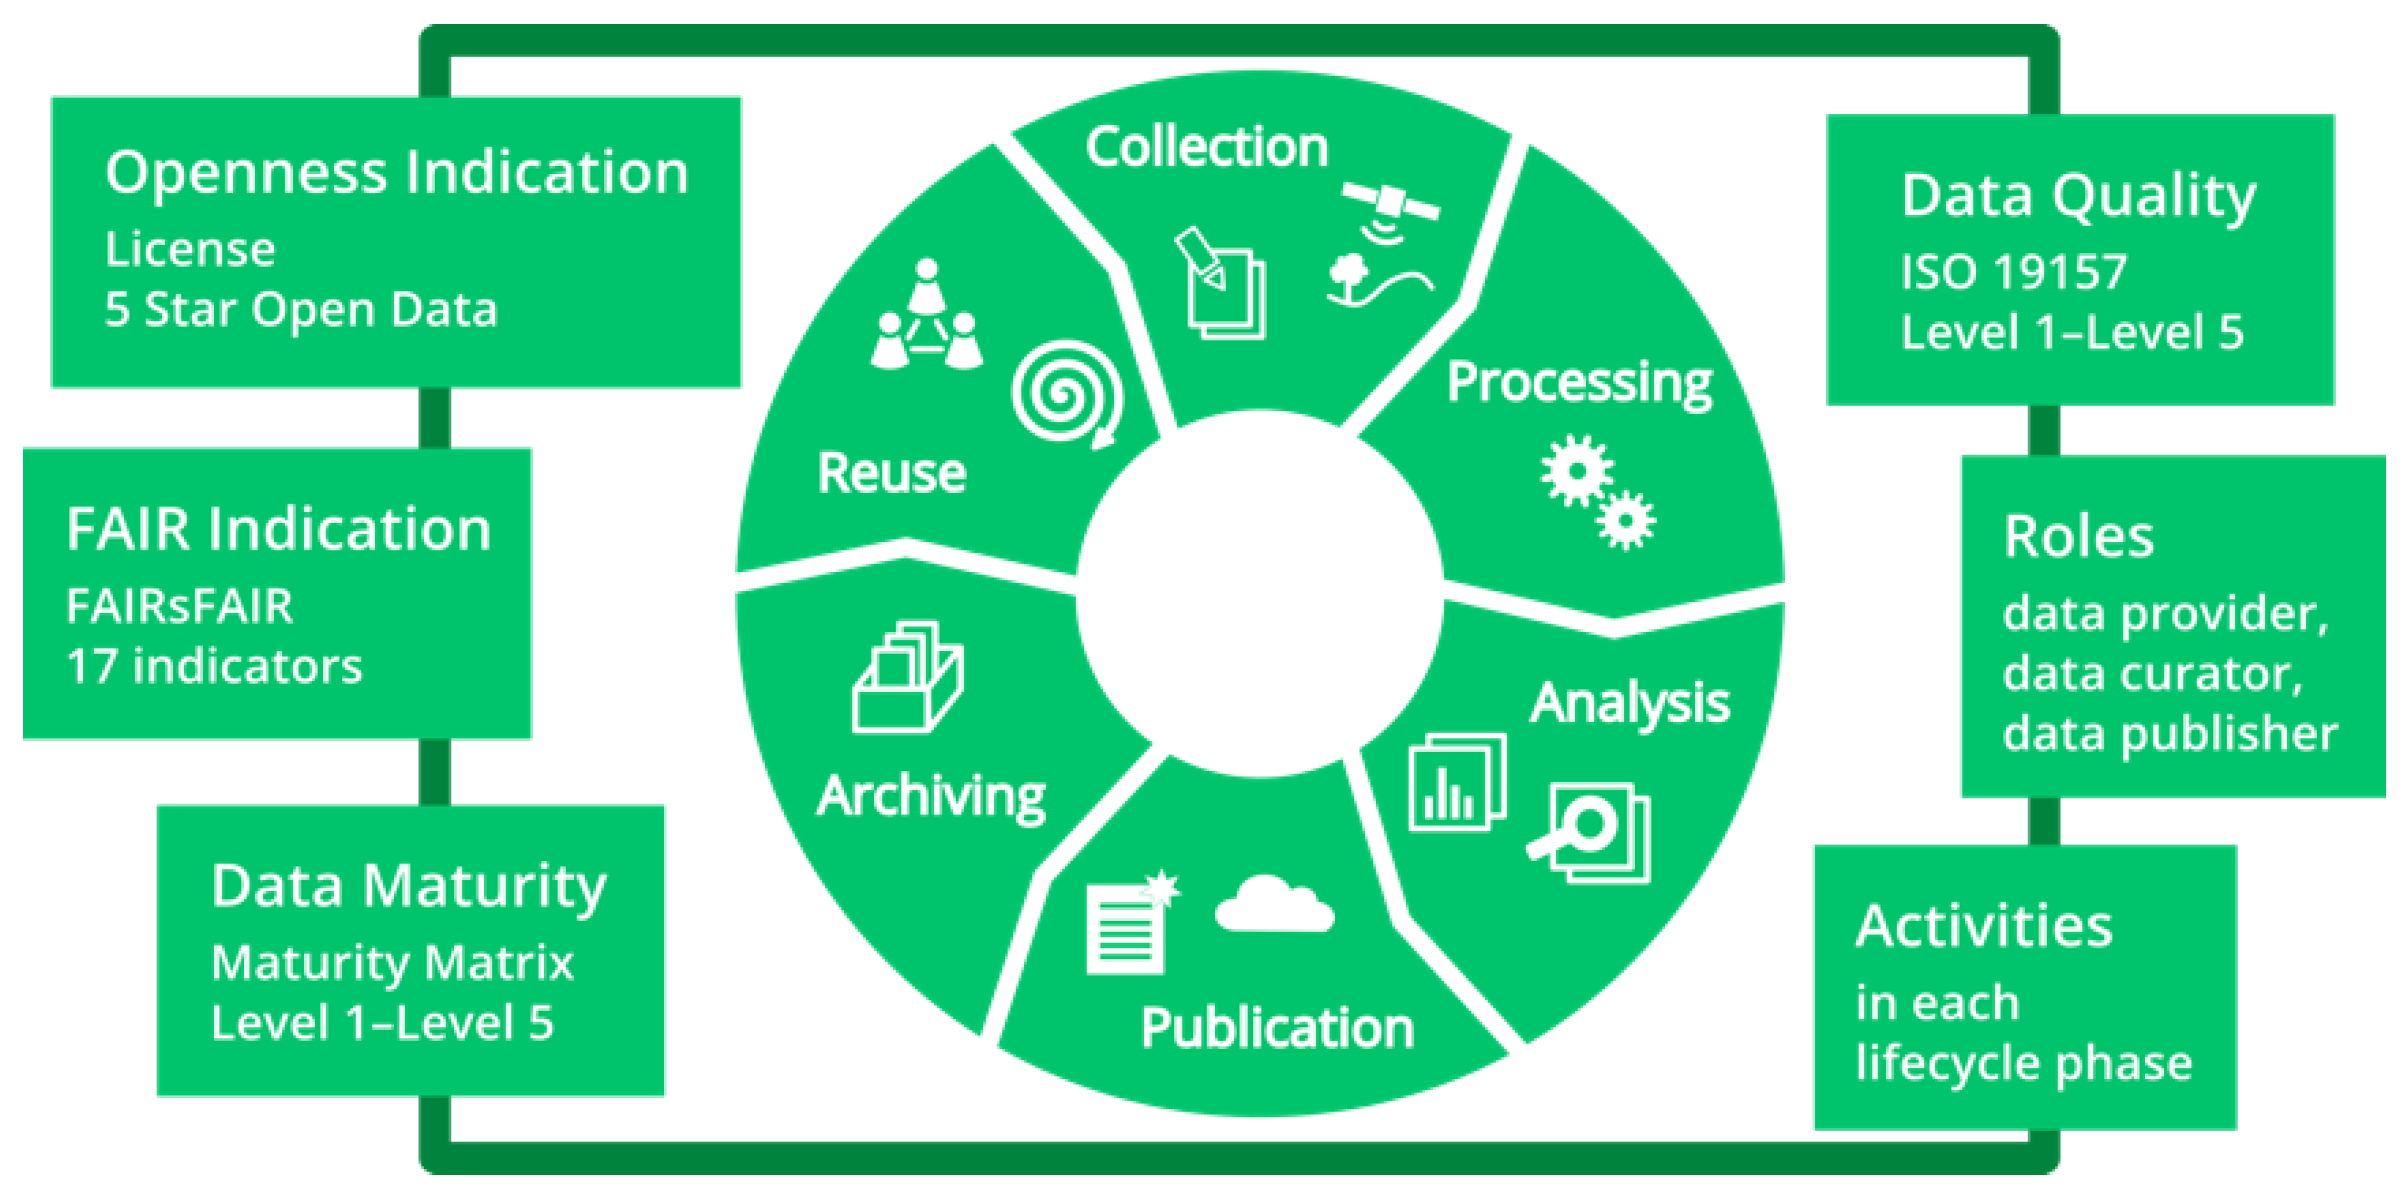
2. Methods—ESS Quality Assurance Concept

We propose an ESS-specific QA workflow concept for spatial research data integrating openness and FAIR indication, data maturity modelling, and spatial data quality measures. Our developed workflow consists of indicators, measures, activities, and responsible roles, which are whenever possible linked to or at least compatible with the phases of the data life cycle.
We assign five data levels to the data life cycle phases collection to archiving (Table 2). The reuse phase is skipped here, as it typically marks the start of the collection phase of a further, e.g., follow-up project. Each level is described as a set of separate level conditions for openness, data maturity, and data quality (Table 2). To assign the according level to a dataset, the dataset has to fulfil conditions for all three aspects. Moreover, to facilitate a quick interpretation, we encoded the level conditions with the aspect’s abbreviation (“Open”, “DM”, and “DQ” for openness, data maturity, and data quality), the sounding separator “4”, and the name of the phase, e.g., “DM4processing”. We predefine ranges for each level condition, facilitating data providers, data curators, or data publishers to adapt them to their use-case-specific needs (e.g., Open4archiving defines that a dataset is minimum 4-star open data). When a research group starts a data-oriented project, they typically establish internal rules, e.g., institutional or disciplinary, and recommendations on data usage. The researchers should therefore implement these rules by adapting/specifying our generic level conditions to their needs.
The QA workflow is developed to provide several QA steps for each phase of the data life cycle (according to levels in Table 2). Every step consists of a number of activities and decisions, which can be assigned to one of the three used roles. The following flow chart (Figure 4) outlines the QA workflow schema following the data life cycle from top to bottom with the roles: data provider (green), data curator (cyan), and data publisher (purple). The colour of the activities (rectangles) and decisions (rhombuses) show the assigned roles. The schema includes a predefined quality control process that is described in detail in Figure 5.
The following sections describe the level conditions for the general QA facets openness and FAIRness (Section 2.1.1 and Section 2.1.2). Discipline-specific QA facets for data maturity and data quality are covered in detail in Section 2.1.1 and Section 2.1.2. Moreover, Section 3 provides an exemplary assessment of all QA facets for the chosen ESS dataset example (see Section 1.1).

2.1. General Quality Assurance

2.1.1. Openness Measures

As Tim Berners-Lee’s 5-star deployment scheme for open data (Section 1.2.1) mostly fits the ESS use case requirements, we use the existing measures to evaluate the openness of data. Hence, we evaluate the data’s license and the degree of data accessibility and linking to other entities. However, we extend the concept of an open license type to potentially restricted licenses to allow a broader usage of our QA concept, e.g., licenses with full data access limited to giving credit to the data creator do not hamper the QA workflow activities (see Section 2.3).
For openness, we propose three different level conditions: Open4usage, Open4publication, and Open4archiving (compare Table 2). A dataset has to comply with a level condition’s requirement to be used in the related phase of the data life cycle. We propose the level conditions definitions as shown in Table 3.

2.1.2. FAIR Indication

The importance of FAIRness of spatial data is already well acknowledged in the ESS research community. The community-developed FAIRsFAIR metrics (Section 1.2.2) include common machine-readable metrics for data and its metadata. The metrics can be applied to ESS-specific research data and offer a comprehensive FAIR assessment, facilitating compatibility to other projects or disciplines. Moreover, it is possible to integrate these metrics into data maturity concepts (Section 2.2.1).

2.2. Discipline-Specific Quality Assurance

2.2.1. Data Maturity Modelling

The QMM provides a large and useful set of requirements for data used and produced in ESS use cases. It describes the maturity in a reasonable level of detail and clarifies/adds information about requirements and improvements. Thus, we use the QMM ([34], see Section 1.2.3) in our QA workflow. As the QMM concept is limited to climate data and relevant themes, we adapt the concept to meet general ESS requirements. Thus, from the ESS perspective, we propose the following modifications: (i) simplify the matrix to fit to researcher’s routines, (ii) explicitly integrate FAIRsFAIR metrics to make the related dataset’s FAIR state more visible, (iii) broaden/extend the QMM concept to facilitate usage for spatial research data, and (iv) facilitate ESS-specific collection of thematic areas. Although the FAIRsFAIR metrics can be mapped to the existing QMM entries, we implement a linking of both concepts to ensure visibility and compatibility to similar approaches.
Our proposed maturity matrix describes 5 maturity levels (Table 2) combined with 4 criteria, 9 aspects, and concrete metrics, including all 17 FAIRsFAIR metrics (Table 1). Additionally, we propose four level conditions for data maturity coinciding with data maturity levels 2 to 5: DM4processing, DM4analysis, DM4publication, and DM4archiving (see Table 2). Level 1 is reached immediately after data creation. To reach a higher maturity level, the dataset must fulfil the according criteria (see below). The criteria are selected and adapted from [34] and renamed to distinguish them from the data quality measures (Section 2.3.2) that are included in our concept as well. Table 4 summarizes criteria and aspects for data maturity.
The first modification objective (see above) is to simplify the usage of QMM in our QA concept. The QMM incorporates several measures referring to the open archival information system model (OAIS, ISO 14721:2012 [39]). For the QA workflow presented here, the long-term preservation of data covers only a minor aspect. Therefore, we decided to remove OAIS-specific aspects. In addition, we removed further measures due to redundancy reasons specifically for the ESS use case (cp. Appendix A).
After the first iteration of developing the ESS maturity matrix, we further revised the matrix by reordering level content for the ESS perspective (third/fourth modification objective), and we established a single matrix entry for each FAIRsFAIR criterion to foster the FAIRness of data (second modification objective). Here, we only include the revised matrix part for criterion integrity in Table 5 as an example. The revised matrix parts of the criteria technicality, accessibility, and validation are provided in Appendix A (Table A1, Table A2 and Table A3).
The modified maturity matrix for the criterion integrity (Table 5) consists of two aspects. Here, we applied several modifications and level changes due to the following reasons. (i) As metadata are already required for data in level 2, an earlier usage of disciplinary and target repository standards than proposed in QMM is strongly recommended. (ii) Most geospatial datasets and the related metadata are already digitalized or will be digitalized at the project’s beginning. Thus, metadata shall be machine-readable at earlier stages than in the original QMM to foster collaborative work. (iii) General metadata are already given for datasets in level 2. To avoid complex and error-prone metadata (format) changes, we strongly recommend using a formal knowledge representation language earlier than in the QMM, in collaboration work (level 3). (iv) Using semantic resources is substantial for high-quality products and future use of the data. To underpin this, we require the use of semantic concepts in lower levels than the QMM. (v) The importance of semantic resources is strongly coupled to the use of linked data and linking to related content. Hence, all semantic and linked-data-related indicators shall be used in the same maturity level. (vi) Provenance information fosters transparent research, and in the end, reproducibility. Several automated provenance tracking tools already exist and can be easily used when integrating into RDM at early stages. These tools can even track runtime parameters. Therefore, provenance information should be gathered in a well-defined format already from the beginning of the model creation in level 2 instead of level 4, as proposed in the original QMM.
The maturity matrix for the criterion technicality (Table A1 in Appendix A) includes the three aspect formats, versioning, and controlled vocabularies. Here, we removed several criteria (OAIS-related, see above) and included a FAIRsFAIR metric to foster reproducibility. The level of FsF-R1.3-02D (data are available in a file format recommended by the target research community) is changed from level 4 to level 3. Spatial datasets are mostly available in digital formats, and to avoid error-prone transformations, well-defined community standards should already be used at collaboration level 3.
The criteria accessibility and validation (Table A2 and Table A3 in Appendix A) do not have level changes for specific measures. However, some measures are removed to simplify the usage of the data maturity matrix. The criterion accessibility covers options to retrieve the data and the metadata, whereas criterion validation includes the potential errors and the data’s statistical characteristics.

2.2.2. Spatial Data Quality Matrix

The previously described concepts of openness and FAIRness describe common research data concepts and can be applied in several scientific domains. The data maturity matrix covers some ESS-discipline-specific aspects but can be applied/adapted to other domains easily. For data quality measures, we must consider spatial aspects. We therefore propose the concept of a spatial data quality matrix combining ESS-specific data quality classes for spatial research data as one dimension with the previously introduced levels (Table 2) as the second dimension.
ISO 19157:2013 [10] offers a broad range of spatial data’s quality aspects and measures, structured as data classes and sub classes. We map ISO data quality classes, related sub classes, and measures to specifically develop data quality levels. A level summarizes several required measures with associated values, which addresses the needs of the ESS community and reflects the characteristics of spatial data.
When applying our developed level concept (Section 2), a dataset immediately reaches level 1 after its creation. To reach a higher level, data quality information needs to be available and the given quality value(s) have to fulfil the level conditions of the related quality measures. Data quality is important for levels 2 and 3 as there is a direct interaction between data providers and data users—and quality information should be available and understandable for several parties, e.g., facilitating the evaluation of fitness for use. Levels 4 and 5 are used for publication and impact research/archiving purposes. In the latter case, the target research group will often adapt the level conditions to meet their own specific project’s or use case’s requirements.
Here, we provide an example for ESS-specific levels and level conditions and define the level for each quality element with particular regard to global geospatial time series of land-use data (cp. Section 1.1). Table 6 provides the data quality classes and sub classes with a short description and related levels. For instance, a value given for absolute external positional accuracy is required and must exceed the defined threshold for level 3 compliance. Focusing on a simple usage of the developed QA workflow, we do not assume stricter threshold values for higher levels. Thus, if a dataset complies with level 3 in absolute external positional accuracy, level 4 and 5 requirements are met as well.
Appendix B provides a modified set of ISO 19157:2013 [10] measures for each data quality sub class (Table A4, Table A5, Table A6, Table A7, Table A8 and Table A9). Modifications include the selection of data quality measures for each class and added measures for metaquality.
Some of the data quality measures require additional reference data, also called ground truth. For absolute external positional accuracy and the gridded data positional accuracy, a spatial ground truth is required to evaluate the current dataset. Further, to assess the accuracy of a time measurement, we need a temporal reference, and evaluating the temporal validity requires valid dates, time spans, and/or resolution. For the assessment of the consistency, valid concepts must be given. For conceptual consistency, some standard concepts, e.g., non-overlapping polygons with mutually exclusive attributes, could be used or adopted. Evaluating the domain consistency requires the use of a thematic domain description, which can be provided as ontology, or vocabulary of valid attributes or value ranges for quantitative data. To evaluate the format consistency, we need related format definitions, provided as a list of valid formats or detailed descriptions of specific formats. A ground truth of classes is required to assess the thematic classification correctness and to evaluate non-quantitative attribute correctness and quantitative attribute accuracy.
For data quality, we assume five level conditions: DQ4usage, DQ4processing, DQ4analysis, DQ4publication, and DQ4archiving (compare Table 2). In contrast to data maturity measures, data quality measures need threshold values for all level conditions. Table 7 provides an overview of measures for the completeness class with a generally permitted 5% rate of excess and missing data. However, this rate can be adapted for other use cases.
The applied ISO 19157:2013 concept provides a comprehensive set of data quality classes, sub classes, and measures. It is obviously not feasible to apply every metric for every use case. For instance, if a dataset is not a time series, information about temporal quality is not required. Furthermore, for datasets used in use cases without ground truth information, albeit ground truth being necessary to evaluate a particular data quality measure, the related measure can be ignored without failing the overall evaluation of the dataset.

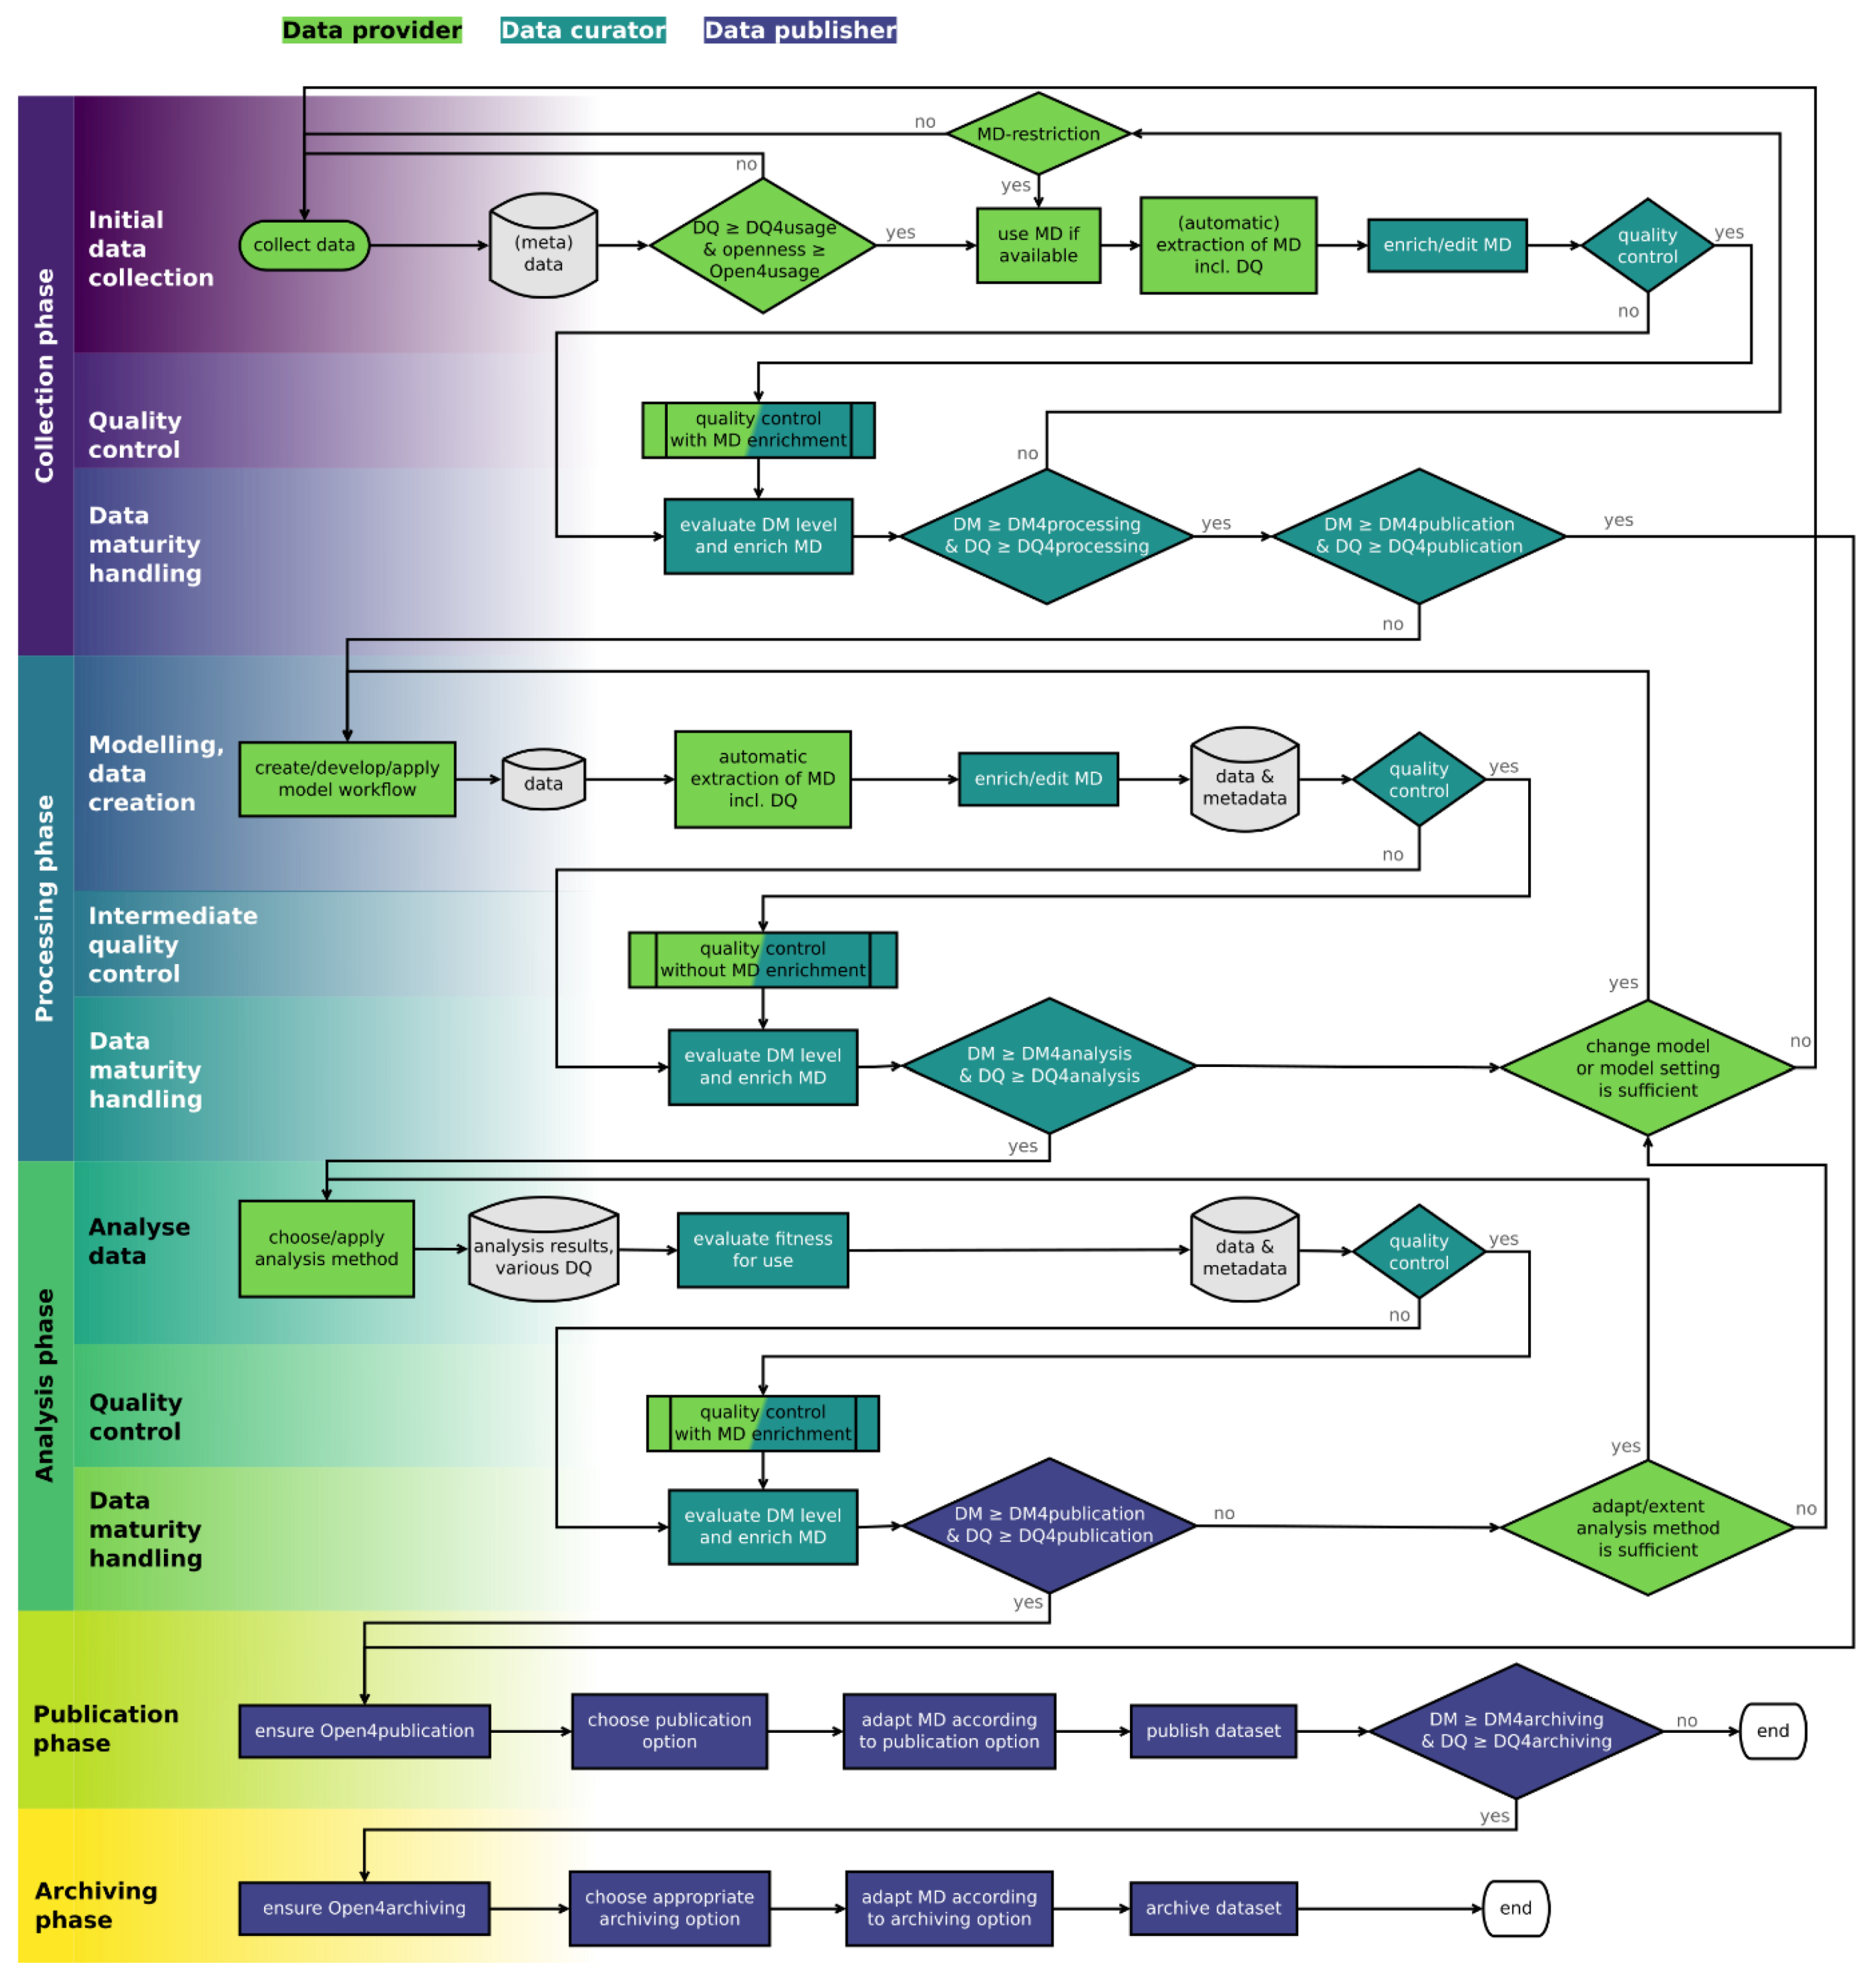
2.3. Roles, Activities, and Descriptions along the Data Life Cycle

The previous Section 2.1 and Section 2.2 describe the aspects we combine in the QA workflow. Using this information, the following sections describe activities, responsible roles, and level attributions for each phase. To better understand the linked activities and roles, Table 8, Table 9, Table 10, Table 11, Table 12, Table 13 and Table 14 use the same background colours for steps and roles as used in Figure 4 and Figure 5.

2.3.1. Preliminary Phase

Before beginning data management, monitoring, and reporting activities during the data life cycle, data providers, data curators, and data publishers have to define measures and level conditions for openness, data maturity, and data quality depending on the project or use case characteristics. Table 8 summarizes all necessary activities.

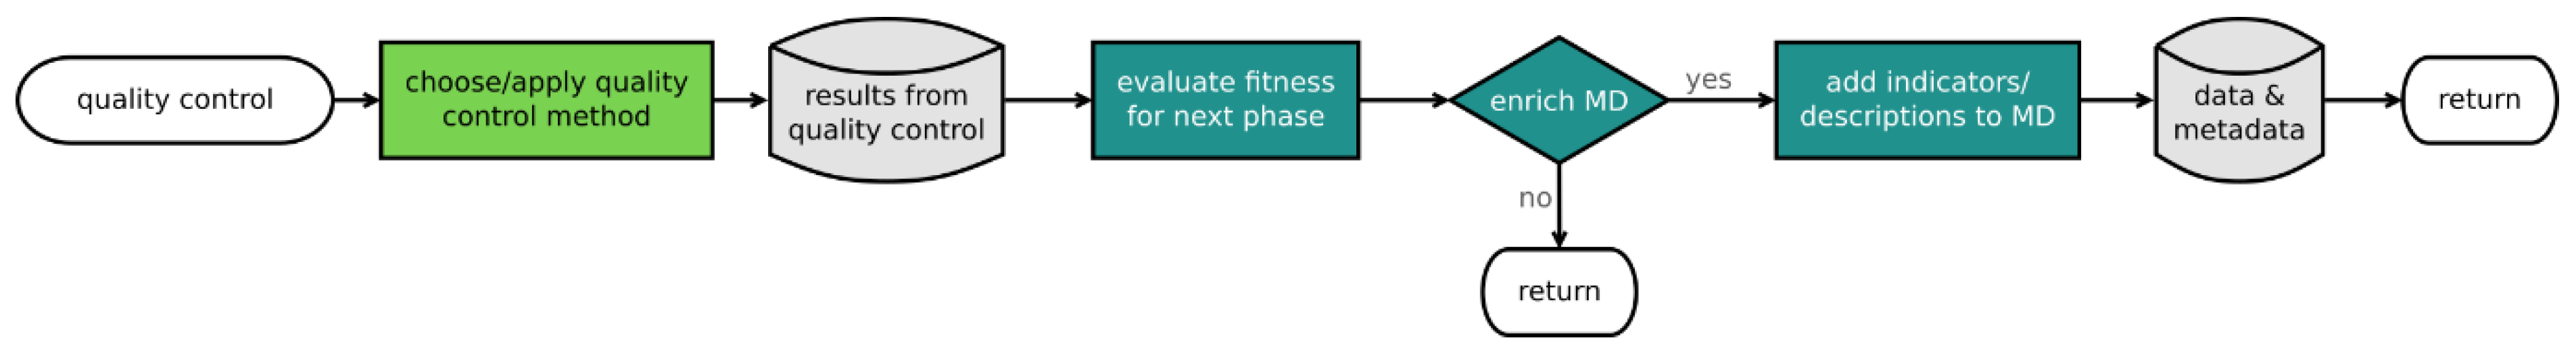
2.3.2. Predefined Quality Control Process

The quality control as a predefined process can be found multiple times in the QA workflow: in the collection phase, the processing phase, and the analysis phase. The quality control starts with choice and application of a suitable QA procedure, including measures and value thresholds definitions. The results are used for assessing whether the dataset is prepared and usable for the next phase in the data life cycle. Depending on the phase, the indicators and results shall be added to the metadata. Table 9 comprises the activities of the quality control process.

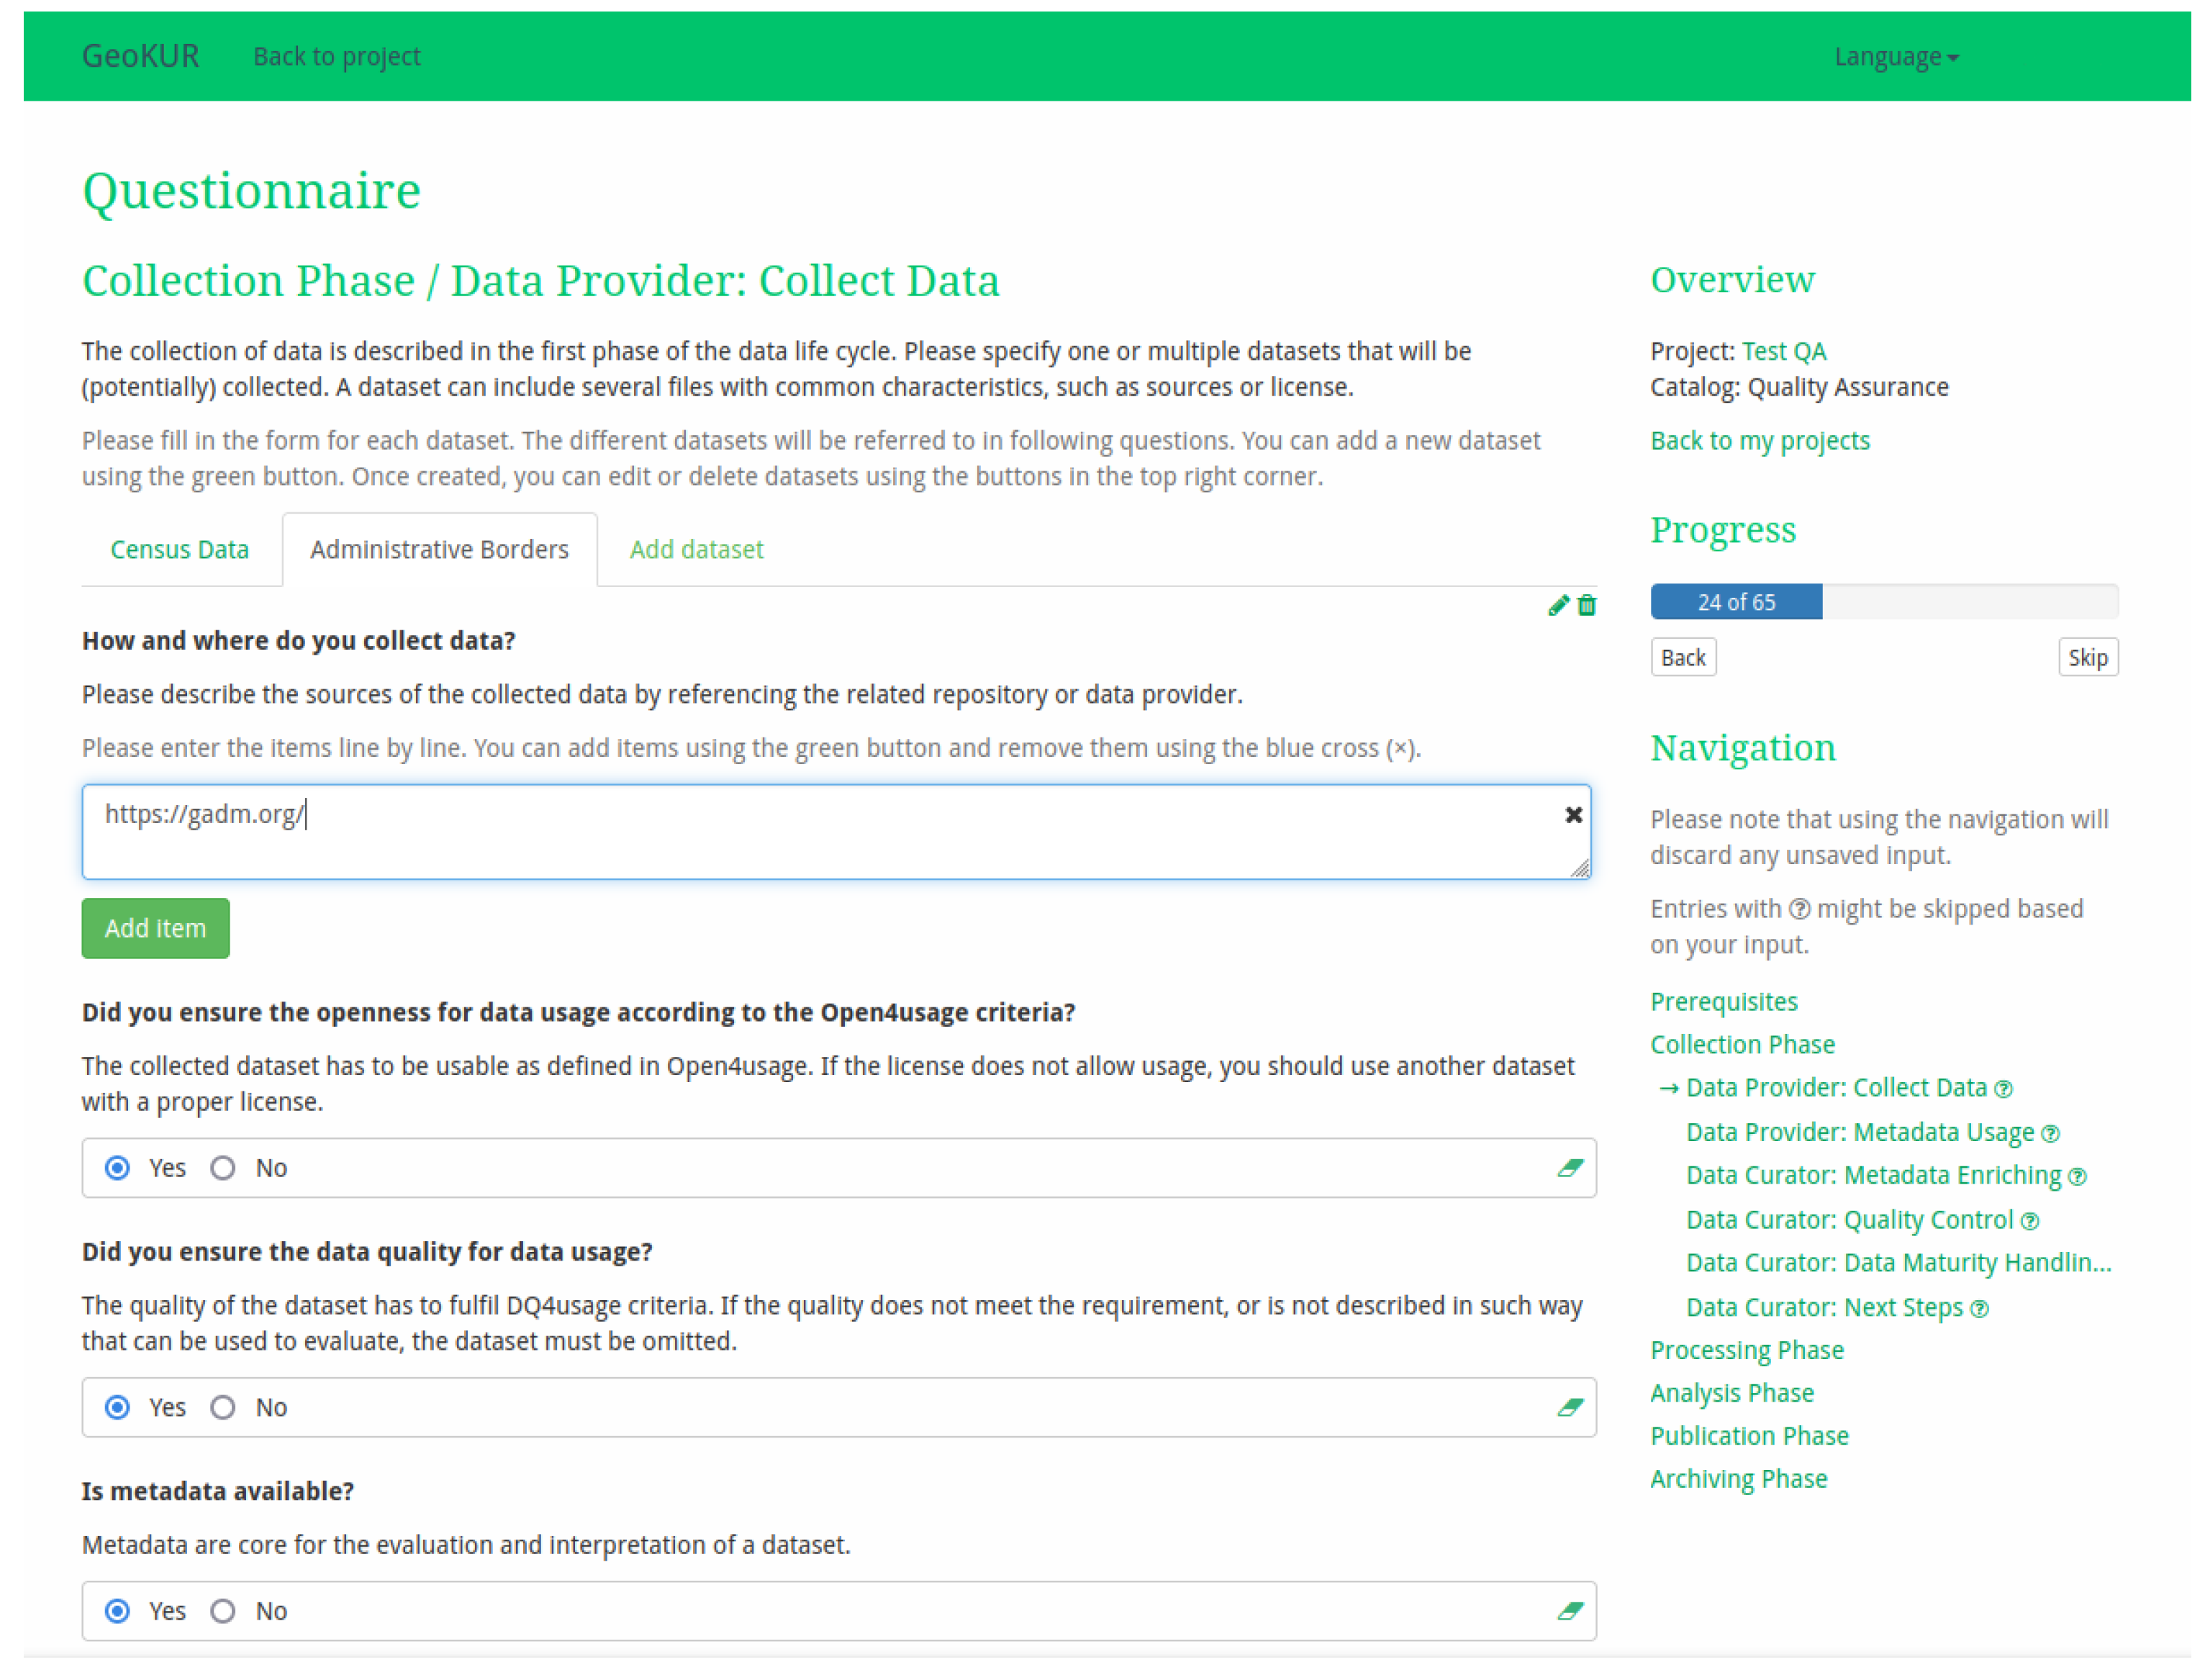
2.3.3. Collection Phase

In ESS, the typical collection phase includes three major steps for QA: the initial collection, the quality control, and the data maturity handling. The initial collection includes data and metadata discovery and the related collection and metadata extraction of spatial data. Then, the data curator has to decide whether a quality control step is useful or not. Quality control is of particular interest if the data’s trustworthiness cannot be evaluated, e.g., by metadata or a data provider’s reputation, or if the data producer collects the data by observing, e.g., applying remote sensing methods.
Data maturity or data quality assessment can fail level 2 conditions of DM4processing or DQ4processing due to missing or faulty metadata or data. In the first case, the data curator should repeat the metadata collection and enriching. In the second case, a new dataset should be discovered and collected.
If the data maturity’s and the data quality’s values for level conditions fall in between DM4processing and DM4publication, or DQ4processing and DQ4publication, the data can be passed to the processing phase. In the case that both DM4publication and DQ4publication (level 4) conditions are fulfilled, and the data can be prepared for publication. This especially applies to data collected from sensors by the data provider.
Table 10 lists the roles, the activities, and their descriptions for collection phase.

2.3.4. Processing Phase

The ESS-specific QA in the processing phase typically consists of three steps: modelling and data creation, respectively, data processing, intermediate quality control, and data maturity handling. The modelling and data creation describes the used model workflow and/or processing, which can consist of an arbitrary number of linked modelling/processing steps. The data curator can advise an intermediate quality control assessment with a set of simple quality checks. This facilitates identifying and rejecting unsuitable results—in early data processing stages—immediately after data modelling.
With the results of data quality and data maturity evaluation, the data curator can decide whether the data are suitable for the analysis phase or not. If either DM4analysis or DQ4analysis conditions are not met, the data provider has two options: (i) Adapt the setting of the model workflow or the model workflow itself needed to improve the results. (ii) Collect new input data, because the used input data do not fit to the model workflow. If the data maturity and the data quality evaluation fulfils the requirements of DM4analysis and DQ4analysis (level 3), the data can be used for further analysis in the analysis phase. Table 11 provides an overview of roles, activities, and descriptions for the processing phase.

2.3.5. Analysis Phase

The analysis phase of the QA workflow consists of three major steps: data analysis, quality control, and data maturity handling. The analysis of spatial data typically includes detailed tests. However, if the analysis results are not limited to the use case’s/project’s objectives and the model directly includes quality control mechanisms/algorithms, a separate quality control assessment can be omitted.
If the data maturity or the data quality do not satisfy the requirements of DM4publication or DQ4publication conditions, the data provider has two options. First, the analysis methods can be adapted or extended to fulfil the necessary criteria. Second, the processing phase has to be repeated with changes in the model or related inputs. If maturity and quality of the data fulfil the conditions of DM4publication and DQ4publication (level 4), the data can be used for publication.
Table 12 gives an overview of activities in the analysis phase.

2.3.6. Publication Phase

Within the publication phase of the QA workflow, data are made publicly available in an appropriate structure and format. In ESS, scientific data are typically published in a well-known repository and linked to a scientific publication. Table 13 provides an overview of publication activities and involved roles. After data publication, the data publisher decides whether the data have to be archived. If the data’s maturity or quality do not comply with DM4archiving and DQ4archiving conditions, the data do not have to be archived, and the QA workflow is finished. Otherwise, if the requirements of DM4archiving and DQ4archiving (level 5) are met, the dataset can be archived.

2.3.7. Archiving phase

The archiving phase is the last phase in the data life cycle. It is reached if the data are evaluated as a valuable resource for further (possibly impact) research. In ESS, several disciplinary repositories facilitate long-term availability of the data. All activities and the descriptions are provided in Table 14.

3. Results—Application to a Land-Use Dataset

3.1. Openness Evaluation for the SPAM2010 Dataset

SPAM2010 is licensed under a Creative Commons Attribution 4.0 International License (CC BY 4.0 [40]). According to the 5-star deployment scheme, we rate SPAM2010 as three stars open data (3.5), which is justified as follows: SPAM2010 is shipped as structured data (2-star), and made available in the two non-proprietary open formats CSV and GeoTIFF (three stars). The metadata can be downloaded via the Harvard Dataverse repository [14]. Some metadata elements contain links using URIs to denote targets. Hence, in these cases it can be rated as 4-star open data, and for the other cases it can only be rated 3-star open data (overall result 3.5). However, SPAM2010 misses the 5-star level, which requires links to other resources to provide context, e.g., vocabularies for crops, used units, column naming.

3.2. Evaluation of FAIR Indication for the SPAM2010 Dataset

The SPAM2010 datasets offer an approach of dataset provision increasingly often used in the ESS community. Such datasets are typically hosted in a central repository, which properly implements the FAIR concept. Thus, the SPAM2010 datasets implement most of the assessed FAIRsFAIR metrics (Table 15). However, to improve the evaluation for FsF-I3-01M (metadata include links between the data and its related entities), metadata should include links to input data, ORCID [41] for contributors, or ROR [42] for organization. Further, the metadata do not cover provenance information (FsF-R1.2-01M—metadata include provenance information about data creation or generation). Moreover, FsF-R1.3-01M (metadata follow a standard recommended by the target research community of the data) is only partly supported by providing metadata structured as Dublin Core. However, domain-specific standards, such as ISO 19115-1:2014 [43] or GeoDCAT [9], are not used.

3.3. Data Maturity Evaluation for the SPAM2010 Dataset

The maturity assessment of the SPAM2010 dataset requires the evaluation of the metadata [14], the related webpage with detailed descriptions [13], and the accompanying publication [15]. Table 16 shows the evaluation results for each criterion. SPAM2010 mostly reaches maturity levels 4 or 5. The few exceptions with ratings on level 1 or 2 mostly refer to the metadata content (criterion integrity). The provenance, describing the history of the data, and the data quality are not described in the metadata, but included in the publication or on the SPAM2010 website. Furthermore, references to input data are missing in the metadata. For the criterion accessibility, the checksums are missing.

3.4. Data Quality Evaluation for the SPAM2010 Dataset

SPAM2010 metadata do not include data quality aspects. Hence, we evaluate the data quality based on the data and the related scientific publication, by a combined manual and tool-based evaluation.
Several classes cannot be evaluated for different reasons: (i) The positional accuracy lacks a ground truth for assessment. (ii) The dataset is not a time series, i.e., temporal quality measures cannot be assessed. (iii) For thematic accuracy, we need specific ground truth data, which are not provided by the SPAM2010 data producers. Statistics for misclassifications or the correctness of quantitative attributes, e.g., crop yield, are lacking, and we cannot evaluate the non-quantitative attributes such as administrative unit or temporal reference.
However, we can evaluate the other classes. The measures of logical consistency are all met. All items are compliant with the concept (required for level 2 or higher), the domain (required for level 4 or 5), and the format (required for level 4 or 5). The dataset does not contain slivers, self-intersections, or self-overlappings (inherent to raster data; required at level 5). Moreover, when evaluating the completeness, the dataset has no missing data—each cell has values for each crop. The raster data also do not contain excess data (cp. Table 7; required for level 3 or higher).
The confidence and the homogeneity in metaquality are not given in SPAM2010. Regarding the representativity, the number of points per area is about 1/100 km2, the number of temporal units is 1, and the number of thematic units is 42 (crops). We assume that these values meet the data publisher’s specification. Hence, the representativity meets level 4 requirements.
The usability element in [10] is not well defined, also due to the wide range of possibilities [45]. Even regarding this multitude, usability information is not provided in the metadata. However, the website for the SPAM product family (see Section 1.1) offers a collection of potential usages as well as a list of publications using SPAM data.
Altogether, SPAM2010 offers a limited number of data quality elements. The derived measures comply with level 5. Potential data users might have their own data quality requirements and can therefore either trust the data, e.g., due to a data provider’s reputation, or evaluate methodology descriptions, provided in the Supplemental Material of the publication and on the website.

4. Discussion/Conclusions

To support applying the presented QA workflow along the data life cycle, we suggest using a management software that fosters tracking, monitoring, and reporting of all activities and responsibilities. The research data management organizer (RDMO [46]) is an open-source software mainly implemented for systematic data management planning, organization, and implementation. RDMO provides mechanisms to publish a catalogue of questions, options, conditions, and tasks. Thus, we implemented a QA workflow questionnaire and mapped the QA activities to the tasks, and the maturity and quality assessments to the questions.
With the questionnaire, data providers, data publishers, and data curators will be guided on how to perform activities and manage and monitor decisions and results (exemplary screenshot in Figure 6). Moreover, progress bars facilitate monitoring the overall progress. In addition to the questionnaire, standardized views can be prepared in RDMO. The user can look at these views and export them to various formats, if requested. This can be used for further automation based on particular answers in the questionnaire. Several (currently mostly German) universities/libraries use RDMO for creating and managing data management plans with positive feedback to the RDMO community. That underpins the suitability of the questionnaire type as a tool for a project-accompanying QA.
To facilitate the creation and reuse of the questionnaire and reduce manual efforts in the RDMO user interface, we implemented a Python script to automatically create the questionnaire and manage relations of tasks, questions, etc. The questionnaire and the script are published as an open-source project on GitHub [47].
In this paper, we presented concepts and a complex workflow for quality assurance of ESS-specific data as well as an implementation. We reviewed several existing QA approaches with and without domain-specific focus. The results were combined with our experiences in guiding ESS data producers in software-related QA and used as input for our QA concepts and workflow.
Generally, there is a discussion going on whether it is more effective to collaborate with groups maintaining well-known standards to incorporate spatial data than to establish methods/workflows solely dedicated to spatial data [48]. Ref. [18] points out the advantages of compiling guidelines for quality information, e.g., the living document in [2], as a community effort. Thus, the community develops a consensus that is likely taken into effect.
ISO 19157:2013 [10] implements a comprehensive list of quality elements. However, there is no similar standard available for data maturity measures/levels. Future work should foster including data maturity elements in the metadata schema, and thus making the maturity assessment and results available and transparent.
By now, quality assurance cannot be fully automated. However, we envision the development of a software-supported extraction and tracking tool for data maturity and data quality elements. Moreover, lightweight and user-friendly visualizations of the (extracted or tracked) quality information—e.g., provided as a dashboard with specific views for data providers, data curators, and data publishers—can foster guidance for the quality assurance workflow.
Future work should include putting more effort into the automation of the processes, as this would encourage a more effective/efficient use and avoids hampering the data producers by technical issues. Formalized and machine-readable criteria could be used to create automatic QA checks. Defining and linking a set of them to datasets, data types, and their metadata (elements) could reduce manual work to a minimum. Further, it facilitates the data producers to focus controlling the (correct) use of metadata standards (e.g., discover a measure definition in a registry and check the correct use of the related elements) or the use of controlled vocabularies for comparing quality metadata.
Furthermore, a transformation of the workflow to the data curator’s perspective can offer a practical curation method. Related views in RDMO can even support the curation without the need of additional software.

Author Contributions

Conceptualization, Michael Wagner and Christin Henzen; methodology, Michael Wagner and Christin Henzen; software, Michael Wagner; validation, Michael Wagner and Christin Henzen; formal analysis, Michael Wagner; investigation, Michael Wagner and Christin Henzen; resources, Michael Wagner; data curation, Michael Wagner; writing—first draft preparation, Michael Wagner and Christin Henzen; writing—review and editing, Michael Wagner and Christin Henzen; visualization, Michael Wagner. All authors have read and agreed to the published version of the manuscript.

Funding

The workflow for quality assurance for spatial research data was developed in the projects GeoKur and NFDI4Earch. We thank the BMBF (Federal Ministry of Education and Research) granting GeoKur under number 16QK04A.

Institutional Review Board Statement

Not applicable.

Informed Consent Statement

Not applicable.

Data Availability Statement

The Spatial Production Allocation Model (SPAM) 2010 dataset series can be downloaded at https://www.mapspam.info/ (accessed on 16 March 2022) [13]. Further information is published in [15].

Conflicts of Interest

The authors declare no conflict of interest. The funders had no role in the design of the study; in the collection, analyses, or interpretation of data; in the writing of the manuscript, or in the decision to publish the results.

Appendix A. Data Maturity Matrix

We developed the ESS-specific maturity matrix by adapting Höck’s QMM [34]. We removed OAIS-related measures (Section 2.2.1) and two measures for other reasons: (i) The measure “documented procedure about methodological sources of errors and deviation/inaccuracy exists” in the aspect “plausibility” (criterion “validation”) is removed, because a procedure documentation about technical sources of errors already exists in the same QMM aspect/criterion. (ii) We removed the measure “references to evaluation results (data) and methods exist” in aspect “plausibility” (criterion “validation”), because the validation documentation described in the same QMM aspect/criterion will satisfy the needs of an ESS-specific QA workflow. Further, we revised the QMM content and added an entry for each FAIRsFAIR metric. Table 5, Table A1, Table A2 and Table A3 show the matrices for each of the four criteria integrity, technicality, accessibility, and validation.
Table A1. Maturity matrix for the criterion technicality. Italic text marks changed or added metrics. Gray background marks level changes from original QMM. Removed measures from [34] are not listed in the table.
AspectLevel 2
DM4processing
Level 3
DM4analysis
Level 4
DM4publication
Level 5
DM4archiving
Data formatsFile extensions are consistentData sizes are consistent
FsF-R1.3-02D * conform to well-defined rules, e.g., discipline-specific standards Conform to interdisciplinary standards
Versioning follows/isInternal rules informal documentedSystematic corresponds to project requirementsSystematic collection including documentation of enhancement conform to well-defined rules, e.g., discipline-specific standardsSystematic collection including documentation of enhancement conform to well-defined rules
Data labelled with controlled vocabularies (CVs) conform toInformal CVs if feasibleFormal project defined CVs if feasibleDiscipline-specific standardsInterdisciplinary standard
* FAIRsFAIR metric as described in Section 1.2.2.
Table A2. Maturity matrix, criterion accessibility. Removed measures from [34] are not listed in the table.
AspectLevel 2
DM4processing
Level 3
DM4analysis
Level 4
DM4publication
Level 5
DM4archiving
Data Access byFile namesInternal unique identifier corresponds to project requirementsFsF-F1-02D permanent identifier (expiration documented)FsF-F1-01D global resolvable identifier registered
Checksums available
Metadata Access by Internal unique identifier corresponds to project requirementsPermanent identifier (expiration documented)FsF-A2-01M global resolvable identifier complete data citation is persistent
FsF-F3-01M mapping between metadata and data identifiers implemented
Table A3. Maturity matrix, criterion validation. Removed measures from [34] are not listed in the table.
AspectLevel 2
DM4processing
Level 3
DM4analysis
Level 4
DM4publication
Level 5
DM4archiving
PlausibilityDocumented procedure about technical sources of errors and deviation/inaccuracy exists (data header and content is consistent)
Documented procedure with validation against independent data exists
Statistical Anomalies
Missing values are indicated, e.g., with fill values
Documented procedure of statistical quality control is available
Scientific consistency among multiple datasets and their relationships is documented if feasible

Appendix B. Spatial Data Quality Matrix

The developed spatial data quality matrix (Section 2.2.2) links ISO 19157:2013 [10] concepts to five maturity levels. The ISO data quality classes, sub classes, and measures are assigned to levels 2 to 5. Table A4, Table A5, Table A6, Table A7, Table A8 and Table A9 describe the characteristics of the classes positional accuracy, temporal quality, logical consistency, completeness, thematic accuracy, and metaquality. The usability class is omitted, because it does not provide structured measures.
Table A4. Spatial data quality matrix for class positional accuracy.
Sub ClassLevel 2Level 3Level 4Level 5
absolute external positional accuracy mean Euclidean distance
mean bias
radius around measured point, in which the true point is located in 95%
relative internal positional accuracy relative horizontal error (bias) as standard deviation in error space
gridded data positional accuracy mean Euclidean distance
mean bias
radius around given centre, in which the true centre is located in 95%
Table A5. Spatial data quality matrix for class temporal quality.
Sub ClassLevel 2Level 3Level 4Level 5
accuracy of a time measurement time half interval in which the true value lies in 95%
temporal consistency chronological order (Boolean value)
temporal validity number of items in non-conformance (integer for whole dataset)
value domain non-conformance rate (real for whole dataset)
Table A6. Spatial data quality matrix for class logical consistency.
Sub ClassLevel 2Level 3Level 4Level 5
conceptual consistencynumber of items in non-compliance (integer for whole dataset)
number of invalid overlaps of surfaces (integer for whole dataset)
non-compliance rate (real for whole dataset)
domain consistency number of items in non-conformance (integer for whole dataset)
value domain non-conformance rate (real for whole dataset)
format consistency physical structure conflicts (Boolean for each item)
physical structure conflicts number (integer for whole dataset)
physical structure conflict rate (real for whole dataset)
topological consistency number of invalid slivers
number of invalid self-intersect errors
number of invalid self-overlap errors
Table A7. Spatial data quality matrix for class completeness.
Sub ClassLevel 2Level 3Level 4Level 5
completeness commission number of excess items
rate of excess items
number of duplicates
completeness omission number of missing items
rate of missing items
Table A8. Spatial data quality matrix for class thematic accuracy.
Sub ClassLevel 2Level 3Level 4Level 5
thematic classification correctnessnumber of incorrectly classified features
misclassification matrix (matrix spanning between data and classes)
kappa coefficient (the better D65, the closer kappa- > 1, ergo one parameter to assess D65)
non-quantitative attribute correctness number of incorrect attribute values
rate of incorrect attribute values
quantitative attribute accuracyhalf length of an interval in which the true value lies in 95%
Table A9. Spatial data quality matrix for class metaquality.
Sub ClassLevel 2Level 3Level 4Level 5
confidence standard deviation of quantitative attribute values based on the model used
confidence intervals of quantitative attribute values
representativity number of polygons/points/lines per area
number of temporal units
number of thematic units
empirical distribution parameters of various combinations in spatial-temporal-thematic space
homogeneityRMSE from comparison of results from different operators

References

  1. Devillers, R.; Stein, A.; Bédard, Y.; Chrisman, N.; Fisher, P.; Shi, W. Thirty Years of Research on Spatial Data Quality: Achievements, Failures, and Opportunities: Thirty Years of Research on Spatial Data Quality. Trans. GIS 2010, 14, 387–400. [Google Scholar] [CrossRef]
  2. Peng, G.; Lacagnina, C.; Ivánová, I.; Downs, R.R.; Ramapriyan, H.; Ganske, A.; Jones, D.; Bastin, L.; Wyborn, L.; Bastrakova, I.; et al. International Community Guidelines for Sharing and Reusing Quality Information of Individual Earth Science Datasets; Updated: 2022, Version: v01r02 20220326, Open Science Framework. 2021. Available online: https://osf.io/xsu4p/ (accessed on 22 March 2022).
  3. Nightingale, J.; Boersma, K.; Muller, J.-P.; Compernolle, S.; Lambert, J.-C.; Blessing, S.; Giering, R.; Gobron, N.; De Smedt, I.; Coheur, P.; et al. Quality Assurance Framework Development Based on Six New ECV Data Products to Enhance User Confidence for Climate Applications. Remote Sens. 2018, 10, 1254. [Google Scholar] [CrossRef] [Green Version]
  4. RfII–German Council for Scientific Information Infrastructures. The Data Quality Challenge. Recommendations for Sustainable Research in the Digital Turn; RfII Head Office: Göttingen, Germany, 2020. [Google Scholar]
  5. Rüegg, J.; Gries, C.; Bond-Lamberty, B.; Bowen, G.J.; Felzer, B.S.; McIntyre, N.E.; Soranno, P.A.; Vanderbilt, K.L.; Weathers, K.C. Completing the Data Life Cycle: Using Information Management in Macrosystems Ecology Research. Front. Ecol. Environ. 2014, 12, 24–30. [Google Scholar] [CrossRef] [Green Version]
  6. Cai, L.; Zhu, Y. The Challenges of Data Quality and Data Quality Assessment in the Big Data Era. CODATA 2015, 14, 2. [Google Scholar] [CrossRef]
  7. Hassenstein, M.J.; Vanella, P. Data Quality—Concepts and Problems. Encyclopedia 2022, 2, 498–510. [Google Scholar] [CrossRef]
  8. ISO/DIS 19157-1. Geographic Information-Data Quality-Part 1: General Requirements. Available online: https://www.iso.org/standard/78900.html (accessed on 22 March 2022).
  9. GeoDCAT-AP-Version 2.0.0. Available online: https://semiceu.github.io/GeoDCAT-AP/drafts/latest/ (accessed on 16 March 2022).
  10. International Organization for Standardization. Geographic Information–Data Quality (ISO 19157:2013); ISO copyright office: Geneva, Switzerland, 2013. [Google Scholar]
  11. International Organization for Standardization. Quality Management Systems–Fundamentals and Vocabulary (ISO 9000:2015); ISO Copyright Office: Geneva, Switzerland, 2015. [Google Scholar]
  12. Henzen, C. GeoKur-Curation and Quality Assurance of Environmental Research Data for the Use Case of Global Land Use Data. Zenodo 2021, 1–10. Available online: https://geokur.geo.tu-dresden.de/ (accessed on 22 March 2022).
  13. Home of the Spatial Production Allocation Model. Available online: https://www.mapspam.info/ (accessed on 16 March 2022).
  14. International Food Policy Research Institute. Global Spatially-Disaggregated Crop Production Statistics Data for 2010 Version 2.0; Harvard Dataverse: Harvard, MA, USA, 2019. [Google Scholar] [CrossRef]
  15. Yu, Q.; You, L.; Wood-Sichra, U.; Ru, Y.; Joglekar, A.K.B.; Fritz, S.; Xiong, W.; Lu, M.; Wu, W.; Yang, P. A Cultivated Planet in 2010—Part 2: The Global Gridded Agricultural-Production Maps. Earth Syst. Sci. Data 2020, 12, 3545–3572. [Google Scholar] [CrossRef]
  16. Agricultural Producer Prices (Global-National-Annual/Monthly-FAOSTAT). Available online: https://data.apps.fao.org/catalog/dataset/faostat-pp (accessed on 22 March 2022).
  17. Protected Areas (WDPA). Available online: https://www.protectedplanet.net/en/thematic-areas/wdpa?tab=WDPA (accessed on 22 March 2022).
  18. Peng, G.; Lacagnina, C.; Downs, R.R.; Ganske, A.; Ramapriyan, H.K.; Ivánová, I.; Wyborn, L.; Jones, D.; Bastin, L.; Shie, C.; et al. Global Community Guidelines for Documenting, Sharing, and Reusing Quality Information of Individual Digital Datasets. Data Sci. J. 2022, 21, 8. [Google Scholar] [CrossRef]
  19. 5-Star Open Data. Available online: https://5stardata.info/ (accessed on 16 March 2022).
  20. About CC Licenses. Available online: https://creativecommons.org/about/cclicenses/ (accessed on 16 March 2022).
  21. Wilkinson, M.D.; Dumontier, M.; Aalbersberg, I.J.; Appleton, G.; Axton, M.; Baak, A.; Blomberg, N.; Boiten, J.-W.; da Silva Santos, L.B.; Bourne, P.E.; et al. The FAIR Guiding Principles for Scientific Data Management and Stewardship. Sci. Data 2016, 3, 160018. [Google Scholar] [CrossRef] [PubMed] [Green Version]
  22. Research Data Alliance FAIR Data Maturity Model Working Group FAIR Data Maturity Model: Specification and Guidelines. Zenodo 2020, 1–47. [CrossRef]
  23. FAIRsFAIR. Available online: https://fairsfair.eu/ (accessed on 16 March 2022).
  24. Devaraju, A.; Huber, R.; Mokrane, M.; Herterich, P.; Cepinskas, L.; de Vries, J.; L’Hours, H.; Davidson, J.; White, A. FAIRsFAIR Data Object Assessment Metrics. Zenodo 2020, 1–25. [Google Scholar] [CrossRef]
  25. Lacagnina, C.; Doblas-Reyes, F.; Larnicol, G.; Buontempo, C.; Obregón, A.; Costa-Surós, M.; San-Martín, D.; Bretonnière, P.-A.; Polade, S.D.; Romanova, V.; et al. Quality Management Framework for Climate Datasets. CODATA 2022, 21, 10. [Google Scholar] [CrossRef]
  26. Peng, G. The State of Assessing Data Stewardship Maturity–An Overview. Data Sci. J. 2018, 17, 7. [Google Scholar] [CrossRef] [Green Version]
  27. National Research Council. Environmental Data Management at NOAA: Archiving, Stewardship, and Access; National Academies Press: Washington, DC, USA, 2007; p. 12017. ISBN 978-0-309-11209-3.
  28. Sadin, S.R.; Povinelli, F.P.; Rosen, R. The NASA Technology Push towards Future Space Mission Systems. Acta Astronaut. 1989, 20, 73–77. [Google Scholar] [CrossRef]
  29. Technology Readiness Levels (TRLs). Available online: https://esto.nasa.gov/trl/ (accessed on 16 March 2022).
  30. Bates, J.J.; Privette, J.L. A Maturity Model for Assessing the Completeness of Climate Data Records. Eos Trans. AGU 2012, 93, 441. [Google Scholar] [CrossRef]
  31. Bates, J.J.; Privette, J.L.; Kearns, E.J.; Glance, W.; Zhao, X. Sustained Production of Multidecadal Climate Records: Lessons from the NOAA Climate Data Record Program. Bull. Am. Meteorol. Soc. 2016, 97, 1573–1581. [Google Scholar] [CrossRef]
  32. Schulz, J. System Maturity Assessment. Presented at the Copernicus Workshop on Climate Observation Requirements, ECMWF, Reading. 2015. Available online: https://www.ecmwf.int/sites/default/files/elibrary/2015/13474-system-maturity-assesment.pdf (accessed on 16 March 2022).
  33. Peng, G.; Privette, J.L.; Kearns, E.J.; Ritchey, N.A.; Ansari, S. A Unified Framework for Measuring Stewardship Practices Applied to Digital Environmental Datasets. Data Sci. J. 2015, 13, 231–252. [Google Scholar] [CrossRef] [Green Version]
  34. Höck, H.; Toussaint, F.; Thiemann, H. Fitness for Use of Data Objects Described with Quality Maturity Matrix at Different Phases of Data Production. Data Sci. J. 2020, 19, 45. [Google Scholar] [CrossRef]
  35. Best Practices—Quality Assurance. Available online: https://www.komfor.net/qa.html (accessed on 16 March 2022).
  36. Yang, X.; Blower, J.D.; Bastin, L.; Lush, V.; Zabala, A.; Masó, J.; Cornford, D.; Díaz, P.; Lumsden, J. An Integrated View of Data Quality in Earth Observation. Phil. Trans. R. Soc. A 2013, 371, 20120072. [Google Scholar] [CrossRef] [PubMed]
  37. DCMI Metadata Terms. Available online: https://www.dublincore.org/specifications/dublin-core/dcmi-terms/ (accessed on 16 March 2022).
  38. Data on the Web Best Practices: Data Quality Vocabulary. Available online: https://www.w3.org/TR/vocab-dqv/ (accessed on 16 March 2022).
  39. International Organization for Standardization Space Data and Information Transfer Systems–Open Archival Information System (OAIS)–Reference Model (ISO 14721:2012); ISO copyright office: Geneva, Switzerland, 2012.
  40. Attribution 4.0 International (CC BY 4.0). Available online: https://creativecommons.org/licenses/by/4.0/ (accessed on 16 March 2022).
  41. ORCID. Available online: https://orcid.org/ (accessed on 16 March 2022).
  42. ROR. Available online: https://ror.org/ (accessed on 16 March 2022).
  43. International Organization for Standardization Geographic Information–Metadata–Part 1: Fundamentals (ISO 19115-1:2014); ISO copyright office: Geneva, Switzerland, 2014.
  44. AGROVOC. Available online: https://www.fao.org/agrovoc/ (accessed on 16 March 2022).
  45. Hunter, G.J.; Wachowicz, M.; Bregt, A.K. Understanding Spatial Data Usability. Data Sci. J. 2003, 2, 79–89. [Google Scholar] [CrossRef] [Green Version]
  46. RDMO—Research Data Management Organiser. Available online: https://github.com/rdmorganiser/rdmo (accessed on 16 March 2022).
  47. RDMO Catalog Builder. Available online: https://github.com/GeoinformationSystems/RDMOCatalogBuilder (accessed on 16 March 2022).
  48. Open Geospatial Consortium Data Quality Domain Working Group. Available online: https://www.ogc.org/projects/groups/dqdwg (accessed on 22 March 2022).
Figure 1. Data life cycle and aspects of developed quality assurance workflow concept.
Ijgi 11 00334 g001
Figure 2. Simplified provenance graph of SPAM2010 data series. Red rectangles describe datasets and blue boxes describe processes.
Ijgi 11 00334 g002
Figure 3. Timeline of maturity matrix development in refs. [28,30,32,33,34] including our developed concept.
Ijgi 11 00334 g003
Figure 4. Quality assurance workflow alongside the data life cycle for spatial research data. Abbreviations: DQ—data quality, MD—metadata, DM—data maturity.
Ijgi 11 00334 g004
Figure 5. Unfolded predefined process of quality control in the QA workflow (Figure 4).
Ijgi 11 00334 g005
Figure 6. Implementation of the QA workflow as an RDMO questionnaire.
Ijgi 11 00334 g006
Table 1. FAIRsFAIR metrics [24].
IdentifierDescription
FsF-F1-01DData are assigned a globally unique identifier
FsF-F1-02DData are assigned a persistent identifier
FsF-F2-01MMetadata include descriptive core elements (creator, title, data identifier, publisher, publication date, summary, and keywords) to support data findability
FsF-F3-01MMetadata include the identifier of the data it describes
FsF-F4-01MMetadata are offered in such a way that it can be retrieved by machines
FsF-A1-01MMetadata contain access level and access conditions of the data
FsF-A1-02MMetadata are accessible through a standardized communication protocol
FsF-A1-03DData are accessible through a standardized communication protocol
FsF-A2-01MMetadata remain available, even if the data are no longer available
FsF-I1-01MMetadata are represented using a formal knowledge representation language
FsF-I1-02MMetadata use semantic resources
FsF-I3-01MMetadata include links between the data and its related entities
FsF-R1-01MMetadata specify the content of the data
FsF-R1.1-01MMetadata include license information under which data can be reused
FsF-R1.2-01MMetadata include provenance information about data creation or generation
FsF-R1.3-01MMetadata follow a standard recommended by the target research community of the data
FsF-R1.3-02DData are available in a file format recommended by the target research community
Table 2. Levels and their objectives for the QA workflow along the data life cycle. Level conditions are defined by data provider (pr), data curator (cu), or data publisher (pu).
LevelLevel ObjectiveData Life Cycle PhaseLevel Conditions
1Conceptualizing data creation and usageCollectionOpen4usage pr, DQ4usage pr
2Processing dataProcessingDM4processing cu, DQ4processing cu
3Providing data suitable for project collaborationAnalysisDM4analysis cu, DQ4analysis cu
4Prepare data for publicationPublicationOpen4publication pu, DM4publication pu, DQ4publication pu
5Provide data suitable for impact research and long-term archivingArchivingOpen4archiving pu, DM4archiving pu, DQ4archiving pu
Table 3. Proposed level condition definitions for openness of data.
Level ConditionDefinition
Open4usageCC license that allows usage of data and dissemination of derived data (e.g., CC0 1.0 or CC BY 4.0); 2-star open data
Open4publicationCC license that allows reusability of data (e.g., CC BY-SA 4.0); 3-star open data
Open4archivingCC license that allows non-commercial and commercial reusability of data for other parties (e.g., CC BY 4.0); 4-star open data
Table 4. Criteria and aspects of data maturity modified from QMM in [34].
CriterionName in QMM ConceptAspect
TechnicalityConsistencyData Formats
Versioning follows/is
Controlled Vocabularies
IntegrityCompletenessExistence of Data
Existence of Metadata
AccessibilityAccessibilityData Access by
Metadata Access by
ValidationAccuracyPlausibility
Statistical Anomalies
Table 5. Maturity matrix for the criterion integrity. Italic text marks changed or added metrics. Gray background marks level changes from original QMM. Removed measures from [34] are not listed in the table.
AspectLevel 2 DM4processingLevel 3 DM4analysisLevel 4 DM4publicationLevel 5 DM4archiving
Existence of DataData are in production and may be deleted or overwrittenDatasets exist, not complete and may be deleted, but not overwritten unless explicitly specifiedFsF-A1-03D data entities conform to discipline-specific standards; data are persistent as long as expiration date requiresData entities conform to interdisciplinary standards; data are persistent as long as expiration date requires
Existence of MetadataFsF-R1.2-01M provenance documented in well-defined format Provenance documented in interdisciplinary standard
FsF-R1-01M basic metadata, e.g., from automatic extractionFsF-F2-01M metadata enriched by non-automatically derivable elementsFsF-A1-01M metadata contain access rights informationMetadata conform to interdisciplinary standards
Data quality as part of metadata included, e.g., from automatic extractionData quality as part of metadata enriched
FsF-F4-01M metadata are machine-readableFsF-A1-02M metadata accessible through standardized protocol
FsF-I1-02M metadata use semantic resources
FsF-I3-01M metadata reference to related entities
FsF-I1-01M metadata in formal knowledge representation language
FsF-R1.3-01M metadata conform to discipline-specific standards
FsF-R1.1-01M metadata contain reuse license
Table 6. Spatial data quality matrix with data quality classes and sub classes (ISO 19157:2013) and the data quality level and level condition from which the quality metric is required.
Data Quality ClassData Quality Sub ClassDescriptionData Quality Level + Condition
Positional accuracyAbsolute external positional accuracyCloseness of reported coordinate values to values accepted as or being true3-DQ4analysis
Relative internal positional accuracyEvaluation of random errors in the relative position of one feature to another in the same dataset4-DQ4publication
Gridded data positional accuracyCloseness of gridded data position values to values accepted as or being true3-DQ4analysis
Temporal qualityAccuracy of a time measurementCorrectness of the temporal references of an item (reporting of error in time measurement)5-DQ4archiving
Temporal consistencyCorrectness of ordered events or sequences, if reported3-DQ4analysis
Temporal validityValidity of data specified by the scope with respect to time3-DQ4analysis
Logical consistencyConceptual consistencyAdherence to rules of the conceptual schema2-DQ4processing
Domain consistencyAdherence of values to the value domains4-DQ4publication
Format consistencyDegree to which data are stored in accordance with the physical structure of the dataset, as described by the scope4-DQ4publication
Topological consistencyCorrectness of the explicitly encoded topological characteristics of the dataset, as described by the scope5-DQ4archiving
CompletenessCompleteness commissionExcess data present in the dataset, as described by the scope3-DQ4analysis
Completeness omissionData absent from the dataset, as described by the scope3-DQ4analysis
Thematic accuracyThematic classification correctnessComparison of the classes assigned to features or their attributes to a universe of discourse2-DQ4processing
Non-quantitative attribute correctnessCorrectness of non-quantitative attributes4-DQ4publication
Quantitative attribute accuracyAccuracy of quantitative attributes2-DQ4processing
MetaqualityConfidenceTrustworthiness of a data quality result4-DQ4publication
RepresentativityDegree to which the sample used has produced a result which is representative of the data within the data quality scope3-DQ4analysis
HomogeneityExpected or tested uniformity of the results obtained for a data quality evaluation2-DQ4processing
Usability elementBased on user requirementsUsability, user perspectives, data use indices, what was the data used for2-DQ4processing
Table 7. Data quality measures and threshold values for the completeness class. Completeness information is supposed to be mandatory from level 3 to level 5. The thresholds assume a 5% rate of excess or missing items; n_all defines the number of all features; * stands for the multiplication operator.
Data Quality ClassData Quality Sub ClassLevel 3 to 5 MeasureThreshold
CompletenessCompleteness commissionnumber of excess itemsn < 0.05 * n_all
rate of excess itemsr < 5%
number of duplicatesn < 0.05 * n_all
Completeness omissionnumber of missing itemsn < 0.05 * n_all
rate of missing itemsr < 5%
Table 8. Roles and related activities with descriptions before starting the data life cycle.
RoleActivityDescriptionPhase—Step
Data providerDefine data quality (DQ) level conditionsDefinition of level conditions for DQ for data usage at collection phase: DQ4usagePreliminary
Define openness of dataDefinition of the required openness of the data: Open4usagePreliminary
Data curatorDefine data maturity (DM) and data quality (DQ) level conditionsDefinition of level conditions for DM and DQ for data usage at processing, analysis, or publication phases: DM4processing, DM4analysis, DQ4processing, DQ4analysisPreliminary
Data publisherDefine data maturity (DM) and data quality (DQ) level conditionsDefinition of level conditions for DM and DQ for data usage in publication and archiving phases: DM4publication, DM4archiving, DQ4publication, DQ4archivingPreliminary
Define openness of dataDefinition of the required openness of the data at publication and archiving phases: Open4publication, Open4archivingPreliminary
Table 9. Roles and related activities with descriptions for predefined quality control process.
RoleActivityDescriptionPhase—Step
Data providerChoose/apply quality control methodSelect and apply suitable quality control procedure, measures, and thresholds for the data with respect to the use case.Multiple
Data curatorEvaluate fitness for next phaseEvaluate the results of the data quality assessment with regard to the fitness for the next phase.Multiple
Add indicators/descriptions to metadataAdd the result of the fitness for the next phase evaluation in the metadata set to facilitate visibility of the assessment, and in the end, reuse of the data.Multiple
Table 10. Roles and their activities with descriptions at collection phase.
RoleActivityDescriptionPhase—Step
Data providerCollect dataDiscover and collect data and metadata from repositories.Collection—initial collection
(Automatic) extraction of metadata including data qualityObtain a metadata set including data quality information by using an extraction tool (automatically) or analysing the data or publications (manually). Automatic metadata extraction is only available for data provided in structured file formats.Collection—initial collection
Quality control with metadata enrichmentApply quality control (Section 2.3.2) and enrich metadata with its results.Collection—quality control
Data curatorEnrich/edit metadataExtend or correct the existing metadata set to better fit evaluation needs (mostly manually).Collection—initial collection
Evaluate data maturity level and enrich metadataEvaluate the data maturity based on available data and metadata. Add the results of the data maturity assessment, the data maturity level, in the metadata.Collection—data maturity handling
Table 11. Roles and their activities with descriptions at processing phase.
RoleActivityDescriptionPhase—Step
Data providerCreate/develop model workflowThe data from the collection phase serves as input for a model workflow. Here, the data provider creates and implements the model and defines related parameters.Processing—modelling, data creation
Automatic extraction of metadata including data qualityObtain a metadata set including data quality information by using an extraction tool (automatically) or analysing the data or publications (manually). Automatic metadata extraction is only available for data provided in structured file formats.Processing—modelling, data creation
Quality control without metadata enrichmentApply quality control (Section 2.3.2).Processing—intermediate quality control
Data curatorEnrich/edit metadataExtend or correct the existing metadata set to better fit evaluation needs (mostly manually).Processing—modelling, data creation
Evaluate data maturity level and enrich metadataEvaluate the data maturity based on available data and metadata. Add the results of the data maturity assessment, the data maturity level, in the metadata.Processing—data maturity handling
Table 12. Roles and their activities with descriptions at analysis phase.
RoleActivityDescriptionPhase—Step
Data providerChoose analysis methodData provider selects proper analysis method that covers research interests and use case/project aspects.Analysis—analyse data
Quality control with metadata enrichmentApply quality control (Section 2.3.2) and enrich metadata with its results.Analysis—quality control
Data curatorEvaluate fitness for useData curator assesses the fitness for use
based on the analysis results.
Analysis—analyse data
Evaluate data maturity level and enrich metadataEvaluate the data maturity based on available data and metadata. Add the results of the data maturity assessment, the data maturity level, in the metadata.Analysis—data maturity handling
Table 13. Roles and their activities with descriptions at publication phase.
RoleActivityDescriptionPhase–Step
Data publisherEnsure Open4publicationCheck and—if necessary—change the openness of the data to meet the Open4publication requirement.Publication
Choose publication optionChoose a proper option for data publication. The target repository can be a local, project-specific, or institutional data management system or a well-known repository.
Adapt metadata according to publication optionTo meet the metadata requirements of the target repository, the data publisher will perform minor transformations of metadata elements to meet the target schema/profile, e.g., renaming metadata elements.Publication
Publish datasetPublish the dataset and metadata.Publication
Table 14. Roles and their activities with descriptions at archiving phase.
RoleActivityDescriptionPhase—Step
Data publisherEnsure Open4archivingCheck and—if necessary—change the openness of the data to meet the Open4archiving requirement.Archiving
Choose appropriate archiving optionChoose an appropriate option for data archiving. The archiving can be a mid-term archiving in a well-known repository or even a long-term archiving including possible alterations in the file format.Archiving
Adapt MD according to archiving optionThe archiving option might have own demands for a metadata schema. In this case, adapt the metadata to the needs of the used archiving option.Archiving
Archive datasetArchive the dataset.Archiving
Table 15. FAIRsFAIR indicators assessment for SPAM2010 example data (identifier descriptions are listed Table 1).
IdentifierImplemented in SPAM2010Comment
FsF-F1-01DYesDOI is available
FsF-F1-02DYesDOI is persistent
FsF-F2-01MYesDescriptive core metadata (e.g., title) are available
FsF-F3-01MYesData DOI is included in metadata
FsF-F4-01MYesThe Harvard Dataverse repository provides machine-readable metadata access
FsF-A1-01MYesMetadata contain information about accessibility of data
FsF-A1-02MYesThe Dataverse repository allows API access
FsF-A1-03DYesThe Dataverse repository allows API or direct file access
FsF-A2-01MYesThe Dataverse repository supports a bit-level preservation
FsF-I1-01MYesThe Dataverse repository allows, e.g., JSON-LD (JSON for linked data)
FsF-I1-02MYesMetadata contain semantic information, e.g., keyword vocabularies
FsF-I3-01MYes/NoLinks to previous versions SPAM2005 and SPAM2000 are available, but links to input datasets are not given
FsF-R1-01MYesMetadata contain data description element
FsF-R1.1-01MYesMetadata include the license information
FsF-R1.2-01MNoProvenance information is not available
FsF-R1.3-01MYes/NoMetadata schema includes some Dublin Core elements, but ISO 19157:2013 or GeoDCAT standards are not applied
FsF-R1.3-02DYesAvailable formats are csv, dbf, and GeoTIFF
Table 16. Evaluated data maturity of SPAM2010 example data.
CriterionAspectReached MeasureReached LevelComment
TechnicalityData FormatsData sizes consistent5
FsF-R1.3-02D4
Versioning follows/isProject requirements3
Controlled Vocabularies (CVs)Formal project defined CVs3Crop types mostly follow Agrovoc [44]
IntegrityExistence of DataFsF-A1-03D; discipline-specific standard4
Existence of MetadataNo provenance in metadata1Input data and methodology are described, but information is not available in metadata
FsF-A1-01M4
No data quality in metadata1Some data quality described in publication (subjective uncertainty rating, local validation against existing datasets)
FsF-A1-02M5
FsF-I1-02M5
No references to related entities2References to thematic vocabulary for keywords, publication, producer available, but not to input data
FsF-I1-01M5
FsF-R1.3-01M5
FsF-R1.1-01M5
AccessibilityData Access byFsF-F1-01D5
No checksums given2
Metadata Access byFsF-A2-01M5
FsF-F3-01M5
ValidationPlausibilityDocumented technical sources of errors exist5In publication
Documented validation against independent data5In publication
Statistical AnomaliesNo missing values indicated1/5No missing values in data
Documented statistical quality control5Subjective uncertainty rating of data in publication [15]
Consistency among multiple datasets5Comparison of different SPAM versions in the publication
Publisher’s Note: MDPI stays neutral with regard to jurisdictional claims in published maps and institutional affiliations.

