Abstract
Wind can influence people’s behavior and their way of inhabiting an architectural or urban space. Furthermore, virtual reality (VR) enables the simulation of different physical and sensitive phenomena such as the wind. We aim to analyze the effects of different wind representations in terms of perception of its properties and sense of presence in VR. We carry out two within-subject studies aiming at evaluating different wind representation suggestions (including audiovisual and tactile stimuli) to identify their effects on wind properties’ perception and sense of presence in the VR scene. Our analysis showed significant effects of tactile restitution over the visual effects used in the study, both for understanding wind properties and for increasing the sense of presence in the VR scene. The tactile condition (T) reduced the estimation error of wind direction by 27% compared to the visual condition (V). The wind force error was reduced by 9.8% using (T) with (V). (T) increased the sense of presence by 12.2% compared to (V). Our second experiment showed an overestimation of the wind force perceived compared to the reference value of the Beaufort scale. For the maximum force value evaluated, the average result was 91% higher than the reference value, while for the lower, the average answer was 77% higher than the reference value. Previous studies have evaluated wind rendering in virtual reality, and others have studied the visualization of wind simulation results. To our knowledge, our study is the first to compare the perception of these two types of representations as well as the effects of wind on elements of the context. We also compared the wind perception to a reference-based method, the Beaufort scale.
1. Introduction
Wind can improve the air quality of a space and can affect the thermal and mechanical comfort of people [1]. The wind can change the way that one perceives and uses a place. However, its sensitive properties (understood as those that stimulate our bodily receptors) are underexploited in architectural representations. We consider that the quantitative information of wind provided in the communication stages of architectural and urban projects does not fully capture the phenomenon-sensitive properties (as presented in Section 2.1). This is why we decided to explore different kinds of wind representations. Furthermore, virtual reality (VR) is attracting interest in the architecture and urban design fields, allowing for the exploration of a 3D model at different scales [2]. Beyond visual aspects, VR offers the possibility to add and evaluate physical and sensitive phenomena such as temperature [3], lightning influence [4], climatic variations [5], and wind effects [6].
Berger and Cristie [7] used the wind simulation results of urban space to create an animation of the wind flow in an immersive environment. They claim that the built-in functions of the CFD visualization software are made for engineers, and “it lacks user-friendliness for real-time exploration of results for architects”, creating a gap. They tried to bridge this gap in wind studies with a collaborative work based on game engine technology.
Our main research question was how to represent sensitive wind properties in a public space in order to transmit information that would be comparable to that perceived in a real situation, allowing for the understanding of its effects.
To answer this question, we divided our study into two different experiments. The objective of the first one was to analyze wind properties’ (force and direction) perception as well as sense of presence in the VR scene. We used four conditions based on three different wind representations: (I) audiovisual effects of wind on the elements of the context, (II) wind flow visualization and (III) tactile representation using eight digitally controlled fans. The results of the experiment show that conditions using a tactile representation were closest to the input value concerning wind force and direction. The tactile condition was also the one that most increased the sense of presence in the VR scene.
Our second experiment focused on the wind direction and force perception compared to the reference values of the Beaufort scale. We used three different variables: (I) wind force, (II) wind direction and (III) visual wind suggestion.
Our studies show the interest in the possible use of wind representations that stimulate people’s body sensors, and thus their mind, to create the illusion of an urban space beyond the aesthetic aspects of the space and traditional wind representations.
The remainder of this paper is structured as follows: in Section 2, we present the previous works about wind representation in different fields, their influence on our prototype and our two experiments. Section 3 describes our apparatus in terms of the physical installation used to conduct our experiments. Section 4 and Section 5 describe our user studies with their hypotheses and results. Finally, we present a general discussion in Section 6 and a conclusion in Section 7.
2. Background
Wind can stimulate various senses. It provides audio, tactile, and thermal feedback to the human body. Its effects can also be perceived by vision, since it makes the elements of the context move.
We focused our bibliographic search on three different groups of representation. First, the wind-flow visualizations that are used in architecture, urban planning and engineering fields (see Section 2.1). Since these representations do not exploit the whole set of sensitive properties of the phenomenon, we decided to extend our search to other disciplines, such as cinema and computer graphics, where the wind is suggested by its mechanical effects (see Section 2.2). Finally, we end with wind tactile rendering in virtual reality scenes (see Section 2.3).
2.1. Wind Flow Visualizations in Architecture, Engineering and Urban Design Fields
In these fields, wind representations are mostly visual. They are based on suggestive sketches (see in Section 2.1.1) and on visualizations of fluid simulation results (see Section 2.1.2), where the wind flow becomes visible to expose its interaction with the elements of the context.
2.1.1. Wind Flow Sketches
Gandemer [1] uses the wind flow sketches to explain the resulting effects of the interaction between the wind and buildings’ morphology. He lists these effects (e.g., Venturi effect, row effect, corners effect, etc.), presenting the wind flow like arrows that express its behavior (see Figure 1). Similarly, Lamberts et al. [8] present how the wind interacts with the context. They use a handmade representation to present these concepts. Bustamante et al. [9] also present a sketch showing the wind flow and the resulting issues produced by the interaction between wind and building shapes. They also evoke the relation between the geographical conditions of the city, urban shapes and pedestrians’ discomfort. This kind of visualization allows the designers to express the presence and behavior of wind as well as its relation with the elements of the context.
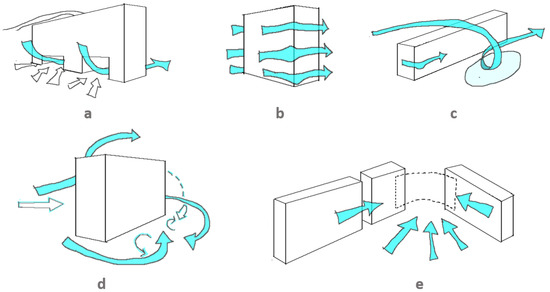
Figure 1.
Example of visualization of some wind effects: (a) effect of slots under a building, (b) effect of corners, (c) row effect (d) wake effect and (e) Venturi effect, based on Gandemer’s [1] sketches. Image from [10].
2.1.2. Visualization of Wind Simulation Results
Furthermore, we find the representations of wind simulation results (with physical and digital models), which in addition to showing the interaction between the context and the wind, allows for obtaining quantitative values to analyze the phenomenon dynamics.
Airflow visualization with physical models has been used for the development of cars, airplanes, spacecrafts [11], constructions, or buildings, among others. It allows for an idea of the fluid’s behavior on the objects, even before starting the calculations. This process makes visible, and highlights, behaviors or problems that would otherwise be invisible. According to Ristic et al. [11], fluid visualizations (in physical models) can be divided into (I) surface flow visualizations (which involve the use of fluorescent inks, oils, etc., applied to the surface of the model) and (II) off-surface flow visualizations that use smoke, oil, and helium-filled soap bubbles. These methods are dependent on an appropriate lighting system and an image recording device. The use of smoke is an effective technique for making wind flow visible. One of the factors that allowed for the advancement of smoke visualization is the introduction of illumination by the use of lasers. In a liquid, an equivalent to smoke injection can be achieved with dyes. According to [11], digital fluid visualizations have attracted interest due to the ease of quickly analyzing both qualitative and quantitative aspects of wind behavior. Moreover, the quality of the rendering, in terms of lighting and image recording, is an advantage for understanding the result.
Digital models can be used similarly. As shown in the extensive reviews of flow visualization provided by Edmunds et al. [12], McLoughlin et al. [13] and Salzbrunn et al. [14], there are different ways to communicate the wind properties resulting from a CFD simulation. Post et al. [15] present four main groups of visualizations: (i) direct visualization, where raw data are communicated most directly, showing the fluid properties by colors or objects such as arrows; (ii) texture-based visualization, which uses textures to express density or displacement; (iii) geometric visualization, where objects such as streamlines are used to show the flow trajectory and a spatial definition. Finally, (iv) feature-based visualization is where data with similar characteristics are assembled to highlight the information of interest for the researcher. Salzbrunn et al. [14] adds a fifth group, (v) partition-based visualization, which gives an overall result of the fluid behavior and its environment. According to Laramee et al. [16] (i) is intuitive and easy to use. Nevertheless, it is difficult to apply in a 3D representation because its rendering becomes less understandable. On the other hand, geometric visualization is more suitable for 2D, 2.5D and 3D representations [16]. Nevertheless, it is possible to experience some occlusion issues due to the proximity of the elements. Brambilla et al. [17] focus on illustrative flow visualization which is inspired by handmade sketches.
Wind visualization has also been used in VR with wind simulations results. Yan et al. [18] propose a method to use the results of CFD simulations in a VR scene using BIM tools (building information modeling). Fu et al. [19] have developed an interface tool to use the ParaView context as an immersive VR environment. Hosokawa et al. [20] propose a tool for architectural design to display the result of CFD simulations in a virtual scene.
We then find a common interest between the suggestive sketches and the CFD results’ visualization: wind flow visualization. One of our objectives is to exploit and evaluate this type of representation by augmenting the virtual scene with the wind flow visualization. An example is shown by Berger and Cristie [7], who present an animation of a CFD simulation result in a VR scene. We also used a similar idea in previous research [21], where the CFD simulation result was superimposed onto a photograph of the real space in a video to communicate a temporal evolution of wind flow along with the analyzed space. We do this in our first experiment (Section 4), importing streamlines from wind simulations results into our VR scene.
2.2. Wind Presence Suggestion by Its Mechanical Effects
Wind’s presence and its properties are expressed in static images or audiovisual representations by the suggestion of its mechanical effects on context. We can find it, for example, in artistic representations (photographs, paintings, films) and computer graphics representations.
In static images, wind can be suggested by a blur effect on some objects. It provides a displacement notion, e.g., the blurred dry leaves and umbrellas contrast with the sharpness of the buildings in the photograph shown in [22], where the wind direction can be perceived. A similar example is shown by Barr’s painting [23], where the blurred traces show the wind’s effects resulting in the building corner, suggesting the wind direction and force.
In cinema, wind presence is suggested by its influence on the surrounding elements presented by visual and audio effects. For example, in the films “Paperman” [24], “The happening” [25] and “The Blue Umbrella” [26], wind plays a protagonist role throughout of stories and its presence is evident by its interaction with trees, grass, hair, and characters’ clothes.
Some examples show a suggestion of the wind flow visualization (as shown in Section 2.1) added to the audiovisual representation of the mechanical effects of wind. Two examples are the “Birth of Venus” by Boticelli [27] and the animated film “Pocahontas” [28], where the wind flow visualization accompanies the objects affected by it, such as leaves.
In the same way, wind presence is expressed in the field of computer graphics. Wang et al. [29] show the wind’s direction and force by its influence on snowfall. Dobashi et al. [30], Max et al. [31] and Vigier et al. [5] have suggested wind properties by cloud motion in a scene. Finally, Bakay et al. [32] expressed wind’s presence on grass and Diener et al. [33] and Quigley et al. [34] on trees’ deformation.
2.3. Tactile Wind Representation in Virtual Reality
In terms of airflow rendering, the literature shows the use of fans [6,35,36,37,38,39], compressed air [40] and even a human-scale wind tunnel [41], detailed below.
Moon and Kim [6] proposed the Windcube, a cubic device that surrounds users. They proposed a layout of fans divided into three different levels. The two lower levels were made up of eight fans placed equidistantly every 45°, and the superior level only had four fans. The authors observed that the sense of presence was augmented when the tactile wind rendering was added. This layout of eight fans was reused by Cardin et al. [35] who used a head-mounted display (HMD), and Verlinden et al. [39] who used larger fans. Cardin et al. [35] propose a “head-mounted wind” device, which consists of an HMD adapted with eight fans tested in a flight simulation. Verlinden et al. [39] used eight fans with a 40 cm diameter placed in an upper structure that had a 4 m diameter and was 2 m high. They tested their device in a sailing simulator and evaluated the sense of presence in the VR scene. Their results were consistent with the previous experiments, showing that the sense of presence was increased using the tactile wind flow. Pluijms et al. [42] used the same device as Verlinden et al. [39]. They evaluated wind perception in terms of direction and force. They tested their device with expert sailors, less skilled sailors, and inexperienced controls.
Kojima et al. [36] adapted a helmet with small fans, tubes and an audio speaker. Their goal was to apply the wind flow directly to the ear, the most sensitive area to wind according to their previous experiment. Rietzler et al. [40] developed a pneumatic device that can rotate 270° around the user’s head, providing visual and audio content. Their results show an increase in the sense of presence and enjoyment in the VR scene using the tactile wind flow. They noted a potential problem with the HMD that masks a part of the face. In response to this problem, they suggested using glasses and gloves in the virtual avatar. This leads to the conclusion that HMDs are not really suitable for tactile restitution of wind.
Kulkarni et al. [41] implemented a human-scale wind tunnel using cross-approaches between numerical and physical simulations. Their main goal was to develop a device that uses wind, temperature and odors to favor the multisensorial stimulation in the VR scene. They used two lateral ducts oriented to the oblique screens of the device, creating a vortex, and directed the wind flow towards the user according to incidence angle and speed.
Lehmann et al. [37] compared the use of fans in two different situations: The first consisted of two static fans located in front of the user. In the second one, two fans were attached to a helmet and located next to the ears. They observed that the use of static fans was preferable to the second option, attributing these results to the vibrations and noise produced in the device.
Ito et al. [43] produced a demonstration integrating visual, audio and tactile stimuli with a limited number of fans taking into account cross-modal effects.
Nakano et al. [44] are interested in the perception of wind direction. They analyze the wind incident on the front, side and back of the head. They have compared JNDs (Just Noticeable Differences) values of wind direction discrimination produced by one single fan or a uniform wind produced by a fan array [45] when the wind is blowing on the face. They have found that the JND for a uniform wind was 5.55° if the subject concentrates and the wind is directly blown on the face with no other stimulus.
2.4. Summary
The experiments conducted by Lehmann et al. [37], Moon and Kim [6], Rietzler et al. [40] and Verlinden et al. [39], show that the use of the tactile wind flow added to an audiovisual representation increases the sense of presence in a VR scene. Wind properties, direction and force, were also tested in VR to evaluate user perception. In the architecture field, the wind flow visualization is used to represent the wind behavior. This kind of representation is also used in the VR field. However, it has neither been compared to the tactile restitution nor to the representation of the mechanical wind effects. We propose to compare those three kinds of representation: wind flow visualizations (presented in Section 2.1), suggestions of wind presence by its effects (Section 2.2) and tactile wind representations (Section 2.3). The state-of-the-art experiment on tactile wind rendering served as a basis for the implementation of our device in the VR space. We use our experimental device first to evaluate the perception of wind force and direction as well as the sense of presence in a VR scene. Then, in our second experiment, we focused on wind force perception compared to the Beaufort scale.
3. Materials and Methods
We present in this section the materials and methods used to carry out our two experiments detailed in Section 4 and Section 5.
3.1. Apparatus
We decided to rely on the arrangement proposed by Verlinden et al. in [39] because the size and distance of the fans they used allowed them to generate an impact of the wind on the participants’ bodies, unlike the small fans used at the level of the VR helmet. This effect more closely resembles the wind perceived in a real urban environment. In addition, the power of the fans makes it possible to generate stronger winds that allow for simulating the resulting wind effects in a real situation. The authors in [39] used eight fans at the top of the experimental room. We decided to locate them at ground level (see in Figure 2b) as participants were to be oriented to look up to see the buildings and wind flow in the virtual scene. We used the following fan model: ProBreeze 20” chrome floor fan (ProBreeze, London, UK) (each fan has 3 predefined speeds: 2.2 m/s, 2.6 m/s and 3.3 m/s measured at the participant position in the VR room). They were located around the user of the device at a 1.32 m distance (see in Figure 2). This room is equipped with a 1.80 m-high by 2.40 m-wide screen, offering a horizontal field of view of 78°. Regarding the sound, we equipped the participants with Plantronics-Backbeat Go 410 (Poly, San Jose, CA, USA) Bluetooth headphones which had a double function: on the one hand, to allow for the sound rendering of the virtual scene, and on the other hand, to reduce the ambient noise of the room (resulting from the fans operation, relays, projector, etc.) with their noise reduction function. Their size was chosen so as not to prevent the tactile influence of wind on the ears of the participants.
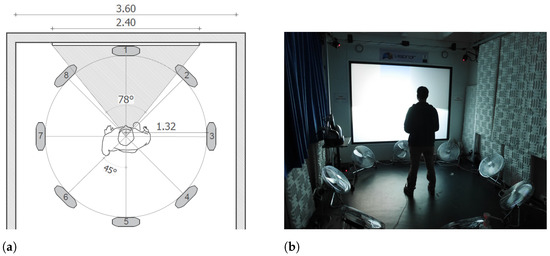
Figure 2.
(a) Fan layout composed of eight fans located around participants in the VR room, units in meters. Image from [10]. (b) A participant in the VR room.
3.2. Digital Fan Control
To integrate the tactile restitution of the wind in the immersive device, we implemented communication between the virtual scene from Unity3D (V.2018.3.9f1, Unity Technologies, San Francisco, CA, USA) and the fans using a Velleman-VMA101 (Velleman Group nv, Gavere, Belgique) card (based on ARDUINO-Mega2560 (Arduino)) and a relay module. The latter works as an intermediary between the card and the fans. It allows for the passage of electric current to the fans according to the signal coming from the microcontroller. This signal is produced in Unity3D by defining when the fans should be turned on and at what speed. We modified the housing of the speed control buttons for each fan so that we could digitally control them.
3.3. Experiments Design
We designed two experiments with within-subject design to evaluate all the variables on all the participants of each experiment. The experiments involved 37 and 30 participants, respectively. These are detailed below.
4. First Experiment: Perception of Multisensory Wind Representation
In this first experiment, our goal was to analyze the effects of three different representations of wind (coming from CFD simulation results (the simulation results were produced by Houda Belgacem [46] former Ph.D. student at AAU laboratory)) in terms of perception of its properties (force and direction) and the sense of presence in a VR scene. We focused on the following representations: (I) the audiovisual representation of the mechanical effects of wind on contextual elements, (II) the visualization of wind flow, and (III) the tactile rendering of wind using digitally controlled fans. For the experiment, we present to participants (I), then (I)+(II) followed by (I)+(III) and finally (I)+(II)+(III). We specified that we were not looking for accuracy in terms of rendering the wind properties, but a suggestion of their variations.
4.1. Wind Simulations Results
We used the wind simulations results data to produce two different representations in the Paraview (V5.5.0, kitware, Clifton Park, NY, USA) software environment. The first one was a 1.5 m-high section (see in Figure 3b) used to control the tactile and sound rendering in the VR scene (presented in Section 4.2), and the second one was a streamlines visualization (see in Figure 3b) used to create the wind-flow animation in the Unity3D context (detailed in Section 4.3).
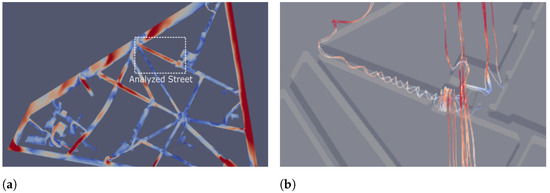
Figure 3.
CFD results visualizations (a) horizontal cut of wind speed. (b) Streamlines of wind velocity in the 3D model of the street of interest. Images from [10].
4.2. Tactile and Sound Rendering in the VR Scene
We imported the horizontal section into the VR scene. The result was a vector field plotted along the studied street (see in Figure 4) which was not shown to the participants. To identify the wind behavior at the avatar position, we created an octagon around it. Each of its sides corresponded to the position of a fan in the physical room of experimentation.
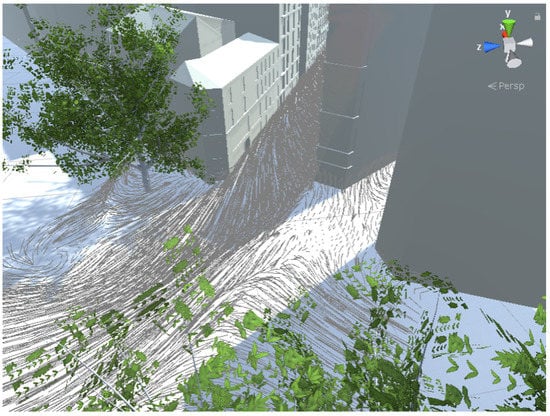
Figure 4.
Vector field drawn on the VR street studied.
All vectors that crossed one of the octagon faces (from outside to inside, see in Figure 5a) were grouped to create a mean vector by surface (yellow arrows in Figure 5b). Each of these mean vectors was projected orthogonally onto the fan axis to calculate the operation of each fan (black arrows in Figure 5b). The fans have only four speeds, from 0 (off) to the maximum speed 3. After a calibration of the device, we assigned the maximum speed of the simulation to that of the fans. This speed corresponds to three fans turned on at the same time at speed 3. Then, we performed a linear interpolation to quantify the set of speeds from 0 to max on the 4 possible levels. Finally, the fans were triggered thanks to the Velleman-VMA101 card according to the calculated quantification.
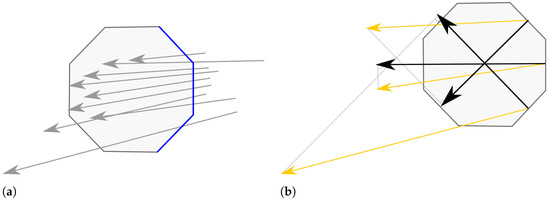
Figure 5.
Schematic representation of the virtual octagon. Image from [10]. (a) Vectors identification crossing one of the octagon faces from outside to inside (in blue). (b) Average vector (in yellow) of the wind speed and direction projected on the fan axis (black arrows).
The octagon moved with the virtual avatar and thus allowed for the identification of wind behavior along the street. Nevertheless, there existed a latency between the moment the fan is turned on and the wind perception at the participant position. We, therefore, decided to predefine the paths of the experiment. This allowed us to anticipate latency and relate the wind received by the participants with the resulting wind in the VR scene.
For the sound rendering, we also used the octagon. We placed a sound source (wind sound recording) around the virtual avatar that moved according to the results of the projections of the mean vector to suggest the wind direction. For the wind force, we used the mean vector velocity values on the octagon to define the volume of wind sound reproduction. The maximum speed of the simulation corresponded to 100% of the volume.
A second sound source was placed in the trees, which suggested both the movement of leaves and the presence of birds in the VR environment. These sounds changed in intensity depending on the proximity of the virtual avatar. All the recordings were retrieved from the soundBible website [47].
4.3. Wind Flow Visual Representation
One of our questions was what type of visual representation of wind flow to use for our evaluation. Based on the expressions used in the literature, both streamlines and surface representation offer advantages for three-dimensional models from an overhead perspective concerning direct visualization. We draw both, streamlines and surfaces, from a pedestrian point of view to have an idea of their effects (see in Figure 6). We choose to use the streamlines in our evaluation (as, in our opinion, it was easier to understand from a pedestrian’s point of view) to animate a path along the studied street.
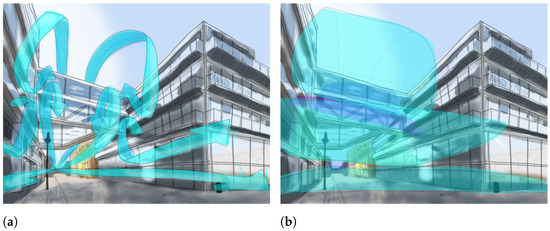
Figure 6.
Schematic representation of an (a) Streamlines visualization and (b) surface visualization from a pedestrian point of view. Image from [10].
The vectors that structure the streamlines used in our virtual prototype came from the results of CFD simulations (see in Figure 3b). They were generated with Paraview (V5.5.0, function Stream Tracer, with the following settings: vectors menu defined as velocity, Integration direction: Forward, Integrator type: Runge-Kutta 4-5, Seed Type: High resolution line source, Resolution: 20).
The information was exported to a CSV file which was then imported into Unity3D. The file contained the wind direction and force information for each of the points that made up the line. We used these data to create reference paths in the virtual environment. We then created an animation of an object that moved along the path line and left a trace of the particles. This allowed us to make the flow in the virtual street visible to suggest the presence of the wind and its interaction with the built environment (see in Figure 7b). In the experiment, the animation of the streamlines was presented in a loop that started again once all the lines had reached the end of their path.
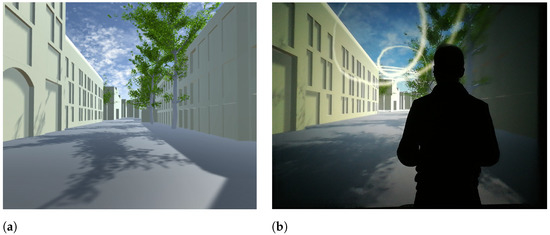
Figure 7.
(a) Reference scene, the first course presented to participants. (b) One participant in the virtual scene with the visual wind flow representation. Images from [10].
4.4. Experimental Conditions
This first experiment is based on a within-subjects design, with 37 participants involved (17 women and 20 men), aged 22 to 61 years (average = 35, = 9.6). The experiment has one independent variable, the type of wind representation, with four different levels that were presented to participants in the following order:
- R: Reference scene composed of an audiovisual representation of the mechanical effects of wind on the elements of the context. The direction and wind force were given by the spatialized sound of the wind. The presence of wind was also suggested by the movement of tree leaves and clouds (see in Figure 7a).
- V: Reference scene (R) + the visual wind flow representation, as found in representations used in architecture (see Figure 7b).
- T: Reference scene (R) + tactile wind rendering with digitally controlled fans.
- V+T: Reference scene (R) + visual representation of the wind flow (V) + tactile restitution (T).
A video of the experimental conditions can be consulted at the following link (accesed on 31 August 2021) https://youtu.be/eMKBUAsbalM. The R condition is found at 0:28 (https://youtu.be/eMKBUAsbalM?t=28, accesed on 31 August 2021), the V condition at 0:41 (https://youtu.be/eMKBUAsbalM?t=41, accesed on 31 August 2021) and the V+T condition at 0:54 (https://youtu.be/eMKBUAsbalM?t=54, accesed on 31 August 2021).
The three dependent variables were the perception of wind properties (D1: direction and D2: force), and D3—the sense of presence in the VR scene.
4.5. Hypotheses
Considering previous research, and based on our experimental design, we made the following hypotheses:
- H1: V is more accurate for understanding wind direction compared to T. Both in the real world and in virtual reality, a visual preeminence exists: the visual sense supplies much more data to our brain, and at a much greater speed than other senses [48]. By assuming visual preeminence, we believe that the wind flow visualization can bring more accurate information about the wind direction.
- H2: V+T is more accurate for understanding wind direction compared to V and T. Assuming H1 is correct, visual plus tactile congruence should lead to a better understanding as well.
- H3: T is more accurate for understanding wind force compared to V. Because the variations in force produce pressure variations in our body sensors, we assume that the tactile effect could be better than the visual speed variation of the streamlines to perceive the wind force.
- H4: V+T is more accurate for understanding wind force compared to V and T. Again, congruence of senses should lead to better wind perception than H3.
- H5: T is more accurate for increasing the sense of presence in the VR scene compared to V. Previous studies [6,37,39,40] have shown that tactile effects increase the sense of presence in a VR scene compared to an audiovisual representation. We assume the wind flow visualization (V) in our study will be consistent with those previous works.
- H6: T is more accurate for increasing the sense of presence in the VR scene compared to V+T. In this case, we do not think the addition of the two variables could be better, because the wind flow visualization does not correspond to reality. We do not see the phenomenon by itself in the real world, we just feel it.
4.6. Procedure
Each participant came to the virtual reality room where the procedure was explained. He or she had to take four different virtual paths in the same street, shown in Figure 8. Each path was characterized by a type of representation and was presented to participants according to the order given above. Before starting, participants were given a tablet and noise-canceling headphones and asked for their height to adjust the camera point of view. Then, they were located in front of the screen and at the center of the group of fans. A reference wind value was played depending on the condition in order to let the participants identify the maximal values of wind force at the sound and tactile level.
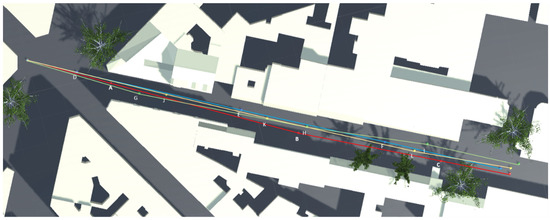
Figure 8.
The four different predefined virtual paths on the analyzed street.
The tablet had an application that indicated the number of the stop to be evaluated and allowed the participants to specify the wind direction in a circle and the wind force in a slider from 0 (corresponding to no wind) to 10 (corresponding to the maximum reference value (see in Figure 9). These evaluations were to be made based on the resulting wind behavior at the stop points, which remained constant during the evaluation. At the end of each path, the participants had to evaluate their sense of presence in the virtual scene with a Slater–Usoh–Steed (SUS) questionnaire [49]. Then they continued the experiment with another type of representation.
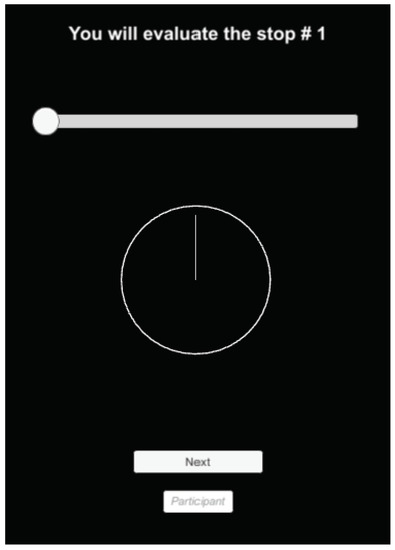
Figure 9.
Evaluation of the wind force (slider) and the wind direction (circle). Image from [10].
4.7. Results
In this section, we present the descriptive and inferential statistical analyses of the perception of the wind properties (direction and force), and of the sense of presence in the VR scene.
4.7.1. Statistical Analyses
The analysis considered the difference between the initial simulated parameters of the wind in the scene (rendered in various experimental conditions) and the user answers for the wind properties and the sense of presence.
A square-root transformation was applied to the data to normalize the absolute values of the answers. The resulting values, concerning wind properties (direction and force) and presence, were analyzed using a multilevel linear model, which is a regression that considers dependency in data [50]. The model includes the variable to be explained (direction difference, force difference or presence), the explanatory variable (the type of representation) and the participant factor as a random effect. The assumption of normality was tested with the Shapiro–Wilk test at the 5% level. Tukey’s post-hoc test was performed to compare all the conditions of the categorical variable representation. The statistical analysis was conducted using RStudio software (V2021.9.2.382, RStudio Team, Boston, MA, USA), with the function lme of the nlme package (V3.1-153). The glht (multcomp package (V1.4-18)) function was used for pairwise comparisons and the shapiro.test (stats package (V4.1.2)) function for the assumption of normality.
4.7.2. Wind Direction
The experimental condition had a significant effect on the estimation of wind direction, such that . Orthogonal contrast revealed that direction error of absolute values (difference between the expected response and the value given by the participants) was significantly reduced for T compared to R, b = 3.05, t(108) = 8.22, p < 0.001, and compared to V, b = 1.67, t(108) = 4.52, p < 0.001. There was no significant difference in direction error between T and V+T, b = 0.34, t(108) = 0.93, p = 0.35. In order to compare the significant pairwise differences, we produced a post-hoc test as set out below (see Figure 10):
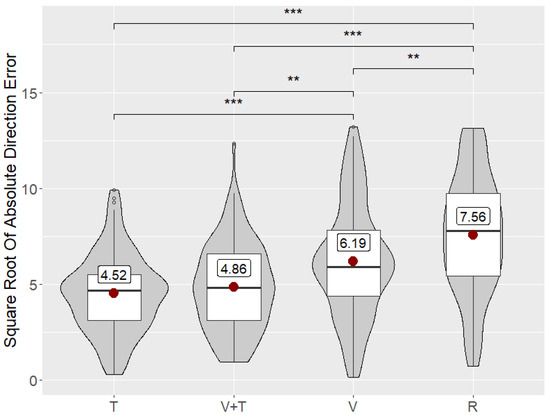
Figure 10.
Box plot and violin plot of the square root of the wind direction estimation error through the four different representations. The red dot is the mean value. Horizontal lines represent the quartiles. The violin plot shows the frequency of results. Stars present the level of significance (** = p < 0.01, *** = p < 0.001). Image from [10].
- Compared to R, direction error was significantly reduced for T (p < 0.001), V+T (p < 0.001) and V (p = 0.001).
- Compared to V, direction error was significantly reduced for T (p < 0.001) and V+T (p = 0.0017) representations.
- There was no significant difference in direction error using V+T compared to T (p = 0.78).
The effects of gender, age (evaluated between two groups: older and younger than median value) and the experience in virtual reality declared by the participants (between 1 and 5) did not present any significant difference on wind direction perception.
4.7.3. Wind Force
The experimental condition had a significant effect on the estimation of wind force, . Orthogonal contrast revealed that force error (difference between the expected response and the value given by the participants) was significantly reduced for T compared to R, b = 0.18, t(108) = 2.64, p = 0.0094. There was no significant difference in force error in T compared to V, b = 0.14, t(108) = 1.99, p = 0.05, and to V+T, b = −0.039, t(108) = −0.56, p = 0.57. In order to compare the significant pairwise differences, we produced a post-hoc test as set out below (see Figure 11):
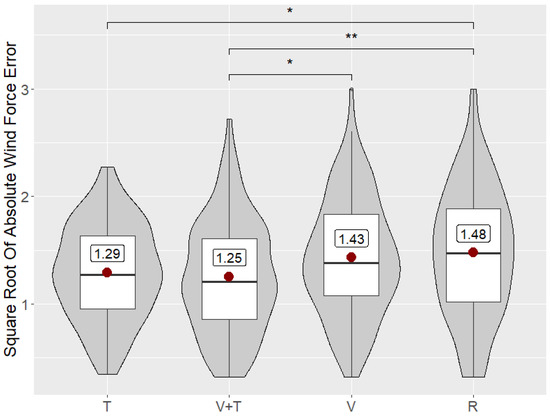
Figure 11.
Box plot and violin plot of the square root of the absolute wind force error through the four different representations. Stars present the level of significance (* = p < 0.05, ** = p < 0.01). Image from [10].
- Compared to the R, force error was significantly reduced for T (p = 0.039) and V+T (p = 0.0068).
- Compared to the V, force error was significantly reduced for V+T (p = 0.049).
- Compared to V, the wind force error was not significantly different either with R (p = 0.91) nor T (p = 0.18).
- There was no significant difference in force error for T compared to V+T (p = 0.94).
The effects of gender, age, and the experience in virtual reality declared by the participants did not present any significant difference on wind force perception.
4.7.4. Sense of Presence
The experimental condition also had a significant effect on the estimation of the sense of presence, . Orthogonal contrast revealed that the sense of presence was significantly increased in T compared to R, b = −0.17, t(108) = −5.60, p < 0.001, V, b = −0.24, t(108) = −7.66, p < 0.001 and V+T, b = −0.08, t(108) = −2.78, p = 0.006. In order to compare the significant pairwise differences, we produced a post-hoc test as set out below (see Figure 12):
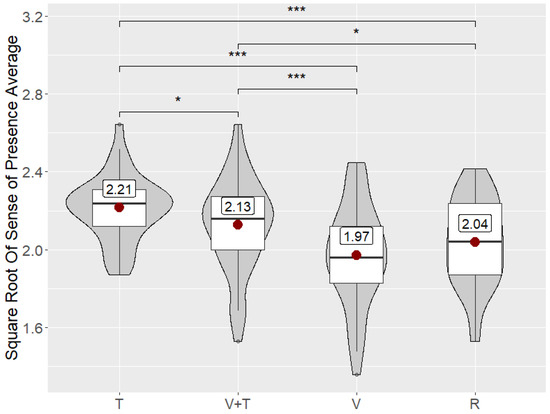
Figure 12.
Box plot and violin plot of the square root of the average sense of presence through the four different representations. The higher the value, the higher the sense of presence. Stars present the level of significance (* = p < 0.05, *** = p < 0.001). Image from [10].
- Sense of presence was significantly increased for T compared to R (p < 0.001), V (p < 0.001) and V+T (p = 0.024).
- Sense of presence was significantly increased for V+T compared to R (p = 0.023) and compared to V (p < 0.001).
- There was no significant difference in the sense of presence for V compared to R (p = 0.15).
The participants’ gender presented significant differences in the sense of presence in the VR scene . Orthogonal contrast revealed that the sense of presence was significantly lower in men compared to women b = −0.15, t(35) = −2.69, p < 0.01 (see in Figure 13). We also observe that this effect was present in all representations seen in Figure 14.
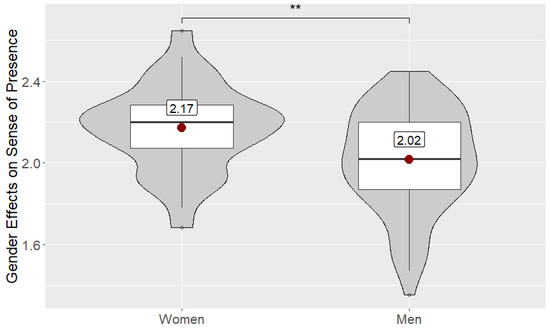
Figure 13.
Box plot and violin plot of the effects of gender on the sense of presence. Stars present the level of significance (** = p < 0.01).
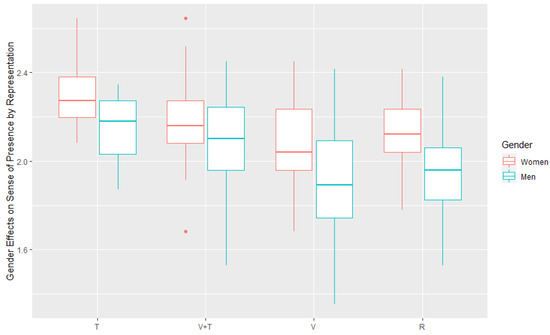
Figure 14.
Box plot of the effects of gender on the sense of presence by representation. Dots represent the outliers.
The age and experience in virtual reality declared by the participants did not have any significant impacr on the sense of presence.
4.8. Discussion
The results of this experiment show that, depending on the conditions and types of representations used in our prototype, the T condition was the most suitable in terms of perception for D1 (wind direction) and it was also the one that increased D3 (the sense of presence) the most. Regarding D2 (wind force), V+T showed the closest result to the input value.
T allows for a better assessment of the wind direction, thus rejecting the H1 hypothesis. The streamlines used in the study for the V and V+T conditions are, according to Laramee et al. [16], more suitable for 3D visualizations than direct visualizations (because of occlusions, visual clutter, or lack of depth). However, there are several ways to understand the streamlines: one can either consider them as a whole, thus indicating a global direction, or consider them more locally as a kind of vortex. This could explain why, even if V was more precise than R, it was not as good as T.
The results of V+T do not support H2. By adding the tactile rendering of the wind to the visual effects, the perception of its direction improved over V, nevertheless, it was not significantly different from T. This shows that, when evaluating the wind direction, the tactile effect was dominant over the visual effect, which highlights a possible problem when attempting a similar approach in augmented reality (AR) if the actual wind felt is not consistent with the visual representation of the phenomenon.
Although the mean wind force estimate tended to be more accurate for T than for V, the H3 hypothesis cannot be formally accepted. In contrast to V, the T and V+T conditions were significantly different from R. In the V+T condition, participants tended to be more accurate in their perception of the wind force. However, this condition was not significantly different from T, which does not support the H4 hypothesis.
Regarding the sense of presence in the VR scene, the results show that T was the condition that increased it the most, supporting the H5 and H6 hypotheses. The V condition decreased the sense of presence compared to R. This can be explained by the fact that we made something visible in the virtual world that is not visible in the real world. By adding tactile effects to the visual effects (V+T), the sense of presence was increased compared to R. Although V+T is lower than T, this study could be extended with different visual stimuli. Compared to the R condition, the T condition was better, which is consistent with previous similar studies [37,41].
In our experiment, age characteristics and reported VR experience had no significant impact on either the evaluation of wind properties or on the sense of presence in the scene.
Gender also did not influence the perception of wind properties, but it did have a significant effect on the sense of presence. Indeed, women had a greater sense of presence in the virtual reality scene. This could be due to the long hair and clothing elements that might be more sensitive to reacting with the wind, however, this would not explain why in the scenes without tactile representation, women also had a higher sense of presence. Another possible reason could be that men in the experiment were more used to specific virtual scenes, (since according to Bradley et al. [51], men spend more time playing video games than women), and were therefore looking for more detail in the model.
4.9. Limitations
Comparing the wind properties in terms of visual and tactile effects was one of the main goals of this first experiment. To do so, we used a streamlines representation that allowed us to visualize the wind flow along its trajectory. This visualization thus allows us to identify the interaction between urban forms and wind. However, due to the three-dimensional nature of the streamlines, it can be complicated to understand the wind direction, which was evaluated in two dimensions. While the streamlines may give a better idea of the overall direction of flow, it may be more difficult to identify the specific direction of the wind at a particular location in space, i.e., the exact moment when the line impacts the user.
In traditional visualization, wind force is usually represented by a color gradient in a static image. In our prototype, it is visually represented by the velocity of a 3D object. This may limit the perception of small speed changes and could explain the similarity between R and V.
Some limitations also come from the representation and measurement of wind characteristics. Our eight fans had only four possible speeds, each creating, even combined, a limited number of possible pairs of wind force and direction. On the measurement side, we used a scale from 1 to 10, which had no physical equivalent, and which therefore, did not allow us to fully measure and compare the sensed speed to the real wind speed. Note that this effect is present in all conditions.
Estimating wind properties in a real situation can be complicated without the necessary measurement tools (traditional methods of estimating wind are based on references, e.g., the Beaufort scale [52] describes the mechanical effects of wind on the environment).
Another potential limitation of this experiment is the use of a single large screen instead of an HMD. While the first one has the advantage of not covering the face for tactile stimulation, the second one could allow for a better immersion thanks to a wider field of view and by making the fans completely invisible.
In this experiment, we evaluated the understanding of the wind direction and force in the device, but we did not evaluate the effects of this direction on the perception of wind force. We want to complete the experiment to find out if certain wind directions lead to over- or under-estimating the perceived force compared to its actual value.
Finally, the participants remarked on the difficulty of identifying the properties of the wind in the audiovisual condition, which is reflected in the evaluation of the understanding of wind properties. Note that in this experiment we used this representation as our reference scene and therefore did not perform any evaluation without this condition. We consider it necessary to carry out a future evaluation without the visual and sound effects to assess their impact on the outcome.
5. Second Experiment: Perception of the Wind Force Estimate in Relation to the Beaufort Scale
The objective of this second experiment was to evaluate the perception of the wind force (based on the Beaufort scale) and the effects of wind direction under different conditions. The experiment involved 30 participants (12 women and 18 men), ranging in age from 23 to 53 years old (Mean = 35, = 8.7). This experiment differs from the previous one in that it focuses on the tactile wind rendering and the evaluation of the wind force perception by taking a known reference, the Beaufort scale. It completes the previous experiment on the question of the wind direction because we had not evaluated the perceptions of wind force concerning its direction.
5.1. Experimental Conditions
We used a within-subject design with three independent variables:
- Wind force, with two levels: (I) maximal force (three fans on at speed 3) and (II) minimal force (one fan on at speed 1) (see Figure 15);
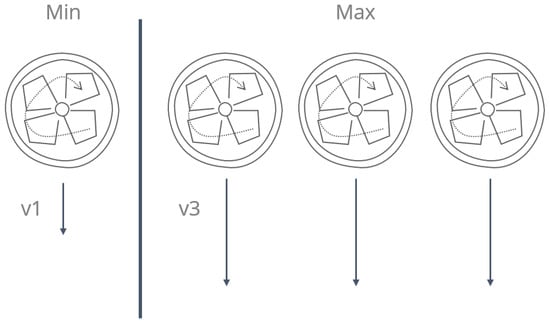 Figure 15. Minimal and maximal condition of wind force.
 - Wind direction, with three levels: (I) the wind coming from the front, (II) coming from the back, and finally (III) wind coming from one of the sides (randomly);
- The visual wind suggestion, with two levels: (I) with and (II) without clouds (see Figure 16). When clouds are present, they move following the two previous variables (force and direction) present in the current evaluation.
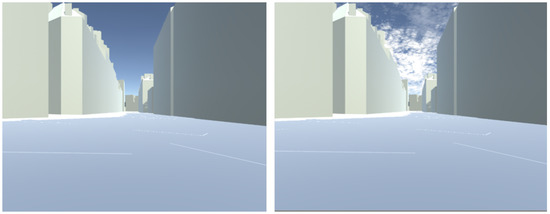 Figure 16. A 3D model with and without clouds (visual suggestion of the presence of wind).
According to these three variables, we defined 12 conditions that were randomly presented twice to the participants (presented in Table 1).

Table 1.
Experimental conditions of our second experiment. They were presented randomly to the participants (F = Frontal, B = Back, S = Side, V = Visual—clouds presence).
The participants carried out the 24 assessments by starting their routes from 12 different points distributed among the five streets presented. The urban scenes presented similar conditions for the configuration of the streets and the built environment. We chose to make 12 different routes for two main reasons. First, we wanted to reduce the effects of the street itself on the results of the evaluation of the experiment, thus assuming that the results can be attributed to various virtual streets and not to one specific street. Secondly, and in the same perspective, the aim was to reduce the effect of repetition and monotony that could have been generated by presenting the same route 24 times to the participants. The virtual streets were presented randomly to the participants with the assumption that this did not influence the final results.
5.2. Hypotheses
The fan speeds were: V1: 2.2 m/s 0.1 m/s and V3: m/s m/s measured at the participants’ position. We deduce that the rendered wind forces in the device stand between degree 2 of the Beaufort scale (wind speed between m/s and m/s) and degree 3 of the scale (3 m/s and m/s). We want to evaluate the following hypotheses:
Hypotheses H1:
The wind speed levels on the Beaufort scale perceived by participants will go beyond the actual measured level. Thus, we assume that participants will perceive higher wind forces than measured.
Hypotheses H2:
The clouds’ movement (visual suggestion of the presence of wind) will give the impression that the wind is stronger than without this suggestion.
Hypotheses H3:
The movement of the clouds will help to better understand the wind direction (especially for the maximal force condition where there are three fans on, which implies three directions).
Hypotheses H4:
The errors in the wind direction will be higher with the maximal wind force condition because of the operation of several fans at the same time.
5.3. Procedure
Each participant arrived at the experimental room where the procedure was explained. They provided with a video game controller to allow them to interact with the application, as well as headphones to reduce the sounds present in the room. Unlike during the first experience, we used a constant white noise during the evaluations to reduce the different sounds in the room (fans, relays, etc.). We did not add the wind sound to reduce the number of variables in our analysis. The gamepad was used to move around the virtual scene and to select and validate responses. Before starting the experiment, we asked each participant to read the reference table of Beaufort scale values where the values from zero to eight, the names corresponding to each value and their equivalent mechanical effects on earth were presented. This table was presented each time we asked the participants to evaluate the wind force.
As for the first experiment, the participants were placed in the middle of the fans and in front of the room screen where the height of the virtual camera was adjusted according to their height (see in Figure 2b). They started a route in a virtual street under one of the predefined wind conditions. The route being free, the participants could move in all directions or stop where they wanted. Nevertheless, the rotation of the virtual camera was forbidden to avoid latency when adjusting the wind direction.
Fifteen seconds after the start of the route, the wind force evaluation screen is shown to the participants (see in Figure 17). They had to choose the perceived wind force on the scale from zero to eight based on the reference description of values.
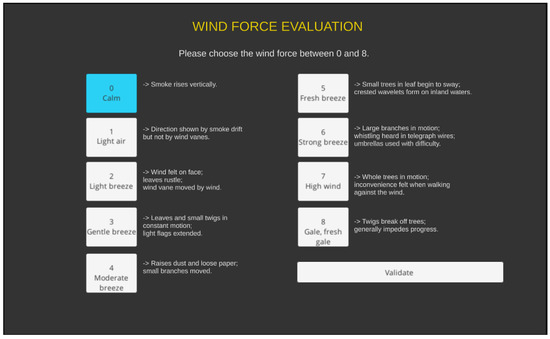
Figure 17.
Wind force evaluation screen based on the Beaufort scale.
Following the evaluation of the wind force, the participant had to validate the wind direction (see in Figure 18). After this evaluation, the participants start a new free path under a different wind condition and repeat the exercise until the 12 (×2) different evaluation conditions are completed.
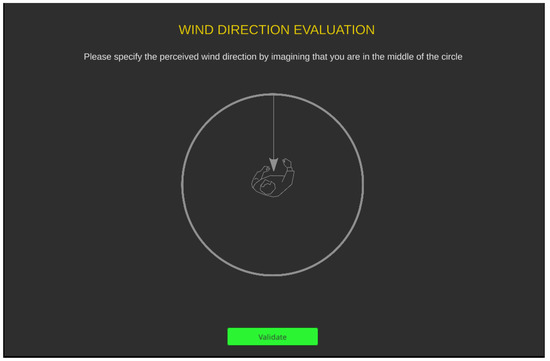
Figure 18.
Wind direction evaluation screen.
5.4. Results
In this section, we present the descriptive and inferential statistical analyses of perceived wind properties (direction and force), relative to the Beaufort scale.
5.4.1. Statistical Analyses
The analysis considered the difference between the initial simulated wind force parameters in the scene (rendered under various experimental conditions) and the participants’ responses.
As for the first experiment, a square-root transformation was applied to the wind direction data to limit the range of values of the participants’ responses and thus manage the outliers. The resulting wind direction and wind force values were analyzed using a multilevel linear model. The model includes the variable to be explained (difference in direction and difference in force), the explanatory variable (the different conditions), and the participant factor (which accounts for the fact that the data are from the same individuals) as a random effect.
A Tukey post-hoc test was performed to compare all conditions of representations of the categorical variable. Statistical analysis was performed using RStudio software, with the function lme of nlme package. The function glht (multcomp package) was used for pairwise comparisons and we performed a visual check of the normal distribution of the data residuals.
5.4.2. Wind Force
The distribution of raw responses regarding wind force is presented in Figure 19. The conditions used in the experiment had a significant effect in estimating wind force, (11) = 194.61, p < 0.0001. The Tukey post-hoc test revealed statistically significant differences, presented in Table 2. The average values analyzed are the difference between the input value and the average values of the participants’ responses (see in Figure 20).
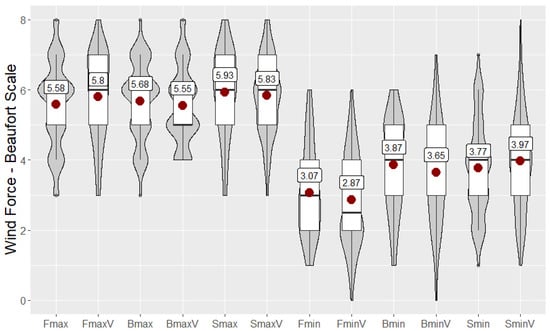
Figure 19.
Box plot and violin plot of the wind force responses under different conditions. The red dot is the mean value. The horizontal lines represent the quartiles. The bold horizontal line is the median. The violin plot shows the distribution of responses for each condition.
Table 2.
Table of statistically significant differences in the deviation of the wind force perception. The stars represent the level of significance (* = p < 0.05, ** = p < 0.01, *** = p < 0.001).
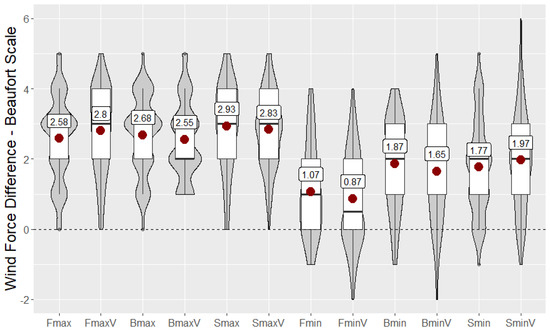
Figure 20.
Box plot and violin plot of the deviation of the wind force (difference between the input value and the perceived value) under different conditions. The 0 value (dotted line) corresponds to the input value. Note: to facilitate the reading of the graph, the relations of the statistical differences between the conditions are presented in Table 2.
Gender and age did not present any significant impact on wind force perception.
5.4.3. Wind Direction
The distribution of responses regarding the deviation of the wind direction from the input value (which corresponds to the value 0 in the figure) is presented in Figure 21. The conditions used in the experiment had a significant effect on the wind direction estimate, (11) = 109.19, p = 0.0001. The Tukey post-hoc test revealed statistically significant differences, presented in Table 3. The average values analyzed correspond to the absolute values of the difference between the input value and the average values of the square root of participants’ responses (see in Figure 22).
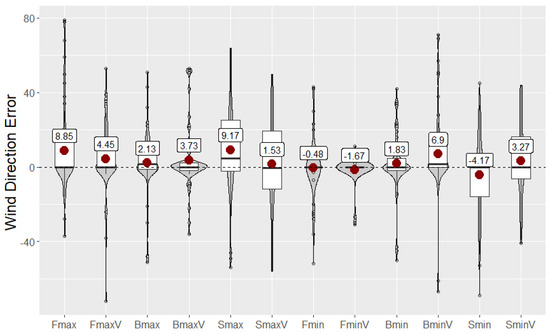
Figure 21.
Box plot and violin plot of the deviation (from the input values) of the wind direction responses under different conditions. The 0 value (dotted line) corresponds to the input value.
Table 3.
Table of statistically significant differences in the square root of the absolute values of the wind direction deviation. The stars represent the level of significance (* = p < 0.05, ** = p < 0.01, *** = p < 0.001).
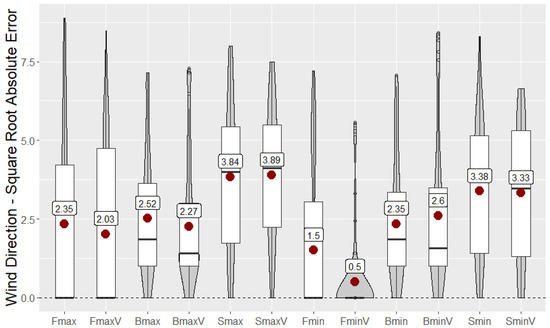
Figure 22.
Box plot and violin plot of the square root of the absolute values of the wind direction deviation under different conditions. The 0 value (dotted line) corresponds to the input value. Note: to facilitate the reading of the graph, the statistical differences between the conditions are presented in Table 3.
Gender and age did not present any significant impact on wind direction perception.
5.5. Discussion
The results of this study show that, according to the conditions used in the experiment, the wind force is overestimated for both the minimum and maximum force value used in relation to the Beaufort scale. The minimum force value was 2.2 m/s (Beaufort force 2), while the average values given by the participants are between Beaufort values 3 and 4. Regarding the maximum force, the resulting value was 3.3 m/s (Beaufort force 3), while the average responses of the participants are between forces 5 and 6 (see in Figure 19). This allows us to accept hypothesis H1. We consider that the overestimation of force may be related to two possible factors. The first factor is the location of the fans close to the participants. Verlinden et al. [39] used a similar fan configuration, however they placed them in the upper part of the device. They noted that participants notice a lack of fan force to make the simulation more realistic. This is not enough to say that the ground location of the fans produced the overestimation of wind force; indeed, the researchers [39] did not evaluate the perception of wind force and their simulation studied the effects of wind at sea, where the wind effects are more remarkable than on land. Nevertheless, we find it very relevant to replicate our experiment by moving the fans from the ground to the top. This could more closely approximate the impact of wind on a pedestrian in an urban environment. The second factor of overestimation of the wind force is related to the sound effect used which could have suggested a higher force. Indeed, we used a constant white noise, and this sound signal was considered by some participants as the sound of strong wind, which makes us think about the reproduction of the experiment without this sound.
Wind direction did not show an impact on the estimation of maximum wind force. There are no statistically significant differences between the three levels of the condition (front, back, side). Nevertheless, concerning the minimum force, we find differences between the force coming from the front (FMin andFMinV) and the other two directions. This could be related to the exposure of the face to the wind, but also to the fact that these were the only conditions where the participant could see (indirectly) a single fan turned on. It should be noted that these conditions were the closest to the actual force input value: FMinV had an average difference of with the input value and FMin . In parallel, BMin (%), BMinV (%), SMin (%) and SMinV (%) showed an increase in the gap between the input value and the perceived value compared to FMinV.
The study shows, according to our experimental conditions, that the visual variable (suggestion of the mechanical effects of the wind on the clouds) does not generate statistically significant differences in the understanding of the wind force nor for its direction, and thus we reject hypotheses H2 and H3.
Concerning the understanding of the wind direction (D2), we find that for the maximum force input value, the differences are in the wind coming from the sides (SMax, SMaxV) in relation to the front and rear directions. Thus, there is an increase in error with wind from the sides and there are no statistically significant differences between wind from the front and wind from the back. Compared to FMaxV (which has the smallest steering deviation of the maximum force conditions ), SMax and SMaxV have shown increases of 89 % and 91% respectively. With regard to the minimum force input value, the wind coming from the front (FMinV) is statistically significantly different to the wind coming from the back and from the sides (see Figure 22). FMinV was the condition whose responses were closest to the input value (difference of ). Compared to this condition, BMin had an increase of 370%, BMinV of 420%, SMin of 576% and SMinV of 566%. The frontal wind shows the smallest error with respect to the direction. As discussed for wind force, this result may be related to the fan visibility. If we compare the maximum force conditions to their minimum force counterparts in terms of perceived direction, we find that only FMaxV and FMinV have a statistically significant difference. We therefore reject H4, and conclude that the wind direction can be understood similarly even if one or three fans are used.
As for our first experiment, neither age nor gender had an influence on the results obtained from the evaluation of wind properties’ perception.
5.6. Limitations
There is a possible bias in the experiment related to the visibility of the front fan when evaluating wind force and direction. Initially, this experiment was also intended to compare the use of an HMD and a large screen; this was not possible due to the COVID-19 health crisis. We decided to limit the use of elements that participants had to manipulate. We therefore plan to repeat the experiment using the HMD device to evaluate its effects.
We also consider it necessary to carry out a new experiment with the location of the fans at a higher level to evaluate the impact of the wind coming from the vertical axis. Indeed, the fact of having the wind coming from the lower part can generate sensations specific to a strong aeraulic behavior, especially the sensation of a strong wind on the legs. It is also important to consider for a future experiment how to reduce the ambient noise, as we consider that the white noise used can also suggest the presence and even the intensity of the wind. This could be the subject of a future experiment, without the immersive scene but using only sound rendering and tactile rendering with the fans.
The device, under the conditions of the experiment, could restore a range of wind forces between levels 3 and 6 of the Beaufort scale in an urban space. For this experiment, we tested the minimum and maximum values of the force produced by the fans. We can assume that by using the intermediate speeds of the fans, we could make values between levels 3 and 6 of the Beaufort scale be felt. It would therefore be relevant to use the device with other elements or configurations (spatial, visual, sound) to create the illusion of low winds (corresponding to levels 1 and 2 of the scale) to simulate the resulting wind behavior in the city using virtual reality.
6. General Discussion and Future Work
In this research, we chose to evaluate different types of wind representation in a virtual reality device equipped with a group of eight digitally controlled fans. Indeed, this device allows for gathering audiovisual and tactile representations, as well as the visualization of elements that are not observable in reality, such as wind flow. We have chosen to analyze urban scenes from a pedestrian point of view because it corresponds to the classic perception of a person in the city.
Using this device, we carried out two different experiments concerning the understanding of wind properties, as well as the effects of the representations on the sense of presence in the VR scene.
In our first experiment, we used the results of a wind simulation to generate different types of wind representations in a VR scene. The results showed a correct understanding of the wind force and direction information through the stimulation of the sense of touch. These results show a way to use quantitative data resulting from a wind simulation by exploiting the sensitive properties of the phenomenon, even if the physical rendering of the wind force was suggestive, and not real wind (in terms of accuracy of the flow) (see Section 4).
We evaluated the streamlines’ understanding of the wind flow in the virtual scene. The results of this representation, while not as good as the tactile rendering for understanding wind properties, are better than the reference scene. We have only evaluated the use of this wind-flow visualization in the virtual scene. Nevertheless, we believe that studying other types of visual wind representation effects may be more appropriate for future analyses.
The results of our experiment showed that conditions including tactile wind rendering increase the sense of presence in the VR scene evaluated the most, which is consistent with previous studies of tactile wind rendering in VR [6,37,39,40].
At this stage, our study is based on the qualitative perception of the wind, and we would also like to evaluate the JNDs attainable with our system, as described by Nakano [45].
We also want to point out that the wind simulation, like any result of a CFD calculation, is also very sensitive to the mesh size and the initial data, and requires a validation process by comparison with real data. The objective of this experiment was more to evaluate the perception of the simulation results than to evaluate, at this stage, an accurate simulation of a real street. However, this would be an interesting topic for collaboration between the simulation and end users such as architects. Eventually, an AR-based visualization could also be interesting to make visible the results of a CFD simulation on site.
This could also be evaluated in a mixed system between virtual and augmented reality, in which, by means of a virtual twin [53], participants could have a global view of wind behavior of an urban environment projected on a scale model while having the immersive view on the VR projection screen.
Our second experiment showed an overestimation of the wind force compared to the Beaufort scale, according to our experimental conditions. This could be interesting to explore in the field of VR as it allows for the generation of strong wind effects with a reduction in equipment requirements.
The results also show that the side wind direction is more difficult to identify than the frontal or back wind direction. This is consistent with the evaluations results of Nakano et al. [38].
With our configuration of fans, their size and their power, it is possible to simulate the wind in a public space. This configuration produces an enveloping effect of the wind around the participants’ bodies that is consistent with real-life situations. Our results show that having several fans on at the same time does not affect the understanding of the dominant wind direction.
Following our experiments, various questions and perspectives were raised. They concern the level of localization of the fans (upper or lower part of the room ), the type of display of the VR scene (HMD or large screen), the interaction of the wind in VR with other physical phenomena (such as temperature, light, colors and sounds) to restore the atmosphere of a space, among others.
7. Conclusions
Based on the existing representations in the architecture and urbanism fields, where the wind representation is notably characterized by the visualization of its flow, we questioned ourselves on the ways to increase these representations to present the sensitive properties of wind. This extended our research to other disciplines and means of expression, such as artistic representations, computer graphics, cinema and virtual reality.
In these areas, we found representations that are closer to the way we perceive wind in reality. They are presented in an audiovisual form, showing the effects of wind on the context, as well as in tactile form on people. This allows us to convey information about the wind that is comparable to real-life experiences.
The purpose of this study is to conduct user studies to answer the question of the possibility of understanding the wind in a VR scene. This question is not necessarily related to realism; our goal was not to create a real wind flow, but to create an illusion of its resulting effects.
Being aware of the incidence that temperature has on the wind resulting from urban spaces, we aim to implement this variable in a future experiment, taking into account the versatility offered by the controlled environment of a VR experiment room.
Throughout this research, we have emphasized the importance of wind in inhabited spaces and its impact on the inhabitants of these spaces. Our experiments show the prospect of developing this approach in the representation of the different stages of architectural and urban projects. On the one hand, it has the potential to enrich the design process by allowing designers to explore the sensitive properties of wind, and on the other hand, to allow the future users of a space to experience and appreciate it beyond its visual and aesthetic aspects.
The results of this study correspond to the variables and conditions used in it. We note that we cannot generalize with our sample population, which is notably limited in terms of quantity and diversity.
Author Contributions
Conceptualization, Gabriel Giraldo, Myriam Servières and Guillaume Moreau; formal analysis, Gabriel Giraldo; investigation, Gabriel Giraldo; supervision, Myriam Servières and Guillaume Moreau; writing—Original draft, Gabriel Giraldo; writing—Review and editing, Myriam Servières and Guillaume Moreau All authors have read and agreed to the published version of the manuscript.
Funding
This research was funded by The Ministry of Higher Education, Research and Innovation (France) (MESRI).
Informed Consent Statement
Informed consent was obtained from all subjects involved in the study.
Data Availability Statement
Raw data of experiments are available upon request to the authors.
Acknowledgments
The authors wish to thanks Houda Belgacem, Pierre Molinaro, Daniel Siret, Maxim Spur, Jenny Gutiérrez and Centrale Nantes for their help in setting up the system and proofreading the paper.
Conflicts of Interest
The authors declare no conflict of interest. The funders had no role in the design of the study; in the collection, analyses, or interpretation of data; in the writing of the manuscript, or in the decision to publish the results.
Abbreviations
The following abbreviations are used in this manuscript:
| VR | Virtual Reality |
| CFD | Computational Fluid Dynamics |
| BIM | Building information modeling |
| HMD | Head Mounted Display |
| JNDs | Just Noticeable Differences |
| AR | Augmented Reality |
References
- Gandemer, J. Discomfort Due to Wind Near Buildings: Aerodynamic Concepts; Department of Commerce, National Bureau of Standards: Washington, DC, USA, 1978. [Google Scholar]
- Paes, D.; Arantes, E.; Irizarry, J. Immersive environment for improving the understanding of architectural 3D models: Comparing user spatial perception between immersive and traditional virtual reality systems. Autom. Constr. 2017, 84, 292–303. [Google Scholar] [CrossRef]
- Erickson, A.; Kim, K.; Schubert, R.; Bruder, G.; Welch, G. Is It Cold in Here or Is It Just Me? Analysis of Augmented Reality Temperature Visualization for Computer-Mediated Thermoception. In Proceedings of the 2019 IEEE International Symposium on Mixed and Augmented Reality (ISMAR), Beijing, China, 14–18 October 2019; pp. 202–211. [Google Scholar] [CrossRef]
- Tahrani, S.; Moreau, G. Integration of Immersive Walking to Analyse Urban Daylighting Ambiences. J. Urban Des. 2008, 13, 99–123. [Google Scholar] [CrossRef]
- Vigier, T.; Siret, D.; Moreau, G.; Lescop, L. Sensitive suggestion and perception of climatic effects in virtual urban environments. In Proceedings of the ACM Symposium on Applied Perception, Dublin, Ireland, 22–23 August 2013. [Google Scholar]
- Moon, T.; Kim, G.J. Design and Evaluation of a Wind Display for Virtual Reality. In Proceedings of the ACM Symposium on Virtual Reality Software and Technology (VRST ’04), Hong Kong, 10–12 November 2004; ACM: New York, NY, USA, 2004; pp. 122–128. [Google Scholar] [CrossRef]
- Berger, M.; Cristie, V. CFD post-processing in Unity3D. Procedia Comput. Sci. 2015, 51, 2913–2922. [Google Scholar] [CrossRef]
- Lamberts, R.; Dutra, L.; Pereira, F.O.R. Eficiência Energética na Arquitetura, 3rd ed.; Eletrobras/Procel: Rio de Janeiro, Brazil, 2014. [Google Scholar]
- Bustamante, C.; Jans, M.; Higueras, E. The behavior of wind in urban morphology and its incidence in the resting use of public space, Punta Arenas, Chile. AUS 2014, 28–33. (In Spanish) [Google Scholar] [CrossRef]
- Giraldo, G.; Servières, M.; Moreau, G. Perception of Multisensory Wind Representation in Virtual Reality. In Proceedings of the 2020 IEEE International Symposium on Mixed and Augmented Reality (ISMAR), Porto de Galinhas, Brazil, 9–13 November 2020; pp. 45–53. [Google Scholar] [CrossRef]
- Ristic, S. Flow Visualisation Techniques in Wind Tunnels Part I—Non optical Methods. Sci. Tech. Rev. 2007, 57, 39–50. [Google Scholar]
- Edmunds, M.; Laramee, R.S.; Chen, G.; Max, N.; Zhang, E.; Ware, C. Surface-based flow visualization. Comput. Graph. 2012, 36, 974–990. [Google Scholar] [CrossRef]
- McLoughlin, T.; Laramee, R.S.; Peikert, R.; Post, F.H.; Chen, M. Over Two Decades of Integration-Based, Geometric Flow Visualization. Comput. Graph. Forum 2010, 29, 1807–1829. [Google Scholar] [CrossRef]
- Salzbrunn, T.; Janicke, H.; Wischgoll, T.; Scheuermann, G. The State of the Art in Flow Visualization: Partition-Based Techniques. In Proceedings of the 2008 Simulation and Visualization Conference, Magdeburg, Germany, 18–29 February 2008; pp. 75–92. [Google Scholar]
- Post, F.H.; Vrolijk, B.; Hauser, H.; Laramee, R.S.; Doleisch, H. The State of the Art in Flow Visualisation: Feature Extraction and Tracking. Comput. Graph. Forum 2004, 22, 775–792. [Google Scholar] [CrossRef]
- Laramee, R.S.; Weiskopf, D.; Schneider, J.; Hauser, H. Investigating Swirl and Tumble Flow with a Comparison of Visualization Techniques. In Proceedings of the IEEE Visualization ’04. IEEE Computer Society, Austin, TX, USA, 10–15 October 2004; pp. 51–58. [Google Scholar]
- Brambilla, A.; Carnecky, R.; Peikert, R.; Viola, I.; Hauser, H. Illustrative Flow Visualization: State of the Art, Trends and Challenges. Eurographics State Art Rep. 2012, 75–94. [Google Scholar] [CrossRef]
- Yan, J.; Kensek, K.; Konis, K.; Noble, D. CFD Visualization in a Virtual Reality Environment Using Building Information Modeling Tools. Buildings 2020, 10, 229. [Google Scholar] [CrossRef]
- Fu, D.; Wu, B.; Moreland, J.; Chen, G.; Ren, S.; Zhou, C. Virtual Reality Visualization of Typical Processes in Blast Furnace. In Proceedings of the AISTech 2009-Proceedings of the Iron and Steel Technology Conference, St. Louis, MO, USA, 4–7 May 2009. [Google Scholar]
- Hosokawa, M.; Fukuda, T.; Yabuki, N.; Michikawa, T.; Motamedi, A. Integrating CFD and VR for Indoor Thermal Environment Design Feedback. In Proceedings of the The 21st International Conference on Computer-Aided Architectural Design Research in Asia (CAADRIA 2016), Melbourne, Australia, 30 March–2 April 2016; pp. 663–672. [Google Scholar]
- Giraldo, G.; Servières, M.; Tourre, V.; Signorelli, V.; Bonnet, A. Caractérisation et restitution vidéographique des ambiances urbaines. In Proceedings of the SCAN’18; SHS Web of Conferences, Nantes, France, 24–26 October 2018; Volume 47. [Google Scholar] [CrossRef]
- Blocken, B.; Stathopoulos, T.; Cameliet, J.; Hensen, J. Application of CFD in building performance simulation for the outdoor environment. In Proceedings of the Eleventh International IBPSA Conference, Glasgow, Scotland, 27–30 July 2009. [Google Scholar]
- Barr, M. Late Rain-Waymouth Street, 2016. Library Catalog. Available online: https://fineartamerica.com/featured/late-rain-waymouth-street-mike-barr.html (accessed on 7 May 2020).
- Kahrs, J. Paperman; IMDb ID: tt2388725; Walt Disney Animation Studios, New York Film Festival: New York, NY, USA, 2012. [Google Scholar]
- Shyamalan, M.N. The Happening; IMDb ID: tt0949731; Twentieth Century Fox: New York, NY, USA, 2008. [Google Scholar]
- Unseld, S. The Blue Umbrella; IMDb ID: tt2616880; Pixar Animation Studios, Berlin International Film Festival: Berlin, Germany, 2013. [Google Scholar]
- Botticelli, S. The Birth of Venus; 1485. Available online: https://www.virtualuffizi.com/birth-of-venus.html5 (accessed on 19 April 2018).
- Gabriel, M.; Goldberg, E. Pocahontas; IMDb ID: tt0114148; Walt Disney Pictures: New York, NY, USA, 1995. [Google Scholar]
- Wang, C.; Wang, Z.; Xia, T.; Peng, Q. Real-time snowing simulation. Vis. Comput. 2006, 22, 315–323. [Google Scholar] [CrossRef]
- Dobashi, Y.; Kaneda, K.; Yamashita, H.; Okita, T.; Nishita, T. A Simple, Efficient Method for Realistic Animation of Clouds. In Proceedings of the 27th Annual Conference on Computer Graphics and Interactive Techniques, (SIGGRAPH ’00), New Orleans, LA, USA, 23–28 July 2000; ACM Press/Addison-Wesley Publishing Co.: New York, NY, USA, 2000; pp. 19–28. [Google Scholar] [CrossRef]
- Max, N.; Crawfis, R.; Williams, D. Visualizing Wind Velocities by Advecting Cloud Textures. In Proceedings of the 3rd Conference on Visualization (VIS ’92), Boston, MA, USA, 19–23 October 1992; pp. 179–184. [Google Scholar]
- Bakay, B.; Heidrich, W. Real-Time Animated Grass. In Eurographics (Short Paper). 2002. Available online: https://www.cs.ubc.ca/labs/imager/tr/2002/bakay2002a/bakay.2002a.pdf (accessed on 31 August 2021).
- Diener, J.; Rodriguez, M.; Baboud, L.; Reveret, L. Wind projection basis for real-time animation of trees. Comput. Graph. Forum 2009, 28, 533–540. [Google Scholar] [CrossRef][Green Version]
- Quigley, E.; Yu, Y.; Huang, J.; Lin, W.; Fedkiw, R. Real-Time Interactive Tree Animation. IEEE Trans. Vis. Comput. Graph. 2018, 24, 1717–1727. [Google Scholar] [CrossRef] [PubMed]
- Cardin, S.; Thalmann, D.; Vexo, F. Head Mounted Wind. In Proceedings of the 20th Annual Conference on Computer Animation and Social Agents (CASA2007), Hasselt, Belgium, 11–13 June 2007; pp. 101–108. [Google Scholar]
- Kojima, Y.; Hashimoto, Y.; Kajimoto, H. A Novel Wearable Device to Present Localized Sensation of Wind. In Proceedings of the International Conference on Advances in Computer Enterntainment Technology (ACE ’09), Athens, Greece, 29–31 October 2009; ACM: New York, NY, USA, 2009; pp. 61–65. [Google Scholar] [CrossRef]
- Lehmann, A.; Geiger, C.; Woldecke, B.; Stocklein, J. Poster: Design and evaluation of 3D content with wind output. In Proceedings of the 2009 IEEE Symposium on 3D User Interfaces, Lafayette, LA, USA, 14–15 March 2009; pp. 151–152. [Google Scholar] [CrossRef]
- Nakano, T.; Yanagida, Y. Conditions influencing perception of wind direction by the head. In Proceedings of the 2017 IEEE Virtual Reality (VR), Los Angeles, CA, USA, 18–22 March 2017; pp. 229–230. [Google Scholar] [CrossRef]
- Verlinden, J.C.; Mulder, F.A.; Vergeest, J.S.; de Jonge, A.; Krutiy, D.; Nagy, Z.; Logeman, B.J.; Schouten, P. Enhancement of Presence in a Virtual Sailing Environment through Localized Wind Simulation. Procedia Eng. 2013, 60, 435–441. [Google Scholar] [CrossRef]
- Rietzler, M.; Plaumann, K.; Kränzle, T.; Erath, M.; Stahl, A.; Rukzio, E. VaiR: Simulating 3D Airflows in Virtual Reality. In Proceedings of the 2017 CHI Conference on Human Factors in Computing Systems (CHI ’17), Denver, CO, USA, 6–11 May 2017; ACM: New York, NY, USA, 2017; pp. 5669–5677. [Google Scholar] [CrossRef]
- Kulkarni, S.; Minor, M.; Deaver, M.; Pardyjak, E.; Hollerbach, J.M. Design, Sensing, and Control of a Scaled Wind Tunnel for Atmospheric Display. Mechatronics IEEE/ASME Trans. 2012, 17, 635–645. [Google Scholar] [CrossRef]
- Pluijms, J.P.; Cañal-Bruland, R.; Bergmann Tiest, W.M.; Mulder, F.A.; Savelsbergh, G.J.P. Expertise effects in cutaneous wind perception. Attention, Percept. Psychophys. 2015, 77, 2121–2133. [Google Scholar] [CrossRef] [PubMed]
- Ito, K.; Ban, Y.; Warisawa, S. AlteredWind: Manipulating Perceived Direction of the Wind by Cross-Modal Presentation of Visual, Audio and Wind Stimuli. In Proceedings of the SIGGRAPH Asia 2019 Emerging Technologies (SA ’19), Brisbane, QLD, Australia, 17–20 November 2019; Association for Computing Machinery: New York, NY, USA, 2019; pp. 3–4. [Google Scholar] [CrossRef]
- Nakano, T.; Saji, S.; Yanagida, Y. Indicating Wind Direction Using a Fan-Based Wind Display. In Haptics: Perception, Devices, Mobility, and Communication; Isokoski, P., Springare, J., Eds.; Springer: Berlin/Heidelberg, Germany, 2012; pp. 97–102. [Google Scholar]
- Nakano, T.; Yoshioka, Y.; Yanagida, Y. Effects of Wind Source Configuration of Wind Displays on Property of Wind Direction Perception. In Proceedings of the ACHI 2014: The Seventh International Conference on Advances in Computer-Human Interactions, Barcelona, Spain, 23 March 2014. [Google Scholar]
- Belgacem, H.; Leduc, T.; Musy, M. Towards a QGIS-based Graph Carrier of Urban Information and Spotting Wind Behavior at the Pedestrian Level. In Proceedings of the 10th International Conference on Urban Climate/14th Symposium on the Urban Environment, New York, NY, USA, 6–10 August 2018. [Google Scholar]
- SoudBible. Free Sound Clips|SoundBible.com. Available online: https://soundbible.com/ (accessed on 15 March 2022).
- Hall, E.T. The Hidden Dimension; Anchor Books: Garden City, NY, USA, 1969. [Google Scholar]
- Slater, M.; McCarthy, J.; Maringelli, F. The Influence of Body Movement on Subjective Presence in Virtual Environments. Hum. Factors 1998, 40, 469–477. [Google Scholar] [CrossRef] [PubMed]
- Field, A.P.; Miles, J.; Field, Z. Discovering Statistics Using R/Andy Field, Jeremy Miles, Zoë Field; Sage: London, UK; Thousand Oaks, CA, USA, 2012. [Google Scholar]
- Greenberg, B.S.; Sherry, J.; Lachlan, K.; Lucas, K.; Holmstrom, A. Orientations to Video Games Among Gender and Age Groups. Simul. Gaming 2010, 41, 238–259. [Google Scholar] [CrossRef]
- World Meteorological Organization; Commission for Maritime Meteorology. The Beaufort Scale of Wind Force: (Technical and Operational Aspects); WMO: Geneva, Switzerland, 1970. [Google Scholar]
- Aheleroff, S.; Xu, X.; Zhong, R.Y.; Lu, Y. Digital Twin as a Service (DTaaS) in Industry 4.0: An Architecture Reference Model. Adv. Eng. Inform. 2021, 47, 101225. [Google Scholar] [CrossRef]


Publisher’s Note: MDPI stays neutral with regard to jurisdictional claims in published maps and institutional affiliations. |
© 2022 by the authors. Licensee MDPI, Basel, Switzerland. This article is an open access article distributed under the terms and conditions of the Creative Commons Attribution (CC BY) license (https://creativecommons.org/licenses/by/4.0/).