Article

Moderating Effect of a Cross-Level Social Distancing Policy on the Disparity of COVID-19 Transmission in the United States

1
School of Resource and Environmental Sciences (SRES), Wuhan University, 129 Luoyu Rd., Wuhan 430079, China
2
Department of Geographical and Sustainability Sciences, University of Iowa, 111 Jessup Hall, Iowa City, IA 52242, USA
3
Information and Education Technology Center, Zhejiang A & F University, Hangzhou 311300, China
*
Author to whom correspondence should be addressed.
ISPRS Int. J. Geo-Inf. 2022, 11(4), 229; https://doi.org/10.3390/ijgi11040229
Submission received: 23 February 2022 / Revised: 22 March 2022 / Accepted: 25 March 2022 / Published: 30 March 2022
(This article belongs to the Collection Spatial Components of COVID-19 Pandemic)

Abstract

:
Currently, coronavirus disease 2019 (COVID-19) remains a global pandemic, but the prevention and control of the disease in various countries have also entered the normalization stage. To achieve economic recovery and avoid a waste of resources, different regions have developed prevention and control strategies according to their social, economic, and medical conditions and culture. COVID-19 disparities under the interaction of various factors, including interventions, need to be analyzed in advance for effective and precise prevention and control. Considering the United States as the study case, we investigated statistical and spatial disparities based on the impact of the county-level social vulnerability index (SVI) on the COVID-19 infection rate. The county-level COVID-19 infection rate showed very significant heterogeneity between states, where 67% of county-level disparities in COVID-19 infection rates come from differences between states. A hierarchical linear model (HLM) was adopted to examine the moderating effects of state-level social distancing policies on the influence of the county-level SVI on COVID-19 infection rates, considering the variation in data at a unified level and the interaction of various data at different levels. Although previous studies have shown that various social distancing policies inhibit COVID-19 transmission to varying degrees, this study explored the reasons for the disparities in COVID-19 transmission under various policies. For example, we revealed that the state-level restrictions on the internal movement policy significantly attenuate the positive effect of county-level economic vulnerability indicators on COVID-19 infection rates, indirectly inhibiting COVID-19 transmission. We also found that not all regions are suitable for the strictest social distancing policies. We considered the moderating effect of multilevel covariates on the results, allowing us to identify the causes of significant group differences across regions and to tailor measures of varying intensity more easily. This study is also necessary to accomplish targeted preventative measures and to allocate resources.

1. Introduction

Coronavirus disease 2019 (COVID-19) initiated a global pandemic. As of 12 March 2022, more than 452 million total confirmed cases and 6.02 million total deaths occurred because of COVID-19, and these numbers are rising. Various nonpharmaceutical interventions have been implemented in countries and regions based on their socioeconomic and cultural considerations [1,2]. The global economy and people’s lives have been substantially impacted [3,4]. Targeted strategies are critical, both at the beginning of the outbreak and in the current postepidemic era. In particular, in the United States, the pattern of the outbreaks varies significantly across states and counties [5,6,7]. Thus, when establishing regionalized policies, such as social distancing restrictions and vaccination resource distributions, policymakers must understand their regional characteristics and how these local factors contribute to the disparities in COVID-19 transmission.
To help identify the communities most likely to be impacted by COVID-19, previous studies have developed various indices incorporating sociodemographic factors such as the economy, population, and medical care system [8,9,10]. Among these indices, the social vulnerability index (SVI) [11] has drawn much attention and has widely been investigated. This index, which can be applied to events involving natural disasters and hazards such as COVID-19, comprises four themes: (1) socioeconomic status, (2) household composition and disability, (3) minority status and language, and (4) housing type and transportation. Many researchers have examined the relationship between the SVI and COVID-19 outcomes [12,13,14,15,16,17]. Some of these studies have shown that social vulnerability is associated with higher COVID-19 incidence and mortality across the United States [11,12,18]. For example, Khazanchi et al. [19] found that disproportionate COVID-19 impacts in urban and rural areas were driven by the SVI’s Minority Status and Language theme. Additionally, some studies found that social vulnerability factors are significantly associated with higher COVID-19 death rates in specific cities and that racial inequity is associated with the COVID-19 incidence rate [20,21].
Additionally, government policies and other societal factors affected by policies, such as social distancing and human mobility, are crucial indicators affecting the spread of COVID-19 [22,23,24]. Charles et al. [25] estimated the impact of four types of social distancing measures on confirmed COVID-19 case growth rates through 27 April 2020. They illustrated the potential danger of an exponential spread in the absence of interventions. Kaufman et al. (2021) [26] estimated the total effect of all state social distancing orders, including nonessential business (NEB) closure, shelter-in-place, and stay-at-home orders, on cumulative COVID-19 cases for each state in the US. They found that the effect of social distancing on the infection rate of COVID-19 in the US varied substantially across states, and the effects were largest in states with the highest community spread. Jia et al. [27] and Badr et al. [28] found a strong correlation between the number of infections and mobility in each prefecture/county in China and the United States using mobile phone location data. Studies have shown sharp decreases in population mobility after state lockdown orders, but how these increases in policy intensity affect the spread of COVID-19 on a more local level remains unclear [29].
Although the factors above are all associated with the spread of COVID-19, the mechanisms of their impact are not universal but vary across space and scales. Hou et al. [30] examined the impact of population mobility and sociodemographic factors in Wisconsin and revealed various spread patterns such as the varying peak infection timing in different subregions even within a county. These heterogeneous patterns likely result from the complex interactions among the wide range of contributing factors on different spatial and administrative levels. For example, transregional population mobility is affected by many local-level factors, such as population density and social distancing policy. At the same time, the vaccination rate is associated not only with the national distribution of vaccines but also with people’s acceptance of them, which, in turn, relates to their risk perceptions and their local cultural backgrounds. However, most previous works only examined the contributing factors on a single spatial level, not accounting for the modifying effects of the hierarchical structure of the factors. Even if many studies have identified heterogeneous distribution characteristics, they often fail to explain the underlying mechanisms [31,32,33]. In other words, high-level macro variables, such as state-level policy measures, often have a moderating effect on influencing factors at lower levels, such as county-level economic income and individual-level social distancing. As counties are nested within states, the data are not independent, and state-level impacts on social activities and COVID-19 limits could influence the results [34,35,36]. Thus, common estimation techniques, such as ordinary least squares (OLS) regression, could result in misestimation and Type I error inflation [33,37]. The interaction between these factors at different levels likely explains the heterogeneous characteristics of the COVID-19 infection rate [38,39].
To further explore the heterogeneity of the infection rate of COVID-19 in the United States and the effect on this difference under cross-level variable interactions, we used 2020 pandemic data to first analyze the correlation between the county-level SVI and infection rate of COVID-19. Next, we explored the spatial heterogeneity using the geographically weighted regression (GWR) model. More importantly, we introduced a hierarchical linear model (HLM) [40], which considers not only the variation in data at the same level as a whole but also the variation in data between different levels [36,41]. This study explored the impact mechanism of the county-level SVI on the infection rate of COVID-19 from the aspects of state-level social distancing policy. A series of hierarchical linear models were established to analyze the influence of multilevel variable interactions on the heterogeneity of the infection rate. Importantly, we analyzed how state-level indicators adjusted the relationship between the county-level SVI and the COVID-19 infection rate. In contrast to general linear regression analysis, we considered the moderating effect of multilevel covariates on the results. This study identified the causes of significant group differences across regions and tailored measures of varying intensity more efficiently, providing strong support for precise prevention and control in the postepidemic era.

2. Materials and Methods

2.1. Variables and Data Source

All the data in this study were derived from official public data sources. The specific descriptions and sources are found in the Supplementary Materials document.

2.1.1. COVID-19 Infection Rate

We examined the COVID-19 confirmed cases at the county level as of 31 December 2020, which originated from the COVID-19 Dashboard provided by the Johns Hopkins Center for Systems Science and Engineering [42]. This repository contains data on COVID-19 cases worldwide collected from various sources including governments and independent health institutions. To eliminate the impact of collinearity caused by population size, we converted confirmed cases into the infection rate (I). The infection rate is the number of people infected per 100,000 people.
As of 31 December 2020, the cumulative number of confirmed cases in the United States exceeded 19 million. The top three cumulative infections were California, Texas, and Florida, and the top three infection rates were North Dakota, South Dakota, and Wisconsin. We used county-level COVID-19 infection rates as the dependent variable for each model in this study.

2.1.2. Social Distancing Policy

Governments have reacted in various ways to the rapid proliferation of COVID-19 worldwide. To contain the spread of the virus, augment health systems, and manage the economic consequences of these actions, common measures included school closures, travel restrictions, bans on public gatherings, contact tracing, vaccination campaigns, and emergency investments in healthcare facilities. The Oxford COVID-19 Government Response Tracker (OxCGRT) [43] provides a systematic cross-national, cross-temporal measure to understand how government responses have changed during the disease’s spread. The project uses a standardized set of indicators to track government policies and interventions and creates a suite of composite indices to measure the extent of these responses. The system has been used widely during the pandemic. The granularity of its policy details and structure of data can provide support for COVID-19 studies. All policy types and data systems are found in the study [44].
Policy is implemented on a state-level basis in the United States. The intensity of policy implementation varies by state relative to its own socioeconomic and cultural factors. We selected four social distancing policies from all state-level policies in the US—namely, school closure (C1), workplace closure (C2), public transport closure (C3), and internal movement restriction (C4). We counted the 2020 annual average index of these four indicators as research indicators. A description of each policy and data source is provided in Supplementary Materials.

2.1.3. Social Vulnerability Index (SVI)

We used publicly available county-level SVI from the Centers for Disease Control Agency for Toxic Substances and Disease Registry. The SVI is a percentile-based measure of social vulnerability or community resilience to external hazard-related pressures on health [45]. The SVI database was created by the Agency for Toxic Substances and Disease Registry’s Geospatial Research, Analysis, and Services Program to assist public health officials in identifying communities that will likely require support and resources during and after a hazardous event, such as a pandemic.
The overall index and each theme are scored from 0 to 1, with higher scores indicating greater vulnerability. The index was constructed using data from 15 variables from the US Census Bureau [15]. A percentile rank was calculated for each of these variables and grouped among four themes of the SVI that measure various aspects of vulnerability: socioeconomic status (SVI1), household composition (SVI2), race/ethnicity/language (SVI3), and housing/transportation (SVI4). The socioeconomic status (SES) theme comprises percentile rank data for the following variables: percentage of people living in poverty, percentage of people who are unemployed, per capita income, and percentages of people who do not have a high school diploma. The variables for household composition include the percentage of 65-year-olds or older, 17-year-olds or younger, 5-year-olds or older with a disability, and single-parent households. Finally, the housing/transportation theme includes data on the percentages of multiunit structures, mobile homes, crowding, people who do not own a vehicle, and group quarters. We used the latest 2018 SVI data as a county-level study indicator.

2.2. Statistical Analysis

Cross-sectional data on the total number of COVID-19 infection rates reported as of 31 December 2020 were used in the OSL model to estimate the association of the county-level SVI with the COVID-19 infection rate. We used the county-level overall SVI index and its four subindices to analyze their linear regression relationship with COVID-19 infection rates.

2.3. Geographically Weighted Regression (GWR)

Spatial data are widely available in many fields such as geography, economics, the environment, ecology, and meteorology. According to Tobler’s First Law of Geography [46], everything is spatially correlated, and the closer things are to each other, the greater the spatial correlation. Therefore, unlike traditional cross-sectional data, the spatial correlation of spatial data leads to spatial nonstationarity (spatial heterogeneity) of the regression relationship. To explore the spatial nonstationarity of spatial data, Brunsdon et al. [47] first proposed a geographically weighted regression model as follows:
Y i = β 0 i + k = 1 n β k i X k i + ε i
where Yi is the dependent variable, Xk(i) is the k-th independent variable (k = 1…n), β0(i) is the intercept at neighborhood i, βk(i) is the coefficient of Xk(i), and εi is the residual of location i. The adaptive bisquare kernel function and cross-validation were used to determine the ideal number of neighbors. The spatial regression associations of the four SVI subindices at the county level in the United States with the COVID-19 infection rate were investigated using GWR. ARCGIS version 10.2 was used to implement this model.

2.4. Hierarchical Linear Model (HLM)

The hierarchical linear model (HLM) [40] was used to model the relationship between different variables across state and county levels and can be considered a generalization of OSL regression when the dependent variable varies at more than one level [48,49,50]. Using HLM software version 7, we first built a basic model, called Model 0 (Null model), in which there were no variables at any of the levels. Model 0 is as follows:
Level 1   model :   Y i j = β 0 j + r i j
Level 2   model :   β 0 j = γ 00 + μ 0 j
If the variance components pass the significance test, the dependent variable is affected by the first and second levels [50,51]. If the variance of the intercept and slope at the first level is significant at the second level, a model covering the variables at both levels is necessary (Model 2). Model 2 (full model) is as follows:
Level 1   model :   Y i j = β 0 j + β n j X n i j + r i j
Level 2   model :   β 0 j = γ 00 + γ 0 m W m j + r μ 0 j
β n j = γ n 0 + γ n m W m j + μ n j
where i is a county; j is a state in the USA; X are the variables at the county-level; Yij is the degree of integration; β0j is the intercept of state j; βnj is the slope of variable Xn in state j; rij is the residual of county i in state j; γ00 and γn0 are intercepts; and γ0m and γnm are the slopes predicting β0j and βnj from variable Wm at the state level, respectively.
HLM software version 7.0 was used to build and calculate the model. This software provides estimates by adding variables to the model separately and calculating to obtain p values and other indicators from which the presence of fixed and random effects can be observed.
Specifically, the first step of the HLM is to check for the presence of cross-level interactions. As the variance between and within groups is significant, a more in-depth examination of the intercept and slope, which correspond to the null model, is contemplated. For each group at the county level, both intercept and slope can be fixed (i.e., all groups have the same value), nonrandomly varying (i.e., the intercept and/or slope can be predicted from the independent variables at the state level), or randomly varying (i.e., the intercept and/or slope are different across groups and each group has its own overall mean and variance). Thus, whether the intercept term is correlated with the variable distinguishes fixed and random effects. In this study, a maximum likelihood (ML) model was used in HLM to estimate the random effects and a least squares (LS) model was used to estimate the fixed effects. The final step is to analyze whether the variance of the slope can be explained by state-level variables and, if so, examine whether state-level variables have an interactive influence on the predictor-dependent variable connection.

3. Results

3.1. SVI and COVID-19 Infection Rate

In the cross-sectional analysis, we found a significant association between the SVI (overall and four subindices) and COVID-19 infection rate (Table 1). Among the indices, the family characteristics subindicator demonstrated the most significant correlation with the COVID-19 infection rate, while the economic status subindicator showed no significant correlation. Specifically, a 0.1-point increase in the overall SVI score was associated with a 3.6% increase in the infection rate. In subindex analyses, household characteristics and the disability subindex were associated with a 7.1% increase in infection rate per 0.1-point increase. Racial/ethnic minority status and language subindex were associated with a 4.2% increase in the infection rate per 0.1-point increase. Housing type and transportation subindex were associated with a 3.4% increase in the infection rate per 0.1-point increase.
These results suggest that counties with a greater SVI index or greater sociodemographic disadvantage had higher rates of COVID-19 infection. In particular, in counties with a high index on household characteristics, disability, housing type, and transportation subindices, and the infection rate was greater.

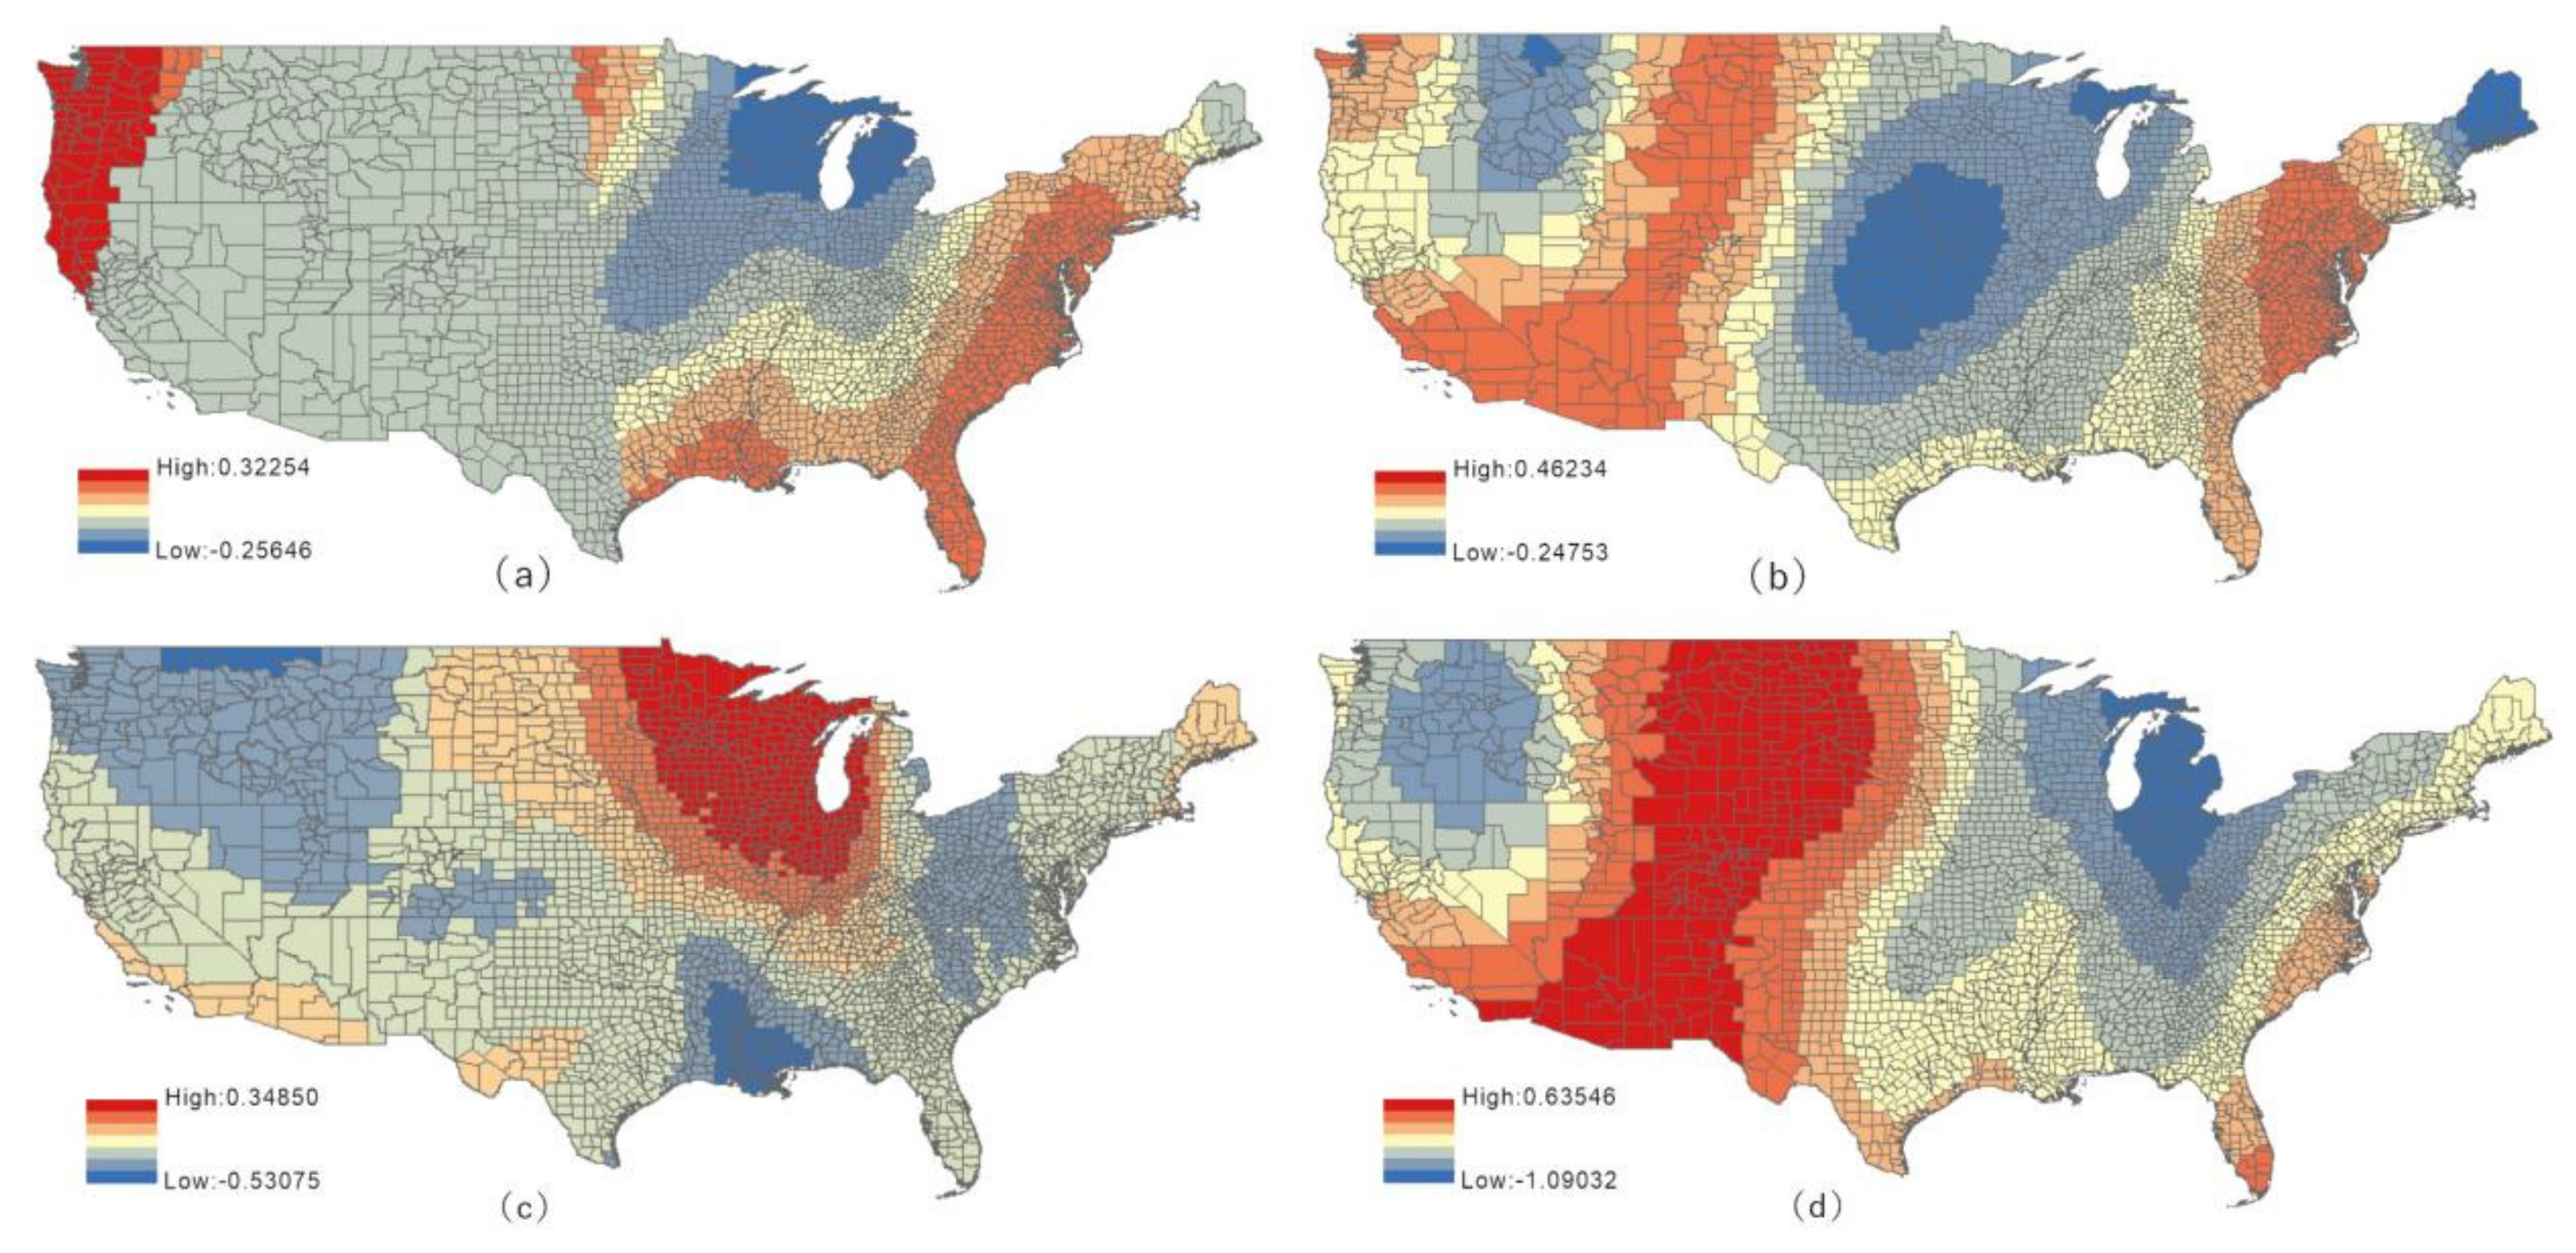
3.2. GWR Results of the SVI Subindex and COVID-19 Infection Rate

GWR is a tool that allows us to better understand the spatial regression relationship between the SVI and COVID-19 infection rate. In this study, GWR determines the spatial variation in the parameters for each COVID-19 infection rate outcome across the contiguous 48 states.
To better contextualize our GWR estimates, we used a series of maps of the 48 contiguous states, presented in Figure 1, to visually assess the local spatial relationships of SVI subindicators with distancing. The red areas indicate positive values, indicating a positive correlation between the SVI and COVID-19 infection rate, with darker colors indicating a higher correlation. By contrast, the blue area indicates a negative correlation between the SVI and COVID-19 infection rate; the darker the color is, the higher the degree of correlation. Light-colored areas have statistically insignificant coefficients (p value < 0.05) [52].
The GWR results showed spatially heterogeneous characteristics of the regression relationships between the four SVI subindices and COVID-19 infection rates. Significant areas of positive and negative correlations were found in all the results. These maps revealed several interesting spatial trends in the SVI subindicator coefficients. For example, the OLS regression model showed that the correlation between the economic status index and COVID-19 infection was not significant, but the GWR results showed a significant positive regression in some areas, particularly in the northwest (Washington and Oregon). However, the regression coefficient maps of the four SVI subindicators with COVID-19 infection rates showed different spatial distributions. Thus, although they are all used as subindicators describing the composition of the SVI, large spatial differences occurred in the results when regression analysis was performed separately with the COVID-19 infection rate. Such differences might be related to other factors at the same level (county level) or the moderating effect of factors across levels (state level).

3.3. HLM

According to the Methods section, the null model and full model were built as follows.

3.3.1. Null Model

The null model was constructed according to Model 1 of the HLM described. Table 1 reports the results. The random-effects examinations reached a significance level of p < 0.001. The intraclass correlation coefficient (ICC) was calculated as a ratio of group-level error variance over the total error variance as follows:
I C C = σ u 0 2 σ u 0 2 + σ e 0 2
where σ u 0 2 is the variance component of Level-2 (state-level), and σ e 0 2 is the variance component of Level-1 (county-level).
The proportion of state-level variation to total variation was measured by the ICC. It reflects county intergroup correlation—that is, the level 2 aggregation or similarity of level 1 variables. In other words, the ICC compares the overall unexplained variance (within- and between-group variance) with the amount of variation unexplained by any predictors in the model that may be assigned to the grouping variable. Thus, for county-level COVID-19 infection rates, ICC = 0.51/(0.51 + 0.25) = 0.67 > 0.059. The ratio of county-level and state-level variance accounts for 33% and 67% of the variance, respectively. In other words, 33% of the variation among the counties’ COVID-19 infection rates comes from the development variations among the SVI of counties, and 67% comes from variations among the states to which they belong. According to Shrout et al. [53] and Castro [54], if the ICC is greater than 0.05, within-group effects must be considered in the statistical model. Therefore, a multilevel linear model must be considered to analyze the prevalence of COVID-19 infection in each county. Traditional regression models cannot explain this difference. We also established the corresponding hierarchical linear model.

3.3.2. Full Model

Some of the results in the full model explain the impact of two levels of indicators on county-level infection rates (Table 2). The fixed-effects result showed that the county-level indicators SVI1 (SES subindex), SVI2 (household characteristics and disability subindex), SVI3 (racial/ethnic minority status and language subindex), and SVI4 (housing type and transportation subindex) had significant effects on the COVID-19 infection rates. However, notably, only SVI2 showed a negative correlation effect on the county-level COVID-19 infection rates, while the others were positive. Thus, under the influence of state-level indicators, the higher the SVI2 index, the lower the infection rate in areas. Among the four state-level social distancing indicators studied, C1 (school closure), C2 (workplace closure), and C4 (restrictions on internal movement) significantly affected the county-level COVID-19 infection rate. However, the impact of C3 (public transport closure) was not significant. Among the indicators, C1, C2, and C4 all had a negative influence. Thus, the stricter the policy index, the lower the infection rate. This finding is consistent with our understanding. The random-effects result showed significant between-group differences in the linear relationship between each county-level SVI index and COVID-19.

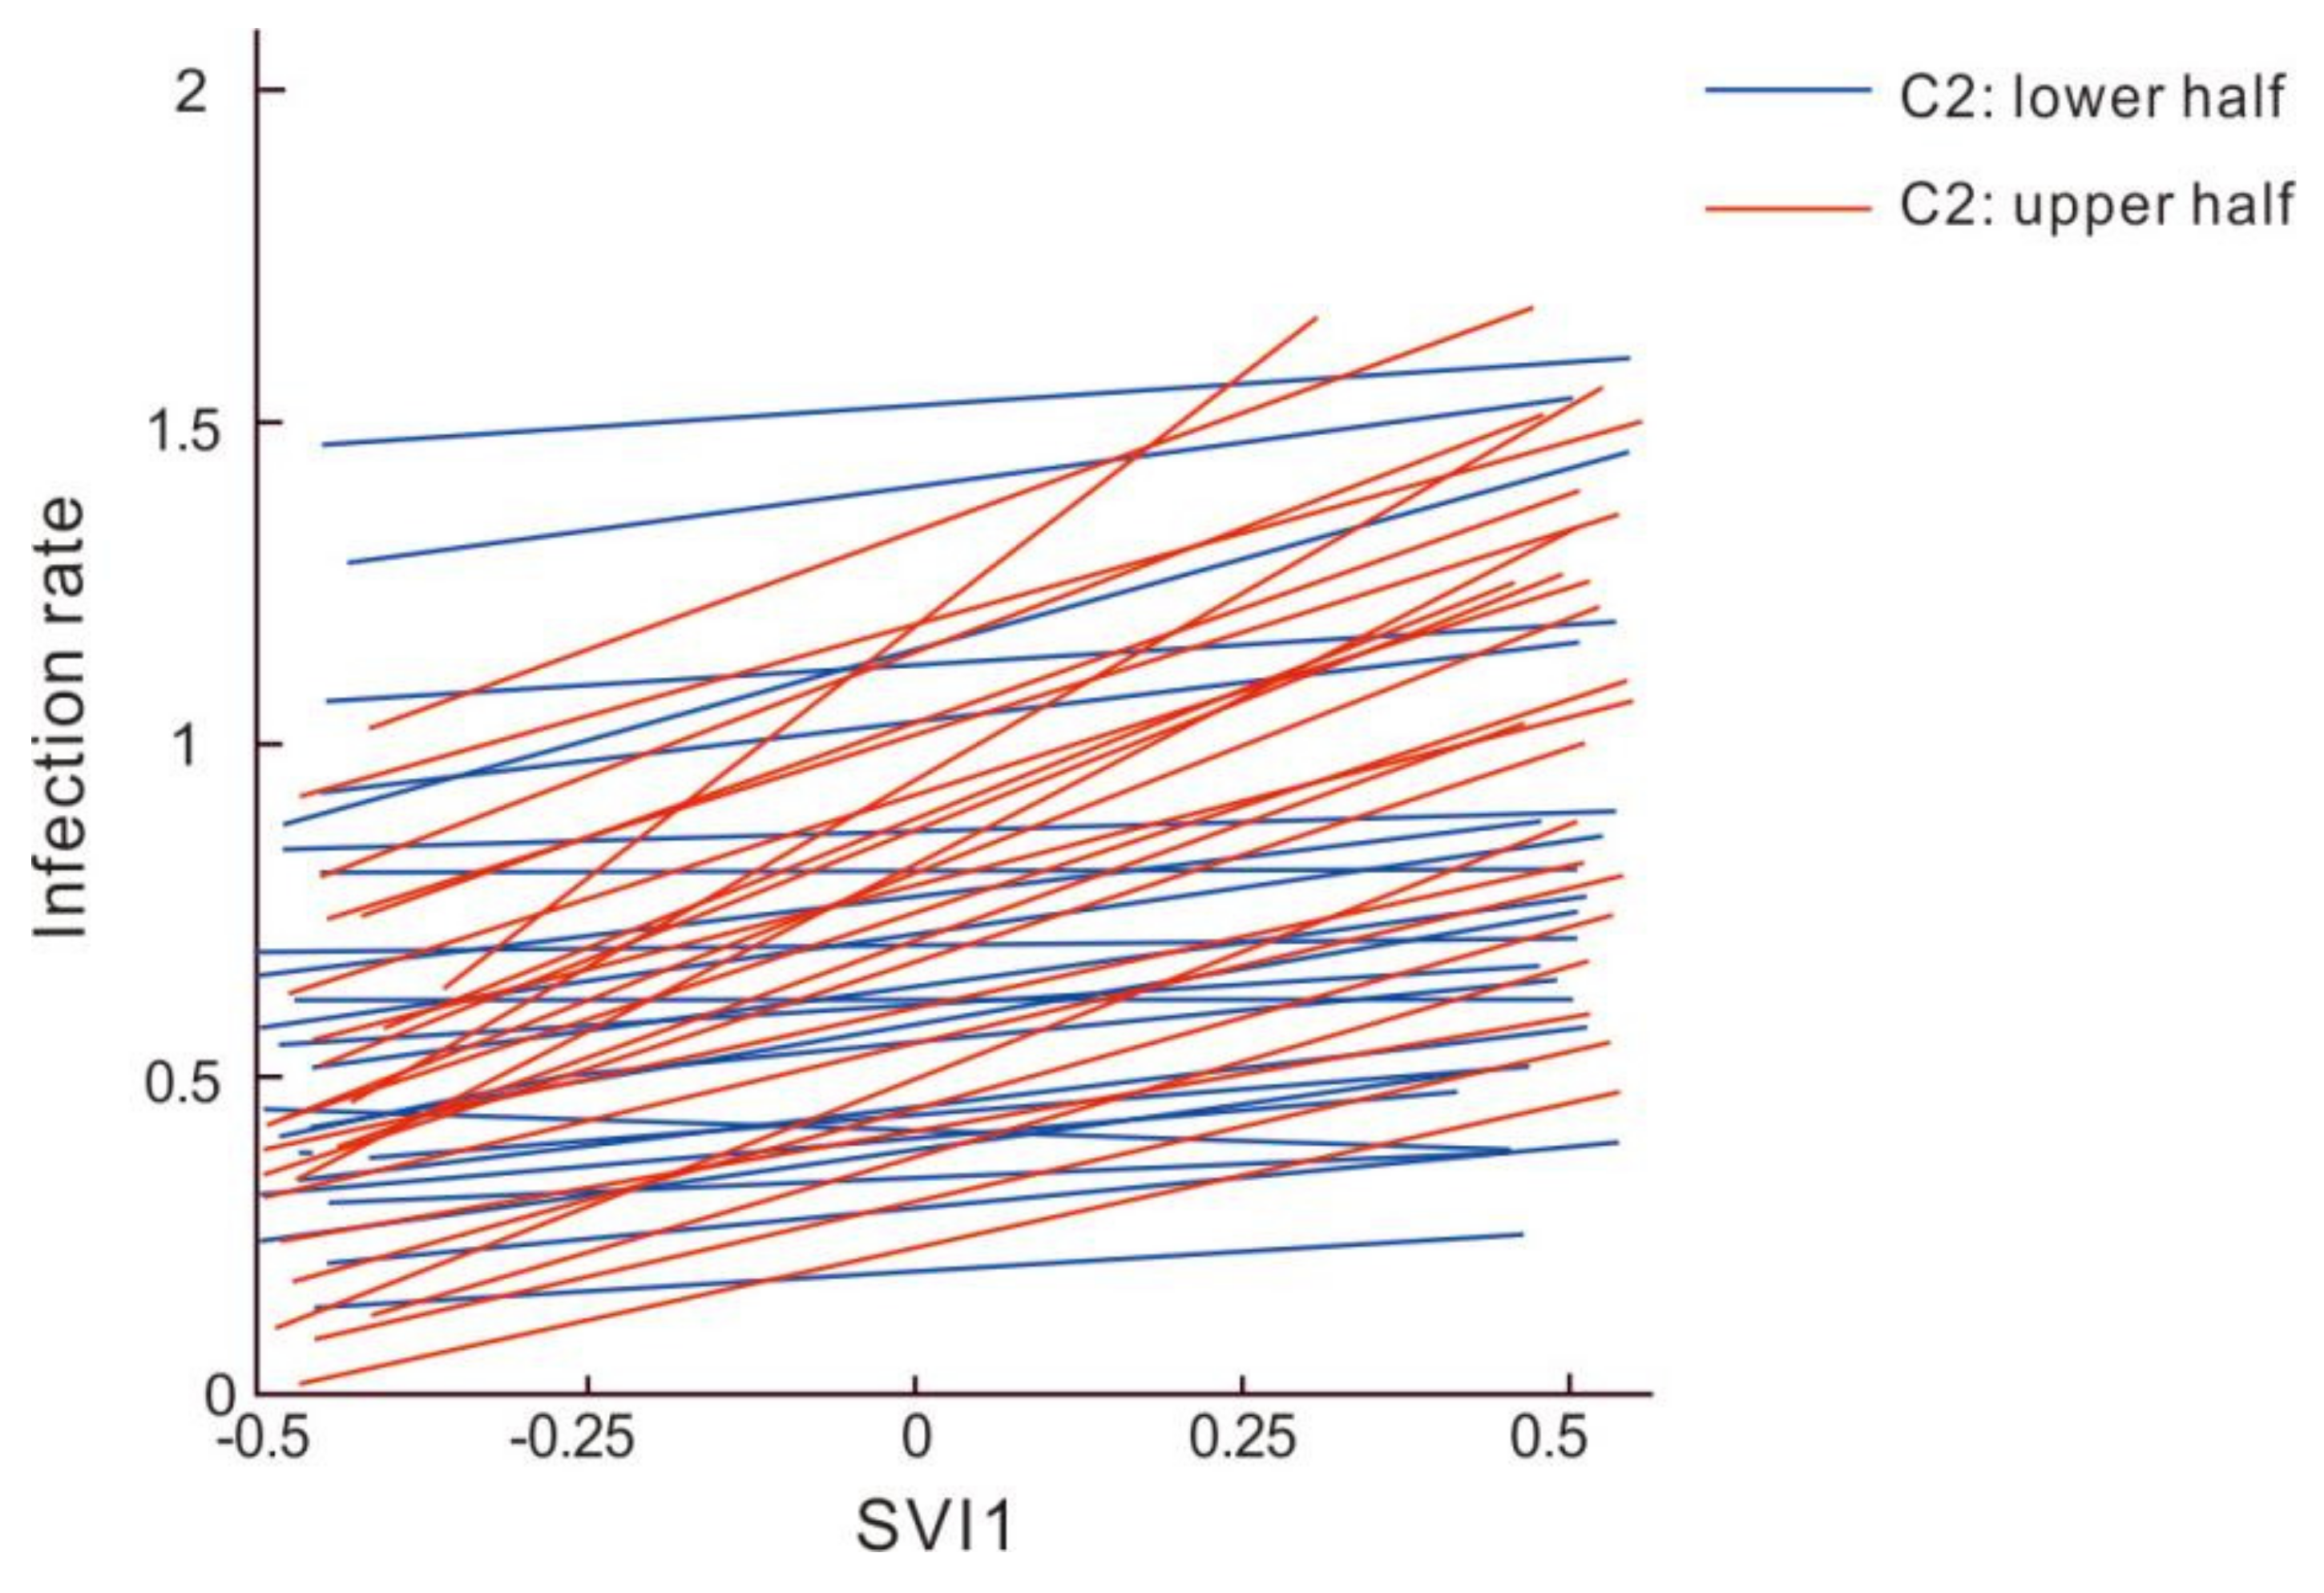
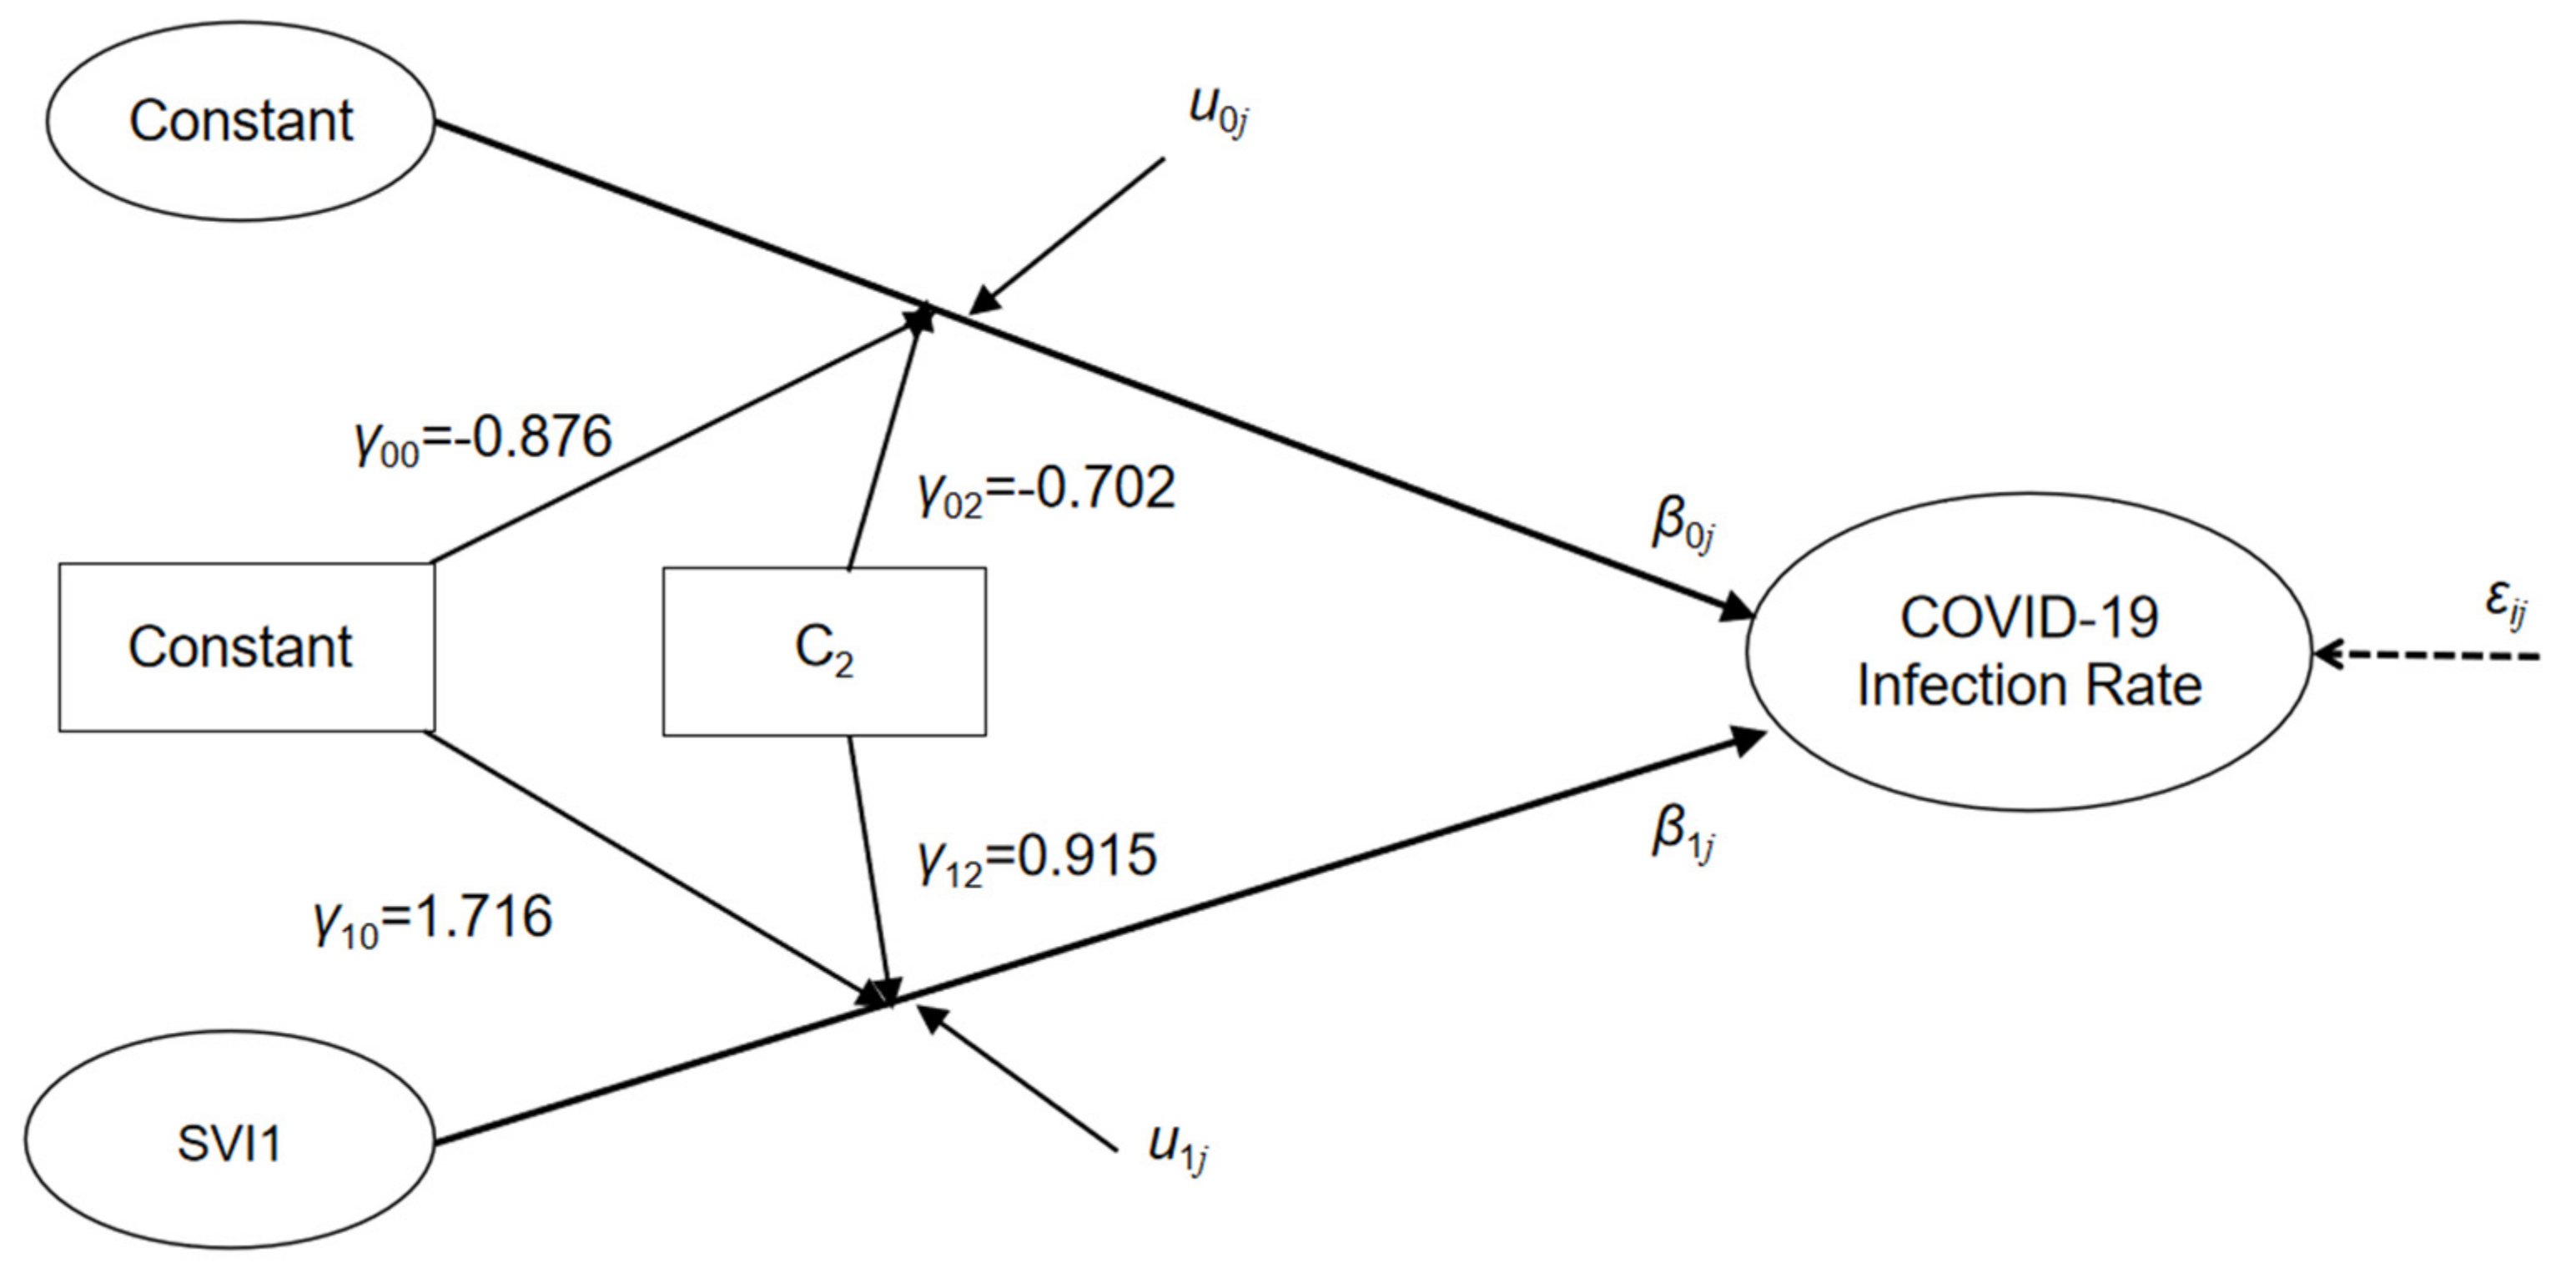
3.3.3. Cross-Level Interaction of Independent Variables

The model also showed the moderating effect of state-level indicators on the relationship between county-level variables. The results of a more complete HLM are provided in the Supplementary Materials and involves the interaction results of cross-layer arguments. We considered the state-level indicator C2 (workplace closure index) on the regulation of the influence of SVI1 (SES subindex) on the COVID-19 infection rate as an example. Table 3 shows a positive linear relationship between county-level SVI1 and COVID-19 under the adjustment of state-level indicators. Thus, county-level areas with a larger SVI1 (lower economic status) have higher rates of COVID-19 infection. The results in the Supplementary Material showed that C2 significantly enhances this linear relationship. The HLM can be derived using cross-level independent variable interactions. Figure 2 shows linear regression lines between SVI1 and the COVID-19 infection rate. The regression lines of different colors represent different degrees of workplace closure policy index C2. In Figure 2, the red and blue lines represent the regression lines above and below the C2 average index, respectively. The results showed that the red lines are all positive and substantially steeper (slope is greater) than the blue lines. Additionally, the state-level workplace closure policy has a significantly enhanced regression relationship between the county-level SVI1 and COVID-19 infection rate. Thus, in the positive linear relationship between the county-level SVI1 index and COVID-19 infection rate, an increase in the state-level C2 index intensity further enhances this positive influence.
In addition to the relationship between the return lines and overall hierarchy of the state, the interaction of this cross-layer self-variable can also be presented through the return factor of Figure 3—that is, the adjustment effect of the overall hierarchical independent variable on the influence of variables. For the above case, when other conditions were unchanged, each additional unit of C2 (workplace closure policy index) increased by the slope (SVI1 on the influence of the COVID-19 infection rate) by 0.915. All the state-level indicators had a certain moderating effect on the influence of county-level indicators on the COVID-19 infection rate, regardless of the strength of the adjustment. Except for the above examples, regarding the influence of SVI1 (SES subindex) on the infection rate, the most significant moderating effects were those of C2 (workplace closure index) and C4 (restrictions on internal movement index). However, notably, the effect of C4 on the relationship between SVI1 and the COVID-19 infection rate was negative. In other words, the increase in C4 could weaken the positive effect of SVI1 on the COVID-19 infection rate. The most significant adjustment effect for SVI2 (household characteristics and disability subindex) was C3 (public transport closure index), but it was a negative adjustment. The most significant adjustment effects were those of SVI3 (racial/ethnic minority status and language subindex), which were C1 (school closure index) and C2, representing positive adjustments. As SVI3 had a positive effect on the infection rate, C4 strengthened this effect. The most significant adjustment effects of SVI4 (housing type and transportation subindex) were C1 and C2, where C1 was a negative adjustment—that is, it weakened the positive correlation of SVI4 with the infection rate. More detailed content and adjustment values are found in the Supplementary Materials.

4. Discussion

We used COVID-19 infection and SVI data as of 31 December 2020 in the United States. In this cross-sectional study of US county-level sociodemographic risk factors conducted during the country’s COVID-19 outbreak, we found that, in addition to the economic status subindicator, the other SVI subindicators all had a significant relationship with the COVID-19 infection rate, and they were all positively correlated. In particular, household characteristics and the disability subindex had the most significant relationship with both. This finding is related to the composition of the indicator. The household characteristics and disability subindex comprise elderly/children and disabled/single-parent families. Furthermore, the minority status and language subindex, as well as the housing type and transportation subindex, had significant effects on the COVID-19 infection rate, reinforcing the preliminary report by state health departments [55,56,57]. As maintaining social distance is challenging in communities with socioenvironmental circumstances such as congested housing and dependency on public transit, illness transmission is more likely. Low-income and racial/ethnic minority residents are also more likely to work in key worker vocations, putting them at higher risk of COVID-19 exposure and transmission from person to person. Furthermore, although certain racial/ethnic minority groups have higher rates of medical risk factors for COVID-19 infection, such as diabetes, hypertension, and lung disease, previous studies have indicated that the underlying factor associated with observed disparities in these chronic health conditions is the upstream social determinant of health [58,59].
To further examine the spatial heterogeneity of the four subindices of the SVI and COVID-19 infection rate, we used the GWR model for separate analyses and produced the GWR correlation coefficient map of the corresponding variables. The results showed significant spatial heterogeneity characteristics, and we can draw many conclusions that could not be obtained in the first part of the variable cross-sectional analysis. Although the OSL regression analysis does not necessarily show a significant correlation, through the GWR model, some areas show certain spatial correlation characteristics. Spatial heterogeneity is also a crucial part of our research on the relationships of different variables; local information characteristics can be obtained. For example, the relationship between the economic status subindicator and COVID-19 infection rate presents a spatially heterogeneous characteristic that differs from the other three subindicators. In Washington and Oregon, where the infection rate is very low, the economic status subindicator has a strong, positive correlation with the infection rate. However, although both are subindicators describing the SVI, the spatial distribution of their GWR coefficients with respect to the COVID-19 infection rate showed significant differences. However, the reasons for this phenomenon are complex and may be a combination of other factors or moderating influence of state-level factors. These differences in characteristics can provide more refined and localized characteristics so that epidemic prevention and control strategies can be more targeted and the waste of resources can be avoided.
As indicated by the above findings, the spread of the COVID-19 pandemic has demonstrated important heterogeneity between states and counties. However, regardless of the statistical or spatial correlation between the SVI and infection at the county level, the cause of heterogeneity or interaction between factors is difficult to explain. When evaluating factors at a certain level, scholars often ignore the moderating effects of macrofactors at a higher level. Various factors exist at the state level that will have a macroregulatory effect. This effect likely explains the heterogeneity of the states, caused by multilevel and multifactor interactions. To study the interaction effects of various levels and factors further, we used an HLM to analyze the moderating effects of state-level social distancing policy on the relationship between the SVI and COVID-19 infection rate at the county level.
According to the results of the HLM null model, the infection rate of COVID-19 at the county level has very significant heterogeneity characteristics. In particular, the COVID-19 infection rate and state-level variation contributed 67% of the overall variation, representing a typical phenomenon of homogeneity within a group and heterogeneity between groups. Statistical analysis performed at the county level in general cannot explain the heterogeneity caused by the differences between these groups.
Under this premise, we established a complete HLM model; two aspects of the main conclusions are highlighted as follows. One is the type of heterogeneity between groups produced by the interaction of multiple levels and multiple factors. The other is how upper-level factors adjust the relationship between lower-level factors—that is, what explains the causes of heterogeneity between groups. We selected four social distancing policies (school closure, workplace closure, public transport closure, and internal movement restriction) from the state-level indicators as state-level adjustment indicators. The county-level model is the influence of the four SVI subindicators on the COVID-19 infection rate. The results showed that the four subindices of the county-level SVI were significantly related to the infection rate. An intriguing and critical point emerged in this study; household characteristics and the disability subindex were positively correlated with the infection rate in the OLS cross-sectional analysis but were negatively correlated in the HLM. In other words, all the county-level data were combined, and regression analysis was performed to obtain a regression line with a gradual upward trend (the slope is positive). However, these data were grouped by state under the adjustment of state-level indicators; the trend in most states was downward. Therefore, areas with high household characteristics and disability subindices do not have a higher sensitivity rate. By contrast, because vulnerable groups such as the elderly, children, and disabled persons are much less likely to contact the outside world (people) than others, their risk of contracting COVID-19 is lower [60,61]. Among the state-level indicators, the workplace closure policy and internal movement restriction policy have the highest impact on the infection rate, followed by the school closure policy and public transport closure policy. All policy strength indicators negatively affect the COVID-19 infection rates. This outcome is consistent with the results of many previous studies [62,63].
However, concerning the findings of the moderating effect of state-level indicators on county-level linear relationships, we obtained some noteworthy findings. The results show that county-level SVI1 (SES subindex) and SVI4 (housing type and transportation subindex) have a positive linear relationship with COVID-19, that is, areas with a lower economic status or weaker housing/personal vehicle conditions have higher rates of COVID-19 infection. However, state-level workplace closures do not weaken (mitigate) this positive relationship but strengthen it slightly. Thus, imposing stricter workplace closures in these areas may further increase infection rates. According to our results, implementing stricter internal movement restriction policies and closing public transportation policies in these regions played a crucial role in reducing infection rates. Influencing each other may not be consistent with the results of all the data analyzed together. The results of this heterogeneity between groups obtained through the HLM provide scholars and decision makers with more information that is easy to ignore. For example, in the later stages of the pandemic, for the rational use of resources, these individuals will be more inclined to precisely prevent and control the disease. They tend to focus more attention on high-risk states, counties, and even communities. Priority will also be given to resources such as vaccine allocation. At this time, the heterogeneity between the research groups becomes more important than mixing data from all regions for analysis. Likewise, for areas with high SVI2 (senior and single-parent households) indices, school closure policies and internal mobility restrictions are more critical. For areas with a high SVI3 (racial/ethnic minority status and language subindex), enhanced workplace closures and public transport closures are more important.
Furthermore, we further investigated how state-level indicators regulate the relationship between the county-level SVI and infection rate. We considered the state-level indicator C2 (workplace closure index) in regulating the influence of SVI1 (SES subindex) on the infection rate as an example. For each additional unit of C2, the influence of the SES subindex on the infection rate will increase by 0.915 (the slope of the regression county increases by 0.915). Corresponding conclusions can be drawn for every two cross-level indicators (details are found in the Supplementary Materials). This relationship can not only predict the infection rate but also, more importantly, help better explain the heterogeneity between groups and understand how the upper-level indicators adjust the relationship between the lower-level indicators. Although previous studies have shown that strict social distancing policies will reduce the risk of infection, our results could specifically derive the specific regulation of the relationship between the policy index and the county-level SVI and infection rate. The interaction between multilevel variables and the moderating mechanism of cross-scale variables for disparity in COVID-19 spread was not considered in previous studies. Understanding the heterogeneous characteristics of COVID-19 spread is necessary to both prevent and control the spread of the pandemic. Thus, we have more detailed guidance when formulating targeted policies. Additionally, our research ideas and methods still apply to the COVID-19 pandemic, which remains rampant, or to other encountered challenges in the future.
This study also has some limitations. For example, we could not cover all of the indicator factors, thus, the results obtained are those of the interactions of the indicators that we selected. The study is not necessarily comprehensive. Second, our study was conducted in 2020, and now that the pandemic has entered 2022, changes to the some of the results might have occurred. However, because the comprehensive selection of indicator factors is a challenge, many unknown potential effects likely exist. The research methods and ideas that we provide apply to any stage and region, although our research period was one year ago.

5. Conclusions

This study found significant statistical and spatial heterogeneity in the COVID-19 infection rate at the county level in the United States. The interaction of various indicators produces findings that reveal not only geographical heterogeneity and dependency but also significant heterogeneity between groups and homogeneity within groups. The difference between states is a crucial factor that causes this heterogeneity. Factors that were not significant for the COVID-19 infection rate using traditional regression methods showed a significant influence after grouping by state. The results suggest that state-level indicators can increase or decrease county-level COVID-19 transmission by significantly enhancing or weakening the impact of county-level SVI on the COVID-19 infection rate. This difference could be one of the intrinsic causes of the disparity in COVID-19 spread. Additionally, not all regions are suitable for the strictest social distancing policies. Only some policies can significantly reduce COVID-19 infection rates in some regions. Although our study did not include all possible potential indicators, this approach to explore the moderating mechanism of multilevel and multiscale variables on the outcome of COVID-19 transmission provides a new approach. Thus, the phenomenon of significant differences in the spread of COVID-19 in different regions might be explained more easily. This study is also necessary to accomplish targeted preventative measures and allocate resources. Under the current situation in which vaccines have gradually become popular, what is the effect of the cross-level impact of various measures and the performance of strategic measures at different stages? These topics must be explored by continued research in the future.

Supplementary Materials

The following supporting information can be downloaded at: https://www.mdpi.com/article/10.3390/ijgi11040229/s1, Table S1: Variables and data source, Table S2: Final estimation of fixed effects for COVID-19 infection rate.

Author Contributions

Conceptualization, Zhenwei Luo; data curation, Bin Wu; formal analysis, Zhuo Tang; funding acquisition, Lin Li; methodology, Zhenwei Luo; resources, Jianfang Ma and Hang Shen; software, Jianfang Ma and Hang Shen; supervision, Lin Li and Haihong Zhu; writing—original draft, Zhenwei Luo; writing—review and editing, Lin Li and Zhuo Tang. All authors have read and agreed to the published version of the manuscript.

Funding

This study was supported by the National Key Research and Development Program of China (grant number: 2017YFB0503701).

Data Availability Statement

The data in this study are from public datasets. Please refer to the Supplementary Materials for the specific sources of each set of data.

Conflicts of Interest

The authors declare no conflict of interest.

References

  1. Askitas, N.; Tatsiramos, K.; Verheyden, B. Estimating worldwide effects of non-pharmaceutical interventions on COVID-19 incidence and population mobility patterns using a multiple-event study. Sci. Rep. 2021, 11, 1972. [Google Scholar] [CrossRef] [PubMed]
  2. Duan, W.; Fan, Z.; Zhang, P.; Guo, G.; Qiu, X. Mathematical and computational approaches to epidemic modeling: A comprehensive review. Front. Comput. Sci. 2015, 9, 806–826. [Google Scholar] [CrossRef] [PubMed]
  3. Karasmanaki, E.; Tsantopoulos, G. Impacts of social distancing during COVID-19 pandemic on the daily life of forestry students. Child. Youth Serv. Rev. 2021, 120, 105781. [Google Scholar] [CrossRef] [PubMed]
  4. Yomoda, K.; Kurita, S. Influence of social distancing during the COVID-19 pandemic on physical activity in children: A scoping review of the literature. J. Exerc. Sci. Fit. 2021, 19, 195–203. [Google Scholar] [CrossRef]
  5. Zhang, C.H.; Schwartz, G.G. Spatial Disparities in Coronavirus Incidence and Mortality in the United States: An Ecological Analysis as of May 2020. J. Rural Health 2020, 36, 433–445. [Google Scholar] [CrossRef]
  6. Iyanda, A.E.; Boakye, K.A.; Lu, Y.M.; Oppong, J.R.; Hipp, J.R. Racial/Ethnic Heterogeneity and Rural-Urban Disparity of COVID-19 Case Fatality Ratio in the USA: A Negative Binomial and GIS-Based Analysis. J. Racial Ethn. Health Disparities 2021, 9, 708–721. [Google Scholar] [CrossRef]
  7. Griffith, D.; Li, B. Spatial-temporal modeling of initial COVID-19 diffusion: The cases of the Chinese Mainland and Conterminous United States. Geo-Spat. Inf. Sci. 2021, 24, 340–362. [Google Scholar] [CrossRef]
  8. Yang, C.W.; Sha, D.X.; Liu, Q.; Li, Y.; Lan, H.; Guan, W.W.; Hu, T.; Li, Z.; Zhang, Z.; Thompson, J.H.; et al. Taking the pulse of COVID-19: A spatiotemporal perspective. Int. J. Digit. Earth 2020, 13, 1186–1211. [Google Scholar] [CrossRef]
  9. Roy, S.; Ghosh, P. Factors affecting COVID-19 infected and death rates inform lockdown-related policymaking. PLoS ONE 2020, 15, e0241165. [Google Scholar] [CrossRef]
  10. Liu, J.T.; Zhou, J.; Yao, J.X.; Zhang, X.X.; Li, L.Y.; Xu, X.C.; He, X.; Wang, B.; Fu, S.; Niu, T.; et al. Impact of meteorological factors on the COVID-19 transmission: A multi-city study in China. Sci. Total Environ. 2020, 726, 138513. [Google Scholar] [CrossRef]
  11. CDC/ATSDR Social Vulnerability Index. Available online: https://www.atsdr.cdc.gov/placeandhealth/svi/ (accessed on 22 February 2022).
  12. Dasgupta, S.; Bowen, V.B.; Leidner, A.; Fletcher, K.; Musial, T.; Rose, C.; Cha, A.; Kang, G.; Dirlikov, E.; Pevzner, E.; et al. Association Between Social Vulnerability and a County’s Risk for Becoming a COVID-19 Hotspot—United States, June 1–July 25, 2020. Morb. Mortal. Wkly. Rep. 2020, 69, 1535–1541. [Google Scholar] [CrossRef] [PubMed]
  13. Gaynor, T.S.; Wilson, M.E. Social Vulnerability and Equity: The Disproportionate Impact of COVID-19. Public Adm. Rev. 2020, 80, 832–838. [Google Scholar] [CrossRef]
  14. Hathaway, E.D. American Indian and Alaska Native People: Social Vulnerability and COVID-19. J. Rural Health 2021, 37, 256–259. [Google Scholar] [CrossRef] [PubMed]
  15. Karmakar, M.; Lantz, P.M.; Tipirneni, R. Association of Social and Demographic Factors With COVID-19 Incidence and Death Rates in the US. JAMA Netw. Open 2021, 4, e2036462. [Google Scholar] [CrossRef] [PubMed]
  16. Wang, C.Y.; Li, Z.Q.; Mathews, M.C.; Praharaj, S.; Karna, B.; Solis, P. The spatial association of social vulnerability with COVID-19 prevalence in the contiguous United States. Int. J. Environ. Health Res. 2020, 1–8. [Google Scholar] [CrossRef]
  17. LeRose, J.J.; Merlo, C.; Duong, P.; Harden, K.; Rush, R.; Artzberger, A.; Sidhu, N.; Sandhu, A.; Chopra, T. The role of the social vulnerability index in personal protective equipment shortages, number of cases, and associated mortality during the coronavirus disease 2019 (COVID-19) pandemic in Michigan skilled nursing facilities. Infect. Cont. Hosp. Ep. 2021, 42, 877–880. [Google Scholar] [CrossRef]
  18. Karaye, I.M.; Horney, J.A. The Impact of Social Vulnerability on COVID-19 in the US: An Analysis of Spatially Varying Relationships. Am. J. Prev. Med. 2020, 59, 317–325. [Google Scholar] [CrossRef] [PubMed]
  19. Khazanchi, R.; Beiter, E.R.; Gondi, S.; Beckman, A.L.; Bilinski, A.; Ganguli, I. County-Level Association of Social Vulnerability with COVID-19 Cases and Deaths in the USA. J. Gen. Intern. Med. 2020, 35, 2784–2787. [Google Scholar] [CrossRef]
  20. Bilal, U.; Tabb, L.P.; Barber, S.; Roux, A.V.D. Spatial Inequities in COVID-19 Testing, Positivity, Confirmed Cases, and Mortality in 3 US Cities An Ecological Study. Ann. Intern. Med. 2021, 174, 936–944. [Google Scholar]
  21. Kim, S.J.; Bostwick, W. Social Vulnerability and Racial Inequality in COVID-19 Deaths in Chicago. Health Educ. Behav. 2020, 47, 509–513. [Google Scholar] [CrossRef] [PubMed]
  22. Xie, K.; Liang, B.; Dulebenets, M.A.; Mei, Y. The Impact of Risk Perception on Social Distancing during the COVID-19 Pandemic in China. Int. J. Environ. Res. Public Health 2020, 17, 6256. [Google Scholar] [CrossRef] [PubMed]
  23. Yuan, J.; Zou, H.; Xie, K.; Dulebenets, M.A. An Assessment of Social Distancing Obedience Behavior during the COVID-19 Post-Epidemic Period in China: A Cross-Sectional Survey. Sustainability 2021, 13, 8091. [Google Scholar] [CrossRef]
  24. Khorram-Manesh, A.; Dulebenets, M.A.; Goniewicz, K. Implementing Public Health Strategies-The Need for Educational Initiatives: A Systematic Review. Int. J. Environ. Res. Public Health 2021, 18, 5888. [Google Scholar] [CrossRef] [PubMed]
  25. Courtemanche, C.; Garuccio, J.; Le, A.; Pinkston, J.; Yelowitz, A. Strong Social Distancing Measures In The United States Reduced The COVID-19 Growth Rate. Health Aff. 2020, 39, 1237–1246. [Google Scholar] [CrossRef]
  26. Kaufman, B.G.; Whitaker, R.; Mahendraratnam, N.; Hurewitz, S.; Yi, J.; Smith, V.A.; McClellan, M. State variation in effects of state social distancing policies on COVID-19 cases. BMC Public Health 2021, 21, 1239. [Google Scholar] [CrossRef]
  27. Jia, J.S.S.; Lu, X.; Yuan, Y.; Xu, G.; Jia, J.M.; Christakis, N.A. Population flow drives spatio-temporal distribution of COVID-19 in China. Nature 2020, 582, 389–394. [Google Scholar] [CrossRef]
  28. Badr, H.S.; Du, H.; Marshall, M.; Dong, E.; Squire, M.M.; Gardner, L.M. Association between mobility patterns and COVID-19 transmission in the USA: A mathematical modelling study. Lancet Infect. Dis. 2020, 20, 1247–1254. [Google Scholar] [CrossRef]
  29. Lasry, A.; Kidder, D.; Hast, M.; Poovey, J.; Sunshine, G.; Winglee, K.; Zviedrite, N.; Ahmed, F.; Ethier, K.A.; CDC Public Health Law Program; et al. Timing of Community Mitigation and Changes in Reported COVID-19 and Community Mobility—Four US Metropolitan Areas, February 26–April 1, 2020. Morb. Mortal. Wkly. Rep. 2020, 69, 451–457. [Google Scholar] [CrossRef] [Green Version]
  30. Hou, X.; Gao, S.; Li, Q.; Kang, Y.; Chen, N.; Chen, K.; Rao, J.; Ellenberg, J.S.; Patz, J.A. Intracounty modeling of COVID-19 infection with human mobility: Assessing spatial heterogeneity with business traffic, age, and race. Proc. Natl. Acad. Sci. USA 2021, 118, e2020524118. [Google Scholar] [CrossRef]
  31. Messner, W.; Payson, S.E. Variation in COVID-19 outbreaks at the US state and county levels. Public Health 2020, 187, 15–18. [Google Scholar] [CrossRef]
  32. Sun, F.; Matthews, S.A.; Yang, T.-C.; Hu, M.-H. A spatial analysis of the COVID-19 period prevalence in US counties through June 28, 2020: Where geography matters? Ann. Epidemiol. 2020, 52, 54–59.e1. [Google Scholar] [CrossRef] [PubMed]
  33. Thomas, L.J.; Huang, P.; Yin, F.; Luo, X.I.; Almquist, Z.W.; Hipp, J.R.; Butts, C.T. Spatial heterogeneity can lead to substantial local variations in COVID-19 timing and severity. Proc. Natl. Acad. Sci. USA 2020, 117, 24180–24187. [Google Scholar] [CrossRef] [PubMed]
  34. Villeneuve, P.J.; Goldberg, M.S. Methodological Considerations for Epidemiological Studies of Air Pollution and the SARS and COVID-19 Coronavirus Outbreaks. Environ. Health Perspect. 2020, 128, 095001. [Google Scholar] [CrossRef] [PubMed]
  35. Probst, T.M.; Lee, H.J.; Bazzoli, A. Economic Stressors and the Enactment of CDC-Recommended COVID-19 Prevention Behaviors: The Impact of State-Level Context. J. Appl. Psychol. 2020, 105, 1397–1407. [Google Scholar] [CrossRef] [PubMed]
  36. McNeish, D.; Kelley, K. Fixed Effects Models Versus Mixed Effects Models for Clustered Data: Reviewing the Approaches, Disentangling the Differences, and Making Recommendations. Psychol. Methods 2019, 24, 20–35. [Google Scholar] [CrossRef]
  37. Cunningham, G.B.; Nite, C. Demographics, politics, and health factors predict mask wearing during the COVID-19 pandemic: A cross-sectional study. BMC Public Health 2021, 21, 1403. [Google Scholar] [CrossRef] [PubMed]
  38. Scarpone, C.; Brinkmann, S.T.; Grosse, T.; Sonnenwald, D.; Fuchs, M.; Walker, B.B. A multimethod approach for county-scale geospatial analysis of emerging infectious diseases: A cross-sectional case study of COVID-19 incidence in Germany. Int. J. Health Geogr. 2020, 19, 32. [Google Scholar] [CrossRef]
  39. Smith, M.D.; Wesselbaum, D. COVID-19, Food Insecurity, and Migration. J. Nutr. 2020, 150, 2855–2858. [Google Scholar] [CrossRef]
  40. Diez-Roux, A.V. Bringing context back into epidemiology: Variables and fallacies in multilevel analysis. Am. J. Public Health 1998, 88, 216–222. [Google Scholar] [CrossRef] [Green Version]
  41. Zhang, Z.; Zyphur, M.J.; Preacher, K.J. Testing Multilevel Mediation Using Hierarchical Linear Models Problems and Solutions. Organ. Res. Methods 2009, 12, 695–719. [Google Scholar] [CrossRef] [Green Version]
  42. Dong, E.; Du, H.; Gardner, L. An interactive web-based dashboard to track COVID-19 in real time. Lancet Infect. Dis. 2020, 20, 533–534. [Google Scholar] [CrossRef]
  43. Oxford COVID-19 Government Response Tracker. Available online: https://covidtracker.bsg.ox.ac.uk/ (accessed on 22 February 2022).
  44. Hale, T.; Angrist, N.; Goldszmidt, R.; Kira, B.; Petherick, A.; Phillips, T.; Webster, S.; Cameron-Blake, E.; Hallas, L.; Majumdar, S.; et al. A global panel database of pandemic policies (Oxford COVID-19 Government Response Tracker). Nat. Hum. Behav 2021, 5, 529–538. [Google Scholar] [CrossRef] [PubMed]
  45. Flanagan, B.E.; Gregory, E.W.; Hallisey, E.J.; Heitgerd, J.L.; Lewis, B. A Social Vulnerability Index for Disaster Management. J. Homel. Secur. Emerg. Manag. 2011, 8, 3. [Google Scholar] [CrossRef]
  46. Tobler, W. On the first law of geography: A reply. Ann. Assoc. Am. Geogr. 2004, 94, 304–310. [Google Scholar] [CrossRef]
  47. Brunsdon, C.; Fotheringham, A.S.; Charlton, M.E. Geographically weighted regression: A method for exploring spatial nonstationarity. Geogr. Anal. 1996, 28, 281–298. [Google Scholar] [CrossRef]
  48. Blalock, H.M. Contextual-Effects Models: Theoretical and Methodological Issues. Annu. Rev. Sociol. 1984, 10, 353–372. [Google Scholar] [CrossRef]
  49. Duncan, C.; Jones, K.; Moon, G. Health-related behaviour in context: A multilevel modelling approach. Soc. Sci. Med. 1996, 42, 817–830. [Google Scholar] [CrossRef]
  50. Zhang, Y.J.; Jin, Y.L.; Zhu, T.T. The health effects of individual characteristics and environmental factors in China: Evidence from the hierarchical linear model. J. Clean. Prod. 2018, 194, 554–563. [Google Scholar] [CrossRef]
  51. Luo, W.; Azen, R. Determining Predictor Importance in Hierarchical Linear Models Using Dominance Analysis. J. Educ. Behav. Stat. 2013, 38, 3–31. [Google Scholar] [CrossRef]
  52. Gibbons, J.; Schiaffino, M.K. Determining the spatial heterogeneity underlying racial and ethnic differences in timely mammography screening. Int. J. Health Geogr. 2016, 15, 39. [Google Scholar] [CrossRef] [Green Version]
  53. Shrout, P.E.; Fleiss, J.L. Intraclass correlations—uses in assessing rater reliability. Psychol. Bull. 1979, 86, 420–428. [Google Scholar] [CrossRef] [PubMed]
  54. Castro, S.L. Data analytic methods for the analysis of multilevel questions—A comparison of intraclass correlation coefficients, r(wg(j)), hierarchical linear modeling, within- and between-analysis, and random group resampling. Leadersh. Q. 2002, 13, 69–93. [Google Scholar] [CrossRef]
  55. Dyer, O. COVID-19: Black people and other minorities are hardest hit in US. BMJ 2020, 369, m1483. [Google Scholar] [CrossRef] [PubMed] [Green Version]
  56. Gross, C.P.; Essien, U.R.; Pasha, S.; Gross, J.R.; Wang, S.-y.; Nunez-Smith, M. Racial and Ethnic Disparities in Population-Level COVID-19 Mortality. J. Gen. Intern. Med. 2020, 35, 3097–3099. [Google Scholar] [CrossRef] [PubMed]
  57. Wadhera, R.K.; Wadhera, P.; Gaba, P.; Figueroa, J.F.; Maddox, K.E.J.; Yeh, R.W.; Shen, C. Variation in COVID-19 Hospitalizations and Deaths Across New York City Boroughs. JAMA J. Am. Med. Assoc. 2020, 323, 2192–2195. [Google Scholar] [CrossRef]
  58. Rogers, T.N.; Rogers, C.R.; VanSant-Webb, E.; Gu, L.Y.; Yan, B.; Qeadan, F. Racial Disparities in COVID-19 Mortality Among Essential Workers in the United States. World Med. Health Policy 2020, 12, 311–327. [Google Scholar] [CrossRef]
  59. McCormack, G.; Avery, C.; Spitzer, A.K.-L.; Chandra, A. Economic Vulnerability of Households With Essential Workers. JAMA J. Am. Med. Assoc. 2020, 324, 388–390. [Google Scholar] [CrossRef]
  60. Xiong, D.; Zhang, L.; Watson, G.L.; Sundin, P.; Bufford, T.; Zoller, J.A.; Shamshoian, J.; Suchard, M.A.; Ramirez, C.M. Pseudo-likelihood based logistic regression for estimating COVID-19 infection and case fatality rates by gender, race, and age in California. Epidemics 2020, 33, 100418. [Google Scholar] [CrossRef]
  61. Levin, A.T.; Hanage, W.P.; Owusu-Boaitey, N.; Cochran, K.B.; Walsh, S.P.; Meyerowitz-Katz, G. Assessing the age specificity of infection fatality rates for COVID-19: Systematic review, meta-analysis, and public policy implications. Eur. J. Epidemiol. 2020, 35, 1123–1138. [Google Scholar] [CrossRef]
  62. Lee, S.; Zabinsky, Z.B.; Wasserheit, J.N.; Kofsky, S.M.; Liu, S. COVID-19 Pandemic Response Simulation in a Large City: Impact of Nonpharmaceutical Interventions on Reopening Society. Med. Decis. Mak. 2021, 41, 419–429. [Google Scholar] [CrossRef]
  63. Wellenius, G.A.; Vispute, S.; Espinosa, V.; Fabrikant, A.; Tsai, T.C.; Hennessy, J.; Dai, A.; Williams, B.; Gadepalli, K.; Boulanger, A.; et al. Impacts of social distancing policies on mobility and COVID-19 case growth in the US. Nat. Commun. 2021, 12, 3118. [Google Scholar] [CrossRef] [PubMed]
Figure 1. GWR coefficients map. (a) Socioeconomic status subindex and infection rate. (b) Household characteristics and disability subindex and infection rate. (c) Racial/ethnic minority status and language subindex and infection rate. (d) Housing type and transportation subindex and infection rate.
Ijgi 11 00229 g001
Figure 2. Effect of the state-level C2 (workplace closure index) on the regulation of the influence of the SVI1 (SES subindex) on the infection rate.
Ijgi 11 00229 g002
Figure 3. Interaction of the cross-layer self-variable through the return factor.
Ijgi 11 00229 g003
Table 1. SVI and COVID-19 infection rate regression results.
VariableInfection Rates
Bp 1
Overall social vulnerability index (SVI)0.36**
Socioeconomic status subindex (SVI1)0.08
Household characteristics and disability subindex (SVI2)0.71***
Racial/ethnic minority status and language subindex (SVI3)0.42***
Housing type and transportation subindex (SVI4)0.34***
1 ** p < 0.05, *** p < 0.01.
Table 2. Null model of the HLM result.
LevelVariance ComponentContribution RatioDegree of FreedomChi-Squarep 1
20.510.67502642.831***
10.250.33
1 *** p < 0.01.
Table 3. Complete HLM results for the infection rate.
Fixed Effect
ParameterCorrelation CoefficientTp 1
INTRCPT2, γ00−0.8757−8.3627***
School closure(C1), γ01−0.2963−3.8930***
Workplace closure(C2),γ02−0.7016−6.3153***
Public transport closure(C3), γ03−0.2265−2.0523*
Internal movement restrictions(C4), γ04−0.6643−5.8852***
SVI1, γ101.716010.9709***
SVI2, γ20−0.6052−6.35301***
SVI3, γ303.162225.4515***
SVI4, γ401.447517.5870***
Random Effect
ParameterStandard DeviationVariance Componentp
INTRCPT1, u00.772670.59701***
SVI1 slope, u10.930570.86596***
SVI2 slope, u20.493470.24352***
SVI3 slope, u30.626110.39201***
SVI4 slope, u40.399230.15938***
r0.684580.46865
1 * p < 0.1, *** p < 0.01.
Publisher’s Note: MDPI stays neutral with regard to jurisdictional claims in published maps and institutional affiliations.

