Article

Development of Big Data-Analysis Pipeline for Mobile Phone Data with Mobipack and Spatial Enhancement

by
Apichon Witayangkurn
1,2,*,
Ayumi Arai
2,3 and
Ryosuke Shibasaki
2,3
1
School of Information, Computer, and Communication Technology (ICT), Sirindhorn International Institute of Technology, Thammasat University, Pathum Thani 12120, Thailand
2
Center for Spatial Information Science, The University of Tokyo, Chiba 277-8568, Japan
3
Spatial Data Commons, The University of Tokyo, Chiba 277-8568, Japan
*
Author to whom correspondence should be addressed.
ISPRS Int. J. Geo-Inf. 2022, 11(3), 196; https://doi.org/10.3390/ijgi11030196
Submission received: 7 February 2022 / Revised: 8 March 2022 / Accepted: 12 March 2022 / Published: 15 March 2022
(This article belongs to the Special Issue Large Scale Geospatial Data Management, Processing and Mining)

Abstract

:
Frequent and granular population data are essential for decision making. Further-more, for progress monitoring towards achieving the sustainable development goals (SDGs), data availability at global scales as well as at different disaggregated levels is required. The high population coverage of mobile cellular signals has been accelerating the generation of large-scale spatiotemporal data such as call detail record (CDR) data. This has enabled resource-scarce countries to collect digital footprints at scales and resolutions that would otherwise be impossible to achieve solely through traditional surveys. However, using such data requires multiple processes, algorithms, and considerable effort. This paper proposes a big data-analysis pipeline built exclusively on an open-source framework with our spatial enhancement library and a proposed open-source mobility analysis package called Mobipack. Mobipack consists of useful modules for mobility analysis, including data anonymization, origin–destination extraction, trip extraction, zone analysis, route interpolation, and a set of mobility indicators. Several implemented use cases are presented to demonstrate the advantages and usefulness of the proposed system. In addition, we explain how a large-scale data platform that requires efficient resource allocation can be con-structed for managing data as well as how it can be used and maintained in a sustainable manner. The platform can further help to enhance the capacity of CDR data analysis, which usually requires a specific skill set and is time-consuming to implement from scratch. The proposed system is suited for baseline processing and the effective handling of CDR data; thus, it allows for improved support and on-time preparation.

1. Introduction

Frequent and granular data on the population of a country are essential for informed decision making. Furthermore, progress monitoring towards achieving the sustainable development goals (SDGs) necessitates data availability at global and disaggregated levels [1]. Surveys are conventional means of collecting information on population characteristics and facilitate the understanding of their situations in detail. However, these data are not updated frequently because this requires a certain time and resources. Particularly in developing countries, the scarcity of up-to-date data is a major challenge because of limited resources [2].
As of 2019, more than half of the global population has been using mobile services. Furthermore, mobile cellular signals are accessible to 97% of the global population [3], even those who do not have access to basic infrastructure such as water and electricity. In this regard, the mobile phone is a pervasive platform that can reach even populations that are often overlooked in conventional surveys, e.g., those who live in remote areas or are highly mobile. High population coverage of mobile cellular signals has been accelerating the generation of large-scale spatiotemporal data such as call detail record (CDR) data. This enables resource-scarce countries to collect digital footprints at scales and resolutions that cannot be realized using traditional surveys [4].
CDR data are collected by the mobile network operator (MNO) for billing and net-work monitoring. This means that the data include all mobile network service subscribers. A CDR is generated at every event on the mobile network, e.g., a call, short message service (SMS), and data communication. The record includes the time of the event, which is associated with the location information of the cell tower connected at the time of the event [5]. Whereas the CDR data cover all subscribers to the mobile network services, the GPS data from the mobile phone are associated with only some subscribers. Specifically, GPS data can be collected from smartphone users who subscribe to specific services provided through smartphone applications only when they enable it. This study focused on the use of CDR data.
Statistical insights generated from CDR data can provide the mobility patterns and spatiotemporal distribution of large populations [6]. The data are useful for disaster management, tourism, responses to health crises, and transportation planning. They can provide digital footprints at scales and resolutions that cannot be realized using traditional surveys [7,8,9,10,11]. However, the use of CDR data requires considerable time, effort, and coordination. This includes data access and an institutional framework such as a partnership between a data producer and data users, consensus on the use of CDR data for policy purposes, privacy protection, and a system and method for producing statistical outputs with secure data privacy [12,13]. These processes can be a burden if they have to be set up at the onset of a disaster or in emergency scenarios where information to support timely responses is needed [14]. Furthermore, a certain platform and data processing is required to generate valuable insights from CDR data. It includes hardware procurement, system setup, algorithm development, and indicators suited for particular purposes. These could require specific capacity and extensive time to implement from scratch. In addition, there is a lack of standardization and consensus on the structure of data and platform for these processes. This limits the usage of CDR data, particularly at broader scales such as comparing results among mobile operators or other countries [13].
Hence, there is a need for a comprehensive platform, namely, a big data-analysis pipeline, which can help process CDR data to produce actionable insights. There are several open-source toolkits such as FlowKit by Flowminder [15] and COVID-19 mobility data by the COVID-19 Mobility Task Force of the World Bank [16]. However, they require commercial subscriptions to implement analyses using open-source tools on large-scale datasets. Given the limited technical capacity and financial resources for utilizing new data sources in developing countries, sustainability in using and maintaining the system is important.
This paper proposes a data-analysis pipeline with an open-source package for CDR data analysis. The pipeline includes the data provider, large-scale data management, and data sharing. The Apache Hadoop ecosystem and our spatial enhancement library are used as the base infrastructure to handle the large data volumes, high-speed processing, and spatiotemporal data involved. In addition, we develop the mobility analysis package Mobipack, which consists of useful mobility analysis modules, including data anonymization, data import, data cleaning, data conversion, trip extraction, origin–destination extraction, zone analysis, route interpolation, and a set of mobility indicators. With this package, the system fulfills the need for functions starting from raw data to the final product for CDR analysis. Furthermore, we provide an estimation of the hardware and software requirements for the data pipeline setup and present performance evaluation results. Finally, actual implemented use cases are presented that demonstrate the advantages and utility of the proposed system. As evidence, our system has been implemented in various countries, including Mozambique, Guinea, Angola, Rwanda, and The Gambia. Ultimately, our proposed system could be feasibly used as a baseline platform for CDR mobility analysis. By introducing the proposed platform, this paper aims to address the following questions:
  • How can a large-scale data platform that requires efficient resource allocation for managing data be built as well as used and maintained in a sustainable manner, given that collecting up-to-date data on populations is a challenge in developing countries?
  • How can we help enhance the capacity of CDR data analysis, which requires a specific skill set and is time-intensive to implement, if we desire to start from scratch where human resources are limited?
The remainder of this paper is structured as follows. Section 2 explains the characteristics of CDR data, which are related to the way the data are collected. It highlights the advantage and challenge of CDR data, which may require careful interpretation of statistical information generated from CDR data. Section 3 presents underlying concepts and related work conducted for developing data pipelines, big data platforms, and existing open-source analytical tools. Section 4 introduces the materials and methods of the purposed pipeline, including its requirements. Section 5 summarizes the results and discussion on the proposed platform, followed by the conclusion.

2. Call Detail Record (CDR) Data

This section explains the characteristics of CDR data, which are associated with the way the data are collected. It helps to understand the advantages and challenges of CDR data, which may require careful interpretation of statistical information generated from CDR data.

2.1. Data Components

CDR data include multiple variables associated with events on mobile networks. There are three key components in understanding mobility patterns: an identifier, timestamp, and cell tower location. Several variables can be used as identifiers: the international mobile equipment identity (IMEI), international mobile subscriber identity (IMSI), and mobile station international subscriber directory number (MSISDN). The IMEI is used as a variable to define the number of devices. The IMSI defines the number of subscriber identity module (SIM) cards, which can be considered as the number of subscriptions. The MSISDN refers to the phone numbers and is used to indicate Anumber and Bnumber. Anumber is a term used to indicate the phone number from which a networking event is initiated, and Bnumber indicates its destination. All these variables are de-identified by the MNO before the data are used for the analysis. The timestamp indicates the time at which a networking event is initiated, e.g., when a phone call is started or a text message is sent. In CDR data, the cell tower location is included as the identifier of the cell tower. A unique identifier is assigned to an antenna when a cell tower is associated with more than one antenna. The geographic coordinates are usually stored in a separate database and associated with the same set of identifiers used in the CDR data. The corresponding MNO must provide this cell tower data with the CDR data. The two databases are related using the identifier as a key for georeferencing CDR data.

2.2. Data Representativeness

A CDR is generated only when a mobile phone is used. This means that what can be observed from CDR data does not represent people who do not use mobile phones. It causes biases that can influence the representativeness of CDR data. Selection bias occurs because CDR data include only mobile phone users. Phone ownership is skewed to specific socioeconomic groups. For example, it is less probable for the elderly and young children to be representative, whereas there is a bias towards males and higher-income groups [17]. Measurement bias occurs because a CDR is generated only when a phone is used; thus, insights generated from data can be affected by the frequency of records [18]. For example, it is difficult to obtain the detailed movements of users who do not use their phones frequently [19]. A similar bias may occur when an analysis is conducted for a sub-sample of CDR data after filtering those with a low number of records [20].

2.3. Spatial Granularity

The spatial granularity of CDR data depends on the density of cell towers, which generally correlates with the population density [21]. The cell tower density is higher in urban areas, and lower in rural areas. For example, in an urban area, the distance between two neighboring cell towers can be less than 10 m if it is a city center. In a rural area, the distance can be several kilometers. This difference influences the capacity to capture mobility in rural areas. The mobility of people in an area covered by a single cell tower can be observed as stationary because any network events in that area are associated with the same cell tower. In addition, it leads to an overestimation of the travel distance when it is computed based on the flow between the cell towers. When people travel across the boundaries of two distant cell towers, distance traveled from an area covered by one cell tower to an area covered by another is computed as distance between the two cell towers. That travel distance estimated from the flow between the cell towers can be kilometers even if actual movement is just crossing the boundaries, given that the two distant cell towers represent the two areas.

2.4. Data Frequency

CDR data are intermittent because they are generated only when mobile phones are used. In addition, the data are not as frequently generated as GPS data, which are generated at a constant interval. This could limit the extent of the analysis that can be performed using CDR data, particularly when the study period is short. For example, the examination of travel behavior over a day requires a certain number of data points, which allows for the estimation of the origin and destination of travel during that day. Travel behavior that can be observed from the data is associated with locations represented by data points while the data points may not necessarily represent the point of the departure time from a travel origin and arrival time at a travel destination. This means that the travel behavior that can be observed from the data is only based on locations observed in the CDR data. This impact can be mitigated when the data are used for long-term analysis. For example, long-term relocation can be estimated by aggregating frequently observed locations over a certain period of time [22].

3. Concepts and Related Work

This section presents underlying concepts and related work conducted on data pipelines, big data platforms, and existing open-source analytical tools.

3.1. Data Pipeline

Data ingestion and pipelines are fundamental aspects of organizations and associations that collect and sort significant amounts of information. To accommodate the rapid transmission of big data, a pipeline should allow for the consistent ingestion, analysis, and storage of information. The development of a foundation for the ingestion of widely varied, multi-source, high-speed, and heterogeneous information streams includes a thorough investigation of the creation and expansion of these information surges. In addition, a pipeline framework should be adaptable, powerful, and extensible to support the information streams between numerous data makers and customers [23]. In [24], the critical components of such a pipeline are presented; they include data acquisition, data integration and extraction, distribution, and analysis.
Various tools are currently used for data acquisition, such as Apache NiFi, Apache Airflow, and AWS Glue. These tools generally contain standard components, including the automated setup and execution of computational dataflows, with the reusability of coordinated executables under given conditions and runtime scenarios. In addition, they provide accessibility to a simple web interface to construct, work, and oversee situations. In this study, we utilized Apache NiFi, which is an open-source tool available for automating and handling the flow of information between various systems. It provides a configurable and adaptable dataflow process for the modification of information at runtime via the web user interface. Liu et al. [25] presented a generic and highly scalable framework for the automation and execution of scientific data processing and simulation workflows, to mechanize the initiation, synchronization, and execution of logical information handling. Their framework utilizes Apache Kafka for correspondence among modules, and Apache Nifi for the fabrication of simulation workflows and information handling.
For the data pipeline, a review work by Sebei et al. [26] on big data pipelines for social media analytics summarizes six distinct steps for processing big data: data acquisition, data recording, data pre-processing with cleaning, data processing with integration, data analysis with an analytics model, and data interpretation with visualization. The Hadoop framework was found to be the main infrastructure used for big data support. Data cleaning in the pre-processing stage has also been identified as a major challenge in the development of data pipelines [27]. It normally includes checking for duplication, inconsistent values, missing data, merged data, and format conversion. Omidvar-Tehran and Amer-Yahia presented various aspects used for the evaluation of the pipeline, including performance in terms of execution time, scalability, and effectiveness of the output [28]. In [29,30], various data sizes and numbers of concurrent tasks and single tasks are used for evaluating execution performance and scalability. For sudden emergencies such as epidemics or natural disasters, there is a need for a standardized system that can gain systematized access to and use anonymized aggregated mobile phone data across countries [13]. Our work provides a baseline analysis pipeline for CDR data analysis that comprises an all-open-source software framework and also provides all programs and the detailed instructions necessary for implementation and analysis. This contrasts with other studies that only focus on the algorithms and provide no practical system and use cases for actual implementation.

3.2. Large-Scale Data Platform

Mobility analysis generally requires data collected over a long term such as months, seasons, and years. The data size is critical, as it may exceed the terabyte-scale. Traditional computational power cannot be used for this case. Therefore, a large-scale processing platform is required for such large-sized data with a significantly high growth rate. This ensures scalability features capable of expandable storage and high-speed processing. Apache Hadoop and Spark are typical examples of such big data platforms. Yang et al. developed a platform for preserving user trajectory privacy while maintaining user mobility patterns using Spark and Hadoop to support large-scale datasets [31]. Abdallah et al. used a cell-phone dataset for the control of the spread of COVID-19. They utilized Spark with GPU enabled as the base infrastructure to handle over 100 million points per day [32]. Qin et al. applied big data analytics to monitor tourist flow. They used Spark with the Spark SQL interface to ensure large-scale support [33]. However, they provide no explicit evaluation information on the performance of the platform or how it scales over time.
Novović et al. utilized both Hive and Spark with the Scala language in the Hadoop ecosystem to identify the relationship between human connectivity and land use [34]. They used the Hive database for storing data and conducted processing via the Spark interface. However, no performance or data size information is provided. CDR information has also been used to screen and control pandemics, e.g., Ebola, by evaluating the human directions and spatiotemporal appropriation of the population [35]. To process the large-sized information, the Apache Hadoop framework was employed, and Hive was used as the primary processing tool. In practice, the Hadoop ecosystem can be installed using Apache Ambari, a web-based management tool for Hadoop clusters that includes base services such as HDFS, YARN, MapReduce, and Zookeeper. Spark and Hive can also be installed as optional services for processing.
CDR data are spatiotemporal data, for which analysis predominantly necessitates working with location data and spatial-related functions such as locating points in administrative boundaries or determining distances between points. Shangguan et al. [36] proposed a methodology for big spatial data processing that uses Apache Spark and HBase for the stacking, overseeing, registration, and verification of a significant amount of spatial information in the appropriate cluster. In particular, the spatial information is handled by Apache Spark utilizing SparkSpatialSDK. In previous work, we developed a spatial-related library to enhance spatial functions on the Hadoop platform, specifically, in Hive [37]. For one day of data—approximately 22 million records—the location mapping task was completed in one minute, with 22 Hive tasks compared to a database of data collected over 1200 min. We included our spatial-enhancement library in the pipeline as well.

3.2.1. Apache Hadoop

Given that CDR data consist of large-sized datasets that common computer systems or databases cannot process within an acceptable time-period, the Apache Hadoop system was used as the primary data processing system in this study. Apache Hadoop [38] is an open-source cloud computing software framework for data-intensive and distributed applications. There are various services and frameworks within the Apache Hadoop toolkit. However, we focused on the Apache Hadoop Distributed File System (HDFS) and Hive in this study. To set up and use Apache Hadoop in the full operation mode, the execution of five components is required, namely, NameNode, DataNodes, Secondary NameNode, JobTracker, and TaskTrackers. NameNode is the bookkeeper of the HDFS, which records how files are sorted into file blocks, the nodes that store the blocks, and the overall health of the distributed file system. DataNodes perform the functions of the filesystem. They store and retrieve blocks when instructed and deliver periodical reports to the NameNode with lists of the blocks stored. JobTracker is the liaison between the application and Apache Hadoop. When code is submitted to a cluster, JobTracker determines the execution plan by determining which files to process, assigning nodes to different tasks and monitoring all running tasks. TaskTrackers execute the individual tasks that JobTracker assigns and manage the execution of individual tasks on each slave node. For production, it is recommended to run the program with a minimum of four machines, including one master node and three slave nodes with a replication of two.

3.2.2. Apache Spark and Databricks

Apache Spark [39] is a hybrid processing framework based on principles similar to those of the MapReduce engine, with the primary objective optimization by speeding up the batch processing workloads by entire in-memory computation. Apache Spark interacts with the storage layer in the initial stage to load the data into memory and maintain the final result at the end of the process. Different from Apache MapReduce, in Apache Spark, all processing and intermediate results are performed and stored in memory. Databricks was founded by the creators of Apache Spark, and provides a unified platform designed to improve productivity for data engineers, data scientists, and business analysts. In particular, the Databricks platform provides an interactive and collaborative ready-to-use notebook experience. Due to its optimized Apache Spark runtime, it frequently outperforms other big data Structured Query Language (SQL) platforms in the cloud. A feature comparison between the Apache Hadoop and Apache Spark is summarized in Table 1. Spark, Hadoop, and Hive typically run in the same environment. While Hadoop is used as the base infrastructure, users have the option of using Spark or Hive for processing and analysis.

3.3. Existing Open-Source Analytical Tools

3.3.1. The WB COVID-19 Mobility Indicator

The WB COVID-19 Mobility Indicator is an open-source project initiated by the COVID-19 Mobility Task Force of the World Bank [15]. The objective is to support data-poor countries with analytics on mobility, to inform mitigation policies for preventing the spread of COVID-19. There is a code for three high-level tasks in this repository, namely, cdr-aggregation, data-checks, and dashboard-dataviz. In addition, the code generates a series of indicators such as the number of unique subscribers, ratio of residents, origin–destination matrix, and mean/standard deviation of the distance traveled. The software is run in the database environment.

3.3.2. FlowKit

FlowKit [15] is an open-source suite of software tools developed by the Flowminder Foundation, to support the analysis of mobile phone data for humanitarian and development efforts. It supports an analytical toolkit developed for use cases. In addition, it includes data quality assurance tools, which further increases the analysis efficiency. FlowKit supports the analysis on the distributions, characteristics, and dynamics of human populations. For large-scale data, the execution of the software is conducted in the Databricks or Apache Spark environments.

4. Materials and Methods

4.1. Key Requirements

To ensure large-scale CDR data analysis in a sustainable and replicable manner, the following requirements are key.
  • The data pipeline comprises data acquisition, data recording, data pre-processing with cleaning, data processing with integration, data analysis with an analytics model, and data interpretation with visualization [26].
  • The data requirements and data formats are clearly defined to ensure a standardized system that can be replicated by any country and run on an operational basis [13].
  • The details of the recommended hardware and software specifications are provided [13].
  • A large-scale platform that can accommodate huge datasets with scalability support and minimum effort to scale is necessary.
  • The system covers all processes, starting from raw data to the output of indicators that can be utilized by other research groups/domains [12].
  • The system includes analysis software with algorithms that are ready to use and able to run on large-scale platforms with parallel processing to minimize the processing time on huge datasets.
  • The system is cost-effective and requires no license to enable CDR analysis capability in developing countries [13].
  • The system supports spatial-related operations such as finding distances between coordinates or identifying boundaries on which points are located. These kinds of functions are typically used in the analyses [37].
We designed and developed our pipeline to fulfill the above requirements. The details are presented in the following sections.

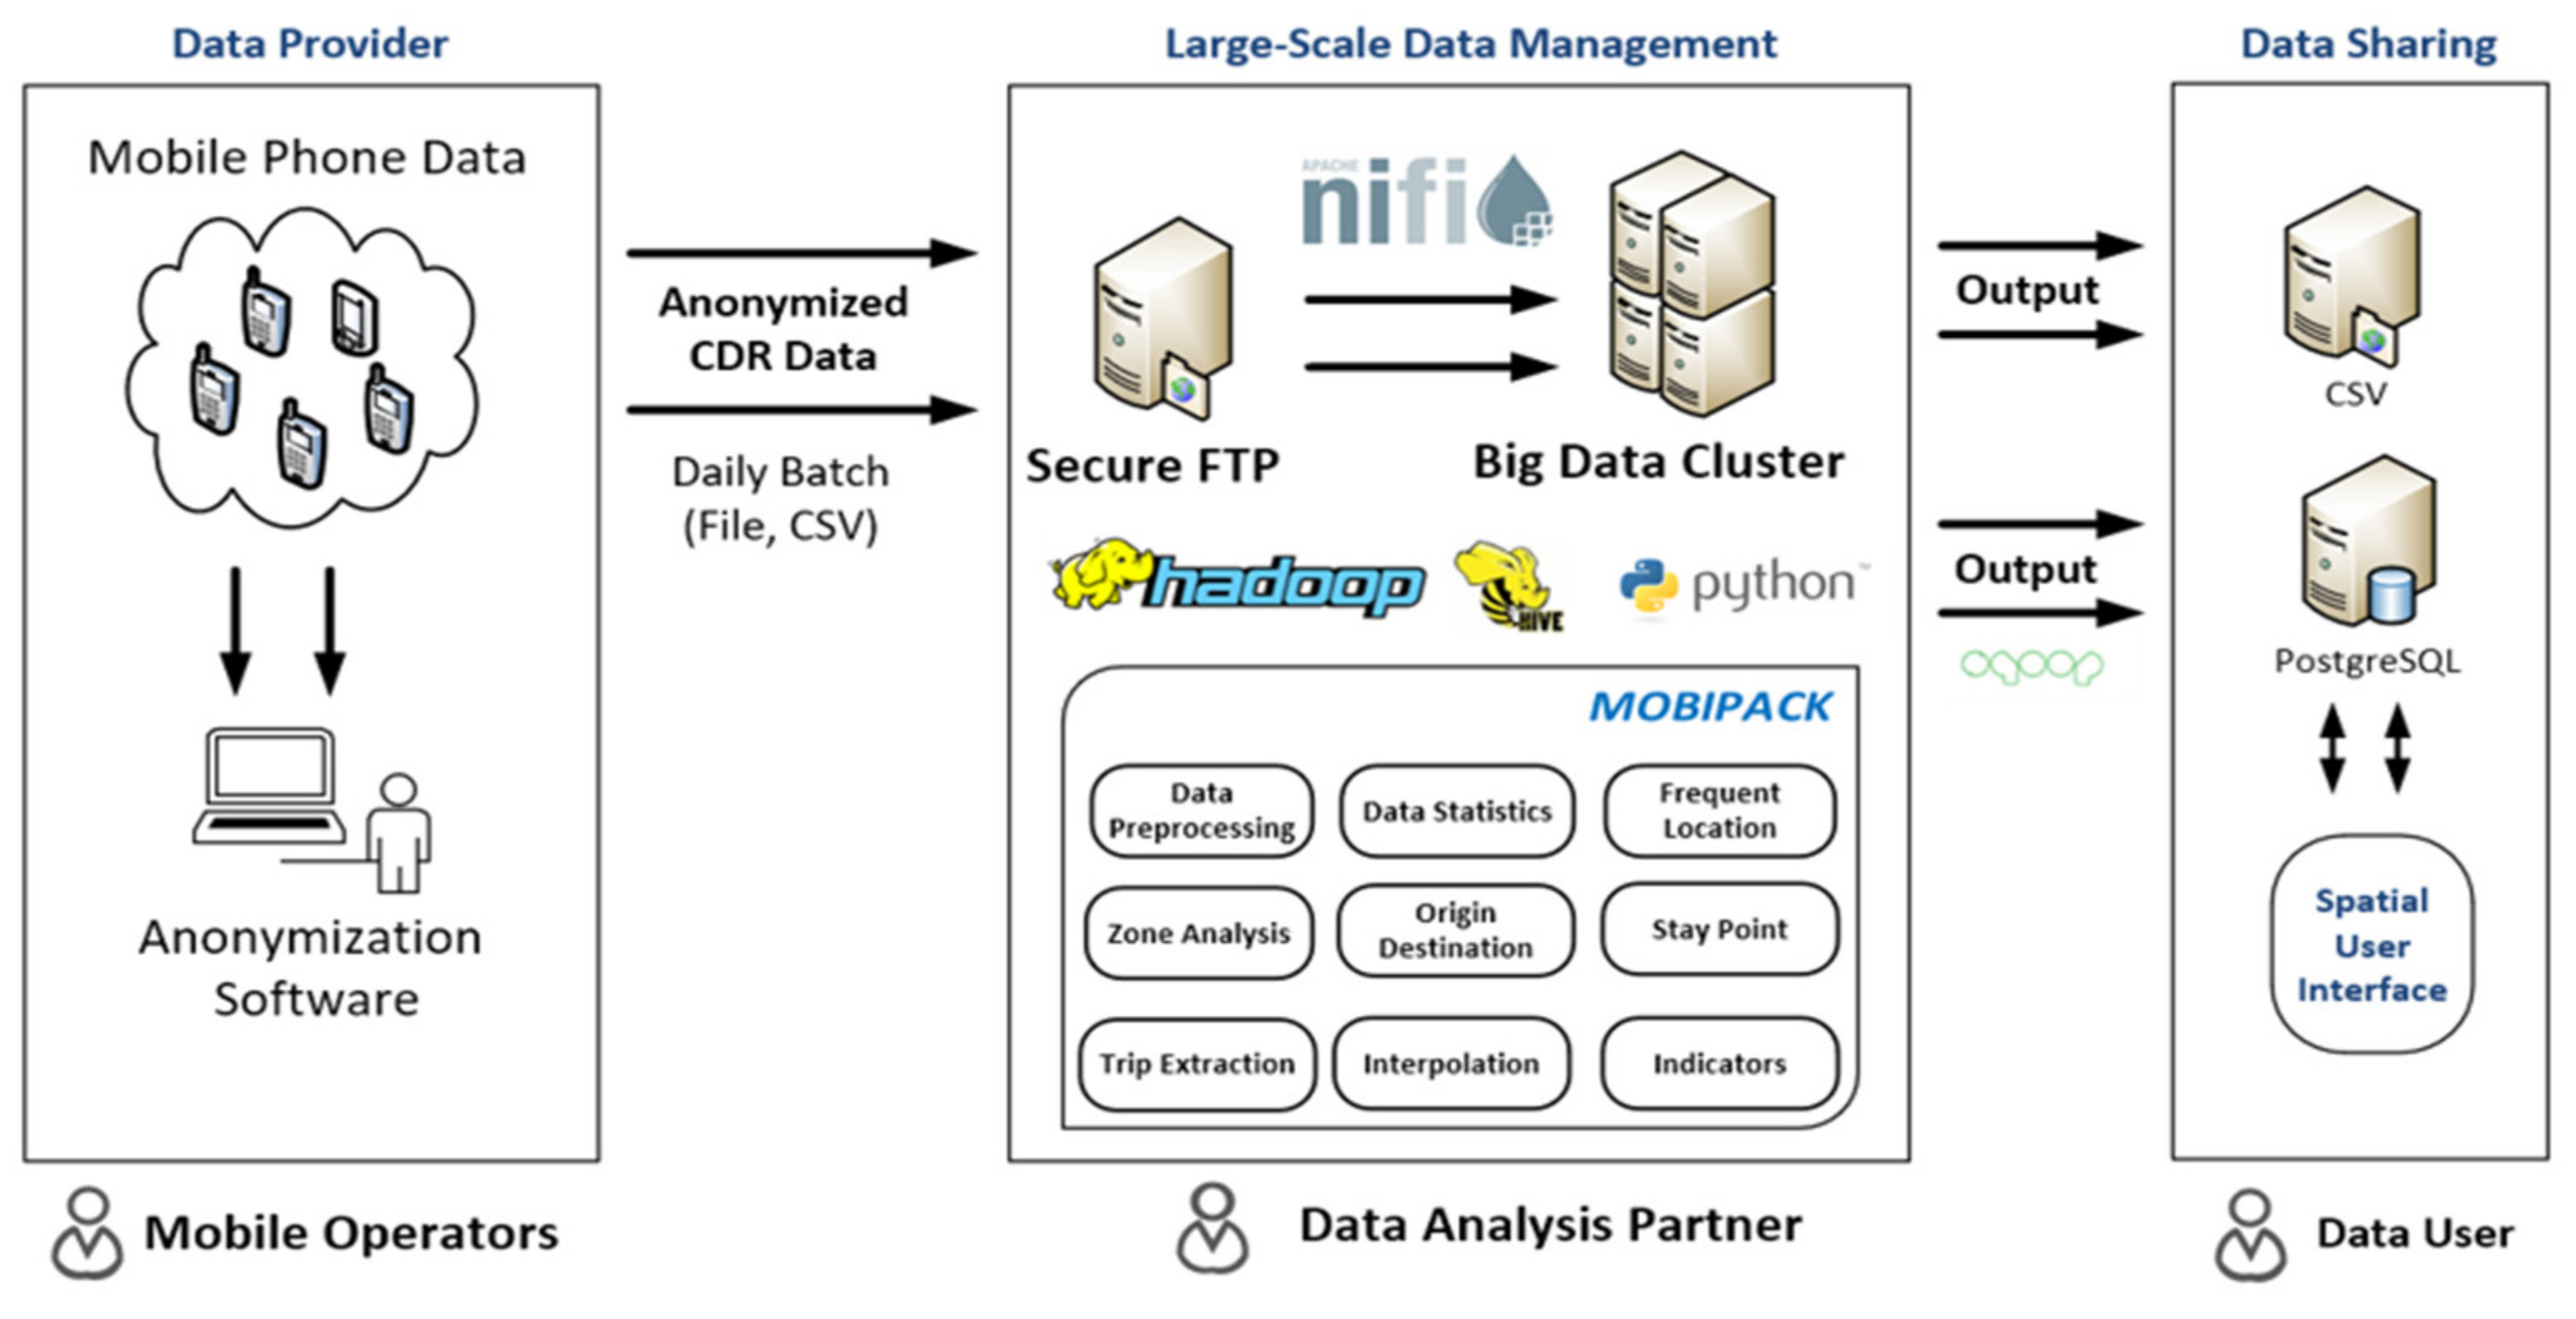
4.2. An Overview of the Data Analytics Pipeline

The pipeline consists of three main parties: data providers, data analysis partners, and data users. Data providers are typically mobile network operators (MNO) or telecommunications regulators. The data analysis partner is dependent on the nation-specific regulations. In most cases, the data analysis partner is a telecommunications regulator or institutions authorized to access the data based on the country’s laws and regulations. In addition, the use of the data outside the country is prohibited. Finally, the data user utilizes and conducts more analysis on the output for a specific domain, such as transportation, disaster, and health. Figure 1 illustrates the overall structure of the pipeline.
The pipeline extends from data providers, which are generally MNOs or telecom regulators. The data providers prepare the data according to the specifications and maintain them in a daily file in the comma-separated values (CSV) format. Given that the CDR data contain privacy data, they undergo an anonymization process that uses an encryption algorithm to hash the identifiable attributes in the data, such as the IMEI and IMSI. Thereafter, the anonymized data are transferred via a secured channel to the secure File Transfer Protocol (FTP) based on the premise of the data analysis partner. Apache Nifi, which is an automated workflow tool, then executes the task to import new data to the big data cluster, followed by a script based on Mobipack software for the pre-processing, computation of data statistics, analysis, and computation of the targeted indicators. The output is stored in a Hive table and exported to the CSV files. Finally, Apache Sqoop, which is an efficient transferring tool, can transfer the output data to the relational database for further analysis and visualization.
The detailed information on Mobipack and our initiative is available online at https://sdc.csis.u-tokyo.ac.jp. The software, source code, and manual are available online at https://github.com/SpatialDataCommons.
Figure 2 presents the flow of the CDR data analysis by Mobipack. Raw CDR data should be pseudonymized by the data provider, such that the data used for analysis do not contain individually identifiable information. The data are then imported to the big data cluster (Apache Hadoop), and pre-processing is carried out. The Apache Hadoop checks for missing and incorrect data, converts the data format, and filters data for specific target areas. Thereafter, it calculates the fundamental statistics of the data, such as the total number of records and total number of subscribers daily. The specific analysis module is then executed, such as the estimation of the population for the specific administrative zone, origin–destination estimation, route interpolation, and mobility indicators.

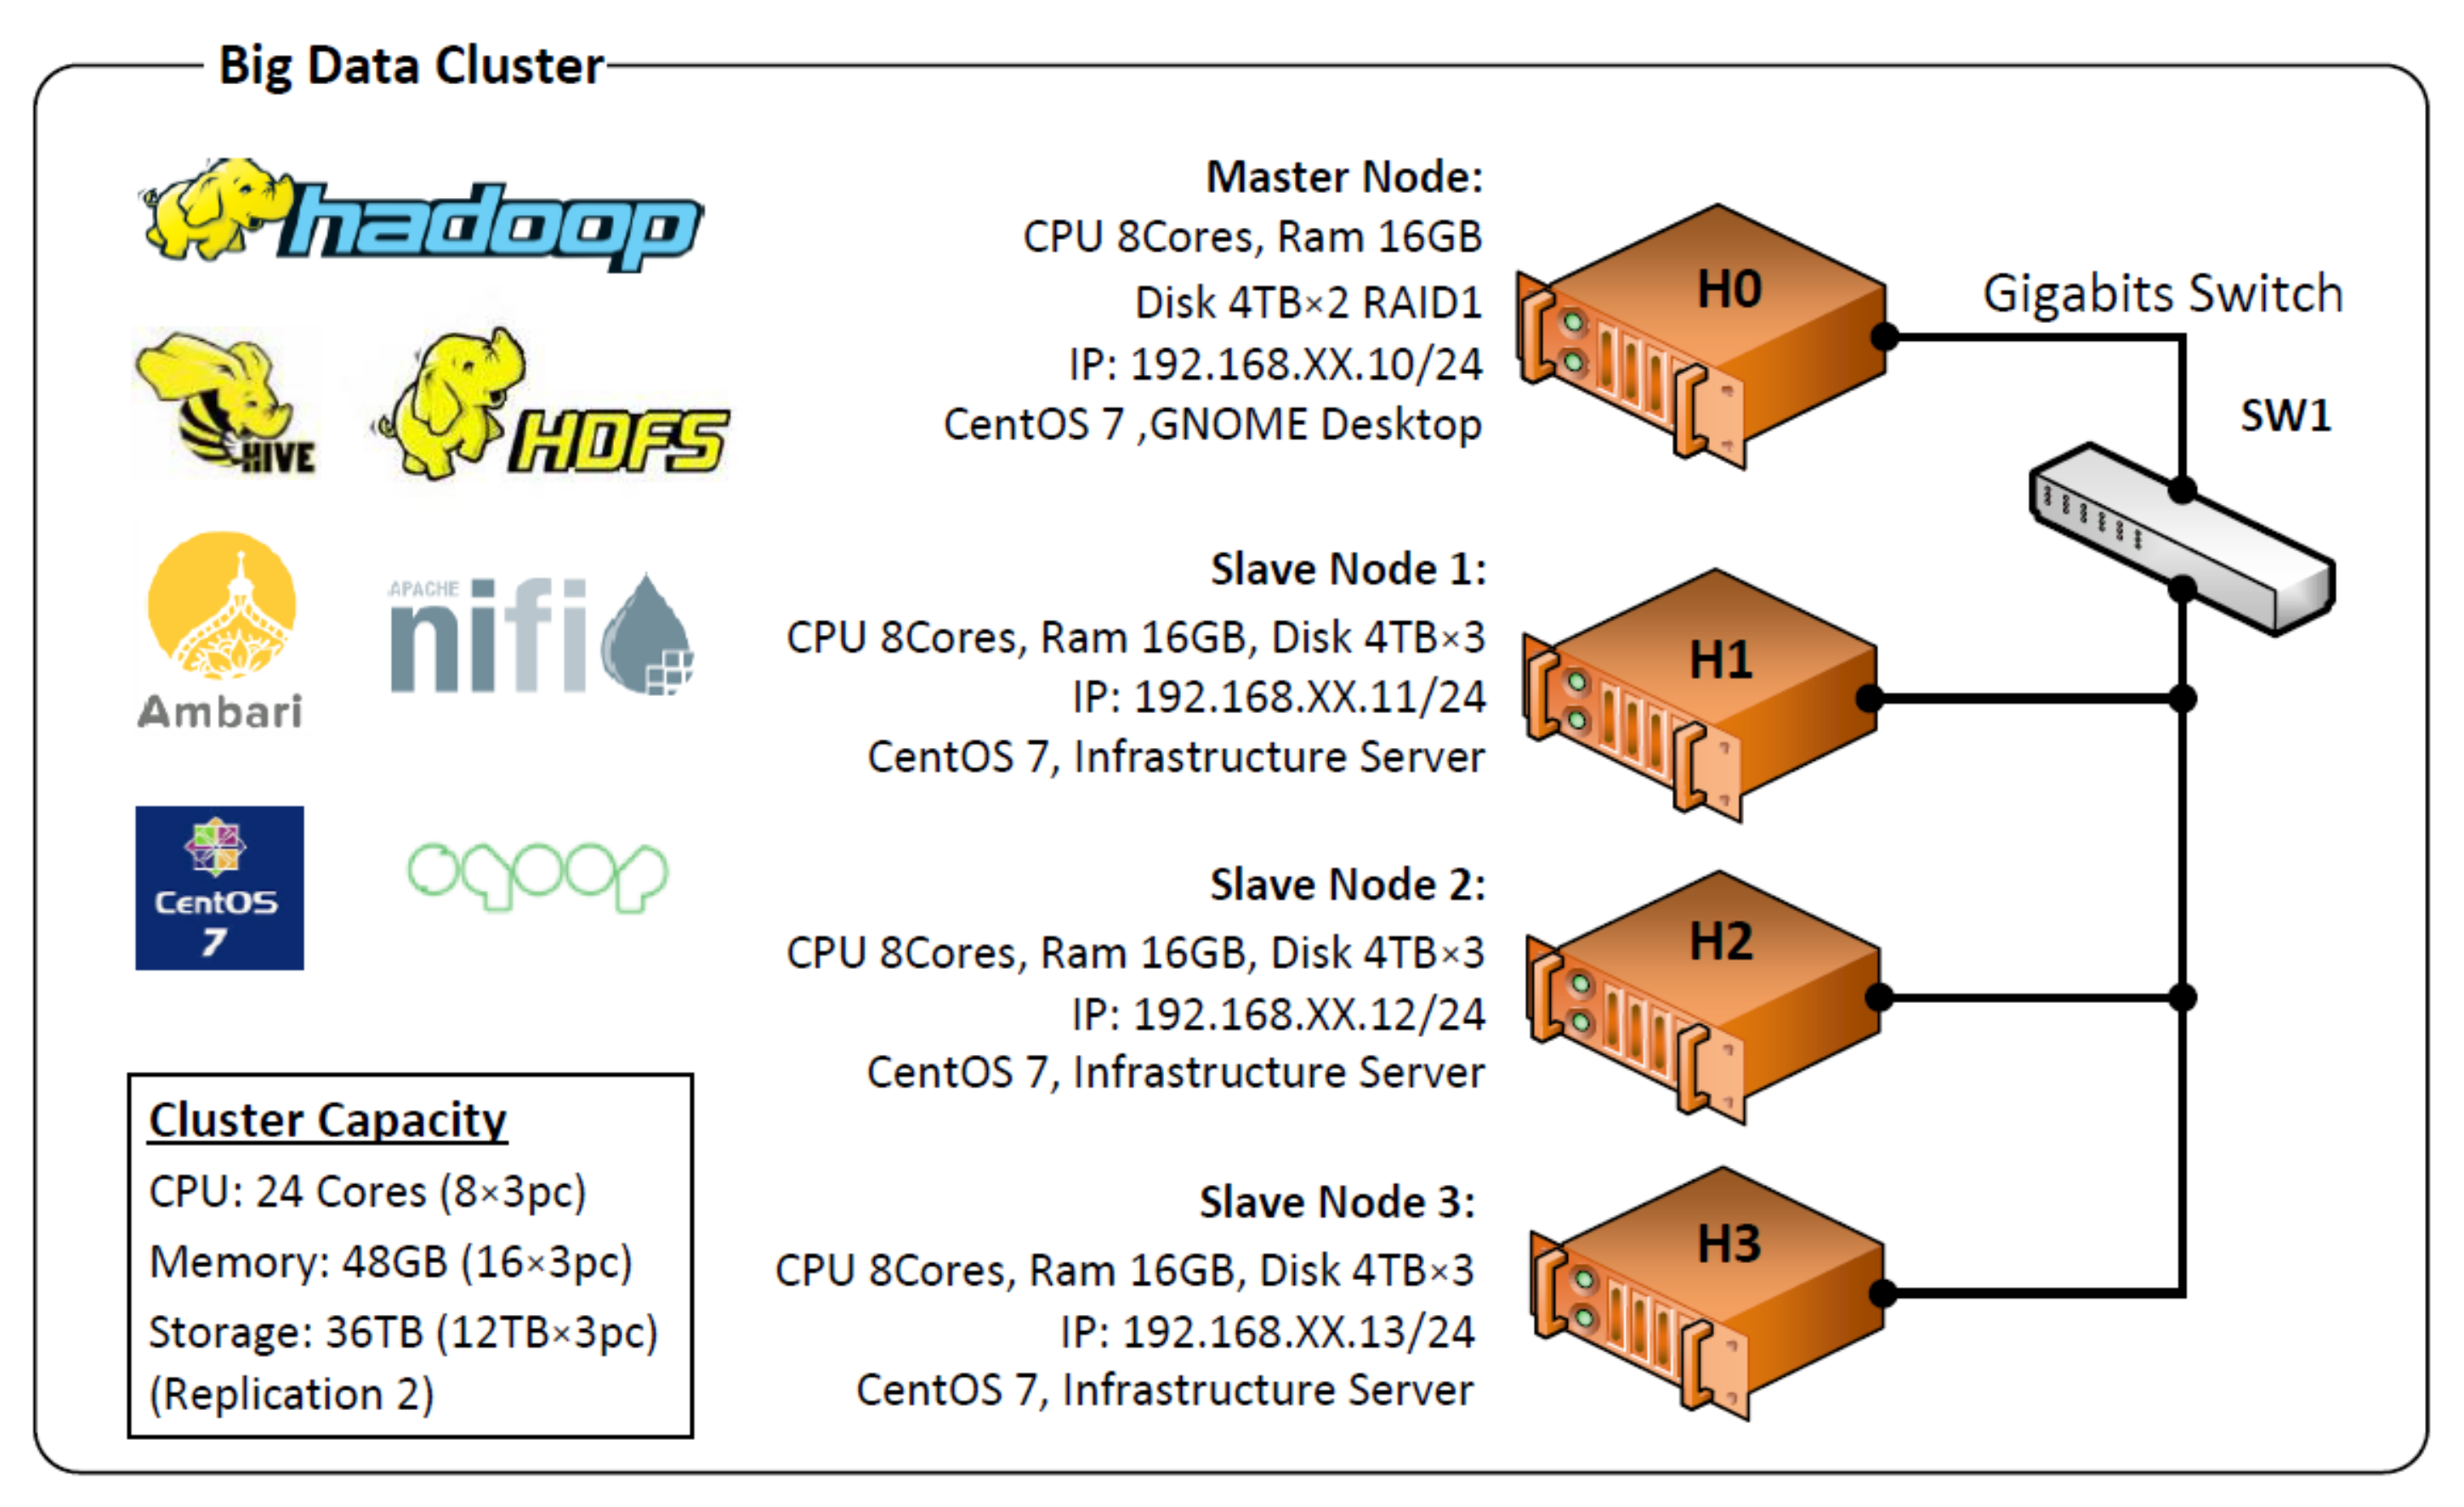
4.3. Big Data Cluster

The CDR data are large-sized datasets that common computer systems or databases cannot process within an acceptable time. To handle such a large dataset with scalability features, Apache Hadoop is used. It is a cloud computing platform which can store a large amount of data, and it has a high processing speed, as it comprises multiple computer nodes. The actual data are split into small files and stored in different nodes. Moreover, Apache Hadoop can utilize multiple nodes for parallel processing, which increases the processing speed. The big data cluster was developed based on the Apache Hadoop platform and the software within its framework. Apache Hadoop was installed as a base infrastructure via Apache Ambari, which is a web-based management tool. Additional software, including HDFS, Hive, and Sqoop, were installed. It should be noted that HIVE is a data warehousing package. In particular, it targets users familiar and comfortable with SQL to perform ad hoc queries, summarization, and data analysis. In addition, it provides a mechanism for developing a custom function for specific or specification-based processing. Apache NiFi is used to automate and handle the flow of information. Figure 3 illustrates the hardware specifications and configuration of the proposed cluster.
The proposed setup consisted of four machines, one master node, and three slave nodes. The master node handles coordination among services and maintains the necessary metadata. The slave node is used to store the block data and execute assigned tasks. In particular, the master node had an eight-core central processing unit (CPU), 16 GB memory, and a 2 × 4 TB disk with RAID1. Master nodes record the metadata of all the blocks stored in the HDFS, which is critical. The failure of the disk can result in the loss of all data. Hence, a minimum RAID1 is required for the master node. In addition, other redundant arrays of independent disks (RAIDs) can be applied, such as RAID5 and RAID 10, for improved performance. The other three slave nodes had the following specifications: eight-core CPU 8, 16 GB memory, and 3 × 4 TB disk with no RAID. With the three slave nodes, the HDFS replication value should be set as two. Moreover, a 64-bit version of CentOS 7.0 is recommended for production.
The total capacity of the cluster is as follows: 24 cores, 48 GB memory, and 36 TB storage. It is capable of performing a maximum of 20 tasks simultaneously. Several CPU cores are reserved for the operating system. The version of Apache Hadoop used was 2.7.3, and the version of Hive was 2.1.0.

4.4. An Analysis Tool: Mobipack

Mobipack is an open-source software under the MIT license. It consists of three main packages, namely, a standalone package, Apache Hadoop package, and indicator series. A standalone package is a set of software/tools used for analyzing CDR data, including anonymization, pre-processing, interpolation, and visualization. It runs in a standalone mode or a regular computer with multi-thread support for large data sizes. An Apache Hadoop package is designed based on the Apache Hadoop platform for more rapid processing and scalability support, thus allowing it to support a large amount of data. The package consists of a set of tools written in Python and Java for analyzing CDR data, including a simple statistics calculation, frequent location, zone-based aggregation, and histogram. The analysis includes visualization (with reports and processed data compatible with other visualization platforms), the determination of the origin–destination (OD), and route interpolation. The indicator series was developed to analyze specific application domains that require a particular set of useful indicators. The experts in these domains can utilize such indicators for further analysis. The details of the essential modules and their algorithms are presented in the following sections. The summaries of the functions and their use cases are shown in Table 2.

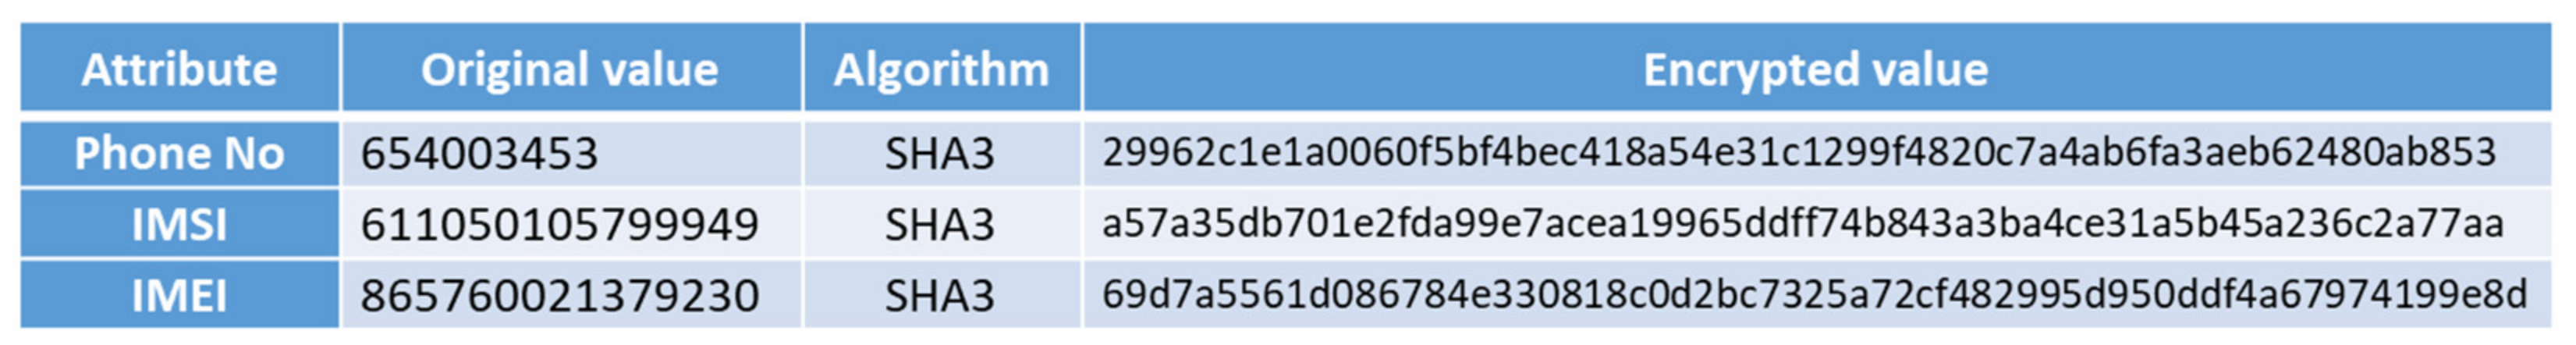
4.4.1. Anonymization Software

Mobipack [40] is a tool for anonymizing identifiable values in data such as the IMEI, IMSI, and mobile number. It is a Java application that can be run in any operating system, and supports running anonymization with multiple threads to accelerate the process. Using a machine with a graphics processing unit (GPU) increases the speed of encoding. Figure 4 presents an example of the input and output after running anonymization. In principle, the programs receive raw CDR data in the CSV format as inputs. Thereafter, anonymization is initiated using the “SHA3-256” algorithm recommended by GSMA [41]. Additionally, “Salt file” is applied as a complementary text to enhance security.

4.4.2. Cell Tower Mapping Tool

Call detail record data only include the location area code (LAC) and cell identification (ID), and not geographic coordinates. The LAC is a location area code, which is a group of cell towers. Cell ID refers to the cell number or that of a sector. The analysis of mobility using CDR data requires the geographic coordinates of cell towers, which are included in the cell tower data. The cell tower data are composed of the LAC, Cell ID, and geographic coordinates. Hence, mobility analysis can be performed by mapping the LAC and Cell ID of the two datasets as keys. Table 3 presents the mapping components of the two datasets.

4.4.3. Statistical Data for Quality Assurance

In general, CDR datasets contain missing data and anomalous values. Therefore, it is necessary to verify their prior use. For example, the dataset may contain missing data of a given day or significantly fewer data than other days. Moreover, data filtering is required, as the dataset may contain non-human IDs such as gateways and roaming IDs, which have significantly higher usages than ordinary people [21]. Hence, to ensure data quality, the items indicated in Table 4 were calculated as fundamental statistics and used as the thresholds for filtering.

4.4.4. Frequent Locations

Frequency-based analysis is one of the common approaches used to estimate significant locations such as home locations from CDR data [42]. The frequent location tool is used as a proxy for the preferred or commonly visited locations of a user. Mainly, these locations include homes and workplaces. An additional location may be a shopping mall, fitness center, or family house. In the case of the CDR data, the location is the cell tower location. For each unique subscriber ID, the data are counted for each cell tower location and ranking. The top list, which covers 90% of the data points, is recorded as the frequent locations. To specifically identify homes and workplaces, the same computation concept can be applied with the filtering of data with respect to the daytime or night-time [21].

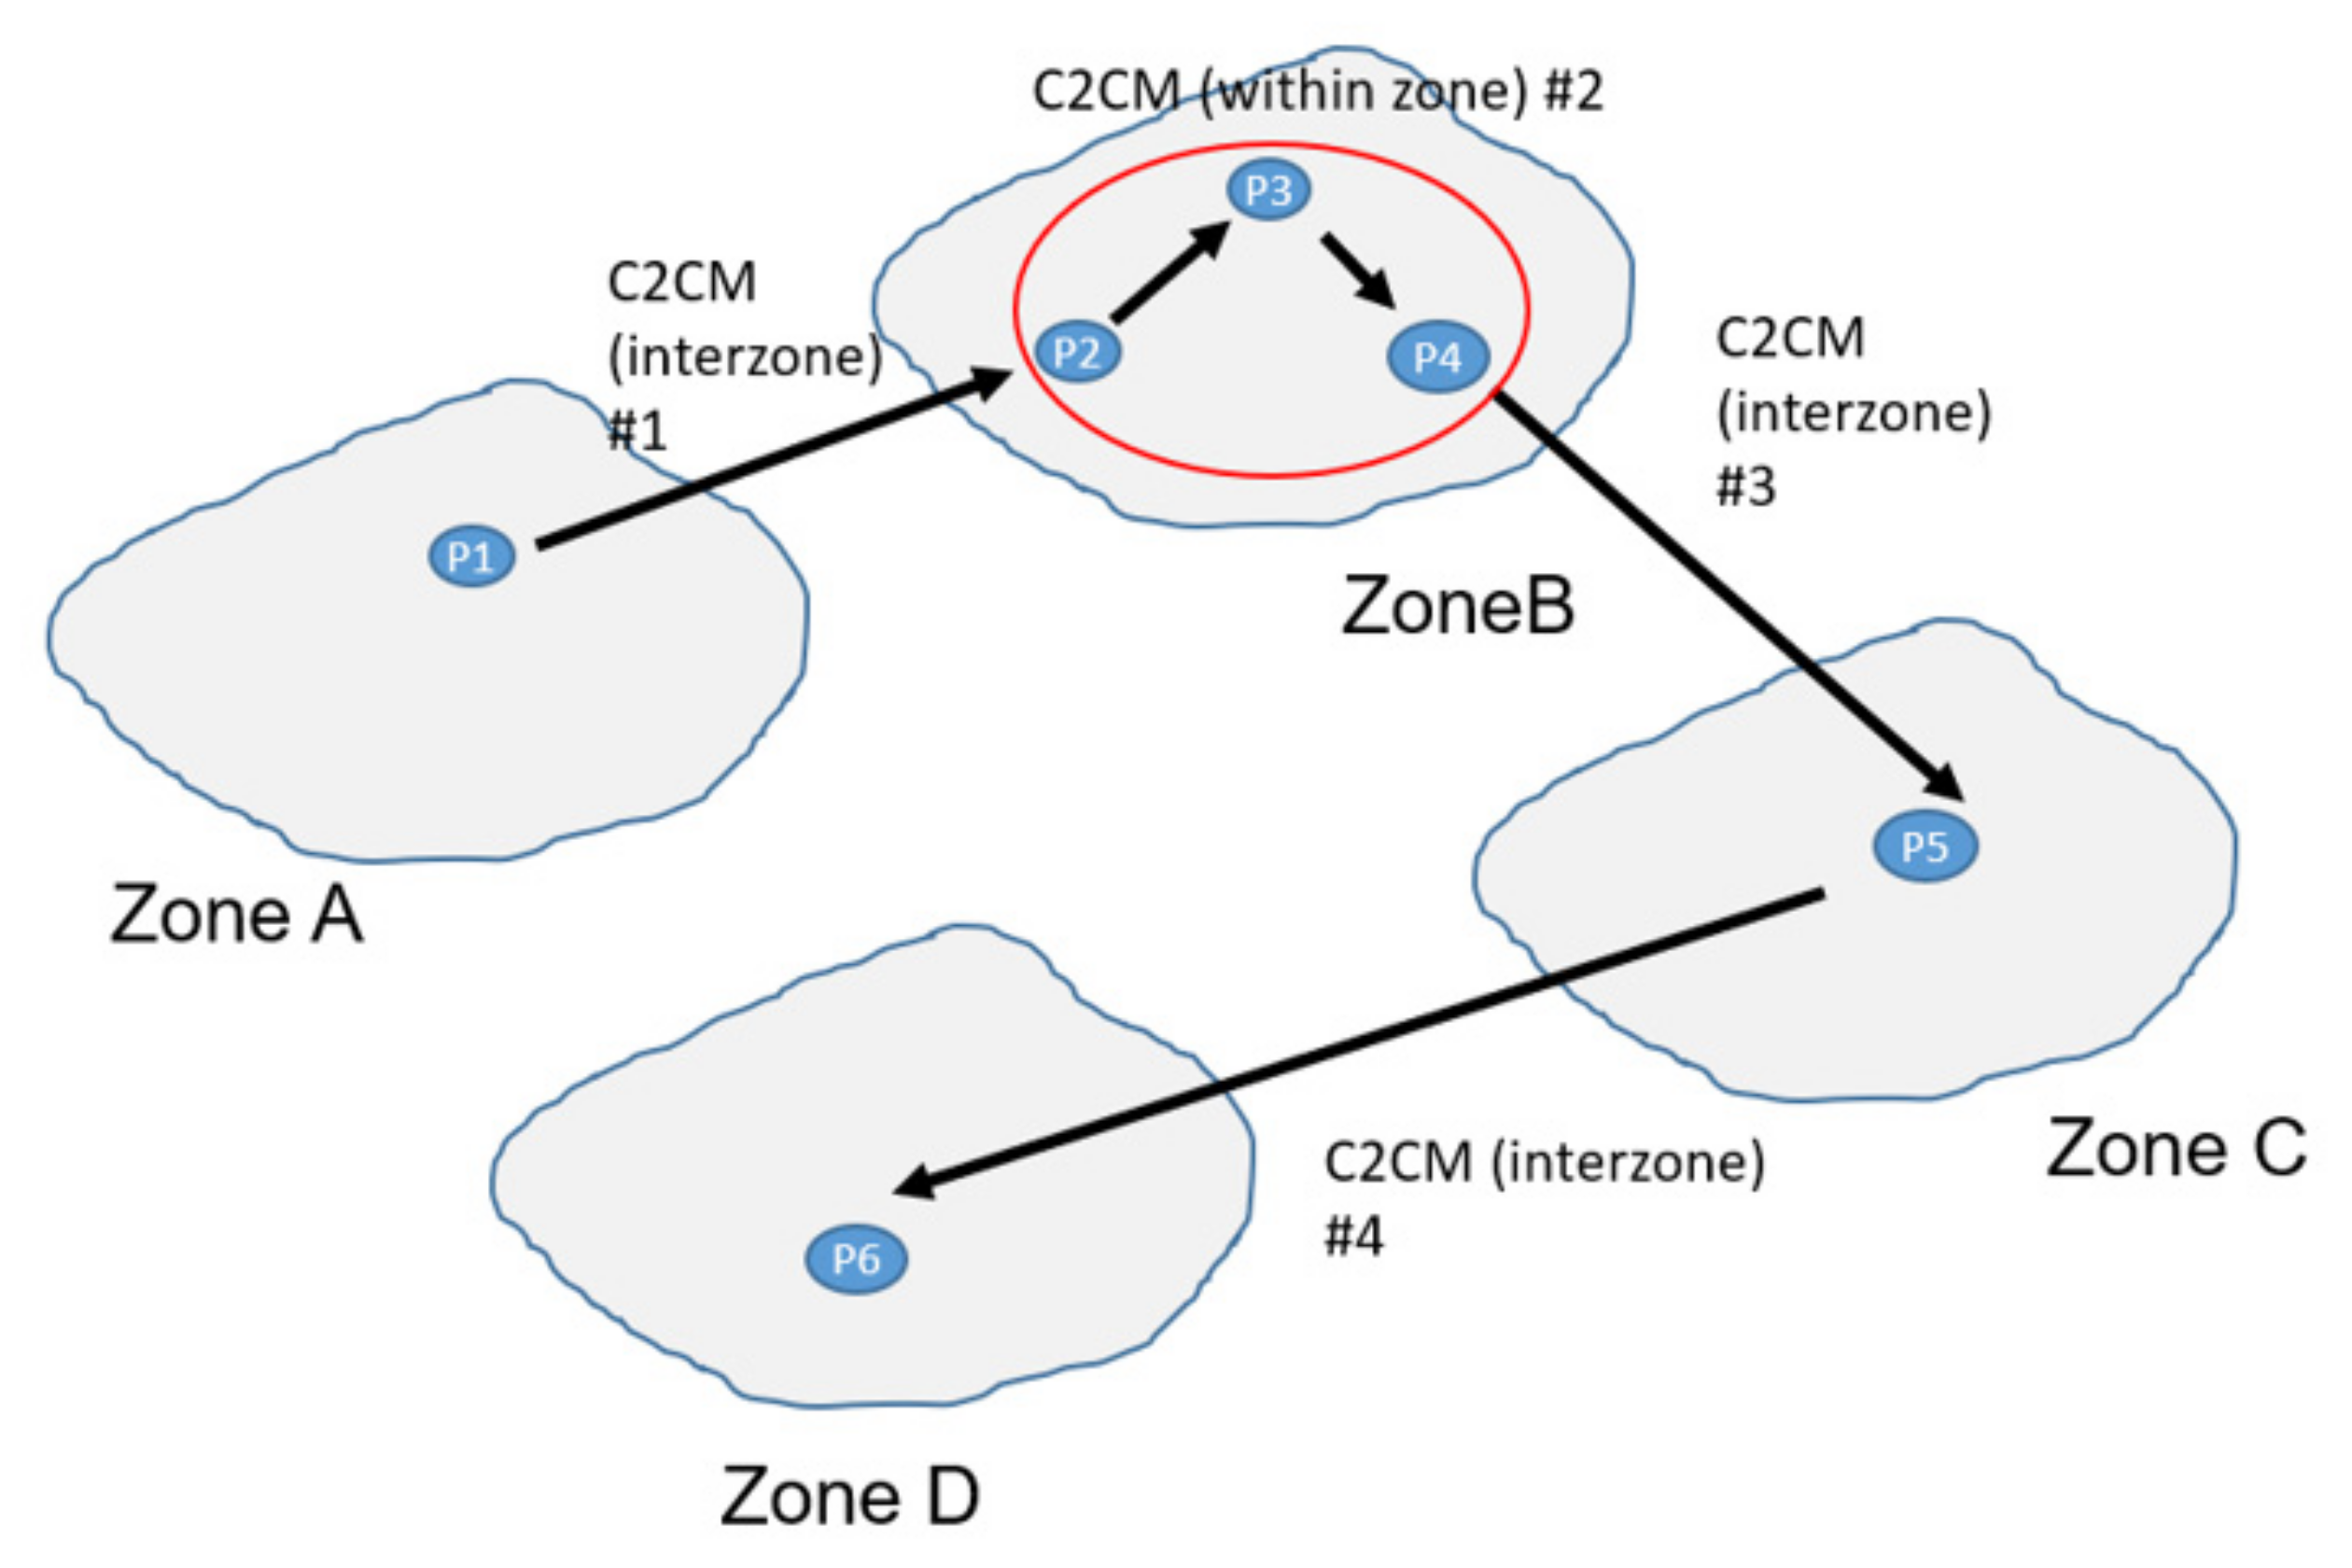
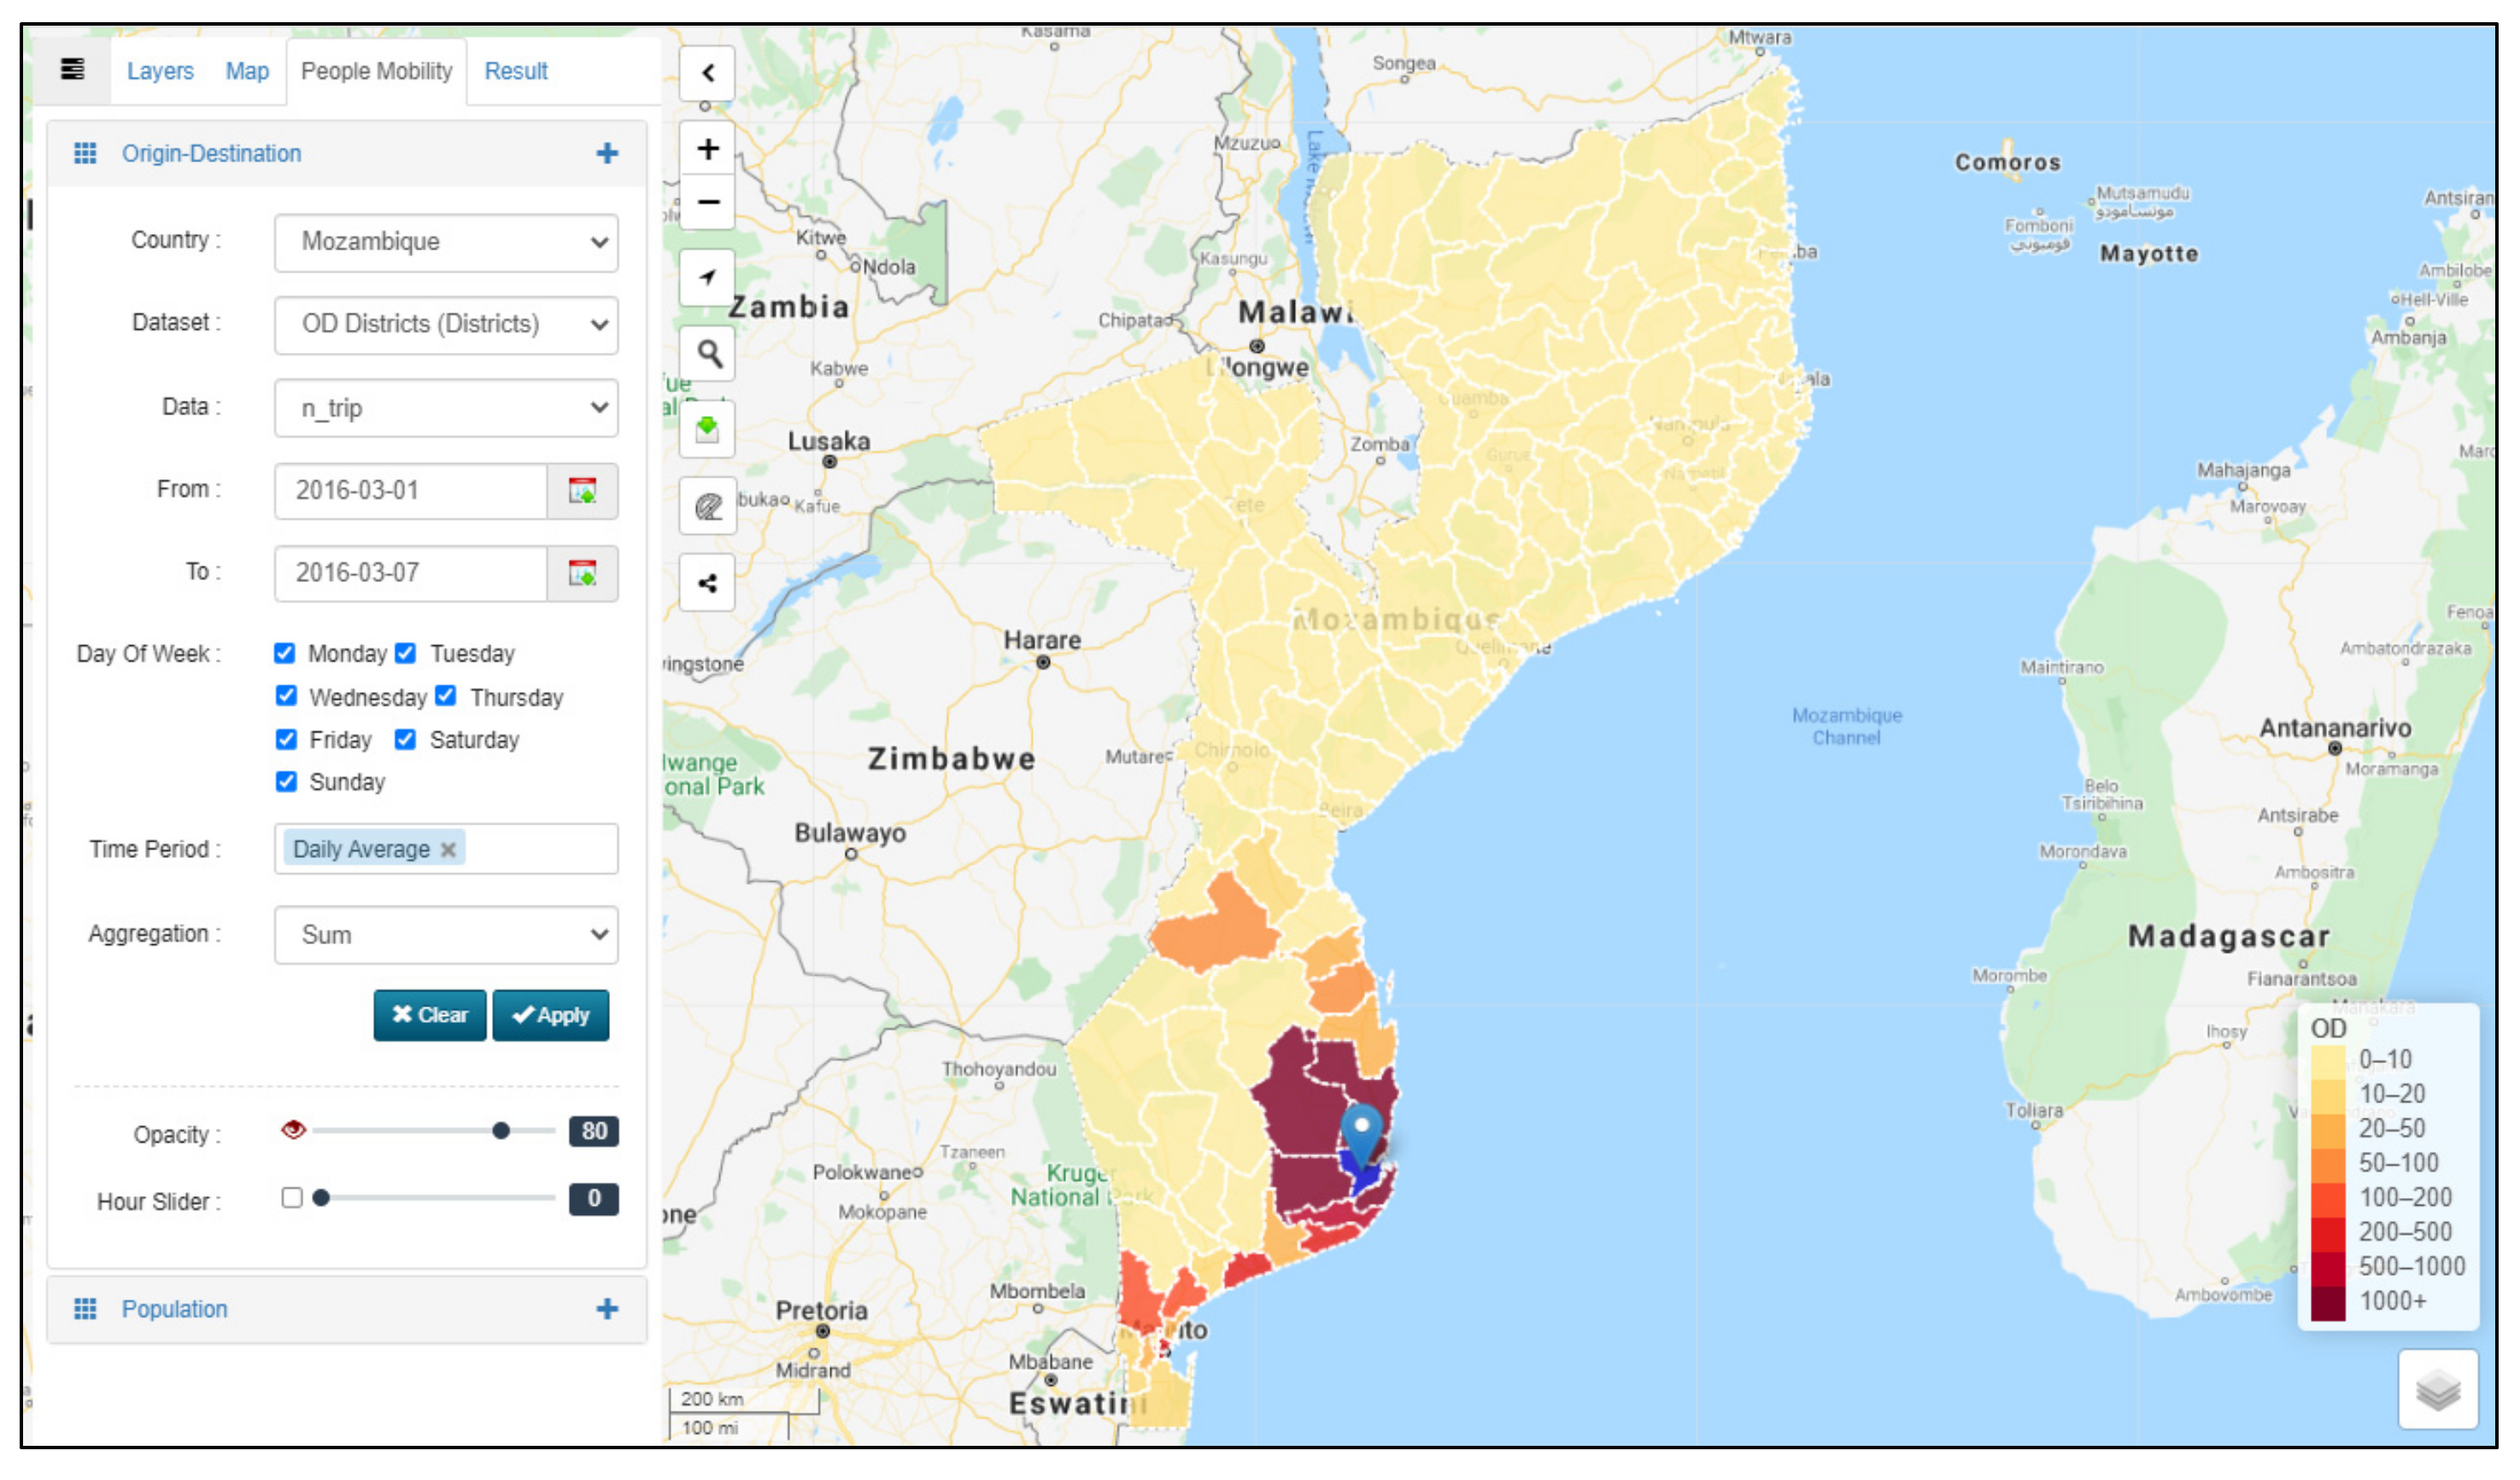
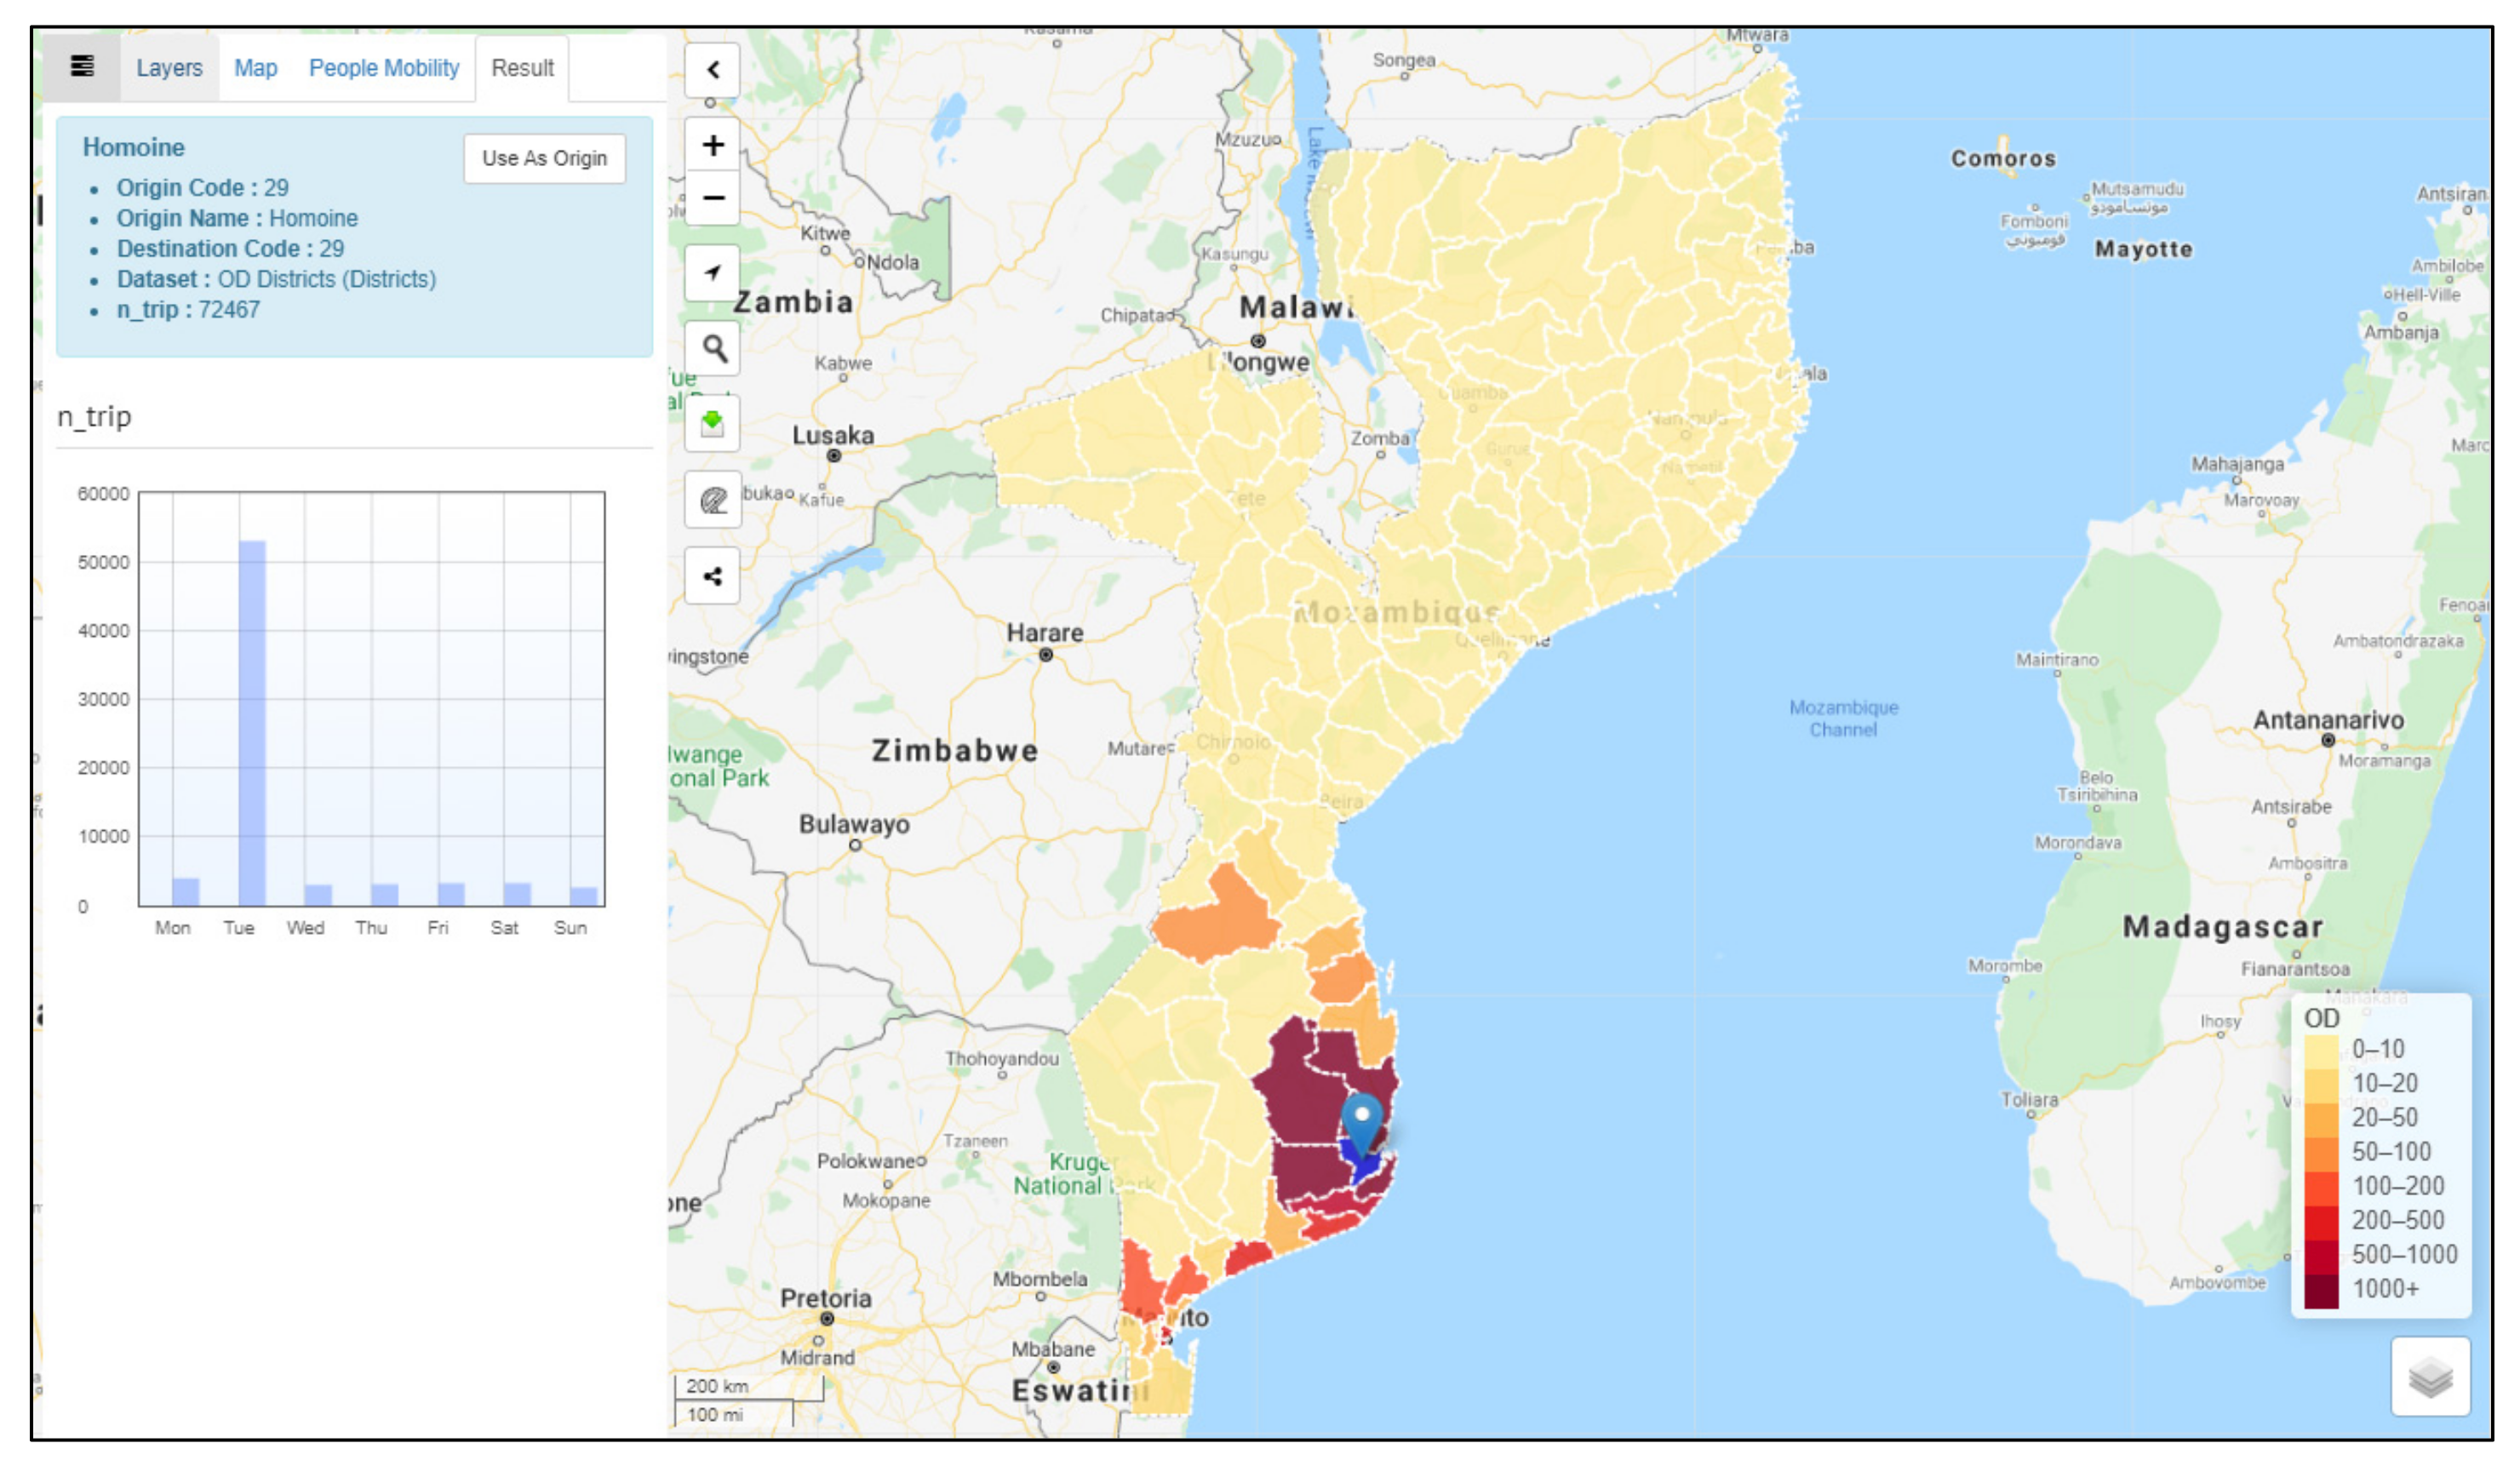
4.4.5. Origin–Destination

Origin–destination matrices were developed based on the trip distributions [43]. First, we calculated the movement between consecutive observations based on the administrative area (zone) for each identifier. We then calculated the time elapsed at the origin and time elapsed at the destination for each trip. Thereafter, for each day, we summed all the people travelling from Zone X to Zone Y, the average time elapsed in Zone X before moving further, and the time elapsed in Zone Y after arriving. We refer to this technique as the call-to-call movement (C2CM). Figure 5 illustrates the technique described above.

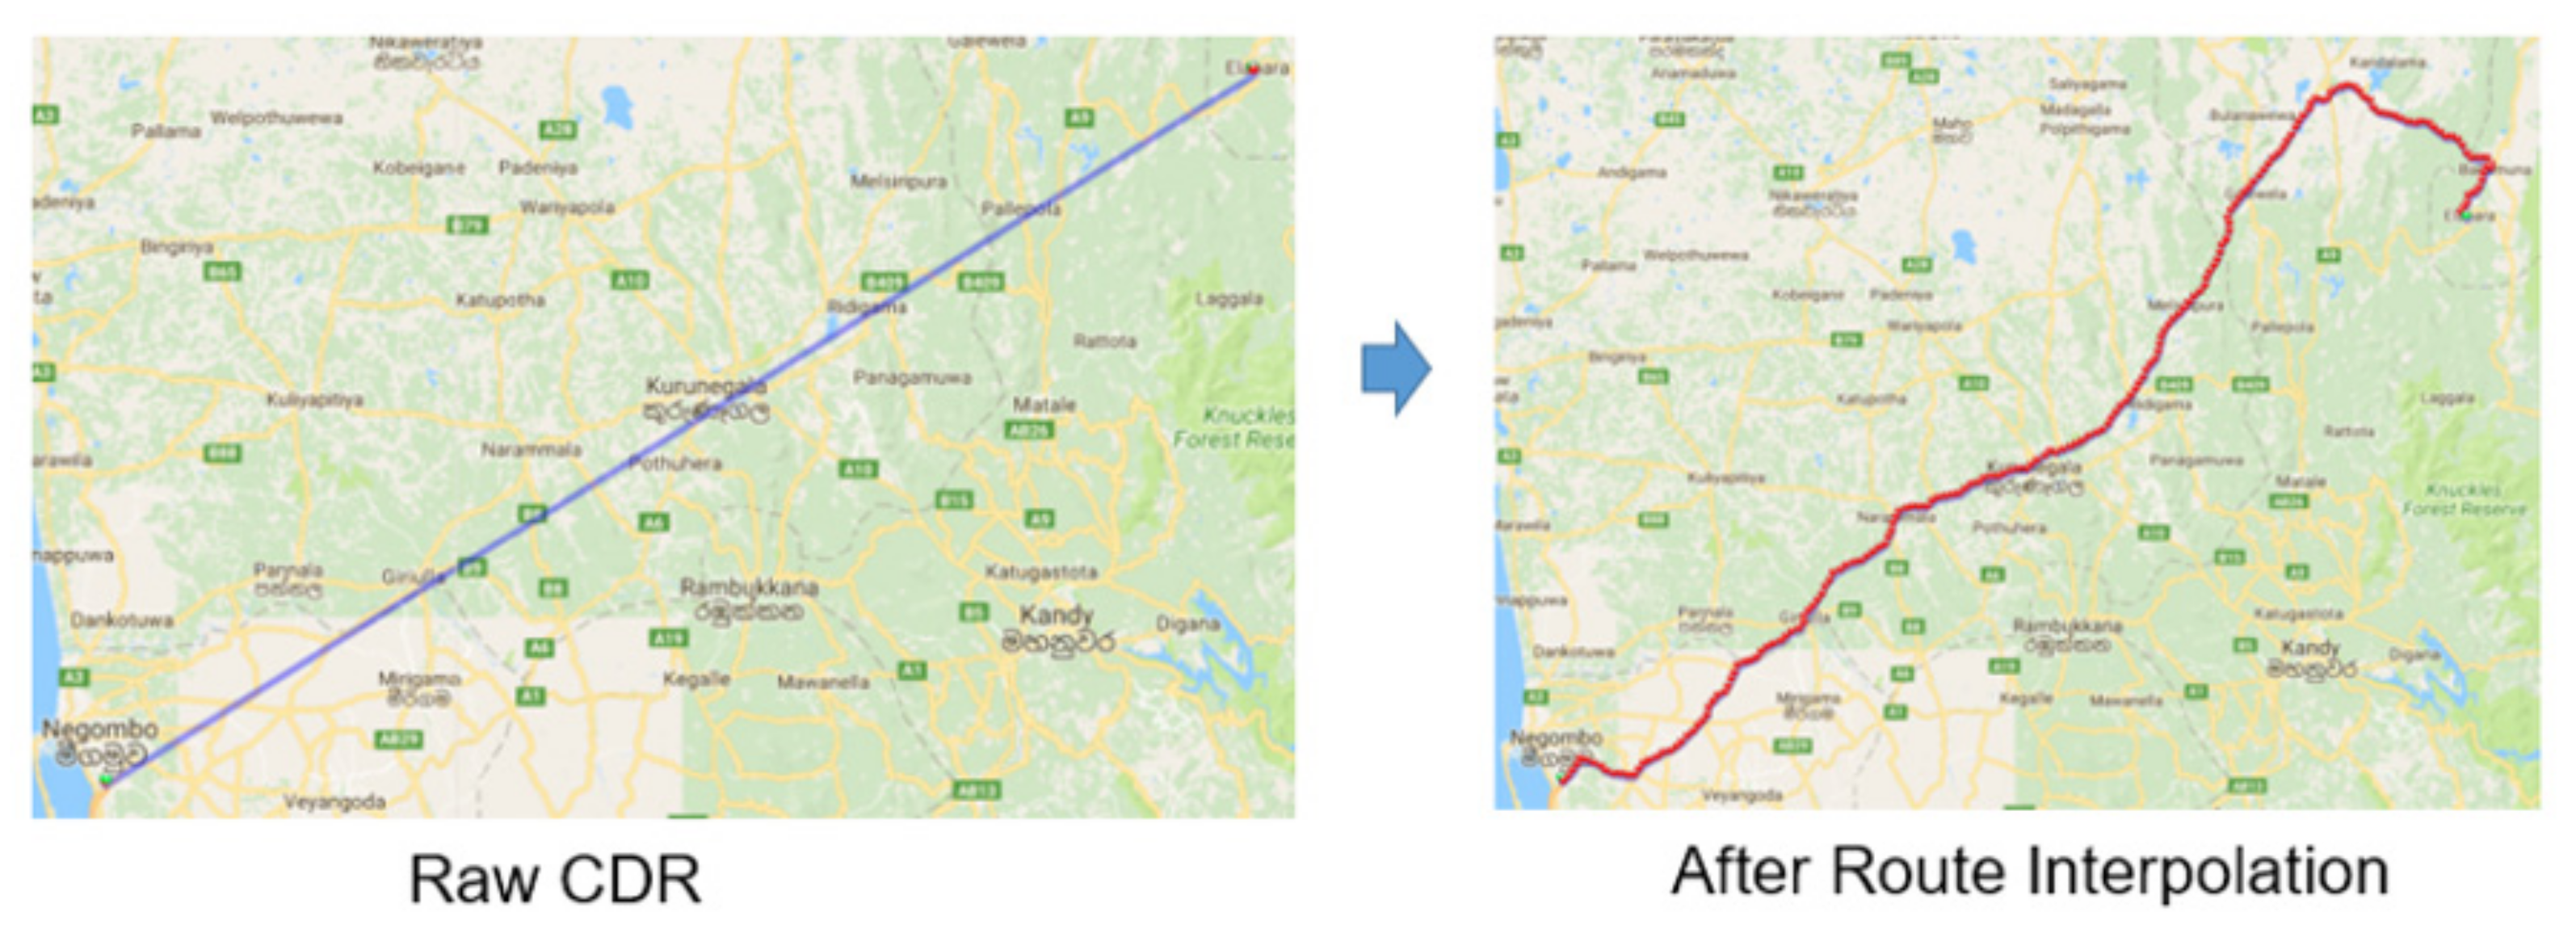
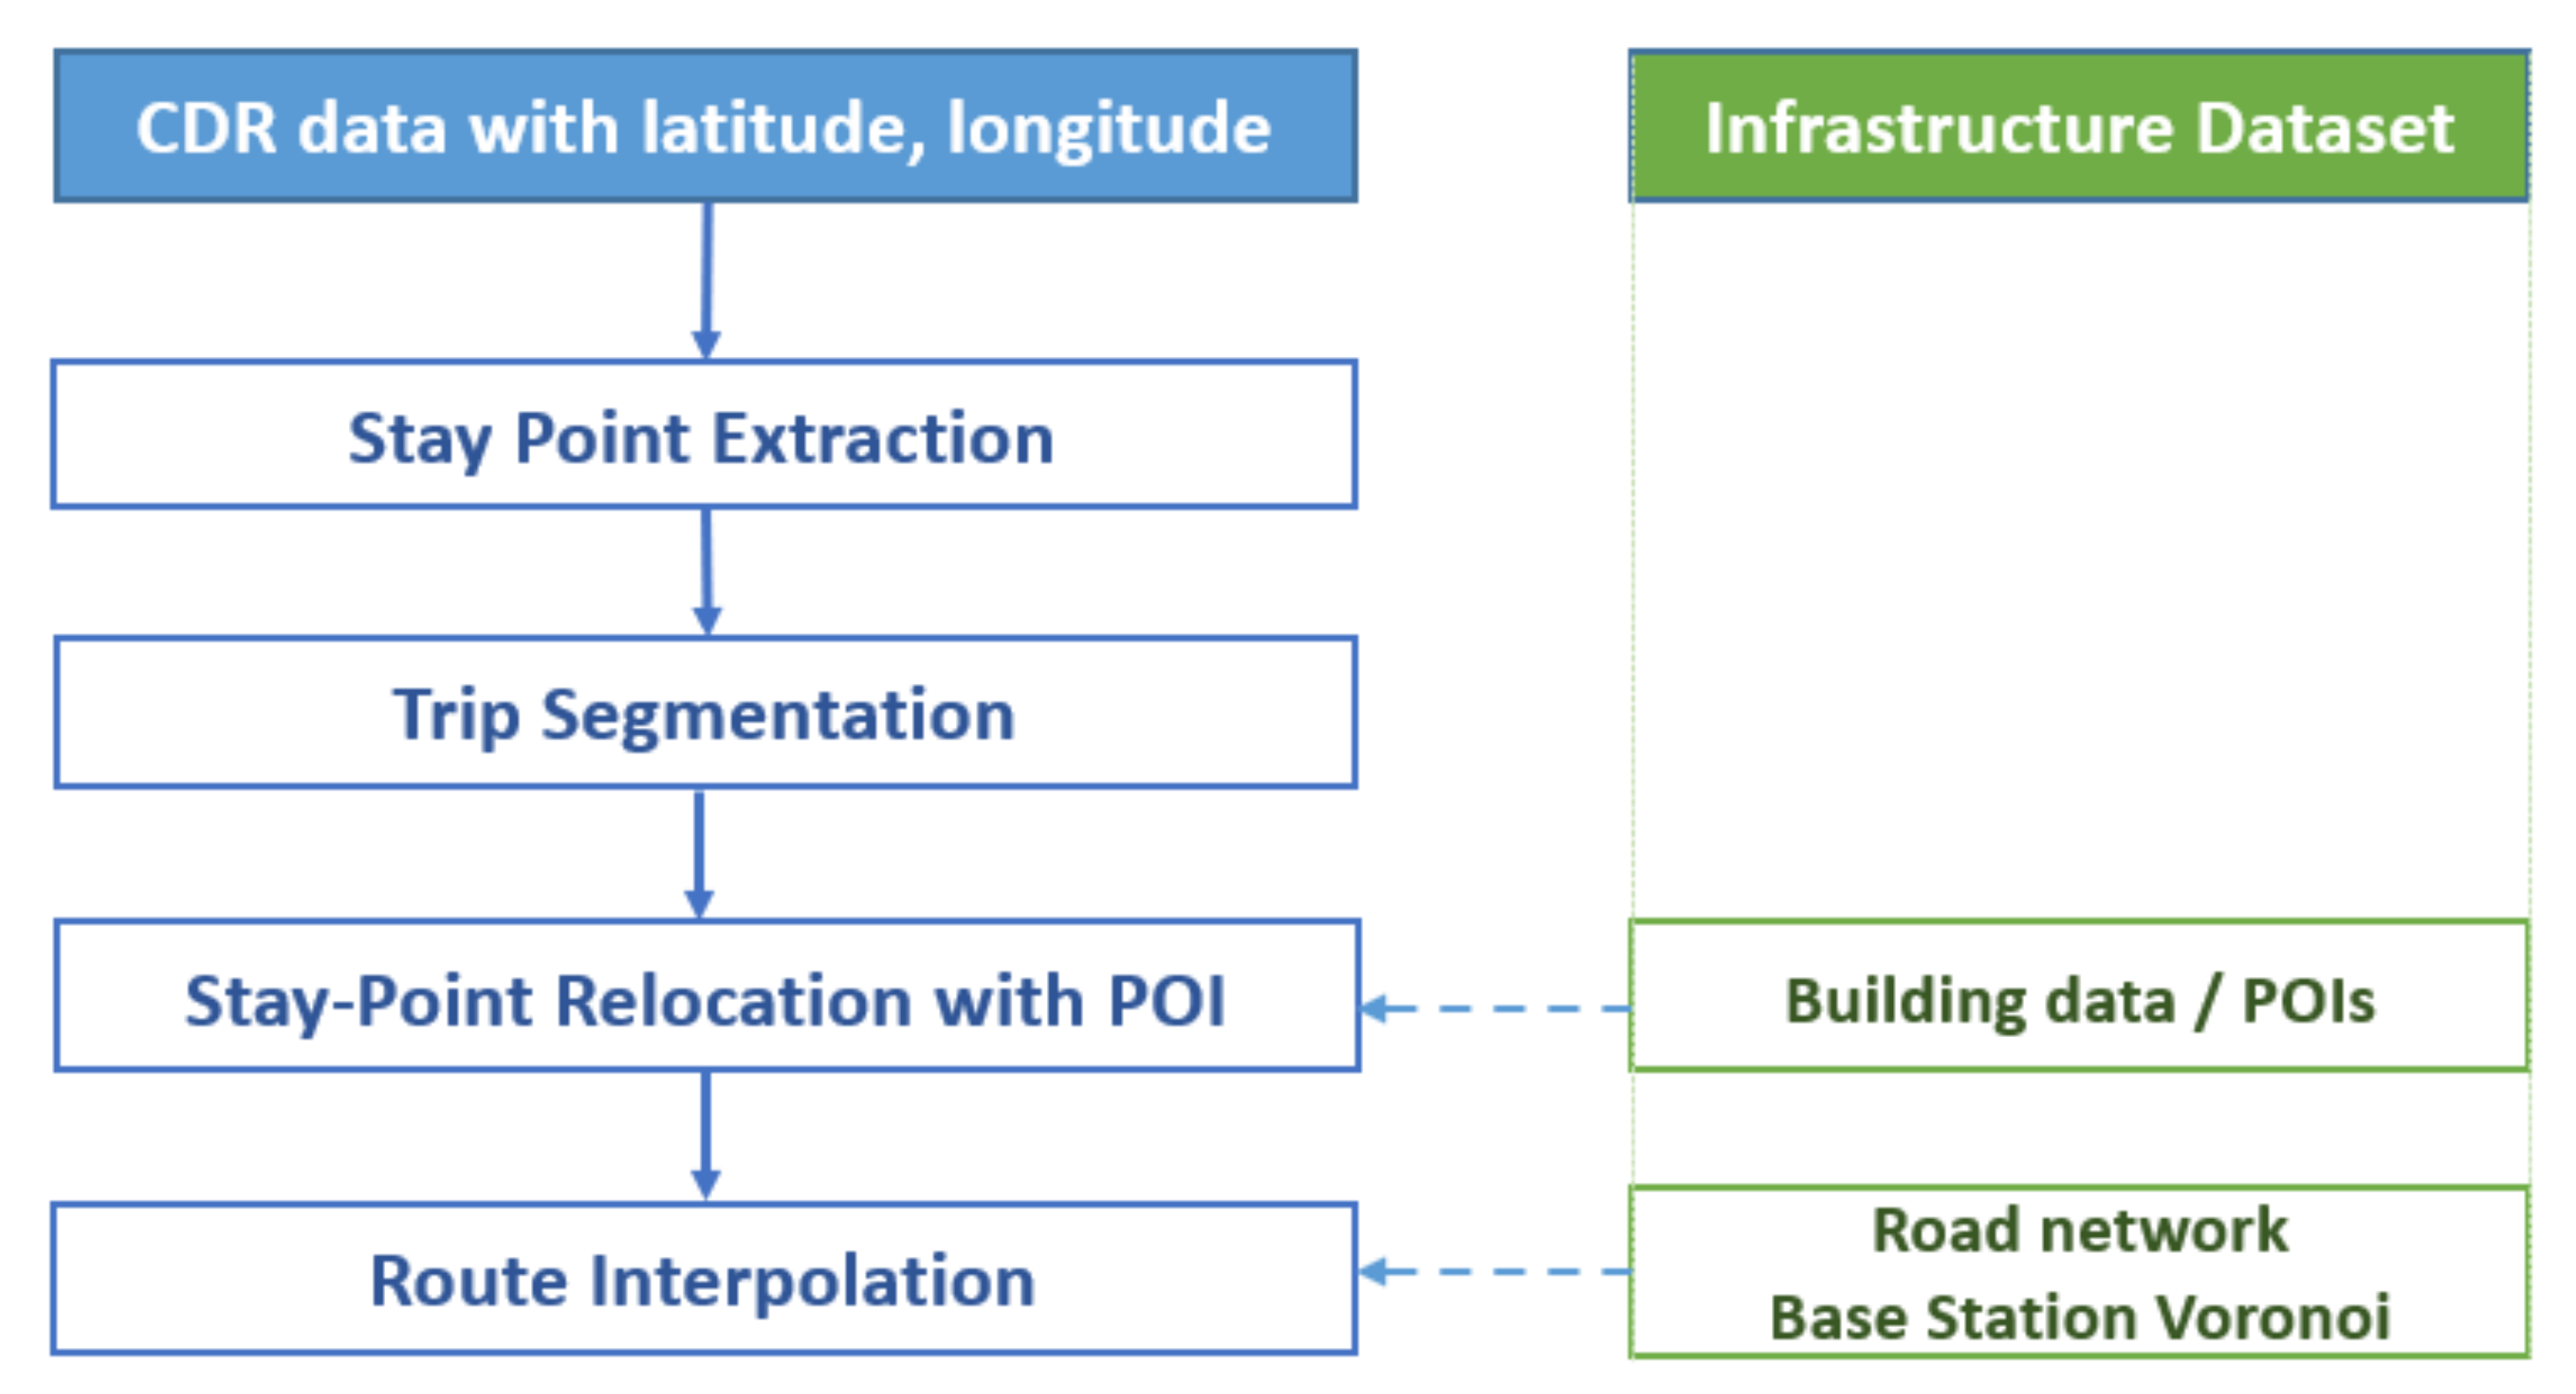
4.4.6. Route Interpolation

Call detail record data are generated according to the usage of mobile phones, e.g., making a call, sending an SMS, and using the Internet. Hence, there are no data when there is no activity on mobile phones, thus resulting in missing movement information. Route interpolation facilitates the recovery of missing data by accommodating road networks using interpolation techniques. We utilized the algorithm developed by Kanasugi et al. [44], which they assessed using CDR and GPS logs obtained in an experimental survey in which the average distance between the estimated routes and GPS logs per examinee was approximately 1.8 km. We ported the code to the Hadoop platform to support large-scale processing. Figure 6 presents an example of a trip estimation based on raw CDR data and after conducting route interpolation.
As illustrated in Figure 7, route interpolation contains four steps: stay-point extraction, trip segmentation, stay-point relocation with point-of interest (POI), and route interpolation with a transportation network. Stay-point extraction is used to extract stay points from trajectory data, to distinguish between a commute trip and a stationary subject.
Stay-point extraction is based on the spatial and temporal values of the points. In the algorithm, a stay point represents a geographic region that a user occupies for a period of time. The space distance and the time difference between the observed points are applied to detect stay points, as expressed by the following constraints. Distance (pstart, pend) < Dthreh, TimeDiff (pstart, pend) > Tthreh, where Dthreh and Tthreh are adjustable parameters. Moreover, Dthreh is the maximum distance that covers a region considered as a stay point, and Tthreh is the minimum time that users spend in the same location. After extraction, the stay points are used as base data to separate the stay and move segments in the trip-segmentation step.
Stay-point relocation involves the relocation of stay points from the previous step to the surrounding POIs with a given probability. This is because the location of the CDR is based on the cell tower location, which implies that all users in the same area have the same exact location. The reallocation process can lead to a more accurate distribution of people, given that the area distribution of POIs can be considered as that of a human settlement, to which locations of people are re-assigned. This step fills the gaps between stay/move segments, to ensure that each trip covers a 24 h period. It should be noted that POIs can be extracted from building distributions obtained from OpenStreetMap (OSM) data.
A route between every pair of relocated stay points is interpolated by searching the shortest path algorithm for the interpolation step. The interpolation process requires additional data, including the road network and the base station Voronoi data [5]. The road can be extracted from the OSM data, similar to POIs. However, it requires an intensive clean-up process, which can be performed in Mobipack. The results are trajectory data with fixed intervals.

4.4.7. Indicator Series: Mobility Indicators

There is a Python program for generating a set of standardized indicators proposed by the World Bank COVID-19 Mobility Task Force [16]. The original development by the World Bank was intended to run in Databricks. Hence, we re-developed it to run in the proposed data pipeline based on the Apache Hadoop cluster, with the data persisted on the Hive table. It is composed of 11 key indicators that provide proxies at different geographic and time levels, as shown in Table 5.

4.5. Visual Analytics Toolset

We developed a web-based application with map functionality to better understand and interpret the results. It allows the user to view the results, including the origin–destination and population estimations, on the interactive map. Users can select the criteria for their views, such as the date, time, and spatial administrative level. It also supports multi-layer displays using measurement tools. We developed the system using open-source software that does not require a license fee or cost for use or replication.
The system consists of three main components: a database server, map server, and web server. PostgreSQL with PostGIS was used as a spatial database to store all the data, and to provide data to the web and map server. Geoserver is an open-source server for sharing geospatial data. It is designed for interoperability, allowing data publishing from all major spatial data sources using open standards. In addition, Geoserver supplies map data in Web Map Service (WMS)-/Web Feature Service (WFS)-to-web applications. Finally, Tomcat is an open-source web server that supports an operating system (OS). We developed a web application using Java, and used Leaflet as the map application programming interface (API). As an example, Figure 8 demonstrates the visualization of the OD on a web map with the data prepared by Mobipack. The display criteria can be selected, such as the number of trips or users over time. The blue area indicates the origin, and the other color-range areas are the main destinations of the selected origin. The dark color indicates a high volume. Users can select the destination area to view more information on the OD pair in the result tab, including the total OD by day of the week, as shown in Figure 9.

5. Results and Discussion

In this study, we used the Apache Hadoop platform and the proposed Mobipack open-source mobility package to develop a full-scale data pipeline for CDR data analysis. The pipeline provides a series of data processing steps, starting from data ingestion at the beginning of the pipeline, followed by a series of further steps, including cell tower mapping, data quality assurance, frequent-location extraction, zone analysis, origin–destination extraction, stay-point extraction, trip segmentation, and route interpolation. The proposed system generates a set of helpful outputs in CSV files at the end of the pipeline. It can be used for direct visualization or further analysis of specific domains, such as health, transportation, and internal migration. The system itself is not designed for real-time processing but for batch processing, in line with the nature of CDR data. The data are normally provided regularly, such as on a daily basis after midnight or once a week. However, once data arrive at the cluster, the pipeline will automatically handle all processes and produce output indicators.

5.1. System Implementation and Scalability

The proposed system benefits from utilizing Apache Hadoop. It can support large-scale data ranging from gigabytes to terabytes, or billions of data records. In addition, storage expansion and improvement in processing speed can be achieved by adding more machines to the cluster with minimum reconfiguration and no downtime. Scaling up by adding more memory, CPU, and storage to a machine is not a viable long-term option, particularly for data-intensive processing of CDR data, where data arrive on a daily basis with rapid growth. Hence, at some point, the machine will no longer be upgradeable, necessitating a new machine with high-end specifications, which is very expensive. Software installation and data migration will also need to take place.
The pipeline can be implemented in both a virtual environment and on physical hardware for full-scale production. For the initial setup, we recommend a minimum of four machines in a cluster with a total of 24 CPU cores, 48 GB of memory, 36 TB of storage, and 21 concurrent tasks for processing. The detailed hardware and software specifications are presented in Figure 3. As regards data, the pipeline needs CDR data and cell tower data. The daily CDR data should be provided in CSV format for easy checking. The cell tower data are used for mapping to obtain the geographic location at the cell tower level. The software used in the pipeline, including Mobipack, is open-source and available in online repositories [40]. Moreover, extension and modification can be performed with no restrictions.
For data estimation based on the data of an anonymous country, the total number of data records for one month of CDR is 800 million, with a total size of 60 GB from approximately two million subscribers. In HDFS, it requires approximately 25 GB of storage in ORC format with a replication factor of two. In total, with the stated hardware specifications, it can accommodate up to 40 months of CDR data. Some storage is reserved for temporary files during processing. Scaling out by adding one machine with the same specification, the cluster can accommodate up to another 12 months of new CDR data and an additional seven tasks for processing.
As regards functional scalability, the proposed system can be enhanced by adding new functionality according to evolving demands while ensuring the availability of ready-to-analyze data. For example, in The Gambia, the system was implemented to create an evidence base for policy design, with a focus on migration analysis. At the onset of COVID-19, the team used the existing system with some modifications to compute the mobility statistics defined for monitoring and planning under COVID-19 [45].

5.2. Performance Evaluation

We evaluated the performance of our proposed platform for each module with two data sizes (50 million and 100 million records) and 10 and 20 concurrent tasks. The hardware used for the testing was the same as the proposed hardware presented in Figure 3. The results for the data anonymization software are shown in Table 6, and the results for other Hadoop-/Hive-based software are illustrated in Table 7.

5.3. Comparison with the Existing Platforms

The proposed platform relies only on an open-source framework that allows easy implementation and high portability to the target environment. Unlike other existing platforms designed for CDR data analysis, it does not require any commercial software or subscription payments. For instance, Databricks, which is the database platform used by the WB COVID-19 mobility indicators and FlowKit, requires a paid license to run their open-source software on the full-scale dataset. Building a system solely on an open-source framework is a strong advantage in introducing a new system for developing countries where data demand is high while resources for setting up and maintaining the system are limited. In addition, our system is enhanced to accommodate other existing software, such as the WB COVID-19 mobility indicator, which was originally designed to use the Databricks database platform. It can also run on our open-source framework. This enhancement benefits potential users of CDR data as it allows them to explore different software with more choices.

5.4. Model Limitation

Nonetheless, our system has certain limitations. First, the estimation of the accuracy of the indicators is highly dependent on the number of records, especially in the estimation of origin–destination. Second, use of the proposed platform requires access to CDR data for long periods to obtain the appropriate result. However, it is very difficult to gain access to CDR data as such access requires a certain level of approval from authoritative offices such as telecom regulators. The route-interpolation process takes a relatively long time of several hours and uses only the shortest-path algorithm that covers the ordinary movement of people.

5.5. Usefulness and Applied Use Cases

Our proposed system has been implemented in various countries, including Guinea, Sierra Leone, Liberia, Mozambique, Angola, Rwanda, and The Gambia. In these countries, we worked closely with the relevant regulatory authority that has the authority to access and accommodate the data for public purposes. In accordance with national regulatory requirements, the regulator set up a secure server where all data were stored on-premise on a dedicated server. CDR data were anonymized before being transferred to the system. Only aggregated statistics are shared with the third party to protect data privacy adhering to the principle of privacy protection recommended by the United Nations [12]. Once the system and data were in place, the system could be used for the analysis of various domains, including health, poverty, migration, transportation, population statistics, and even policy design. For example, the system was implemented to demonstrate how analyzed CDR data can address specific issues associated with Ebola epidemics by estimating the dynamic trajectories, spatiotemporal distribution, and transboundary movement of people in Guinea, Sierra Leone, and Liberia [35,46,47]. In Mozambique, it was employed for transport studies and urban planning [48]. Thereafter, it was adapted to enable rapid analysis to understand changes in mobility patterns during COVID-19 [12]. In The Gambia, the system was initially implemented for internal migration analysis. Then, it was applied for monitoring and planning under COVID-19 [45]. In Angola and Rwanda, the system was used for hotspot detection and contact tracing during the COVID-19 pandemic. In addition, in Rwanda, the system was additionally applied to assess the impact of COVID-19 on public transportation [49].

5.6. Challenges of CDR Data

Although the application of CDR data has great potential for various domains, there are still challenges. While the population coverage of CDR data is much higher than that of an ordinary survey, the challenge of population representativeness still remains. CDR data represent populations who subscribe to mobile network services. Males and the wealthy are more likely to own phones; children and the elderly are underrepresented in the data [17,19]. These biases can be mitigated by combining information on phone ownership from surveys if available [22].
Data access is also a major challenge. CDR data exist in any country or region where mobile network services are available, but coordination and negotiation for accessing the data takes time. An alternative option could be statistical data provided by the private sector which are made available to support humanitarian activities. For example, following the onset of COVID-19, Google LLC released the COVID-19 Community Mobility Reports that chart movement trends over time by geography across different categories of places. Meta Platforms, Inc. shares various maps through the Facebook Data for Good platform. It provides mobility metrics which are designed to indicate changes in movement and staying put. These data can be useful for demonstrating the usefulness of mobility data such as CDR data to enable consensus among stakeholders and accelerate negotiations.
Spatial resolution sometimes limits the accuracy of the analysis. Unlike GPS data, the geolocation of CDR data is based on the location of the cell tower, which does not provide the exact position of the device. Location accuracy fluctuates within a range of hundreds of meters at the maximum in urban areas, while it can be up to several kilometers in rural areas. This can be mitigated by incorporating information from other data sources mentioned above. As these datasets are based on more frequent and granular data, they can be used to complement and enhance the results of CDR data analysis.

6. Conclusions

Timely and reliable data are critical for informing decision making, particularly in disaster contexts such as national disasters or the COVID-19 pandemic. Moreover, they can be used to monitor and evaluate scenarios. The CDR data of mobile phones allow for the dynamics of human mobility to be captured with timestamps and location information at the national scale, without the installation of additional applications. This paper proposes a data pipeline with an open-source mobility analysis package that allows for full-scale CDR data processing from raw data to the indicator results and visualization. Furthermore, detailed system transfer instructions were prepared and made available through an open repository, namely, GitHub. Thus, it can be readily implemented on the premise of the data analysis partner in the target country. The proposed system is expected to be used in a sustainable manner, and was developed based on open-source frameworks. Moreover, it can be used after the completion of a project where the system is introduced. Capacity development plays a significant role in fostering the sustainability of such initiatives. For example, in the abovementioned cases, training was provided by the engineers of the ICT regulator. Moreover, this confirms that the development of such a system contributes to preparedness and decision making.
As future research, we aim to extend the capability of our data pipeline by adding more features such as road traffic estimation, demographic attribute estimation, and computing radius of gyration. Furthermore, we would like to extend the use of the pipeline to more use cases, such as in urban planning and internal migration.

Author Contributions

Conceptualization, Apichon Witayangkurn and Ayumi Arai; methodology, Apichon Witayangkurn and Ayumi Arai; software, Apichon Witayangkurn; investigation, Apichon Witayangkurn; writing—original draft preparation, Apichon Witayangkurn and Ayumi Arai; writing—review and editing, Apichon Witayangkurn and Ayumi Arai; supervision, Apichon Witayangkurn and Ryosuke Shibasaki; project administration, Apichon Witayangkurn, Ayumi Arai and Ryosuke Shibasaki. All authors have read and agreed to the published version of the manuscript.

Funding

This research was partially funded by the Japan Society for the Promotion of Science, 20K10447, and the Japan Science and Technology Agency, JPMJAS2019.

Acknowledgments

The authors are grateful to Hiroshi Kanasugi and Satoshi Ueyama for their support in developing open-source algorithms at the time of their work at the University of Tokyo.

Conflicts of Interest

The authors declare no conflict of interest.

References

  1. Gomez, T.P.; Lokanathan, S. Leveraging big data to support measurement of the sustainable development goals. SSRN Electron. J. 2017, 1, 1–14. [Google Scholar] [CrossRef]
  2. Kishore, N.; Kiang, M.V.; Engø-Monsen, K.; Vembar, N.; Schroeder, A.; Balsari, S.; Buckee, C.O. Measuring mobility to monitor travel and physical distancing interventions: A common framework for mobile phone data analysis. Lancet Digit. Health 2020, 2, E622–E628. [Google Scholar] [CrossRef]
  3. ITU. Measuring Digital Development: Facts and Figures 2020; ITU Publication: Geneva, Switzerland, 2020. [Google Scholar]
  4. Olle, J.; Rein, A.; Frank, W. Understanding monthly variability in human activity spaces: A twelve-month study using mobile phone call detail records. Transp. Res. Part C: Emerg. Technol. 2014, 38, 122–135. [Google Scholar]
  5. Rien, A.; Anto, A.; Antti, R.; Ülar, M.; Siiri, S. Evaluating passive mobile positioning data for tourism surveys: An Estonian case study. Tour. Manag. 2008, 29, 469–486. [Google Scholar]
  6. González, M.C.; Hidalgo, C.A.; Barabási, A.L. Understanding individual human mobility patterns. Nature 2008, 453, 779–782. [Google Scholar] [CrossRef]
  7. United Nations. The Sustainable Development Goals Report 2020; United Nations Publications: New York, NY, USA, 2020. [Google Scholar]
  8. UN Global Working Group on Big Data for Official Statistics. Handbook on the Use of Mobile Phone Data for Official Statistics; United Nations Publications: New York, NY, USA, 2019. [Google Scholar]
  9. Bachir, D.; Khodabandelou, G.; Gauthier, V.; Yacoubi, M.E.; Puchinger, J. Inferring dynamic origin-destination flows by transport mode using mobile phone data. Transp. Res. Part C Emerg. Technol. 2019, 101, 254–275. [Google Scholar] [CrossRef] [Green Version]
  10. Buckee, C.O.; Wesolowski, A.; Eagle, N.N.; Hansen, E.; Snow, R.W. Mobile phones and malaria: Modeling human and parasite travel. Travel Med. Infect. Dis. 2013, 11, 15–22. [Google Scholar] [CrossRef] [Green Version]
  11. Bengtsson, L.; Lu, X.; Thorson, A.; Garfield, R.; Schreeb, J.V. Improved response to disasters and outbreaks by tracking population movements with mobile phone network data: A post-earthquake geospatial study in Haiti. PLoS Med. 2011, 8, e1001083. [Google Scholar] [CrossRef]
  12. Ronald, J.; Kovacs, K.; Esko, S.; Saluveer, E.; Sõstra, K.; Bengtsson, L.; Li, T.; Adewole, W.A.; Nester, J.; Arai, A.; et al. Guiding Principles to Maintain Public Trust in the Use of Mobile Operator Data for Policy Purposes. Data Policy 2021, 3, E24. [Google Scholar] [CrossRef]
  13. Milusheva, S.; Lewin, A.; Gomez, T.B.; Matekenya, D.; Reid, K. Challenges and opportunities in accessing mobile phone data for COVID-19 response in developing countries. Data Policy 2021, 3, e20. [Google Scholar] [CrossRef]
  14. Ayumi, A.; Witayangkurn, A.; Kanasugi, H.; Fan, Z.; Ohira, W.; Cumbane, S.P.; Shibasaki, R. Building a data ecosystem for using telecom data to inform the COVID-19 response effort. In Proceedings of the 5th International Data for Policy Conference 2020, London, UK, 15–17 September 2020. [Google Scholar]
  15. Flowminder. FlowKit. Available online: https://github.com/Flowminder/FlowKit (accessed on 1 August 2021).
  16. The COVID19 Mobility Task Force. COVID-Mobile-Data. Available online: https://github.com/worldbank/covid-mobile-data (accessed on 1 August 2021).
  17. Wesolowski, A.; Eagle, N.; Noor, A.M.; Snow, R.W.; Buckee, C.O. The impact of biases in mobile phone ownership on estimates of human mobility. J. R. Soc. Interface 2013, 10, 20120986. [Google Scholar] [CrossRef] [PubMed]
  18. Couper, M.P. Is the sky falling? New technology, changing media, and the future of surveys. Surv. Res. Methods 2013, 7, 145–156. [Google Scholar]
  19. Deville, P.; Linard, C.; Martin, S.; Gilbert, M.; Stevens, F.R.; Gaughan, A.E.; Tatem, A.J. Dynamic population mapping using mobile phone data. Proc. Natl. Acad. Sci. USA 2014, 111, 15888–15893. [Google Scholar] [CrossRef] [PubMed] [Green Version]
  20. Liu, Y.; Sui, Z.; Kang, C.; Gao, Y. Uncovering patterns of inter-urban trip and spatial interaction from social media check-in data. PLoS ONE 2014, 9, e86026. [Google Scholar] [CrossRef]
  21. Rein, A.; Siiri, S.; Olle, J.; Erki, S.; Margus, T. Using Mobile Positioning Data to Model Locations Meaningful to Users of Mobile Phones. J. Urban Technol. 2010, 17, 3–27. [Google Scholar]
  22. Wilson, R.; Erbach-Schoenberg, E.Z.; Albert, M.; Power, D.; Tudge, S.; Gonzalez, M.; Bengtsson, L. Rapid and near real-time assessments of population displacement using mobile phone data following disasters: The 2015 Nepal earthquake. PLoS Curr. 2016, 8. [Google Scholar] [CrossRef]
  23. Liu, J.; Braun, E.; Düpmeier, C.; Kuckertz, P.; Ryberg, D.S.; Robinius, M.; Hagenmeyer, V. Architectural concept and evaluation of a framework for the efficient automation of computational scientific work flows: An energy systems analysis example. Appl. Sci. 2019, 9, 728. [Google Scholar] [CrossRef] [Green Version]
  24. Isah, H.; Zulkernine, F. A Scalable and Robust Framework for Data Stream Ingestion. In Proceedings of the 2018 IEEE International Conference on Big Data, Seattle, WA, USA, 10–13 December 2018; pp. 2900–2905. [Google Scholar]
  25. Liu, J.; Braun, E.; Dupmeier, C.; Kuckertz, P.; Ryberg, D.S.; Robinius, M.; Hagenmeyer, V. A Generic and Highly Scalable Framework for the Automation and Execution of Scientific Data Processing and Simulation Workflows. In Proceedings of the IEEE 15th International Conference on Software Architecture, Seattle, WA, USA, 30 April–4 May 2018; pp. 145–155. [Google Scholar]
  26. Sebei, H.; Taieb, M.A.H.; Aouicha, M.B. Review of social media analytics process and Big Data pipeline. Soc. Netw. Anal. Min. 2018, 8, 30. [Google Scholar] [CrossRef]
  27. Pervaiz, F.; Vashistha, A.; Anderson, R. Examining the challenges in development data pipeline. In Proceedings of the 2019 Conference on Computing and Sustainable Societies, Accra, Ghana, 3–5 July 2019; pp. 13–21. [Google Scholar]
  28. Omidvar-Tehrani, B.; Amer-Yahia, S. Data pipelines for user group analytics. In Proceedings of the ACM SIGMOD International Conference on Management of Data, Amsterdam, the Netherlands, 30 June–5 July 2019; pp. 2048–2053. [Google Scholar]
  29. Misale, C.; Drocco, M.; Tremblay, G.; Martinelli, A.R.; Aldinucci, M. PiCo: High-performance data analytics pipelines in modern C++. Future Gener. Comput. Syst. 2018, 87, 392–403. [Google Scholar] [CrossRef] [Green Version]
  30. Aung, T.; Min, H.Y.; Maw, A.H. Performance Evaluation for Real-Time Messaging System in Big Data Pipeline Architecture. In Proceedings of the 2018 International Conference on Cyber-Enabled Distributed Computing and Knowledge Discovery, Zhengzhou, China, 18–20 October 2018; pp. 198–204. [Google Scholar]
  31. Yang, J.; Dash, M.; Teo, S.G. PPTPF: Privacy-Preserving Trajectory Publication Framework for CDR Mobile Trajectories. ISPRS Int. J. Geo-Inf. 2021, 10, 224. [Google Scholar] [CrossRef]
  32. Abdallah, H.S.; Khafagy, M.H.; Omara, F.A. Case study: Spark GPU-enabled framework to control COVID-19 spread using cell-phone spatio-temporal data. Computers. Mater. Contin. 2020, 65, 1303–1320. [Google Scholar] [CrossRef]
  33. Qin, S.; Man, J.; Wang, X.; Li, C.; Dong, H.; Ge, X. Applying Big Data Analytics to Monitor Tourist Flow for the Scenic Area Operation Management. Discret. Dyn. Nat. Soc. 2019, 2019, 8239047. [Google Scholar] [CrossRef] [Green Version]
  34. Novović, O.; Brdar, S.; Mesaroš, M.; Crnojević, V.N.; Papadopoulos, A. Uncovering the Relationship between Human Connectivity Dynamics and Land Use. ISPRS Int. J. Geo-Inf. 2020, 9, 140. [Google Scholar] [CrossRef] [Green Version]
  35. ITU. Call Detail Record (CDR) Analysis: Republic of Guinea; ITU Report: Geneva, Switzerland, 2017. [Google Scholar]
  36. Shangguan, B.; Yue, P.; Wu, Z.; Jiang, L. Big spatial data processing with Apache Spark. In Proceedings of the Sixth International Conference on Agro-Geoinformatics, Fairfax, VA, USA, 7–10 August 2017; pp. 1–4. [Google Scholar]
  37. Witayangkurn, A.; Horanont, T.; Shibasaki, R. Performance comparisons of spatial data processing techniques for a large-scale mobile phone dataset. In Proceedings of the 3rd International Conference on Computing for Geospatial Research and Applications, Washington, DC, USA, 1–3 July 2012; p. 1. [Google Scholar]
  38. Apache Software Foundation. Hadoop. Available online: https://hadoop.apache.org (accessed on 1 August 2021).
  39. Apache Software Foundation. Spark. Available online: https://spark.apache.org (accessed on 1 August 2021).
  40. The Mobipack Software. Spatial Data Commons. Available online: https://github.com/SpatialDataCommons (accessed on 1 August 2021).
  41. GSMA. GSMA Guidelines on the Protection of Privacy in the Use of Mobile Phone Data for Responding to the Ebola Outbreak; GSMA Guidelines: London, UK, 2014. [Google Scholar]
  42. Vanhoof, M.; Lee, C.; Smoreda, Z. Performance and sensitivities of home detection on mobile phone data. In Big Data Meets Survey Science 2020: A Collection of Innovative Methods; Wiley: Hoboken, NJ, USA, 2020; pp. 245–271. [Google Scholar]
  43. Bhandari, D.M.; Witayangkurn, A.; Shibasaki, R.; Rahman, M.M. Estimation of Origin-Destination using Mobile Phone Call Data: A Case Study of Greater Dhaka, Bangladesh. In Proceedings of the Thirteenth International Conference on Knowledge, Information and Creativity Support Systems (KICSS), Pattaya, Thailand, 15–17 November 2018; pp. 1–7. [Google Scholar]
  44. Kanasugi, H.; Sekimoto, Y.; Kurokawa, M.; Watanabe, T.; Muramatsu, S.; Shibasaki, R. Spatiotemporal Route Estimation Consistent with Human Mobility Using Cellular Network Data. In Proceedings of the 2013 IEEE International Conference on Pervasive Computing and Communications Workshops (DERCOM Workshops), San Diego, CA, USA, 18–22 March 2013; pp. 267–272. [Google Scholar]
  45. Arai, A.; Knippenberg, E.; Meyer, M.; Witayangkurn, A. The hidden potential of call detail records in The Gambia. Data Policy 2021, 3, E9. [Google Scholar] [CrossRef]
  46. ITU. Call Detail Record (CDR) Analysis: Republic of Liberia; ITU Report: Geneva, Switzerland, 2017. [Google Scholar]
  47. ITU. Call Detail Record (CDR) Analysis: Sierra Leone; ITU Report: Geneva, Switzerland, 2017. [Google Scholar]
  48. Batran, M.; Arai, A.; Kanasugi, H.; Cumbane, S.P.; Grachane, C.; Sekimoto, Y.; Shibasaki, R. Urban Travel Time Estimation in Greater Maputo Using Mobile Phone Big Data. In Proceedings of the 2018 IEEE 20th Conference on Business Informatics (CBI), Vienna, Austria, 11–14 July 2018; pp. 122–127. [Google Scholar] [CrossRef]
  49. GSMA. Utilising Mobile Big Data and AI to Benefit Society: Insights from the COVID-19 Response; GSMA Report: London, UK, 2021. [Google Scholar]
Figure 1. The overall structure of the data-analytics pipeline.
Ijgi 11 00196 g001
Figure 2. An example of the processing steps for the mobility analysis of CDR data.
Ijgi 11 00196 g002
Figure 3. Hardware and software specifications of the big data cluster.
Ijgi 11 00196 g003
Figure 4. An example of the input and output after running anonymization.
Ijgi 11 00196 g004
Figure 5. An illustration of the call-to-call movement (C2CM) technique.
Ijgi 11 00196 g005
Figure 6. An example of a trip estimation based on raw CDR data and after conducting route interpolation.
Ijgi 11 00196 g006
Figure 7. Overall steps of route interpolation.
Ijgi 11 00196 g007
Figure 8. Visualization of the OD on a web map (blue indicates the origin, and the other color-range areas are the main destinations of the selected origin).
Ijgi 11 00196 g008
Figure 9. A result of the selected destination on a web map.
Ijgi 11 00196 g009
Table 1. Feature comparison between Apache Hadoop and Apache Spark.
CriteriaApache HadoopApache Spark
Data ProcessingBatch processingBatch, real-time, streaming
Processing SpeedHighHigher by a factor of 10–100 (limited by memory)
Processing modeOn-diskIn-memory
StorageApache Hadoop Distributed File System (HDFS)Uses existing platform
ScalabilityEasily scalable by adding more nodes to the clusterSame; however, memory-intensive nodes are required
Table 2. The three main components of Mobipack 1.
ComponentsFunctionalitiesUse Cases
Standalone packageAnonymization
Stay-point extraction
Trip segmentation
Route interpolation
To be run on personal computers (PCs) with small datasets
Apache Hadoop packageCell tower mapping
Data quality assurance
Frequent locations
Zone analysis
Origin–destination matrix
Stay-point extraction
Trip segmentation
Route interpolation
For processing big data
Built as part of a data pipeline
Requires Apache Hadoop cluster
Indicator seriesMobility indicatorComputation of necessary statistics of big data
Requires Apache Hadoop cluster
Table 3. The data components of the CDR data and cell tower data.
DataCall Detail Record DataCell Tower Data
Mapping componentsLocation area code (LAC)
Cell identification (ID)
Location area code (LAC)
Cell ID
Other ComponentsAnonymized identifiers
Event timestamp
Activity type
Geographic coordinates of cell towers (latitude and longitude)
Table 4. The statistical data for data quality assurance.
No.NameUnit
1Total records, total unique identifierPer dataset
2Total records, total unique identifierPer day
3Average usage per day for each unique identifierPer dataset
4Average number of unique locations per dayPer unique identifier
5Hourly usage for each administrative zonePer weekday, weekend
6Footprint data for each administrative zone: total usage and total unique identifier.Per dataset
7Ratio of international mobile equipment identity (IMEI) to international mobile subscriber identity (IMSI)Per dataset
Table 5. The definition of indicators.
IndicatorNameUnit
1Count of all CDR dataDay/hour
2Count of unique handsetsDay/hour
3Count of unique handsetsDay
4The ratio of residents active on a given day based on those present at baselineDay
5Origin–destination matrix–trips between two regionsDay
6Residents living in the areaWeek
7Mean and standard deviation (SD) of distance traveled (from home location)Day
8Mean and standard deviation of distance traveled (from home location)Week
9Daily locations based on home region with average stay time and SD of stay timeDay
10Simple origin–destination matrix–trips between consecutive in time regions with durationDay
11Residents living in the areaMonth
Source: World Bank https://github.com/worldbank/covid-mobile-data (adjusted by author).
Table 6. Performance evaluation results for data anonymization.
ModuleNo. of Records (Million)No. of Concurrent TasksExecution Time (min)
Data Anonymization5048.10
5083.13
100413.58
10087.5
Table 7. Performance evaluation for the other Hadoop-/Hive-based software.
ModuleNo. of Records (Million)No. of Concurrent TasksExecution Time (min)
Data Preparation
(Load, Pre-process, Cleaning, Mapping)
50107.93
50204.62
1001011.62
100207.39
Data Statistics
(Daily and Summary Stats, Histogram, Zone-based Aggregation)
501030.32
502025.27
1001051.03
1002040.78
Frequent Location50103.30
50202.28
100106.84
100203.93
Origin–Destination50101.16
50201.00
100102.39
100201.37
Route Interpolation5010349.07
5020179.77
10010558.51
10020226.89
Mobility Indicators501060.60
502037.77
10010186.67
1002073.67
Route interpolation was the longest process; it required over 6 h to complete. Running all the mobility indicators would require approximately 1 h for 50 million data records. The processing time was 30–70 s per query, counting data points and unique subscribers per day.
Publisher’s Note: MDPI stays neutral with regard to jurisdictional claims in published maps and institutional affiliations.

