Article

Application of “Observation Minus Reanalysis” Method towards LULC Change Impact over Southern India

1
Disaster Prevention Research Institute, Kyoto University, Kyoto 6110011, Japan
2
Research Institute for Global Change, Japan Agency for Marine-Earth Science and Technology, Yokohama 2360001, Japan
3
Department of Geography, Delhi School of Economics, University of Delhi, Delhi 110007, India
4
Delhi School of Climate Change & Sustainability, Institution of Eminence, University of Delhi, Delhi 110007, India
5
Center for Disaster Mitigation & Management, Vellore Institute of Technology, Vellore 632014, India
6
Department of Geography, University of California Los Angeles, Los Angeles, CA 90095, USA
7
Farmneed AgriBusiness Private Limited, Salt Lake 700091, India
*
Author to whom correspondence should be addressed.
ISPRS Int. J. Geo-Inf. 2022, 11(2), 94; https://doi.org/10.3390/ijgi11020094
Submission received: 25 November 2021 / Revised: 7 January 2022 / Accepted: 24 January 2022 / Published: 27 January 2022

Abstract

:
This study performed a land use and land cover (LULC) change analysis over Southern India for the period 1981–2006 from the normalized difference vegetation index (NDVI) images of AVHRR data and applied the “observation minus reanalysis” (OMR) method to investigate the impact of the LULC change on the temperature of the region. The LULC change analysis indicated that the areas under agriculture/fallow land were significantly increased while the areas under shrubs/small vegetation were decreased during the period 1981–2006. The areas under forest cover and barren land were also decreased but relatively low compared to the other LULC types. The OMR results showed that the LULC changes over urban areas contributed to warming with a temperature of 0.02 °C during this period, while that over non-urban areas showed a cooling effect with a temperature reduction of 0.29 °C and that over the whole Southern India (looked at an average) indicated a cooling effect with a temperature reduction of 0.063 °C. The comparative analysis between the two (LULC change analysis and OMR) results showed that the cooling over Southern India was mostly due to the expansion of agriculture/fallow land and the decline of shrubs/small vegetation. The study suggests that the OMR method reasonably demonstrates the effect of LULC changes on the temperature over Southern India.

1. Introduction

Recent studies [1,2] have revealed that climate change in recent decades has been partly associated with the changes in the land use and land cover (LULC) over the years. The LULC is being modified due to the population growth, food demand, and various other needs of human life and sometimes due to the changes in the climatic conditions [3]. As a result, the land surface processes change and affect the lower atmosphere and thus the local climate [4,5,6,7,8,9,10,11,12,13].
A number of studies have been conducted to estimate the impact of LULC changes on the climate over various regions across the globe. Bryant et al. [14] estimated the impact of LULC changes over the Sonoran Desert due to overgrazing in the semi-arid grassland and reported an increase in sensible heat flux. Gallo et al. [15] demonstrated that the changes in LULC conditions within a 10 km radius can significantly influence the diurnal temperature range of the region. The areas undergoing land degradation cause a significant increase in the diurnal temperature range over the Sonoran Desert [16]. Kalnay and Cai [17] documented that changes in the LULC contributed 0.27 °C to the mean surface warming per century over the continental United States during 1950–1999. Zhou et al. [18] and Frauenfeld et al. [19] highlighted increases in the trends in surface temperature due to the urbanization in China and LULC changes in the Tibetan Plateau, respectively. Christy et al. [20] documented a rise in the minimum temperature in Central California, which is caused by massive growth in irrigated agriculture. These studies clearly indicate that the impact of the LULC on the climate is significant on a regional scale, although the reflectance of the impacts due to change in the LULC is limited not only to certain climate variables, but also to other variables [21].
Various studies have assessed the climate change due to LULC changes over several regions of India [13,22,23,24,25,26,27]. Gogoi et al. [24] reported an increase in the mean temperature over Eastern India for the period 1981–2010 due to LULC changes over the region. Nayak et al. [13] studied the impact of LULC changes over five homogenous regions (classified based on rainfall distribution) of India during 1991–2010 and highlighted that the changes in LULC contributed to warming over Northwest India, West Central India, and Southern Peninsular of India and cooling over Northeastern India and Central North India. Their study also reported an increase of the precipitation over the west central and southern peninsular regions of India and a decrease of precipitation over Northwest India in 1991−2010. Halder et al. [25] documented that the Indian summer monsoonal maximum temperature was increased due to LULC changes. Nayak and Mandal [26] reported a warming contribution from LULC changes over India during 1991−2006. Lodh [27] documented a decrease of the precipitation over Northern India due to LULC changes over the Thar Deserts.
To quantitatively investigate the effect of LULC changes on the regional climate, numerous studies have adopted various methods. The observation minus reanalysis (OMR) is one of the many methods and was originally proposed by Kalnay and Cai [17]. Later, this method was used in various studies across the world [26,28,29]. This method is used when the reanalysis temperature does not consider the LULC change effect during the data preparation but considers the greenhouse gas effect. On the other hand, the observed temperature contains both LULC and greenhouse gas effects. Thus, the subtraction of the reanalysis temperature from the observed temperature, known as OMR, gives the LULC change impact on the temperature. This method is widely used in the United States [28], India [26], China [29], and many other countries [30].
India has a variety of LULC types, and many previous studies have highlighted them [31,32]. Several studies also highlighted their changes over time [6,33,34]. Such changes influence the local climate due to the modifications in the interactive mechanism between the lower atmosphere and the land surface [13]. As mentioned before, many studies have highlighted the impacts of LULC change on the Indian climate [35,36,37], and it is noticed that the effect of the LULC change on the climate in terms of the temperature is not uniform over Indian regions. The LULC changes result in warming over Western India [38], Central India [39,40], and Northern India [41], while they result in cooling over Northwest India [42], Northeast India [41], and Eastern India [43]. However, the LULC change impact on the temperature over Southern India is unclear, and such studies are meager over this region to examine whether LULC changes over this region cause warming or cooling.
Southern India is a peninsular region and surrounded by the Indian Ocean on two sides (Figure 1). According to the Köppen climate classification [44], this region has different types of climates in comparison to other regions of India. Southern India comprises a wide diversity of land cover including a large variety of vegetation cover. Rich flora and fauna are mostly found in this region [45]. As the land across the globe has been changed a lot due to various types of human demand, the LULC changes over Southern India are also obvious over the years, for example, urbanization. However, as mentioned earlier, studies are limited to understand the LULC changes over Southern India and their possible impact on the climate of the region. Therefore, as a follow-up to the previous research [38,39,41], this study investigated the changes in the LULC over Southern India and their contributions towards temperature trends over the region.
Recently, remote sensing data have been used widely for LULC changes due to the sophistication process of identifying the physical features of a region [46,47]. The Advanced Very High-Resolution Radiometer (AVHRR) data are one of the remote sensing products, which are acquired by the onboard AVHRR sensor on the satellite of the National Aeronautics and Space Administration (NASA) [48,49]. This product is available over the whole globe with normalized difference vegetation index (NDVI) values for the period 1981–2006 and widely used in numerous studies across the globe [26,39,41,50,51]. In the present study, we attempted to investigate the LULC change over Southern India from the AVHRR data and applied the OMR method to explore the impact of the LULC change on the temperature over the region.

2. Data and Methods

We utilized the NDVI images of AVHRR data for the years 1981, 1991, 2001, and 2006 at a 8 km spatial resolution as given by the Global Inventory Modeling and Mapping Studies (GIMMS). Here, the NDVI refers to the ratio of the difference between near-infrared (NIR) light and red band (RED) and the addition of NIR and RED, indicated by (NIR−RED)/(NIR + RED), and the value ranges from −1.0 to 1.0. We followed the hierarchies of the classification structure approaches [52] based on the NDVI values of the AVHRR data [26,30,53,54] and classified the images into five LULC categories: barren land and settlement (BS), shrubs/small vegetation (SS), agricultural/fallow (AF), open forest (OF), and dense forest (DF). As shown in Figure 2, we first classified the AVHRR data into the two LULC types: vegetation cover and non-vegetation cover. The non-vegetation cover included barren land, sand, rock, settlement, and waterbody. The vegetation cover included the forest cover and the non-forest cover. Forest cover was further classified into the OF and the DF, and the non-forest cover was classified into the AF and SS covers. The classified LULC maps were verified using 50 arbitrarily sampled points from the NASA Landsat satellite imageries of the Multispectral Scanner (MSS), the Thematic Mapper (TM), and the Enhanced Thematic Mapper (ETM) images available at 30 to 60 m spatial resolutions.
The observed daily temperature data were obtained from the National Climatic Data Center (NCDC) for 18 different stations, and reanalysis temperature data for the period 1981–2006 were obtained from the NCEP/NCAR, National Oceanic and Atmospheric Administration. The NCEP/NCAR reanalysis dataset was selected based on their wide use in previous studies, especially over India [8,55,56,57]. The period of this study (i.e., 1981–2006) and the 18 stations were selected based on the availability of the AVHRR NDVI data and the observed temperature accessibility for a minimum of 20 years. Note that the reanalysis data were a gridded data, while the observed data were available at stations which were scattered. Therefore, the reanalysis temperature at each observed station was extracted by using the inverse distance weighting method from four nearest grid points of each station. Here, the inverse distance weighting refers to the method by which the temperature at each station was interpolated with a weighted average of the temperatures available at the four nearest grid points containing the observation station by using the following equation:
T s = j = 1 4 P j × T q j j = 1 4 P j   f o r   j = 1 ,   2 ,   3 ,   4 ,
where Ts is the temperature at the target station from reanalysis, Pj−1 is the Euclidean distance from the station to the corner point qj, and Tqj is the temperature at point qj from reanalysis.
The detailed information of the 18 stations, such as the name, location, elevation, and area type, is given in Table 1. To investigate the impact of the LULC change on the temperature over Southern India, we calculated the OMR. The temperature anomalies and the rate of change of temperature were computed for the period 1981–2006 from both the datasets, i.e., observation and reanalysis. The difference between the trend in the observed data and that in reanalysis data (i.e., OMR) was considered as the contribution from the LULC change.
It is worth mentioning that LULC changes contribute differently towards warming or cooling, depending on the locations and the kinds of the LULC change. For example, LULC changes over Northeastern Indian regions contribute to cooling [40,42], while those over Northern Indian regions contribute to warming [41]. The impacts of LULC changes over urban areas and non-urban areas are also not the same [35,36,37,40]. To examine such differences over Southern Indian regions, the OMR trends were analyzed over five different categories. Three categories were considered from their heights above sea level based on the elevations of the station locations viz. the low-elevation coastal areas up to 100 m above sea level, the high-elevation mountain areas located at 500 m or higher above sea level, and the other interior regions between 101 and 499 m above sea level. The other two categories were considered as urban areas and non-urban areas based on the surrounding areas of the station locations.

3. Results and Discussion

3.1. Spatial Distributions of the LULC Classification and the Accuracy Assessment

Figure 3 presents the NDVI images used for the classification of the LULC over Southern India for the years 1981, 1991, 2001, and 2006 (Figure 3a–d), the classified LULC maps for these years (Figure 3e–h), and the Landsat satellite images (Figure 3i–l) used for accuracy assessment. The classified LULC map indicated that the major portions of Southern Indian were covered with AF land during 1981–2006, the central areas were mostly covered with SS and BS, and a few areas of the south western part (i.e., the Western Ghats) were covered with DFs. We performed the accuracy assessment based on the arbitrarily selected 50 sample locations and validated them with high-resolution satellite images through the producer’s accuracy, the user’s accuracy, and the overall accuracy (Table 2).
We noticed that some LULC types were not classified correctly; for instance, the producer’s accuracies in the case of the OF showed 50%, 50%, and 67% for the years 1981, 1991, and 2006, respectively, while the user’s accuracy of the OF showed 50% for the year 2001. The producer’s and user’s accuracies in the case of the BS also indicated low accuracies for some years in the classification. The reason for the low accuracies could be associated with the misclassification of some sub-categories in the LULC types. Thus, more LULC types were required to increase these accuracies. However, the overall accuracies of the categorized LULC maps for the year 1981 and 1991 were 88% and 86%, respectively, whereas they were 92% and 90% for the years 2001 and 2006, respectively. Figure 4 illustrates the estimated areas under each LULC type. It was noticed that the AF land spread over more than 300,000 km2 of the total areas of Southern India and showed a continuous expansion from years 1981 to 2006, while SS covered over 150,000–200,000 km2 and indicated a continuous decline during this period. Other LULC types covered the areas below 100,000 km2 each and, except for the OF in 1981, showed a continuous decline during the period 1981–2006.

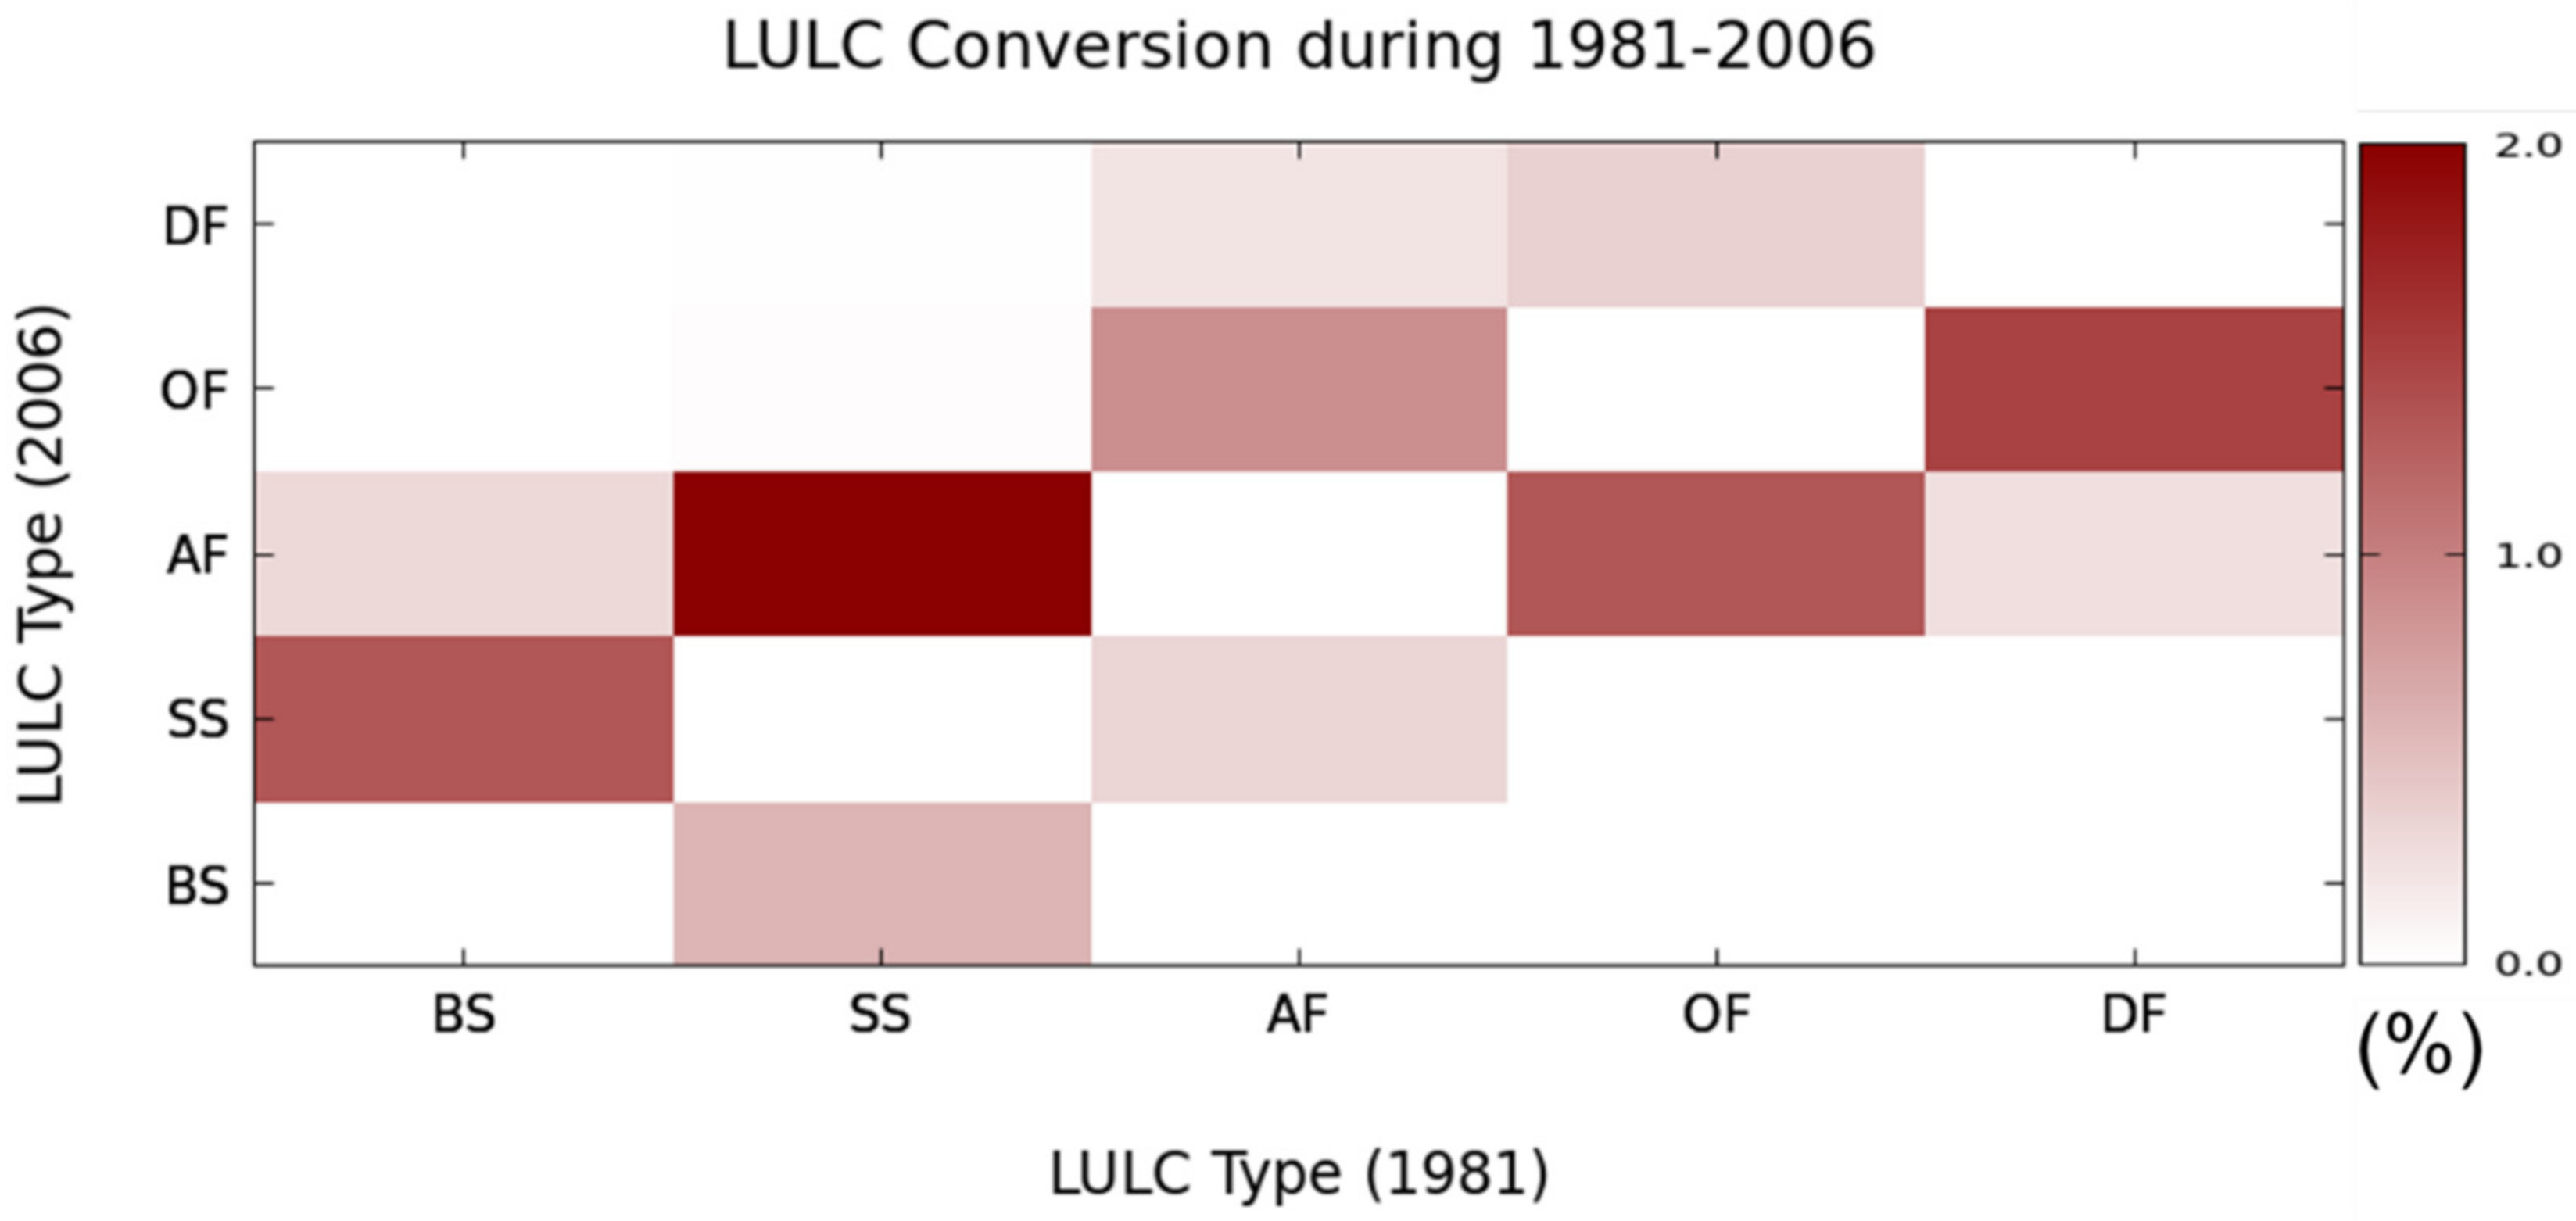
3.2. LULC Change Analysis
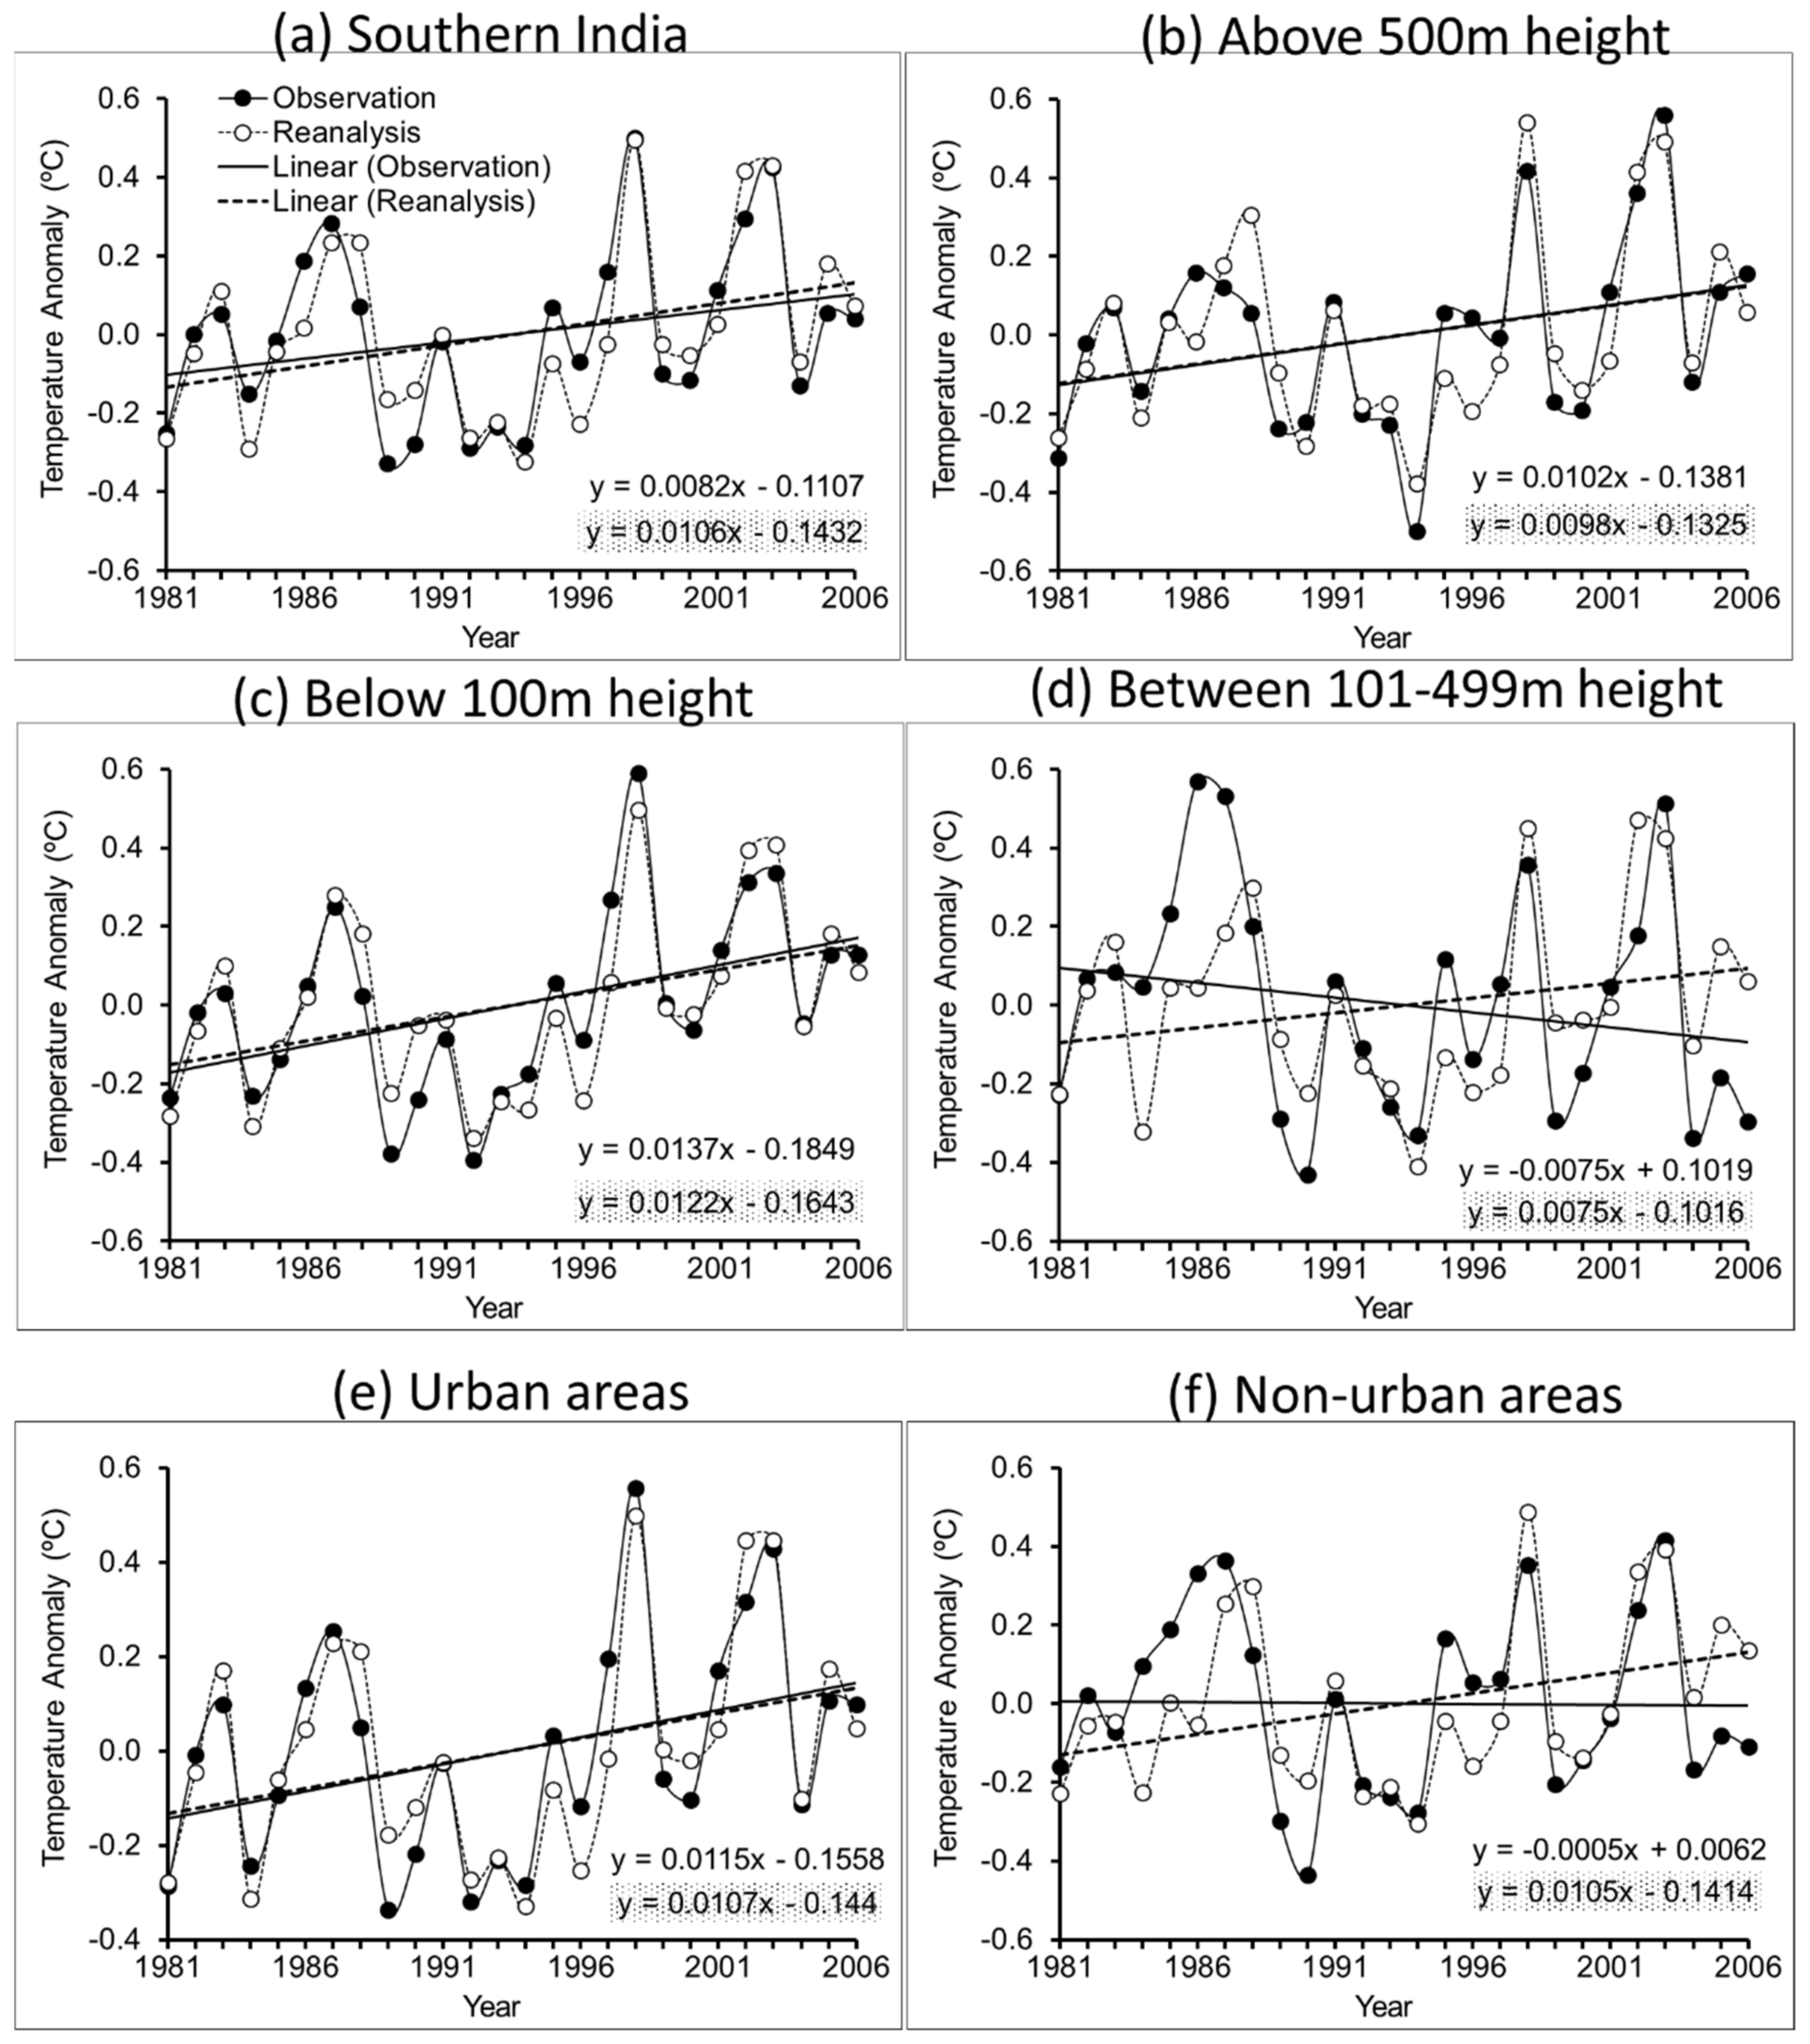
Table 3 shows the changes in the LULC between the years 1981 and 1991, between 1991 and 2001, between 2001 and 2006, and between 1981 and 2006. It was indicated that the areas under BS were decreased continuously from 1981 to 2006. The SS also showed a gradual decrease in each subperiod during 1981–2006. The AF land cover indicated a continuous expansion in each period. The areas under OFs were decreased during 1981–1990 and thereafter increased in each period during 1991–2006. The DF was noticed with a continuous decrease during 1981–2006. The overall analysis on LULC changes over Southern India indicated an exceptional increase of the OF during 1991–2006 and the AF land during 1981–2006. However, all other LULC types decreased during 1981–2006. Figure 5 showed the LULC change matrix from one type to another over Southern India during 1981–2006.
The change matrix was performed by comparing the LULC classification maps between the years 1981 and 2006 and quantifying the changes of the LULC type at each pixel, no matter whether it was converted to another LULC type or remained as it was. We found that the major conversions occurred between the following pairs: SS and barren land, AF land and SS, OFs and AF land, and DFs and OFs. We found that during this period, a small portion of barren land was converted into SS. A large portion of SS was converted into BS land, and a small portion of SS was converted into AF land. Similarly, a small portion of AF land was converted into BS land during this period, while a large portion of AF land was converted into SS and OFs, and a small portion of AF land was converted into DFs. It was also found that some parts of the OF converted into AF land while large parts were converted into DFs during this period. Smaller portions of conversions between the other LULC types were noticed.
The above results indicated an overall expansion of the areas under AF land and OFs and reductions of the areas under the other three LULC types. The expansion of areas under agricultural land in Southern India could be associated with the food demand due to population growth [58], while the expansion of areas under OFs is found linked with the reduction of DFs, possible deforestation due to human needs [59]. A multitude of studies over other regions of India also showed agricultural land expansion. For instance, it is highlighted that AF land significantly increases over Western India [38], Eastern India [43], and Central India [39]. The OF cover is also increased significantly over Eastern India [26] and Northeast India [41]. On the other hand, the reason for the reductions of the areas under SS and BS were the conversion into agricultural land. The results in Figure 5 indicated conversions of large areas under BS into SS and the transformation of large areas under SS into AF land. Previous studies over other regions of India also documented similar results [38,43], implying the reduction under SS was not only noticed over Southern India, but also observed in other parts of the country.

3.3. OMR Analysis

Future 6 illustrates the anomalies of the temperature during 1981–2006 and their linear trends obtained from the observed temperature data and reanalysis temperature over Southern India as a whole and five different categorized areas. We found that the temperature over Southern India during 1981–2006 increased by ~0.082 °C per decade and 0.213 °C during the whole period (Figure 6a). The reanalysis temperature trend during this period also showed an increasing rate at ~0.1 °C/decade. The difference between the two trends (OMR) indicated cooling rates at ~0.024 °C/decade and 0.063 °C during the whole period (1981–2006) due to the LULC change over Southern India. Compared with other Indian regions regardless of LULC types and their changes, the cooling contribution from LULC change was also observed over Northwest India [42], Northeast India [29], and Eastern India [43], while warming due to LULC changes was reported over the central, western, and northern regions of India. We also noticed that the year 1998 was the warmest year and the year 1994 was the coolest year during 1981–2006 over Southern India. The closer investigation of the results in Figure 6a showed that the temperature over Southern India decreased until the year 1994, and from this year onwards, it showed an increasing trend. The reanalysis temperature also showed the same pattern, but with lower magnitudes before the year 1994 and higher magnitudes afterwards. It implied that the OMR trend was positive until the year 1994 and negative afterwards, indicating a warming contribution due to the LULC change until the year 1994 and the cooling contribution afterwards. Although the LULC change contributed to the cooling over Southern India, the observed temperature indicated warming over the Southern Indian region during 1981–2006. Figure 6b–d shows the OMR results calculated from the stations at 500 m or higher, up to 100 m, and between 101 and 499 m heights above sea level, respectively.
The OMR in the high elevation/mountain areas showed a warming effect (an increase of 0.01 °C during 1981–2006) due to LULC changes (Figure 6b). The LULC change over low-elevation/coastal areas also contributed to warming with a temperature increase of 0.039 °C during this period (Figure 6c). However, the LULC changes over the other interior regions located between 101 and 499 m heights above sea level showed a cooling with a temperature reduction of 0.39 °C during 1981–2006 (Figure 6d). The OMR results obtained from the stations over urban and non-urban areas are shown in Figure 6e,f. It was indicated that the LULC changes over urban areas caused warming with a temperature increase of 0.02 °C during 1981–2006, while that over non-urban areas resulted in cooling with a temperature reduction of 0.29 °C. This implied that the overall warming during 1981–2006 over Southern India could be due to the urbanization over low and highly elevated regions. It would also be interesting to investigate the impacts of different underlying landscapes on the temperature change. For example, what are the temperature changes of impervious surface, farmland, and other landscapes? However, it is difficult to quantify from the present limited datasets. The OMR method may also not be a good choice here, because the LULC surrounding the stations is almost heterogamous. Moreover, the LULC change impact on the temperature at each station is due to the surrounding LULC changes, but not due to a particular type of the LULC change at each station. It is, thus, planned as a future work by using a regional high-resolution climate model and changing a particular type of LULC to investigate the impact.
These results indicated that LULC changes over low-level coastal regions and high-elevation mountain areas produced warming while those over other regions showed cooling effects. An overall cooling contribution was noticed by the LULC change over the southern region during the period. The cooling contribution over the region due to LULC changes could be due to the fact that LULC changes significantly influence atmospheric processes at a lower level [60]. For example, LULC changes modify the land surface characteristics of land cover such as roughness, evapotranspiration, albedo, and leaf area indices [61,62]. Such changes in the land surface characteristics over Southern India may also occur due to LULC changes which in turn may alter the energy feedback from the land surface to the atmosphere [5,63]. Earlier, we mentioned that the major changes during this period over Southern Indian were noticed between the pairs BS–SS, SS–AF, AF–OF, and OF–DF (Figure 5) and a significant increase of areas under the AF was noticed during this period (Figure 4 and Table 3). According to the previous studies, any conversion into AF land, except DFs, results in cooling [26,28]. Our results showed a reduction of areas under DFs during 1981–2006, while an increase under AF land during the same period was shown. This implied the conversion between LULC types occurred mostly from SS to AF land and from AF land to OFs, implying cooling. Although other conversions from SS to BS, from DFs to OFs, from AF land to SS, and from AF land to OFs should have resulted in warming [43], we noticed the converted areas under these categories were fewer compared to those from BS to SS, from OFs to DFs, from SS to AF land, and from OFs to AF land. This indicated an overall cooling contribution from the LULC change over Southern India, which was noted through the OMR analysis. We inferred that the OMR method successfully detected the overall cooling due to the LULC during 1981–2006 over the southern regions of India.
The overall analysis suggested that the OMR method is useful for examining the LULC change impact over Southern India. It is worth mentioning that the present study did not quantify the LULC impact on the temperature contributed from the individual LULC type, which added additional information and the capability of the OMR method. However, our findings on the warming contribution due to LULC changes over low-level coastal regions suggested possible impact on extreme events, as the Southern Indian coastal regions are mostly flood-prone and cyclone-prone areas. Therefore, modeling studies by changing particular LULC types are further suggested to investigate the individual impact, particularly for future projection, for which the OMR-based results may be useful in validating modeling studies in present-day simulations.

4. Conclusions

We investigated the LULC changes over Southern India and used the OMR method to demonstrate the impact of the LULC change on the temperature during the period 1981–2006. The results indicated that the areas under SS during this period were significantly decreased and the areas under AF land subsequently increased over Southern India. The BS and the forest cover showed some reductions of the temperature. The OMR analysis indicated a cooling contribution with a temperature reduction of 0.063 °C from LULC changes over Southern India during this period. The reason for the cooling is mainly attributed to the conversions of barren lands, SS, and OFs into AF lands. The overall study inferred that the OMR method reasonably demonstrated the effect of LULC changes on the temperature over Southern India. It is worth highlighting that our results showed the LULC impact over Southern India as a whole on the area average temperature; thus, much detailed analysis with more LULC types and sub-regions are suggested as a future research topic. However, anthropological activities causing the LULC change are alarming towards a warming climate, which may have an impact on the future socioeconomic development. Thus, we believe our results may have implications for the undertaken strategies towards the LULC change over Southern India in future.

Author Contributions

Conceptualization, Sridhara Nayak; data curation, Sridhara Nayak; formal analysis, Sridhara Nayak; investigation, Sridhara Nayak, Netrananda Sahu, Atul Saini, and Hara Prasad Nayak; methodology, Sridhara Nayak; software, Sridhara Nayak and Suman Maity; supervision, Sridhara Nayak; validation, Sridhara Nayak, Netrananda Sahu, Suman Maity, and Kuvar Satya Singh; visualization, Sridhara Nayak, Atul Saini, Suman Maity, and Soma Dutta; writing—original draft, Sridhara Nayak; writing—review and editing, Sridhara Nayak, Netrananda Sahu, Suman Maity, Kuvar Satya Singh, Hara Prasad Nayak, and Soma Dutta. All authors have read and agreed to the published version of the manuscript.

Funding

This research received no external funding.

Data Availability Statement

The NASA AVHRR data supporting this study is obtained from the Global Land Cover Facility (GLCF). The reanalysis temperature and observed temperature datasets are obtained from NCEP/NCAR and National Climatic Data Centre respectively.

Acknowledgments

The authors sincerely acknowledge the two anonymous reviewers for improving the original manuscript. NASA, Global Land Cover Facility (GLCF) is acknowledged for providing the LULC data from the National Climatic Data Centre (NCDC). The National Centers for Environmental Prediction (NCEP) and the National Center for Atmospheric Research (NCAR) are acknowledged for providing observed and reanalysis temperature datasets, respectively. The authors also acknowledge B. Tyagi of NIT Rourkela for the suggestions and advice towards the improvement of this manuscript. Indian Institute of Technology Kharagpur, India, is also acknowledged for providing the research facility to conduct this research.

Conflicts of Interest

The authors declare no conflict of interest.

References

  1. Intergovernmental Panel on Climate Change (IPCC). The Physical Science Basis. In Fourth Assessment Report of the Intergovernmental Panel on Climate Change; Solomon, S., Qin, D., Manning, M., Chen, Z., Marquis, M., Averyt, K.B., Tignor, M., Miller, H.L., Eds.; Cambridge University Press: Cambridge, UK, 2007. [Google Scholar]
  2. Intergovernmental Panel on Climate Change (IPCC). Climate Change 2013: The Physical Science Basis. In Contribution of Working Group I to the Fifth Assessment Report of the Intergovernmental Panel on Climate Change; Stocker, T.F., Qin, D., Plattner, G.-K., Tignor, M., Allen, S.K., Boschung, J., Nauels, A., Xia, Y., Bex, V., Midgley, P.M., Eds.; Cambridge University Press: Cambridge, UK; New York, NY, USA, 2013; pp. 5–14. [Google Scholar]
  3. Sahu, N.; Saini, A.; Behera, S.K.; Sayama, T.; Sahu, L.; Nguyen, V.-T.-V.; Takara, K. Why apple orchards are shifting to the higher altitudes of the Himalayas? PLoS ONE 2020, 15, e0235041. [Google Scholar] [CrossRef]
  4. Viterbo, P. The role of the land surface in the climate system. In Meteorological Training Course Lecture Series, European Centre for Medium Range Weather Forecasting (ECMWF); ECMWF: Reading, UK, 2002. [Google Scholar]
  5. Teuling, A.J.; Seneviratne, S.I.; Stöckli, R.; Reichstein, M.; Moors, E.; Ciais, P.; Luyssaert, S.; van den Hur Ammann, B.; Bernhofer, C. Contrasting response of European forest and grassland energy exchange to heatwaves. Nat. Geosci. 2010, 3, 722–727. [Google Scholar] [CrossRef]
  6. Jain, S.; Panda, L.; Kant, S. Possible Socio-scientific Issues of Land-use and Land-cover Change Impact and Associated Tools of Study with a Special Reference to Delhi-Mumbai Industrial Corridor Region. Int. J. Earth Atmos. Sci. 2014, 1, 58–70. [Google Scholar]
  7. Li, Y.; Zhao, M.; Motesharrei, S.; Mu, Q.; Kalnay, E.; Li, S. Local cooling and warming effects of forest based on satellite data. Nat. Commun. 2015, 6, 6603. [Google Scholar] [CrossRef] [Green Version]
  8. Maity, S.; Satyanarayana, A.N.V.; Mandal, M.; Nayak, S. Performance evaluation of land surface models and cumulus convection schemes in the simulation of Indian summer monsoon using a regional climate model. Atmos. Res. 2017, 197, 21–41. [Google Scholar] [CrossRef]
  9. Mushore, T.D.; Odindi, J.; Dube, T.; Mutanga, O. Prediction of future urban surface temperatures using medium resolution satellite data in Harare metropolitan city, Zimbabwe. Build. Environ. 2017, 122, 397–410. [Google Scholar] [CrossRef]
  10. Roy, S.; Pandit, S.; Eva, E.A.; Bagmar, M.S.H.; Papia, M.; Banik, L.; Razi, M.A. Examining the nexus between land surface temperature and urban growth in Chattogram Metropolitan Area of Bangladesh using long term Landsat series data. Urban Clim. 2020, 32, 100593. [Google Scholar] [CrossRef]
  11. Tan, J.; Yu, D.; Li, Q.; Tan, X.; Zhou, W. Spatial relationship between land-use/land-cover change and land surface temperature in the Dongting Lake area, China. Sci. Rep. 2020, 10, 1–9. [Google Scholar] [CrossRef]
  12. Mall, R.K.; Chaturvedi, M.; Singh, N.; Bhatla, R.; Singh, R.S.; Gupta, A.; Niyogi, D. Evidence of asymmetric change in diurnal temperature range in recent decades over different agro-climatic zones of India. Int. J. Climatol. 2021, 41, 2597–2610. [Google Scholar] [CrossRef]
  13. Nayak, S.; Mandal, M.; Maity, S. Assessing the impact of Land-use and Land-cover changes on the climate over India using a Regional Climate Model (RegCM4). Clim. Res. 2021, 85, 1–20. [Google Scholar] [CrossRef]
  14. Bryant, N.A.; Johnson, L.F.; Brazel, A.J.; Balling, R.C.; Hutchinson, C.F.; Beck, L.R. Measuring the effect of overgrazing in the Sonoran Desert. Clim. Chang. 1990, 17, 243–264. [Google Scholar] [CrossRef]
  15. Gallo, K.P.; Easterling, D.R.; Peterson, T.C. The influence of land use/land cover on Climatological values of the diurnal temperature ranges. J. Clim. 1996, 9, 2941–2944. [Google Scholar] [CrossRef] [Green Version]
  16. Balling, R.C.; Vose, R.S.; Weber, G.R. Analysis of long-term European temperature records: 1751–1995. Clim. Res. 1998, 10, 193–200. [Google Scholar] [CrossRef]
  17. Kalnay, E.; Cai, M. Impact of urbanization and land-use change on climate. Nature 2003, 423, 528–531. [Google Scholar] [CrossRef] [PubMed]
  18. Zhou, L.M.; Dickinson, R.E.; Tian, Y.H. Evidence for a significant urbanization effect on climate in China. In Proceedings of the National Academy of Science, New York, NY, USA, 29 June 2004; Volume 101, pp. 9540–9544. [Google Scholar]
  19. Frauenfeld, O.W.; Zhang, T.; Serreze, M.C. Climate change and variability using European Centre for Medium-Range Weather Forecasts reanalysis (ERA-40) temperatures on the Tibetan Plateau. J. Geophys. Res. 2005, 110, D02101. [Google Scholar] [CrossRef]
  20. Christy, J.R.; Norris, W.B.; Redmond, K.; Gallo, K.P. Methodology and results of calculating central California surface temperature trends: Evidence of human-induced climate change? J. Clim. 2006, 19, 548–563. [Google Scholar] [CrossRef] [Green Version]
  21. Sahu, N.; Singh, R.B.; Kumar, P.; Da Silva, R.V.; Behera, S.K. La Niña Impacts on Austral Summer Extremely High-Streamflow Events of the Paranaíba River in Brazil. Adv. Meteorol. 2013, 2013, 461693. [Google Scholar] [CrossRef]
  22. Mukherjee, F.; Singh, D. Assessing Land Use–Land Cover Change and Its Impact on Land Surface Temperature Using LANDSAT Data: A Comparison of Two Urban Areas in India. Earth Syst. Environ. 2020, 4, 385–407. [Google Scholar] [CrossRef]
  23. Kayet, N.; Pathak, K.; Chakrabarty, A.; Sahoo, S. Spatial impact of land use/land cover change on surface temperature distribution in Saranda Forest, Jharkhand. Model. Earth Syst. Environ. 2016, 2, 127. [Google Scholar] [CrossRef] [Green Version]
  24. Gogoi, P.P.; Vinoj, V.; Swain, D.; Roberts, G.; Dash, J.; Tripathy, S. Land use and land cover change effect on surface temperature over Eastern India. Sci. Rep. 2019, 9, 1–10. [Google Scholar]
  25. Halder, S.; Saha, S.K.; Dirmeyer, P.A.; Chase, T.N.; Goswami, B.N. Investigating the impact of land-use land-cover change on Indian summer monsoon daily rainfall and temperature during 1951−2005 using a regional climate model. Hydrol. Earth Syst. Sci. 2016, 20, 1765–1784. [Google Scholar] [CrossRef] [Green Version]
  26. Nayak, S.; Mandal, M. Impact of land use and land cover changes on temperature trends over India. Land Use Policy 2019, 89, 104238. [Google Scholar] [CrossRef]
  27. Lodh, A. Simulating the impact of extended desertification on Indian hydro climate using ICTP-RegCM4. 4.5. 10 model. J. Hydrol. 2021, 598, 126405. [Google Scholar] [CrossRef]
  28. Fall, S.; Watts, A.; Nielsen-Gammon, J.; Jones, E.; Niyogi, D.; Christy, J.R.; McNider, R.; Pielke, R.A., Sr. Analysis of the impacts of station exposure on the U.S. Historical Climatology Network temperatures and temperature trends. J. Geophys. Res. 2011, 116, D14120. [Google Scholar] [CrossRef] [Green Version]
  29. Jin, X.; Jiang, P.; Du, H.; Chen, D.; Li, M. Response of local temperature variation to land cover and land use intensity changes in China over the last 30 years. Clim. Chang. 2021, 164, 34. [Google Scholar] [CrossRef]
  30. Lim, Y.K.; Cai, M.; Kalnay, E.; Zhou, L. Impact of Vegetation Types on Surface Temperature Change. J. Appl. Meteorol. Climatol. 2008, 47, 411–424. [Google Scholar] [CrossRef] [Green Version]
  31. Nayak, S.; Behera, M.D. Land use/land cover classification and mapping of Pilibhit District Uttar Pradesh India. Indian Geogr. J. 2008, 83, 15–24. [Google Scholar]
  32. Vinayak, B.; Lee, H.S.; Gedem, S. Prediction of Land Use and Land Cover Changes in Mumbai City, India, Using Remote Sensing Data and a Multilayer Perceptron Neural Network-Based Markov Chain Model. Sustainability 2021, 13, 471. [Google Scholar] [CrossRef]
  33. Babykalpana, Y. Landuse Landcover change detection using remotely sensed data for Coimbatore district, India. Int. J. Sci. Eng. Res. 2012, 3, 1–8. [Google Scholar]
  34. Rawat, J.S.; Biswas, V.; Kumar, M. Changes in land use/cover using geospatial techniques: A case study of Ramnagar town area, district Nainital, Uttarakhand, India. Egypt. J. Remote Sens. Space Sci. 2013, 16, 111–117. [Google Scholar] [CrossRef] [Green Version]
  35. Niyogi, D.; Pyle, P.; Lei, M.; Arya, S.P.; Kishtawal, C.M.; Shepherd, M.; Chen, F.; Wolfe, B. Urban modification of thunderstorms: An observational storm climatology and model case study for the Indianapolis urban region. J. Appl. Meteorol. Climatol. 2011, 50, 1129–1144. [Google Scholar] [CrossRef]
  36. Mohan, M.; Kandya, A. Impact of urbanization and land-use/land-cover change on diurnal temperature range: A case study of tropical urban airshed of India using remote sensing data. Sci. Total Environ. 2015, 506, 453–465. [Google Scholar] [CrossRef]
  37. Kedia, S.; Bhakare, S.P.; Dwivedi, A.K.; Islam, S.; Kaginalkar, A. Estimates of change in surface meteorology and urban heat island over northwest India: Impact of urbanization. Urban Clim. 2021, 36, 100782. [Google Scholar] [CrossRef]
  38. Nayak, S.; Mandal, M. Impact of land use and land cover change on temperature trends over Western India. Curr. Sci. 2012, 102, 1166–1173. [Google Scholar]
  39. Nayak, S. Land use and land cover change and their impact on temperature over central India. Lett. Spat. Resour. Sci. 2021, 14, 1–12. [Google Scholar] [CrossRef]
  40. Singh, P.; Kikon, N.; Verma, P. Impact of land use change and urbanization on urban heat island in Lucknow city, Central India. A remote sensing based estimate. Sustain. Cities Soc. 2017, 32, 100–114. [Google Scholar] [CrossRef]
  41. Nayak, S.; Maity, S.; Singh, K.S.; Nayak, H.P.; Dutta, S. Influence of the Changes in Land-Use and Land Cover on Temperature over Northern and North-Eastern India. Land 2021, 10, 52. [Google Scholar] [CrossRef]
  42. Prijith, S.S.; Srinivasarao, K.; Lima, C.B.; Gharai, B.; Rao, P.V.N.; SeshaSai, M.V.R.; Ramana, M.V. Effects of land use/land cover alterations on regional meteorology over Northwest India. Sci. Total Environ. 2021, 765, 142678. [Google Scholar] [CrossRef]
  43. Nayak, S.; Mandal, M. Examining the impact of regional land use and land cover changes on temperature: The case of Eastern India. Spat. Inf. Res. 2019, 27, 601–611. [Google Scholar] [CrossRef]
  44. Oliver, J.E.; Wilson, L. Climate classification. In The Encyclopedia of Climatology; Oliver, J.E., Fairbridge, R.W., Eds.; Van Nostrand Reinhold Company: New York, NY, USA, 1987; pp. 221–236. [Google Scholar]
  45. Saini, A.; Sahu, N.; Kumar, P.; Nayak, S.; Duan, W. Advanced Rainfall Trend Analysis of 117 Years over West Coast Plain and Hill Agro-Climatic Region of India. Atmosphere 2020, 11, 1225. [Google Scholar] [CrossRef]
  46. Rogan, J.; Chen, D. Remote sensing technology for mapping and monitoring land-cover and land-use change. Prog. Plan. 2004, 61, 301–325. [Google Scholar] [CrossRef]
  47. Pricope, G.N.; Mapes, K.L.; Woodward, K.D. Remote Sensing of Human–Environment Interactions in Global Change Research: A Review of Advances, Challenges and Future Directions. Remote Sens. 2019, 11, 2783. [Google Scholar] [CrossRef] [Green Version]
  48. Tucker, C.J.; Pinzon, J.E.; Brown, M.E. Global inventory modeling and mapping studies, NA94apr15b.n11-VIg, 2.0. In Global Land Cover Facility; University of Maryland: College Park, MD, USA, 2004. [Google Scholar]
  49. Tucker, C.J.; Pinzon, J.E.; Brown, M.E.; Slayback, D.A.; Pak, E.W.; Mahoney, R.; El Saleous, N. An extended AVHRR 8-km NDVI data set compatible with MODIS and SPOT vegetation NDVI data. Int. J. Remote Sens. 2005, 26, 4485–4559. [Google Scholar] [CrossRef]
  50. Chavula, G.; Brezonik, P.; Bauer, M. Land use and land cover change (LULC) in the Lake Malawi Drainage Basin, 1982–2005. Int. J. Geosci. 2011, 2, 172. [Google Scholar] [CrossRef] [Green Version]
  51. John, R.; Chen, J.; Lu, N.; Wilske, B. Land cover/land use change in semi-arid Inner Mongolia: 1992–2004. Environ. Res. Lett. 2009, 4, 045010. [Google Scholar] [CrossRef]
  52. DeFries, R.S.; Townshend, J.R.G. NDVI-derived land cover classifications at a global scale. Int. J. Remote Sens. 1994, 15, 3567–3586. [Google Scholar] [CrossRef]
  53. Hansen, M.C.; DeFries, R.S.; Townshend, J.R.; Sohlberg, R. Global land cover classification at 1 km spatial resolution using a classification tree approach. Int. J. Remote Sens. 2000, 21, 1331–1364. [Google Scholar] [CrossRef]
  54. Nayak, S.; Mandal, M.; Maity, S. RegCM4 simulation with AVHRR land use data towards temperature and precipitation climatology over Indian region. Atmos. Res. 2018, 214, 163–173. [Google Scholar] [CrossRef]
  55. Nayak, S.; Mandal, M.; Maity, S. Customization of regional climate model (RegCM4) over Indian region. Theor. Appl. Climatol. 2017, 127, 153–168. [Google Scholar] [CrossRef]
  56. Maity, S.; Mandal, M.; Nayak, S.; Bhatla, R. Performance of cumulus parameterization schemes in the simulation of Indian Summer Monsoon using RegCM4. Atmósfera 2017, 30, 287–309. [Google Scholar] [CrossRef] [Green Version]
  57. Nayak, S.; Mandal, M.; Maity, S. Performance evaluation of RegCM4 in simulating temperature and precipitation climatology over India. Theor. Appl. Climatol. 2019, 137, 1059–1075. [Google Scholar] [CrossRef]
  58. Creutzig, F.; d’Amour, C.B.; Weddige, U.; Fuss, S.; Beringer, T.; Gläser, A.; Kalkuhl, M.; Steckel, J.C.; Radebach, A.; Edenhofer, O. Assessing human and environmental pressures of global land-use change 2000–2010. Glob. Sustain. 2019, 2, e1. [Google Scholar] [CrossRef]
  59. Jha, C.S.; Dutt, C.B.S.; Bawa, K.S. Deforestation and land use changes in Western Ghats, India. Curr. Sci. 2020, 79, 231–238. [Google Scholar]
  60. Baldocchi, D.; Liukang, X. What limits evaporation from Mediterranean oak woodlands-the supply of moisture in the soil, physiological control by plants or the demand by the atmosphere? Adv. Water Resour. 2007, 30, 2113–2122. [Google Scholar] [CrossRef]
  61. Wang, X.; Zhang, B.; Xu, X.; Tian, J.; He, C. Regional water-energy cycle response to land use/cover change in the agro-pastoral ecotone, Northwest China. J. Hydrol. 2020, 580, 124246. [Google Scholar] [CrossRef]
  62. Li, J.; Tam, C.Y.; Tai, A.P.; Lau, N.C. Vegetation-heatwave correlations and contrasting energy exchange responses of different vegetation types to summer heatwaves in the Northern Hemisphere during the 1982–2011 period. Agric. For. Meteorol. 2021, 296, 108208. [Google Scholar] [CrossRef]
  63. Tran, D.X.; Pla, F.; Latorre-Carmona, P.; Myint, S.W.; Caetano, M.; Kieu, H.V. Characterizing the relationship between land use land cover change and land surface temperature. ISPRS J. Photogramm. Remote Sens. 2017, 124, 119–132. [Google Scholar] [CrossRef] [Green Version]
Figure 1. Location maps of Southern India (a) and the observation stations (b). (c) The elevation map of Southern India Cartosat-1 (CartoDEM Version-3 R1) digital elevation model obtained from the Bhuvan web portal (https://bhuvan.nrsc.gov.in accessed on 1 January 2022) of National Remote Sensing Center, ISRO, India, used to show the elevation.
Ijgi 11 00094 g001
Figure 2. Hierarchy of the land use and land cover (LULC) types.
Ijgi 11 00094 g002
Figure 3. (ad) Advanced Very High-Resolution Radiometer (AVHRR) normalized difference vegetation index (NDVI) images; (eh) classified LULC maps over Southern India; and (il) the Landsat satellite imageries utilized for the validation. The points in (il) correspond to the 50 sample locations on which the accuracy was considered. BS indicates barren land and settlement; SS indicates shrubs/small vegetation; AF indicates agricultural/fallow; OF indicates open forest; and DF indicates dense forest.
Ijgi 11 00094 g003
Figure 4. Areas under each LULC type in different years over Southern India. BS indicates barren land and settlement; SS indicates shrubs/small vegetation; AF indicates agricultural/fallow; OF indicates open forest; and DF indicates dense forest.
Ijgi 11 00094 g004
Figure 5. LULC change matrix analysis over Southern India during 1981–2006. The x-axis indicates the LULC types for the year 1981, and the y-axis indicates the LULC types for the year 2006. The diagonals indicate that there is no change. BS indicates barren land and settlement; SS indicates shrubs/small vegetation; AF indicates agricultural/fallow; OF indicates open forest; and DF indicates dense forest.
Ijgi 11 00094 g005
Figure 6. Observed and reanalysis temperatures during 1981–2006 over Southern India (a), the stations at an above 500 m height above sea level (b), the stations at up to 100 m height above sea level (c), the stations at between 101 and 499 m heights above sea level (d), the stations falling in urban areas (e), and the stations falling in non-urban areas (f). The equations with shaded marks correspond to the results from reanalysis, and the other equations correspond to those from observation.
Ijgi 11 00094 g006
Table 1. Names and locations of observation stations. The area types (urban/non-urban) were considered based on the surrounding areas of the station locations.
StationLongitude (°E)Latitude (°N)Height (m) above Sea LevelArea Type
Bangalore77.58312.967910Urban
Begumpet Airport78.46717.450527Urban
Belgaum/Sambra74.61715.850771Non-urban
Coimbatore/Peelamed77.05011.033389Urban
Cuddalore79.76711.76715Urban
Gadag75.63315.417661Urban
Kakinada82.23316.9509Urban
Kozhikode75.78311.25015Urban
Kurnool78.06715.800283Urban
Machilipatnam81.15016.2008Urban
Madras/Minambakkam80.18313.00018Urban
Mangalore/Bajpe74.88312.91792Non-urban
Nellore79.98314.45023Urban
PBO Anantapur77.63314.583372Non-urban
Port Blair92.71711.66710Non-urban
Ramgundam79.43318.767170Non-urban
Thiruvananthapuram76.9508.48313Urban
Tiruchchirapalli78.71710.76784Urban
Table 2. Accuracy assessments of LULC types for the year 1981, 1991, 2001, and 2006. BS indicates barren land and settlement; SS indicates shrubs/small vegetation; AF indicates agricultural/fallow; OF indicates open forest; and DF indicates dense forest.
LULC Type1981199120012006
Producer’s Accuracy (%)User’s Accuracy (%)Producer’s Accuracy (%)User’s
Accuracy (%)
Producer’s Accuracy (%)User’s
Accuracy (%)
Producer’s Accuracy (%)User’s
Accuracy (%)
BS75.00100.00100.0066.67100.00100.0050.00100.00
SS85.7180.0073.3384.6284.62100.0076.9290.91
AF95.0090.4890.9186.9696.3092.86100.0089.29
OF50.00100.0050.00100.00100.0050.0066.67100.00
DF100.0088.89100.0090.0087.5087.50100.0087.50
Overall accuracy88.00%86.00%92.00%90.00%
Table 3. LULC changes (in %) over Southern India between the years 1981 and 1990, between 1991 and 2000, between 2001 and 2006, and between 1981 and 2006. BS indicates barren land and settlement; SS indicates shrubs/small vegetation; AF indicates agricultural/ fallow; OF indicates open forest; and DF indicates dense forest.
LULC Type1981–19901991–20002001–20061981–2006
BS−0.06−0.80−0.387−1.246
SS−1.10−1.04−0.782−2.925
AF1.911.760.9624.624
OF−0.170.770.5941.198
DF−0.58−0.69−0.387−1.651
Publisher’s Note: MDPI stays neutral with regard to jurisdictional claims in published maps and institutional affiliations.

