Article

Air Humidity Characteristics in “Local Climate Zones” of Novi Sad (Serbia) Based on Long-Term Data

1
Department of Geography, Tourism and Hotel Management, Faculty of Sciences, University of Novi Sad, Trg Dositeja Obradovića 3, 21000 Novi Sad, Serbia
2
Climatology and Hydrology Research Centre, Faculty of Sciences, University of Novi Sad, Trg Dositeja Obradovića 3, 21000 Novi Sad, Serbia
3
Institute of Economic Sciences, Zmaj Jovina 12, 11000 Belgrade, Serbia
4
Department of Mathematics and Informatics, Faculty of Sciences, University of Novi Sad, Trg Dositeja Obradovića 3, Novi Sad 21000, Serbia
*
Author to whom correspondence should be addressed.
ISPRS Int. J. Geo-Inf. 2021, 10(12), 810; https://doi.org/10.3390/ijgi10120810
Submission received: 30 September 2021 / Revised: 18 November 2021 / Accepted: 28 November 2021 / Published: 30 November 2021

Abstract

:
This study aims to investigate spatial and temporal dynamics and relationship between air temperature and five air humidity parameters (relative humidity, water vapor pressure, absolute humidity, specific humidity, and vapor pressure deficit) in Novi Sad, Serbia, based on two-year data (December 2015–December 2017). The analysis includes different urban areas of Novi Sad, which are delineated in five built (urban) types of local climate zones (LCZ) (LCZ 2, LCZ 5, LCZ 6, LCZ 8, and LCZ 9), and one land cover (natural) local climate zone (LCZ A) located outside the urban area. Temporal analysis included annual, seasonal, and monthly dynamics of air temperature and air humidity parameters, as well as their patterns during the extreme periods (heat and cold wave). The results showed that urban dry island (UDI) occurs in densely urbanized LCZ 2 from February to October, unlike other urban LCZs. The analysis of the air humidity dynamics during the heat wave shows that UDI intensity is most pronounced during the daytime, but also in the evening (approximately until midnight) in LCZ 2. However, lower UDI intensity is observed in the afternoon, in other urban LCZs (LCZ 6, LCZ 8, and LCZ 9) and occasionally in the later afternoon in LCZ 5. Regression analysis confirms the relationship between air temperature and each of the analyzed air humidity parameters.

1. Introduction

Population growth and climate change are addressed to be major challenges in urban areas. Urban areas are homes to more than half of the world’s population, and thus they are most prone to environmental transformation. Urban transformation is a result of human activities in land use/land cover changes, with the simultaneous introduction of artificial impervious construction materials [1], resulting in modifications in surface properties, which contribute to microclimate changes, especially in urban canopy layer (UCL). There is a substantial number of studies on various specific aspects of urban climate, but the changes in atmospheric moisture in urban areas have been neglected [2,3,4], even though they affect human health, energy consumption, ecological systems, and thermal comfort [4,5,6], though recent studies report minor influence of humidity on human thermal comfort [7].
In densely built-up urban areas, artificial construction materials contribute to the decrease in evapotranspiration rate [8], and the lack of vegetation [3,9] leads to the modification in atmospheric humidity. In general, the water content of the urban atmosphere is low, especially in daytime, compared to the surrounding environment [10]. This situation is known as the urban dry island (UDI) [11], which precisely means that humidity levels are lower in urban centers and progressively increase toward peripheral areas [1]. According to Lokoshchenko [12], Urban Dry Island Intensity (UDII) represents the difference in humidity between urban and the surrounding rural areas. Negative UDII values for relative humidity (RH), water vapor pressure (Ea), saturated water vapor pressure (Es), absolute humidity (AH), specific humidity (Q), and positive UDII value for vapor pressure deficit (VPD) indicate that the urban area is drier than its surrounding rural area, and vice versa [3]. Luo and Lau [3] suggest that even though both urban and rural areas experience a decrease in RH, Ea, Q, and an increase in VPD, urban areas are experiencing a more prominent drying trend than rural areas. However, at night the opposite may be true; i.e., there can be an urban moisture excess [10]. According to Yang et al. [13] and Luo and Lau [3], there are examples demonstrating that the atmospheric humidity in many cities has a decreasing trend that spans over the past several decades. Comprehensive studies, measuring the differences between city and suburbs, also show that urban atmospheres are drier than rural atmosphere in cities such as Chicago, USA [14]; London, England [15]; Belgrade, Serbia [16]; Cairo, Egypt [17]; Zaragoza, Spain [1]; Moscow, Russia [12]; Beijing, China [13]; and Nanjing, China [4]. Differences in humidity between urban and rural areas varied depending on the local environment, seasons, and time of the day [18]. According to Cuadrat et al. [1], spatial pattern of UDI is significantly correlated with topography, urban density, and vegetation. Vegetation cover in urban areas has a positive influence on air humidity due to evapotranspiration process. In contrast, built up structures influence air humidity negatively. They also indicate that other urban variables should be considered when explaining air humidity patterns, such as types of land use, surface cover characteristics, population, and traffic density. In several case studies (e.g., London, Szeged, and Mexico City), the connection between the intensity of the Urban Heat Island (UHI) and differences in vapor pressure (VP) is noted; i.e., urban areas were drier than suburban (rural) areas, and RH increased during night in urban areas [18].
Various humidity parameters have been studied in urban areas, such as RH (in %) [2,13], AH (in g/m3) [19], Q (in gwater per kgmoist_air) [3,20], Ea (in hPa) [2,21,22]; and humidity ratio (in gwater per kgdry_air) [4]. Oke et al. [10] recognize multiple factors influencing UCL humidity, such as synoptic conditions, urban morphology, urban thermal fields, relative lack of vegetation, extensive impervious surfaces, urban water bodies, advection, vertical turbulent transfer, anthropogenic sources of water vapor; as well as some particular events (e.g., precipitation, dew, frost, snow, etc.). However, Lau and Luo [3] suggest that there are three main drivers of UDI occurrence: changes in surface properties, vegetation deterioration; and UHI effect, and all of these are strongly correlated to urbanization.
Compared to UHI studies, the humidity of UCL seems to be less investigated. Some of the reasons for that are the complexity of the UCL humidity assessment and measurements compared to temperature [10]. Yang et al. [4] state that there are gaps in the available studies on urban humidity, which indicate a possible direction of further research. These gaps are related to the lack of studies employing Local Climate Zones (LCZ) concept in humidity investigation, and dominant focus on urban–rural differences, without analyzing the fine scale differences in humidity in urban environment. Urban humidity patterns were often analyzed by employing one urban and one rural station [5,14,15], or using the traverse measurements [1]. The data sources are often long-term fixed stations whose original design is not for urban climate studies, but for common meteorological issues [4]. There are state of the art technologies made for urban climate measurements which provide high level of accuracy, but their wider applicability is limited due to the more complex technological, financial, and knowledge requirements [23]. Modeling could be useful in overcoming the mentioned gaps since it has important role in modern urban climate research (e.g., [7,24]).
The concept of LCZs emerged in 2012, and ever since is widely accepted classification scheme of urban and surrounding areas for the purposes of urban climate research [25]. Numerous LCZ-based urban meteorological networks (UMNs) were developed (e.g., NSUNET in Novi Sad, Serbia [26,27,28]; UMN in Szeged, Hungary [29,30,31]; BUCL network in Birmingham, UK [32,33]; MOCCA network in Ghent, Belgium [34]; and MUSTARD network in Dijon, France [35]) the meteorological data from the UMNs has proven to be useful in the studies of temperature and humidity characteristics in cities [4,22,36]. Kopp et al. [37] emphasize the importance of knowing ecohydrological properties of LCZ in their applicability in research related to urban adaptation to climate change.
The present work wants to increase the knowledge on local-scale urban humidity characteristics by providing a detailed long-term meteorological data in various local climate zones (LCZs) in diverse built-up and natural environments of a central European city of Novi Sad (Serbia). This analysis could be used for the development of climate-sensitive urban design to tackle the negative aspects of urbanization and climate change in cities. The occurrence of heat waves as well as their intensity are expected to increase [38,39,40,41]. To mitigate intensive heat stress and thermal discomfort it is very important to contribute to climate sensitive urban design and provide guidelines for the warmer future [38]. This is achieved by studying various aspects of weather and microclimate, not only temperature, and their influence on human health, air pollution, urban ecological systems, and thermal comfort.
The following tasks have been performed in this study:
  • Analysis of humidity characteristics in LCZs of Novi Sad on annual, seasonal, and monthly level as well as during heat wave (HW) and cold wave (CW) period;
  • Assessment of the influences of air temperature on humidity in LCZs of Novi Sad; and
  • Discussion of the main findings and provision of major conclusions for future humidity studies in cities.

2. Study Area, Data, and Methods
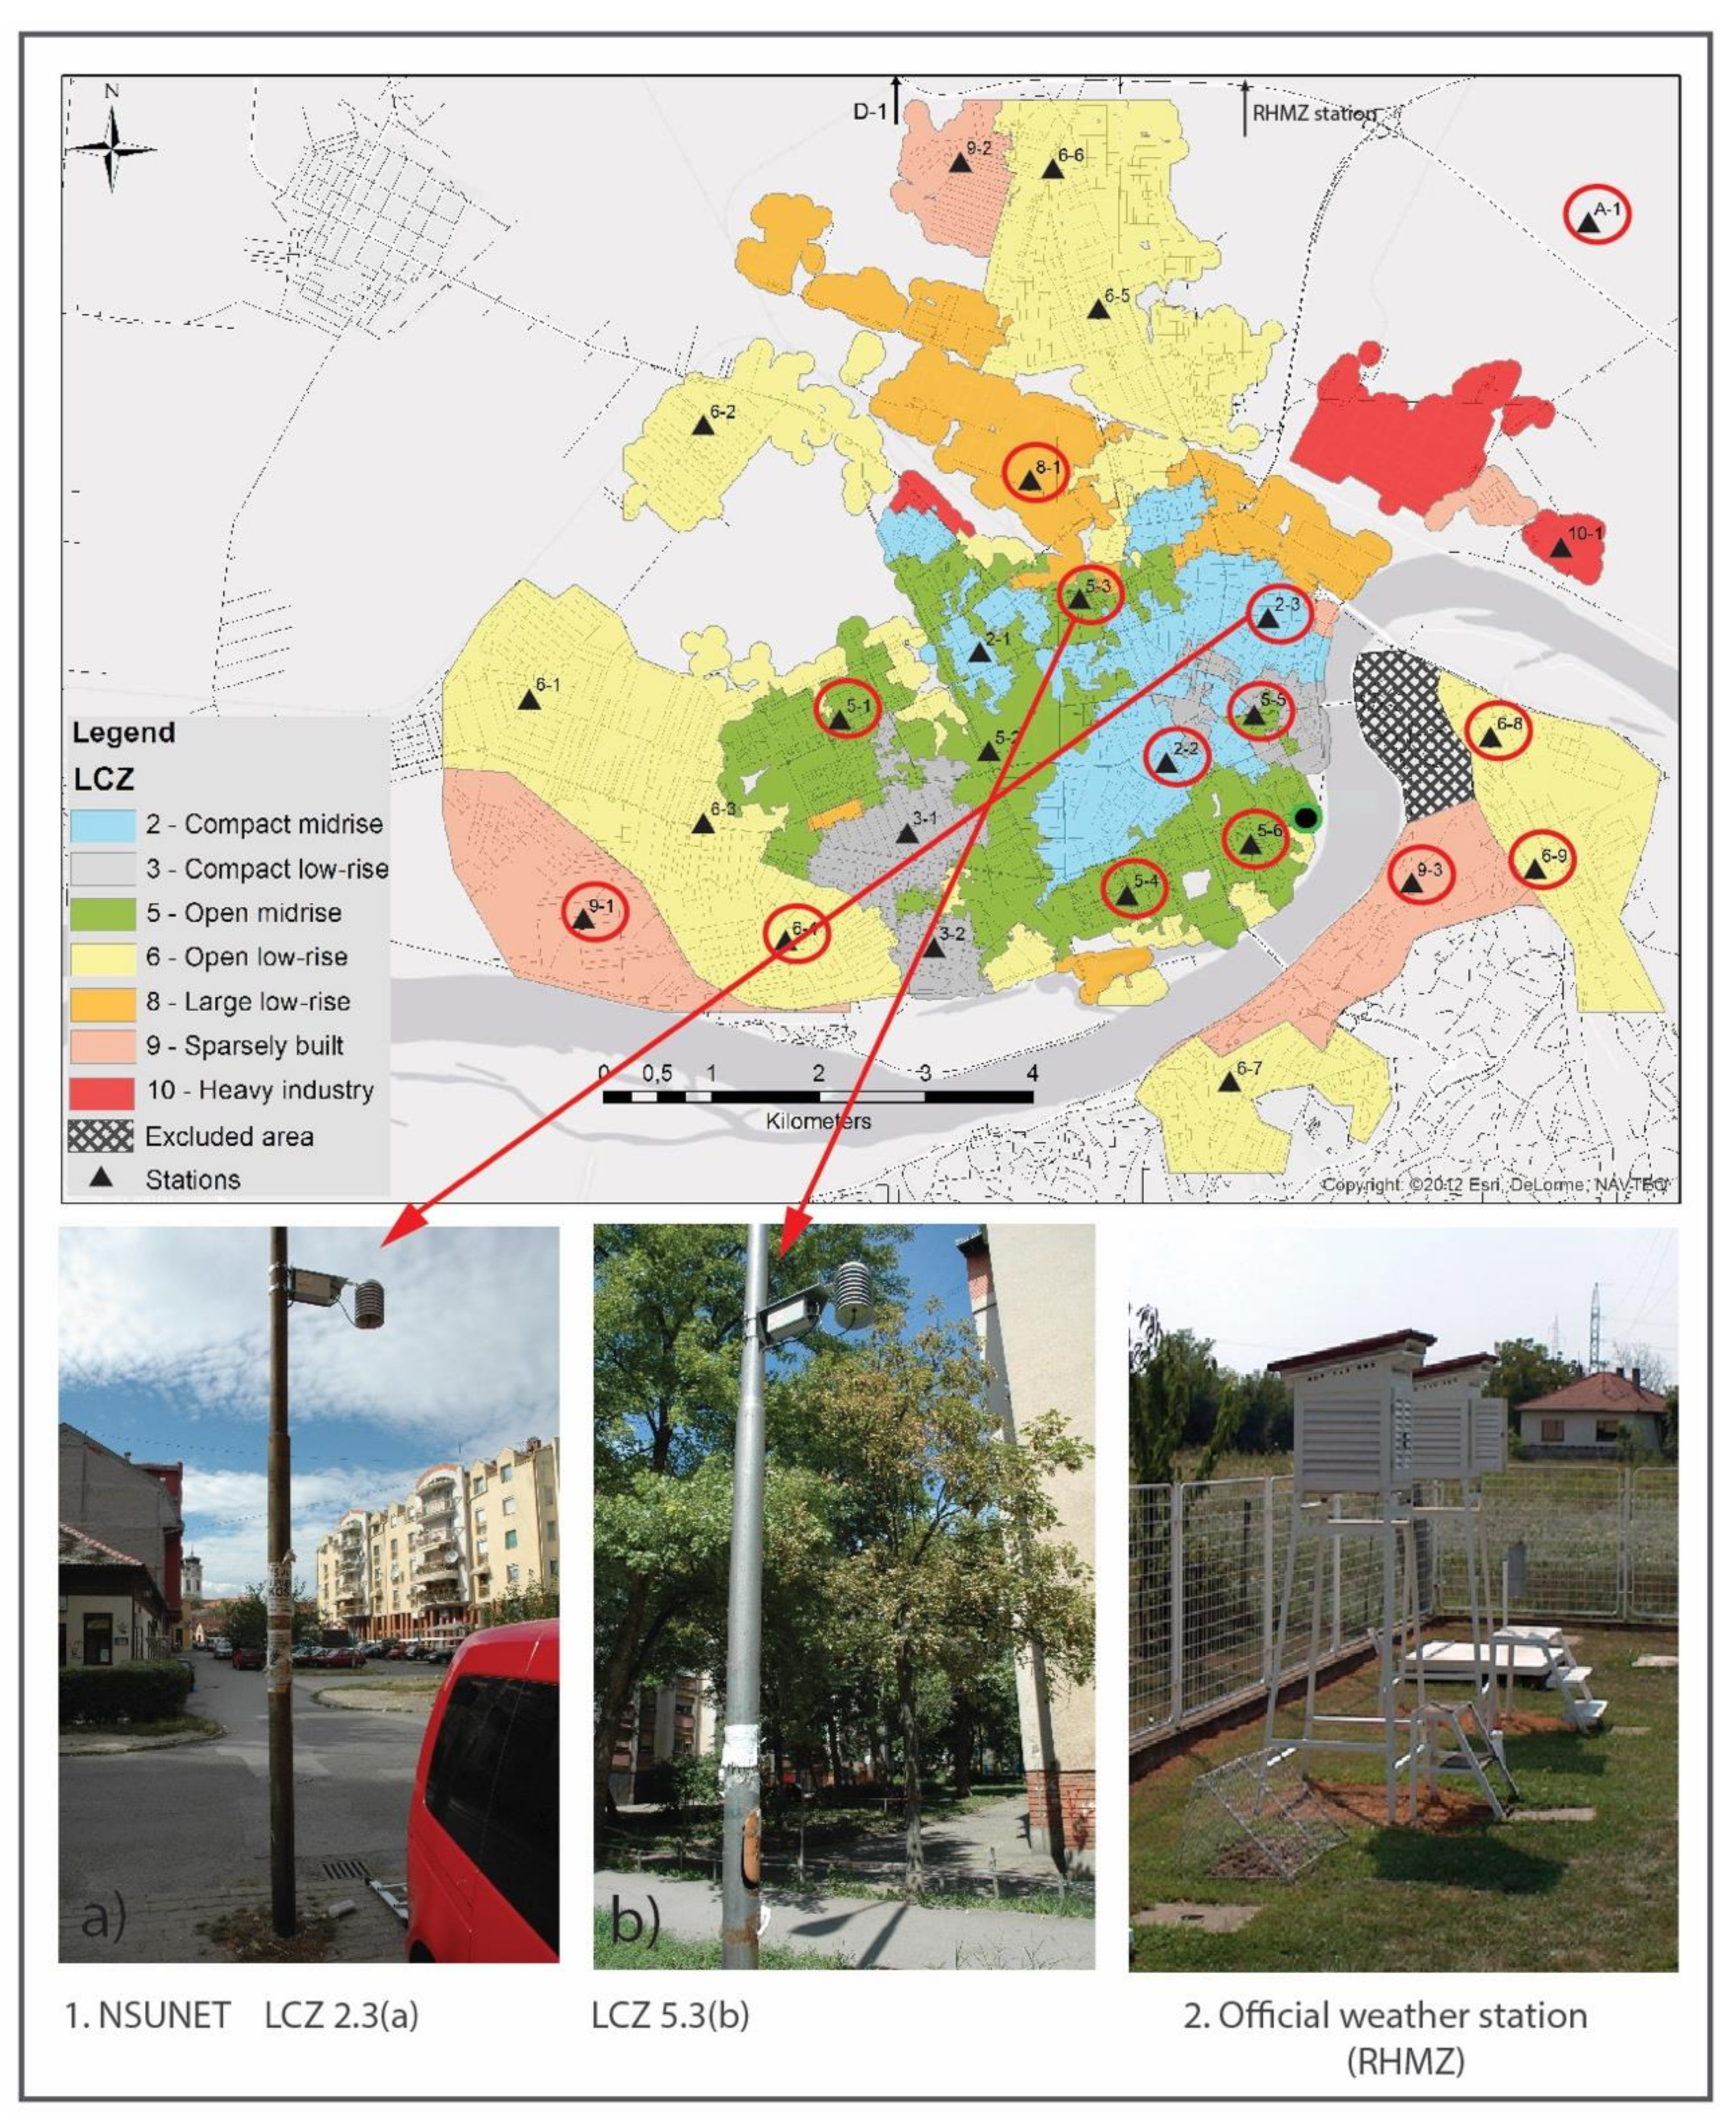
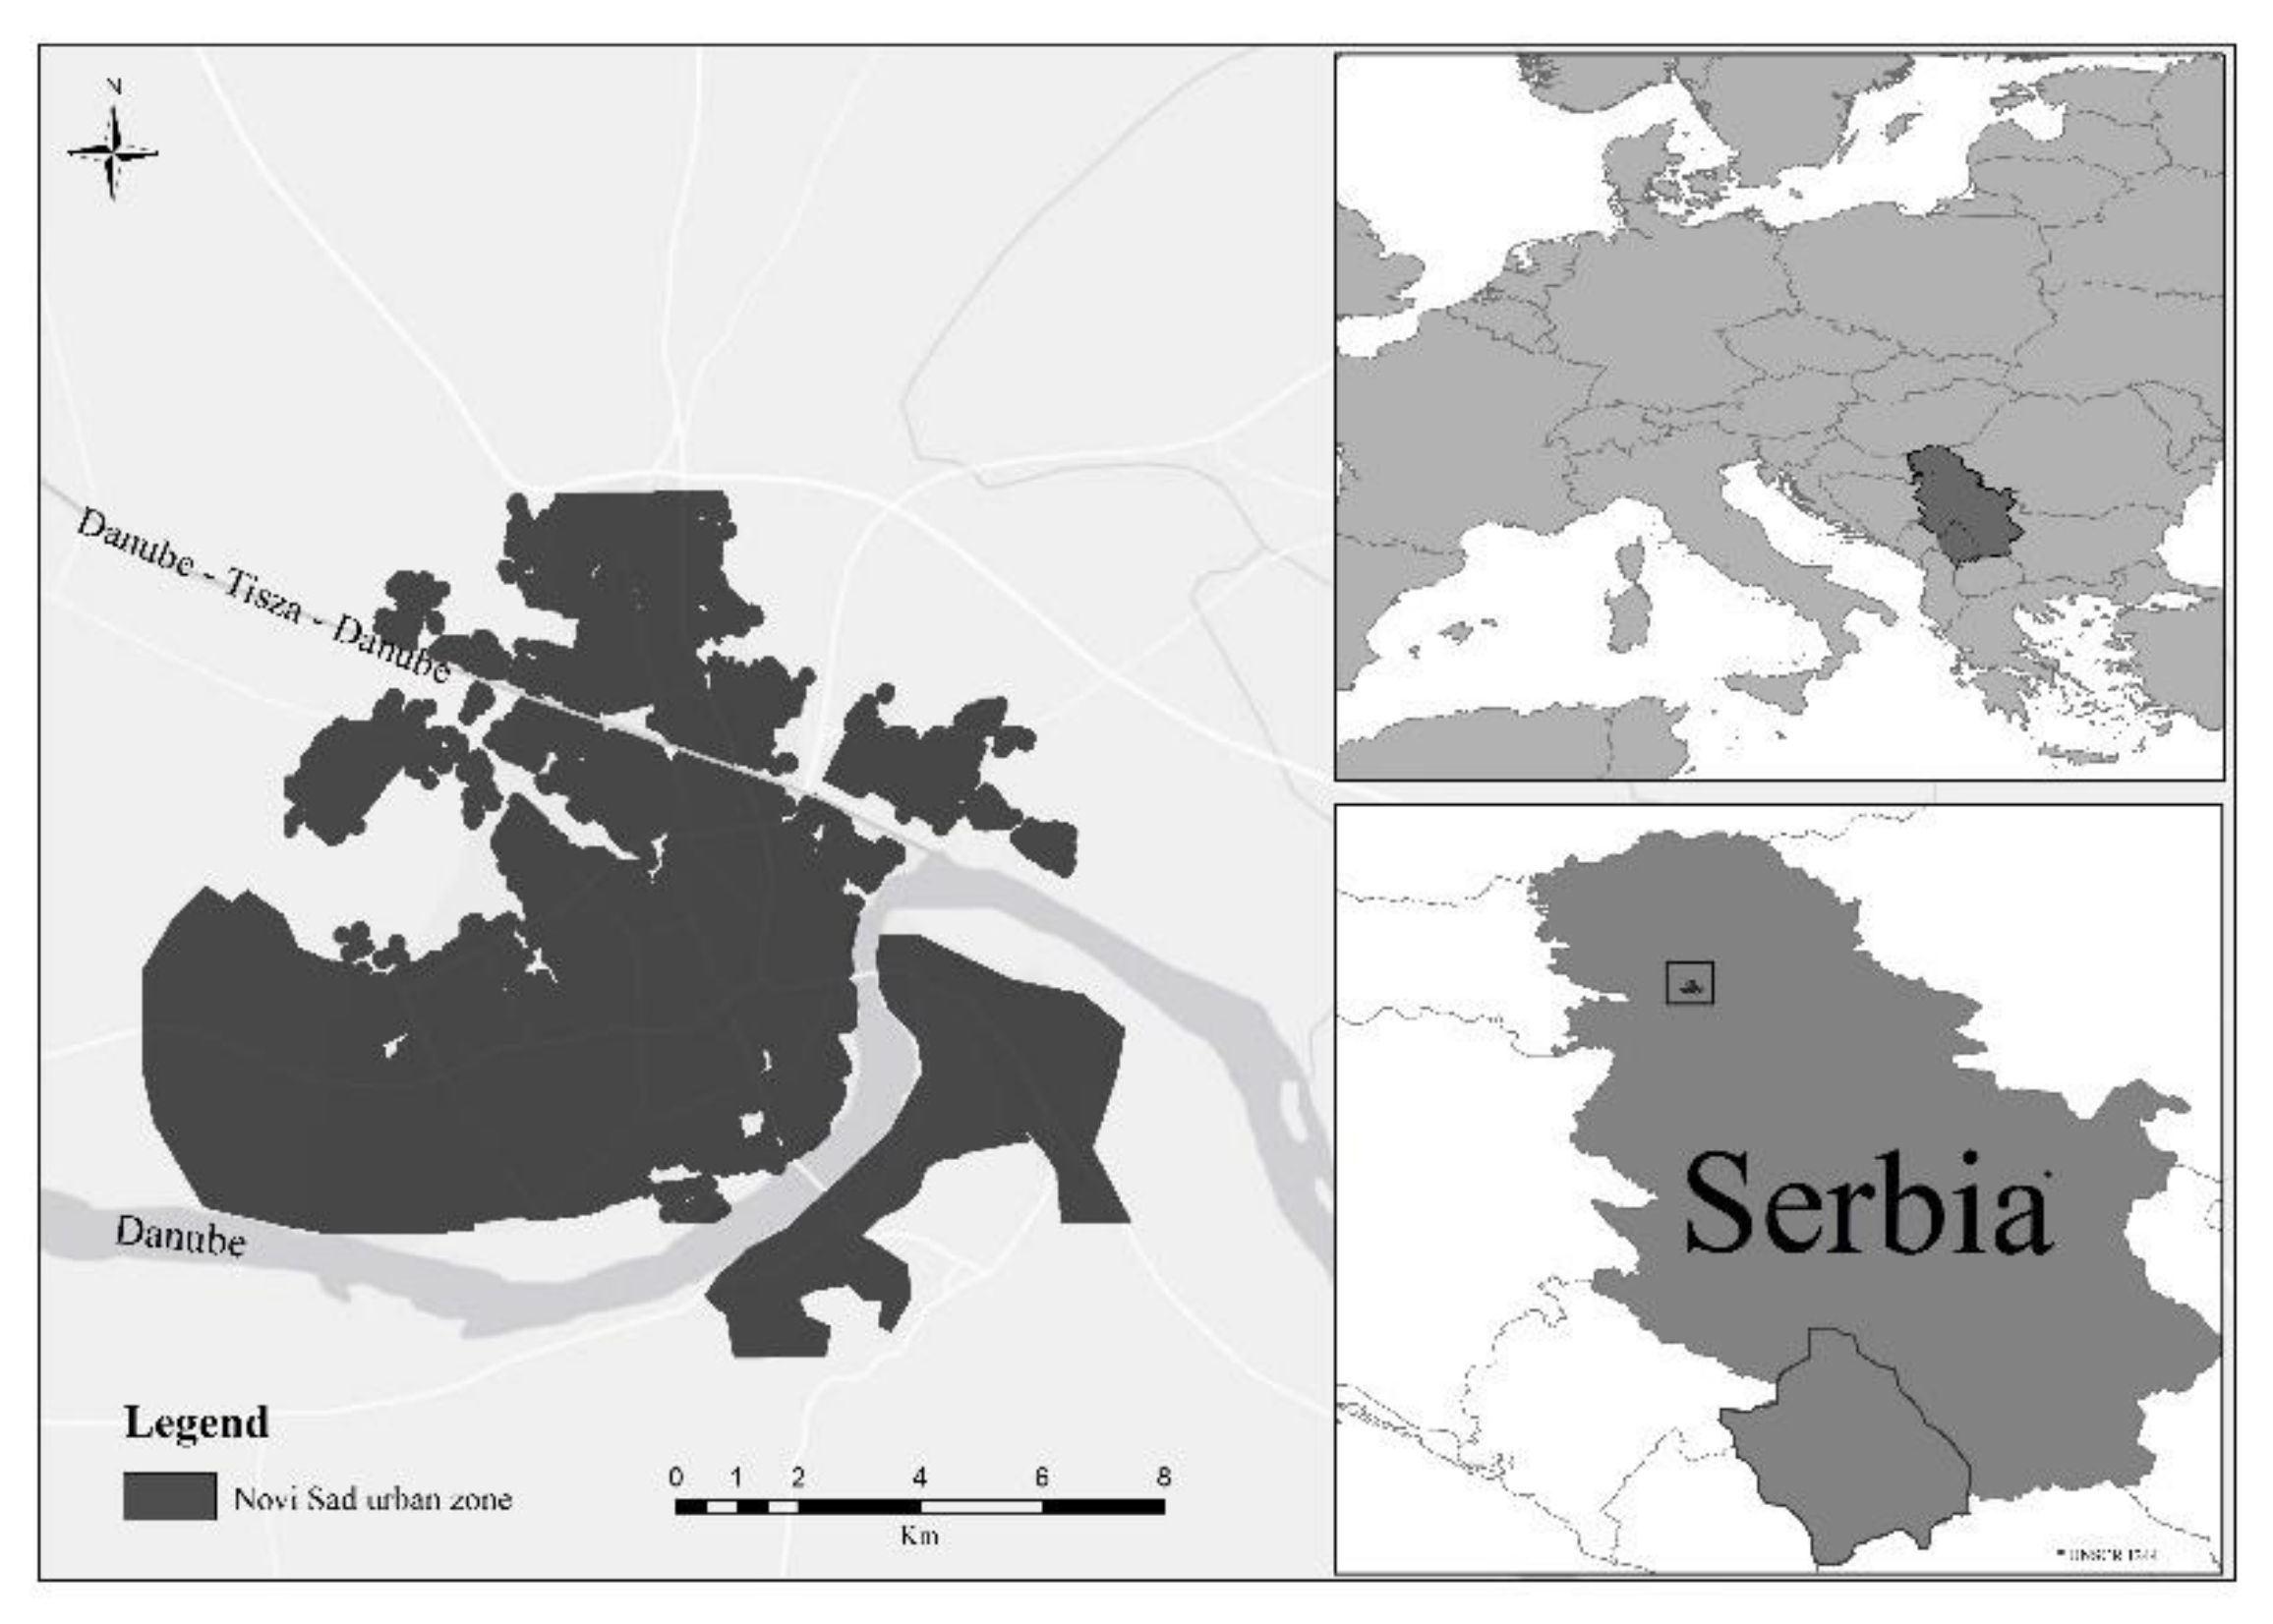
2.1. Study Area

The investigated city is Novi Sad, located in the northern part of Serbia, in Central Europe (45°15’ N, 19°50’ E). The city has developed on the flat terrain of the Pannonian Plain (80–86 m a.s.l.) with only a smaller fraction of the city located on the slopes (90–200 m a.s.l.) of the low Fruška Gora Mountain (the highest peak is 539 m a.s.l.) located to the south of the city. Between the city and the mountain is the Danube River that separates the most urbanized part of the city from the southern hilly terrain. In addition to the Danube River, the Danube-Tisa-Danube Canal is another water body that flows in the northern part of the city (Figure 1).
The City of Novi Sad is characterized by the Cfb temperate climate [42] with the coldest month of January (Tmean = 0.2 °C), the warmest month of July (Tmean = 21.9 °C), and the annual Tmean of 11.4 °C during the climatological standard normal period (1981–2010) provided by the Republic Hydrometeorological Service of Serbia. In the same period, the mean annual precipitation was about 647 mm. The lowest mean monthly relative humidity was in May (RHmean = 66%), the highest in December (RHmean = 86%), and the annual RHmean was about 74%.
The urbanized area of the city is about 112 km2 with a population of 325.000. The city was delineated in LCZs [43] with the application of the automated GIS method (see [29]). As a result, an easy-to-understand LCZ map was obtained with delineated seven built-up and three land cover LCZ types. The built-up zones are compact midrise (LCZ 2), compact low-rise (LCZ 3), open midrise (LCZ 5), open low-rise (LCZ 6), large low-rise (LCZ 8), sparsely built (LCZ 9), and heavy industry (LCZ 10). The land cover zones are dense trees (LCZ A), low plants (LCZ D), and water (LCZ G). Downtown area is densely built with compact low-rise houses (LCZ 3) and midrise buildings (LCZ 2). Residential and commercial areas with midrise buildings in open green spaces (LCZ 5) are located around the downtown. North, west, and south of this area are characterized with low-density residential housing (LCZs 6 and 9). Moreover, in the northern part of the city are located industrial areas with large low-rise warehouses (LCZ 8) and heavy industry (refinery) (LCZ 10). The predominant agricultural area with low plants (e.g., corn and maize) (LCZ D) is located to the west, north, and east of the city, while north of the city is also located a managed forested area (LCZ A) [44]. Spatial analysis of urban climate parameters using the concept of LCZs allows detailed analysis considering local surroundings at the finer scale. LCZs are already used for the assessment of land surface temperatures (LSTs) in the city of Novi Sad [45] and spatial patterns of precipitation [46].

2.2. Data

We have used data from two different sources for the two-year period (December 2015–December 2017):
(i)
Average hourly RH and Ta data from 14 stations that are part of the NSUNET (Figure 2). The stations are equipped with fully calibrated air temperature and relative humidity General Electric Measurement & Control Company’s ChipCap 2 sensors (precision and accuracy ±2%RH, ±0.3 °C, 14bit). Sensors are individually calibrated and tested by manufacturer, performing at ±2% from 20% to 80% RH (±3% over entire humidity range), usable without further calibration or temperature compensation. The sensors are placed in radiation protection screens [27,28].
These stations are located in LCZ 2 (two stations), LCZ 5 (five stations), LCZ 6 (3 stations), LCZ 8 (1 station), LCZ 9 (2 stations), and LCZ A (one station). Supplementary Materials provide additional information about the typical surface properties of 250 m radius environment around stations for each LCZ (obtained from [47]); and
(ii)
7 h, 14 h, and 21 h measurements of air pressure, from the official meteorological station of the Republic Hydrometeorological Service of Serbia (RHMZ) (Figure 2). Air pressure (in mb) data were used for the calculation of Q.
In this regard, a comprehensive database was created for further detailed analysis of humidity characteristics and influencing factors in the city and its surroundings.

2.3. Methods

Differences between the humidity indicators were investigated between urban LCZ sites (LCZs 2, 5, 6, 8, 9) and natural LCZ A as a reference site. LCZ A is selected as a reference site for following reasons:
  • LCZ A represents the zone with dense trees on a local scale, where evapotranspiration rate is higher than in other urban LCZs in Novi Sad; and
  • LCZ A can also be considered as a natural (rural) LCZ in the vicinity of Novi Sad.
We examine several different humidity indicators (measures of humidity): RH, Ea, VPD, AH, and Q.
According to Yang et al. [4], RH is one of the most widely used measure for humidity research. Its popularity is due to its simple mathematical expression and understandability [10,13]. It is a function of temperature and water vapor content in the air. It is highly controlled by temperature, and patterns of RH typically exhibit a close inverse relationship with temperature [4]. RH as an indicator represents the ratio (%) of the actual vapor pressure to the saturation vapor pressure at the given temperature and pressure. It shows how close the air is to saturation at the present temperature, but it is not the direct (absolute) measure of moisture content or its vapor deficit, which means that it is not suitable for the assessment of horizontal and vertical differences in moisture content across the landscape. Even though it cannot be used to describe if the air is more or less moist, RH is useful in predicting the likelihood of condensation [10].
Different measures have been used to determine the actual vapor content in the air: vapor pressure (hPa), dew point temperature (°C), absolute humidity (g/m3), specific humidity (g water/kg moist air), and humidity ratio (g water/kg dry air). To determine the humidity of the urban area of Novi Sad, we use some of the direct measures of atmospheric humidity: VPD, Q, AH, and Ea.
Actual vapor pressure (Ea) in hPa is calculated as following [3]:
E a = E s × R H / 100
Saturated vapor pressure (Es) in hPa is calculated with the Bolton equation [3,48]:
E s = 6.112 × exp 17.67 × T 243.5 + T
where T is temperature in °C.
Absolute humidity (AH) is a direct measure of atmospheric humidity and represents the ratio of the mass of the water vapor in the total air volume [10]. We calculated the AH following Vaisala [49] formula:
A H = C × E a × 100 273.15 + T
where C = constant 2.16679 gK/J.
Specific humidity (Q) represents the mass ratio between the mass of the water vapor and the mass of the moist air, and it is a conservative humidity measure, which means that the humidity of an air parcel does not change even if the pressure or the temperature changes [10]. We calculated Q (in g/kg) following formula [3]:
Q = 622 × E a P 0.378 × E a
It should be mentioned that Q values are calculated using P values from the official meteorological station of the Republic Hydrometeorological Service of Serbia, which records the data three times a day (07:00, 14:00, and 21:00). Therefore, hourly analysis of Q could not be performed.
Vapor pressure deficit (VPD) is an important indicator for studying the water cycle in the climate system because it provides a measure of the difference between the actual amount of vapor in the air and the saturated vapor [3,50,51]. This means that VPD shows the difference between how much moisture the air can hold before saturating and the amount of moisture actually present in the air and is also known as drying power of the air [52,53]. It is a difference between actual and saturated vapor pressures (Ea−Es). It is strongly connected to the UHI effect because it induces an increase in saturated pressure which leads to water vapor deficit [54].
Vapor pressure deficit (VPD) in hPa is calculated as follows [3]:
V P D = E s E a
Bearing in mind that most of the humidity indicators are connected to the temperature, and could not be discussed independently, we discussed temperature patterns and their relationship with humidity indicators. The data on T and RH was obtained from 14 stations located in 6 LCZs (2, 5, 6, 8, 9, A) which are part of NSUNET.
Dataset was preprocessed by suitable anomaly detection algorithm for climate time series which detects outliers based on an autoregressive cost update mechanism [55]. After preprocessing all the stations with more than 5% of missing data were excluded, leaving the 14 stations in 6 LCZs in Novi Sad. Detailed procedure od quality control process is described in Milošević et al. [44]. According to Mayer et al. [56], urban moisture characteristics depend on specific site conditions within UCL, current weather and climate zone of the area, and temporal factors such as time of the day and season, because they affect energetic processes related to the emission or condensation of water vapor. Therefore, we analyzed annual, seasonal, monthly, and daily dynamics of air temperature and several air humidity indicators in 6 LCZs in Novi Sad, Serbia. For daily dynamics assessment we chose HW and CW periods, because of their extreme yet relatively stable meteorological conditions during the few consecutive days. The periods of HW and CW are defined as periods of minimum 5 consecutive days with maximum daily temperatures significantly higher/lower than normal values, according to the Republic Hydrometeorological Service of Serbia. In this case, HW period occurred 20–25 June 2017, and CW occurred 6–12 January 2017.

3. Results and Discussion

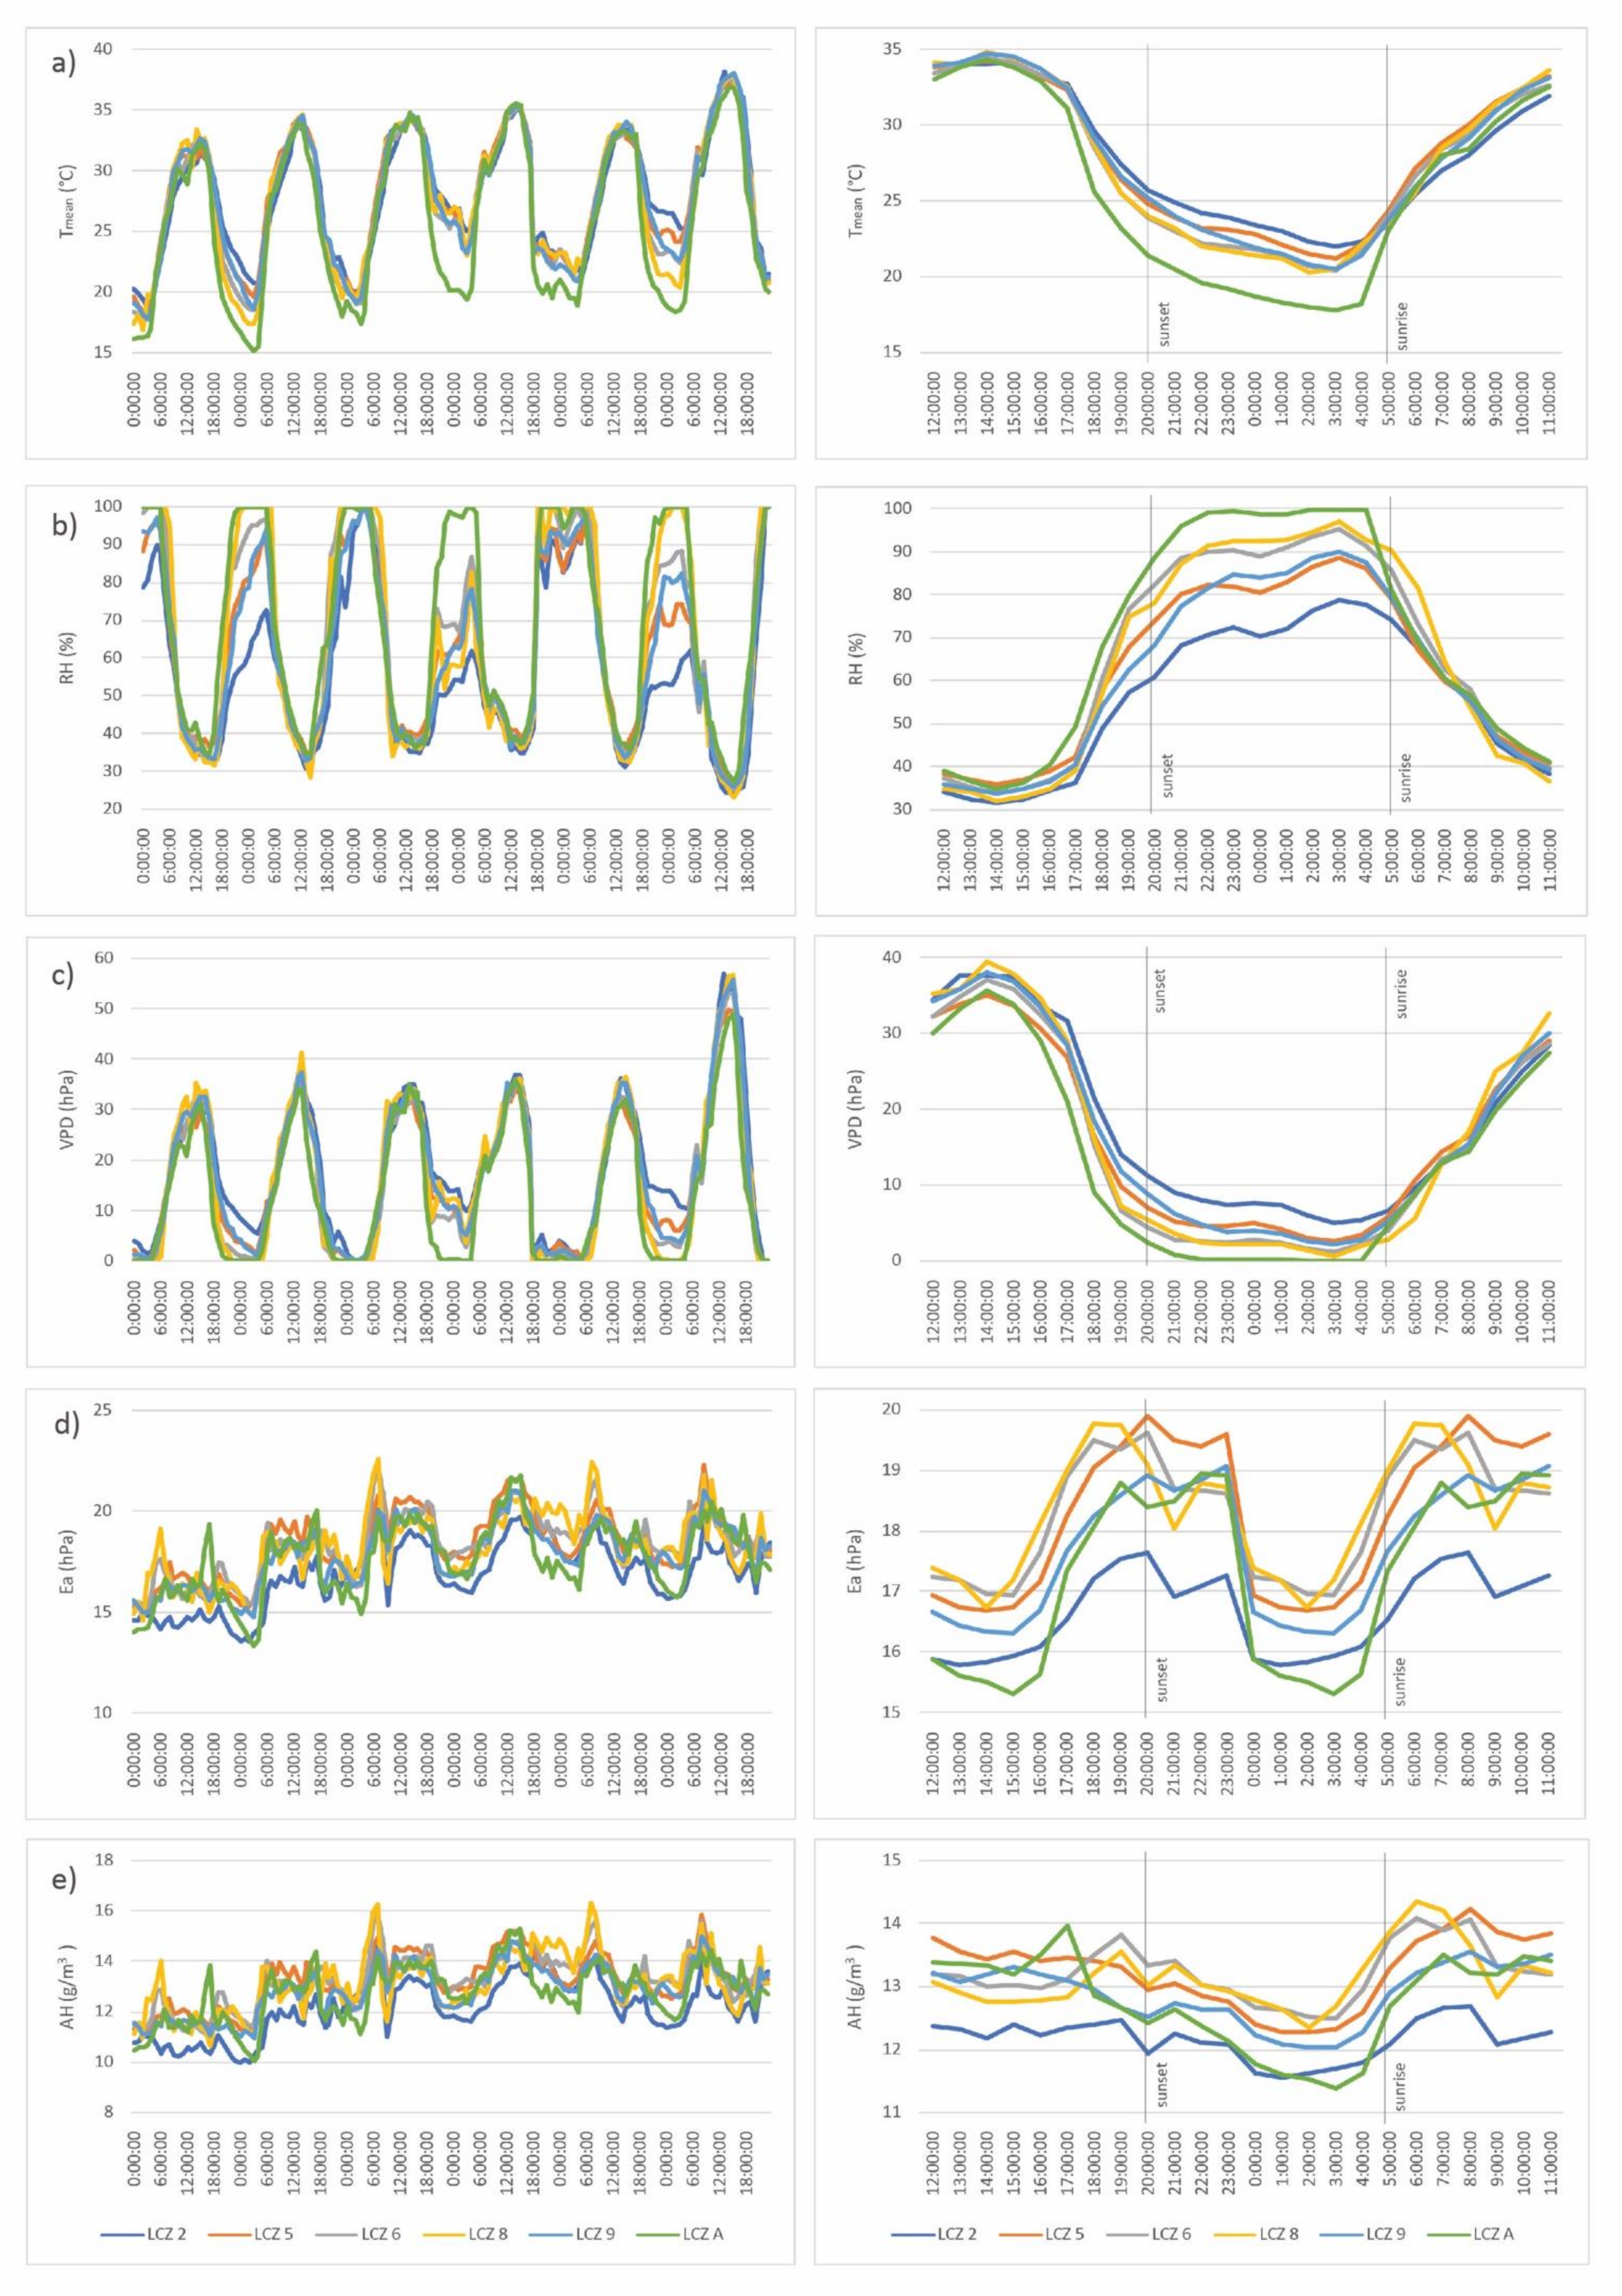
3.1. Annual Variations in Air Temperature and Air Humidity Parameters (RH, VPD, Q, AH, Ea) among LCZs

Annual variations of mean air temperatures, RH, VPD, AH, Q, and Ea are presented in Table 1. On an annual level, mean air temperatures (Tmean) tend to decrease from more compact built-up LCZ 2 to less densely built-up LCZs (6 < 8 < 9 < 5) and natural LCZ A. The greatest difference occurs between LCZ 2 and LCZ A (TLCZ 2-LCZ A=1.9 °C), while intra-urban differences are significantly lower (TLCZ 2-LCZ 6 = 0.6 °C). This is confirmed in previous studies from Novi Sad, Serbia [44]; Szeged, Hungary [30,31]; and Berlin, Germany [57]. Further attention to air temperature dynamics will be paid in the context of its relationship with air humidity. Detailed analysis of air temperature dynamics in LCZs of Novi Sad is available in [44].
Mean annual values of RH show direct inverse relationship with the mean air temperature. The lowest values are observed at LCZ 2, and the highest values are observed in LCZ A (RHLCZ 2-LCZ A = −9.9 %). The differences in mean RH values are smaller among the intra-urban LCZs (9 < 8 < 5 < 6) and they are ~1%, except for the LCZ 2, where mean RH values express the difference up to 6.4% (RHLCZ 6-LCZ 2). Similar results in annual RH being greater in rural than in urban areas are reported in Moscow, Russia [12]; Nanjing, China [4]; Chicago, USA [14]; London, UK [15]; and Zaragoza, Spain [1]. The opposite result was reported in Vujović et al. [58], where RH at urban site was greater than at rural site in Belgrade, Serbia. They stated that the reason for that, as well as for the increase in Ea at urban site, might be that surface dew point at the rural site was reached earlier, more often, and lasted longer than in the urban environment. Other than that, they considered anthropogenic releases of water vapor from combustion in the city [58].
Mean annual values of VPD show low differences among LCZs. The lowest values are observed in LCZ A while the highest values are observed in LCZ 2. Intra-urban differences in moisture deficit are lower than between urban and natural LCZs. The differences vary from 1.14 hPa (VPDLCZ 2-LCZ 5) between urban LCZs, to 2.16 hPa (VPDLCZ 2-LCZ A) between urban and natural LCZs. This means that on annual level, VPD is present in urban LCZs, especially in densely built up LCZ 2. The result is in accordance with the results from previous studies, such as Yangze River Delta Urban Agglomeration (YRDUA), China [3].
The values of Q, AH, and Ea show similar pattern on annual level. The major differences occur between intra-urban LCZs, i.e., LCZ 5 (highest values) and LCZ 2 (lowest values). When observing the urban–natural differences, the major differences are noticed between LCZ 5 and LCZ A, for all three parameters. The highest values of absolute humidity parameters (Q, AH, and Ea) in LCZ 5 might be connected to morphological structure of LCZ 5 in Novi Sad, which consist of combination of impervious surfaces (buildings and boulevards) and green (pervious) surfaces. This type of morphological structure might tend to retain moisture from precipitation longer than in natural areas. On the other hand, a study from Szeged [22] reports that for annual and seasonal means of Ea, there is no clear relationship noticed between Ea and the morphology of LCZs. Other than that, as stated in [58], it might be that surface dew point at the natural site was reached earlier, more often, and lasted longer than in urban environment. However, it should be noted that the differences are below 1 (g/kg, g/m3, hPa), which indicate that the variations on annual level are rather low.
The results show relatively low differences between the values of different parameters among LCZs, except for RH. The analysis of annual mean differences in air temperatures and humidity indicators show rather general overview, but more detailed temporal analysis is needed to identify clearer patterns and more precise dynamics.

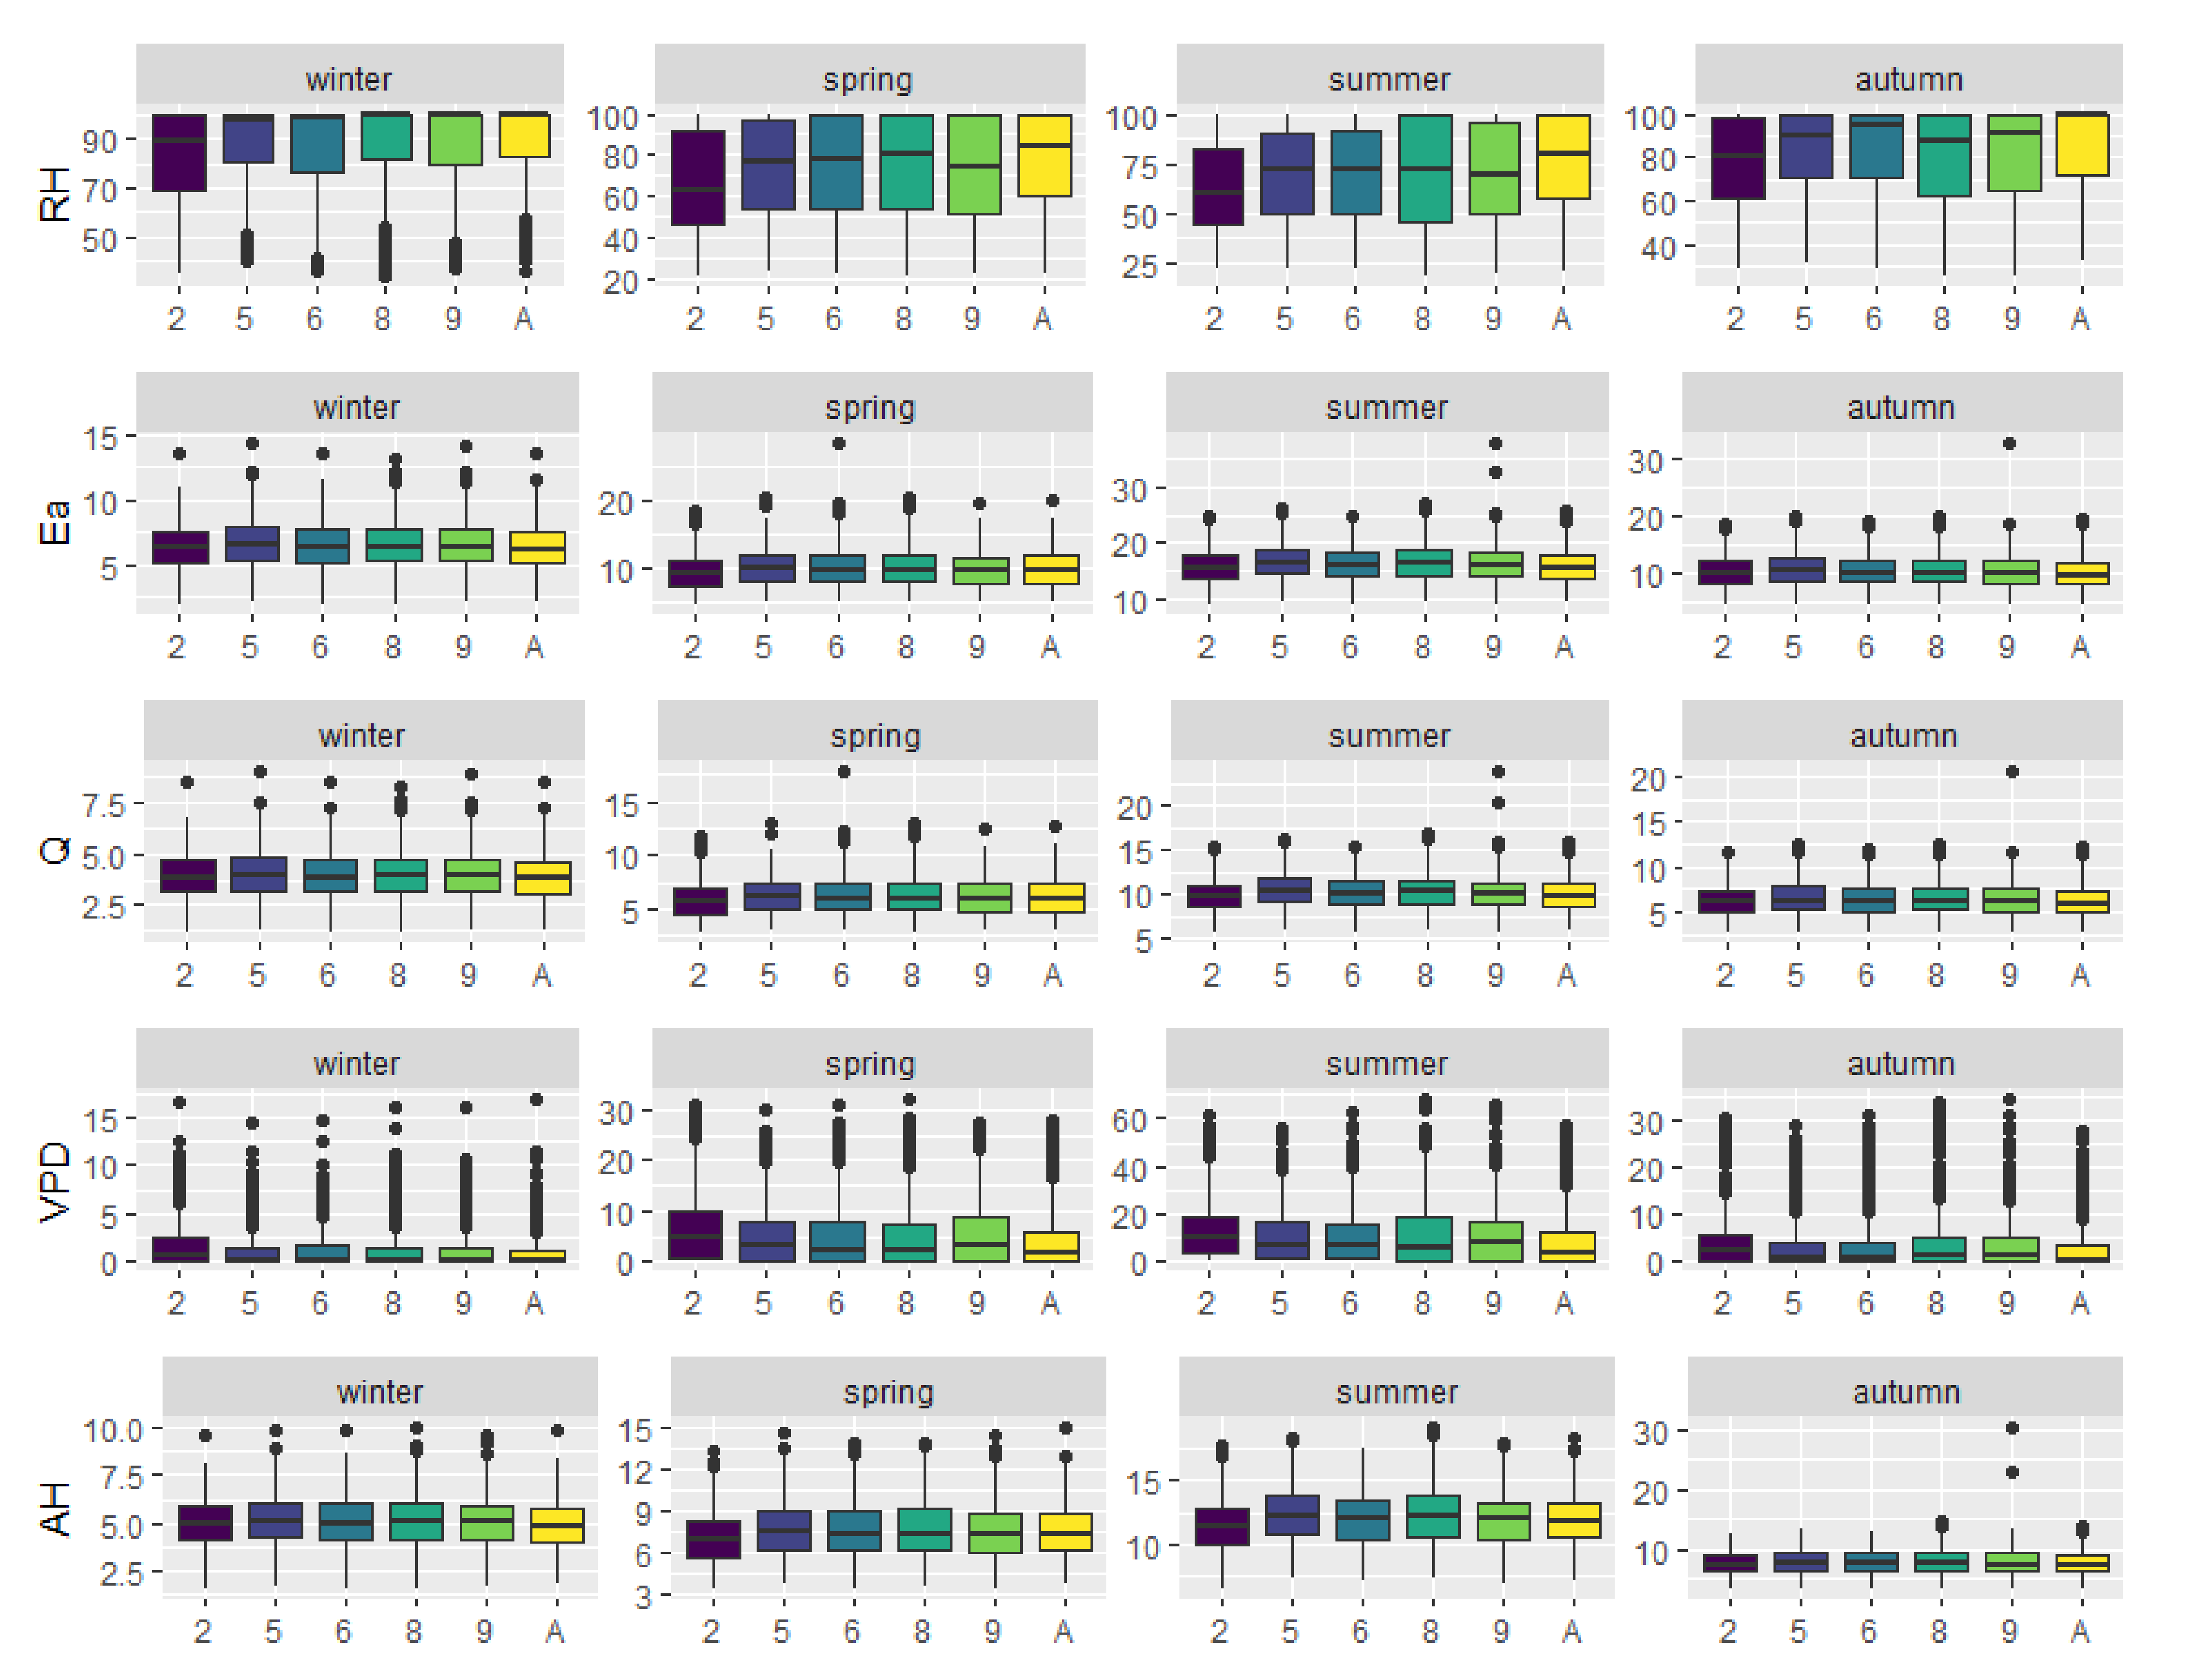
3.2. Seasonal Variations of Air Humidity Parameters (RH, Ea, Q, VPD, AH)

Seasonal distribution of mean values of humidity parameters (RH, Ea, Q, VPD, and AH) are presented in Figure 3. Mean seasonal RH values are the lowest in LCZ 2, and the highest in LCZ A in all seasons. The other urban LCZs (5, 6, 8, and 9) exhibit relatively similar mean values in winter and summer, and relatively small differences in spring (9 < 5 < 6 < 8) and autumn (8 < 5 < 9 < 6). In all seasons, RH values exhibit wide ranges (up to 40%), except for the winter season, when the ranges are narrower, but certain outliers are observed in LCZs 5, 6, 8, 9, and A. Yang et al. [4] also reported no significant seasonal variations for RH.
The values of Ea are the highest in summer but are very similar between the LCZs, and the values range is quite narrow. Slightly lower values are observed in LCZ 2. In spring and autumn, the values are rather similar between the LCZs. In winter, Ea values are the lowest in all LCZs, again with the small differences between LCZs. In winter, the values range is a bit wider than in other seasons.
Similar as Ea, Q values range is narrow in spring, summer, and autumn, and a bit wider in winter, when the values are the lowest. Higher values occur in spring and autumn, and the highest in summer. No significant differences among LCZs are observed. Similar results for Ea are observed in Szeged [22]. The largest values of Ea and Q in the summer could be explained with the high air temperatures in summer, which increases air capacity to hold water vapor resulting to the increase in Ea and Q [59].
AH values exhibit the largest mean seasonal values in summer (11–12 g/m3). The highest AH values in summer occur in LCZ 5 and the lowest in LCZ 2. Similar pattern for AH is observed in spring, but with lower mean values (7–8 g/m3). In Novi Sad, the main differences between LCZ 2 and LCZ 5 are reflected in the level of compactness. LCZ 2 is very densely built-up, with low level of greenery, whereas LCZ 5 is more open with more space between the buildings and more green spaces. As stated in [22], a microscale environment, pereambility of the surface, and the vegetation cover might be decisive factors for differences in moisture content. In autumn, the mean AH values are slightly higher (~9 g/m3), but there is no significant difference between the LCZs. In winter, mean AH values in all LCZs are rather similar (~5 g/m3). The value ranges are wider in winter, spring and in summer, while in autumn they are narrower. Ea, Q, and AH values are the lowest in winter, which might be explained with the low air temperatures that are limiting maximum water vapor content to small amounts [2].
VPD values are the highest in summer season, and the lowest in winter. In all seasons, the largest VPD is observed in LCZ 2, and the lowest in LCZ A. In summer and spring, the value range for all LCZs is wider than in autumn and winter seasons.

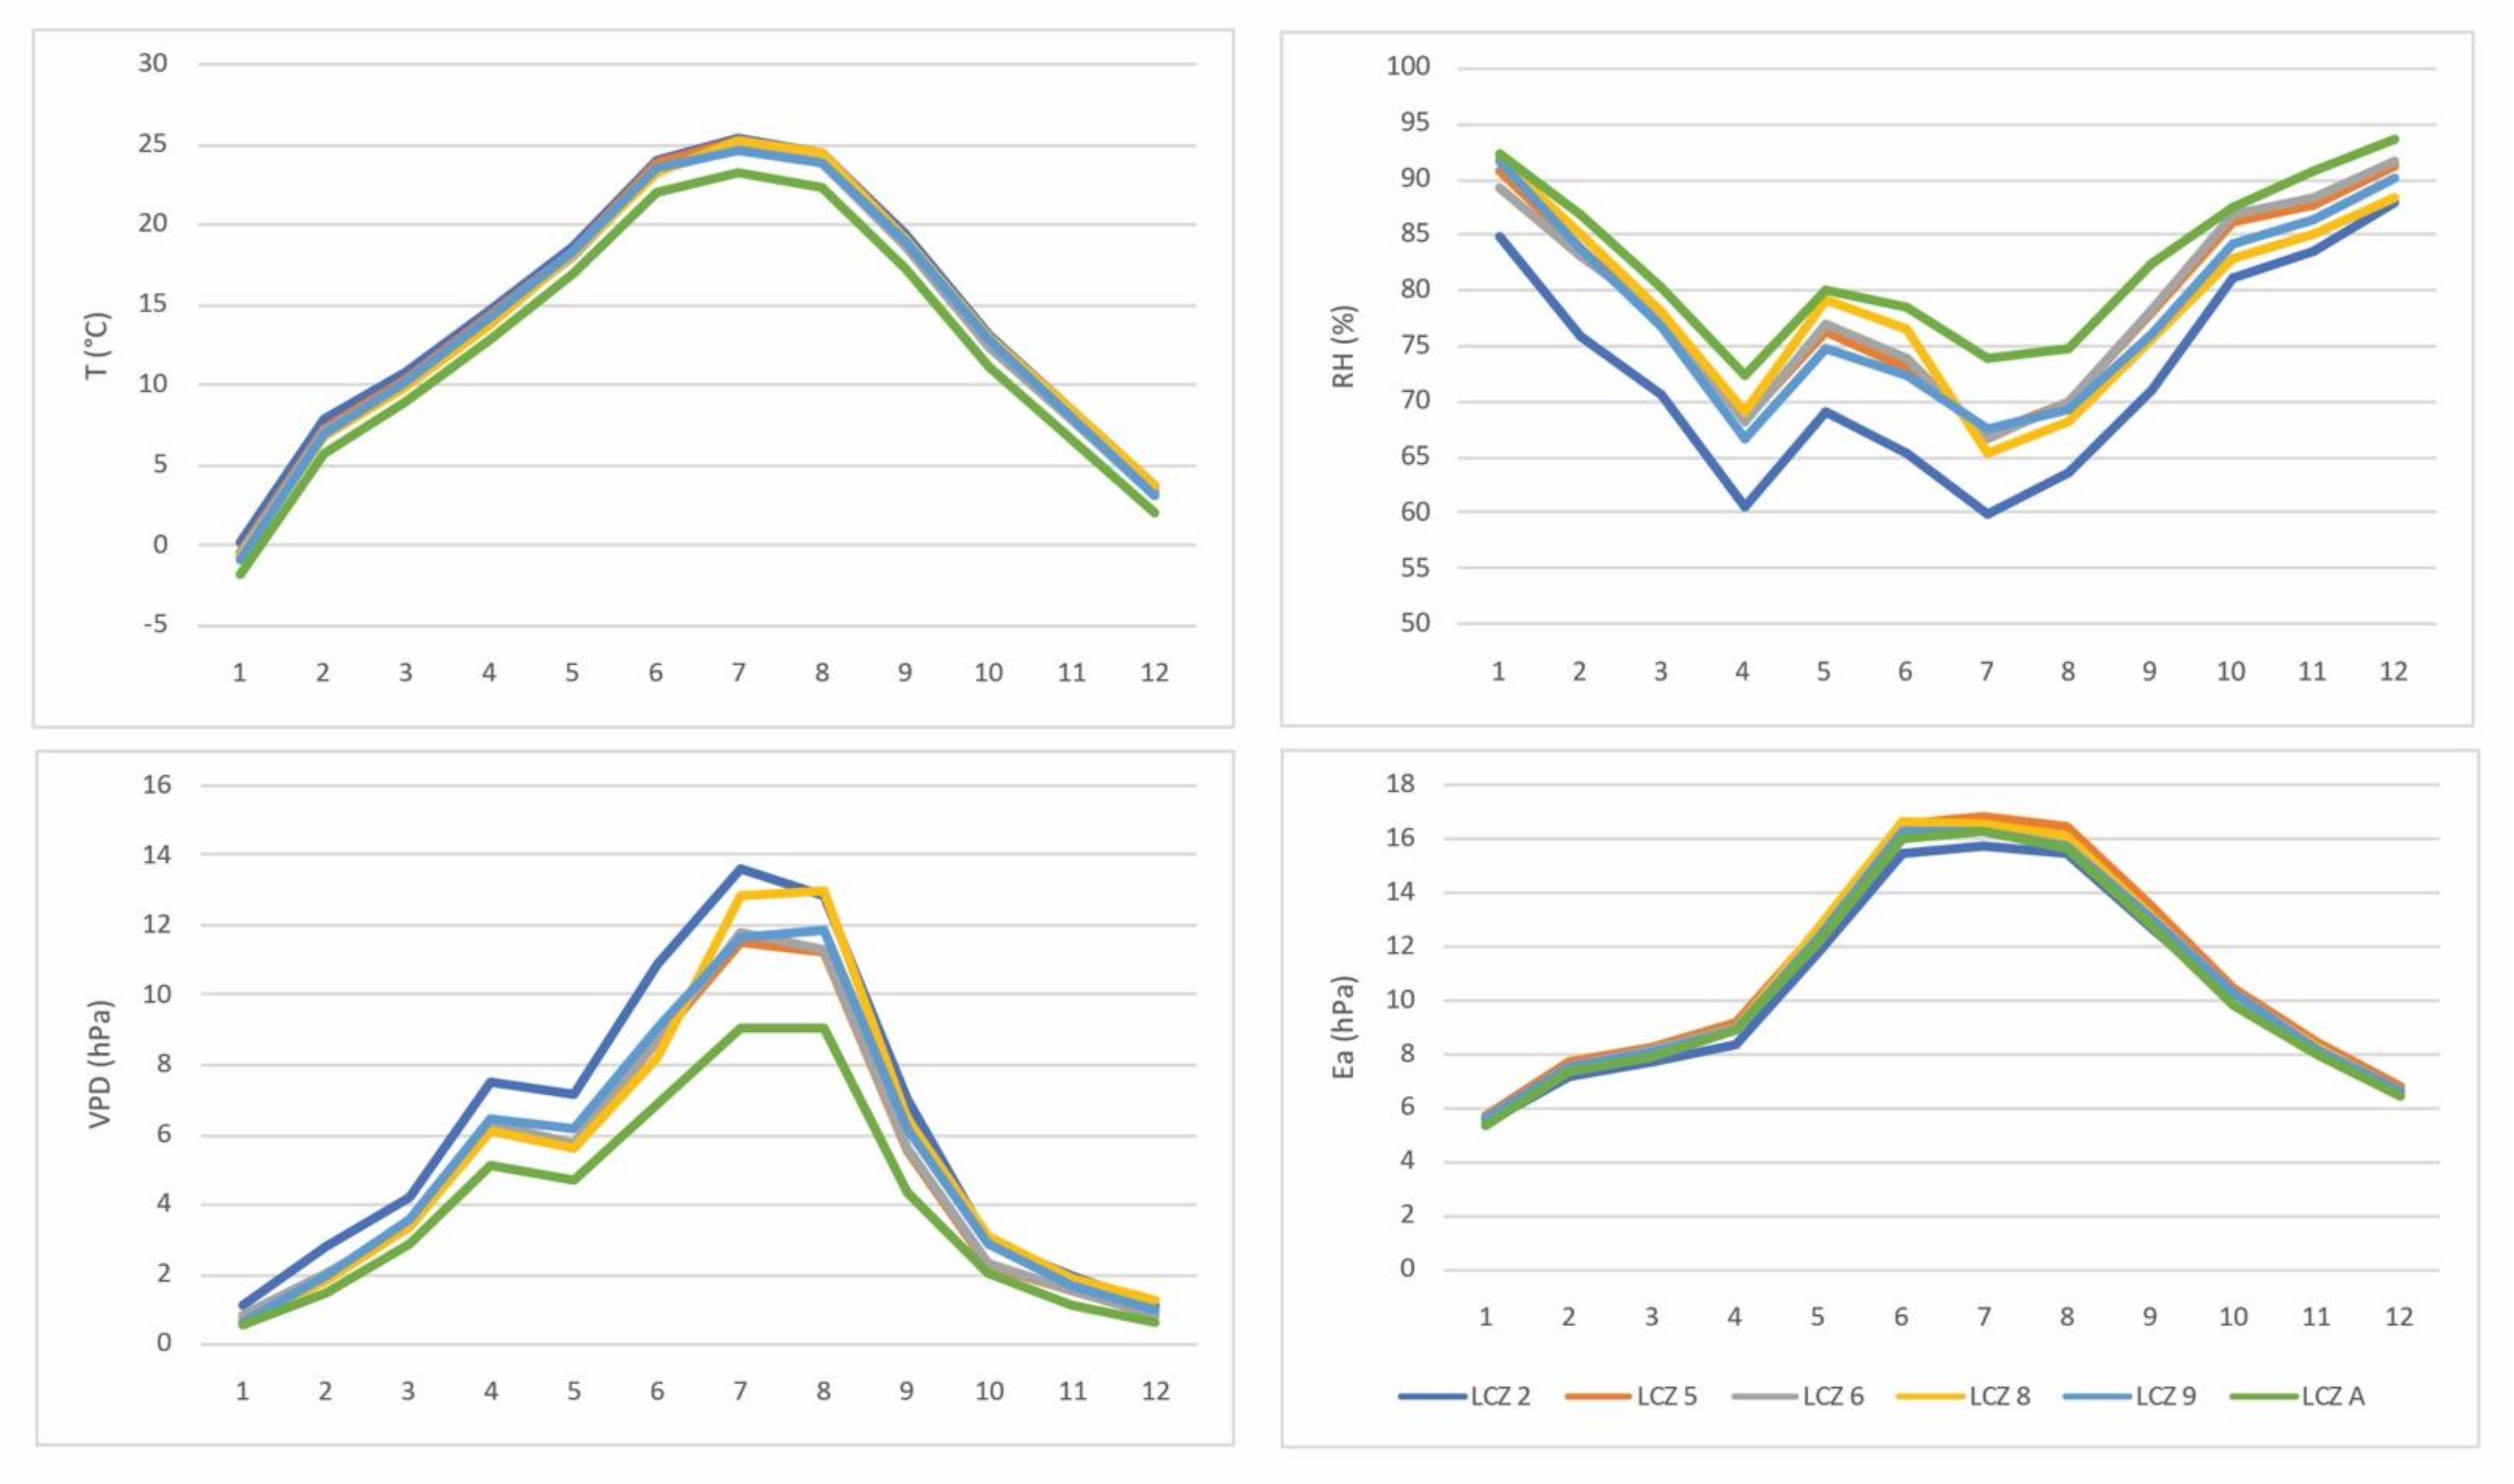
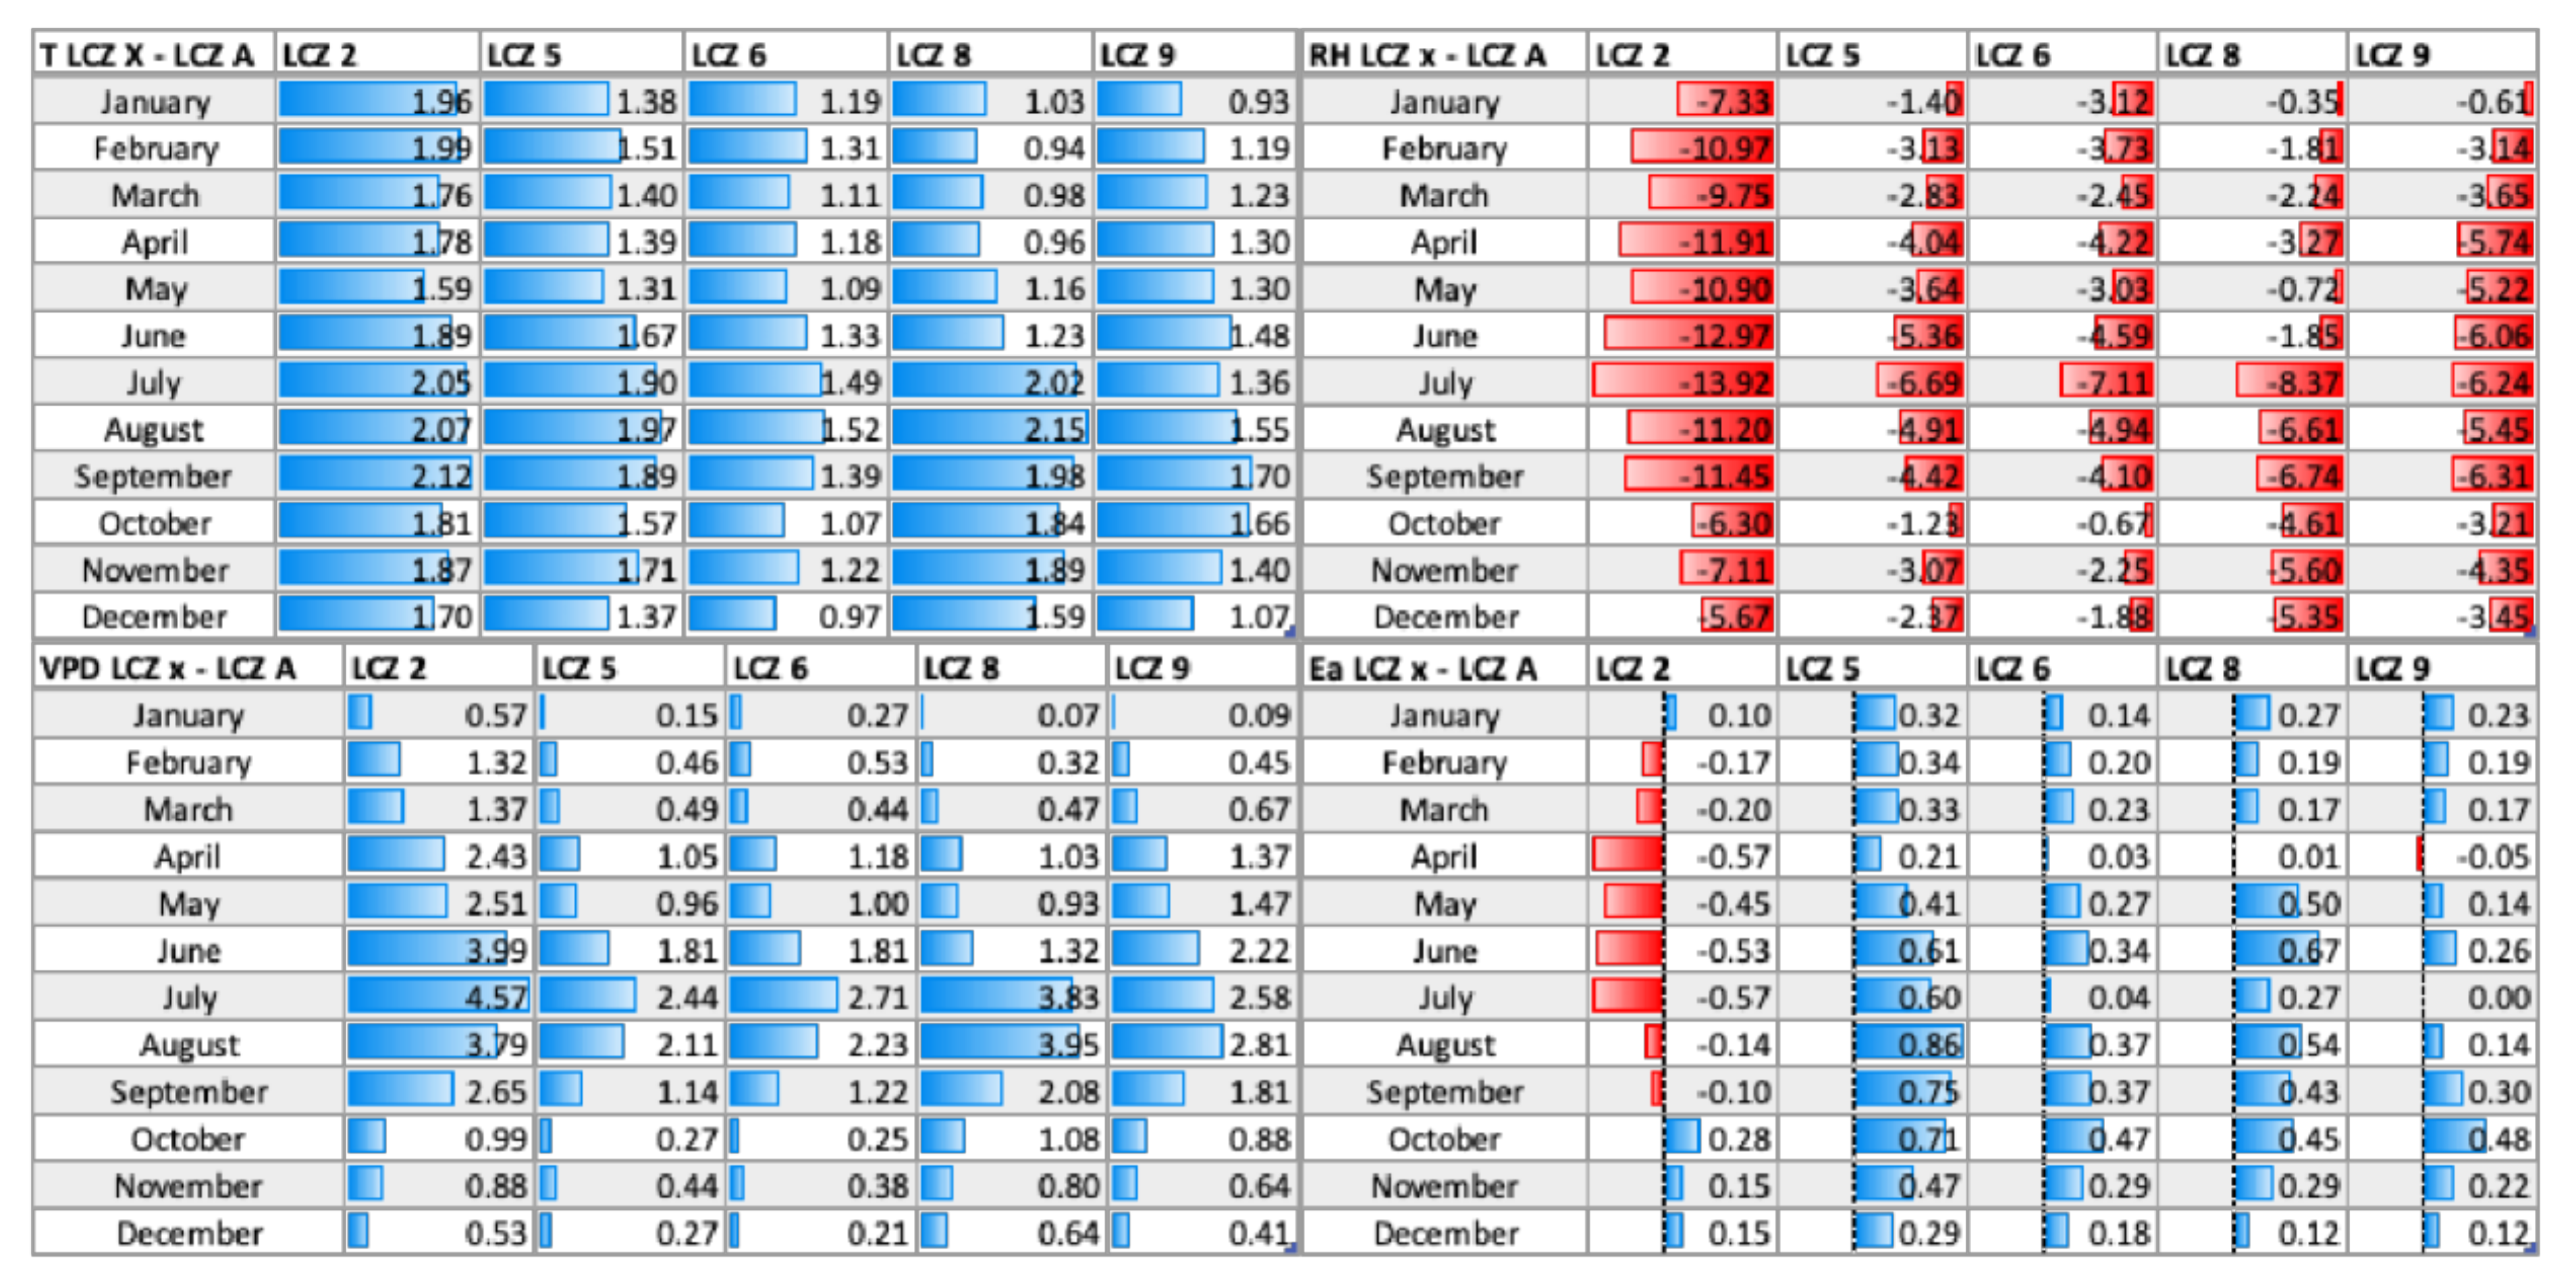
3.3. Monthly Dynamics of Air Temperature and Humidity Parameters (RH, VPD, Q, AH, Ea)

Monthly dynamics of mean air temperature and humidity parameters (RH, VPD, Q AH, and Ea) are shown in Figure 4. As expected, air temperatures in all LCZs are the lowest in winter and the highest in summer months. Mean air temperature is the lowest in LCZ A in all months, and the highest in LCZs 8 and 2, and the difference between them is the largest in summer months (June, July, and August). Similar results are reported in [44] where the largest differences in mean air temperature occurred between LCZ 2 and LCZ A (2.0 °C). On the other hand, RH monthly variations are smaller. RH values that vary from 80 to 95% are observed in the colder period, from October to March. In the warmer period of the year (from April to September), RH values vary between 60 and 80%. The lowest values are observed in April and in July. The largest differences are observed between LCZ 2 and LCZ A, and the differences vary from 5% in December to 13% in July. This confirms the statement of Yang et al. [13] that monthly mean RH decreases with the increase in urbanization.
VPD values are the lowest during winter months (December–February) in all LCZs (VPD < 2 hPa). In transitional seasons (spring and autumn), VPD values are larger, but they peak in summer months (July and August). The curves are narrowed from September to January, slightly widened from February to April, and more widened from May to August. VPD values vary between the LCZs, and are the lowest in LCZ A, and the highest in LCZ 2 in all months.
The values of Q, AH, and Ea show a similar trend, which is compatible with the trend of Ta. This is expected since the rise of air temperatures contributes to the increase in Q and Ea, due to the rising capacity of the air to hold water vapor [54,59]. The lowest values are observed in winter, slightly higher in spring and autumn, and the highest in summer for all three parameters. The curves are narrow in all months, meaning that the values show no or minimal differences among the LCZs, except for the LCZ 2 where the slightly lower values are observed for the Q, AH and Ea.
Monthly mean differences between urban LCZs (2, 5, 6, 8, and 9) and rural LCZ A in air temperature and humidity parameters (RH, VPD, and Ea) are shown in Figure 5. RH is higher in LCZ A than in all other urban LCZs. The greatest differences between LCZ A and urban LCZs occur in July, e.g., when LCZ A has higher RH values compared to other urban LCZs, ranging from ~6% (RHLCZ A-LCZ9) to ~14% (RHLCZ A-LCZ 2). The differences among urban LCZs and LCZ A are the most pronounced for LCZ 2 in all months. VPD is also larger in urban LCZs compared to LCZ A, with the greatest differences in summer months (July and August) in all urban LCZs. Ea, Q, and AH express similar dynamics in urban LCZs, except for the LCZ 2. Negative values of all three parameters (Q, AH, and Ea) between LCZ 2 and LCZ A emerge from February to September, meaning that those humidity parameters are lower in densely built LCZ 2 than in natural LCZ A in warmer part of the year. According to [3], differences between humidity indicators (negative for RH, AH, Q, Ea, and positive for VPD) between urban and rural areas indicate the presence of urban dry island (UDI). Given that the differences in RH, Q, AH, and Ea are negative, and the difference in VPD is positive between LCZ 2 and LCZ A in the period from February to September, it can be concluded that UDI emerges in this period in LCZ 2 in Novi Sad. The UDI intensity for all humidity indicators is <1, except for the RH values. The most intensive UDII is observed in July, when the urban–rural difference peaked for most humidity indicators. Similar results were reported in Belgrade [58] with the peak also in July, and in Matsuyama City, Japan, but the UDII peaked in August [60]. Unlike warmer months of the year, in the colder period (October to January), LCZ 2 experiences slight urban moisture excess (UME). Similar situation is observed in Szeged [22].

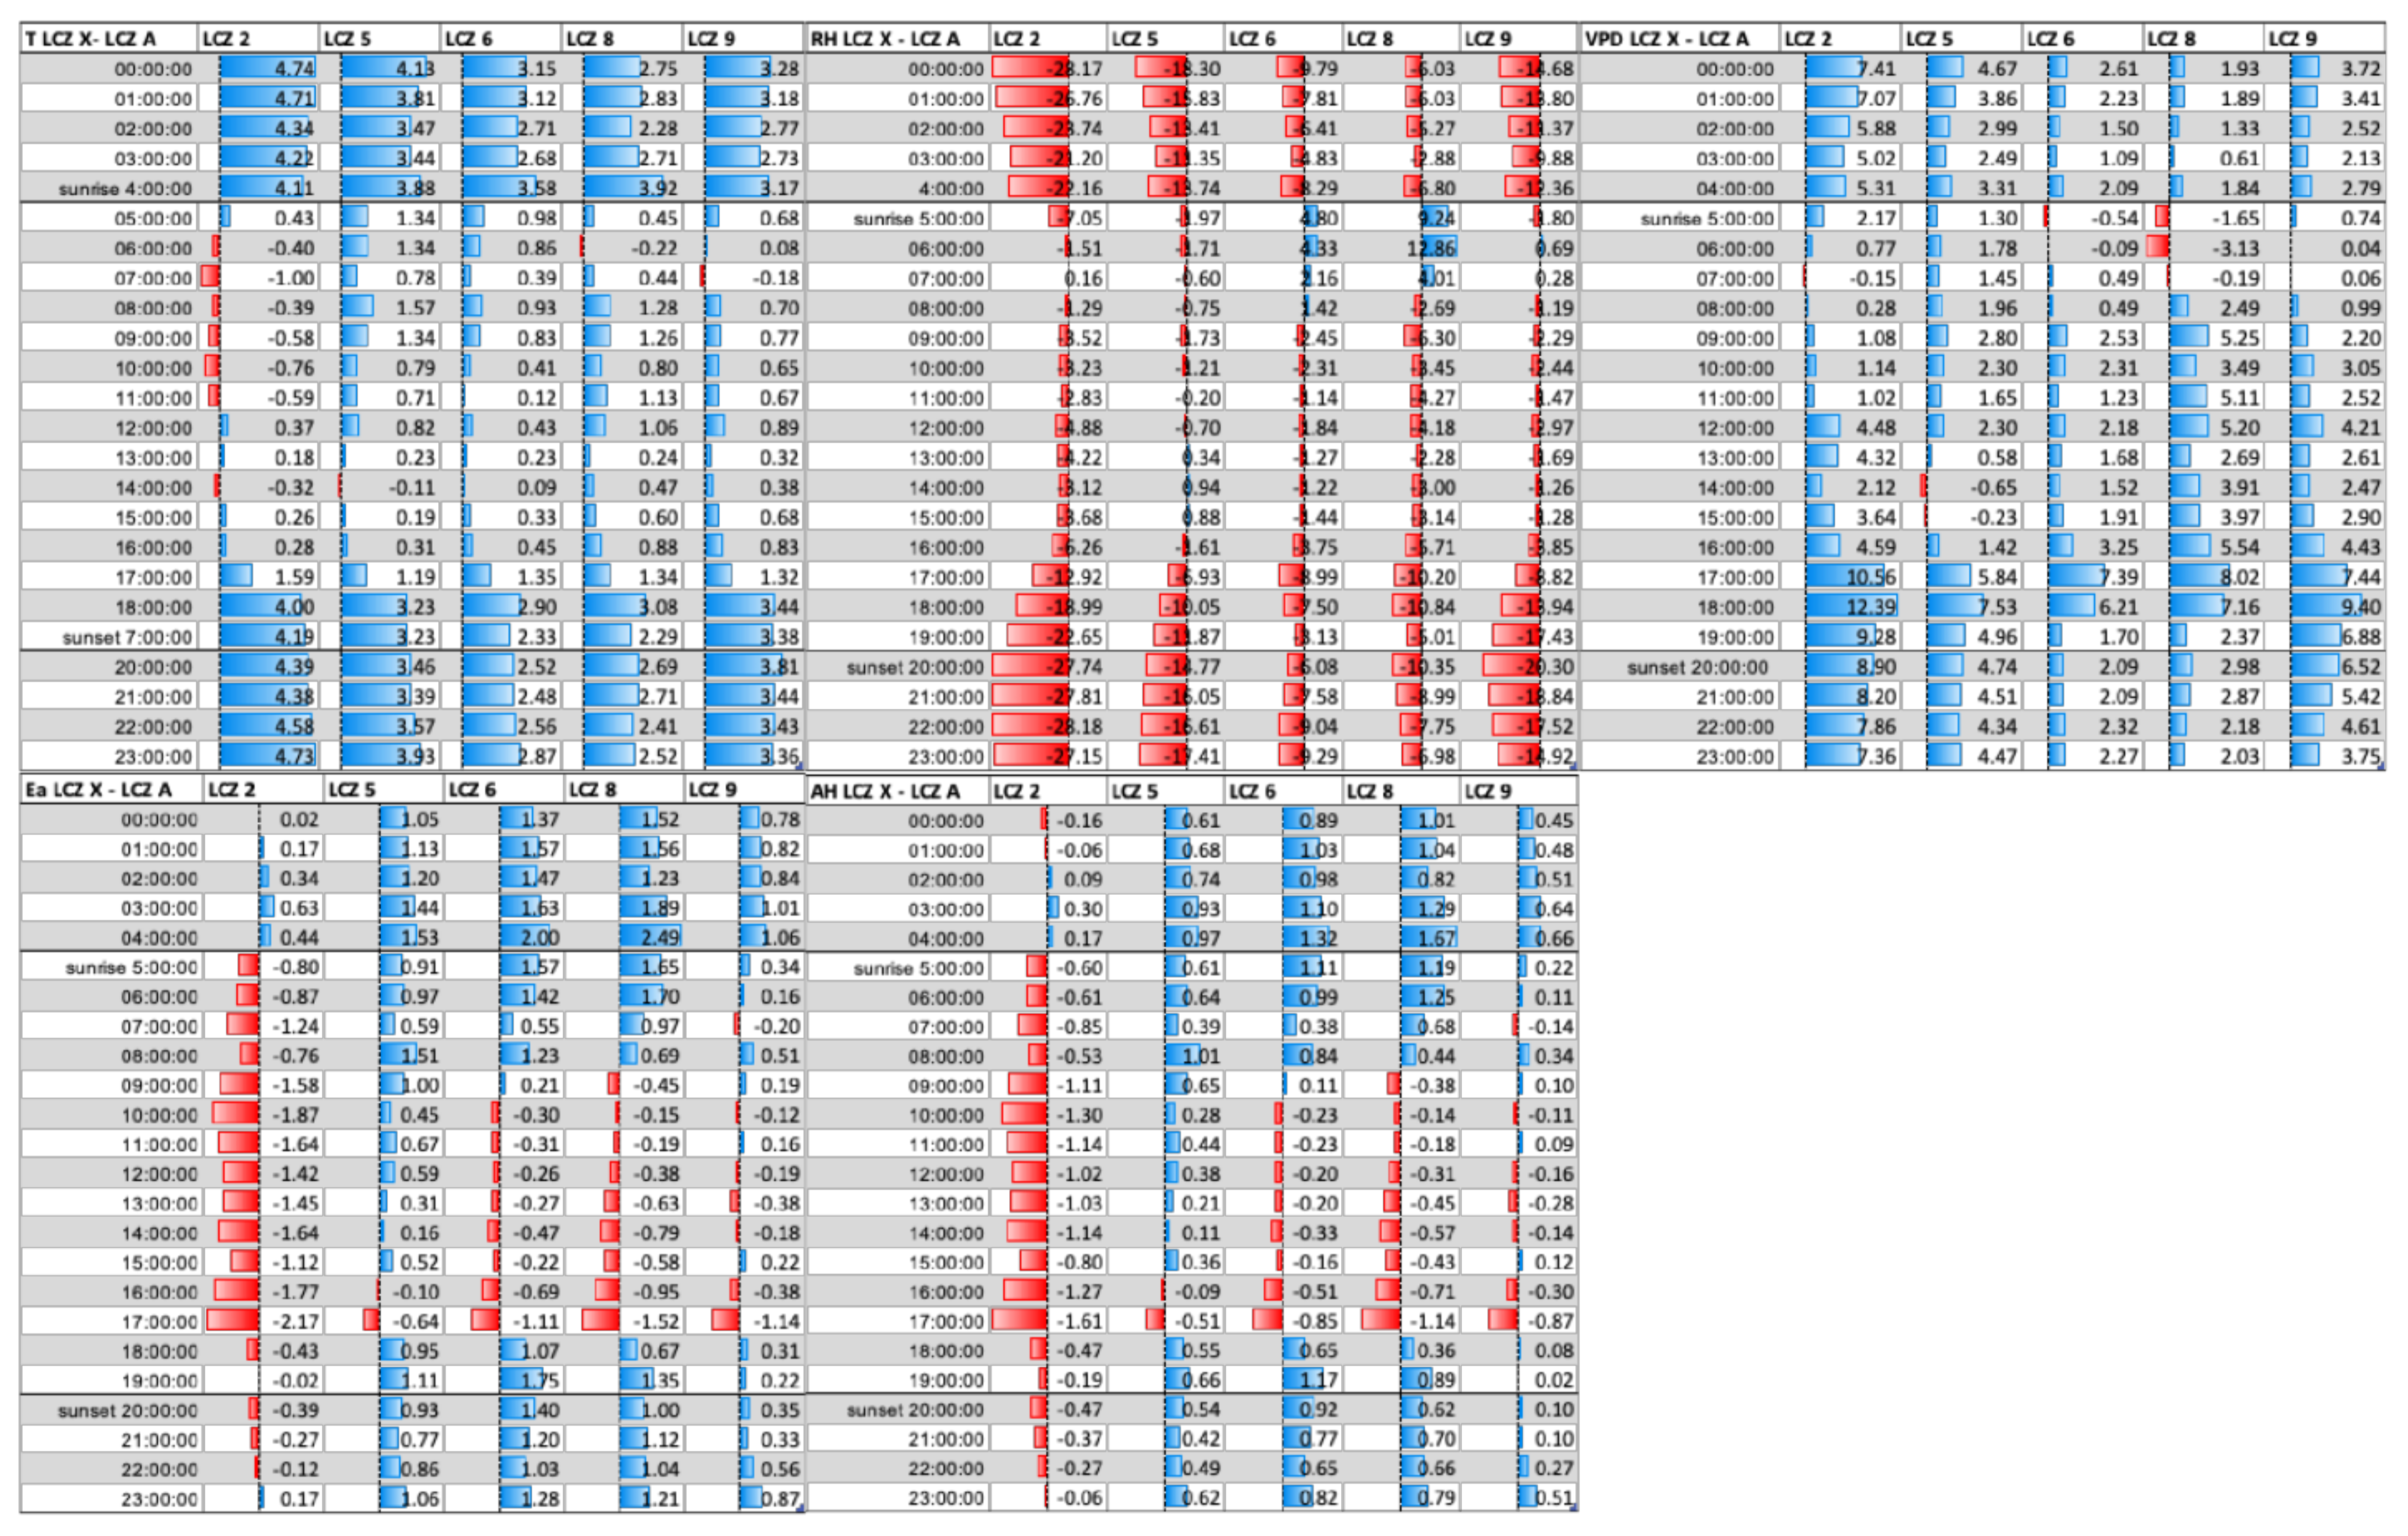
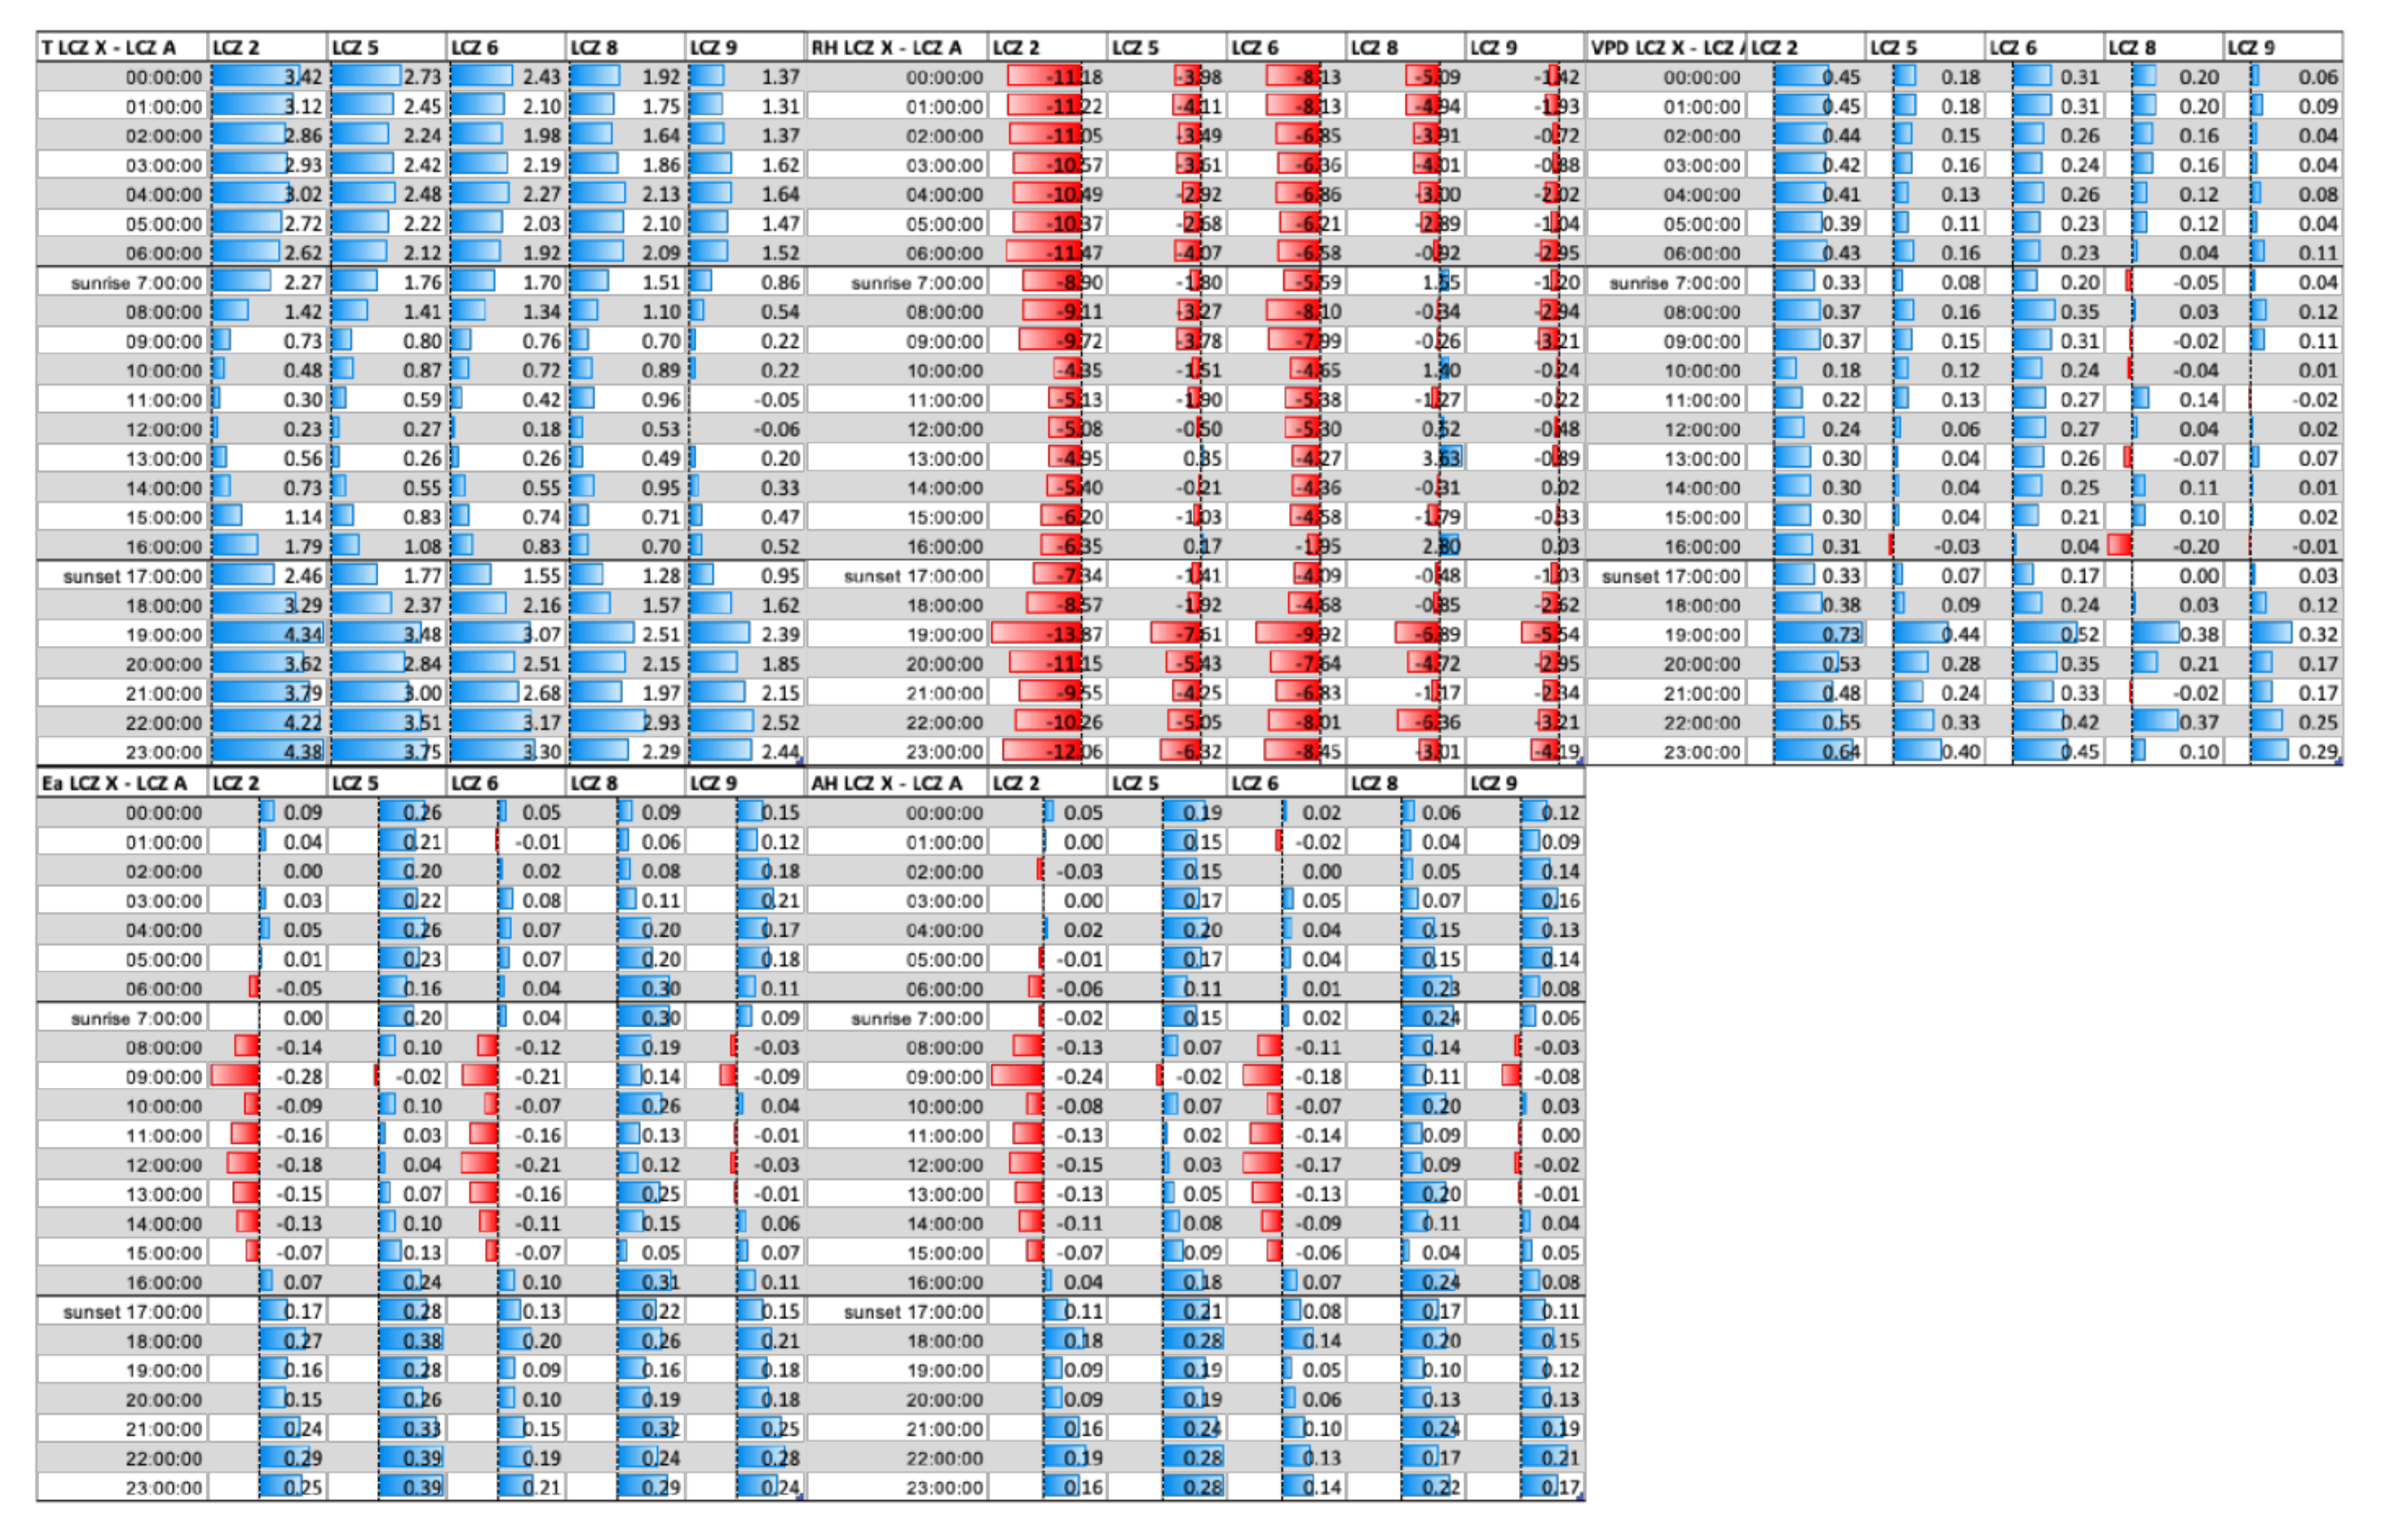
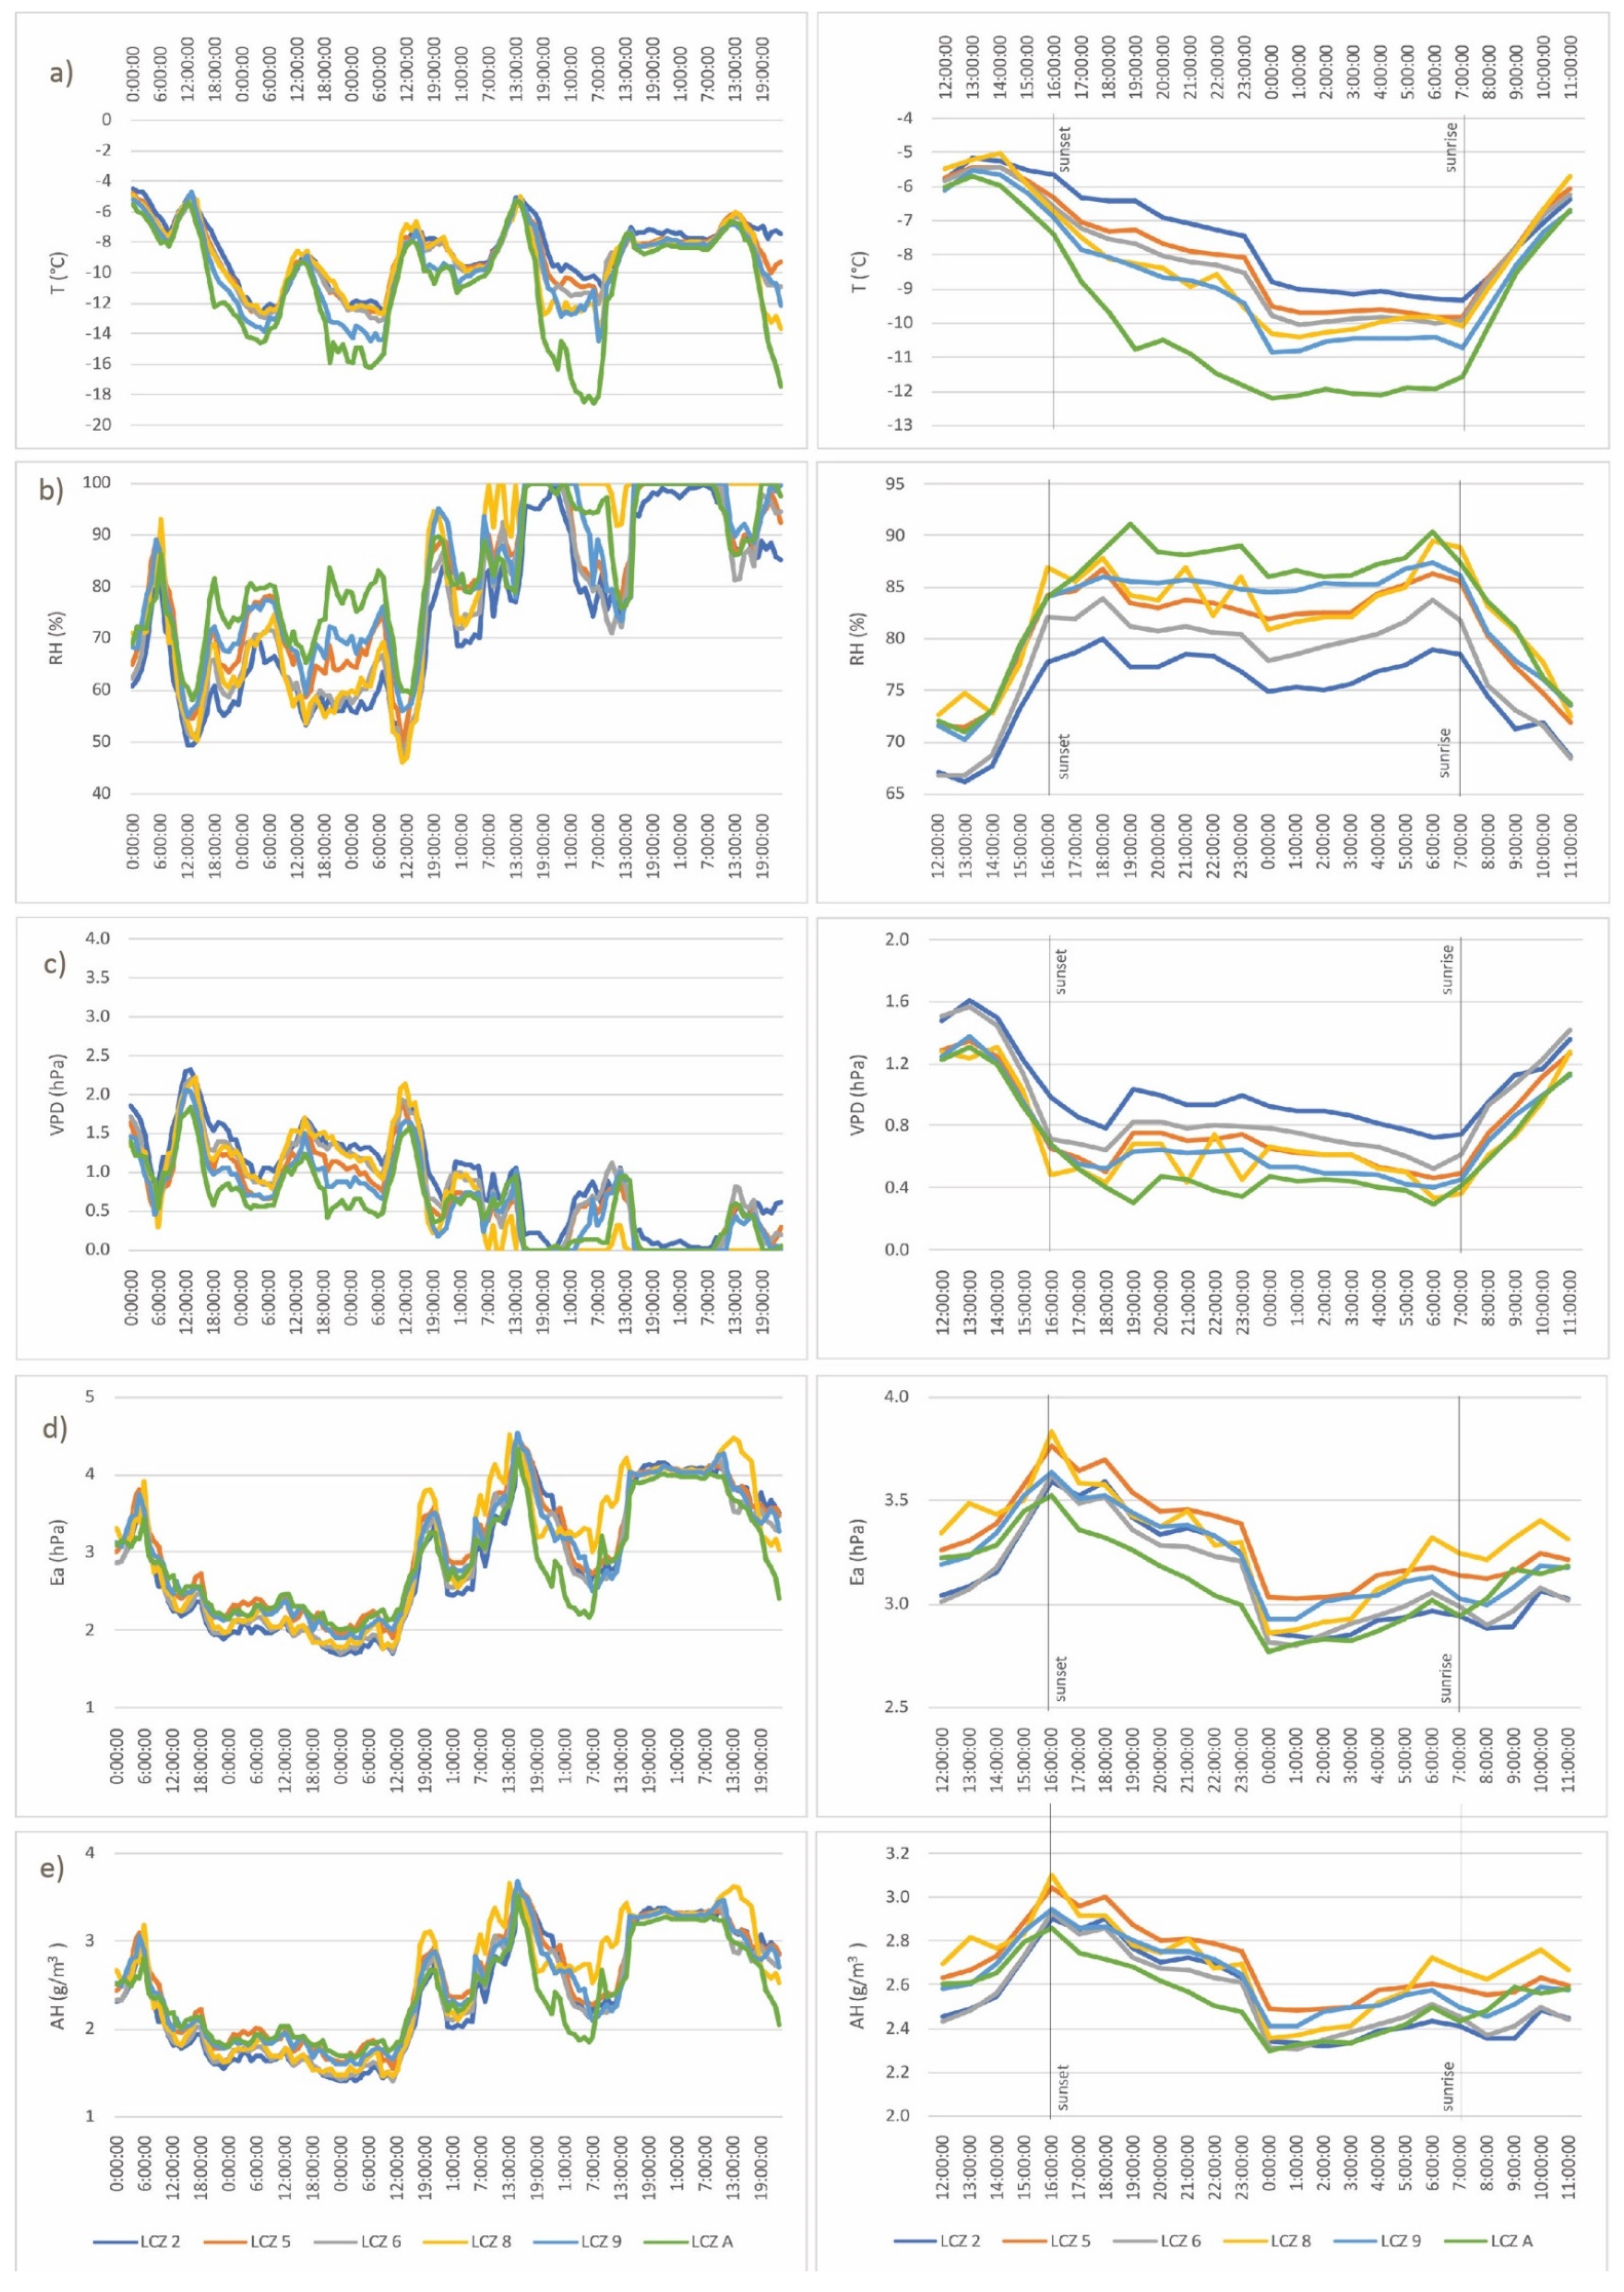
3.4. Daily and Hourly Differences during HW and CW

Air humidity conditions vary significantly throughout the day, and therefore the form and intensity of UDI could express large daily variations [1]. Hourly differences in air temperature and air humidity parameters during the extreme events, HW and CW, are analyzed. Figure 6 shows hourly differences in Ta, RH, Ea, VPD, and AH during HW (20–25 June 2017).
The analysis of hourly dynamics of temperature and air humidity parameters during HW confirmed that air humidity parameters are influenced by temperature dynamics (Figure 6—left). The influence is most pronounced for RH dynamics, which show an inverse relationship with air temperature dynamics, and for VPD, whose dynamic is synchronized with air temperature dynamics. The opposite T and RH dynamics are confirmed in previous studies as well [3,4,9,13,54]. During the HW period, Ea and AH did not show such clear patterns. However, averaged hourly results for the HW period give somewhat clearer insights (Figure 6—right).
RH values are lower during the daytime and start to increase in the later afternoon about 3 hours before the sunset, as the temperatures begin to drop. During the daytime, there is no substantial difference in RH values between LCZs. However, during the evening and in nighttime, the differences emerge, showing the lowest RH values in LCZ 2 (60–80%) and the highest values in LCZ A (up to 100%). RH differences between urban and natural LCZs in Brno are also highlighted around the sunset [24]. The highest urban–rural RH differences are observed in the nighttime in Lodz as well [2]. The highest values of RH in all the LCZs are observed about 2 hours before the sunrise.
VPD dynamics follow the air temperature dynamics, meaning that higher VPD values are observed during the day, while during the nighttime, VPD drops. The VPD values vary between 30 and 40 hPa in the daytime, and 0 and 10 hPa in the nighttime. In the morning, there is no significant differences in VPD values between the LCZs. However, around the noon, the differences start to be slightly pronounced, especially between LCZ A where the lowest values are observed, and LCZ 2 and LCZ 5 where the values are higher. Following the sunset and in the nighttime, the differences among the LCZs become more pronounced. In the nighttime, the greatest VPD values are observed in LCZ 2, and the lowest in LCZ A. Even though there are certain differences in VPD among the LCZs, the differences vary between 2 and 9 hPa are the most pronounced in the evening after the sunset.
Ea does not show such a clear pattern during the whole HW period as RH and VPD, and it does not seem to show the clear influence of the air temperature on its dynamics. However, Ea values show an interesting pattern during the HW period on the daily level. It is observed that its values increase at the sunrise and start to decrease around the noon. The decrease lasts until about 4 hours before the sunset, when they start to increase again. A second decrease is observed around the midnight, and it lasts until the sunrise. During both decrease periods, the Ea values vary between 15 hPa (LCZ A) and 17 hPa (LCZ 6 and LCZ 8). Similar double peak in Ea is also observed in Szeged [22] as well as in Lodz [2]. This pattern might be associated with daily dynamics in urban boundary layer, where the evaporation increases in the morning due to the insolation, and later the convection pushes the near-surface moisture to the higher levels of urban boundary layer. As the sunset approaches, the insolation is reduced which leads to UBL collapse, and the descendance of moisture back near to the surface [22]. Double peak in humidity ratio is observed by [4]. Another interesting observation is that the Ea values in LCZ 2 are the lowest among the urban LCZs. During both increase periods, Ea values vary between 17 hPa (LCZ 2) and 20 hPa (LCZ 5). In the periods of the Ea increase it is observed that the increase in Ea values is the lowest in LCZ 2.
AH levels show unclear patterns as well. However, average hourly values show that during the HW period AH values vary from 11. g/m3 to 14.5 g/m3. The values start to increase 1 h before the sunrise. The highest values of AH are observed 1–2 h after the sunrise, and then they start to decrease. The lowest AH values are observed at nighttime, 2–5 h before the sunrise. The lowest AH is observed in LCZ 2, except for the period 2 h before the sunrise, when the lowest AH is observed in LCZ A. The highest AH is observed in LCZ 8 and LCZ 5 at 1–3 h after the sunrise. According to Moriwaki et al. [60], this might be the consequence of evaporation from the surfaces—latent heat flux, which is larger during the daytime because of the solar radiation, which enhances evaporation and absolute humidity in the atmosphere. Similar trend has been observed in Matsuyama City, Japan [60].
Figure 7 shows hourly differences in air temperature and humidity parameters (RH, Ea, VPD, and AH) between urban LCZs (2, 5, 6, 8, and 9) and rural LCZ during the HW.
Hourly differences between urban LCZs (2, 5, 6, 8, and 9) and rural LCZ A (LCZ X–LCZ A) in air temperature and humidity parameters (RH, Ea, VPD, and AH) are shown in Figure 7. Hourly analysis of air temperature shows that UHII is well developed during the nighttime, in all urban LCZs, with the temperature differences up to ~5 °C (around midnight, T LCZ 2-LCZ A). Meanwhile, in the morning, until the noon, slight urban cold island is observed in LCZ 2 (T LCZ 2-LCZ A ≤ −1 °C). The analysis of the air humidity parameters dynamics shows that UDII is most pronounced during the daytime, but also in the evening (approximately until midnight) in LCZ 2. However, lower intensity UDI is observed in the afternoon, in other urban LCZs (6, 8, and 9) and occasionally in the later afternoon in LCZ 5. This is opposite from the results from the Munich, where UME is present in summer month (August) [56].
Figure 8 shows dynamics of air temperature, relative humidity, atmospheric water vapor pressure, vapor pressure deficit, and absolute humidity differences during the cold wave (6–12 January 2017).
During the six days of extremely low temperatures from 6 to 12 January 2017, the temperature varied between −4 and −19 °C. Average hourly values of the mean air temperature for CW period are the highest 2–3 h before the sunset, and the lowest around the midnight (Figure 8).
As during the HW period, the influence of air temperature on relative humidity is observed during the CW period as well. RH varies from around 50 to 100% during this period. The lowest RH (65–75%) is present around the noon and as the day progresses to sunset, and air temperature further decreases, RH values increase. During the daytime, the differences in RH between the LCZs are lower, and they are ranging from 67% in LCZ 2 and LCZ 6, to 70–75% in other LCZs. RH is higher but stable between the sunset and sunrise. The highest values of RH during the nighttime are observed in LCZ A (85–90%), and the lowest are observed in LCZ 2 (75–80%), which shows inverse relationship with temperature values in LCZs. The variations in RH during the day in colder period are lower than during the warmer period, which could relate to the fact that in wintertime cold air is usually close to saturation [2].
VPD shows very low values in the CW period, ranging from 0 to 2.5 hPa. A somewhat clearer pattern is noticed observing hourly averaged values during the CW. In the nighttime, VPD values are very low, just above 0 (0.4–1 hPa), and during the daytime, the VPD increases up to 1.6 hPa at 3 h before the sunset. The highest VPD is observed in LCZ 2, and the lowest in LCZ A.
Similar to VPD, Ea is low during the CW period, and varies from 1.8 to 4.5 hPa. The highest average Ea occurs around the sunset (3.5–3.8 hPa), and the lowest around the midnight (2.8–3 hPa). The differences among the LCZs are small, but it is noticed that the highest Ea are observed in LCZ 5 during the nighttime and in LCZ 8 during the daytime, while the lowest Ea is observed in LCZ A during the nighttime and in LCZ 2 and LCZ 6 during the daytime. According to Fortuniak et al. [2], urban–rural differences VPD rarely reach 1 hPa in winter time, which is confirmed in this case.
AH is at very low level as well during the CW period (2.3–3.1 g/m3), and it shows almost identical pattern as Ea. The highest AH is observed around the sunset (2.8–3.1 g/m3), and the lowest around the midnight (2.3–2.5 g/m3). The differences between LCZs are low, but the pattern is the same as for the Ea. Low temperatures affect water vapor content in terms that they keep water vapor content small, and that way reduce differences in absolute humidity [2].
Figure 9 shows hourly dynamics of air temperature and air humidity parameters during CW. Low intensity UDI is observed in LCZ 2 and LCZ 6 during the daytime. Interestingly, LCZ 8 occasionally experiences slight UME during the daytime. During the nighttime all LCZs experience UME, which was previously noticed in Munich, Germany [56]. LCZs 8 and 5 occasionally experience slight UME during the daytime, while other LCZs (LCZ 2, LCZ 6, and LCZ 9) mostly experience UDI during the daytime.

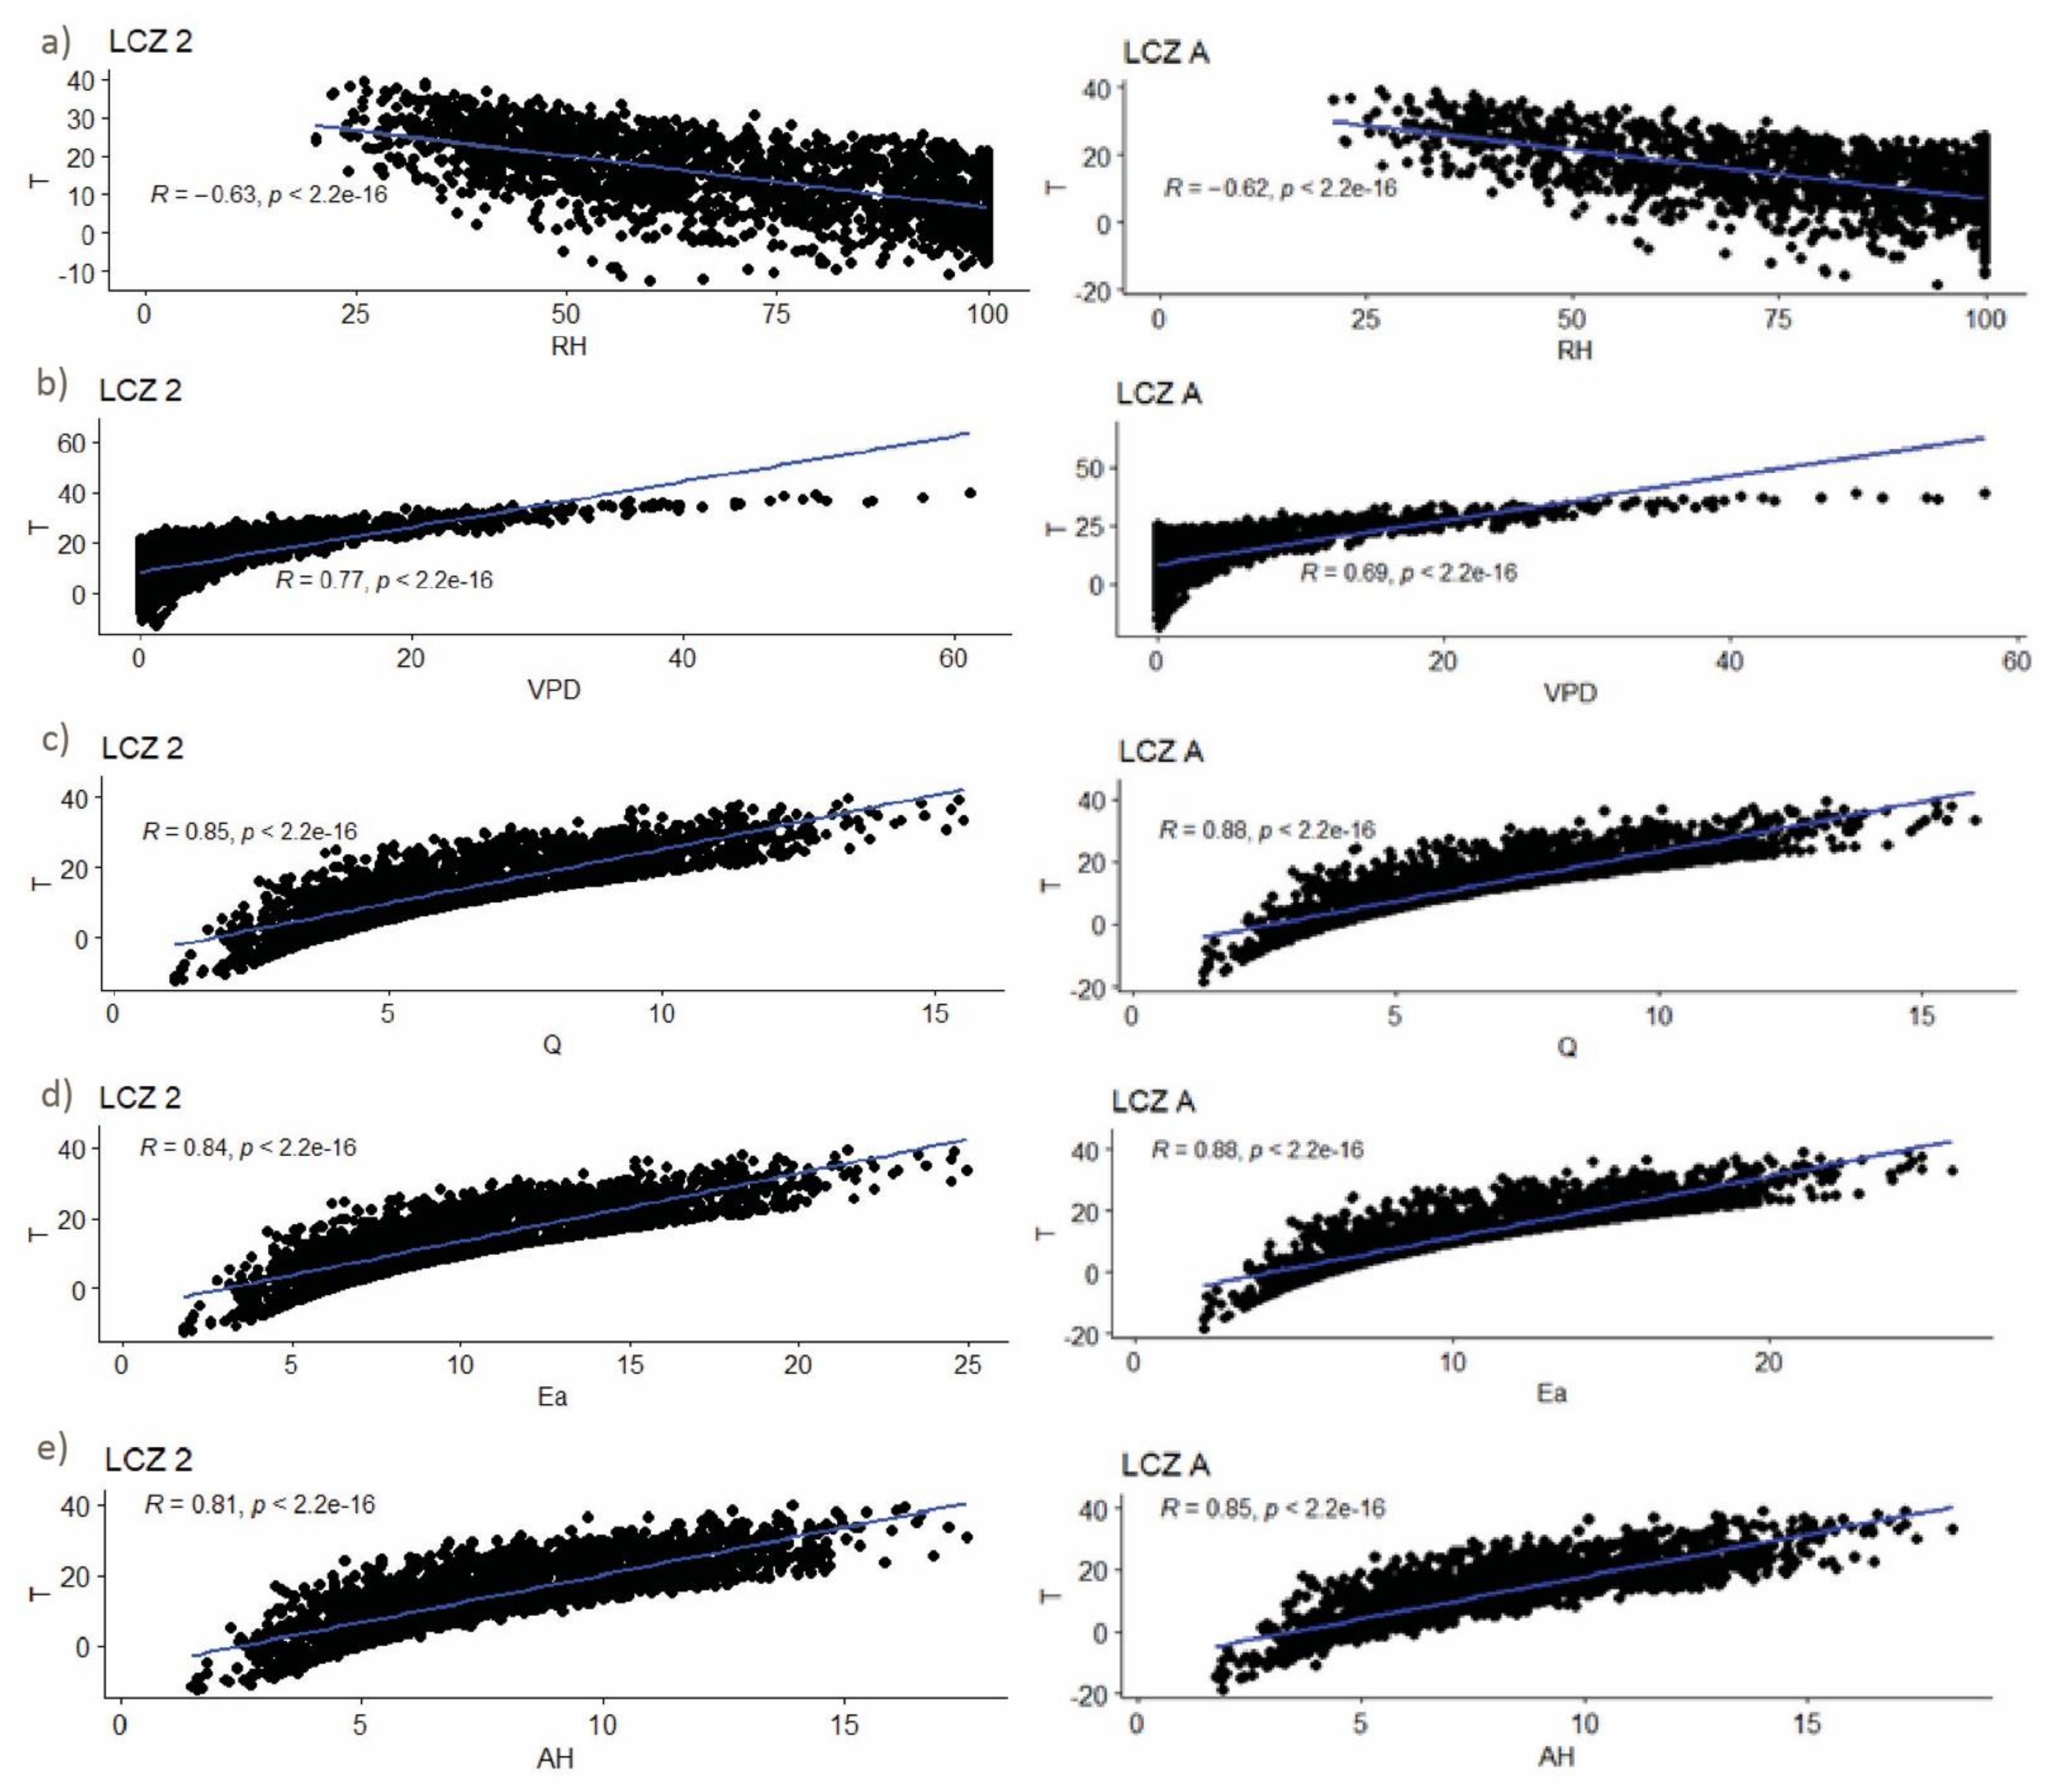
3.5. Relationship between Air Temperature and Humidity Parameters (RH, VPD, Q, Ea, and AH)

Previous analysis has shown that air temperature might affect humidity parameters. For that reason, we conducted more detailed analysis to assess the relationship between air temperature and humidity parameters. We used mean values of the two-year data (December 2015–December 2017) for RH, VPD, Q, Ea, and AH for one urban (LCZ 2) and natural LCZ (LCZ A), which exhibited major differences in previous analysis. The results are presented in Figure 10.
The statistically significant relationship between air temperature and humidity parameters are detected (p < 0.01) for all of the analyzed parameters and LCZs. The average air temperatures in both urban and natural LCZs (2 and A) are negatively correlated with RH (R = −0.63 in LCZ 2; R = −0.62 in LCZ A), and strongly positively correlated with VPD (R = 0.77 in LCZ 2; R = 0.69 in LCZ A), Q (R = 0.85 in LCZ 2; R = 0.88 in LCZ A), Ea (R = 0.84 in LCZ 2; R = 0.88 in LCZ A), and AH (R = 0.81 in LCZ 2; R = 0.85 in LCZ A). Inverse relationship between air temperature and relative humidity is recorded also in studies from other regions [1,4], and is confirmed in this case as well at all levels of temporal analysis (annual, seasonal, monthly, and daily/hourly during HW and CW periods). Significant and strong correlation between air temperature and humidity parameters confirms the previous statements [2,3,4] that air humidity is under influence of air temperature. The results from this and previous studies (e.g., [44,47]) showed that LCZ 2 in Novi Sad tends to be the warmest area of the city, with the presence of UHI especially during the nights in summer, when UHI reaches up to 5.5 °C (LCZ 2–LCZ A) at sunset +1 during the HW [44]. In this study, the results of monthly analysis of air temperature and air humidity indicators, show that UDI occurs in the warmer part of the year (from February to September) in LCZ 2, which is the most densely built-up area in the city. Daily/hourly analysis during HW and CW periods, indicates that UDII is the most pronounced in LCZ 2 at daytime. According to [54], urban areas are densely populated, and their morphology has changed in recent decades by converting green areas into impervious and densely built-up areas, which, among other things, increases anthropogenic air pollution, which also affects atmospheric humidity; however, further research is needed to specify the impact [54].

4. Conclusions

Even though air humidity directly influences human health, air pollution, energy consumption, urban ecological systems, and (at certain level) thermal comfort [4], this topic is less documented in the scientific community in contrast to the air temperature patterns. This exists because of two factors: a) partly due to the lack of the reliable data, and b) because of less clear humidity indicator patterns. To achieve higher level of accuracy regarding the air humidity patterns in various urban areas of Novi Sad, we have used both absolute and relative humidity measures comparing their spatial and temporal dynamics. The present study provides insight into the spatio-temporal patterns of air humidity in the city of Novi Sad, using five parameters (RH, VPD, Ea, Q, and AH) gathered from the long-term data (December 2015–December 2017) for five urban LCZs (LCZ 2, LCZ 5, LCZ 6, LCZ 8, and LCZ 9) and one natural LCZ A. Additionally, their relationship with air temperature was analyzed in order to assess the influence of air temperature on various indicators of air humidity. Following can be concluded:
(a)
Air humidity patterns in urban areas relate to the level of urbanization. Therefore, the application of LCZ scheme is important for air humidity spatial dynamics, and could contribute to comparability of the results between different cities. The results show that UDI occurs in LCZ 2 from February to September. In other urban LCZs (5, 6, 8, and 9) this is not the case.
(b)
During the HW period, the air humidity dynamics show that UDII is most pronounced during the daytime, but also in the evening (approximately until midnight) in LCZ 2. However, lower intensity UDI is observed in the afternoon, in other urban LCZs (LCZ 6, LCZ 8, and LCZ 9) and occasionally in the later afternoon in LCZ 5.
(c)
All air humidity parameters are significantly correlated to air temperature dynamics.
There are certain limitations of this study that should be addressed in the future research of similar topic. First, Novi Sad Urban Meteorological Network (NSUNET) was active in the period 2014–2017. Analysed period (December 2015–December 2017) is the period that showed the most stable data, which was confirmed through quality control process. A longer period data set would provide more insightfull picture of the humidity patterns of Novi Sad. Second, after the quality control process, some of the stations were excluded due to missing data, so we used data from uneven number of the stations per LCZ (e.g., LCZ 2—two stations, LCZ 5—five stations, LCZ 6—three stations, LCZ 8—one station, LCZ 9—2 stations, and LCZ A—one station). The LCZs with a lower number of stations might have less reliable results. Third, local climatic background (Cfb temperate climate, and fully humid and warm summers [42]) influenced the results of our study, so more intense differences in air humidity patterns (especially at the absolute values) among LCZs might be present in cities of different geographical regions. Furthermore, as stated in Yang et al. [4] most of the studies related to air humidity were conducted in medium sized cities (as was our study), so the studies from large-sized cities might have different results.
In general, the results presented in this study indicate that level of urbanization affects air humidity values and dynamics, and not only air temperature, which was expected. However, not all urban areas experience air humidity dynamics the same way due to the different urbanization pace, land use patterns, and vegetation presence. Therefore, the LCZs can have critical roles in spatial analysis of urban climate parameters other than temperature, such as humidity parameters. Because urban air humidity influences human health, air pollution, ecological systems, and thermal comfort, more effort should be invested in further analysis and understanding of the urban humidity patterns on local and micro scale.

Supplementary Materials

The following are available online at https://www.mdpi.com/article/10.3390/ijgi10120810/s1. In supplementary materials you can find full data Figure 4, Figure 5, and Figure 10, as well as typical surface properties of 250 m radius environment around stations for each LCZ (obtained from [47]).

Author Contributions

Conceptualization, Dragan Milošević and Jelena Dunjić; methodology, Jelena Dunjić and Dragan Milošević; data quality control, Milena Kojić; writing—original draft preparation, Jelena Dunjić and Dragan Milošević; writing—review and editing, Dragan Milošević, Ivan Šećerov, Milena Kojić, Stevan Savić, Zorana Lužanin and Daniela Arsenović; Visualization, Jelena Dunjić, and Milena Kojić; supervision, Dragan Milošević and Stevan Savić. All authors have read and agreed to the published version of the manuscript.

Funding

This research received no external funding.

Data Availability Statement

The data presented in this study are available on request from the corresponding author. The data are not publicly available due to privacy.

Acknowledgments

This research was supported by the project grant from the Ministry of Education, Science and Technological Development of the Republic of Serbia through the Project No 176020.

Conflicts of Interest

The authors declare no conflict of interest.

References

  1. Cuadrat, J.M.; Vicente-Serrano, S.M.; Saz, M.A.; Cuadrat, J.M. Influence of different factors on relative air humidity in Zaragoza, Spain. Front. Earth Sci. 2015, 3, 10. [Google Scholar] [CrossRef] [Green Version]
  2. Fortuniak, K.; Kłysik, K.; Wibig, J. Urban–rural contrasts of meteorological parameters in Łódź. Theor. Appl. Climatol. 2006, 84, 91–101. [Google Scholar] [CrossRef]
  3. Luo, M.; Lau, N.C. Urban Expansion and Drying Climate in an Urban Agglomeration of East China. Geophys. Res. Lett. 2019, 46, 6868–6877. [Google Scholar] [CrossRef]
  4. Yang, X.; Peng, L.L.; Chen, Y.; Yao, L.; Wang, Q. Air humidity characteristics of local climate zones: A three-year observational study in Nanjing. Build. Environ. 2020, 171, 106661. [Google Scholar] [CrossRef]
  5. Hage, K.D. Urban-Rural Humidity Differences. J. Appl. Meteorol. Climatol. 1975, 14, 1277–1283. [Google Scholar] [CrossRef]
  6. Epstein, Y.; Moran, D.S. Thermal Comfort and the Heat Stress Indices. Ind. Health 2006, 44, 388–398. [Google Scholar] [CrossRef] [PubMed] [Green Version]
  7. Geletič, J.; Lehnert, M.; Krč, P.; Resler, J.; Krayenhoff, E. High-Resolution Modelling of Thermal Exposure during a Hot Spell: A Case Study Using PALM-4U in Prague, Czech Republic. Atmosphere 2021, 12, 175. [Google Scholar] [CrossRef]
  8. Ibrahim, I.; Abu Samah, A.; Samah, A. Preliminary study of urban heat island: Measurement of ambient temperature and relative humidity in relation to landcover in Kuala Lumpur. In Proceedings of the 19th International Conference on Geoinformatics, Shanghai, China, 24–26 June 2011; pp. 1–5. [Google Scholar] [CrossRef]
  9. Hao, L.; Huang, X.; Qin, M.; Liu, Y.; Li, W.; Sun, G. Ecohydrological Processes Explain Urban Dry Island Effects in a Wet Region, Southern China. Water Resour. Res. 2018, 54, 6757–6771. [Google Scholar] [CrossRef]
  10. Oke, T.R.; Mills, G.; Christen, A.; Voogt, J.A. Urban Climates; Cambridge University Press: Cambridge, UK, 2017. [Google Scholar]
  11. Hilberg, S.D. Diurnal Temperature and Moisture Cycles. Summary of METROMEX, Vol. 2, Causes of Precipitation Anomalies. Illinois State Water Survey Bull 63. Urbana, 30–36. 1978. Available online: http://www.isws.illinois.edu/pubdoc/B/ISWSB-63.pdf (accessed on 10 June 2021).
  12. Lokoshchenko, M.A. Urban Heat Island and Urban Dry Island in Moscow and Their Centennial Changes. J. Appl. Meteorol. Climatol. 2017, 56, 2729–2745. [Google Scholar] [CrossRef]
  13. Yang, P.; Ren, G.; Hou, W. Temporal–Spatial Patterns of Relative Humidity and the Urban Dryness Island Effect in Beijing City. J. Appl. Meteorol. Climatol. 2017, 56, 2221–2237. [Google Scholar] [CrossRef]
  14. Ackerman, B. Climatology of Chicago Area Urban-Rural Differences in Humidity. J. Clim. Appl. Meteorol. 1987, 26, 427–430. [Google Scholar] [CrossRef]
  15. Lee, D.O. Urban-rural humidity differences in London. Int. J. Climatol. 1991, 11, 577–582. [Google Scholar] [CrossRef]
  16. Unkašević, M.; Jovanović, O.; Popović, T. Urban-suburban/rural vapour pressure and relative humidity differences at fixed hours over the area of Belgrade city. Theor. Appl. Climatol. 2001, 68, 67–73. [Google Scholar] [CrossRef]
  17. Robaa, S.M. Some aspects of the urban climates of Greater Cairo Region, Egypt. Int. J. Climatol. 2013, 33, 3206–3216. [Google Scholar] [CrossRef]
  18. Liu, W.; You, H.; Dou, J. Urban-rural humidity and temperature differences in the Beijing area. Theor. Appl. Climatol. 2009, 96, 201–207. [Google Scholar] [CrossRef]
  19. Masiero, E.; De Souza, L.C.L. Mapping humidity plume over local climate zones in a high-altitude tropical climate city, Brazil. Ambient. Constr. 2018, 18, 177–197. [Google Scholar] [CrossRef]
  20. Holmer, B.; Eliasson, I. Urban–rural vapour pressure differences and their role in the development of urban heat islands. Int. J. Climatol. 1999, 19, 989–1009. [Google Scholar] [CrossRef]
  21. Kuttler, W.; Weber, S.; Schonnefeld, J.; Hesselschwerdt, A. Urban/rural atmospheric water vapour pressure differences and urban moisture excess in Krefeld, Germany. Int. J. Climatol. 2007, 27, 2005–2015. [Google Scholar] [CrossRef]
  22. Unger, J.; Skarbit, N.; Gál, T. Absolute moisture content in mid-latitude urban canopy layer, Part 2: Results from Szeged, Hungary. Acta Climatol. 2018, 51–52, 47–56. [Google Scholar] [CrossRef]
  23. Anderson, V.; Leung, A.C.W.; Mehdipoor, H.; Jänicke, B.; Milošević, D.; Oliveira, A.; Manavvi, S.; Kabano, P.; Dzyuban, Y.; Aguilar, R.; et al. Technological opportunities for sensing of the health effects of weather and climate change: A state-of-the-art-review. Int. J. Biometeorol. 2021, 65, 779–803. [Google Scholar] [CrossRef]
  24. Geletič, J.; Lehnert, M.; Savić, S.; Milošević, D. Inter-/intra-zonal seasonal variability of the surface urban heat island based on local climate zones in three central European cities. Build. Environ. 2019, 156, 21–32. [Google Scholar] [CrossRef]
  25. Lehnert, M.; Savić, S.; Milošević, D.; Dunjić, J.; Geletič, J. Mapping Local Climate Zones and Their Applications in European Urban Environments: A Systematic Literature Review and Future Development Trends. ISPRS Int. J. Geo-Inf. 2021, 10, 260. [Google Scholar] [CrossRef]
  26. Savić, S.; Milošević, D.; Lazić, L.; Marković, V.; Arsenović, D.; Pavić, D. Classifying urban meteorological stations sites by’local climate zones’: Preliminary results for the city of Novi Sad (Serbia). Geogr. Pannonica 2013, 17, 60–68. [Google Scholar] [CrossRef] [Green Version]
  27. Šećerov, I.; Savić, S.; Milošević, D.; Marković, V.; Bajšanski, I. Development of an automated urban climate monitoring system in Novi Sad (Serbia). Geogr. Pannonica 2015, 19, 174–183. [Google Scholar] [CrossRef] [Green Version]
  28. Šećerov, I.B.; Savić, S.M.; Milošević, D.D.; Arsenović, D.M.; Dolinaj, D.M.; Popov, S.B. Progressing urban climate research using a high-density monitoring network system. Environ. Monit. Assess. 2019, 191, 89. [Google Scholar] [CrossRef] [PubMed]
  29. Lelovics, E.; Unger, J.; Gál, T.; Gál, C. Design of an urban monitoring network based on Local Climate Zone mapping and temperature pattern modelling. Climatol. Res. 2014, 60, 51–62. [Google Scholar] [CrossRef] [Green Version]
  30. Gál, T.; Skarbit, N.; Unger, J. Urban heat island patterns and their dynamics based on an urban climate measurement network. Hung. Geogr. Bull. 2016, 65, 105–116. [Google Scholar] [CrossRef] [Green Version]
  31. Skarbit, N.; Stewart, I.D.; Unger, J.; Gál, T. Employing an urban meteorological network to monitor air temperature conditions in the ‘local climate zones’ of Szeged, Hungary. Int. J. Climatol. 2017, 37, 582–596. [Google Scholar] [CrossRef]
  32. Chapman, L.; Muller, C.L.; Young, D.T.; Warren, E.L.; Grimmond, C.S.B.; Cai, X.-M.; Ferranti, E.J. The Birmingham Urban Climate Laboratory: An Open Meteorological Test Bed and Challenges of the Smart City. Bull. Am. Meteorol. Soc. 2014, 96, 1545–1560. [Google Scholar] [CrossRef]
  33. Bassett, R.; Cai, X.; Chapman, L.; Heaviside, C.; Thornes, J.E.; Muller, C.L.; Young, D.T.; Warren, E.L. Observations of urban heat island advection from a high-density monitoring network. Q. J. R. Meteorol. Soc. 2016, 142, 2434–2441. [Google Scholar] [CrossRef]
  34. Caluwaerts, S.; Hamdi, R.; Top, S.; Lauwaet, D.; Berckmans, J.; Degrauwe, D.; Dejonghe, H.; De Ridder, K.; De Troch, R.; Duchêne, F.; et al. The urban climate of Ghent, Belgium: A case study combining a high-accuracy monitoring network with numerical simulations. Urban Climatol. 2020, 31, 100565. [Google Scholar] [CrossRef]
  35. Richard, Y.; Emery, J.; Dudek, J.; Pergaud, J.; Chateau-Smith, C.; Zito, S.; Rega, M.; Vairet, T.; Castel, T.; Thévenin, T.; et al. How relevant are local climate zones and urban climate zones for urban climate research? Dijon (France) as a case study. Urban Climatol. 2018, 26, 258–274. [Google Scholar] [CrossRef] [Green Version]
  36. Unger, J.; Skarbit, N.; Gál, T. Absolute moisture content in mid-latitude urban canopy layer, Part 1: A literature review. Acta Climatol. 2018, 51–52, 37–45. [Google Scholar] [CrossRef] [Green Version]
  37. Kopp, J.; Frajer, J.; Novotná, M.; Preis, J.; Dolejš, M. Comparison of Ecohydrological and Climatological Zoning of the Cities: Case Study of the City of Pilsen. ISPRS Int. J. Geo-Inf. 2021, 10, 350. [Google Scholar] [CrossRef]
  38. Top, S.; Milošević, D.; Caluwaerts, S.; Hamdi, R.; Savić, S. Intra-urban differences of outdoor thermal comfort in Ghent on seasonal level and during record-breaking 2019 heat wave. Build. Environ. 2020, 185, 107103. [Google Scholar] [CrossRef]
  39. Christensen, J.; Hewitson, B.; Busuioc, A.; Chen, A.; Gao, X.; Held, I. Regional climate projection. Technical report. In Climate Change 2007: The Physical Science Basis. Contribution of Working Group I to the Fourth Assessment Report of the Intergovernmental Panel on Climate Change; Solomon, S., Qin, D., Manning, M., Chen, Z., Marquis, M., Averyt, K.B., Eds.; Cambridge University Press: Cambridge, UK; New York, NY, USA, 2007. [Google Scholar]
  40. Russo, S.; Sillmann, J.; Fischer, E.M. Top ten European heatwaves since 1950 and their occurrence in the coming decades. Environ. Res. Lett. 2015, 10, 124003. [Google Scholar] [CrossRef]
  41. Meehl, G.A.; Tebaldi, C. More Intense, More Frequent, and Longer Lasting Heat Waves in the 21st Century. Science 2004, 305, 994–997. [Google Scholar] [CrossRef] [Green Version]
  42. Kottek, M.; Grieser, J.; Beck, C.; Rudolf, B.; Rubel, F. World Map of the Köppen-Geiger climate classification updated. Meteorol. Z. 2006, 15, 259–263. [Google Scholar] [CrossRef]
  43. Stewart, I.D.; Oke, T.R. Local Climate Zones for Urban Temperature Studies. Bull. Am. Meteorol. Soc. 2012, 93, 1879–1900. [Google Scholar] [CrossRef]
  44. Milošević, D.; Savić, S.; Kresoja, M.; Lužanin, Z.; Šećerov, I.; Arsenović, D.; Dunjić, J.; Matzarakis, A. Analysis of air temperature dynamics in the “local climate zones” of Novi Sad (Serbia) based on long-term database from an urban meteorological network. Int. J. Biometeorol. 2021, 1–14. [Google Scholar] [CrossRef]
  45. Savic, S.; Geletic, J.; Milosevic, D.; Lehnert, M. Analysis of land surface temperatures in the “Local Climate Zones” of Novi Sad (Serbia). Glas. Srp. Geogr. Drus. 2020, 100, 41–50. [Google Scholar] [CrossRef]
  46. Savić, S.; Kalfayan, M.; Dolinaj, D. Precipitation spatial patterns in cities with different urbanisation types: Case study of Novi Sad (Serbia) as a medium-sized city. Geogr. Pannonica 2020, 24, 88–99. [Google Scholar] [CrossRef]
  47. Lelovics, E.; Unger, J.; Savić, S.; Gál, T.M.; Milošević, D.; Gulyás, Á.; Marković, V.; Arsenović, D.; Gál, C.V. Intra-urban temperature observations in two Central European cities: A summer study. Időjárás 2016, 120, 283–300. [Google Scholar]
  48. Bolton, D. The Computation of Equivalent Potential Temperature. Mon. Weather. Rev. 1980, 108, 1046–1053. [Google Scholar] [CrossRef] [Green Version]
  49. Vaisala. Humidity conversion formulas. In Calculation Formulas for Humidity; VaisalaOyj: Helsinki, Finland, 2014. [Google Scholar]
  50. Novick, K.A.; Ficklin, D.; Stoy, P.C.; Williams, C.A.; Bohrer, G.; Oishi, A.; Papuga, S.; Blanken, P.D.; Noormets, A.; Sulman, B.; et al. The increasing importance of atmospheric demand for ecosystem water and carbon fluxes. Nat. Climatol. Chang. 2016, 6, 1023–1027. [Google Scholar] [CrossRef] [Green Version]
  51. Pan, Y.; Birdsey, R.A.; Fang, J.; Houghton, R.; Kauppi, P.E.; Kurz, W.A.; Phillips, O.L.; Shvidenko, A.; Lewis, S.L.; Canadell, J.G.; et al. A Large and Persistent Carbon Sink in the World’s Forests. Science 2011, 333, 988–993. Available online: https://www.jstor.org/stable/27978486 (accessed on 6 June 2021). [CrossRef] [PubMed] [Green Version]
  52. Arya, P.S. Introduction to Micrometeorology; Elsevier: Amsterdam, The Netherlands, 2001. [Google Scholar]
  53. Montejo-Kovacevich, G.; Martin, S.H.; Meier, J.I.; Bacquet, C.N.; Monllor, M.; Jiggins, C.D.; Nadeau, N.J. Microclimate buffering and thermal tolerance across elevations in a tropical butterfly. J. Exp. Biol. 2020, 223, 220426. [Google Scholar] [CrossRef] [Green Version]
  54. Li, X.; Fan, W.; Wang, L.; Luo, M.; Yao, R.; Wang, S.; Wang, L. Effect of urban expansion on atmospheric humidity in Beijing-Tianjin-Hebei urban agglomeration. Sci. Total. Environ. 2021, 759, 144305. [Google Scholar] [CrossRef]
  55. Schlüter, S.; Kresoja, M. Two preprocessing algorithms for climate time series. J. Appl. Stat. 2019, 47, 1970–1989. [Google Scholar] [CrossRef]
  56. Mayer, H.; Matzarakis, A.; Iziomon, M.G. Spatio-temporal variability of moisture conditions within the Urban Canopy Layer. Theor. Appl. Climatol. 2003, 76, 165–179. [Google Scholar] [CrossRef]
  57. Fenner, D.; Meier, F.; Scherer, D.; Polze, A. Spatial and temporal air temperature variability in Berlin, Germany, during the years 2001–2010. Urban Climatol. 2014, 10, 308–331. [Google Scholar] [CrossRef]
  58. Vujović, D.; Todorović, N. Urban-rural fog differences in Belgrade area, Serbia. Theor. Appl. Climatol. 2018, 131, 889–898. [Google Scholar] [CrossRef]
  59. Song, Y.; Liu, Y.; Ding, Y. A study of surface humidity changes in china during the recent 50 years. Acta Meteorol. Sin. 2012, 26, 541–553. [Google Scholar] [CrossRef]
  60. Moriwaki, R.; Watanabe, K.; Morimoto, K. Urban Dry Island Phenomenon and Its Impact on Cloud Base Level. J. JSCE 2013, 1, 521–529. [Google Scholar] [CrossRef] [Green Version]
Figure 1. Location of the City of Novi Sad in Europe and in Serbia [44].
Ijgi 10 00810 g001
Figure 2. LCZ map of the City of Novi Sad with used NSUNET stations (black triangle in red circle) and RHMZ station (indicated by an arrow): Photos of 1. NSUNET stations (two examples are shown in Figure 2 (a) and (b)), and 2. official weather station from RHMZ (located 2 km north of the city). NOTE: On the LCZ map of the City of Novi Sad (NSUNET) stations, the numbers that identify station have a following meaning: the first number represents LCZ and the second number represents the number of the station within the given LCZ.
Ijgi 10 00810 g002
Figure 3. Seasonal distribution (December 2015–December 2017) of humidity parameters (RH, Ea, Q, VPD, and AH) between the LCZs in Novi Sad.
Ijgi 10 00810 g003
Figure 4. Monthly averages (December 2015–December 2017) of air temperature and humidity parameters (RH, VPD; Ea) in LCZs of Novi Sad. NOTE: Full Figure S4 (with AH and Q values) can be found in Supplementary Materials.
Ijgi 10 00810 g004
Figure 5. Monthly mean differences in air temperature and humidity parameters (RH, VPD, and Ea) between urban LCZs (2, 5, 6, 8, and 9) and rural LCZ A (positive difference—blue, negative difference—red). NOTE: Full Figure S5 (with AH and Q values) can be found in Supplementary Materials.
Ijgi 10 00810 g005
Figure 6. Hourly changes in (a) air temperature (Tmean (°C)), (b) relative humidity (RH (%)), (c) vapor pressure deficit (VPD (hPa)), (d) atmospheric water vapor pressure (Ea (hPa)), and (e) absolute humidity (AH (g/m3)) during all days of the heat wave (left), and hourly average for the heat wave period (right).
Ijgi 10 00810 g006
Figure 7. Hourly differences in air temperature and humidity parameters (RH, Ea, VPD, and AH) between urban LCZs (2, 5, 6, 8, and 9) and rural LCZ A (positive difference—blue, negative difference—red) during the HW.
Ijgi 10 00810 g007
Figure 8. Hourly changes in (a) air temperature (Tmean (°C)), (b) relative humidity (RH (%)), (c) vapor pressure deficit (VPD (hPa)), (d) atmospheric water vapor pressure (Ea (hPa)), and (e) absolute humidity (AH (g/m3)) during all days of the cold wave (left), and hourly average for the cold wave period (right).
Ijgi 10 00810 g008
Figure 9. Hourly differences in air temperature and humidity parameters (RH, Ea, VPD, and AH) between urban LCZs (2, 5, 6, 8, and 9) and rural LCZ A (positive difference—blue, negative difference—red) during the CW.
Ijgi 10 00810 g009
Figure 10. Relationship between (a) air temperature T (°C) and relative humidity RH (%), (b) air temperature T (°C) and vapor pressure deficit VPD (hPa), (c) air temperature T (°C) and specific humidity Q (g/kg), (d) air temperature T (°C) and atmospheric water vapor pressure Ea (hPa) and (e) air temperature T (°C) and absolute humidity AH (g/m3) in LCZ 2 and LCZ A during the two-year period in Novi Sad. NOTE: Full Figure S10 (for all LCZs) can be found in Supplementary Materials.
Ijgi 10 00810 g010
Table 1. Mean annual variations in air temperature and air humidity parameters among LCZs in Novi Sad (Serbia) in the period December 2015–December 2017. NOTE: Red cells indicate maximum values of analyzed parameters; and blue cells indicate minimum values of analyzed parameters.
ParameterLCZ ClassMax Urban-Natural DifferenceMax Intra-Urban Difference
25689A∆LCZ X-LCZ A∆LCZ X-LCZ Y
T (°C)14.1313.913.5213.7613.7712.251.88 LCZ 2-LCZ A0.61 LCZ 2-LCZ 6
RH (%)72.5478.8678.9778.3477.9182.52−9.98 LCZ 2-LCZ A6.43 LCZ 6-LCZ 2
VPD (hPa)6.175.035.085.425.474.012.16 LCZ 2-LCZ A1.14 LCZ 2-LCZ 5
Q (g/kg)6.446.856.716.766.656.550.30 LCZ 5-LCZ A0.41 LCZ 5-LCZ 2
AH (g/m3)7.748.248.068.118.037.910.33 LCZ 5-LCZ A0.5 LCZ 5-LCZ 2
Ea (hPa)10.3711.0410.7810.8510.7410.540.5 LCZ 5-LCZ A0.67 LCZ 5-LCZ 2
Publisher’s Note: MDPI stays neutral with regard to jurisdictional claims in published maps and institutional affiliations.

