1. Introduction
Mapping serious accident places and conditions in a large city, with millions of vehicles in transit everyday is a task that can effectively contribute to save lives. More so when this effort is integrated in a Public Administration living lab initiative, that insures the knowledge generated is returned to the data holders. This paper describes in detail the application of several techniques that gather and analyze an amount and diversity of different data sources that has not been found in previous case-studies.
Geographic Information Systems (GIS) allows researchers to use various computational methods and tools to combine geographical, statistical, and mapping data to identify the spatial characteristics of a hotspot [
1]. According to Esteves [
2], “GIS are computational tools that allow the integration and manipulation of different types of information, especially suitable for spatial variables of global, regional or local nature. They are a decision support system that involves integrating georeferenced data in a problem-oriented environment, particularly those where the spatial component is strongly present”. Identifying these critical spots through GIS is especially relevant, as it makes it possible to understand the causes and factors associated with accidents, allowing consistent decisions by the city council’s mobility department. For that, it is essential to identify the existence of a pattern of spatial clusters in the accident data. In this work this is achieved using the following two spatial analysis algorithms [
3]: (1) Kernel density estimation (KDE) is a technique for interpolating and analyzing spatial patterns of spots. A set of known spots identifies the intensity with which a given variable occurs in space. It is ideal for formulating explanations and illustrating conclusions and is an easily understandable statistical method for non-mathematicians. With GIS, it is possible to visualize the concentration of processes and describe process changes at the local level. (2) Hot spot analysis in a neighborhood context, which is based on the Getis-Ord Gi statistical calculation, presents the high (hotspot) and low (cold spot) clustering values, resulting in the z-score (the number of standard deviations from the mean of an information spot) and
p-value (the probability of obtaining the observed results of a test, assuming the null hypothesis is correct). An area with a high
p-value is not necessarily a statistically significant hotspot. A spot must have a high value and be “surrounded” by other spots with equally high values to be a statistically significant hotspot [
4]. The local sum of a location and its neighbors is compared proportionally to the sum of all the spots. When the local sum is quite different from the expected local sum, and if this difference is too large, a statistically significant z-value occurs [
5].
The object of this study was derived from a challenge using real data, originated from the municipality, based on available data of the Lisbon City Council Mobility Office. This initiative involves the municipality and the academy searching for solutions through data analysis for real city problems. This challenge required the identification of areas prone to traffic accidents (hotspots) in the municipality of Lisbon and their causes.
The “Lisboa Inteligente” challenge aims to give the municipal authorities the necessary data responsible for mobility and the management of Protection and Rescue. It provides the necessary information to improve the planning and management of the city’s traffic, allowing the identification and implementation of mitigating measures that limit the number of accidents and victims in these accident hotspots.
Thus, and to achieve the objective now materialized, a multivariable space–time analysis of the road accidents that occurred between 2010 and 2019 was carried out to identify the location of its hotspots.
The work began with a collection of data provided by the Lisbon Municipality (CML) to the University Institute of Lisbon (ISCTE-IUL), which included a database dump of Fire Brigade Regiment (RSB) occurrences for the year 2019 and some shapefiles with geographical data of the municipality, namely, the slopes values traffic lights, intersections, and altimetry. It seemed from the beginning and after analyzing the data provided that it fell short of the real needs for an investigation of this nature. Thus began a meticulous process to gather the necessary data to allow a robust and efficient analysis. This process allowed the fusion of data from six different entities, which provided more information and different possibilities for conclusions than any known previous study on this subject.
2. Literature Review
Our research goals are mainly to explore the results of data fusion and big data analytics to extract knowledge from several disperse, large data-sets. We believe that this fusion along with the adequate technique of data visualization will allow us to understand the places and conditions that increase accident likelihood. The identification of the RTAs Hotspots and the pinpointing of their causal factors was a request from Lisbon municipality.
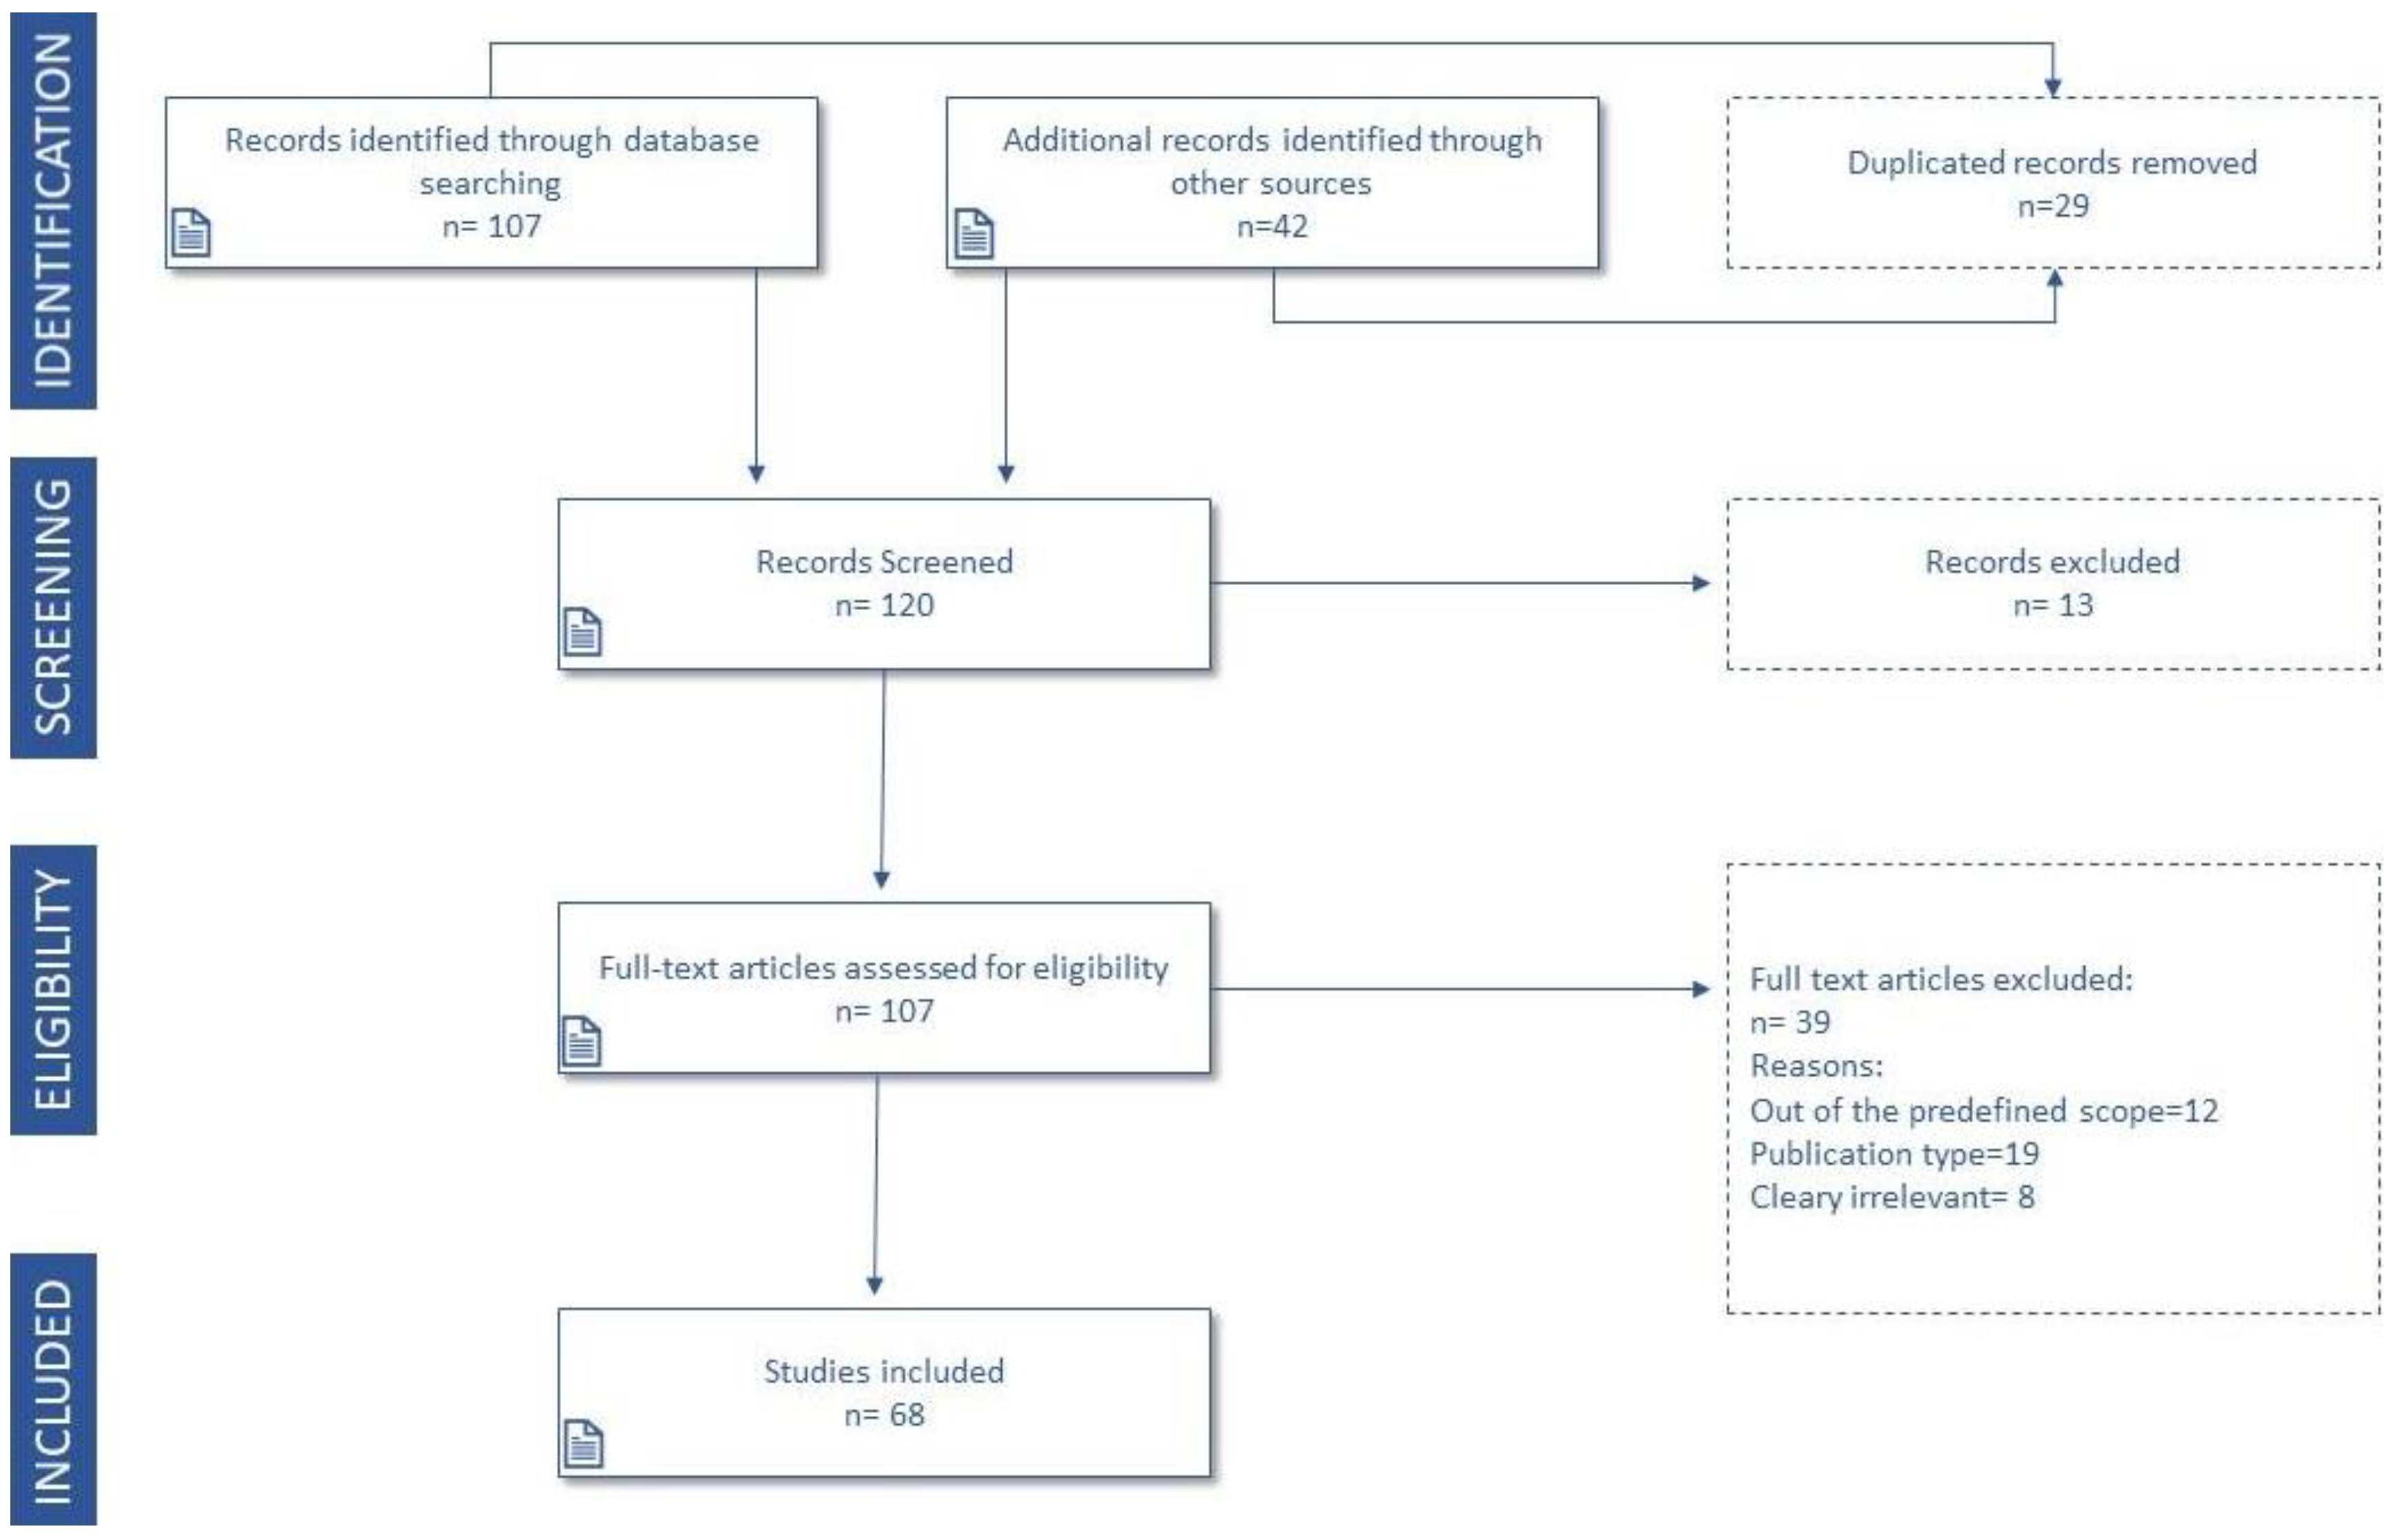
A hybrid approach combining two methodologies was used to conduct the systematic literature review. The PRISMA Statement—Preferred Reporting Items for Systematic Reviews and Meta-Analyses [
6], whose objective is to ensure that systematic reviews (SR) and meta-analyses are done in a thorough, clear, and precise manner; and, complementarily, the snowball sampling methodology (non-probabilistic sampling using reference chains), a technique that searches for new sources of information based on the references used by the documents that scientifically support this study.
Therefore, the systematic search was done in three academic search engines: Scopus [
7],
Biblioteca do Conhecimento Online [
8], and Web of Science [
9]. The time interval considered for these articles was the publication date between 2010 and 2020. The location of the articles needed for this study was made through different combinations of groups of keywords. Through them, the existing contents in the respective databases was extracted and filtered:
(“Road Traffic Accidents” AND “analysis” AND Portugal AND spatial pattern);
(RTA AND accident AND mapping AND spatiotemporal analysis);
(Traffic accident AND GIS, AND Kernel density estimator AND KDE+ OR “Getis-Ord Gi”);
(Lisbon AND RTA AND “GIS”; (KDE AND KDE+)) AND (hot spot analysis); (Lisboa AND Acidentes de transito); (human factors AND road accidents).
The results obtained were filtered according to a rationale applied to the Covidence [
10] systematic literature review tool, consisting of three steps: (1) Eligibility Criteria—at this stage, the results are approved or rejected according to the following criteria: Language (only articles written in English or Portuguese are accepted); date of publication of the article between 2010 and 2020; (2) scientific literature exclusively from scientific articles or reviews, apart from grey literature from the Lisbon City Council, the National Road Safety Authority, and the European Commission. These intervention plans, technical documentation (e.g., Municipal Emergency Plan of the Civil Protection of Lisbon) and reports, cannot be published in the scientific community; and the article The CRISP-DM Model: The New Blueprint for Data Mining, for not meeting the publication date criterion.
After analyzing and filtering the results, the values obtained are depicted on
Figure 1.
The map visibly highlights the term “GIS” as the central concept of the links and relationships established, followed by the term “Road Safety”, traffic accidents, and Hotspots.
A critical component of reducing road traffic accidents is analyzing the locations of the accident. Road traffic accidents do not occur at random. They are prone to congregate in particular locations for reasons that can be explained by a variety of circumstances referred to as “influencing factors.” These clusters, or concentrations of RTAs, which are usually referred to in the literature as “hotspots”, are described as locations that have “a higher number of accidents than other similar spots due to local risk factors” [
11]. This notion refers to the concept that hotspots are prone areas where the geometry and the traffic design (e.g., congested intersections, sharp curves, and inefficient vertical signalization) play a significant role in accidents, which can be reduced if the influencing factors are identified and corrected by the authorities. There is no universally accepted and precise definition of accident hotspots [
12] as definitions differ among scholars and are adapted to suit each country’s features and governmental goals. Rune Elvik compiled hotspot definitions in European countries [
13] in order to demonstrate the differences.
According to the literature review and the comparison of approaches for defining hotspots, no European country has fully adopted an identical methodology for determining hotspots as depicted on
Table 1. Applied methods of identification, each with distinct strengths and weaknesses in their field of application, are beneficial in locating hotspots. In view of the above, this study uses the hotspot definition provided by the Portuguese National Road Safety Authority (ANSR): “A stretch of road with a maximum length of 200 m, in which there were at least five accidents with victims in the year under review” [
14].
The academic world has used different statistical models to try to classify hotspots. This topic gained momentum in the last quarter of the 20th century, specifically in the late 1970s. Gaussian regression, Multivariate Poisson regression, and negative binomial models were applied in several studies, taking into account the randomness of events in space and time [
15,
16]. The results of the mentioned models were incorrect because they considered the spatial characteristics of an RTA as constant for a given period, which Lakshmi [
1] described as occurring “when the assumption that mean and variance must be equal is violated. When the accident data are over-dispersed (variance exceeds mean) or under-dispersed (mean exceeds variance), it will lead to erroneous inference with the parameters which determine the crash frequency.” The identification of a hotspot requires a much more detailed analysis of the causes and factors—e.g., the severity of the crash, the road conditions, the vehicle conditions, and the weather factors present/existing when the accidents occurred [
12,
13,
14,
15,
16,
17].
Nowadays, researchers are combining GIS and spatial analysis techniques to examine the spatial distribution and spatial dependence of RTA events in a two-dimensional (2D) planar space, utilizing global indices such as Global Moran’s I (spatial autocorrelation), Getis-Ord G, and Getis-Ord G*, which enable investigators to identify statistically significant hot spots, cold spots, and spatial outliers. Moreover, local indices such as KDE and Local Anselin Moran can be used to identify the spatial locations of RTA clusters. Geographic Information Systems (GIS) have established themselves as a critical and powerful tool for spatial data analysis over time due to their multiple features and uses. These systems enable the storage, modelling, analysis, and visualization of georeferenced data. Spatial data analysis is the study of spatially referenced phenomena using approaches that attempt to describe and explain why specific events occur in particular locations.
Khanh Giang Le et al. [
18] used a combination of KDE and COMAP techniques (comprehensive mitigation assessment process) to identify RTA hotspots. Both analyses determined relatively similar hotspots, but the ranking of some hotspots was quite different due to the integration of the severity index. In this evaluation, Khanh Giang Le proves that in addition to accident frequency, accident severity level is also essential because it helps to highlight the accidents that involve significant damage. Kaygsz et al. [
19] conducted a spatiotemporal analysis of traffic accidents on Turkish motorways. Due to data quality, only the South Anatolian Motorway was numerically investigated. Both the KDE and Network KDE techniques were used to identify hotspots, which mainly occurred during the summer. The most common accident types in the study region were rear-end collisions, stationary object collisions, and run-offs.
Using accident data from Pennsylvania between 1996 and 2000, Aguero-Valverde and Jovanis [
20] approximated the annual frequency of accidents in the United States at the county level according to hierarchical models. Sociodemographic data, weather conditions, transportation infrastructure, and journey time were among the elements considered. They discovered that parameters such as low poverty, age range (specifically, 0 to 24 and over 64 years of age), road length and traffic flow density contribute to an increased likelihood of road accidents.
Iyanda [
21] used a smoothing method to predict two years of road accident events based on previous historic RTA in all 36 states and the federal territory of Nigeria. This study employed Moran’s I, a spatial autocorrelation statistic, to determine the degree of randomness of RTA severity among the 36 states. It also used Anselin’s local indicator of spatial association (LISA), which provides a statistic for each location with an assessment of significance and establishes a proportional relationship between the sum of the local statistics and a corresponding global statistic. According to the findings, the northern portion of Nigeria has the highest RTA severity compared to the southern states. Local research suggests that these clusters in the northern part of Nigeria did not happen by chance; the geographic patterns are considerably clustered.
Kernel density estimation is a widely used and well-established spatial technique for estimating crash intensity and identifying hotspots [
12,
22,
23]. This method converts a collection of point events into a continuous surface that indicates their density and enables researchers to examine the variance in the mean value of the event under study over the study area—i.e., how events are distributed in space.
Erdogan et al. [
24] investigated accident hotspots and identified unsafe zones on highways in the Turkish city of Afyon. KDE and repeatability analysis were applied to analyze the data. Both assessments identified nearly identical locations as hot spots. The majority of them were around junction points, crossroads and access routes to villages and towns. They also discovered that the number of accidents increases in the summer and winter, particularly in August and December. Weekends had higher frequencies as well. Furthermore, they found that the majority of deadly accidents occurred after midnight. Anderson [
12] recommends utilizing GIS and KDE to examine regional patterns, such as injury crash hotspots, and then merging the data with clustering techniques.
Prasannakumar et al. [
3] studied 1468 accidents that were reported to the police in Thiruvananthapuram, India, in 2008. Unlike many other work reports, these provided each event’s coordinates. To conduct the investigation, researchers compared the spatial autocorrelation methods of Moran’s I, Getis-Ord Gi* statistical index, and KDE.
When the Getis-Ord Gi* and KDEs were applied, the Moran I revealed that the data tend to cluster in specific time zones [
25]. Furthermore, using methods such as the Moran I, hotspot analysis, and KDE, Aghajani et al. [
25] discovered a significant relationship between accident density, topography, and rainfall maps—i.e., more mountainous regions and locations with higher rainfall have a higher accident density. Of the studies described above, few suggest accident prevention strategies. Instead, they focus only on the process of discovering hotspots and providing a descriptive analysis. Taking into account this scenario we performed data integration from different information sources to enrich this data analytics process. This approach can be applied to any smart city with available data. This data allows the discovery of important knowledge based on which local authorities can act.
3. Materials and Methods
For the implementation of this study, we started contacts with ANSR and Instituto Português do Mar e da Atmosfera (IPMA) to obtain the necessary data. From these contacts was born a cooperation protocol between ISCTE and ANSR that will allow other students and researchers to access a precious source of information.
After a new analysis, we realized that it was still not possible to measure the volume of traffic on the Lisbon roads at the time of the accident. IMTT and TomTom were essential to get this answer.
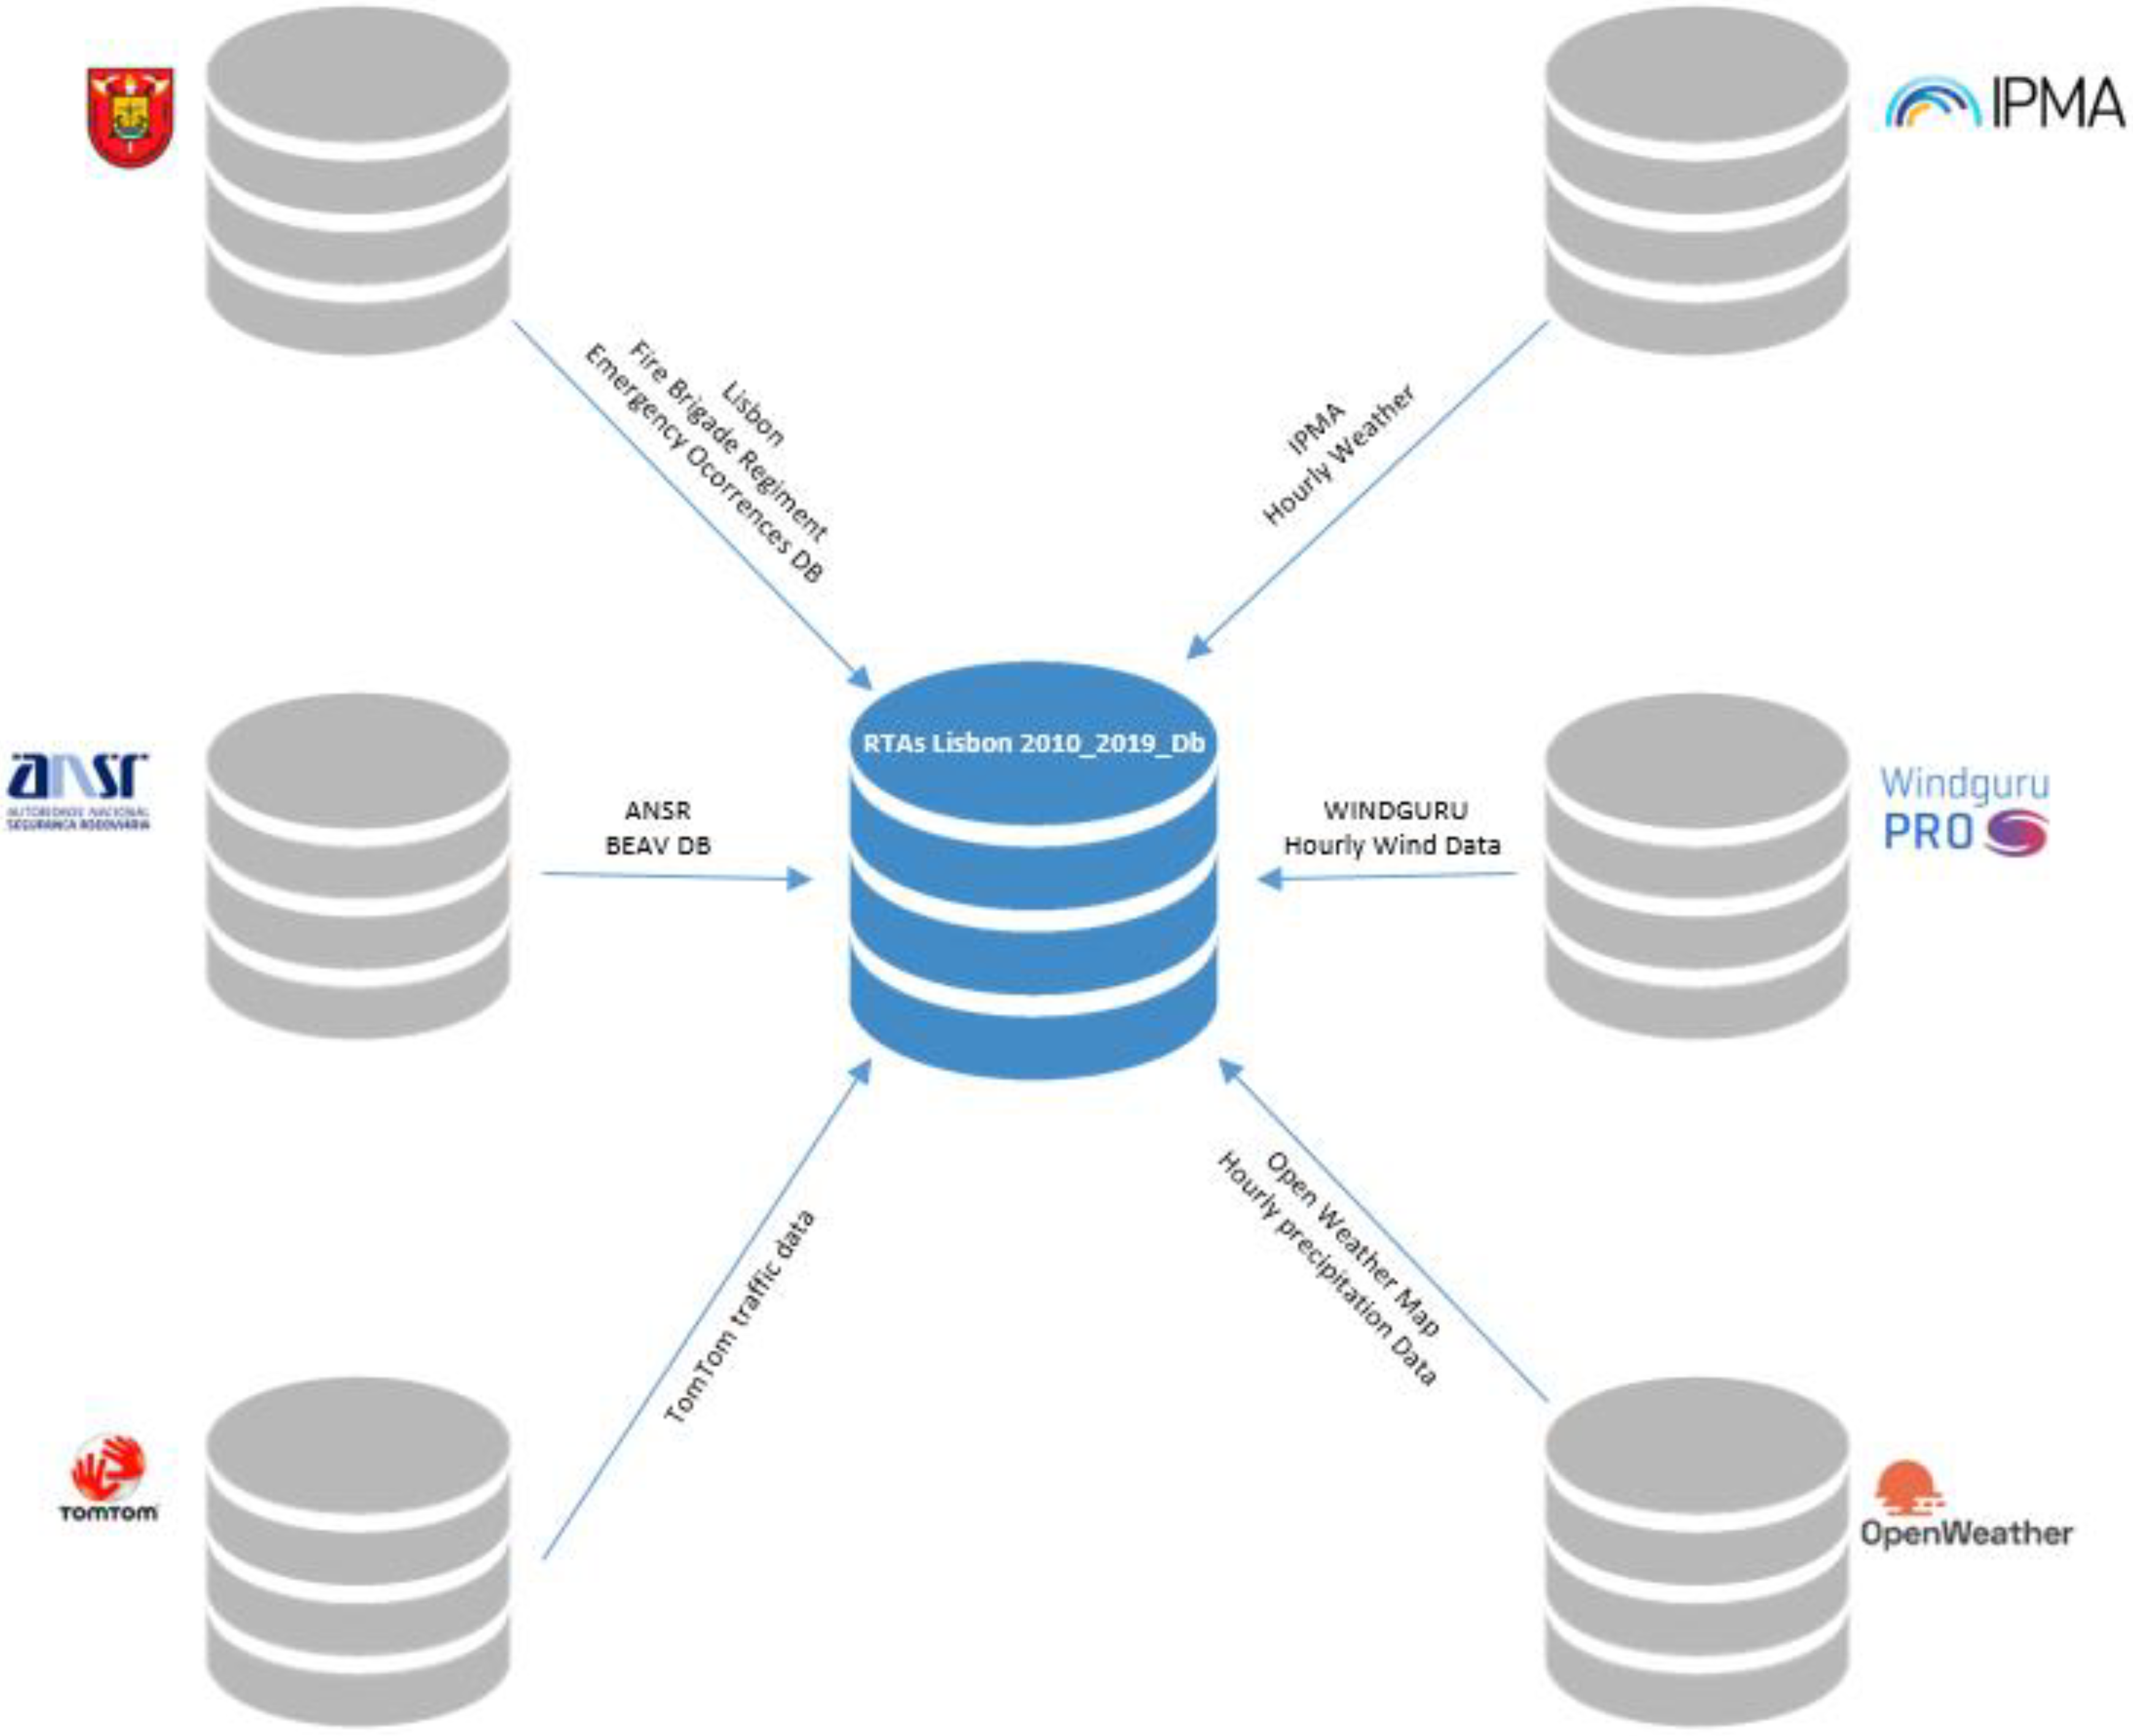
Once the necessary data were gathered, we proceeded to cleaning and preparing data from 6 different sources with georeferenced information and in different formats, carrying out the whole process of feature engineering for the transformation and construction of derived data, etc.
A single dataset was created recurring to different set of data requested to different entities, such as
All the different data sources mentioned used in this research study are depicted in
Figure 2.
Regarding 1, the records in this dataset showed several inconsistencies, particularly concerning the recording of wind speed and direction (absences) and precipitation. Several precipitation records had a value of “−990” (value expressed in mm/hour), which was identified initially as a natural phenomenon known as negative rainfall, but was later clarified by IPMA specialists as a weather station code error (sensor not working).
In 2 and 3, the records included in the dataset contained 87,829 lines of hourly wind information speed and direction (for 2) and weather information (regarding 3) with very few missing data.
For the dataset in number 4, the dataset is composed of 22,725 accident records. In this dataset we only used data regarding the accidents that produced victims (Deaths, Serious Injured, Light Injured).
Concerning 5, he dataset included 10,097 records from all occurrences related to the three natures associated with an RTA—(1) accidents involving vehicles, (2) accidents involving extrication operations, and (3) accidents involving pedestrians.
Lastly, for 6, it was not possible to obtain data for the whole period under analysis due to the financial burden that this acquisition represented, so it was decided to limit the acquisition to a period of one year (2019; organized in monthly datasets subdivided into weekdays and weekend data). Due to the cost to obtain the data for a 10-year span, it was assumed together with the experts for the purposes of this study that the values obtained are sufficiently representative of the dynamics of Lisbon traffic. Therefore, the data results were applied to the full extent of the dataset.
After this step and having a new dataset that gave us the necessary data for the study, we began the task of statistical data analysis, identifying patterns and deviations, and the search for a justification for some of the results that proved challenging.
Once the ETL was finished, we proceeded to all the processing and geographic analysis work using ArcGIS PRO version 2.8 and the applicability of spatial autocorrelation algorithms, namely, the Kernel density estimation, the Moran I index, and the Hotspot analysis getis ord gi*.
Our goal is based on accident data using GPS identify hotspots. For that, global Moran’s I was used to evaluate the data for spatial autocorrelation. Then we used the Kernel Density Estimator to identify accident hotspots because it is a widely used method that is simple to apply and implement and produces visually appealing results [
31] similar to those obtained by the authors mentioned above [
12,
21,
22,
23]. Moreover, when combined with hot spot analysis (Getis-Ord Gi*), it allows for identifying problematic hotspots in Lisbon’s road network. Moran’s Index values vary from –1 to 1, with a value near +1.0 indicating clustering, a value near −1.0 indicating dispersion [
32], and a value of “0” indicating perfect geographic randomness [
33].
3.1. Global Moran’s I
Global Moran’s I is a widely used spatial autocorrelation indicator. The initial measure on spatial autocorrelation for Road traffic accidents in this study was Global Moran’s I. we used Global Moran’s I to identify whether the spatial output pattern is clustered, scattered, or random, as well as is concentration levels [
3]. The null hypothesis states that the feature values are distributed randomly throughout the research region. Moran’s Index values vary from −1 to 1, with a value near +1.0 indicating clustering, a value near −1.0 indicating dispersion [
34], and a value of “0” indicating perfect geographic randomness [
35].
The
p-value is a probability that indicates whether the observed values were generated by random processes or by other geographical activities. When the essential z-score values are 1.655 at a 90% confidence level and the
p-value is more than 0.10 (>0.10), the null hypothesis can be accepted. The null hypothesis can be rejected when the crucial z-score values are more significant than 1.65 at a 90% confidence level, and the
p-value is less than 0.10 (0.10). This is because significant clustering exists beyond this region [
24]. In the tails of the normal distribution, very high (+2.58) or very low (−2.58) z-scores are discovered, which are associated with very small
p-values (0.01) and represent clustering or dispersion at a 99 percent confidence level. Substantial hotspots (shades of red in Image 3.2) are indicated by high z-scores linked with small
p-values, whereas significant cold spots are indicated by low z-scores coupled with small
p-values [
36].
The Spatial Autocorrelation tool was performed for each iteration with distance criteria defined by the ArcGIS Incremental Spatial Autocorrelation. The direct distance between two points was utilized to determine the locational proximity of data events, whereas the inverse distance weighting approach was employed to determine the locational proximity of neighboring points. Because each data point is analyzed in terms of its neighbors, determined by a distance threshold, it is important to pick a distance threshold that maximizes spatial autocorrelation [
3]. The Global Moran I-Index is calculated using the following equation:
3.2. Kernel Density Estimator for Road Accident Analysis
One of the most popular techniques for identifying hotspots is spatial point pattern analysis, and there are several methods for doing so. We have followed the recommendation in [
12] to utilize GIS and KDE to examine patterns as explained in the state of the art. These can be divided into two categories [
25]: first-order methods, which measure the variation of the process’s mean value, such as quadrant counting or KDE, and second-order methods, which examine the spatial dependence of points and use functions to explain this level of spatial dependence.
As previously stated, KDE is the most widely used non-parametric statistical method for smoothing data because it is simple to understand and implement. It uses a kernel, K(x), centered in the estimation location (Xi), to calculate the density value of a set of point events (n) in a given area, interpolating them and generating a continuous, more or less smooth surface. The kernel is a weighted function that can be Gaussian, quadratic, or conic in nature. In other words, the function counts the number of points within a region of influence, weighting them according to their distance from the location of interest; the bandwidth h determines the region of influence.
Equation (2) expresses the Kernel density function
f:
The chosen kernel and the bandwidth are two parameters that can influence the final result. However, according to several authors, including Wand and Jones [
35], the final result is relatively unaffected by the type of kernel used. The bandwidth is the most crucial parameter and has the most significant impact on the final result. It determines the smoothness of the surface produced; bands that are too small produce non-smooth results, while bands that are too wide produce the opposite effect. Because it varies with the study area and data and sometimes requires a subjective judgment when applied, there is no universal formula for determining this parameter.
This study applied the KDE method in ArcGIS PRO 2.8 [
34] with the Spatial Analyst extension. After testing several bandwidths, a bandwidth of 500 m was chosen. The hotspots covered a large portion of the study area with larger bands, making it impossible to pinpoint hotspot concentration locations on specific roads. In comparison, only a few hotspots were identified with smaller bands, resulting in an uneven surface that required multiple attempts to achieve [
36].
3.3. Hotspot Analysis (Getis-Ord Gi*)
The Getis-Ord Gi* are a group of statistics with several properties that make them appealing for quantifying dependence in a geographically distributed variable, particularly when combined with Anseli Moran’s I [
37].
The Getis-Ord Gi* analyze evidence of spatial patterns, according to is creators, Getis and Ord [
4], “
deepen the knowledge of the process that give rise to spatial dependence and enhance detection of local pockets of dependence that may not be detected when using the global statistic”.
The Getis-Ord Gi* statistical computation is used in this study to determine where the spatial clusters (hotspots) of road accidents with victims occur in the study area. In addition to identifying these clusters, the algorithm uses the z-score and p-value values to determine where the highest/lowest values for spatial clusters occur.
The Getis-Ord Gi* spatial cluster analysis analyses the characteristics of each occurrence of road accidents with victims, accessing each record in a neighborhood context and looking for the distance that ensures that each record (accident) has at least one neighbor. A high-value occurrence does not necessarily imply a hot zone.
To be statistically significant, it must have a high value and be surrounded by additional high-value occurrences.
The sum of a given characteristic, [accident], with its neighbors is proportionally compared to the sum of all attributes. When the local sum differs significantly from what is predicted, and this difference is not a random outcome, a z-score with statistical significance is produced.
where:
Gi* is the spatial autocorrelation statistic of an event i over n events. The term,
xj is the attribute value for feature
j,
wi,
j is the spatial weight between feature
i and
j,
n is equal to the total number of features.
Once calculated, t the determined value is a z-score, and the greater the score, the stronger the clustering of high values (hot spot). When the z-score number is negative (low-value), more cold spot values are clustered.
4. Major Outputs Applied to Lisbon City Data
Using a GIS-assisted technique (ArcGIS Pro) to identify accident hotspots within the Lisbon municipality area will aid in the identification of contributing causes and will assist the city council and its departments in implementing mitigation measures to make driving safe in these areas. The Kernel Density Estimation (
KDE) and Getis-Ord
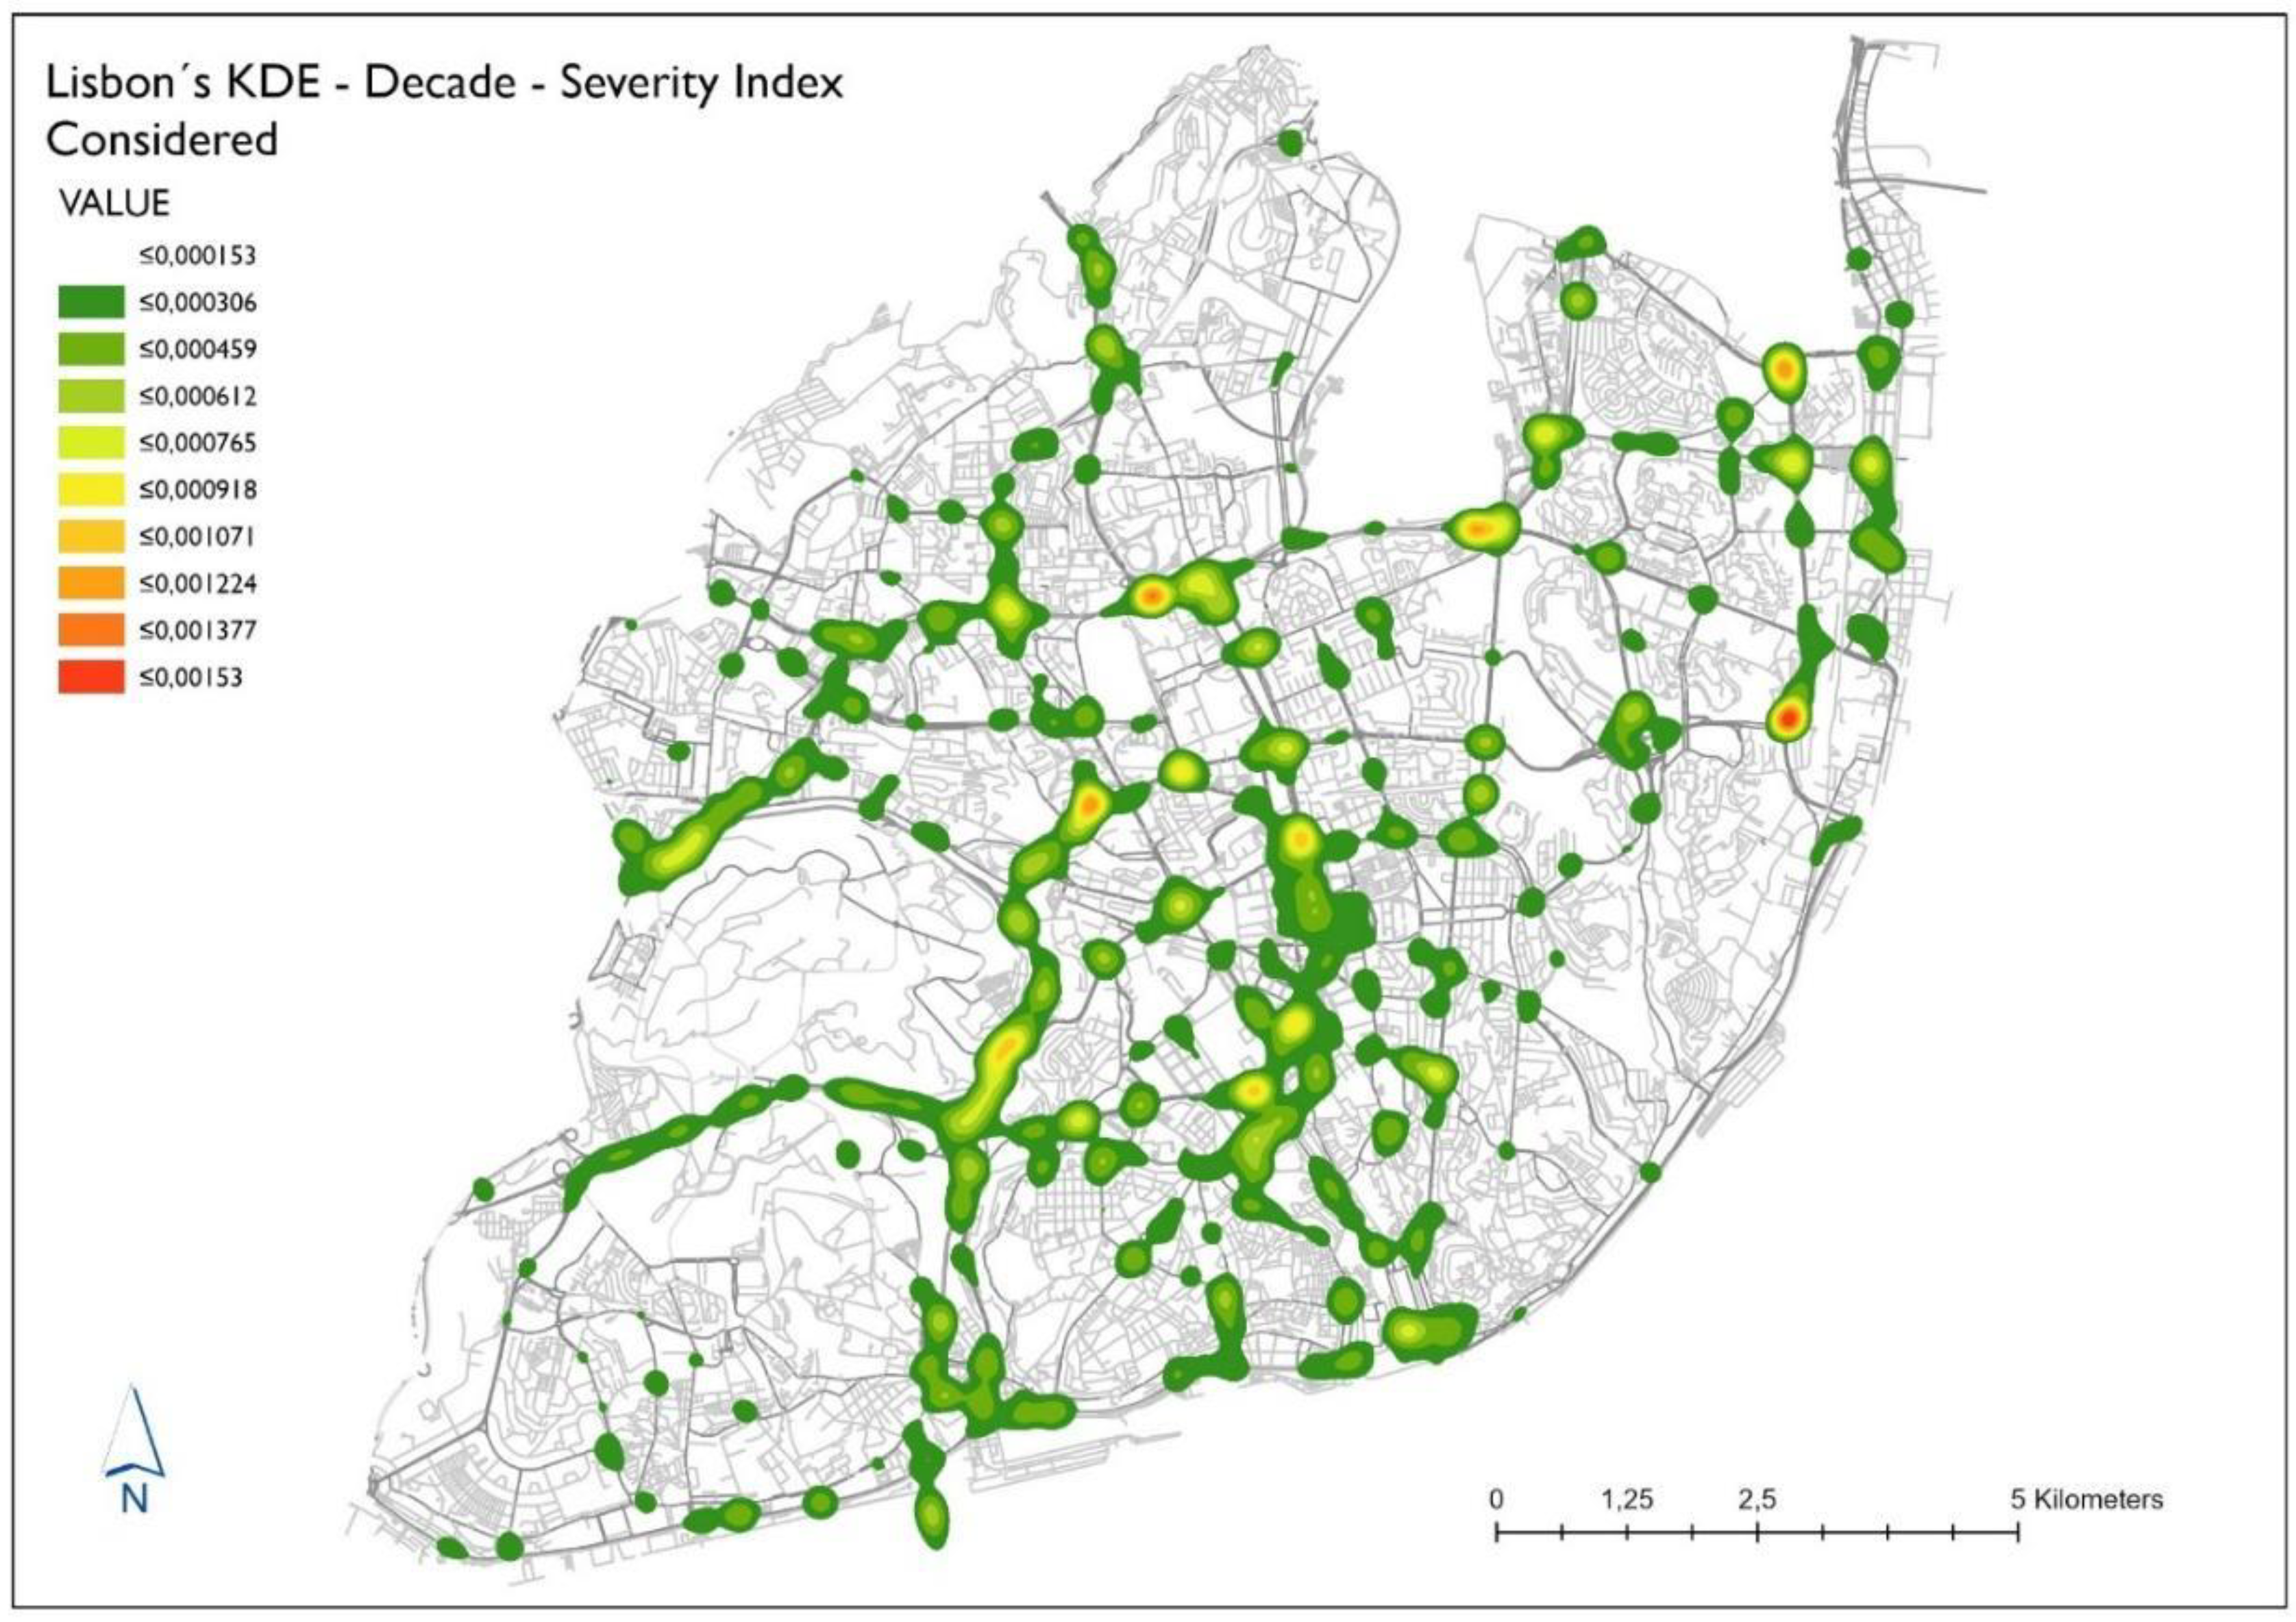
Gi* hotspot analysis were used to identify hotspots of road traffic accidents with victims in the Lisbon city area based on the location and characteristics of the road accident. Using Kernel density analysis and Getis-Ord Gi* hotspots analysis, different densities and levels of confidence were determined for each year’s data. The map produced by the Kernel density analysis and Getis-Ord Gi* hotspots analysis from the decade 2010–2019 is displayed on
Figure 3. Several hotspot areas occurred in the study area consistently throughout the study period. The data were checked for spatial autocorrelation using global Moran’s I before performing KDE and Getis-Ord Gi* hotspot analysis to ensure that the data contained spatial clustering required for hotspot analysis. The ANSR definitions (5 victims, 200 m) of a hotspot were aggregated and used to determine an appropriate search radius distance for KDE and Getis-Ord Gi*.
In order to obtain the parameters required to proceed with the hotspot analysis, the data for the biennium were selected in ArcGis Pro 2.8 using a SQL Query that allowed us to select only the road accidents with victims for the years in review (2010–2011; 2012–2013; 2014–2015; 2016–2017; and 2018–2019), after which the five biennia were subjected each one to the Moran I calculation to assess the existence of clusters of RTAs. The inverse distance and the Euclidean distance method were introduced to conceptualize spatial relationships; no threshold was used. The results obtained demonstrate a strong cluster Padron of accidents, with a positive Moran’s Index of 0.99, a z-score of 65, and a p-value of 0.01, giving us less than 1% likelihood for the clustering pattern result of random chance. Thus, we can reject the null hypothesis.
The next step after identifying spatial clustering of road traffic accidents in 2010 and 2011 was to conduct a Kernel Density Estimation (KDE) in ArcGis 2.8 utilizing the tool spatial analyst tool. Anderson [
12] identifies cell size and search radius (bandwidth) as the two most important elements influencing the KDE technique. According to several experts, the bandwidth is the most critical parameter for determining the best density surface [
38]. As a result, the selection of bandwidth will have a considerable impact on the outcome of the hotspots. Specifically, the smaller the bandwidth, the smaller the hotspots.
The value of bandwidth will influence the smoothness of the density surface. The smoother the density surface, the larger the bandwidth. As a result, it is critical to select an ideal bandwidth.
To determine the desired bandwidth, we used Fumiya’s study [
39], which suggests making incremental 50-m jumps until the hotspot plot reaches the equilibrium, i.e., larger bands, hotspots cover a large portion of the study area, making it challenging to identify hotspot concentration points on specific roads correctly. In comparison, only a few hotspots are identified with smaller bands, resulting in a rough surface. In our case, we reached a balance in the bandwidth of 250 m.
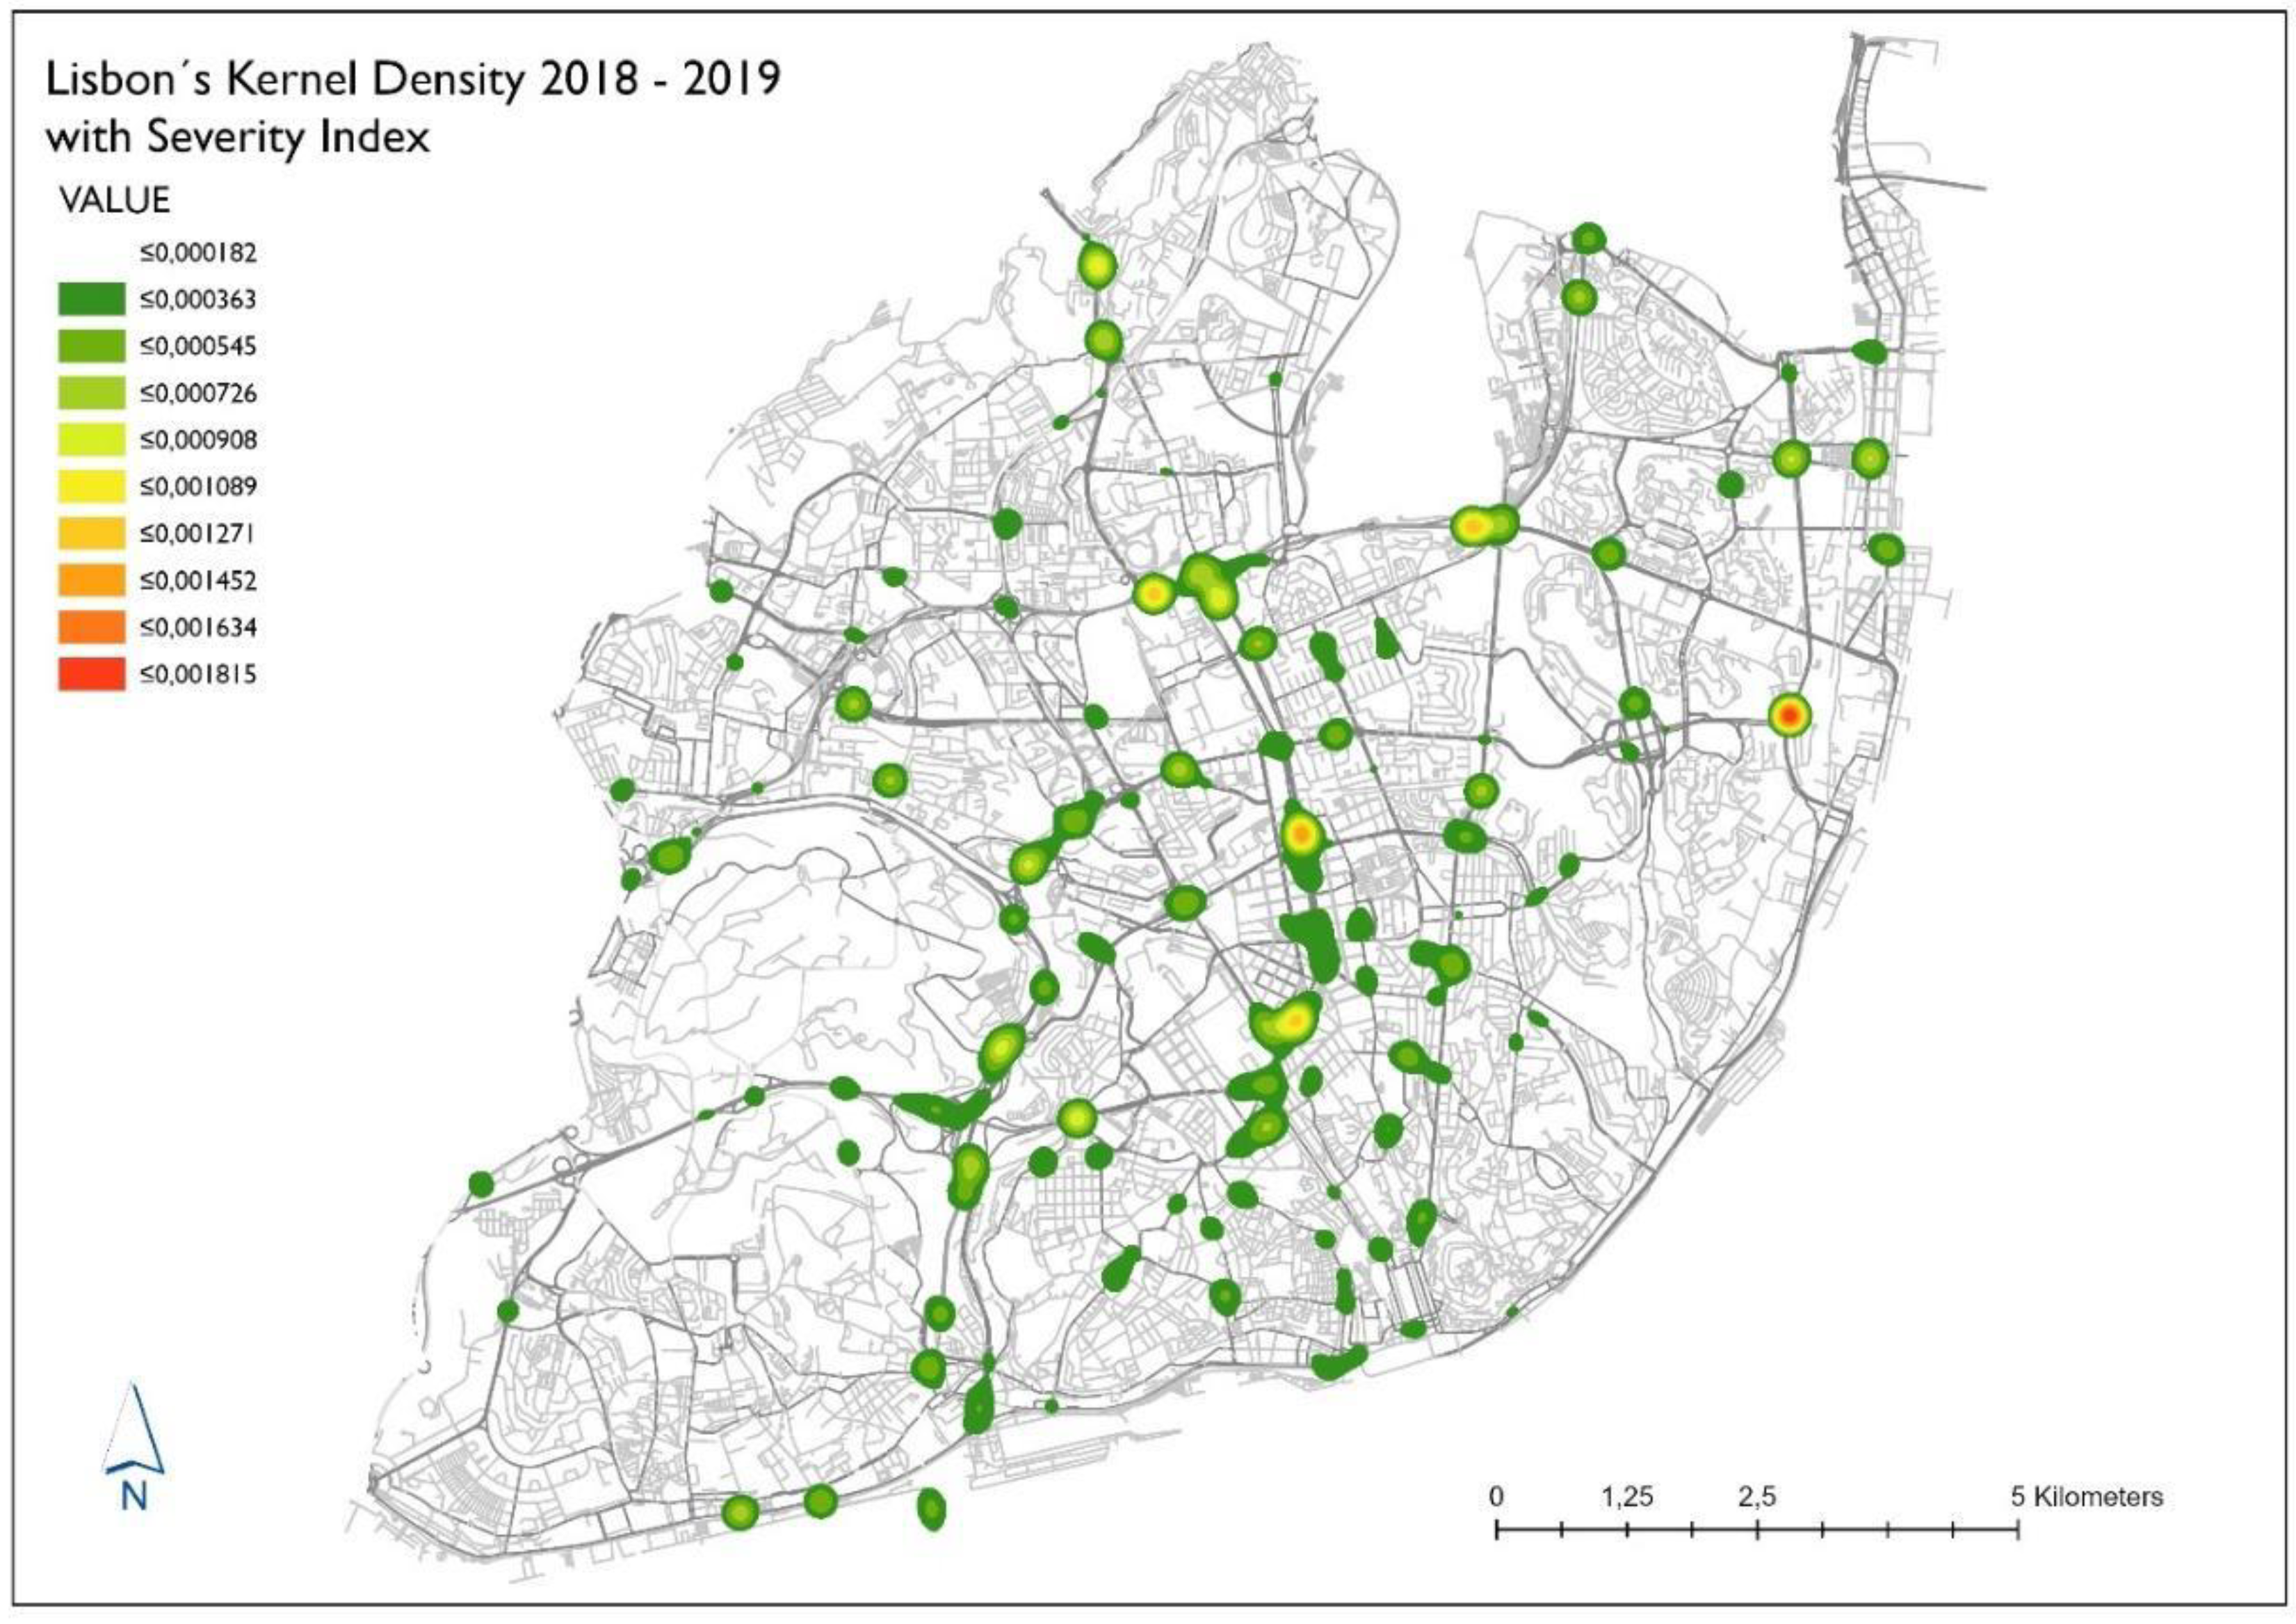
The 2018–2019 biennium presents the second outlier in our data. There is a decrease in the number and location of hotspots, particularly in the city center, the spots that were previously spread across the 3rd Level, 4th Level, and 5th Level roads are practically non-existent. If in 2012–2013 the economic crisis justified the reduction in traffic and consequently the reduction in accidents with victims, the current biennium cannot justify the same. Portugal is in total economic growth, according to the Tourism of Portugal [
40], and Lisbon is one of the European cities with the highest demand, registering numbers in the order of 7.5 million tourists only in 2018. To understand this phenomenon, we asked the Lisbon Municipal Civil Protection and the Lisbon Municipal Police what could justify this decrease. The conclusion we reached is both surprising and revealing. Once again, explaining the thesis defended in this study that human factors are undoubtedly the most significant contributor to a road accident with victims.
Comparing
Figure 4, with the decade from
Figure 3 there is a marked decrease in the number and location of hotspots, particularly in the city center.
This phenomenon is explained since in 2019, the Lisbon Municipal Police (PML), in addition to the 21 fixed speed cameras, started to control the speed with mobile speed cameras strategically placed in areas where the speed limit is 30 km/h (4th Level and 5th Level roads) such as residential areas or schools. The control of mobile speed control in the municipality allowed PML to record a record number of offenses, with a total of 61,540 severe infractions, ten times more than in 2015 (6842). This data and the study of the average speeds recorded by TomTom showed that drivers adjusted their speed to the limit imposed by law mainly on the roads mentioned above, resulting in a clear decrease in road accidents.
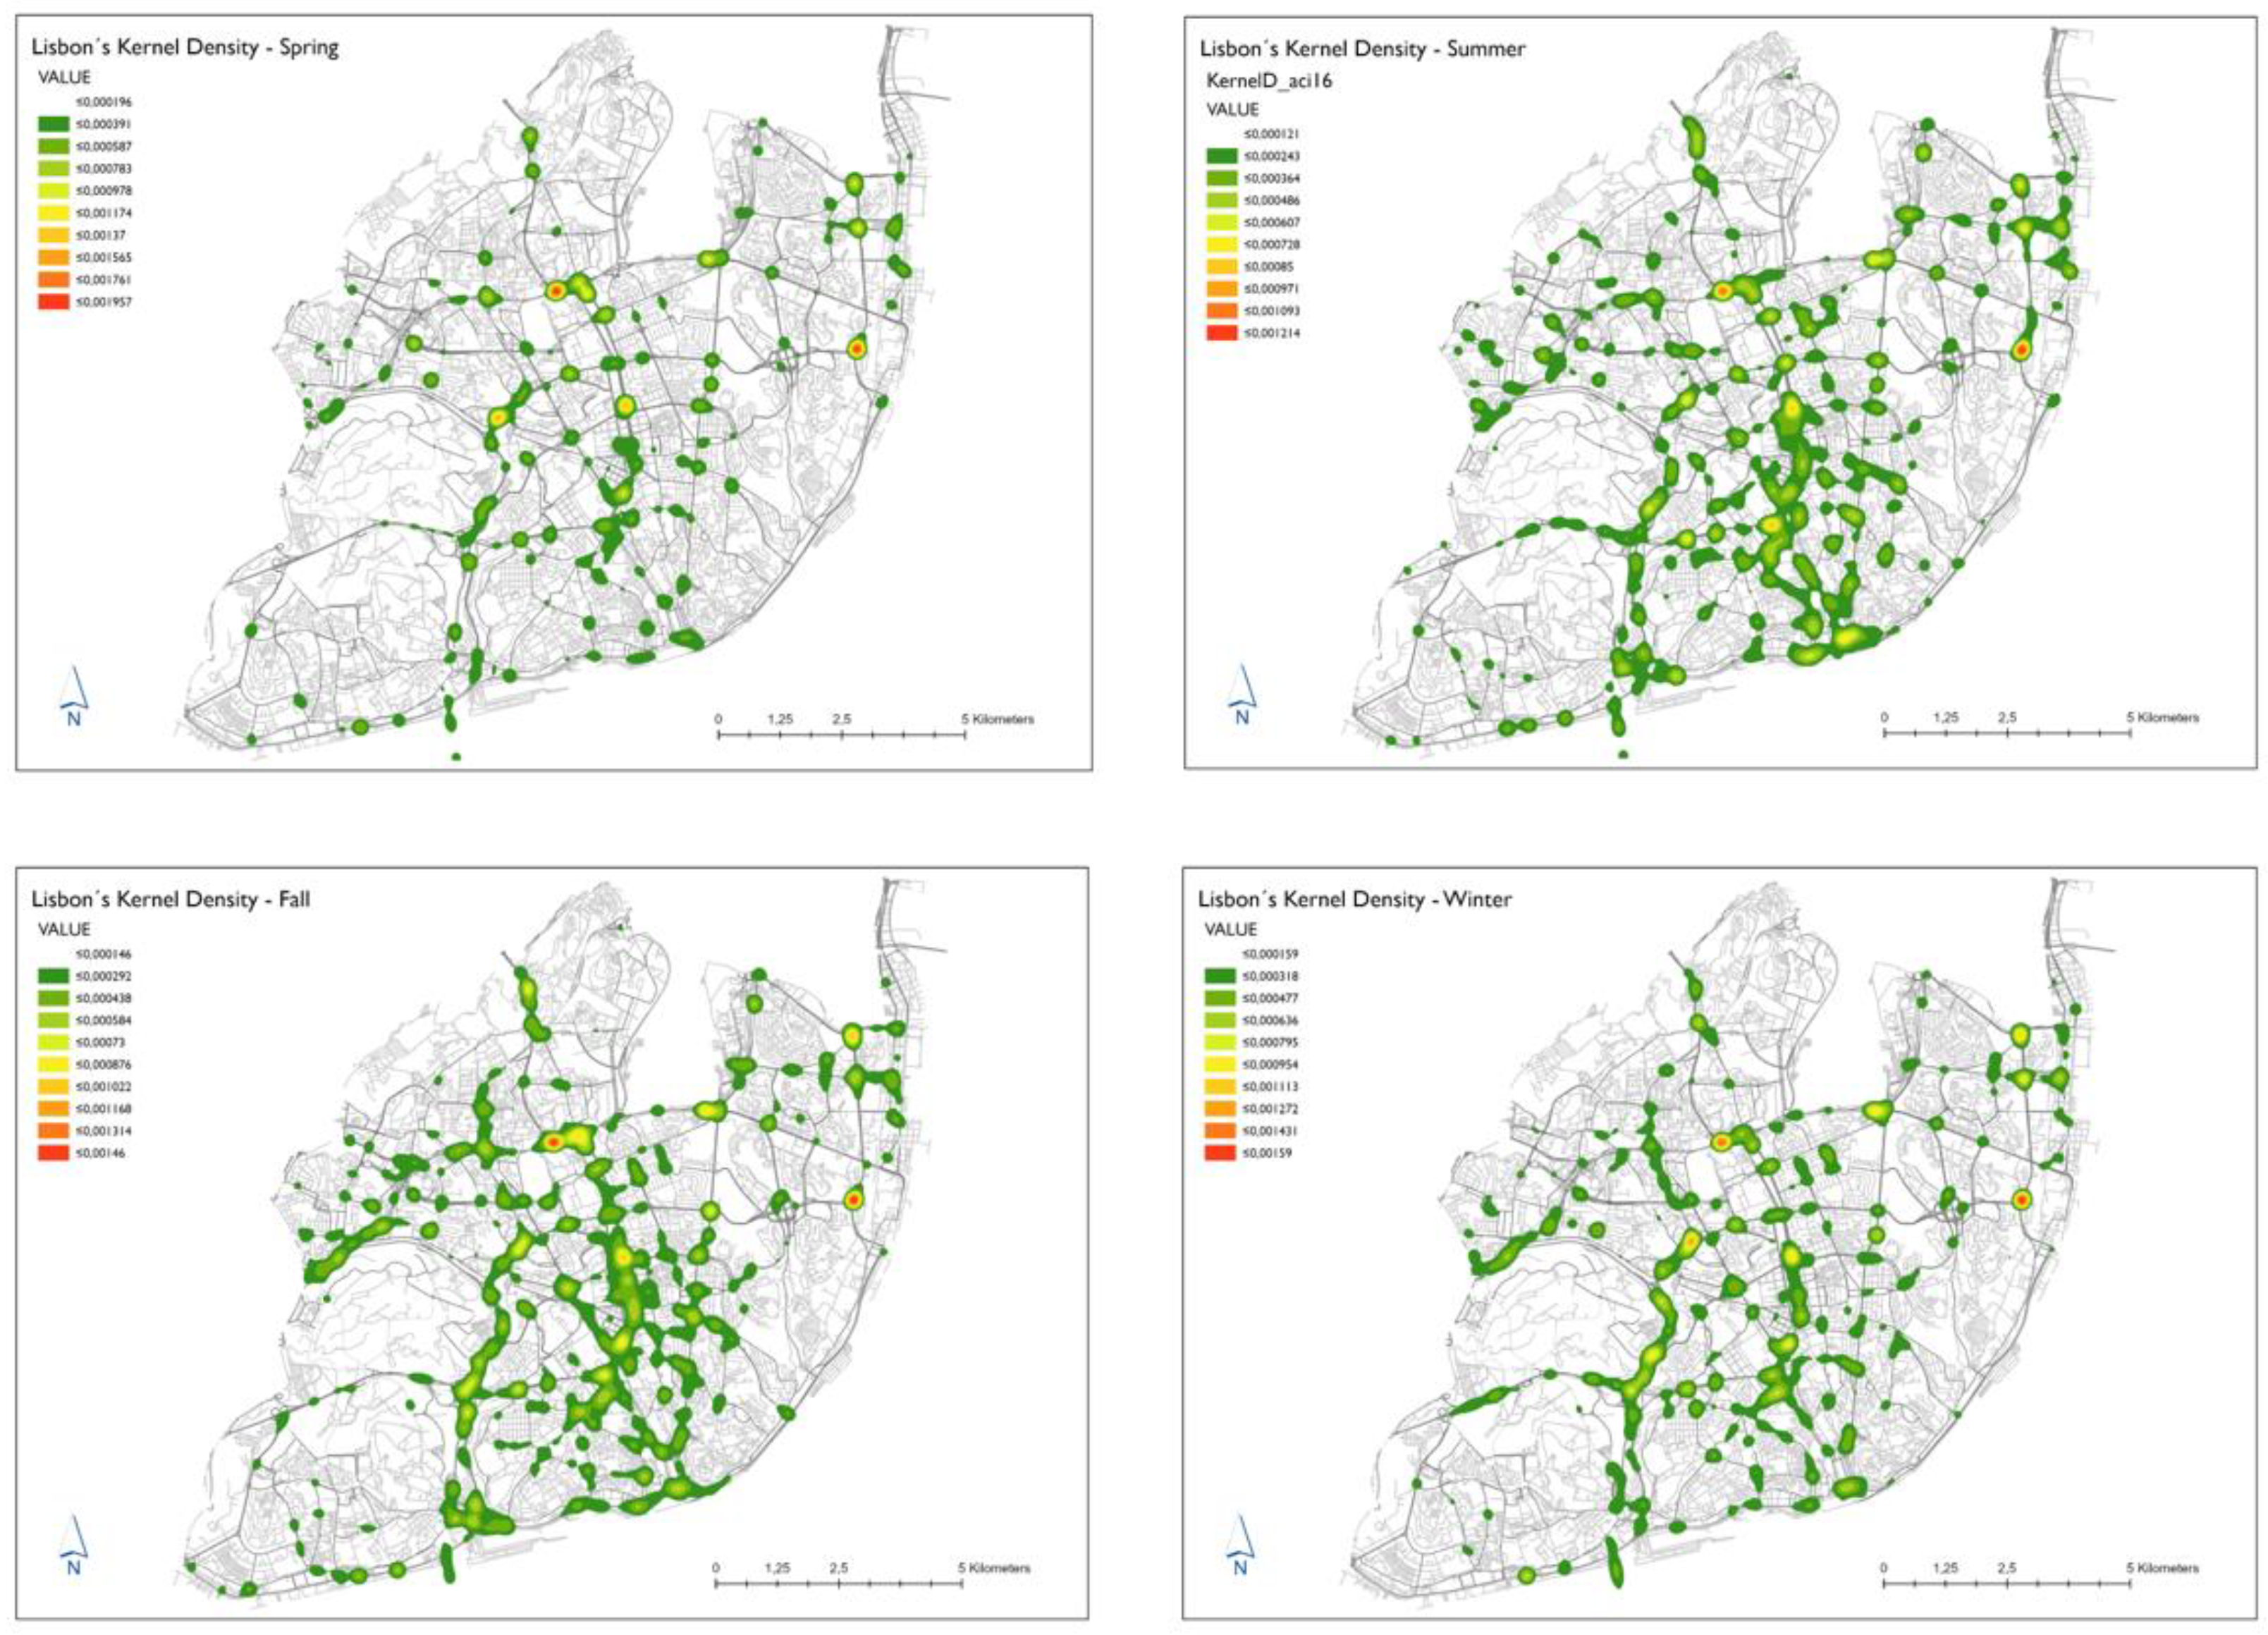
A seasonal analysis was performed, and
Figure 5 depicts the temporal study of the kernel density for the seasons of the year of accidents with victims, which allows us to identify that in spring, there is a lower concentration of hotspots in the outlying areas of the city in comparison with the other seasons of the year, being observable that it is the city center, as well as downtown area around the
Marquês de Pombal roundabout that concentrates the accidents, an example of this being
Avenida da República,
Avenida Fontes Pereira de Melo, and
Avenida Liberdade. In the summer, there is an increase in accidents and frequency of accidents in the central area of the city, in the area of the
Eixo Norte-Sul, accesses to the
25 de Abril bridge,
General Norton de Matos Avenue with the
Benfica Road, and at the end of the A5 towards the
Duarte Pacheco viaduct at the exit to the bridge. The aforementioned roads continue to be hotspots throughout the autumn and winter. However, there is a greater accident concentration on the outskirts of Lisbon, specifically along with
Avenida General Norton de Matos and the
Eixo Norte-Sul, with the highest concentration of accidents in the area that overlaps
Avenida Engenheiro Duarte Pacheco.
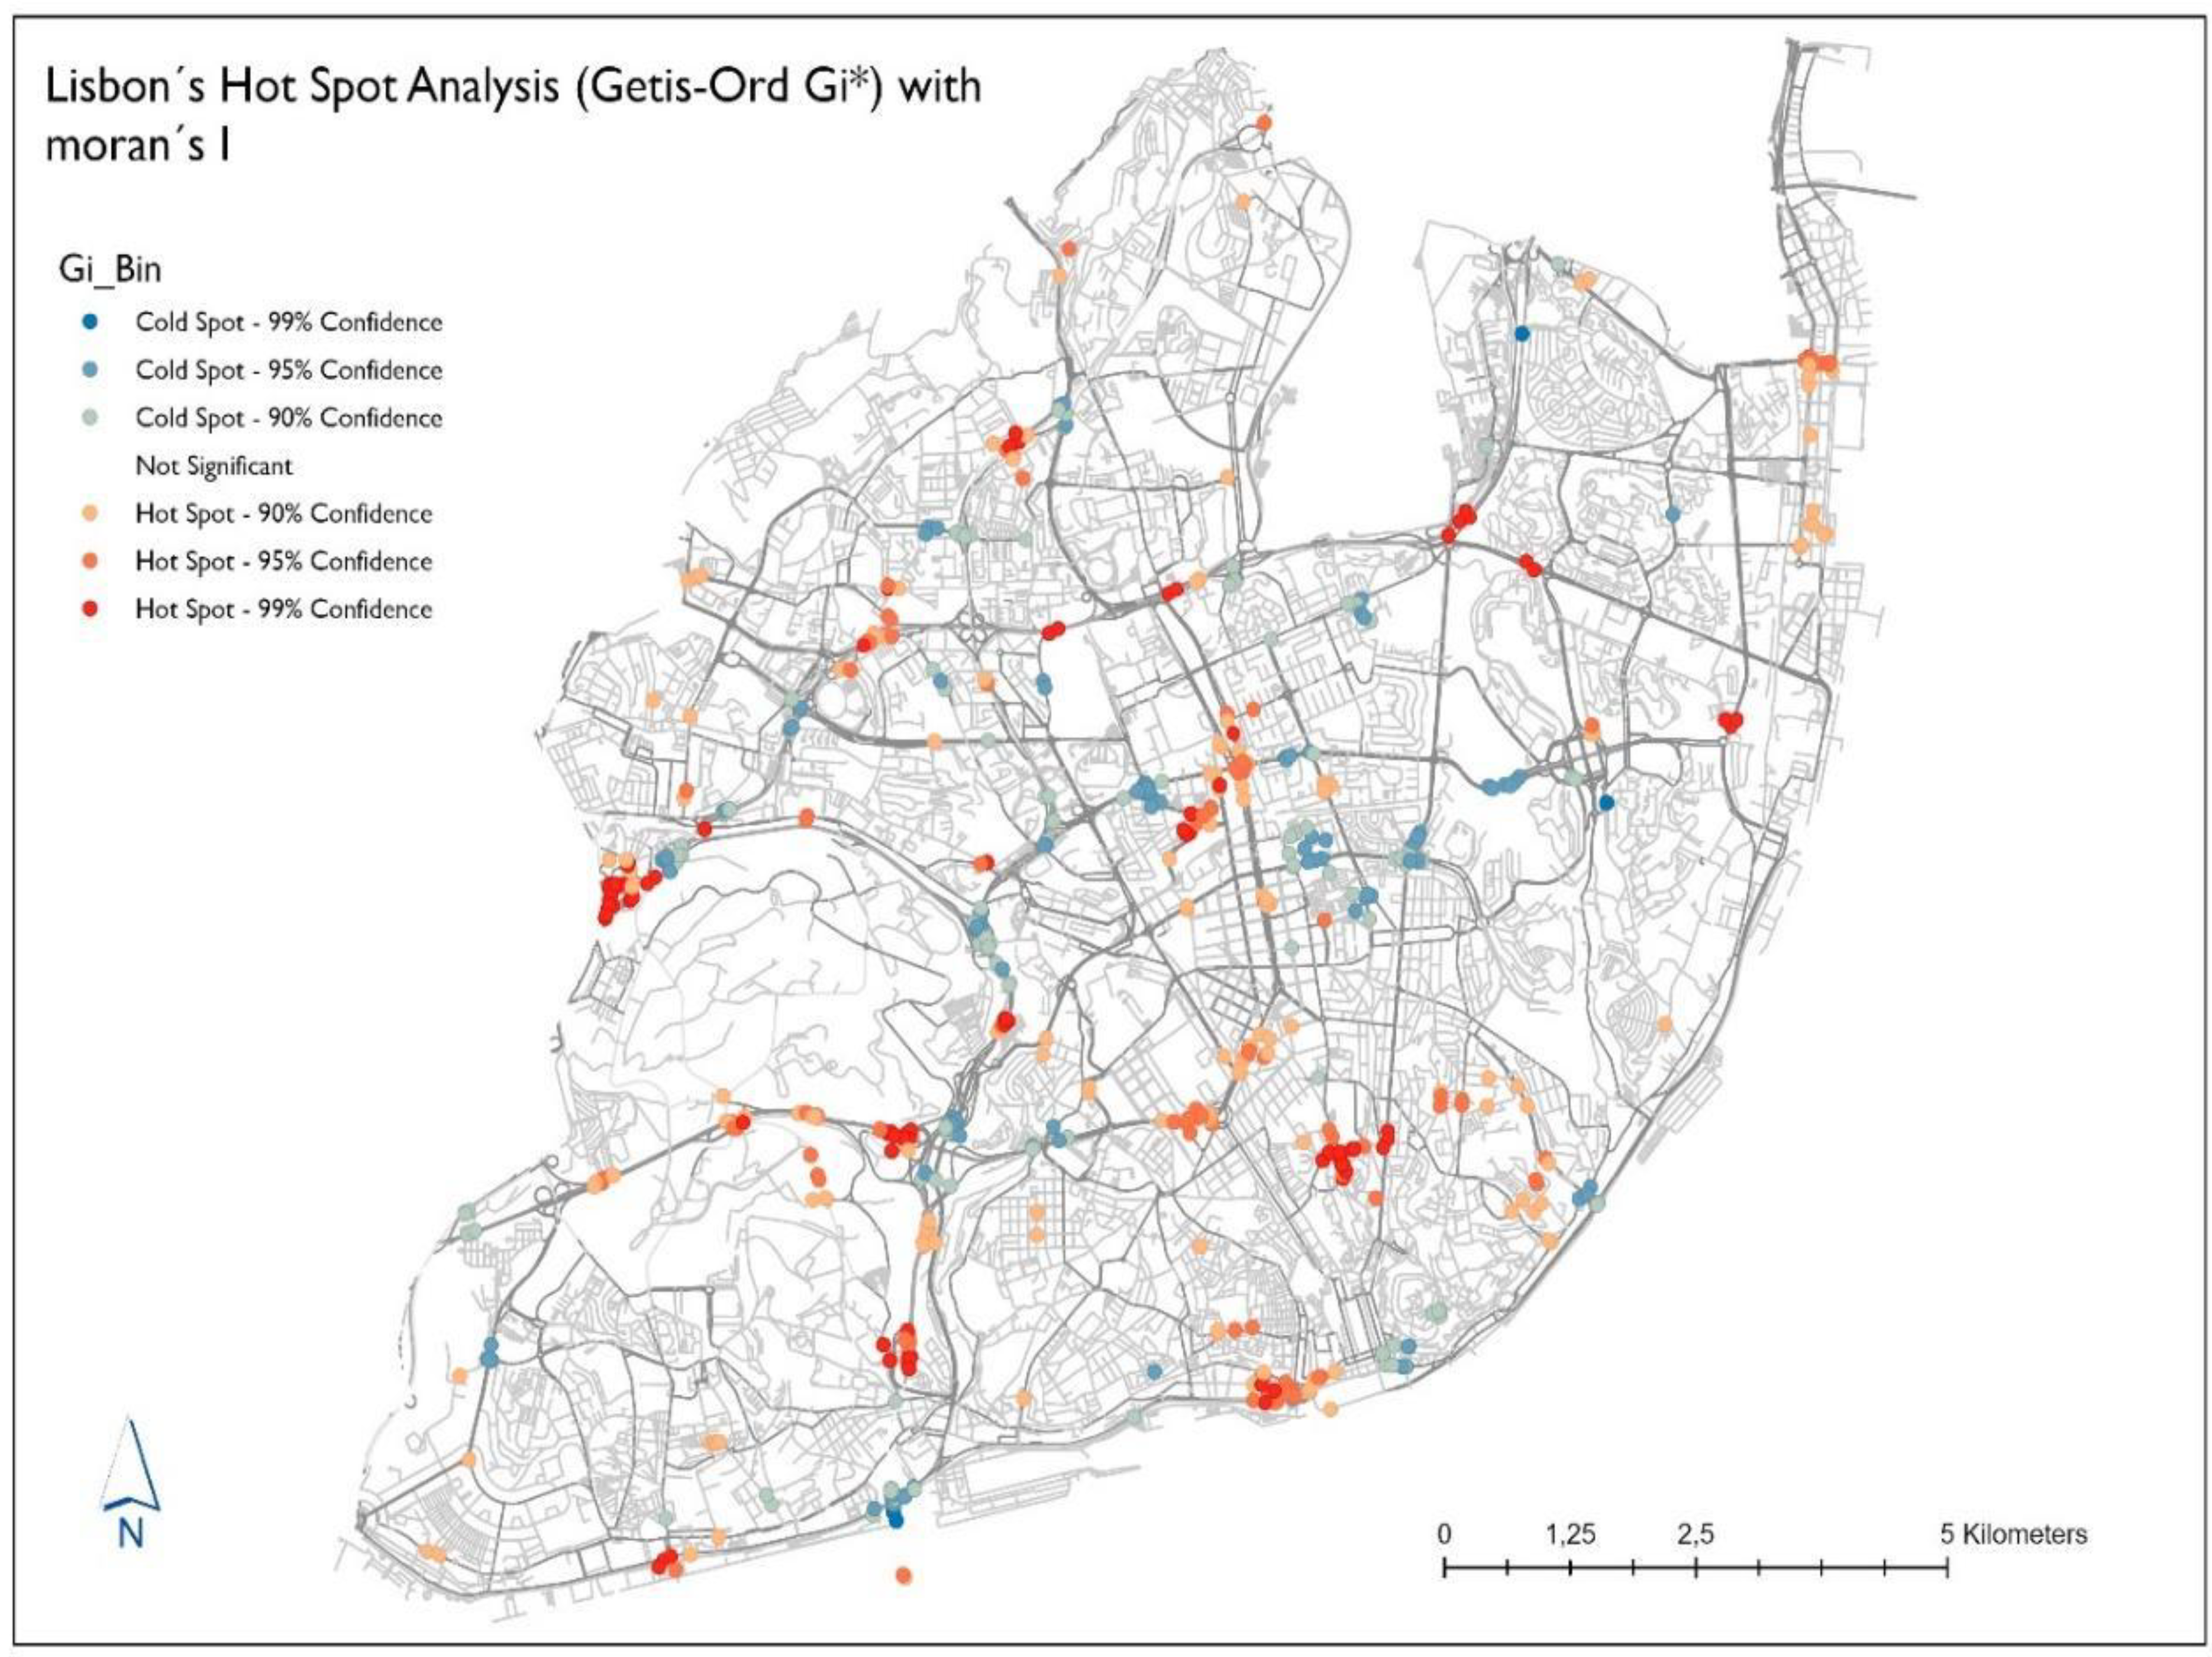
In order to be able to perform an assessment and identification of the hotspots of traffic accidents with victims existing in the area of the municipality of Lisbon that reflects the real problems without suffering the influences or deviations that may exist in spatio-temporal analyses of lower temporal amplitude, we performed, as in the biannual analyses, the KDE analysis of all road accidents with victims that fulfilled the ANSR hotspot cluster requirement (5 victims, 200 m). The results obtained demonstrate a strong cluster pattern of accidents, with a positive Moran’s Index of 0.99, a z-score of 200, and a p-value of 0.0001, giving us less than 1% likelihood for the clustering pattern result of random chance.
Thus, we can reject the null hypothesis; Getis-Ord Gi* analysis. The previous analysis (KDE) permitted the identification of the RTAs hotspots. However, as previously stated, the KDE technique lacks an evaluation of the statistical significance of the discovered hotspots. As a result, it is critical to look into the statistical significance of the hotspot and identify the most prone regions with statistical significance. According to many researchers, it is preferable if the statistical value of the discovered hotspot is determined objectively and proactively [
24]. Our statistically significant evaluation procedure began with the null hypothesis: “accidents in a roadway segment occurred at random.” As previously stated, we initially used spatial autocorrelation global Moran’s I test to verify the statistical testing for the null hypothesis and determine whether RTAs points were organized in clusters of identical values. Accordingly to Prasannakumar [
3], this is a required step before performing the Hotspot Analysis (Getis-Ord Gi*) on ArcGIS PRO. In this way and for the identification of hotspots of road accidents with victims in the municipality of Lisbon, the Hotspot Analysis Getis-Ord Gi* was applied to our database, presenting a clustering of high values (hot spots) with a confidence level of 99%, as demonstrated on
Figure 6 for the following locations:
Avenida Dom João II, Eixo Norte-Sul, Avenida General Norton de Matos, Avenida Marechal Craveiro Lopes, Avenida Eusébio da Silva Ferreira, Itinerário Complementar 17, Estrada de Monsanto, A5, Acesso Avenida da Ponte, Ponte 25 de Abril, Avenida Vinte e Quatro de Julho, Campo dos Mártires da Pátria, Rua Joaquim António de Aguiar, Tunel Marquês. At a 95% confidence interval were identified as statistically hotspots:
Avenida Fontes Pereira de Melo, Rua Sousa Lopes, Avenida da República, Avenida Álvaro Pais, Avenida General Roçadas, Avenida Mouzinho de Albuquerque, Avenida de Brasília, Avenida Infante Dom Henrique e Avenida da India.
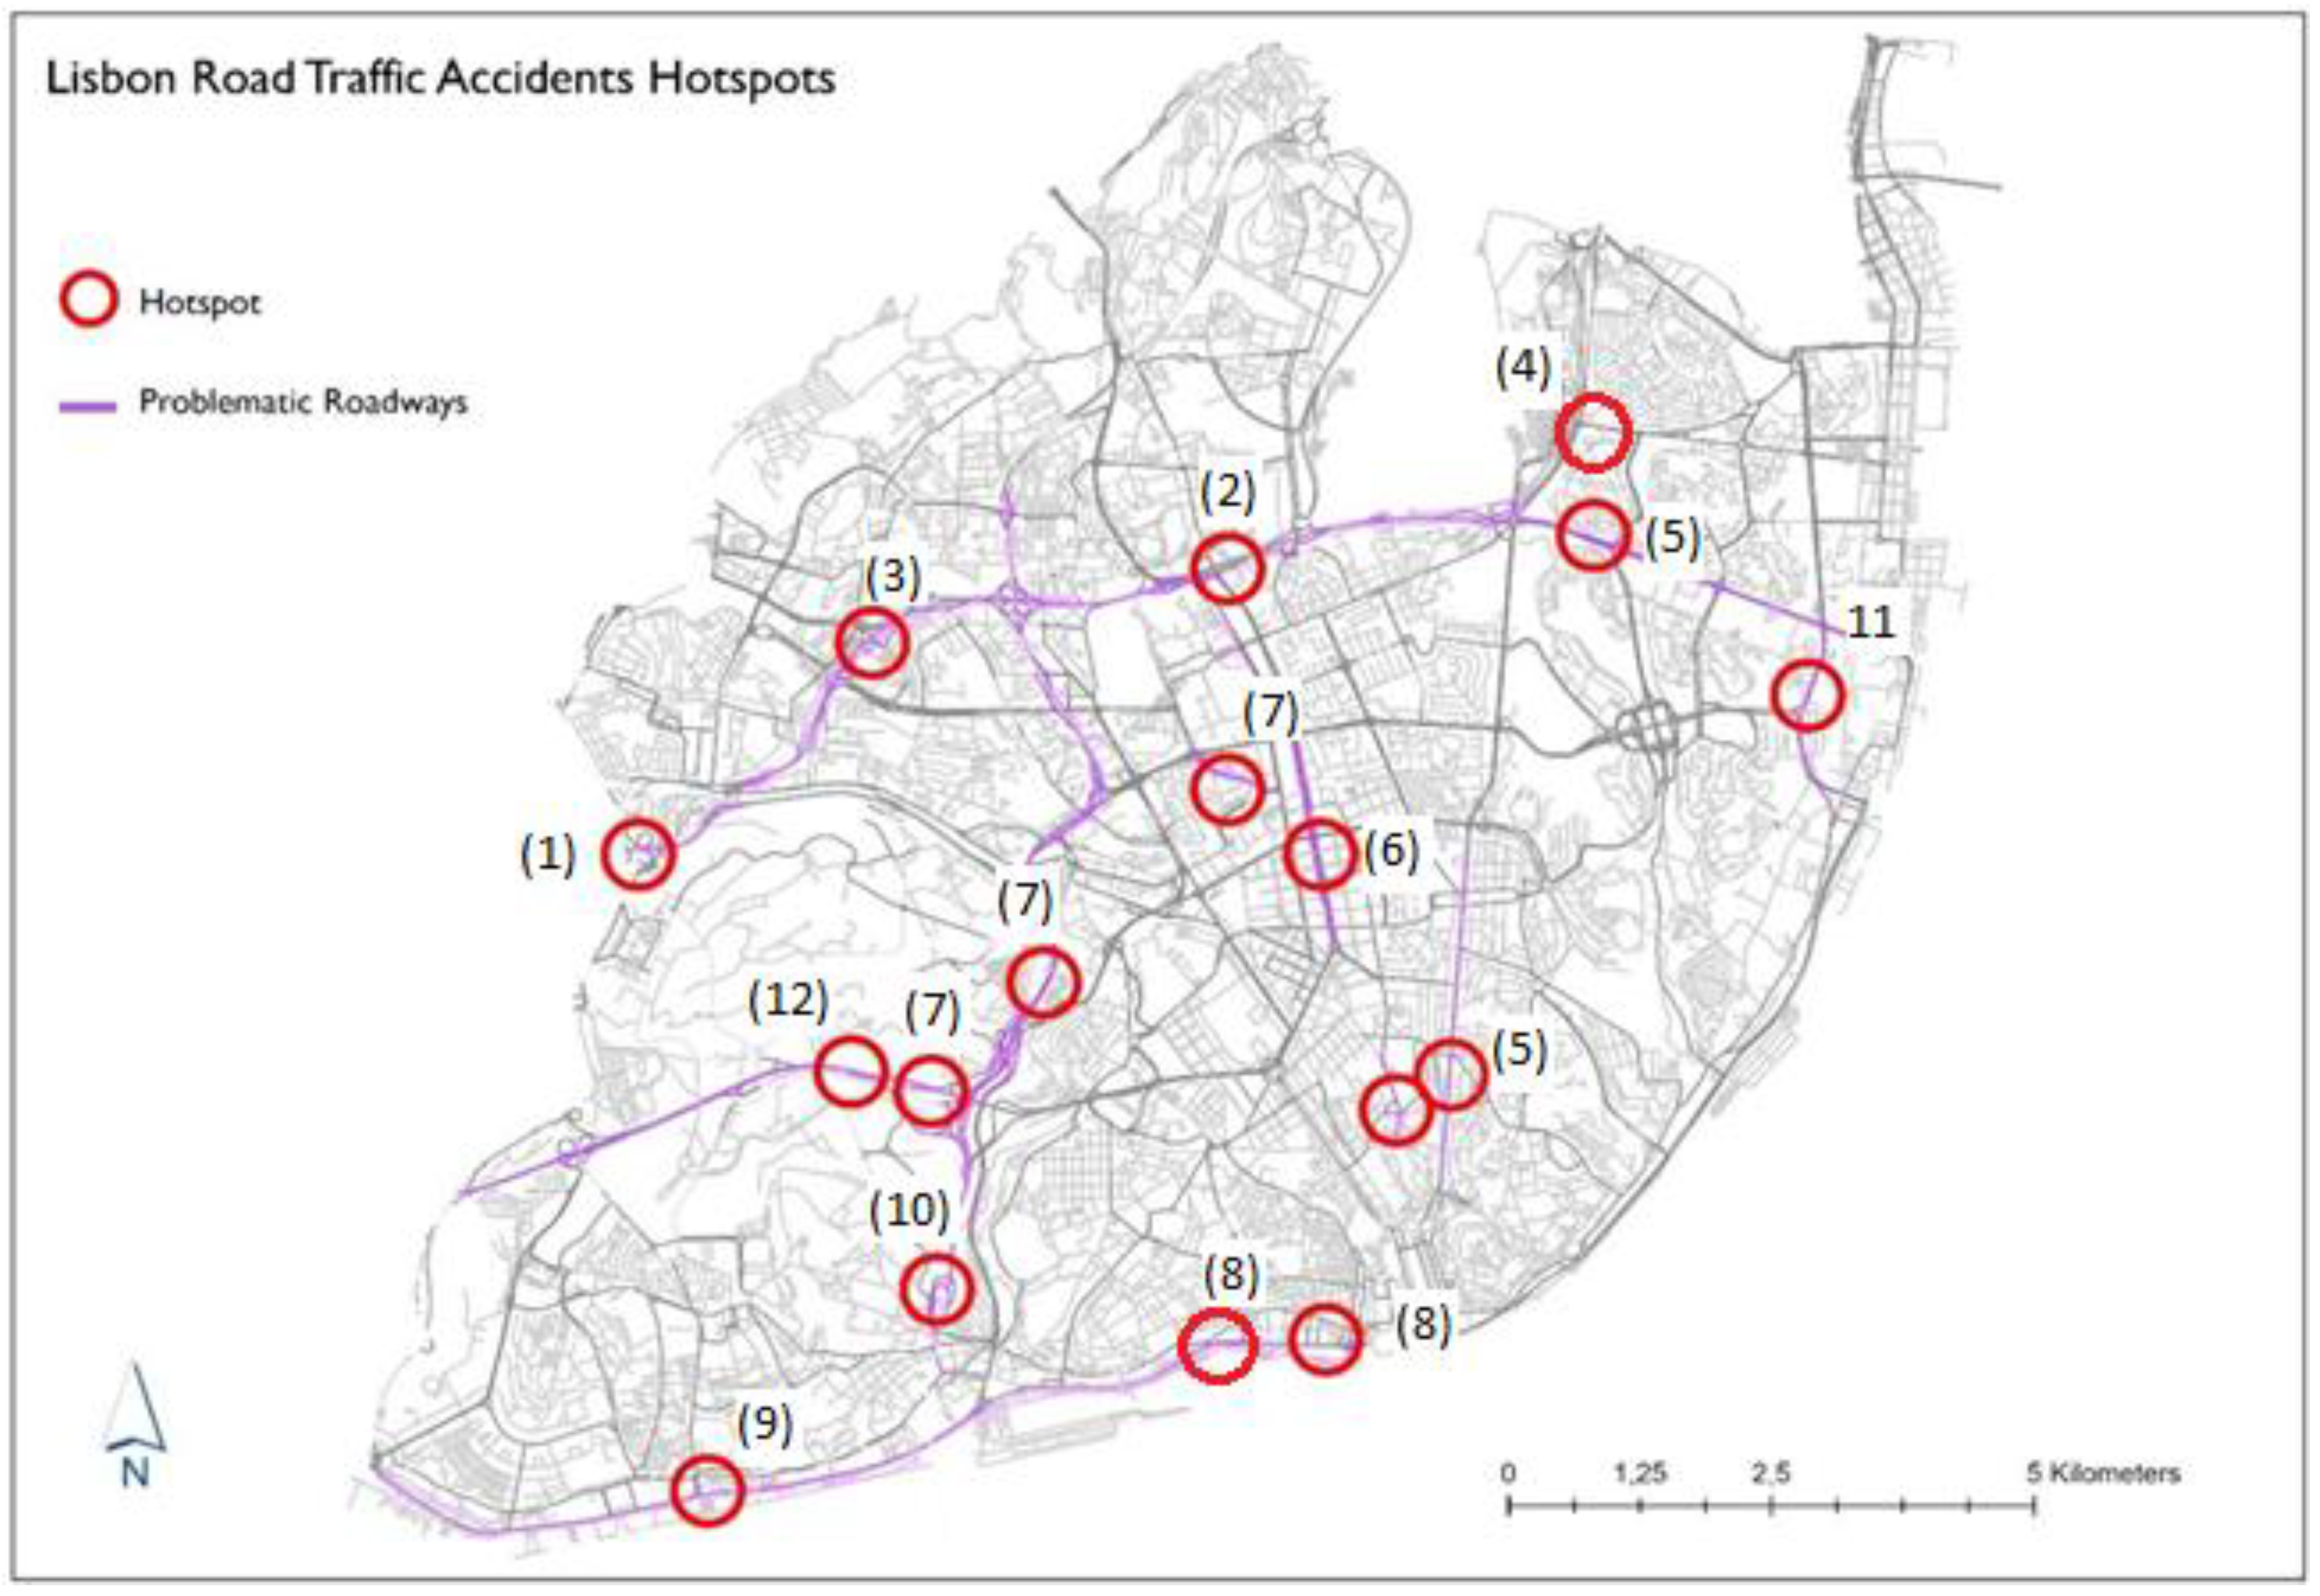
Hotspot identification and characterization is depicted in
Figure 7. After the identification of the location of statistically significant hotspots performed by the Hotspot Analysis Getis-Ord Gi* algorithm, the results were analyzed, and a selection of the most active hotspots was arranged by the number of accidents and severity of victims was made. If Lisbon Municipality had already applied the Municipal Road Safety Index (ISRM) we could compare this classification with the one calculated by CML.
The data shows that the Segunda Circular is the most problematic roadway in this study. It comprises three avenues: Avenida General Norton de Matos, Avenida Marechal Craveiro Lopes, and Avenida Eusébio da Silva Ferreira, the later only exists from 2015 onwards.
Major Findings from This Big Data Analytics Process of City Data
An analysis was made regarding hotspots represented on the map of
Figure 7, and it was made a summarization on
Table 2, where in each location we have the identification number of the hotspots in the map.
Table 2 summarizes the main knowledge extracted from smart city data to local municipality helping them to deal with the increasing accident numbers. The growth of the urban mesh and the population density has not been accompanied by the development or sizing of the road infrastructure in Lisbon. It is a fact that the number and severity of road accidents in Portugal have been decreasing over the last thirty years, bringing us closer to the European average. However, despite these facts, the situation remains a source of concern. To help deal with these problems data on road accidents has started to be georeferenced to allow for a better understanding of spatial patterns and risk factors. In this section a data analytics process to this collected data to extract useful information for local management authority.
During our analysis and regarding Avenida Eusébio da Silva Ferreira (Hotspot 1), there were on average only 100 days of precipitation per year and that these conditions (rain) only correspond to 17% of the RTAs cases in our study.
From
Table 2, we believe that the leading causes for the existence of this hotspot are undoubtedly the human factors that, combined with atmospheric conditions, potentiate the occurrence of RTA in these locations.
Regarding Segunda Circular, as a suggestion and extending the concept to the rest of locations, we believe that the reduction of speed from 80 km/h to 50 km/h combined with the existence of average speed cameras (located near the airport, Campo Grande viaduct, and after the exit to Benfica/Buraca) would drastically reduce the number of accidents on this roadway.
The main reason of the road accidents are due to human factors, where in eixo norte-sul (Hotspot 7) there is a mix between this human factors and environmental ones (roadway with poor drainage and weather conditions).
5. Conclusions
We identified that an ideal period for data collection when conducting a study on road accidents should be between 5 and 10 consecutive years since this interval represents a compromise between the number of years required to have a reasonable sample of seasonal patterns and still be in the processable range.
Therefore, the first task was to fuse six major databases with relevant data for this work. This data fusion allows to improve knowledge extraction. Once the necessary data were gathered, they were cleansed and prepared. The use of data visualization methodologies over this fusion allows a new view regarding accident location and conditions in Lisbon.
After this step we proceeded with the necessary data-exploration phase and afterwards the processing and geographic analysis work using ArcGIS PRO version 2.8 and the applicability of spatial autocorrelation algorithms, namely, the Kernel density estimation, the Moran I index, and the Hotspot analysis Getis-Ord Gi*.
The results allowed us to identify twelve streets considered problematic and the location of fourteen hotspots of traffic accidents in the municipality. The analysis of each hotspot statistics allowed us to state that the major contributing factor to traffic accidents in the city of Lisbon is the human factor as concluded from
Table 2. The vast majority, if not the totality of the causes of RTAs in the places under consideration, are due to excessive speed or disrespect of traffic signs and traffic signals. Local municipality used this hot spot geographic information to locate new speed radars in the city. Around 22 new speed radar were placed using this hot spot information.
We have seen that environmental factors (weather) have little influence on road traffic accidents in the study area, with the exception of two cases identified, namely, in an area prone to flooding located in the North-South axis, near the Duarte Pacheco viaduct and in the Segunda Circular at the end of Avenida Eusébio de Silva Ferreira, near the exit to the IC19. With the exception of these factors, we were unable to identify any other factors that could potentiate a traffic accident. This is other example of useful information generated from this data analytics process over smart city fusion data.
As the product is a digital artifact, an output, and not a framework, it had to be validated, so the whole process was accompanied by a panel of four experts from various branches related to the project’s scope. There were several iterations made, as well as changes/corrections suggested.
Studies such as this one should be conducted regularly and would benefit from the existence of an integrated database with the used data-sources as well as others.
In order to correct the problems faced during the data survey process to have a consistent database it is essential to develop a set of recommendations to fill the information gaps identified during the said data survey process:
Integration between IPMA and ANSR, so that when the accident is entered in ANSR’s database, the meteorological values for that date, time and location are automatically added to the BEAV;
Integration between ANSR and the georeferenced data of the recent e-secured application from the Portuguese Insurers Association [
40] will allow the coordinates of the accident to be compared with those recorded by the security forces and registered in the BEAV;
The causes of the accident could also be analyzed, i.e., densification of the data identifying the cause of the crash: were the drivers under the influence of alcohol? Was the reason for the distraction of the accident because they were on their mobile phones? Why was the pedestrian hit by a car? Was he or she wearing headphones or on a mobile phone? These and other questions would allow researchers, in the future, to develop more detailed studies according to the reality of road accidents with victims in the municipality of Lisbon.


