Article

Measuring Spatial Accessibility to Hospitals of Acute Myocardial Infarction in Multi Period Scale: A Case Study in Shijingshan District, Beijing, China

School of Urban Design, Wuhan University, 299 Bayi Road, Wuchang District, Wuhan 420072, China
*
Author to whom correspondence should be addressed.
ISPRS Int. J. Geo-Inf. 2022, 11(2), 137; https://doi.org/10.3390/ijgi11020137
Submission received: 10 December 2021 / Revised: 3 February 2022 / Accepted: 12 February 2022 / Published: 15 February 2022

Abstract

:
The hospital accessibility of Acute Myocardial Infarction (AMI) emergency treatment is of great importance, not only for improving the survival rate of patients but also for protecting the basic human right to health care. Traditional AMI emergency treatment research often does not consider ways to shorten the travel time to hospitals for AMI patients and does not reflect the actual time it takes to travel to hospitals, which is critical to AMI emergency treatment. To avoid these shortcomings, this study proposes a method of accessibility measurement based on Web Mapping API (Application Programming Interface) to obtain travel time to hospitals during different periods, then calculated the AMI hospital accessibility based on these detailed data. This study considered the Shijingshan District, Beijing, China, as an empirical case. The study discovered significant differences in the temporal and spatial characteristics of the AMI hospital accessibility on weekdays and weekends. The analysis revealed that travel time to hospitals and traffic congestion are the two main factors affecting AMI hospital accessibility. The research results shed new light on the accessibility of urban medical facilities and provide a scientific basis with which local governments can optimize the spatial structure of medical facilities.

1. Introduction

Cardiovascular disease causes the largest number of deaths in China. In 2017, cardiovascular diseases accounted for 43.56% and 45.91% of the death causes of urban and rural residents in China, respectively, much higher than other diseases such as tumors. There are 237.7 deaths due to cardiovascular disease out of every 100,000 middle-aged people each year on average in China. As of the end of 2019, approximately 330 million people in China were suffering from cardiovascular disease [1].
Acute myocardial infarction (AMI) is a cardiovascular disease that comes on rapidly and suddenly. It blocks the blood vessels in a very short time, leading to myocardial ischemia and hypoxia. If the patient is not sent to the doctor in time, the patient’s blood vessels will be blocked and the myocardium will be completely necrosis, and eventually death [2].
At the same time, with the increase in the urban population, delays in the prime emergency treatment time due to untimely medical treatment caused by urban traffic congestion frequently occur. How to scientifically measure the fairness of medical treatment and allocate medical resources fairly and reasonably has become a research topic that urgently needs to be solved [3].

1.1. Study on the AMI Emergency Treatment

Primary percutaneous coronary intervention (PCI) surgery is currently the best method for AMI emergency treatment, which can improve the recovery of patients in the short and long term [4]. Scholars discovered that the prolongation of total myocardial ischemia time is closely related to the recovery and recovery of AMI patients. For every 30 min of delay in medical treatment for AMI patients, the yearly mortality rate increases by 7.5% [5]. Therefore, immediate PCI surgery after the onset of disease to clear the blocked blood vessels is the key to saving the lives of AMI patients. For this extremely time-sensitive disease, 120 min following the onset is called the prime treatment time until AMI, and it is also the threshold time from the onset of AMI to the PCI surgery [6].
At present, most of the research on AMI emergency treatment is from a medical perspective, exploring how to improve the level of medical treatment and the survival rate of AMI patients [7,8], as well as how to shorten the preparation time for PCI surgery [9]. There is still a lack of relevant research regarding how to shorten the travel time to hospitals for AMI patients and optimize and improve the layout and transportation planning from the perspective of the medical facility. Reasonable layout of medical facilities, the configuration of emergency treatment facilities, targeted traffic planning, and road optimization can greatly shorten the time for AMI emergency treatment, thereby increasing the survival rate of patients. Therefore, measuring and optimizing AMI accessibility is significant in saving AMI patients’ lives.

1.2. Study on the Hospital Accessibility

Accessibility is defined and operationalized in different ways. It has thus has taken on a wide range of meanings, which include well-known definitions such as “the potential of opportunities for interaction” [10,11], “the relative ease by which services can be reached from a given location by a given way of transportation” [12,13]. Hospital accessibility refers to the difficulty of patient access to medical facilities and services [14], which involves a “5A” dimension, i.e., acceptability, availability, accommodation, affordability, and accessibility [15]. It can be regarded as the primary measure of the reasonable allocation of medical facilities [16]. Hospital accessibility includes both spatial and non-spatial indicators [17]. It plays an irreplaceable role in identifying urban and rural areas where there are medical deficiencies, as well as allocating medical facilities [18]. In addition, achieving better hospital accessibility should be the primary goal of the planning layout of medical facilities [19].
As far as the study object is concerned, research on hospital accessibility can be roughly divided into four categories: (a) The supply and demand relationship of a specific hospital for a potential population with certain disease [20,21,22,23]; (b) measuring the spatial hospital accessibility for different groups combined social and economic indicators [24,25,26,27,28]; (c) modeling based on population size or facility level to assess and optimize the spatial distribution of medical facilities [29,30,31,32,33]; and (d) spatial comparison of hospital accessibility under different modes of transportation [34,35,36]. For example, Hare and Barcus explored the accessibility of Kentucky’s heart-related hospital services by considering the bed-to-population ratios jointly with the doctor-to-population ratios [20]. Benevenuto evaluated the accessibility to healthcare centers of low-income groups in rural Brazil using statistical and Geographic Information System (GIS) tools [24]. Cheng analyzed the spatial hospital accessibility in Changning District of Shanghai, China, using the improved potential model (IPM), mainly conducted the cluster and outlier analysis and the Getis-Ord Gi* analysis by ArcGIS tools [29]. Chen used the Gaussian two-step floating catchment area (2SFCA) and the adjusted 2SFCA methods to measure the hospital accessibility of older residents (people aged 60 years or over) who travel mainly by bus in Nanjing, China [34].
Scholars proposed a variety of methods to evaluate hospital accessibility. Gravity models (or potential models) that emphasize the relationship between supply (i.e., medical service providers) and demand (i.e., patients) have a long and widespread operation in hospital accessibility measurements [12,37,38,39]. With the rapid development of GIS technology, the GIS-based kernel density method was introduced and further developed to measure hospital accessibility through a more comprehensive framework [40,41,42]. Based on the gravity model, the two-step floating catchment area (2SFCA) method has been widely employed to measure hospital accessibility [43,44]. The 2SFCA method evaluated potential hospital accessibility in light of the maximum acceptable distance of individuals, along with the limitation of the distance decay for different travel zones [45]. Recently, several modifications and extensions methods such as the enhanced two-step floating catchment area (E2SFCA) method [46], the three-step floating catchment area (3SFCA) method [47], the modified 2SFCA (M2SFCA) method [48], the variable 2SFCA (V2SFCA) method [49], the kernel density 2SFCA (KD2SFCA) method [50,51], the Gauss 2SFCA (Ga2SFCA) method [52], the gravity 2SFCA (G2SFCA) method [53], the nearest-neighbor 2SFCA (NN2SFCA) method [54], and the hierarchical 2SFCA (H2SFCA) method [55] have been introduced to address this limitation. These methods have all made great contributions to the measurement of hospital accessibility. However, the existing hospital accessibility models lack consideration regarding the levels of medical facilities and the accurate description of the travel time to hospitals, which are both extremely important AMI emergency treatment. To avoid such pitfalls, considering a more accurate time data acquisition method, such as Web Mapping API, is crucial for the effective measurement of AMI hospital accessibility.

1.3. Web Mapping API

The method of packaging the relevant functions of the website into an easy-to-operate programming interface is called the API (Application Programming Interface) of the open website [56]. The rapid development of big data positioning technology has enabled online maps to calculate accessibility more accurately [57]. Travel time with related distances and routes can be directly and accurately acquired using high-performance background platforms of online maps. During route planning, online maps analyze the traffic congestion situation, calculate the vehicle speed in real-time, and use related algorithms for fitting, which can predict the travel time more accurately. At present, many online maps service providers such as Google Map, Bing Map, Baidu Map, and Gaode Map (or AutoNavi Map) provide their own map API interfaces, namely Web Mapping API, introducing more accurate and scientific research tools for studying residents’ travel behavior. Scholars applied Web Mapping API to the fields of Origin-Destination (OD) analysis [58], measurement of urban park accessibility [56,59,60], measurement of travel accessibility [61], measurement of walking accessibility [62], and the measurement of hospital accessibility [39,50,63]. This method is simply designed and easy to operate. Therefore, this study selected Web Mapping API to analyze AMI hospital accessibility.
In view of the above, this study takes Shijingshan District, Beijing, China, as an empirical case. Based on real-time traffic navigation data acquired through Web Mapping API, the AMI hospital accessibility is calculated in different time periods. This provides a new perspective and method for measuring hospital accessibility and enables recommendations to be made for future urban planning and the layout of medical facilities.
The remainder of this study is organized as follows. In Section 2, the materials and methods of the study are introduced. The case-study details and results are shown and discussed in both Section 3 and Section 4. Finally, the main conclusions are drawn in Section 5.

2. Materials and Methods

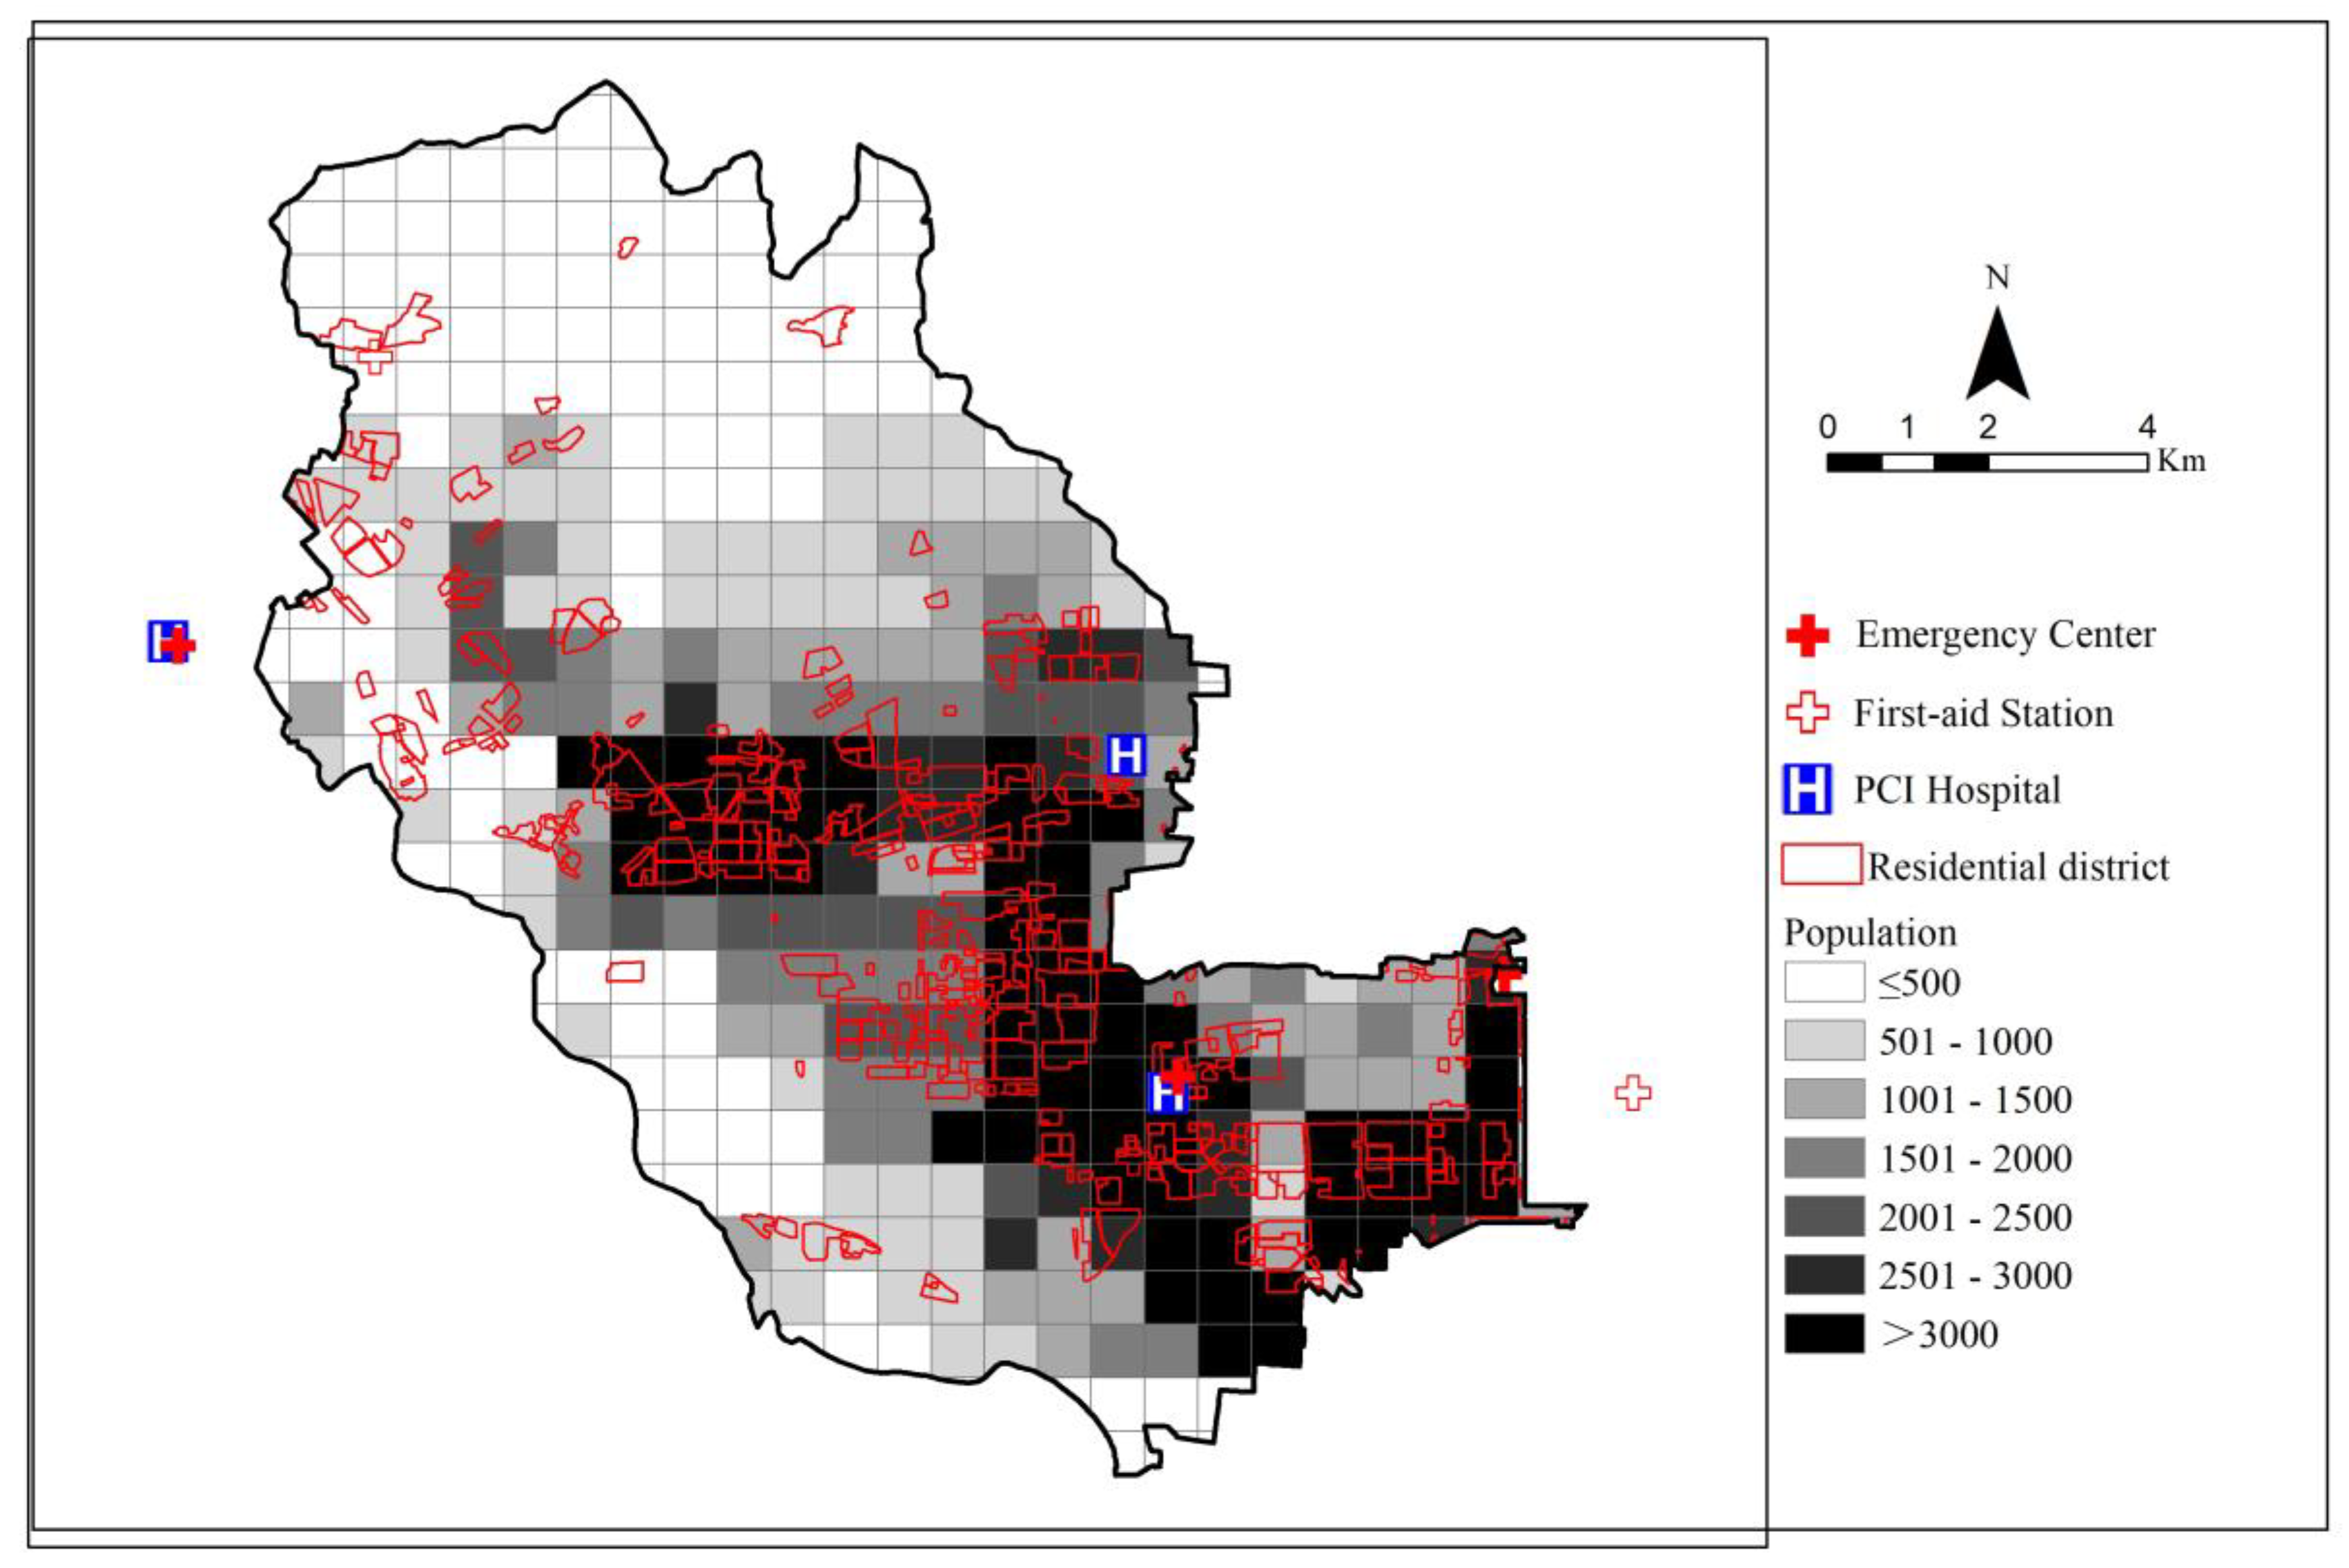
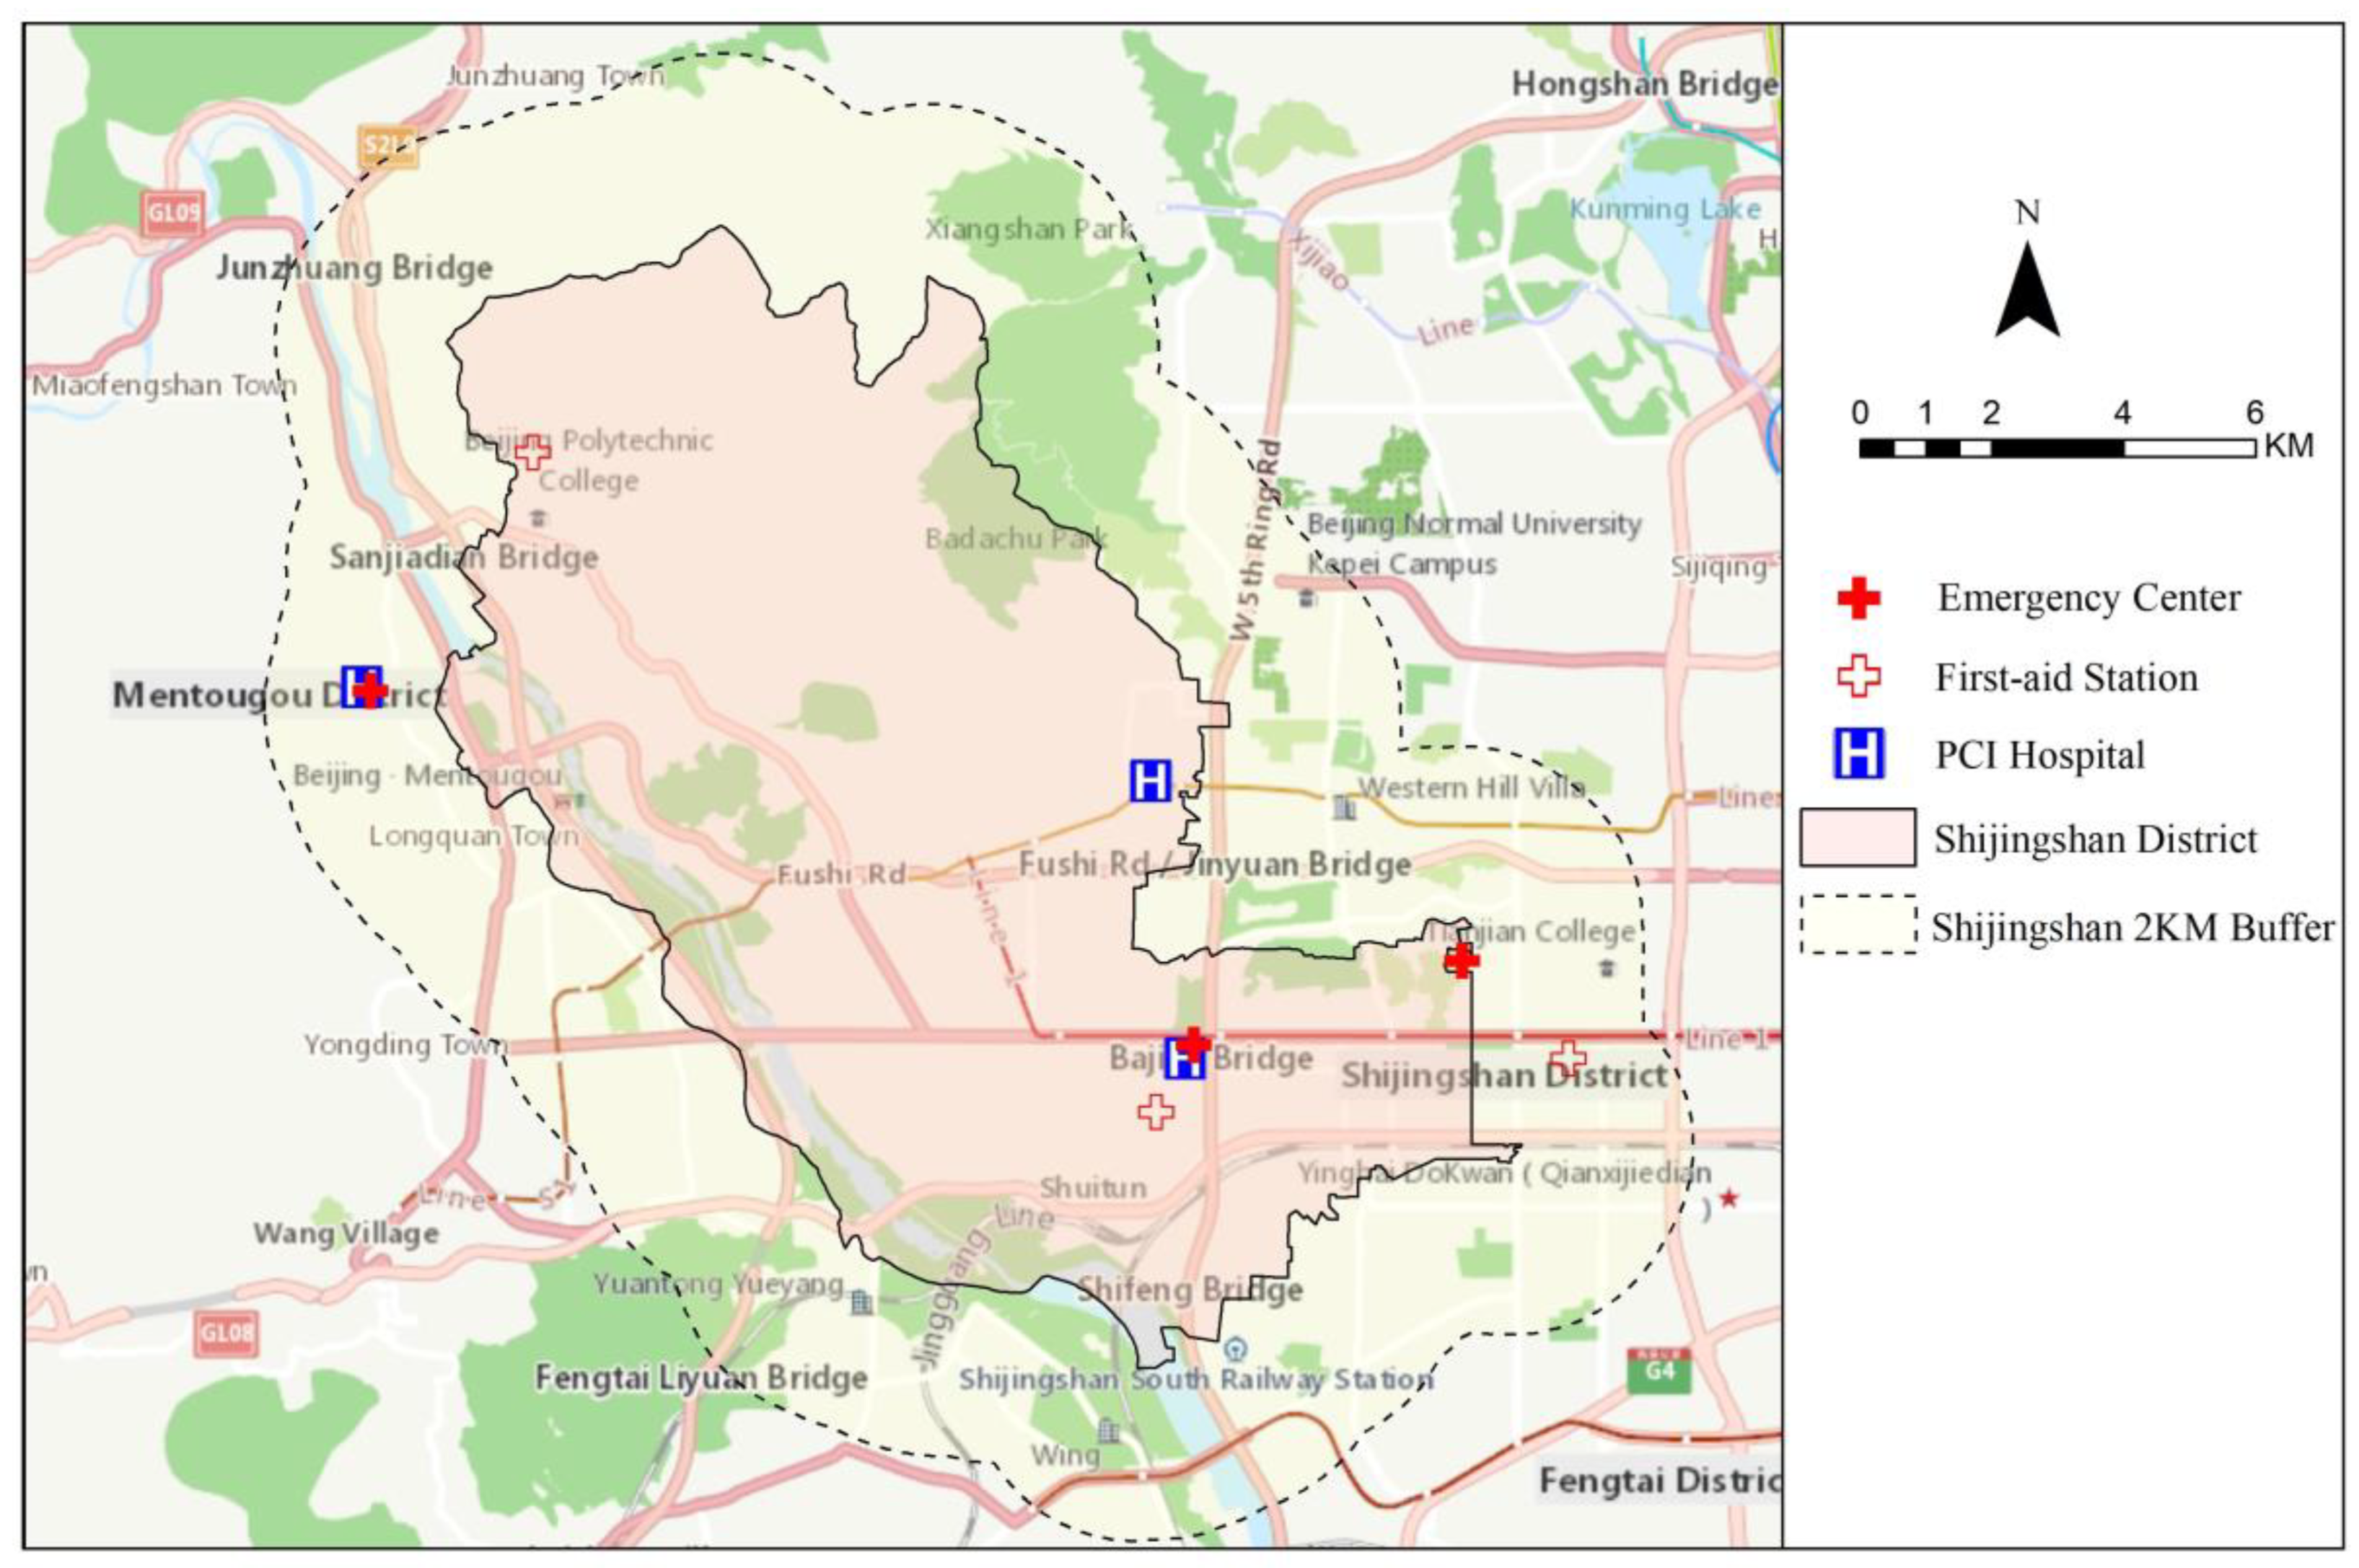
2.1. Overview of the Study Area

Shijingshan District is one of the six main urban areas in Beijing. It is located in the west of Beijing, between 39°53′–39°59′ north latitude and 116°07′–116°14′ east longitude, with a total area of about 84.38 square kilometers. As of the end of 2019, there were 567,845 residents in Shijingshan District, with a population density of 6667 people per square kilometer [64]. Regarding regional traffic structure, only three subway lines pass through Shijingshan District, namely Metro Line 1, Line 6, and Line S1. At the same time, the three east-west main roads of the Chang’an Street Extension Line, Lianshi Road, and Fushi Road in the area, along with the Fifth Ring Road and Fourth Ring Road of Beijing, formed a relatively convenient road network. Most residents in the area choose to travel by car, and the traffic pressure of motor vehicles and road traffic in the area is remarkably intense.
At the end of 2018, AutoNavi released the “Traffic Analysis Report for Major Cities in the Third Quarter of 2018”, showing that Beijing’s traffic peak congestion mileage and morning peak congestion delay index ranked first in China’s metropolises. Meanwhile, Shijingshan District is also one of the urban areas with the most severe traffic congestion in Beijing [65]. According to the “2021 Beijing Transportation Development Annual Report” released by the Beijing Transport Institute, among the six main urban areas in Beijing only the Fengtai District and Shijingshan District have an upward trend in the traffic congestion index and Shijingshan District had the most serious increase [66]. Traffic congestion has brought major challenges and difficulties to residents seeking healthcare transportation, especially emergency transportation.

2.2. Data

2.2.1. Medical Facility Data

In the real situation, not all residents of the Shijingshan District will only seek medical treatment within the area. In particular, residents in marginal areas are more likely to seek medical treatment at facilities outside the area closest to them. To reduce the impact of residents’ cross-regional medical treatment on the accuracy of the measurement results, this study included medical facilities in a certain area around Shijingshan in the scope of this study. Because the east-west radius of Shijingshan District is about 2 km, this study assumes that the acceptable distance for residents to travel for cross-regional medical treatment is about the same, so the width of the buffer zone is set to 2 km, and all medical facilities inside the buffer zone are involved in the measurement.
The Web Mapping API provides a map POI (Point of Interest) retrieval interface (for example https://lbsyun.baidu.com/index.php?title=%E9%A6%96%E9%A1%B5 accessed on 9 December 2021), from which the list and locations of emergency centers and first-aid stations were collected. The medical facility data in this study comes from two sources to ensure the accuracy of the data: (a) From the list of emergency centers and first-aid stations collected from Baidu Maps and AutoNavi Maps Web mapping API, a total of 6 emergency centers and first-aid stations were collected within the scope of the study; (b) From the list of PCI hospitals is provided by Beijing Anzhen Hospital Affiliated to Capital Medical University. The spatial visualization of the emergency station and PCI hospital data involved in this study is shown in Figure 1.

2.2.2. Travel Time Data

Baidu Map is one of the main Internet map providers in China. The route navigation module of Baidu Map Web Mapping API can provide accurate travel time to hospitals based on actual real-time traffic conditions. The real-time travel time data selected in this study is collected from the route navigation module of Baidu Map Web Mapping API, through a python algorithm programming that can access the API and acquire the accurate travel time to hospitals.

2.2.3. Demographic, Residential Area, and Administrative Division Data

Analyzing the hospital accessibility combined with the distribution of population and residential areas can help policymakers make optimal decisions and avoid waste of medical resources. According to the “2021 Beijing Transportation Development Annual Report”, the average speed of vehicles in Beijing during peak periods is 27 km/h (i.e., 450 m/min) [66]. Therefore, in this study, a grid of 500 m × 500 m is used as the basic unit for research to control the time measurement error between the grid center and the grid edge within 1 min. The demographic data used in this study is the 100-m-precision Chinese population data in 2020 provided by Worldpop [67] and corrected and optimized in combination with the data of China’s seventh national census conducted from October to December 2020 [68]. The residential area data used in this study was provided by the Beijing City Lab [69], and the administrative division data of the study area was obtained from the Beijing Platform for Common Geospatial Information Services (Tiandutu Website) [70]. The visual analysis results based on the above data are shown in Figure 2.

2.2.4. Experimental Period

To ensure that the time data is not affected by accidental events in a day, this study has obtained two consecutive weeks of data. The averaging method is used to reduce the interference of accidental events on the data. At the same time, this study obtained midnight time data as a time sample without traffic interference. In addition, the incidence of AMI is greatly affected by seasonal and temperature changes, and winter and spring are high incidence periods [71,72,73,74,75,76]. At the same time, the winter vacation of Chinese college students is generally concentrated from December to February of the following year, and both January and February are usually during the “Spring Festival travel rush” in China, which is a large-scale population movement. These special time periods cannot represent the traffic conditions in daily conditions. Therefore, this study chose March as the time period for the experiment. The specific collection dates for the travel time to hospitals of Shijingshan District in this study are midnight on 6 March 2021, morning peak, evening peak, and flat peak period from 13 March to 22 March 2021. The specific time period is defined as: morning peak from 6:00–8:30 a.m., evening peak from 5:30–8 p.m., midnight from 0–4 a.m., and flat peak period from 10–12 a.m. or 1–3 p.m.

2.3. Method

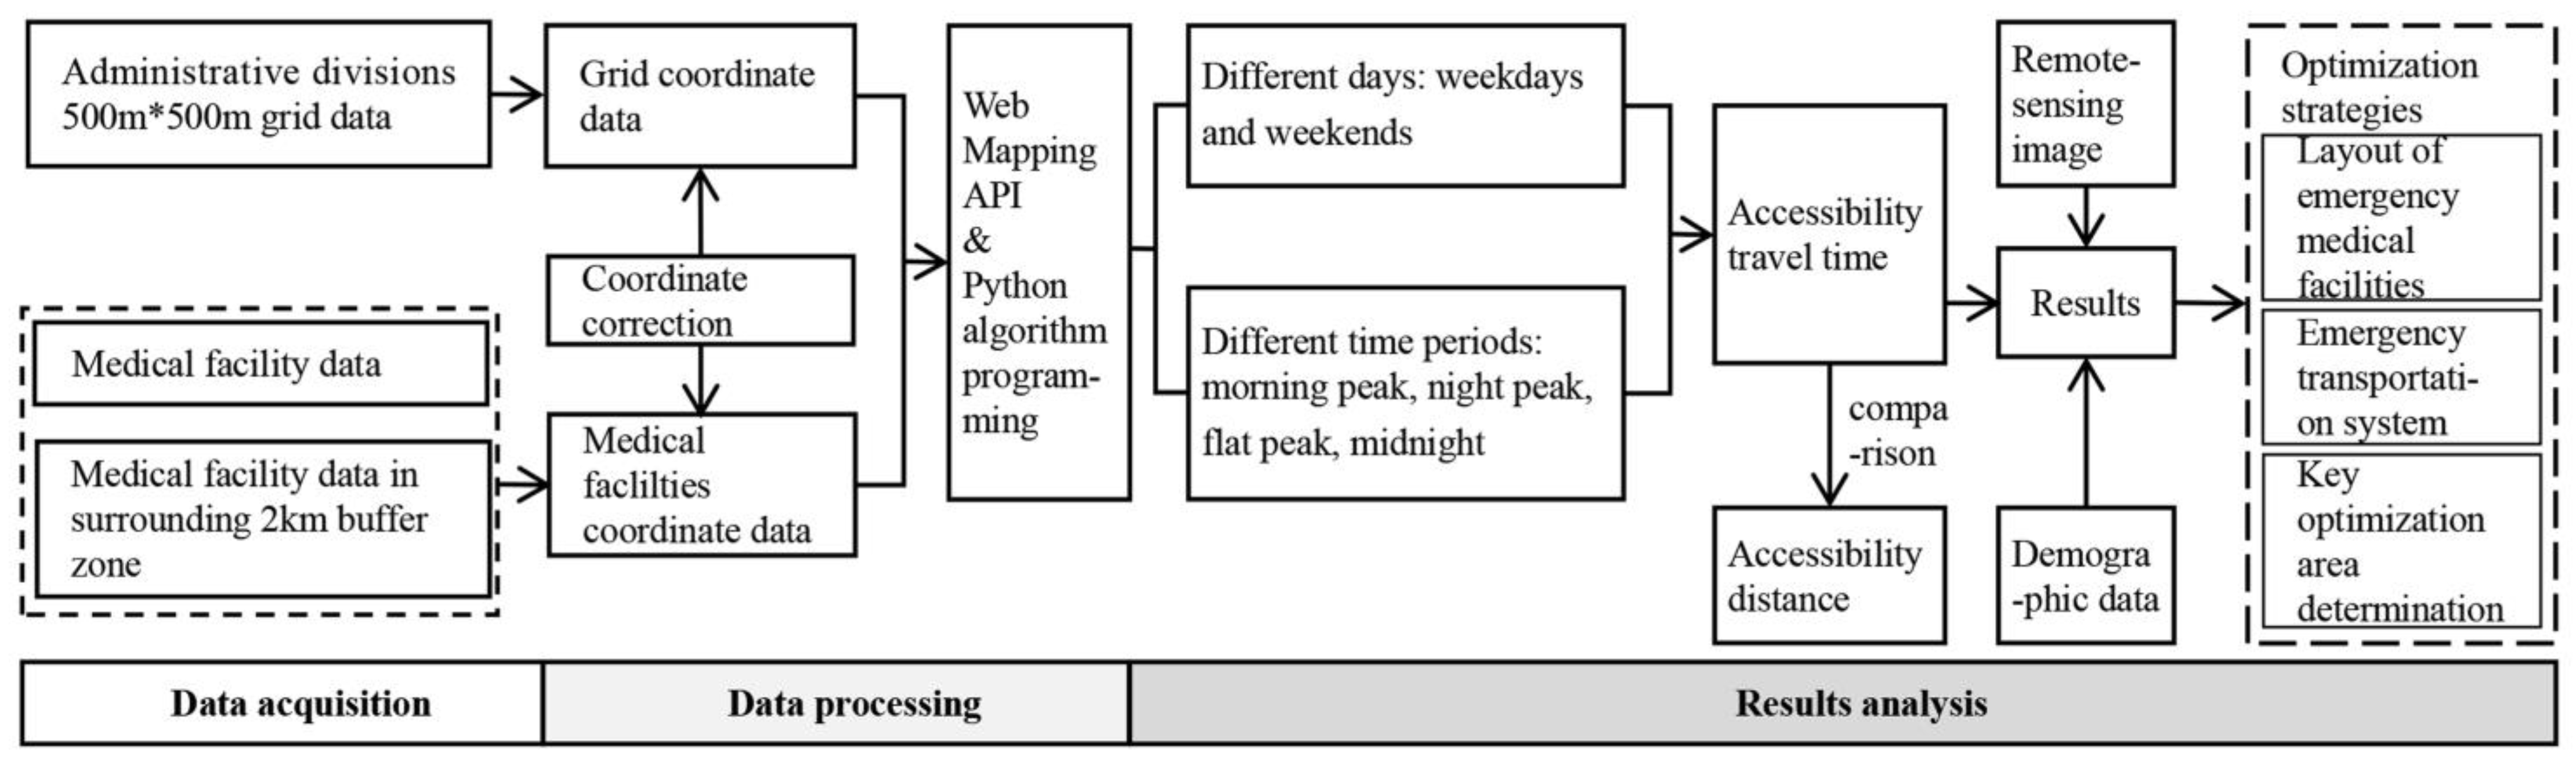
2.3.1. A Framework for AMI Hospital Accessibility Measurement

Figure 3 shows the AMI hospital accessibility measurement process. First, the process takes the data for the starting point and extracts the starting point coordinates, which are then geocoded using geocoding tools and ArcGIS. Geocoding is the process of converting a description of a location, such as a hospital address or the location of a grid center point, into geographic coordinates [77]. This study geocodes the obtained list of medical facilities according to the geocoding interface provided by Baidu Map (https://api.map.baidu.com/lbsapi/getpoint/index.html accessed on 9 December 2021). Secondly, by constructing an algorithm, writing a python program, using the Web Mapping API, and using the route planning module of the online map, the travel time from each grid center point to the medical facility in the corresponding travel mode at different time periods is automatically calculated. Then, the collected time data is cleaned, filtered, and counted to obtain the travel time when each point arrives at the nearest medical facility. Thirdly, import the data into the ArcGIS platform for visualization processing and spatial difference calculation. The purpose of spatial difference calculation is to predict the hospital accessibility time of all sub-areas in the research area based on the accessibility results of the grid center points. Finally, the results are analyzed using remote sensing image and demographic data. Optimization strategies are proposed from two perspectives: optimization strategy for the layout of emergency medical facilities and optimization strategy for the emergency transportation system.

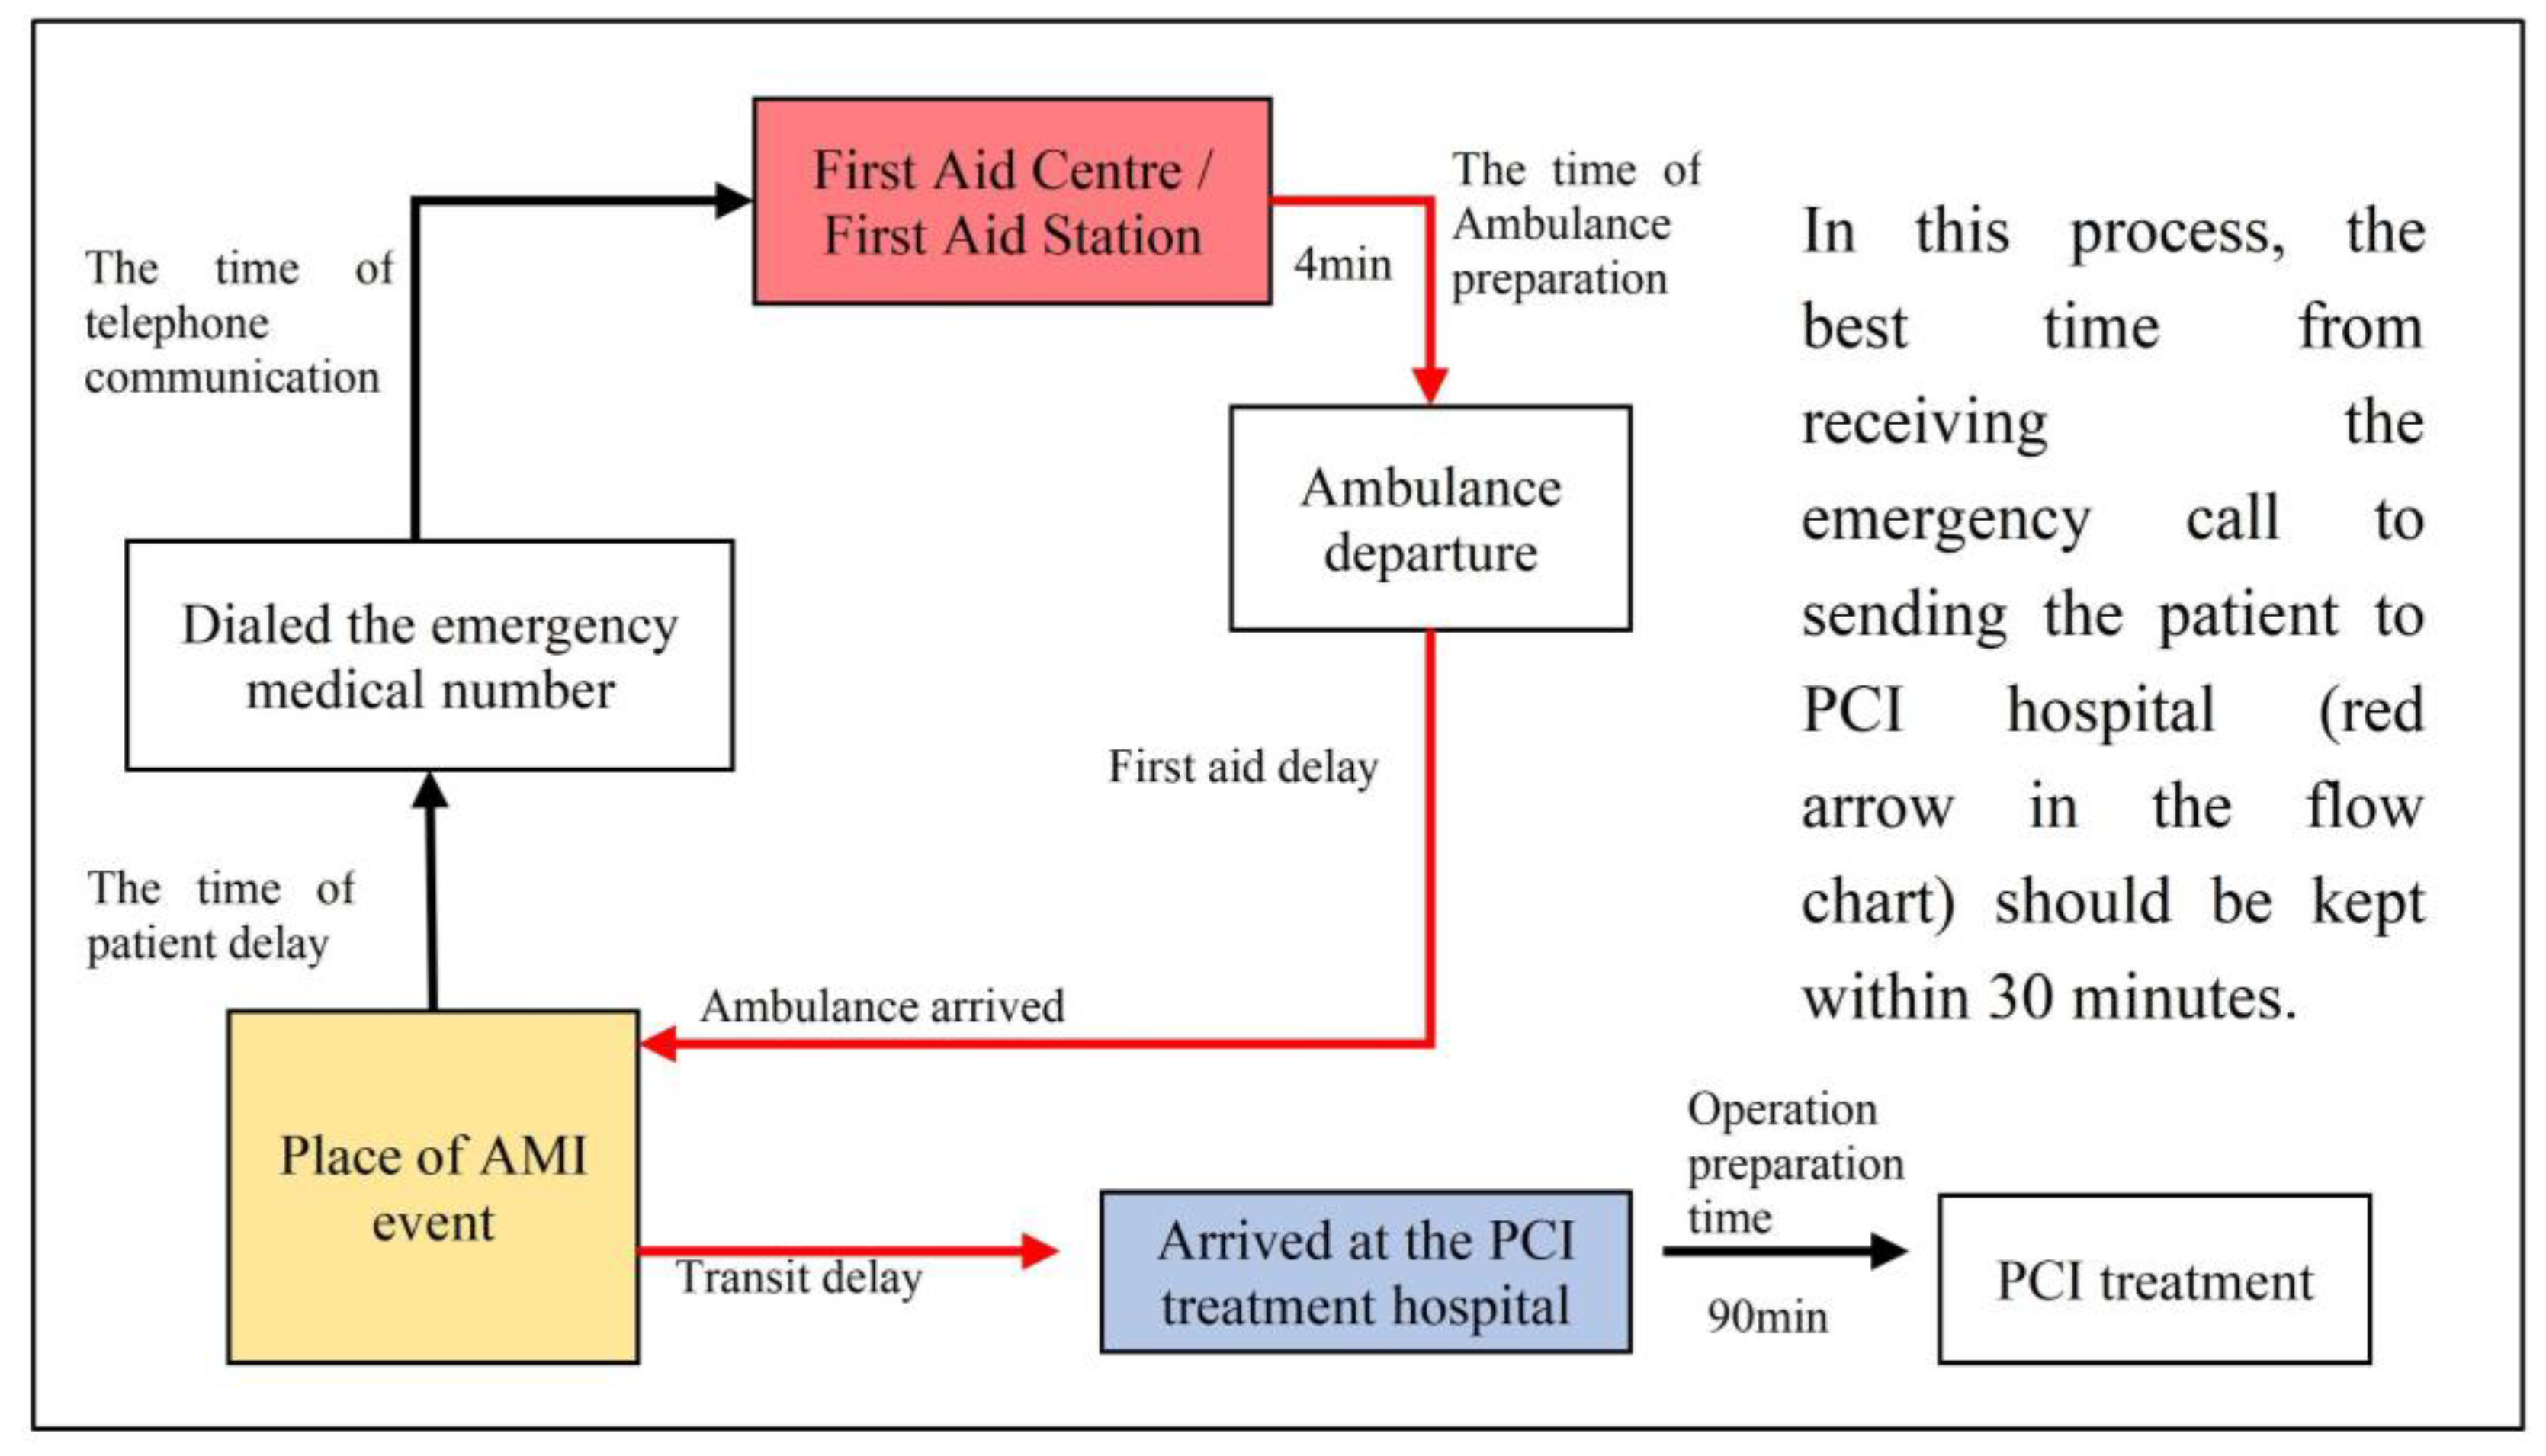
2.3.2. AMI Emergency Treatment Process

The emergency treatment process for AMI patients is shown in Figure 4. First, after the patient has an AMI attack and dials the medical emergency number, the emergency command center dispatches an ambulance from the emergency center or first-aid station closest to the patient pick-up point. (Here, this study assumes that the number of ambulances in the area is always sufficient to respond quickly to an ambulance call, where the ambulance preparation time for departure is generally about 4 min). Later in the ambulance, emergency personnel diagnose the patient. The recommended maximum time from the onset of the disease to the doctor’s confirmation of the AMI is 10 min, and the diagnosis can be completed in an ambulance. After confirming that the patient is having an AMI attack, the ambulance will transfer the patient to the nearest PCI hospital for PCI surgery.
The threshold expected delay time from the diagnosis of AMI to the PCI surgery should not exceed 120 min. The American Heart Association (ACC/AHA) and the European Society of Cardiology (ESC) recommend that AMI patients enter the door-the balloon dilation time should be less than 90 min; therefore, in this study, the optimal time for transferring a patient to the PCI hospital after dialing the emergency number should be within 30 min. It should be noted that, because the time delay between the onset of AMI patients and the emergency call cannot be accurately obtained, this study assumes that AMI patients make an emergency call immediately after the onset.

2.3.3. Measuring Spatial Accessibility to Hospitals

As mentioned above, first, the location data of emergency centers, first-aid stations, and hospitals are acquired through online maps and remote sensing images. Secondly, the area of Shijingshan District is divided into a 500 m × 500 m dot-matrix division grid, and the center point of the grid is used as the hypothetical AMI onset point. Then, a practical python program is connected to the map Web Mapping API interface, combined with the above location data and based on the AMI emergency treatment process, the travel time from each AMI emergency medical facility to each AMI onset point, as well as the time from each AMI onset point to reach the AMI emergency medical facility is obtained.
To obtain the hospital accessibility of the entire space within the study area, it is necessary to perform differential processing on the study area according to the obtained results of AMI onset points. In this study, the IDW (Inverse Distance Weighted) method is used for difference processing. This method is a commonly used spatial interpolation method, which requires the discrete points to be uniformly distributed, and the sample points closer to the interpolation point are given greater weights [78,79]. The specific steps are as follows: First, because this study uses Baidu geocoding tool, it is necessary to obtain the starting point based on the BD-09 coordinate system, and bring the coordinate data into the coordinate correction software tool Geosharp to obtain the WGS84 coordinate system-based coordinate data, thereby importing the coordinate data and the obtained corresponding travel time data into the ArcGIS platform for analysis. Then, use the IDW difference tool in the ArcGIS platform to perform difference processing to obtain the hospital accessibility of the entire space in the study area.

2.3.4. Propose Optimization Strategies Based on Demographic and Residential Area Data

In this study, the up-to-standard AMI hospital accessibility travel time was 30 min, and the main factors affecting the accessibility travel time were the number and location of PCI hospitals and road traffic congestion. At the same time, this study believes that the spatial distribution characteristics of the population and residential areas should also be an important basis for formulating optimization strategies. This would enable the phasing of measures to improve access to patients, and can help policymakers make optimal decisions while avoiding waste of resources. Therefore, based on the results of accessibility analysis, combined with the spatial distribution characteristics of population and residential areas, as well as remote sensing image data, this study discusses specific planning strategies from two aspects: optimization strategy for the layout of emergency medical facilities and optimization strategy for the emergency transportation system, and by determining the optimization area to suggest specific layout optimization strategies. Specifically, this study adopts the spatial pattern distribution map of hospital accessibility during the midnight period (when there is no traffic congestion, and the impact of traffic concerning hospital accessibility is minimal), and uses 30 min as the hospital accessibility travel time standard, identifying areas that do not meet the hospital accessibility travel time standards. Then, the data of the worst accessibility period is compared with the data of the midnight period to obtain the change value of hospital accessibility, to identify the areas where the hospital accessibility does not meet the standard caused by traffic factors. Finally, combined with demographic data, residential area data, and remote sensing image data for comprehensive analysis, key optimization areas are identified, and optimization strategies are proposed according to the specific conditions of each key optimization area.

3. Results

3.1. Analysis of the AMI Hospital Accessibility on Weekdays

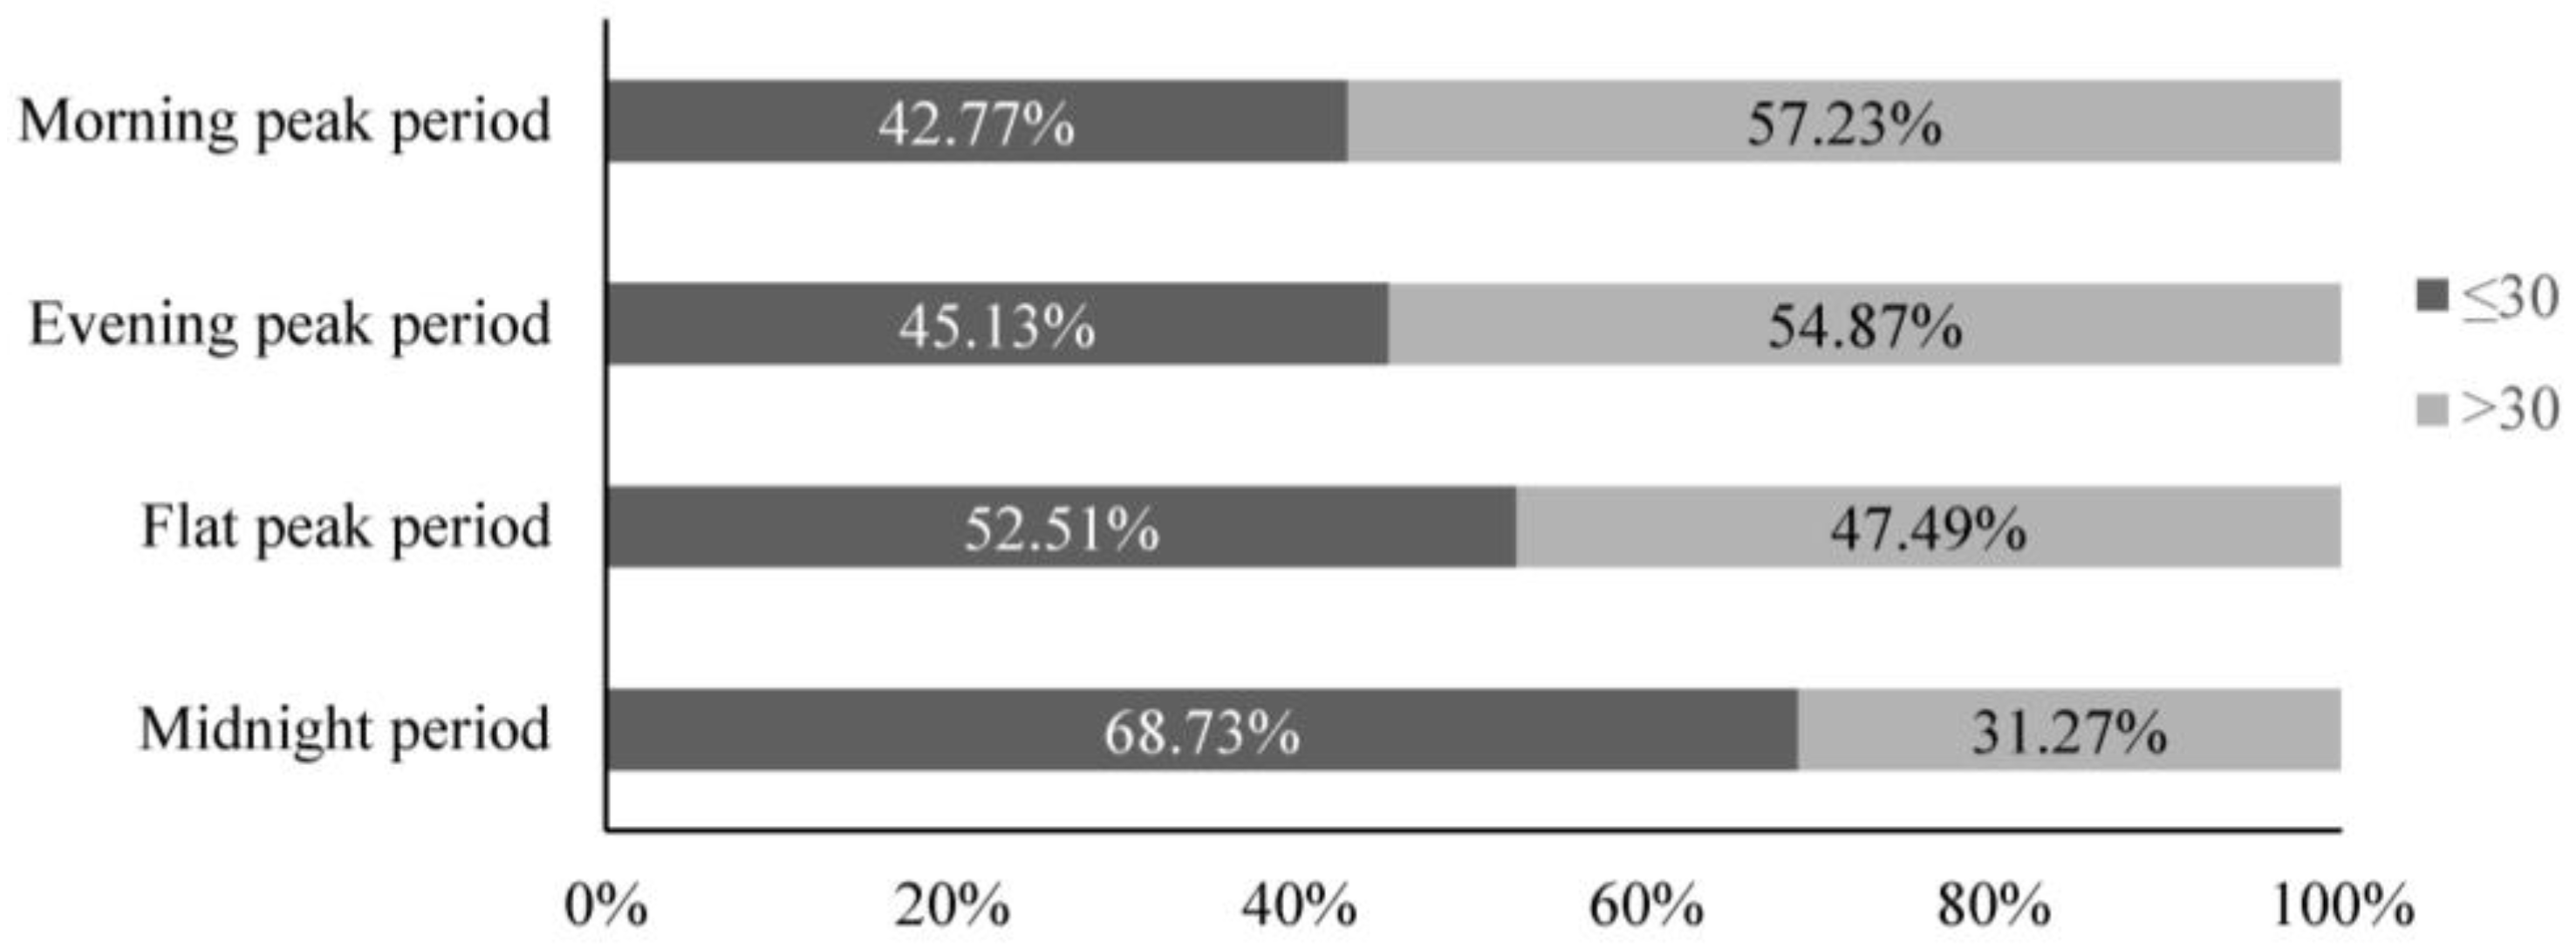
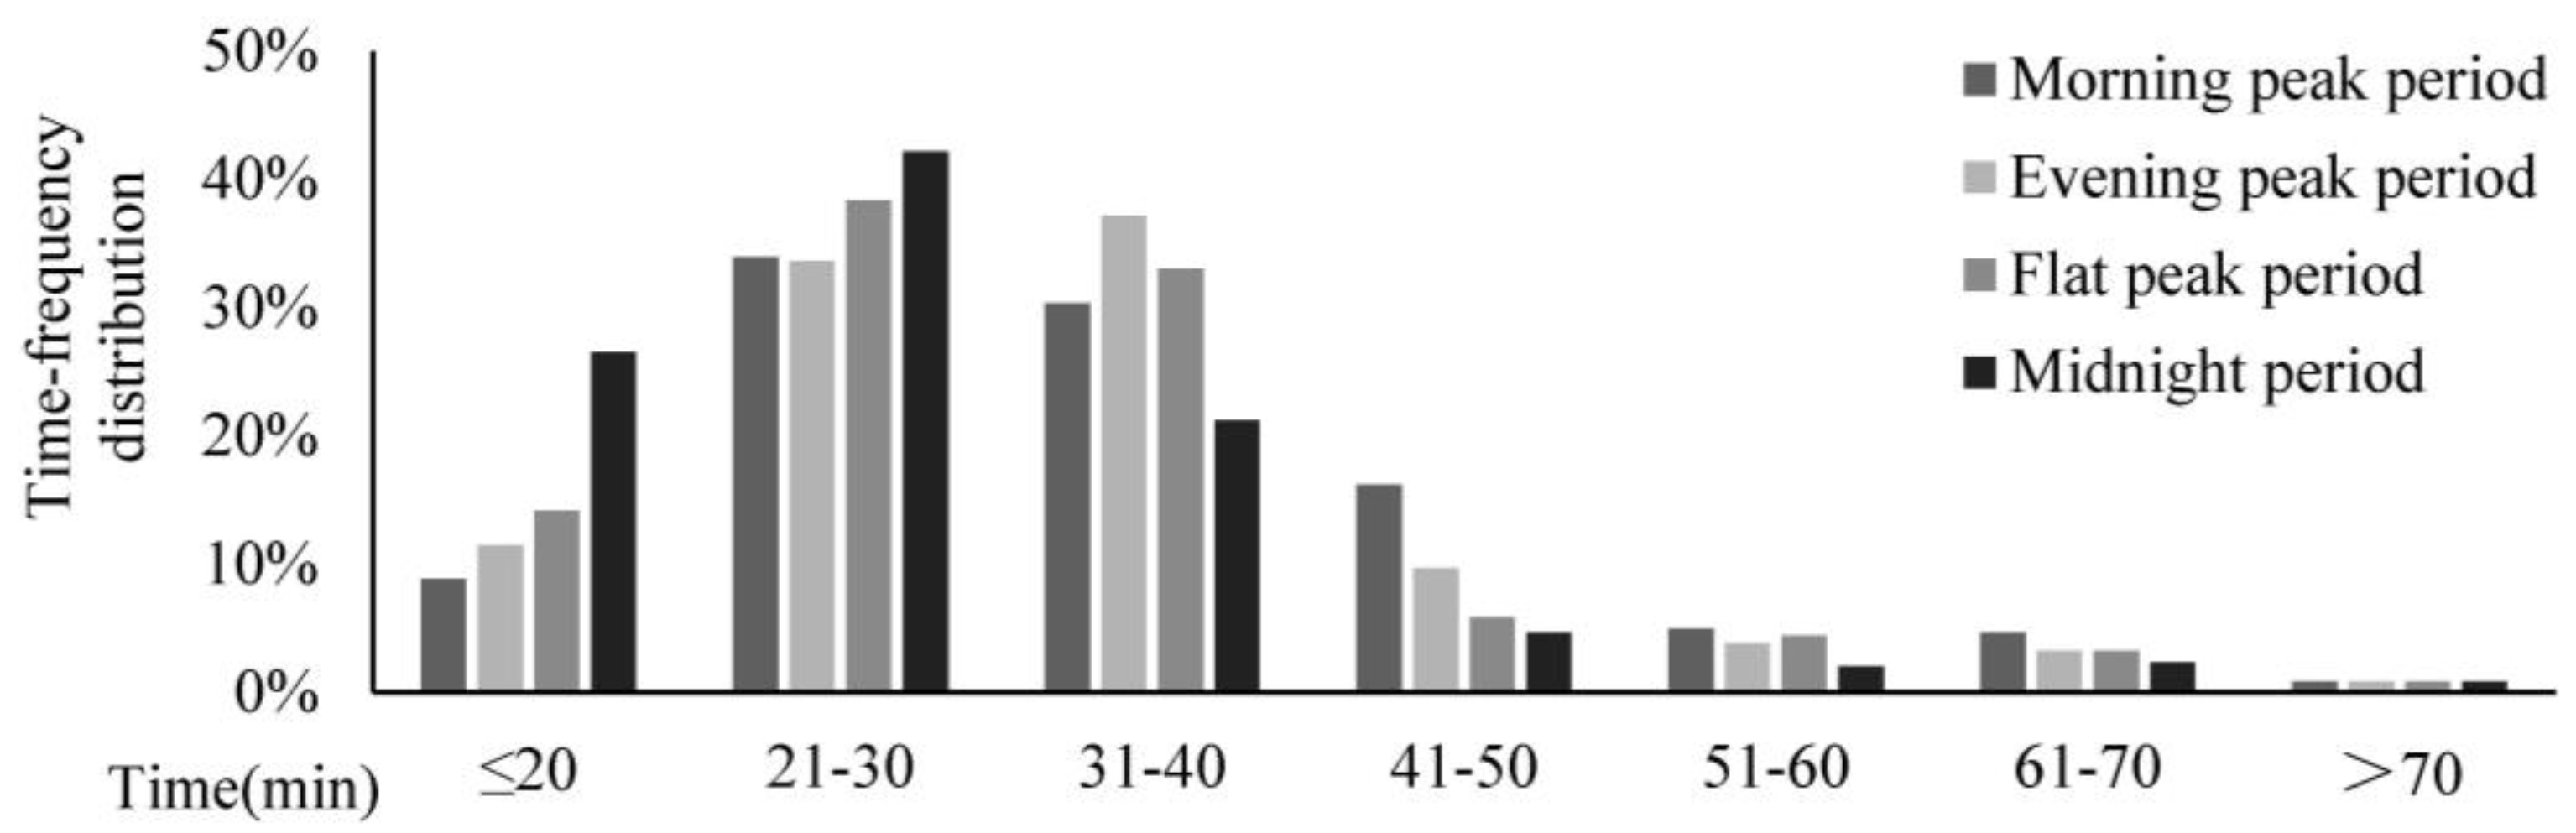
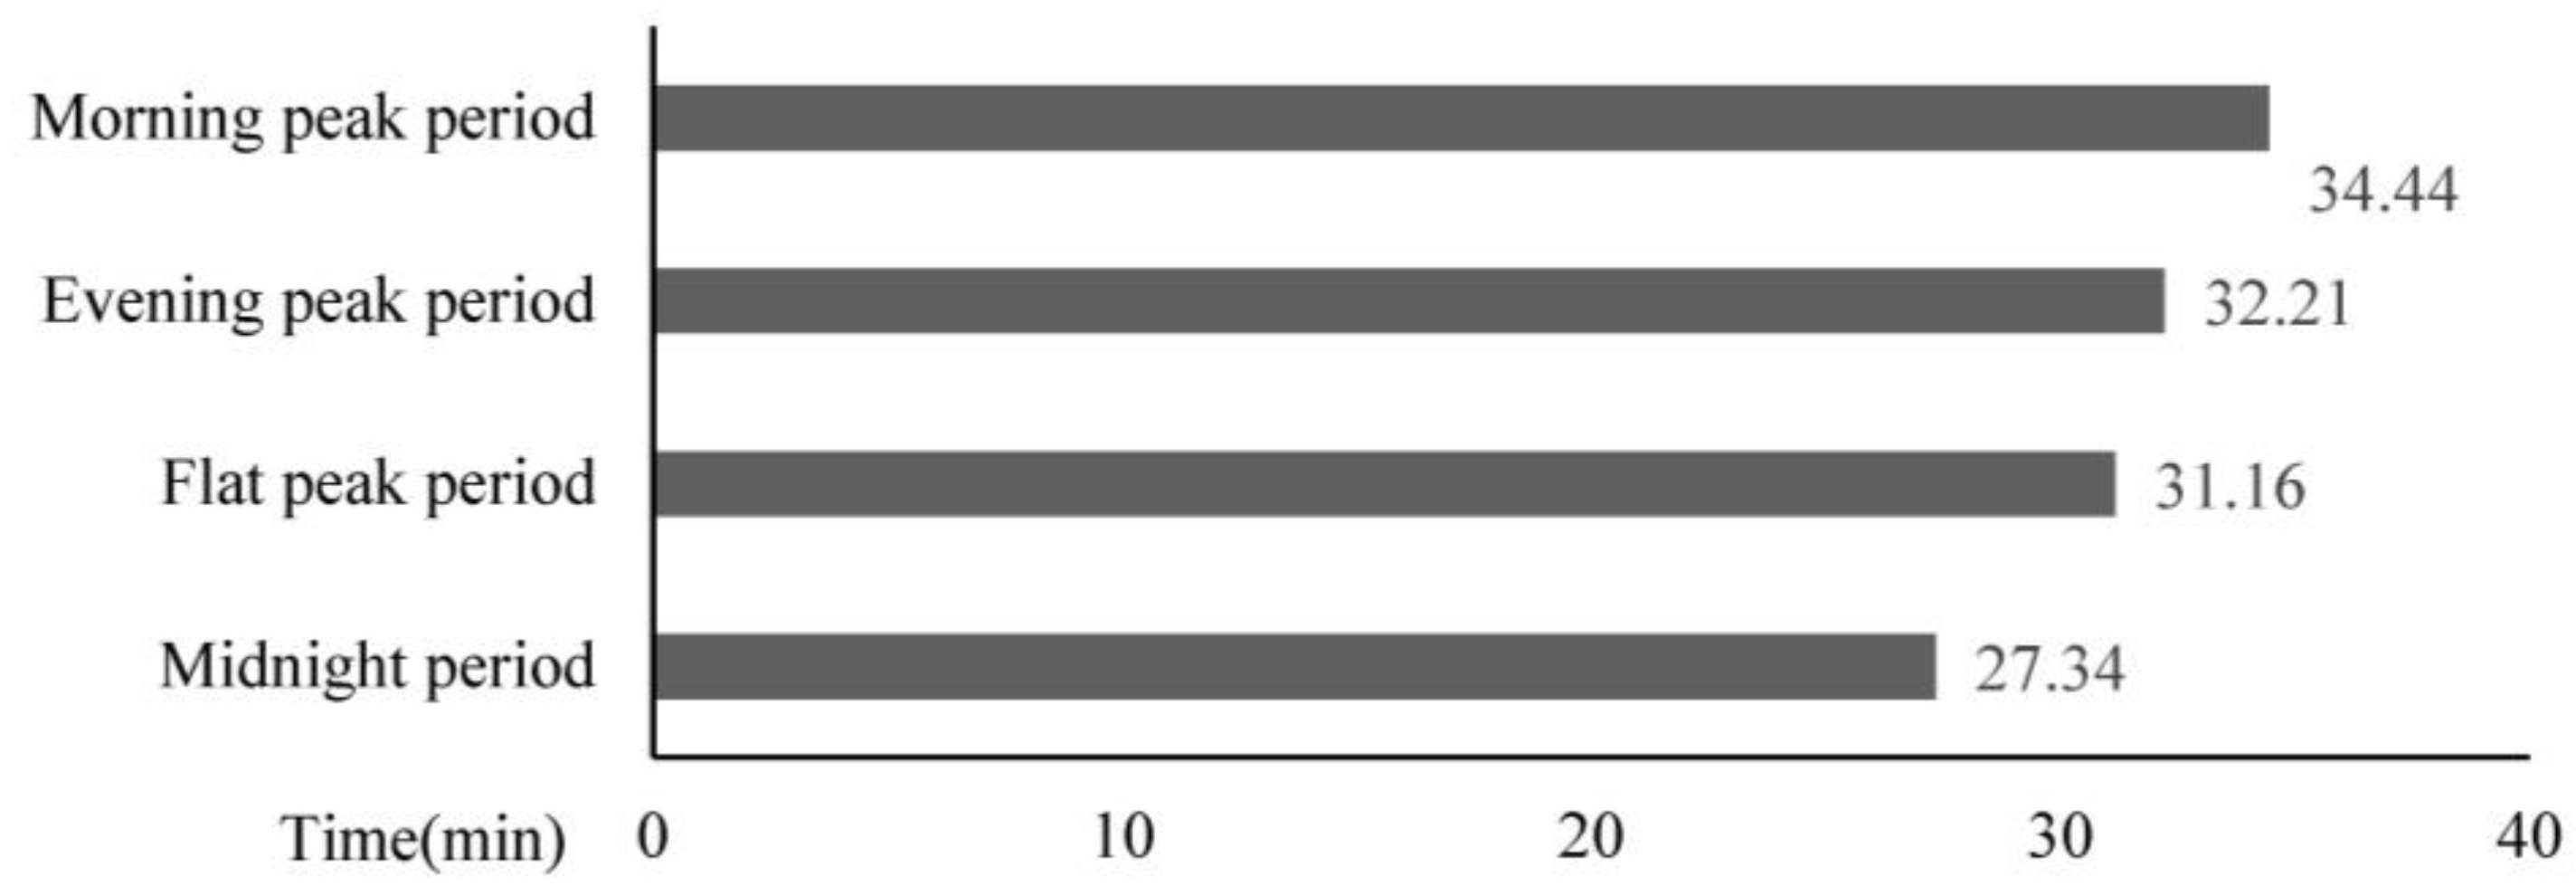
3.1.1. Analysis of AMI Accessibility Travel Time on Weekdays

In this study, the AMI hospital accessibility analysis was carried out according to the four periods: morning peak, flat peak, evening peak, and midnight period. According to the collected online map data, the average AMI accessibility travel time under four different weekday traffic conditions is calculated separately. The statistical results are shown in Figure 5.
From the perspective of average travel time, it can be seen that only the average travel time of the midnight period was within 30 min, which meets the time standard for AMI emergency treatment. The average travel time of the other three periods on weekdays all have varying degrees of delay. Among them, the most severely delayed period is the morning peak period. The travel time was 7.1 min longer than during the midnight period, an extension of 25.97%.
This study uses 30 min as the standard to evaluate the compliance rate of AMI accessibility travel time (Figure 6). During the midnight period, the travel time compliance rate was the highest at 68.73%, while during the morning peak the compliance rate had the lowest number of 42.77%. In general, the compliance rate of AMI accessibility travel time in Shijingshan District is far from adequate, and traffic congestion has a serious impact on the AMI hospital accessibility. The compliance rate of AMI accessibility travel time in the midnight period was close to 70%, while the compliance rate of the morning peak and evening peak was less than 50%.
To analyze the distribution of the time delay of AMI hospital accessibility in Shijingshan District in a more detailed and comprehensive way, this study divided the travel time into 7 levels, namely ≤20 min, 21–30 min, 31–40 min, 41–50 min, 51–60 min, 61–70 min, and more than 70 min. The time distribution of the 7 levels of accessibility is shown in Figure 7. The frequency distribution that can be reached within 21–30 min was the largest, followed by the time period of 31–40 min.

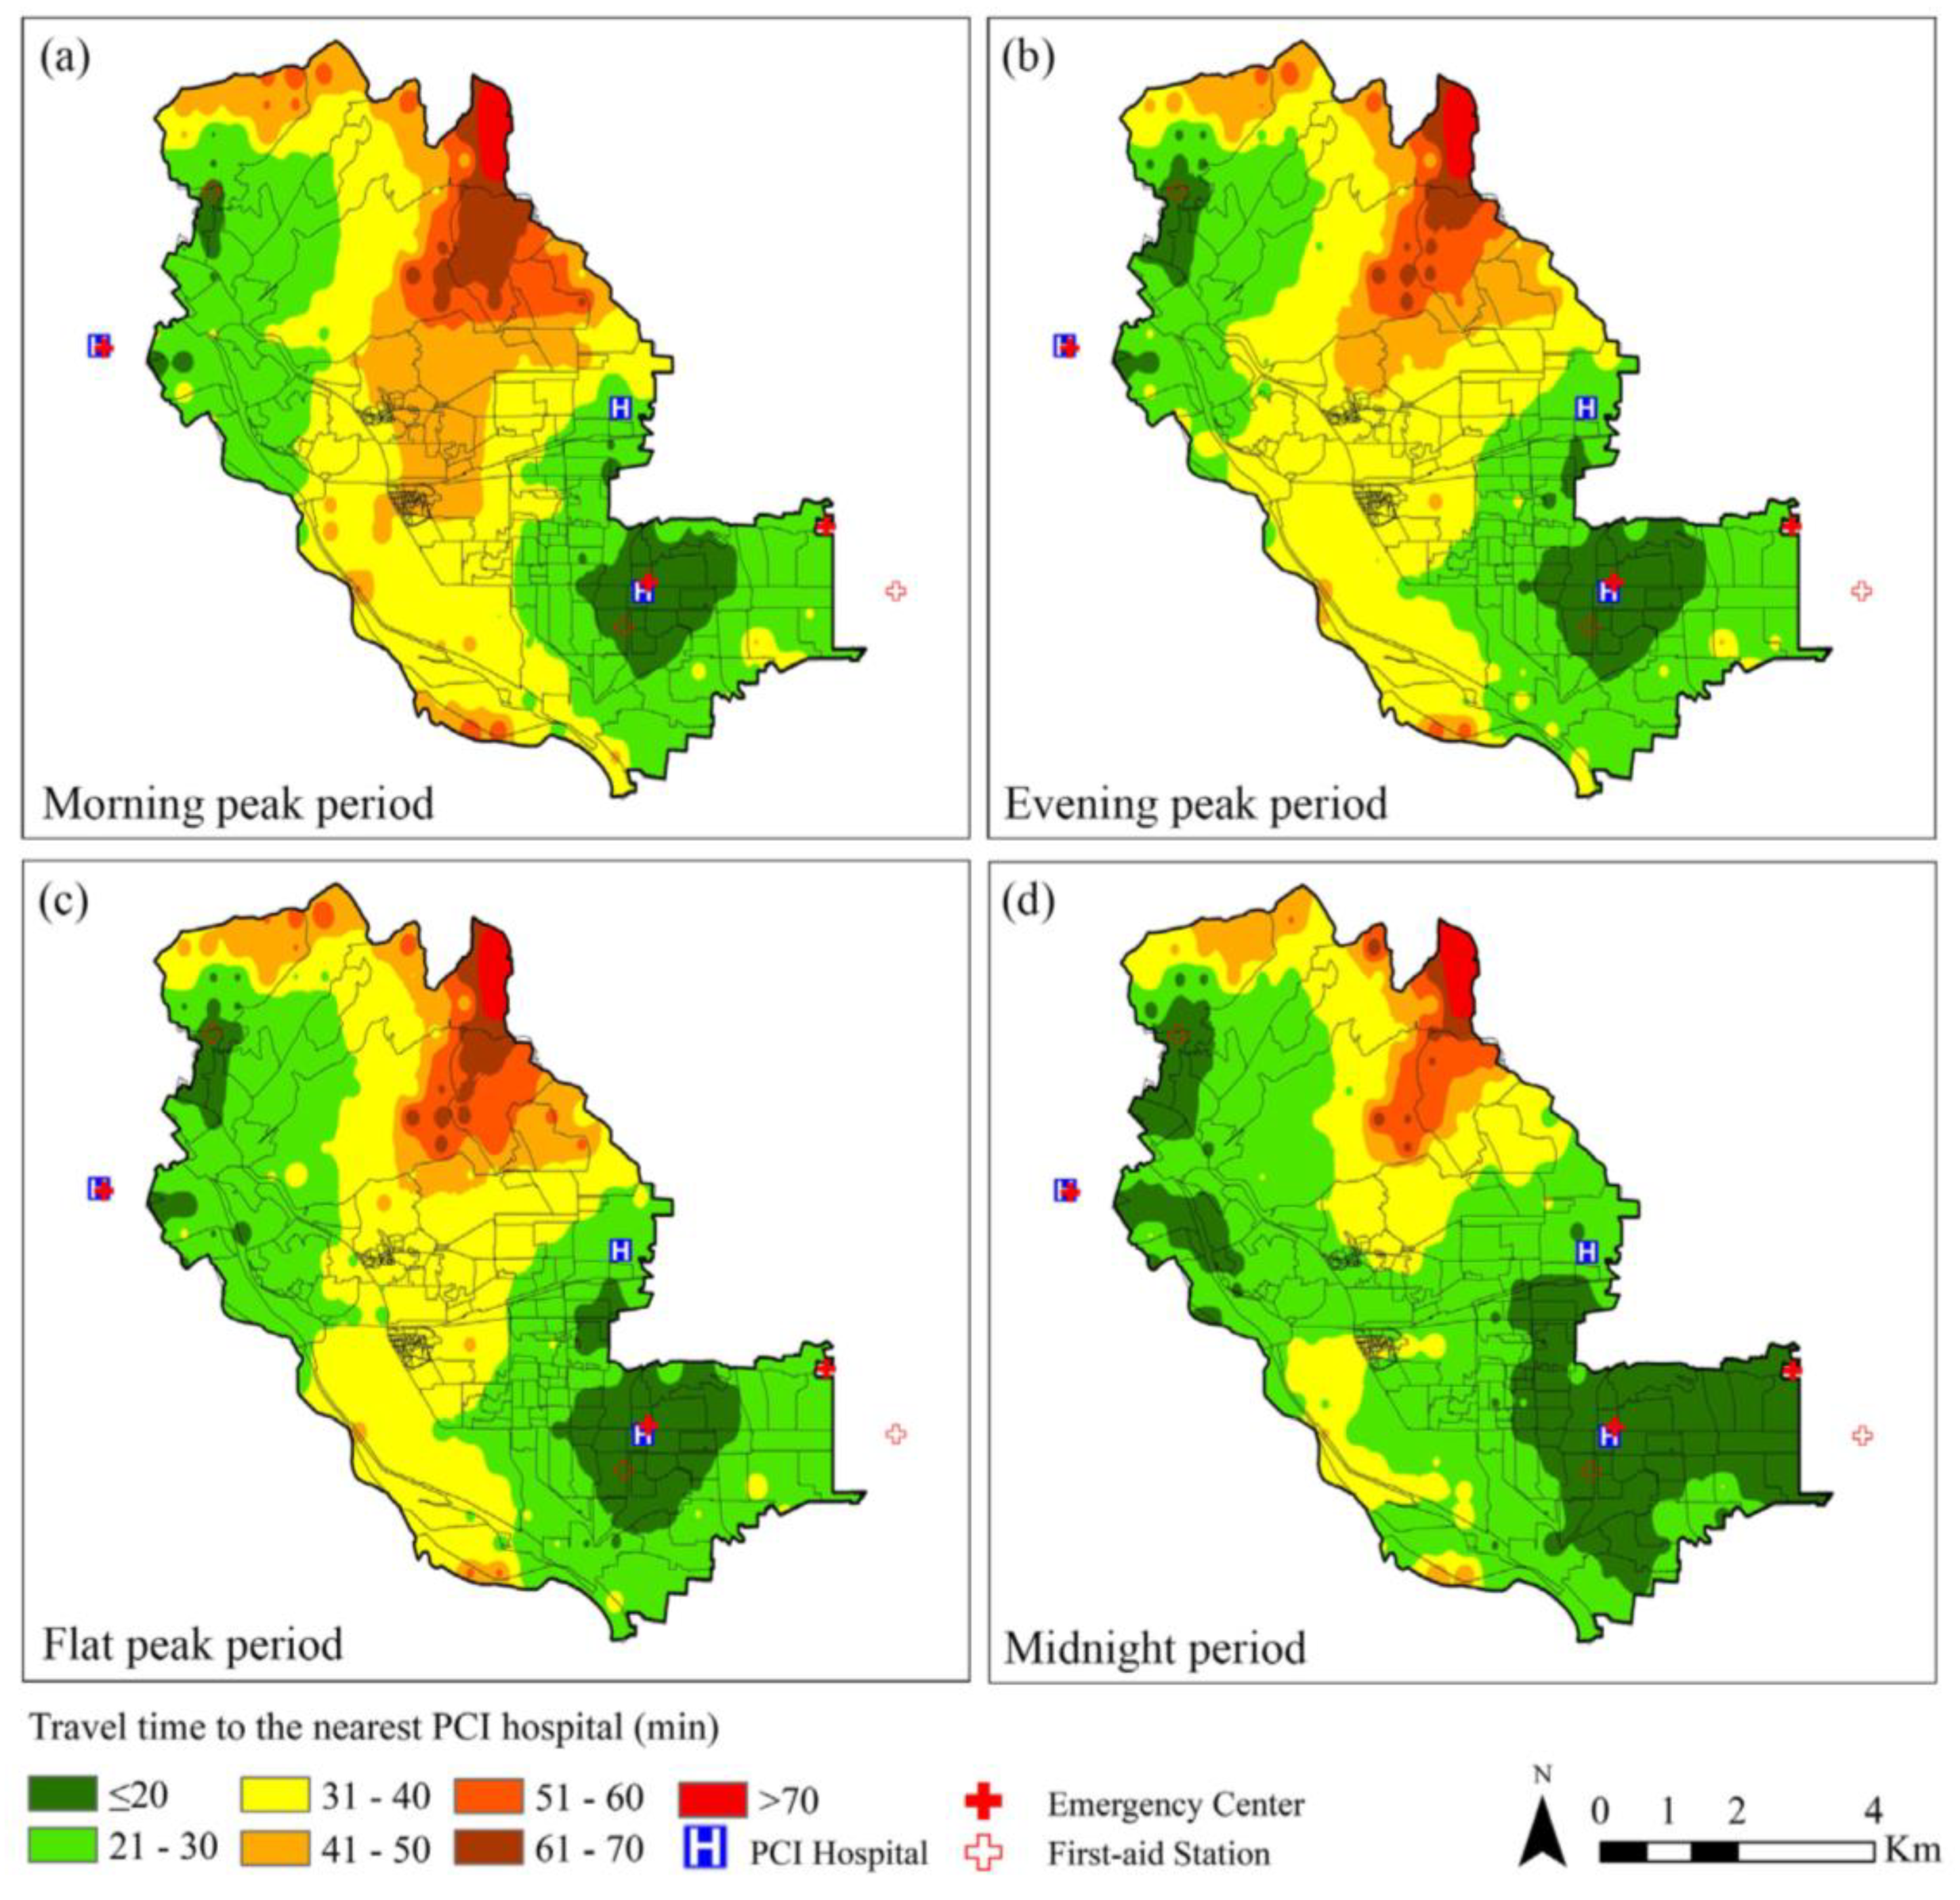
3.1.2. Spatial Pattern Analysis on Weekdays

In this study, according to the level of travel time, ArcGIS 10.3 was used for interpolation analysis, the isochronous circle of AMI hospital accessibility was calculated, and finally, the AMI accessibility spatial pattern distribution map was generated (Figure 8).
The results show that the AMI hospital accessibility levels in Shijingshan District show obvious spatial differentiation characteristics in the four periods of the midnight period, flat peak period, morning peak, and evening peak period. Although the spatial differentiation characteristics of AMI hospital accessibility vary with different time periods of the day, the overall characteristics are relatively similar: both the southeast and northwest area of Shijingshan District present better levels of accessibility and the same level of accessibility has obvious spatial gathering characteristics.
The appearance of this spatial distribution feature is closely related to the spatial configuration of the emergency centers, first-aid stations, and PCI hospitals in the Shijingshan District, which are mainly located in the northwest and southeast. It can be seen from Figure 6 that the area where the AMI accessibility travel time is less than 30 min shows little variation between morning, evening, and flat peak period, while the variation is more obvious in the midnight period. From the comparison between different traffic conditions, it can be seen that the spatial distribution ranking of AMI hospital accessibility during weekdays in Shijingshan District is as follows: (1) southeast region; (2) northwest region; (3) southern region; (4) central region; (5) northern region.

3.2. Analysis of the AMI Hospital Accessibility on Weekends

3.2.1. Analysis of AMI Accessibility Travel Time on Weekends

The average AMI accessibility travel time under different traffic costs during the four weekend periods was calculated separately and compared with that on weekdays (Figure 9). The results are as follows: the average travel time during the midnight period, that is, without traffic congestion, was 27.34 min; the average travel time during the flat peak period on weekends was 31.89 min, which is 43.8 s longer than that on weekdays; the average travel time during evening peak on weekends was 31.43 min, and for the morning peak was 30.36 min, both shorter than those on weekdays. In particular, the average travel time during the morning peak on weekends decreased the most significantly, reaching 4.08 min. It can be seen that the changes in residents’ lives on weekends have a significant impact on AMI hospital accessibility. The average travel time during the flat peak period on weekends was the longest, while the average travel time during the morning peak was the shortest. Although the average travel time during the morning peak and evening peak was shortened, they still do not reach the ideal AMI accessibility travel time of 30 min. Compared with the average travel time at midnight, there is still a significant delay.
Taking 30 min as the standard for AMI accessibility travel time, the compliance rate of the AMI accessibility travel time in each period on weekends in Shijingshan District has all exceeded 50% (Figure 10), and the compliance rate has increased significantly compared with that on weekdays. The impact of traffic congestion on AMI hospital accessibility is reduced on the weekends, especially in the travel time during the morning peak. Compared with the compliance rate of the travel time during the morning peak of the weekdays, the compliance rate of the morning peak of the weekends increased by 15.34%.
It can be seen from Figure 11 that both of the four periods had the largest frequency distribution within 21–30 min, while the frequency of the morning peak and midnight periods were almost equal. It can be seen that the travel frequency of residents during the morning peak period on weekends was relatively low, and to some extent even lower than the frequency of the midnight period. The second-largest frequency distribution was the 31–40 min time period, of which the flat peak period accounts for the highest proportion in this time period.

3.2.2. Spatial Pattern Analysis on Weekends

As shown in Figure 12, the overall spatial distribution of AMI hospital accessibility travel time on weekends in the Shijingshan District is basically the same as that of weekdays. The spatial distribution ranking of AMI hospital accessibility during weekends in Shijingshan District is as follows: (1) southeast region; (2) northwest region; (3) southern region; (4) central region; (5) northern region. The evolution of the time series has a relatively weak effect on the AMI hospital accessibility travel time within 20 min, while within the time period of 20–30 min, the spatial distribution of the hospital accessibility time in the morning peak, evening peak, and flat peak period shows a gradual contraction.

3.3. Optimizing Strategies for AMI Hospital Accessibility

In this study, the spatial patterns of AMI hospital accessibility in the Shijingshan District on weekdays and weekends were combined to calculate the total spatial pattern of AMI hospital accessibility in Shijingshan District, 30 min is used as the standard of AMI accessibility travel time, and the visualization results are shown in Figure 13. This study uses the same method to calculate the emergency travel distance from the study area to the nearest PCI hospital under the support of Web Mapping API (as shown in Figure 14), and the results show that there is a certain relationship between two aspects: (a) The spatial distribution of the area where the shortest emergency travel distance is less than 9km is similar to that of the area where the accessibility travel time is less than 30 min; (b) The spatial distribution of the area where the shortest emergency travel distance is between 9.1 and 12 km is similar to that of the area that fails to reach the 30-min accessibility travel time standard due to traffic congestion; (c) The spatial distribution of the area where the shortest emergency travel distance is longer than 12 km is similar to that of the area where the accessibility travel time exceeds 30 min. In China, the government arranges the spatial distribution of medical facilities according to the service distance, and does not consider the hospital accessibility travel time. Therefore, the correlation study of the hospital accessibility travel time and emergency travel distance will help to provide a more comprehensive and optimized decision-making basis for the planning strategy of medical facilities in this region.

3.3.1. Optimization Strategy for the Layout of Emergency Medical Facilities

Area A and Area B in Figure 13 are areas where the AMI accessibility travel time still cannot reach the 30-min-standard even under zero influence of traffic congestion. In these areas and the adjacent surrounding areas, there are neither first-aid stations nor PCI hospitals, nor even non-PCI general hospitals. Therefore, the AMI hospital accessibility of AMI in these areas is extremely poor.
Based on the satellite remote sensing images of Shijingshan District, the area mentioned above was analyzed in detail. The northern part of Area A is a mountainous area with few residential areas. At the same time, there are more residential areas in the east and south of Area A, including larger residential areas and several colleges, middle schools, and primary schools. Considering that the new construction of a PCI hospital requires a large-scale investment and a long preparatory operation cycle, it is recommended that the newly-added medical facilities should be mainly first-aid stations to effectively make up for the vacancy of AMI emergency medical treatment needs in the area. In addition, the existing built environment of Area B is mainly industrial heritage parks and forest parks. There are fewer residents in the area, and the need for AMI emergency medical treatment is low. It is recommended not to add first-aid stations and other medical facilities in Area B for the time being.

3.3.2. Optimization Strategy for the Emergency Transportation System

It can be seen from Figure 13 that the area of the Shijingshan District where the AMI hospital accessibility is not up to standard is large, mainly distributed in the middle and extending to both sides of Shijingshan District, such as Area C and Area D. Based on the satellite remote sensing images of the Shijingshan District, specific analysis of the above areas was carried out. Area C is mainly distributed with green areas and residential areas. Area D is the remaining old towns of the Shijingshan District, including large-scale residential areas and forest parks. The motor vehicle lanes in the area are crisscrossed, and the roads are remarkably narrow. At the same time, because there are fewer parking lots, many vehicles park along both sides of the street, which increases the difficulty of passing ambulances and prolongs the time of emergency treatment.
Area C and Area D should become the key areas for optimizing the transportation system in the Shijingshan District. The number and scale of parking lots should be increased reasonably in the area, and the parking of residents’ motor vehicles should be strictly regulated. In this way, traffic congestion in the area could be reduced, and the rapid passage of ambulances could be fully guaranteed. In addition, in the road network planning, consideration should be given to strengthening the construction of dedicated public transport lanes for ambulances to significantly improve the efficiency of emergency traffic.

3.3.3. Key Optimization Area Determination Based on Demographic and Residential Area Data

This study corrects the 100m-precision Chinese demographic data provided by worldpop with China’s seventh national census data to calculate the spatial distribution characteristics of the population in the study area, and fits into the 500 m × 500 m grid divided by the method described in the previous section, and visualize the spatial distribution of residential areas (Figure 15). To make a comprehensive analysis with the accessibility results clearer, this study visualizes the population in the form of point density. Each point in Figure 15 represents 200 residents, and the density of the points reflects the spatial distribution of population density. Through the above analysis, this study determined the proportion of population numbers under different accessibility time standards (Figure 16). The total population of the Shijingshan District is 567,845, of which 15.48% of the residents cannot reach the nearest PCI hospital within 30 min under any traffic conditions due to the distance, 28.55% of the residents cannot reach the nearest PCI hospital within 30 min during peak traffic congestion, and only 55.97% of the residents can always reach the nearest PCI hospital within 30 min.
Through the above analysis, this study found that two areas need to be identified as key optimization areas. Area 1 in Figure 15 is located on Jindingjie Street. This area has a high population and residential area density, and there are no medical facilities or emergency facilities built in it. At the same time, the hospital accessibility in this area is greatly affected by traffic. During peak periods, the area cannot meet the 30-min accessibility travel time standard due to traffic factors. Therefore, it is necessary to focus on optimizing the traffic network system in this area, increase the diversion of road traffic during peak periods, increase the economic investment in transportation infrastructure, and add dedicated public transportation lanes for ambulances. In addition, it can be considered to configure corresponding medical facilities such as first-aid stations, etc., depending on the construction conditions of the residential area.
Area 2 in Figure 15 is located in Bajiao Street. Similar to Area 1 in Figure 15, this area has a high population and residential area density. Different from Area 1, this area has better hospital accessibility and can meet the standard of 30-min hospital accessibility travel time. However, there is only one hospital and one emergency center in the area, which makes it difficult to meet the medical needs of the large population in the area. For this type of area, improving medical quality should be the focus of decision makers. In the case of good hospital accessibility, consideration should be given to adding enough medical staff, ambulances, emergency equipment, and other medical resources to cope with the larger potential medical load.

4. Discussion

4.1. Influencing Factors of AMI Hospital Accessibility

This study took Shijingshan District as an example, and explored the AMI hospital accessibility on a multi-period scale by analyzing the time it takes for AMI patients to arrive at the PCI hospital after dialing the emergency number. Results have shown that two major factors have a significant impact on AMI hospital accessibility:
(1) Heavily delayed AMI accessibility travel time and the insufficient allocation of emergency medical facilities is the main reason for the poor AMI hospital accessibility of the Shijingshan District. Even in the midnight period in the absence of traffic congestion, the area where the AMI accessibility travel time is longer than 30 min still exceeds one-third of the total area of Shijingshan District. It can be seen that it is necessary to optimize and adjust the planning pattern of emergency medical facilities, including optimizing the spatial layout of emergency medical facilities and reasonably increasing the number of emergency medical facilities, to minimize the AMI accessibility travel time and improve the AMI hospital accessibility.
(2) Traffic congestion caused by poor road conditions is another important factor that affects AMI accessibility travel time. For example, the highest percentage of non-compliant travel time is the morning peak on weekdays, reaching 57.23%, while the travel time without the influence of traffic congestion (that is, midnight period) is 31.27%, the time was delayed by 25.96% from the midnight period. Improving the accessibility of emergency transportation and optimizing the urban emergency transportation system are of great significance for improving AMI hospital accessibility.

4.2. Temporal and Spatial Distribution Differences of AMI Hospital Accessibility

On the temporal pattern of AMI hospital accessibility, the overall average AMI hospital accessibility travel time on weekdays is longer than on weekends. The period with the largest difference between the AMI hospital accessibility travel time on weekdays and on weekends is the morning peak period. During this time period, the AMI hospital accessibility travel time on weekdays was delayed by 13% compared to weekends. During the morning peak period on weekdays, half of the areas in the Shijingshan District cannot meet the 30-min AMI hospital accessibility travel time standard. On the spatial pattern of AMI hospital accessibility, the overall spatial distribution of AMI hospital accessibility travel time on weekends in Shijingshan District is basically the same as that of weekdays. The spatial distribution ranking of AMI hospital accessibility during weekends in Shijingshan District is as follows: (1) southeast region; (2) northwest region; (3) southern region; (4) central region; (5) northern region.

4.3. Comparison of Analytical Methods with Existing Research Methods

The measurement of hospital accessibility in previous studies mostly focused on obtaining the driving distance and time through ArcGIS analysis, and most of the studies focused on the accessibility of general hospitals or the overall medical treatment. There is no accurate measurement of AMI hospital accessibility. In addition, the existing research methods of hospital accessibility cannot obtain real-time road traffic data and traffic congestion in the study area in a timely and accurate way, and cannot accurately and effectively measure the AMI hospital accessibility, which is extremely sensitive to emergency time. Based on Web Mapping API, this study proposed a fast and accurate method to measure the accessibility of multiple types of medical facilities, which can measure the AMI hospital accessibility with high accuracy in multiple periods and regions and is suitable for promoting this method in other fields of accessibility research.

4.4. Limitations

(1) In this study, considering the time-sensitivity of AMI emergency treatment, we mainly analyze the hospital accessibility when the patient calls an ambulance. In actual situations, patients can seek emergency medical treatment through different types of transportation, including self-driving and public transportation. Analyzing the characteristics of hospital accessibility under different modes of transportation is the current deficiency of this study and the direction of further research.
(2) Statistics on the frequency of medical staff going to emergency outpatient clinics for acute myocardial infarction can also help propose relevant optimization and improvement strategies. Due to the confidentiality of medical data in Chinese medical institutions, the data could not be obtained in this study.
(3) Due to the inability to obtain the time between the onset of AMI patients and the patient’s emergency call, this study assumed that the patient made an emergency call immediately after the onset of the disease, and this time delay was not calculated in the study.
(4) This study assumes that the number of ambulances and PCI medical resources in the study area are always sufficient and available. However, in a real situation, there is also the crowding of medical institutions caused by too much first-aid demand, prolonging the waiting time for patients seeking emergency treatment.
(5) Constrained by the limited computing power and data sources, this study assumes that the farthest cross-regional travel range for AMI patients is 2 km outside the study area (i.e., the buffer zone), which is a weakness in the study design. A better way is to expand the study scope and the number of medical facilities, allowing for a more precise calculation of accessibility.

5. Conclusions

This study proposed a method to accurately measure the AMI hospital accessibility based on Web Mapping API, Shijingshan District, Beijing, and was considered an empirical case. It is concluded that travel time to hospitals and traffic congestion are important factors affecting AMI hospital accessibility and are also important points when improving AMI hospital accessibility. The research results shed new light on the accessibility of urban medical facilities from the dual perspectives of time and space and provide a scientific basis with which local governments can optimize the spatial structure of medical facilities, especially emergency treatment facilities. In future research, scholars can further optimize and improve the accuracy and pertinence of hospital accessibility measurement by studying the accessibility of different transportation modes (such as self-driving travel, taxi travel, and public transportation travel). The method adopted in this study can also provide a reference for hospital accessibility research in other diseases (such as Acute Cerebral Apoplexy, Acute Respiratory Failure, etc.). In addition, some accessibility measurement methods improved and optimized based on GIS technology and big data technology, such as THE i2SFCA (i2SFCA) method, can be applied to the research on hospital accessibility to further improve the scientificity of the research.

Author Contributions

Conceptualization, Yuwei Su, Jingyong Wang, Jiangping Wang and Guoen Wang; Data curation, Yuwei Su and Jingyong Wang; Funding acquisition, Jiangping Wang and Guoen Wang; Investigation, Yuwei Su; Methodology, Yuwei Su and Jingyong Wang; Project administration, Jiangping Wang and Guoen Wang; Software, Yuwei Su; Supervision, Jiangping Wang and Guoen Wang; Visualization, Yuwei Su and Jingyong Wang; Writing—original draft, Yuwei Su and Jingyong Wang; Writing—review & editing, Yuwei Su, Jingyong Wang, Jiangping Wang, and Guoen Wang. All authors have read and agreed to the published version of the manuscript.

Funding

This research was funded by the National Natural Science Foundation of China (NSFC), grant number 51878516, and the open research project (key project) of the Institute of Wuhan Studies (IWHS), grant number IWHS20181003.

Data Availability Statement

Data or models that support the findings of this study are available from the corresponding author upon reasonable request.

Acknowledgments

The authors would like to express special thanks to the research team of Professor Ying Long of Tsinghua University for providing the residential area data and the research team of Professor Jing Liu from Beijing Anzhen Hospital Affiliated to Capital Medical University for providing the PCI hospital data for this study.

Conflicts of Interest

The authors declare no conflict of interest.

References

  1. National Center for Cardiovascular Diseases. Available online: https://www.nccd.org.cn/News/Information/Index/1089 (accessed on 29 November 2021).
  2. Boersma, E.; Mercado, N.; Poldermans, D.; Gardien, M.; Vos, J.; Simoons, M.L. Acute myocardial infarction. Lancet 2003, 361, 847–858. [Google Scholar] [CrossRef]
  3. Ding, S.; Chen, B. Rationality Assessment of the Spatial Distributions of Urban Medical Facility. J. Geo-Inf. Sci. 2017, 19, 185–196. [Google Scholar] [CrossRef]
  4. GBD 2016 DALYs and HALE Collaborators. Global, regional, and national disability-adjusted life-years (DALYs) for 333 diseases and injuries and healthy life expectancy (HALE) for 195 countries and territories, 1990–2016: A systematic analysis for the Global Burden of Disease Study 2016. Lancet 2017, 390, 1260–1344. [Google Scholar] [CrossRef] [Green Version]
  5. Giuseppe, D.L.; Harry, S.; Jan, P.O.; Elliott, M.A. Time delay to treatment and mortality in primary angioplasty for acute myocardial infarction: Every minute of delay counts. Circulation 2004, 109, 1223–1225. [Google Scholar] [CrossRef] [Green Version]
  6. ESC Scientific Document Group. 2020 ESC Guidelines for the management of acute coronary syndromes in patients presenting without persistent ST-segment elevation: The Task Force for the management of acute coronary syndromes in patients presenting without persistent ST-segment elevation of the European Society of Cardiology (ESC). Eur. Heart J. 2021, 42, 1289–1367. [Google Scholar] [CrossRef]
  7. Elliott, M.A. Bypassing the emergency department to improve the process of care for ST-elevation myocardial infarction: Necessary but not sufficient. Circulation 2013, 128, 322–324. [Google Scholar] [CrossRef] [Green Version]
  8. Shen, Y.-C.; Hsia, R.Y. Association Between Emergency Department Closure and Treatment, Access, and Health Outcomes Among Patients With Acute Myocardial Infarction. Circulation 2016, 134, 1595–1597. [Google Scholar] [CrossRef] [Green Version]
  9. Trifan, A.L.; Dragomir, L.; Anghele, M.; Elkan, E.M.; Munteanu, S.; Moscu, C.; Stoian, V.-I.; Telehuz, A.; Zlati, M.L.; Lungu, M.; et al. Assessment of Transportation by Air for Patients with Acute ST-Elevation Myocardial Infarction from Non-PCI Centers. Healthcare 2021, 9, 299. [Google Scholar] [CrossRef]
  10. Hansen, W.G. How accessibility shapes land-use. J. Am. Ins. Planners 1959, 25, 73–76. [Google Scholar] [CrossRef]
  11. Geurs, K.T.; Wee, B.V. Accessibility evaluation of land-use and transport strategies: Review and research directions. J. Transp. Geogr. 2004, 12, 127–140. [Google Scholar] [CrossRef]
  12. Wang, F. Measurement, Optimization, and Impact of Health Care Accessibility: A Methodological Review. Ann. Am. Assoc. Geogr. 2012, 102, 1104–1112. [Google Scholar] [CrossRef] [PubMed] [Green Version]
  13. Dalvi, M.Q.; Martin, K.M. The measurement of accessibility: Some preliminary results. Transportation 1976, 5, 17–42. [Google Scholar] [CrossRef]
  14. Zhengna, S.; Wen, C.; Qianjin, C.; Lei, Z. Measurement of Spatial Accessibility to Health Care Facilities and Defining Health Professional Shortage Areas Based on Improved Potential Model—A Case Study of Rudong County in Jiangsu Province. Sci.Geogr. Sin. 2010, 30, 213–219. [Google Scholar] [CrossRef]
  15. Penchansky, R.; Thomas, J.W. The concept of access: Definition and relationship to consumer satisfaction. Med. Care 1981, 19, 127–140. [Google Scholar] [CrossRef] [PubMed]
  16. Gary, H. A Literature Review of the Use of GIS-Based Measures of Access to Health Care Services. Health Serv. Outcome 2004, 5, 119–139. [Google Scholar] [CrossRef]
  17. Khan, A.A. An integrated approach to measuring potential spatial access to health care services. Socio Econ. Plan. Sci. 1992, 26, 275–287. [Google Scholar] [CrossRef]
  18. Dewulf, B.; Neutens, T.; De Weerdt, Y.; Van De Weghe, N. Accessibility to primary health care in Belgium: An evaluation of policies awarding financial assistance in shortage areas. BMC Fam. Pract. 2013, 14, 122. [Google Scholar] [CrossRef] [Green Version]
  19. Lovett, A.; Sunnenberg, G.; Haynes, R. Using GIS to assess accessibility to primary health care services. Public Health Pract. Opp. Pit. 2004, 2, 187–204. [Google Scholar]
  20. Hare, T.S.; Barcus, H. Geographical accessibility and Kentucky’s heart-related hospital services. Appl. Geogr. 2007, 27, 181–205. [Google Scholar] [CrossRef]
  21. Ting, H.-W.; Chien, T.-Y.; Lai, K.R.; Pan, R.-H.; Wu, K.-H.; Chen, J.-M.; Chan, C.-L. Differences in Spontaneous Intracerebral Hemorrhage Cases between Urban and Rural Regions of Taiwan: Big Data Analytics of Government Open Data. Int. J. Environ. Res. Public Health 2017, 14, 1548. [Google Scholar] [CrossRef] [Green Version]
  22. Wang, Z.; Nie, K. Measuring Spatial Patterns of Health Care Facilities and Their Relationships with Hypertension Inpatients in a Network-Constrained Urban System. Int. J. Environ. Res. Public Health 2019, 16, 3204. [Google Scholar] [CrossRef] [Green Version]
  23. Abu Bakar, M.A.; Samat, N.; Yaacob, N.S. Spatial accessibility to health care services among children with cerebral palsy in Johor, Peninsular Malaysia. Geospat. Health 2021, 16, 987. [Google Scholar] [CrossRef] [PubMed]
  24. Benevenuto, R.G.; Azevedo, I.C.C.; Caulfield, B. Assessing the spatial burden in health care accessibility of low-income families in rural Northeast Brazil. J. Transp. Health 2019, 14, 100595. [Google Scholar] [CrossRef]
  25. Siegel, M.; Koller, D.; Vogt, V.; Sundmacher, L. Developing a composite index of spatial accessibility across different health care sectors: A German example. Health Policy 2016, 120, 205–212. [Google Scholar] [CrossRef] [PubMed]
  26. Lechowski, Ł.; Jasion, A. Spatial Accessibility of Primary Health Care in Rural Areas in Poland. Int. J. Environ. Res. Public Health 2021, 18, 9282. [Google Scholar] [CrossRef]
  27. Hundt, G.L.; Alzaroo, S.; Hasna, F.; Alsmeiran, M. The provision of accessible, acceptable health care in rural remote areas and the right to health: Bedouin in the North East region of Jordan. Soc. Sci. Med. 2012, 74, 36–43. [Google Scholar] [CrossRef]
  28. Pinto, A.; Köptcke, L.S.; David, R.; Kuper, H. A National Accessibility Audit of Primary Health Care Facilities in Brazil—Are People with Disabilities Being Denied Their Right to Health? Int. J. Environ. Res. Public Health 2021, 18, 2953. [Google Scholar] [CrossRef]
  29. Cheng, M.; Tao, L.; Huang, Y.L.a. Measuring Spatial Accessibility of Urban Medical Facilities: A Case Study in Changning District of Shanghai in China. Int. J. Environ. Res. Public Health 2021, 18, 9598. [Google Scholar] [CrossRef]
  30. Gao, F.; Jaffrelot, M.; Deguen, S. Measuring hospital spatial accessibility using the enhanced two-step floating catchment area method to assess the impact of spatial accessibility to hospital and non-hospital care on the length of hospital stay. BMC Health Serv. Res. 2021, 21, 1078. [Google Scholar] [CrossRef]
  31. Wang, X.; Yang, H.; Duan, Z.; Pan, J. Spatial accessibility of primary health care in China: A case study in Sichuan Province. Soc. Sci. Med. 2018, 209, 14–24. [Google Scholar] [CrossRef]
  32. Zhang, J.; Han, P.; Sun, Y.; Zhao, J.; Yang, L. Assessing Spatial Accessibility to Primary Health Care Services in Beijing, China. Int. J. Environ. Res. Public Health 2021, 18, 13182. [Google Scholar] [CrossRef] [PubMed]
  33. Kotavaara, O.; Nivala, A.; Lankila, T.; Huotari, T.; Delmelle, E.; Antikainen, H. Geographical accessibility to primary health care in Finland–Grid-based multimodal assessment. Appl. Geogr. 2021, 136, 102583. [Google Scholar] [CrossRef]
  34. Chen, W.; Cheng, L.; Chen, X.; Chen, J.; Cao, M. Measuring accessibility to health care services for older bus passengers: A finer spatial resolution. J. Transp. Geogr. 2021, 93, 103068. [Google Scholar] [CrossRef]
  35. Caviglia, M.; Dell’Aringa, M.; Putoto, G.; Buson, R.; Pini, S.; Youkee, D.; Jambai, A.; Vandy, M.J.; Rosi, P.; Hubloue, I.; et al. Improving Access to Healthcare in Sierra Leone: The Role of the Newly Developed National Emergency Medical Service. Int. J. Environ. Res. Public Health 2021, 18, 9546. [Google Scholar] [CrossRef] [PubMed]
  36. Langford, M.; Higgs, G.; Fry, R. Multi-modal two-step floating catchment area analysis of primary health care accessibility. Health Place 2016, 38, 70–81. [Google Scholar] [CrossRef] [PubMed]
  37. Andersen, R. A behavioral model of families’ use of health services. J. Hum. Resour. 1968, 7, 125. [Google Scholar]
  38. Yiannakoulias, N.; Bland, W.; Svenson, L.W. Estimating the effect of turn penalties and traffic congestion on measuring spatial accessibility to primary health care. Appl. Geogr. 2013, 39, 172–182. [Google Scholar] [CrossRef]
  39. Rong, P.; Zheng, Z.; Kwan, M.; Qin, Y. Evaluation of the spatial equity of medical facilities based on improved potential model and map service API: A case study in Zhengzhou, China. Appl. Geogr. 2020, 119, 102192. [Google Scholar] [CrossRef]
  40. Rosenblatt, M. Remarks on some nonparametric estimates of a density function. Ann. Math. Stat. 1956, 27, 832–837. [Google Scholar] [CrossRef]
  41. Yang, D.H.; Goerge, R.; Mullner, R. Comparing GIS-based methods of measuring spatial accessibility to health services. J. Med. Syst. 2006, 30, 23–32. [Google Scholar] [CrossRef]
  42. Fan, P.; Xu, L.; Yue, W.; Chen, J. Accessibility of public urban green space in an urban periphery: The case of Shanghai. Landsc. Urban Plan. 2016, 165, 177–192. [Google Scholar] [CrossRef]
  43. Wang, F.H.; Luo, W. Assessing spatial and non-spatial factors for healthcare access: Towards an integrated approach to defining health professional shortage areas. Health Place 2005, 11, 131–146. [Google Scholar] [CrossRef] [PubMed]
  44. Luo, W.; Wang, F. Measures of spatial accessibility to health care in a GIS environment: Synthesis and a case study in the chicago region. Environ. Plann. Plann. Des. 2003, 30, 865–884. [Google Scholar] [CrossRef] [PubMed] [Green Version]
  45. Xing, L.; Liu, Y.; Wang, B.; Wang, Y.; Liu, H. An environmental justice study on spatial access to parks for youth by using an improved 2SFCA method in Wuhan, China. Cities 2020, 96, 102405. [Google Scholar] [CrossRef]
  46. Luo, W.; Qi, Y. An enhanced two-step floating catchment area (E2SFCA) method for measuring spatial accessibility to primary care physicians. Health Place 2009, 15, 1100–1107. [Google Scholar] [CrossRef]
  47. Wan, N.; Zou, B.; Sternberg, T. A three-step floating catchment area method for analyzing spatial access to health services. Int. J. Geogr. Inf. Sci. 2012, 26, 1073–1089. [Google Scholar] [CrossRef]
  48. Delamater, P.L. Spatial accessibility in suboptimally configured health care systems: A modified two-step floating catchment area (M2SFCA) metric. Health Place 2013, 24, 30–43. [Google Scholar] [CrossRef]
  49. Luo, W.; Whippo, T. Variable catchment sizes for the two-step floating catchment area (2SFCA) method. Health Place 2012, 18, 789–795. [Google Scholar] [CrossRef]
  50. Cheng, G.; Zeng, X.; Duan, L.; Lu, X.; Sun, H.; Jiang, T.; Li, Y. Spatial difference analysis for accessibility to high level hospitals based on travel time in Shenzhen, China. Habitat Int. 2016, 53, 485–494. [Google Scholar] [CrossRef] [Green Version]
  51. Liu, Z.; Yang, H.; Xiong, W.; Chen, G. Spatial accessibilities of medical services at county level based on optimized two-step floating catchment area method. Sci. Geogr. Sin. 2017, 5, 91–100. [Google Scholar] [CrossRef]
  52. Ye, C.; Hu, L.; Li, M. Urban green space accessibility changes in a high-density city: A case study of Macau from 2010 to 2015. J. Transp. Geogr. 2018, 66, 106–115. [Google Scholar] [CrossRef]
  53. Zhang, F.; Li, D.; Sherry, A.; Zhang, J. Assessing spatial disparities of accessibility to community-based service resources for Chinese older adults based on travel behavior: A city-wide study of nanjing, China. Habitat Int. 2019, 88, 101984. [Google Scholar] [CrossRef]
  54. Wu, H.-C.; Tseng, M.-H. Evaluating disparities in elderly community care resources: Using a geographic accessibility and inequality index. Int. J. Environ. Res. Public Health 2018, 15, 1353. [Google Scholar] [CrossRef] [Green Version]
  55. Xiao, Y.; Chen, X.; Li, Q.; Jia, P.; Li, L.; Chen, Z. Towards healthy China 2030: Modeling health care accessibility with patient referral. Soc. Sci. Med. 2021, 276, 113834. [Google Scholar] [CrossRef] [PubMed]
  56. Niu, Q.; Wang, Y.; Xia, Y.; Wu, H.; Tang, X. Detailed Assessment of the Spatial Distribution of Urban Parks According to Day and Travel Mode Based on Web Mapping API: A Case Study of Main Parks in Wuhan. Int. J. Environ. Res. Public Health 2018, 15, 1725. [Google Scholar] [CrossRef] [PubMed] [Green Version]
  57. Zhou, Y.; Li, Y.; Huang, Y.; Geng, E. Analysis of classification methods and activity characteristics of urban population based on social media data. J. Geo-Inf. Sci. 2017, 19, 1238–1244. [Google Scholar] [CrossRef]
  58. Wang, F.; Xu, Y. Estimating OD travel time matrix by Google Maps API: Implementation, advantages, and implications. Geogr. Inf. Sci. 2011, 17, 199–209. [Google Scholar] [CrossRef]
  59. Xu, M.; Xin, J.; Su, S.; Weng, M.; Cai, Z. Social inequalities of park accessibility in Shenzhen, China: The role of park quality, transport modes, and hierarchical socioeconomic characteristics. J. Transp. Geogr. 2017, 62, 38–50. [Google Scholar] [CrossRef]
  60. Zheng, Z.; Shen, W.; Li, Y.; Qin, Y.; Wang, L. Spatial equity of park green space using KD2SFCA and web map API: A case study of zhengzhou, China. Appl. Geogr. 2020, 123, 102310. [Google Scholar] [CrossRef]
  61. Xia, N.; Cheng, L.; Chen, S.; Wei, X.; Zong, W.; Li, M. Accessibility based on Gravity-Radiation model and Google Maps API: A case study in Australia. J. Transp. Geogr. 2018, 72, 178–190. [Google Scholar] [CrossRef]
  62. Zhou, X.; Kim, J. Social disparities in tree canopy and park accessibility: A case study of six cities in Illinois using GIS and remote sensing. Urban For. Urban Green. 2013, 12, 88–97. [Google Scholar] [CrossRef]
  63. Zheng, Z.; Xia, H.; Ambinakudige, S.; Qin, Y.; Li, Y.; Xie, Z.; Zhang, L.; Gu, H. Spatial Accessibility to Hospitals Based on Web Mapping API: An Empirical Study in Kaifeng, China. Sustainability 2019, 11, 1160. [Google Scholar] [CrossRef] [Green Version]
  64. Beijing Municipal Bureau Statistics. Available online: http://tjj.beijing.gov.cn/tjsj_31433/ (accessed on 29 November 2021).
  65. AutoNavi. Available online: https://report.amap.com/download_city.do (accessed on 29 November 2021).
  66. Beijing Transport Institute. Available online: https://www.bjtrc.org.cn/List/index/cid/7.html (accessed on 2 February 2022).
  67. Bondarenko, M.; Kerr, D.; Sorichetta, A.; Tatem, A.J. Census/Projection-Disaggregated Gridded Population Datasets for 189 Countries in 2020 Using Built-Settlement Growth Model (BSGM) Outputs; WorldPop. University of Southampton: Southampton, UK, 2020. [Google Scholar] [CrossRef]
  68. The People’s Government of Beijing Municipality. Available online: http://www.beijing.gov.cn/gongkai/shuju/sjjd/202105/t20210519_2392886.html (accessed on 2 February 2022).
  69. Beijing City Lab. Available online: https://www.beijingcitylab.com/ (accessed on 2 February 2022).
  70. Beijing Platform for Common Geospatial Information Services. Available online: https://beijing.tianditu.gov.cn/ (accessed on 2 February 2022).
  71. Xiao, H.; Zhang, H.; Wang, D.; Shen, C.; Naghavi, M. Impact of smoke-free legislation on acute myocardial infarction and stroke mortality: Tianjin, China, 2007–2015. Tob. Control 2019, 29, 54477. [Google Scholar] [CrossRef] [PubMed] [Green Version]
  72. Jia, E.Z.; Xu, Z.X.; Cai, H.Z.; Guo, C.Y.; Li, L.; Zhu, T.B.; Wang, L.S.; Cao, K.J.; Ma, W.Z.; Yang, Z.J. Time distribution of the onset of chest pain in subjects with acute ST-Elevation myocardial infarction: An Eight-Year, Single-Center study in china. PLoS ONE 2012, 7, 32478. [Google Scholar] [CrossRef]
  73. Hopstock, L.A.; Wilsgaard, T.; Njolstad, I.; Mannsverk, J.; Mathiesen, E.B.; Lochen, M.L.; Bonaa, K.H. Seasonal variation in incidence of acute myocardial infarction in a sub-Arctic population: The Troms Study 1974–2004. Eur. J. Cardiov. Prev. Rehabil. 2011, 18, 320–325. [Google Scholar] [CrossRef]
  74. Manfredini, R.; Boari, B.; Smolensky, M.H.; Salmi, R.; Gallerani, M.; Guerzoni, F.; Guerra, V.; Malagoni, A.M.; Manfredini, F. Seasonal Variation in Onset of Myocardial Infarction—a 7-year single-center study in Italy. Chronobiol. Int. 2005, 22, 1121–1135. [Google Scholar] [CrossRef]
  75. Marchant, B.; Ranjadayalan, K.; Stevenson, R.; Wilkinson, P.; Timmis, A.D. Circadian and seasonal factors in the pathogenesis of acute myocardial infarction: The influence of environmental temperature. Heart 1993, 69, 385–387. [Google Scholar] [CrossRef]
  76. Marshall, R.J.; Robert, S.; Paul, B. An analysis of the seasonal variation of coronary heart disease and respiratory disease mortality in new zealand. Int. J. Epidemiol. 1988, 17, 325–331. [Google Scholar] [CrossRef] [Green Version]
  77. Mcelroy, J.A.; Remington, P.L.; Trentham-Dietz, A.; Robert, S.A.; Newcomb, P.A. Geocoding addresses from a large population-based study: Lessons learned. Epidemiology 2003, 14, 399–407. [Google Scholar] [CrossRef]
  78. Watson, D.F.; Philip, G.M. A refinement of inverse distance weighted interpolation. Geoprocessing 1985, 2, 315–327. [Google Scholar]
  79. Philip, G.M.; Watson, D.F. A Precise method for determining countoured surfaces. APPEA J. 1982, 22, 205–212. [Google Scholar] [CrossRef]
Figure 1. Location of the study area in Beijing.
Ijgi 11 00137 g001
Figure 2. The spatial distribution pattern of demographic and residential areas data in Shijingshan District.
Ijgi 11 00137 g002
Figure 3. Methods workflow.
Ijgi 11 00137 g003
Figure 4. AMI emergency treatment process.
Ijgi 11 00137 g004
Figure 5. The average AMI accessibility travel time on weekdays in Shijingshan District.
Ijgi 11 00137 g005
Figure 6. Distribution of AMI accessibility travel time compliance rates in four time periods on weekdays in Shijingshan District.
Ijgi 11 00137 g006
Figure 7. Time-frequency distribution of AMI accessibility travel time on weekdays in Shijingshan District.
Ijgi 11 00137 g007
Figure 8. Spatial pattern of AMI hospital accessibility during different periods on weekdays in the Shijingshan District.
Ijgi 11 00137 g008
Figure 9. The average AMI accessibility travel time on weekdays and weekends in Shijingshan District.
Ijgi 11 00137 g009
Figure 10. Distribution of AMI accessibility travel time compliance rates in four time periods on weekends in Shijingshan District.
Ijgi 11 00137 g010
Figure 11. Time-frequency distribution of AMI accessibility travel time on weekends in Shijingshan District.
Ijgi 11 00137 g011
Figure 12. Spatial pattern of AMI hospital accessibility during different peak periods on weekends in the Shijingshan District.
Ijgi 11 00137 g012
Figure 13. Total spatial pattern of AMI hospital accessibility in Shijingshan District.
Ijgi 11 00137 g013
Figure 14. Spatial distribution of emergency travel distance to PCI hospitals in Shijingshan District.
Ijgi 11 00137 g014
Figure 15. Spatial pattern of population and residential area density and medical accessibility in Shijingshan District.
Ijgi 11 00137 g015
Figure 16. The proportion of population numbers under different accessibility time standards in the Shijingshan District.
Ijgi 11 00137 g016
Publisher’s Note: MDPI stays neutral with regard to jurisdictional claims in published maps and institutional affiliations.

