
Operation Status Comparison Monitoring of China’s Southeast Asian Industrial Parks before and after COVID-19 Using Nighttime Lights Data

 ,
,  ,
,  ,
, 
Abstract
:1. Introduction
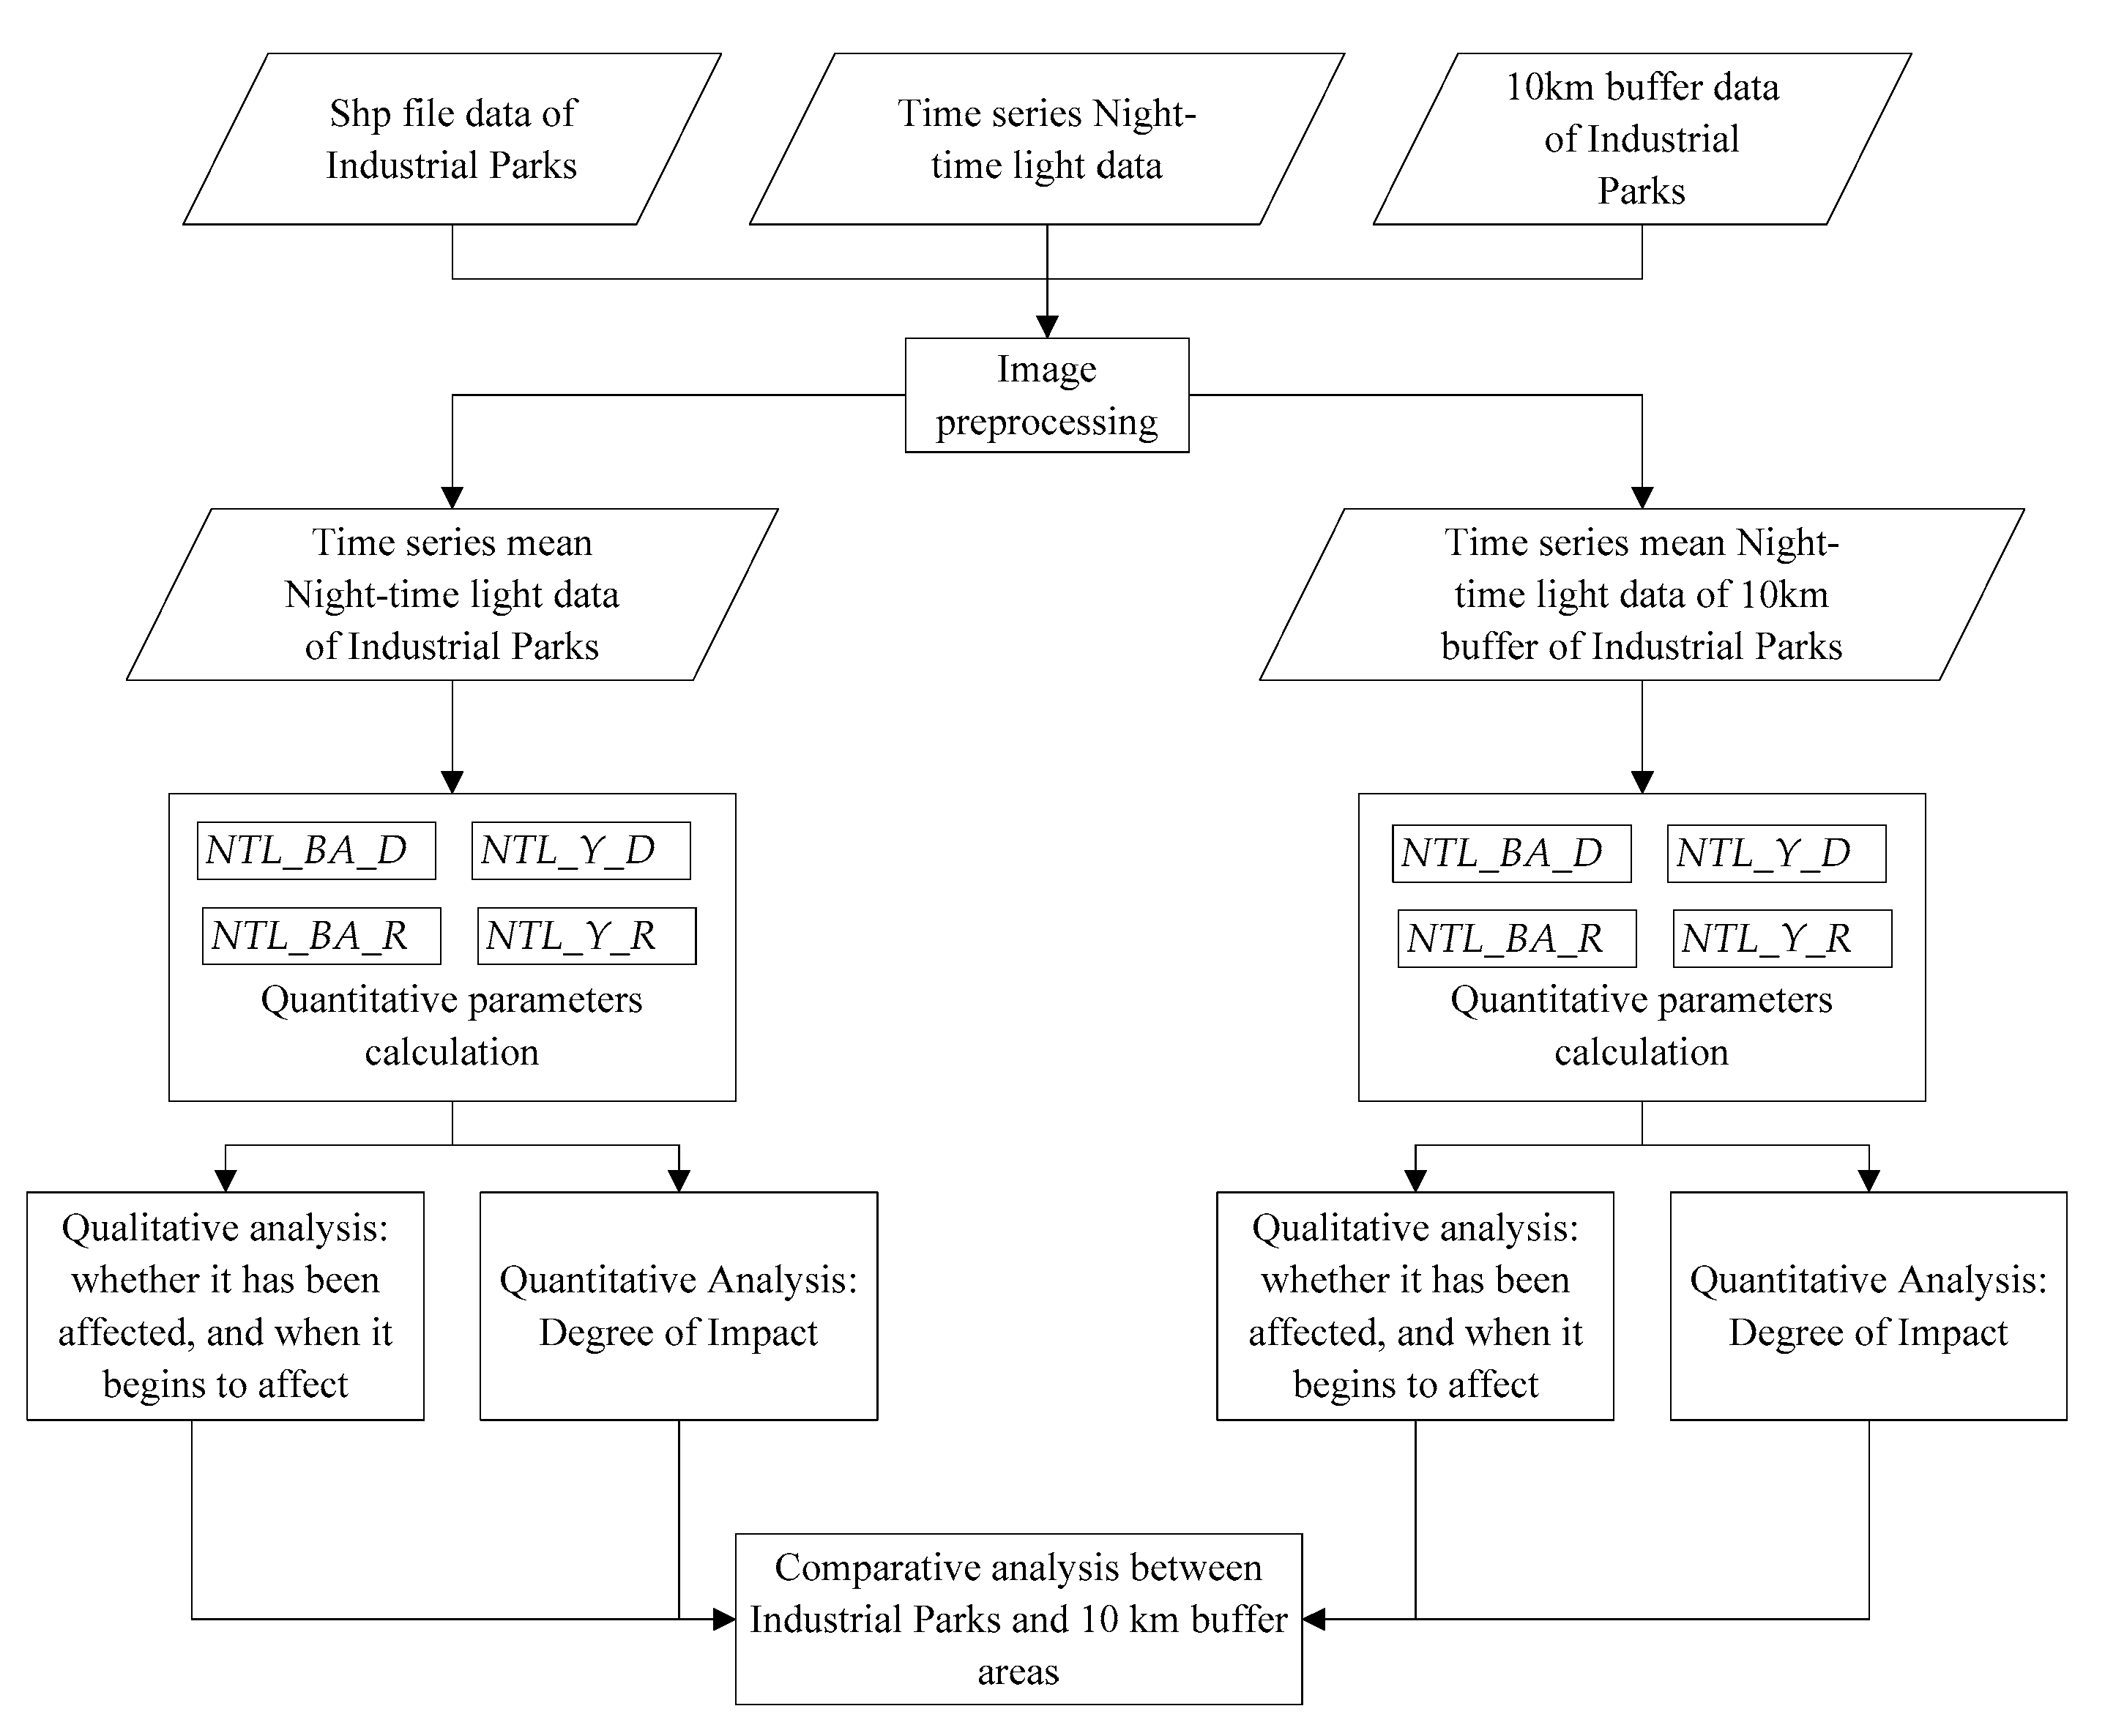
2. Methods
2.1. Method Input and Processing Steps
2.2. Calculation of Quantitative Parameters
2.2.1. Parameters Calculation for Comparing with the Pre-epidemic Situation
2.2.2. Parameters Calculation for Comparison with the Same Month in 2019
2.3. Qualitative Analysis of the Operation of Parks after the Outbreak of COVID-19
2.4. Quantitative Analysis of the Impact of the COVID-19 Epidemic
2.5. NTL Comparison of Foreign Parks and 10 km Buffer Zones
3. Method Test and Results
3.1. Study Area and Data
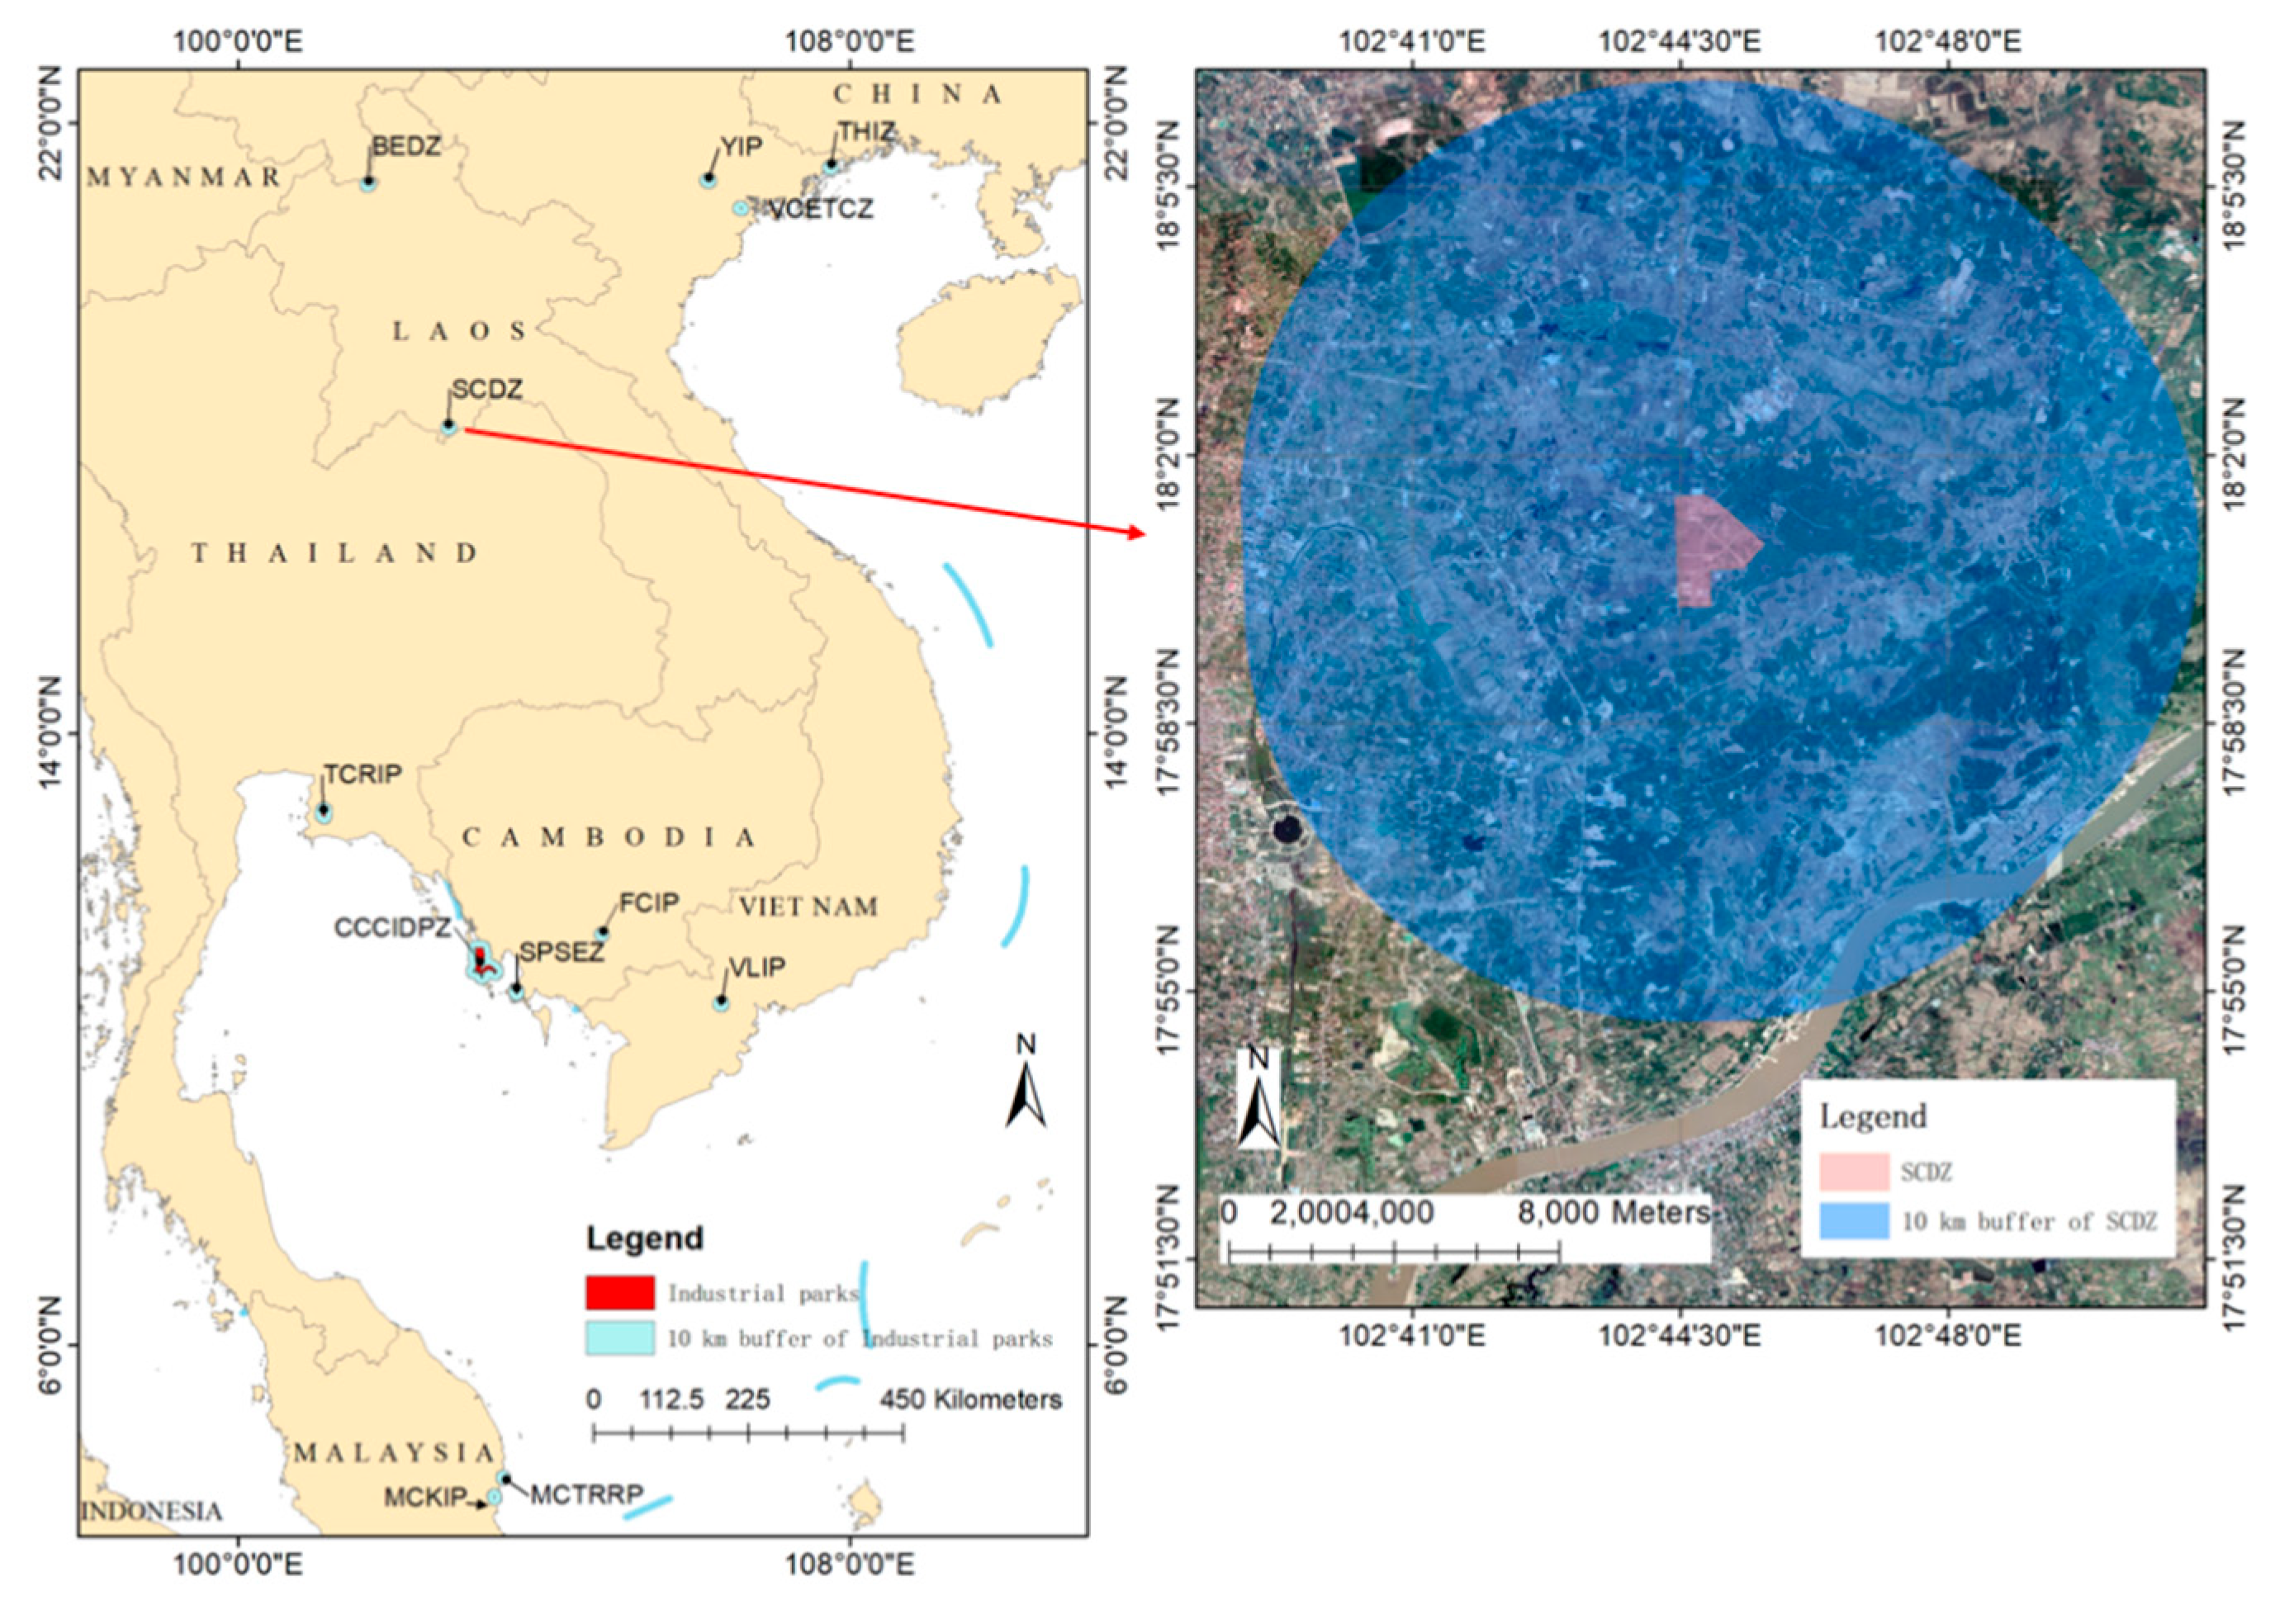
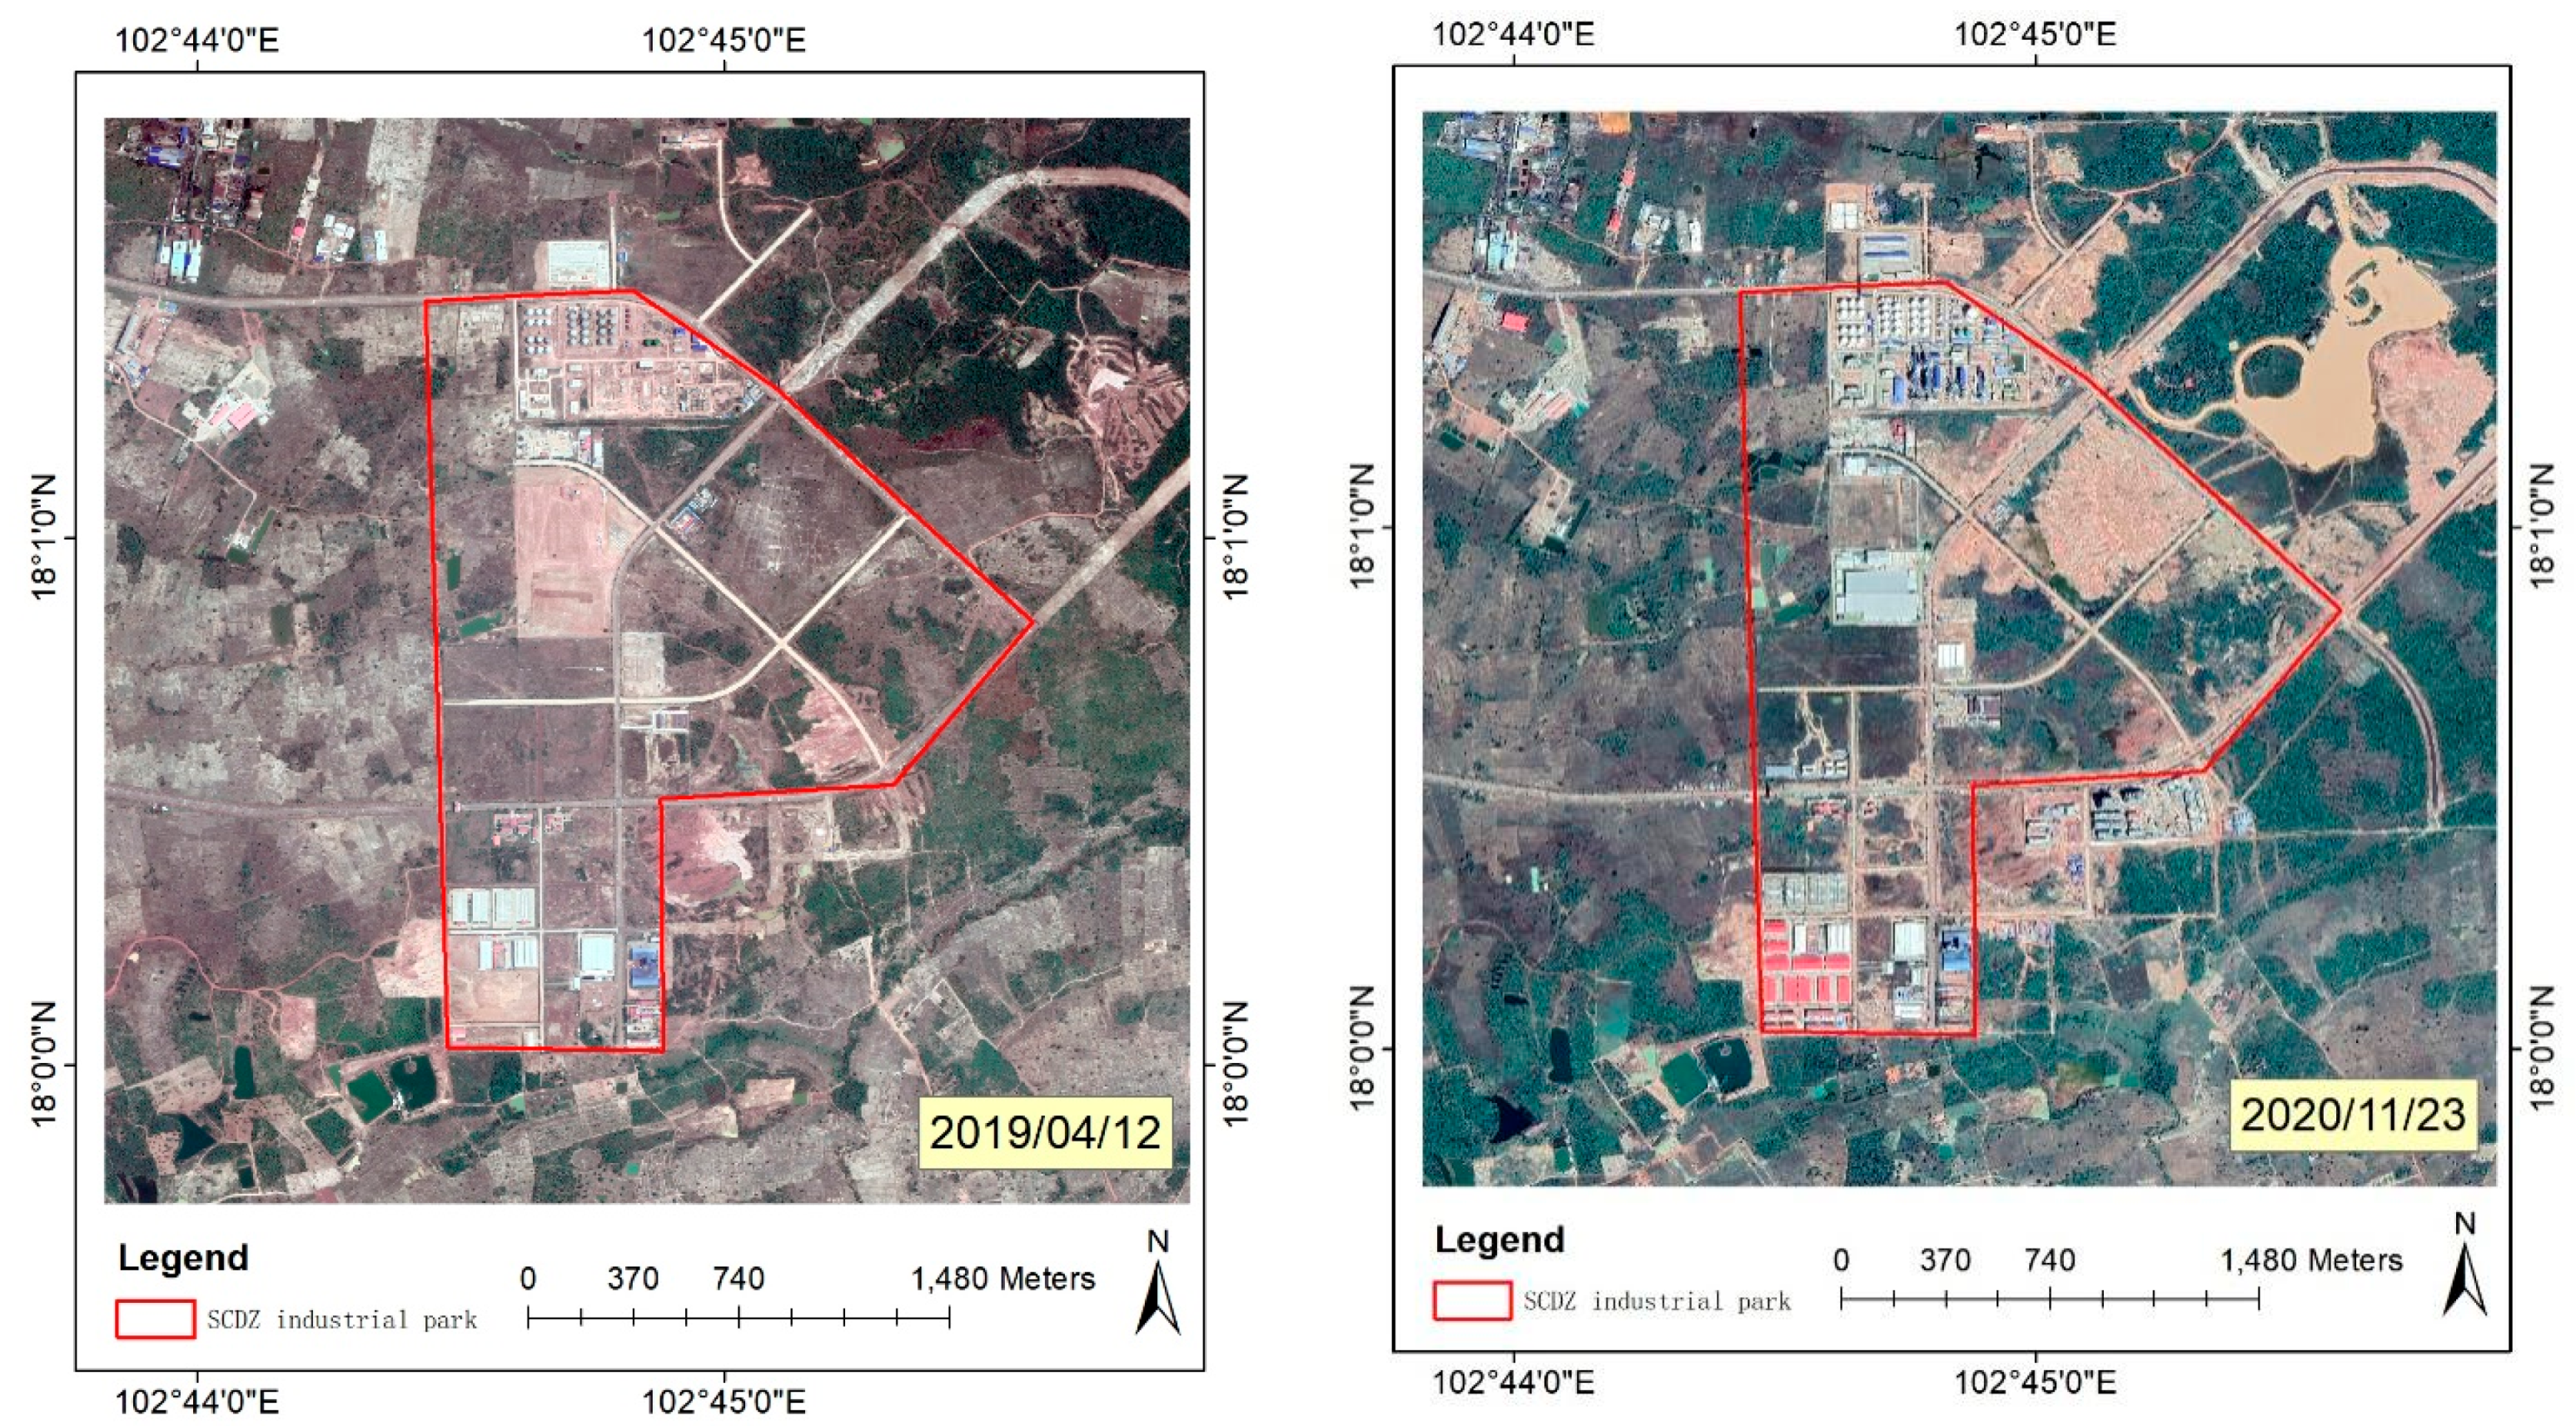
3.1.1. Study Area
3.1.2. Data and Data Preprocessing
Dataset
Data Preprocessing
- (1)
- Since cloud and stray light was removed in monthly products by the EOG, additional cloud and stray light removal processes were not needed.
- (2)
- Removal of background and invalid values. Pixels with poor-quality data due to cloud cover or solar illumination were set to zero. In addition, there was very little background noise in the NTL data. These zero invalid values and ground noise should be removed when the mean or sum NTL values are calculated. Ghosh et al. (2020) removed such ground noise by masking NTL values < 0.6 nanowatt/cm2/sr while calculating the summed NTL values for India [15]. Here, ten regions of interest without human activity in Southeast Asia were selected to calculate the background noise value. The mean NTL value of these ten regions was 0.5 nanowatt/cm2/sr. Therefore, NTL values < 0.5 nanowatt/cm2/sr in each month NTL dataset were set to -NaN values to remove background and invalid values. NTL data of Parks with background and invalid values of more than 50% were also removed to ensure the high quality of the data used.
- (3)
- Due to the small size of certain parks, the number of pixels covering these parks turned out to be low. This could result in outliers when statistical means are calculated. To increase the number of pixels, we resampled the NTL imagery to 100 m using the nearest neighboring pixel method in ENVI 4.3 software (ITT Industries, Inc., Boulder, CO, USA).
- (4)
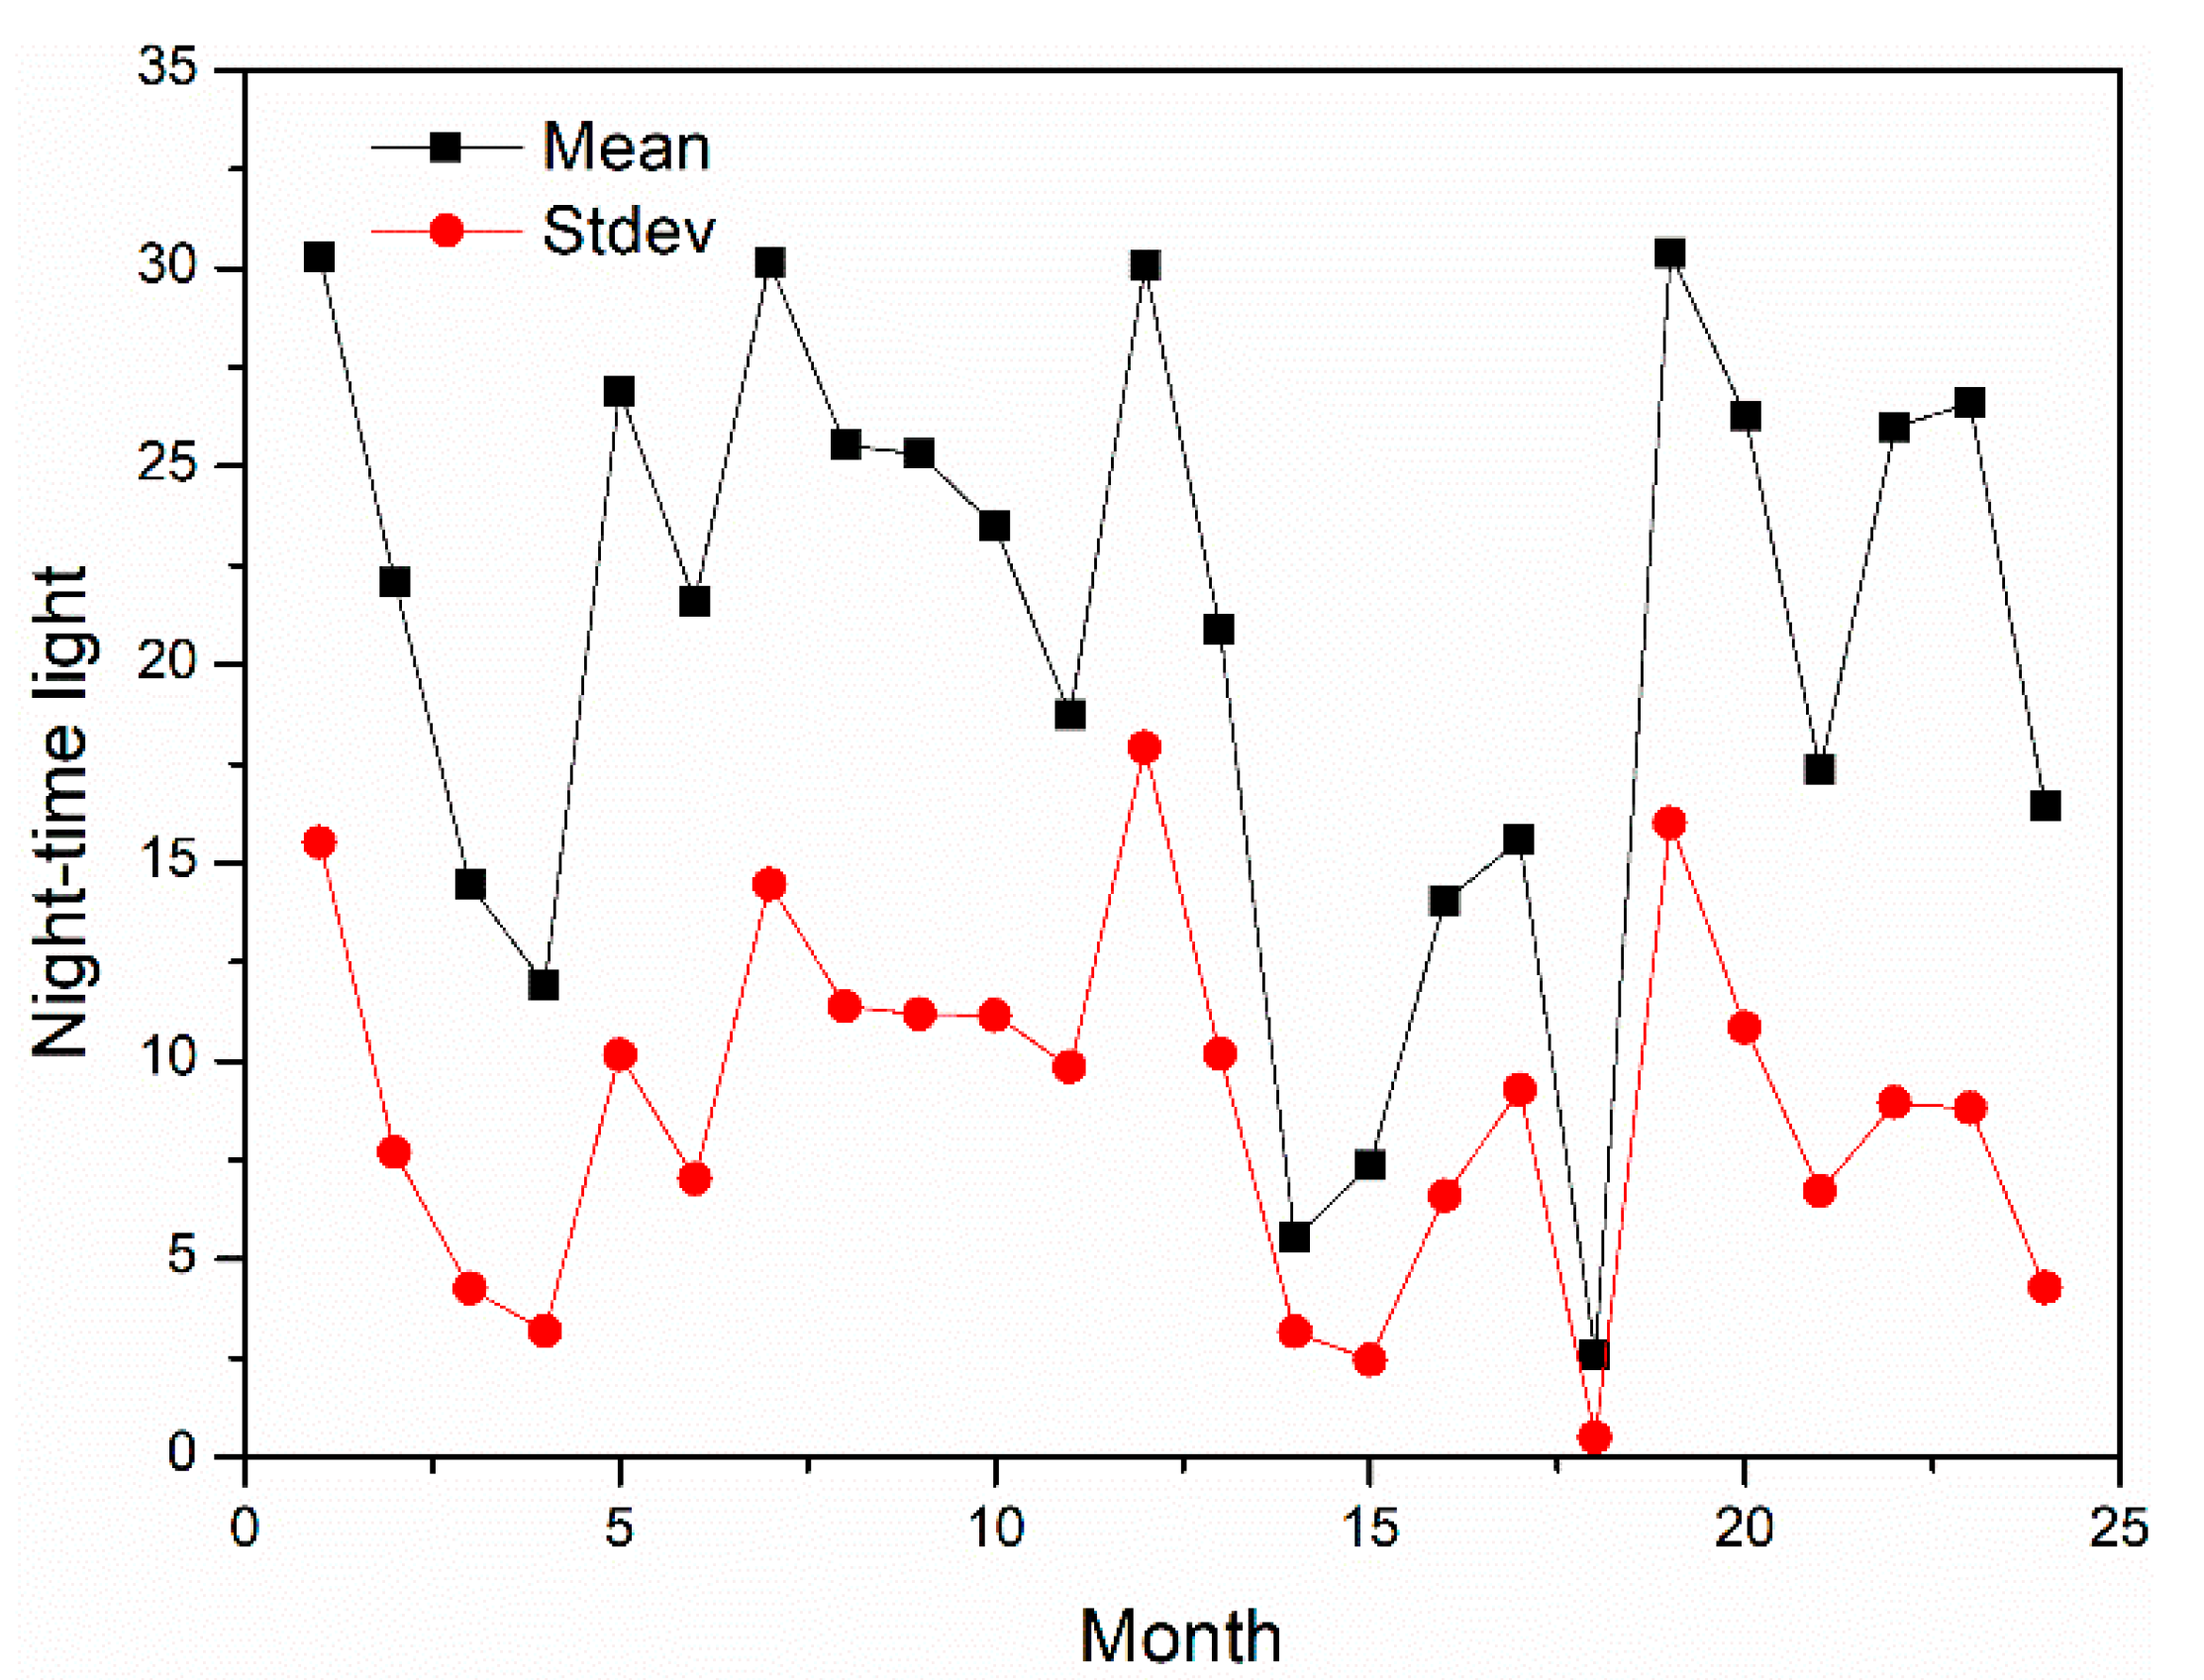
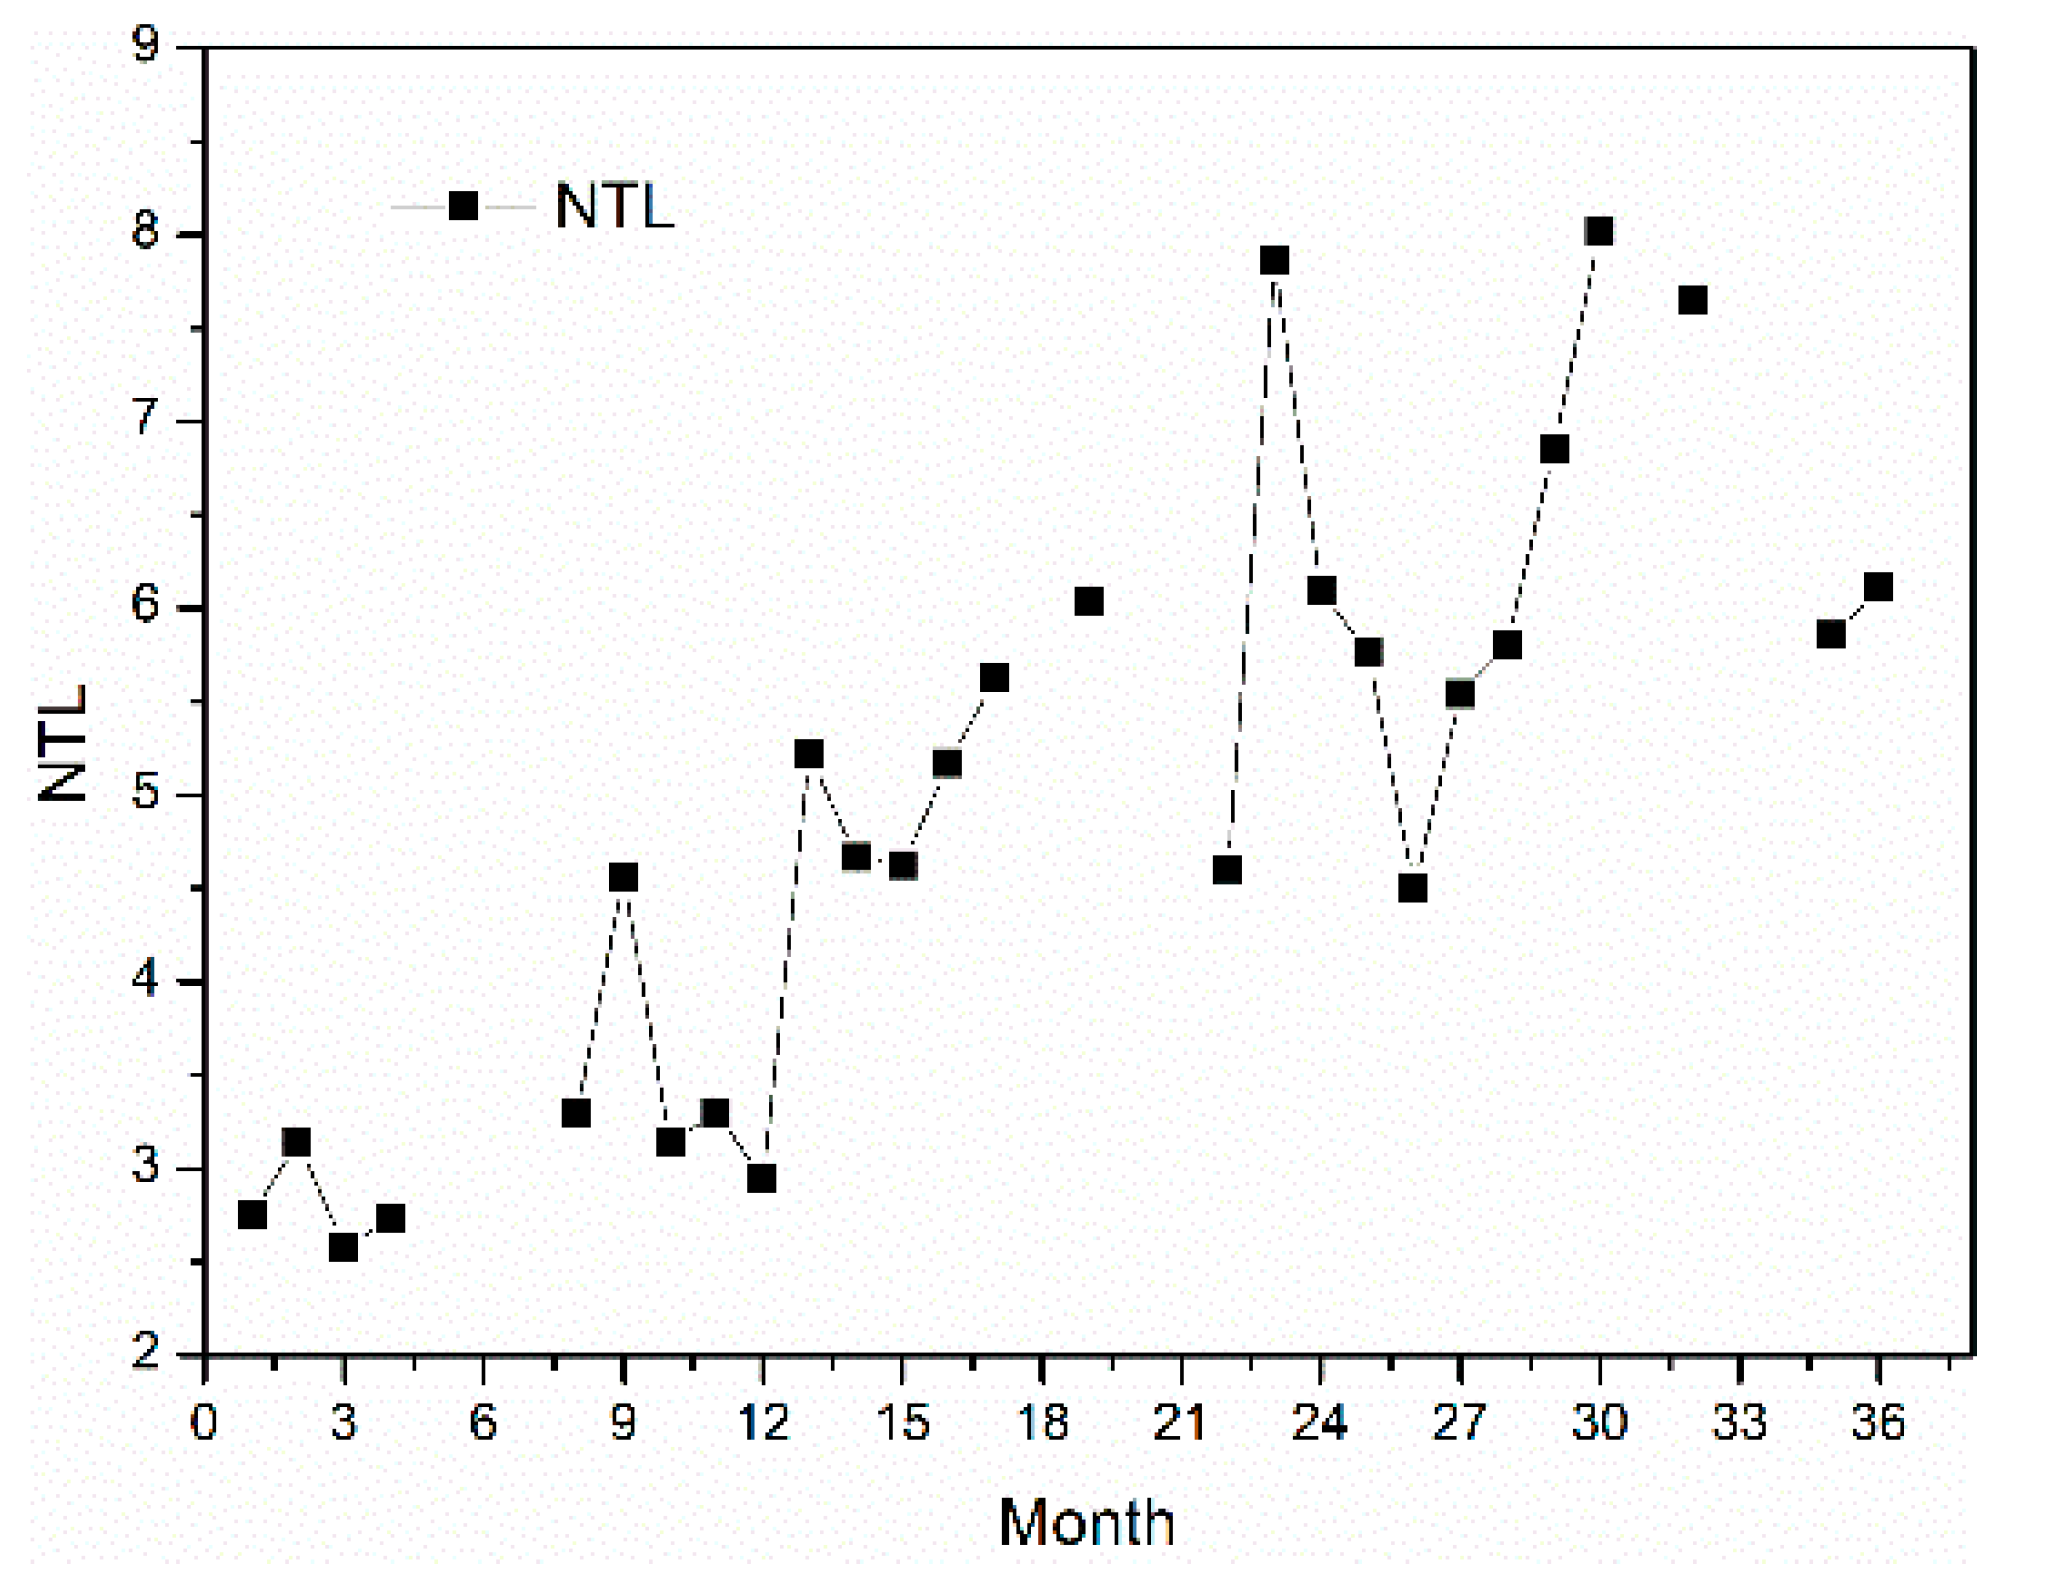
- The monthly mean NTL values of each CIPSA park and in 10 km buffer zones around each CIPSA in 2018, 2019, and 2020 were calculated using the statistical tools in ENVI 5.3 software. Figure 4 shows the monthly mean and standard deviation (Stdev) nighttime light values of Yunzhong Industrial Park, Beijiang Province, Vietnam, from January 2019 to December 2020.
- (5)
- The monthly mean NTL values were used to calculate the NTL index, and the operation status before and after the outbreak were compared.
3.2. Results
3.2.1. Results of China’s Southeast Asian Industrial Parks Operation Monitoring
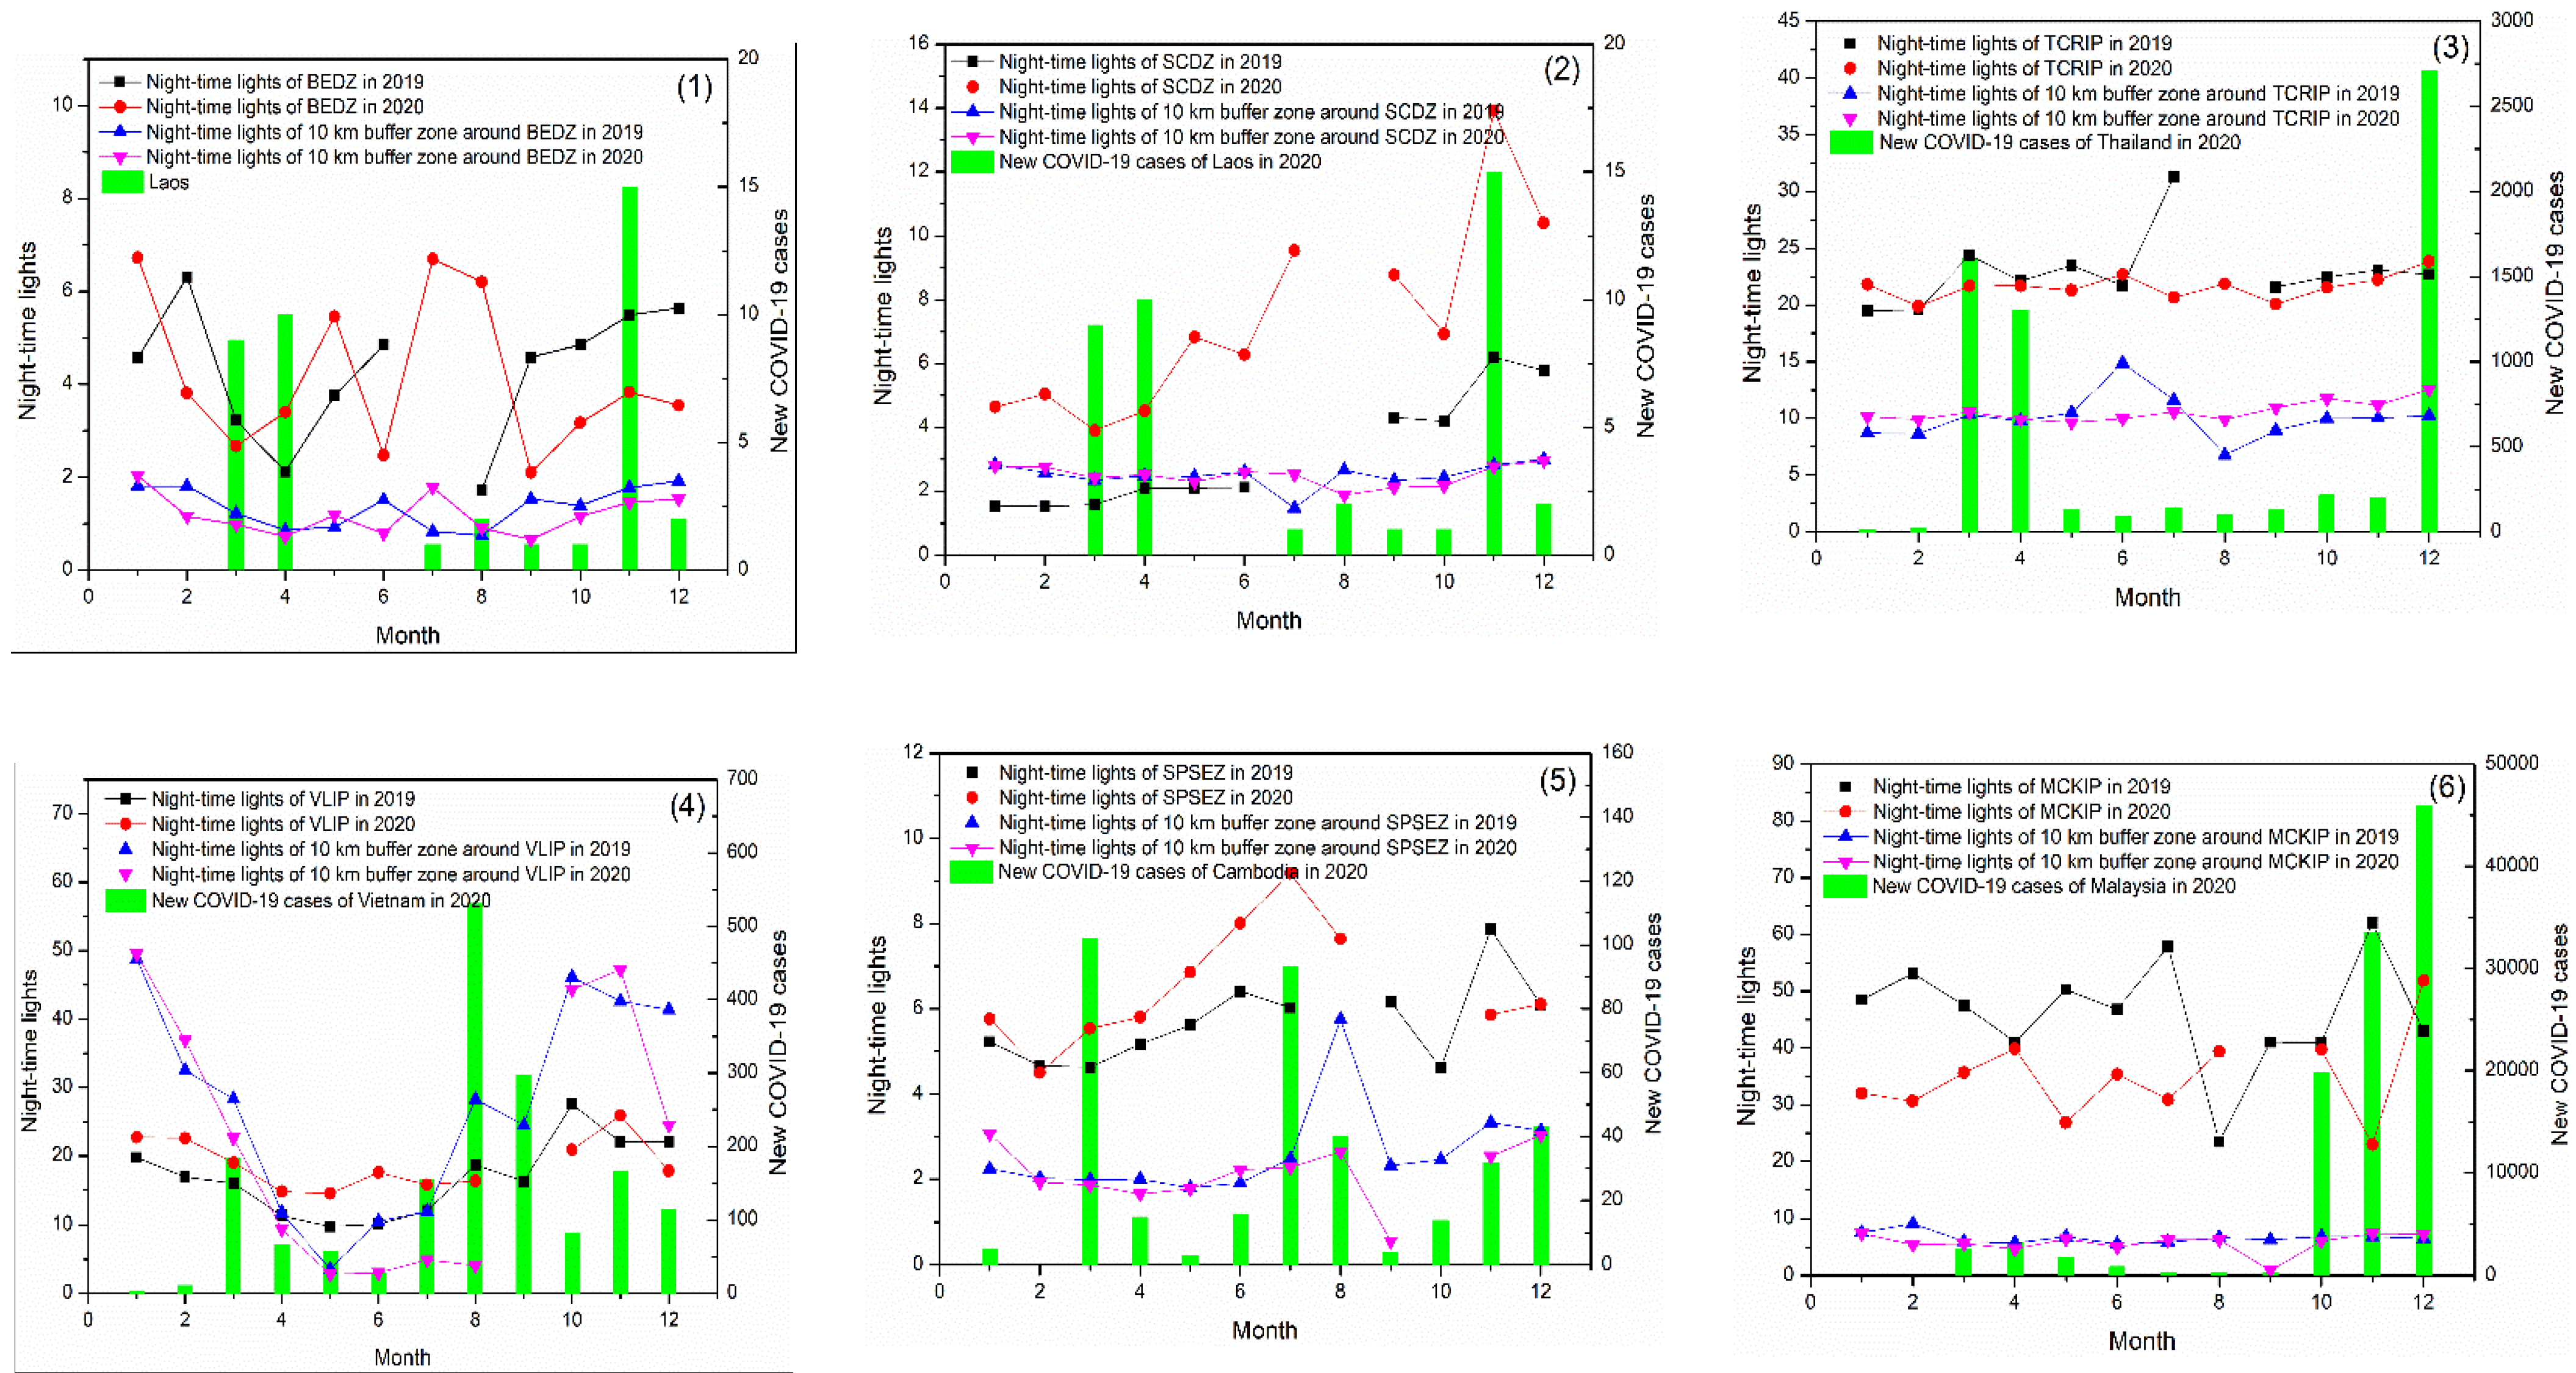
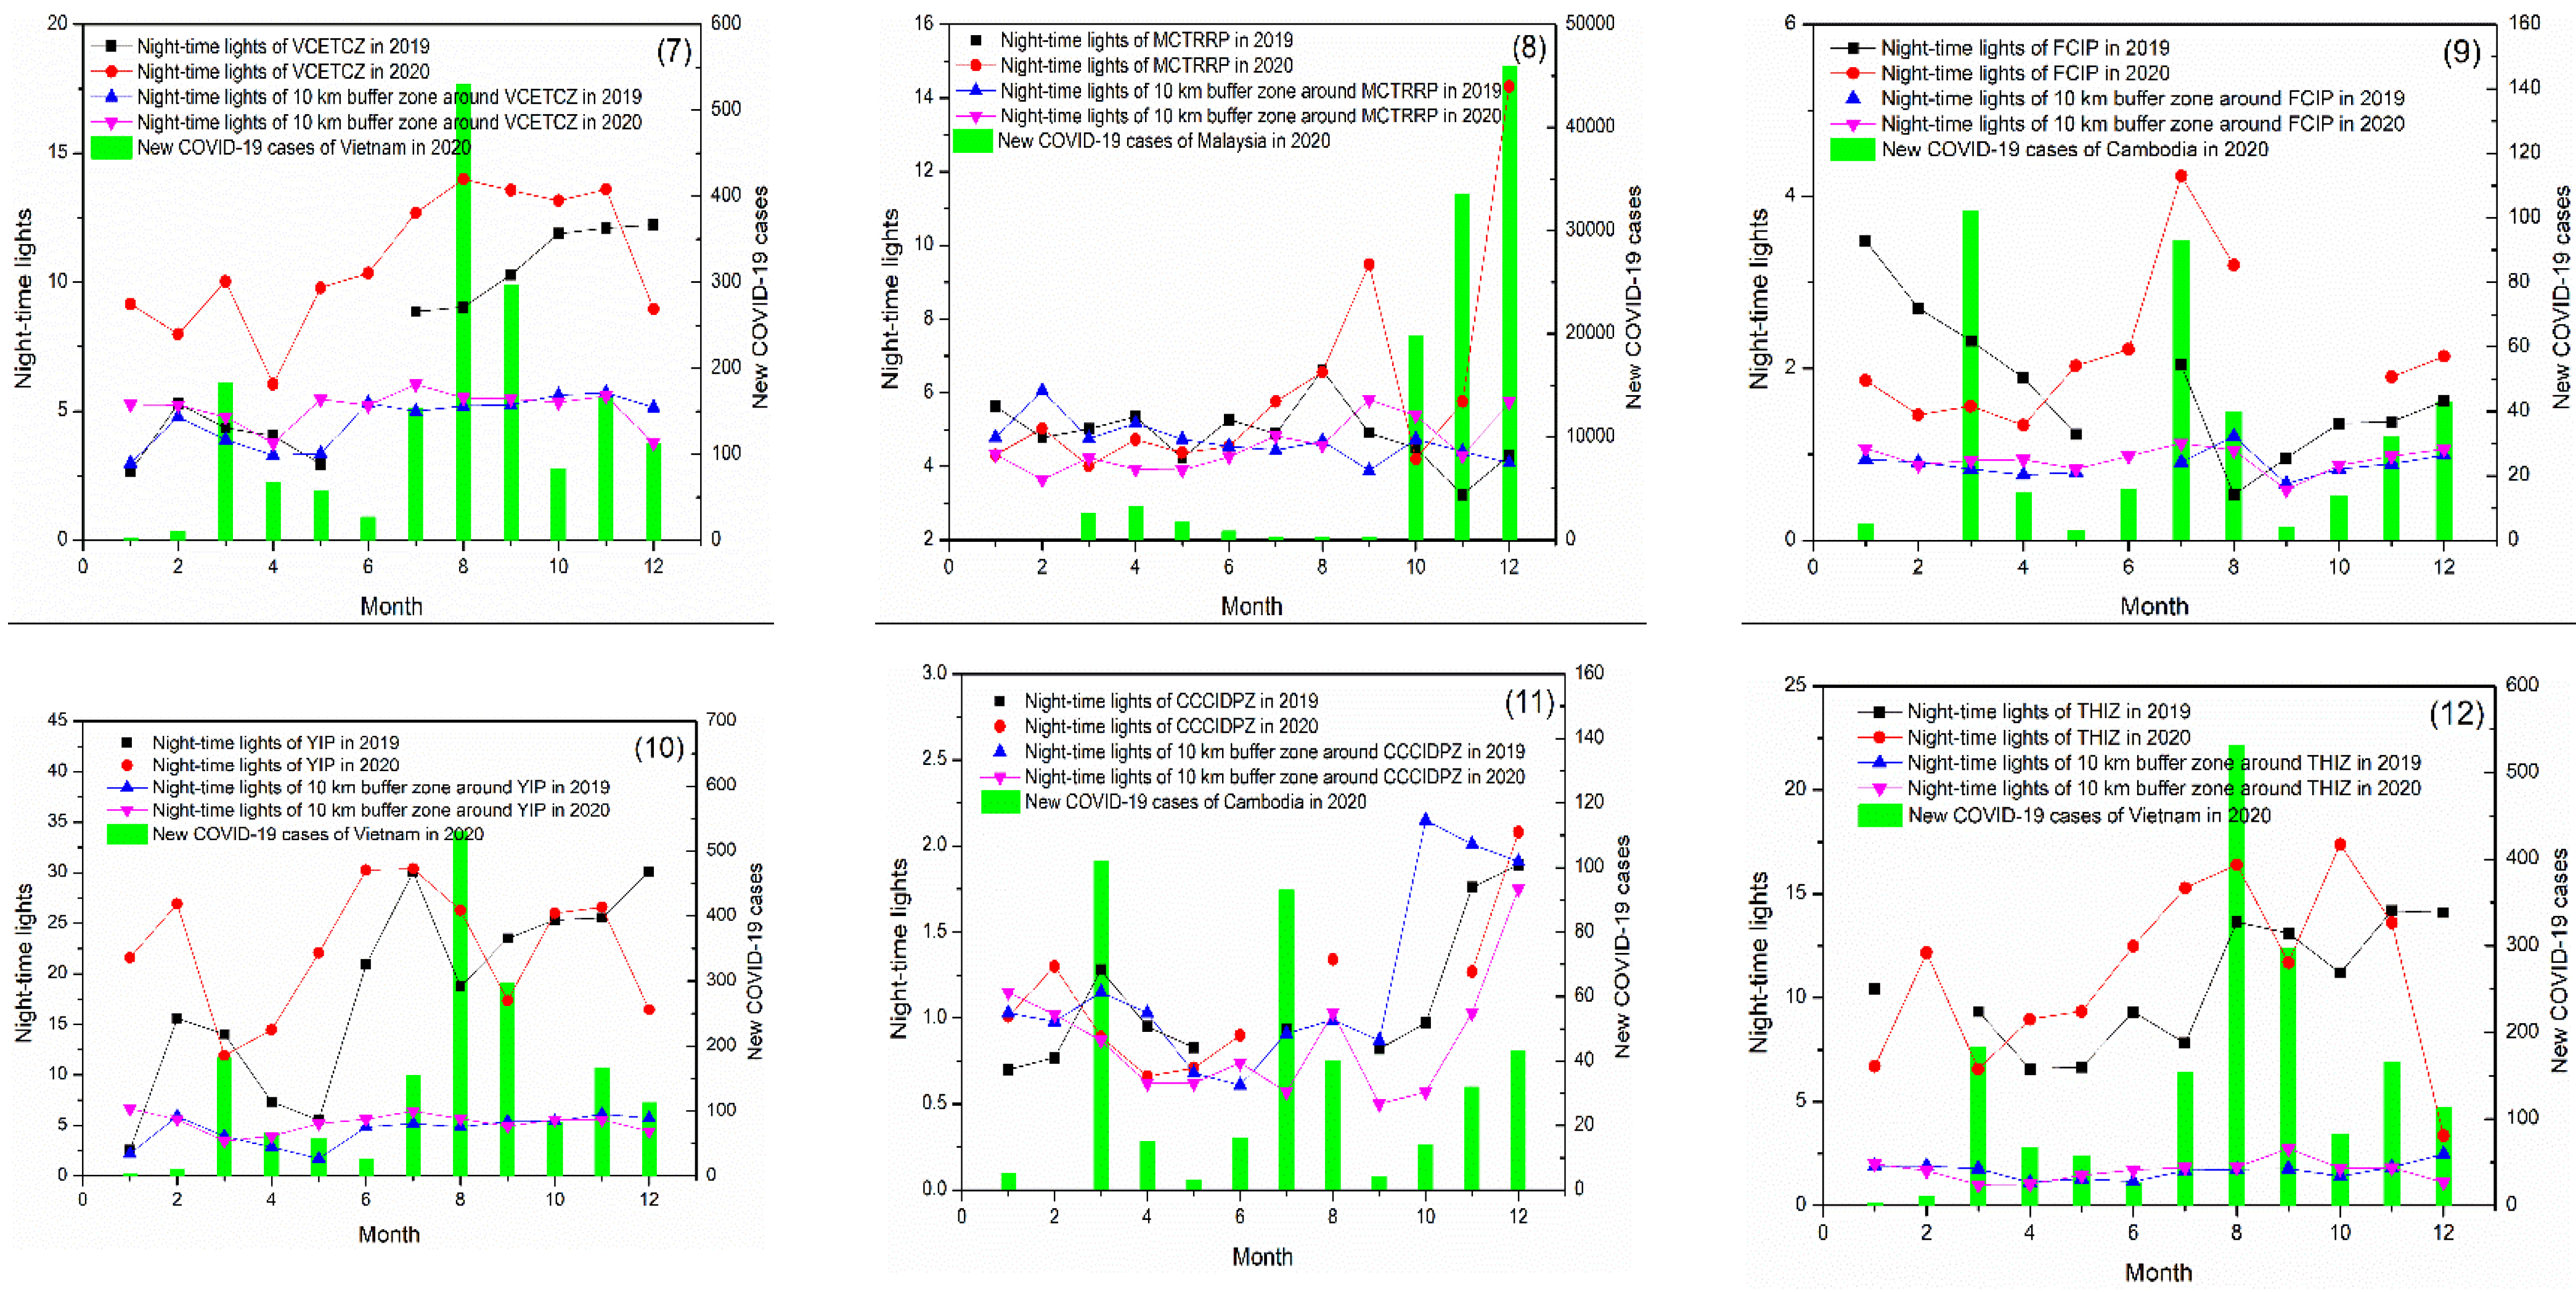
Results of Qualitative Analysis of Parks
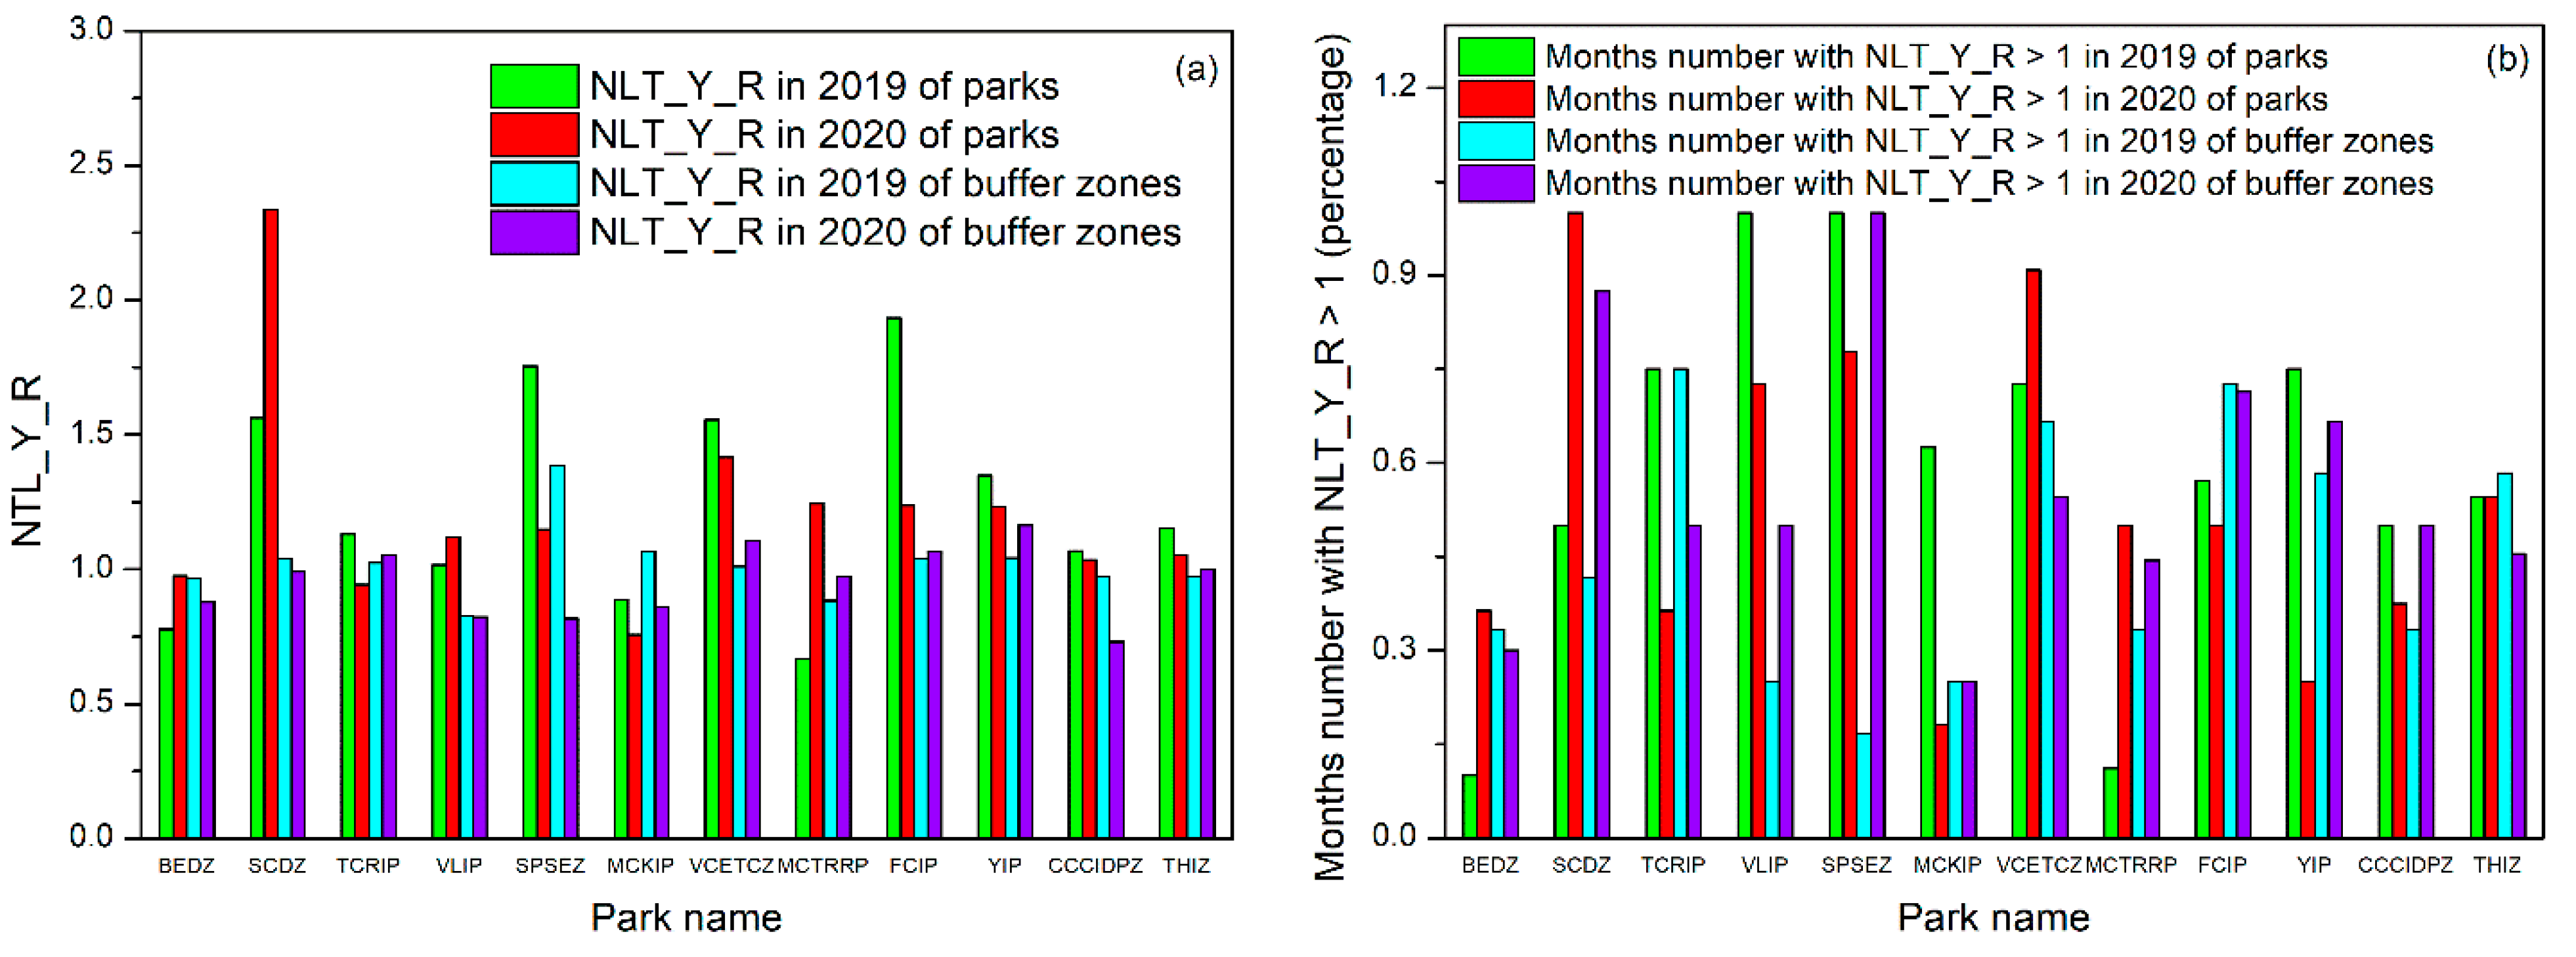
Results of Quantitative Parameter Analysis of Parks
3.2.2. Comparison of the Impacts of COVID-19 on Foreign Enterprises and Local Areas
Results of Qualitative Analysis of 10 km Buffer of Parks
Comparison between the Parks and of 10 km Buffer
4. Discussion
4.1. Comparison of 2018, 2019, and 2020
4.2. Impacts of COVID-19 Prevention and Control Measures on New COVID-19 Cases and the Economy
4.3. Influence of Land-Use Types
4.4. Limitations
- (1)
- Southeast Asia is cloudy and rainy. Due to the influence of clouds, there are a large number of default values in the daily and monthly NTL data in this area. This limits the sensitivity of using NTL data to monitor the operation of the park, making it difficult to catch short-term changes in operation. In less cloudy areas, daily NTL data can be considered to increase the sensitivity of monitoring.
- (2)
- The spatial resolution of NTL data acquired by VIIRS is 500 m. Some industrial parks are very small. This makes them difficult to monitor using VIIRS NTL data. On 5 November 2021, China launched the Sustainable Development Science Satellite 1 (SDGSAT-1). It was equipped with a night light sensor with a 10 m resolution. The use of high-resolution night light data was more suitable for the monitoring of park targets.
- (3)
- The COVID-19 data used in this study were national-scale data and the night lighting data were gridded data. The difference in data scales means that we can only discuss the relationships between the number of COVID-19 cases, the NTL index and COVID-19 prevention, as well as control measures. Detailed analysis of the relationships between these three factors requires data with consistent scales. For example, national-scale NTL and COVID-19 data can be used together to analyze the impact of COVID-19 on national economics.
- (4)
- NTL data can be utilized to monitor the overall operation of the park. However, the operation of the park is affected by many factors, such as raw material supply, energy supply, personnel mobility, and market fluctuations. More data is required to analyze the specific impact of COVID-19.
5. Conclusions
- (1)
- Despite the negative impact of COVID-19, 9 of the 12 parks had a NTL_Y_R2020 index greater than 1, indicating that these parks were in better operating condition in 2020 than in 2019. However, there were nine parks whose NTL_Y_R2020 index was lower than the NTL_Y_R2019 index. This indicates that due to the impact of COVID-19, the growth rate of the park had declined.
- (2)
- The 2019 NTL curve and the 2020 NTL curve of 11 parks intersect. This indicates that the operation of these parks in 2020 was fluctuating, from being sometimes worse than that in 2019 and sometimes better. The maximum NTL_Y_D values of 11 of the parks which were used to evaluate the maximum monthly decline was greater than 0, with a mean maximum NTL_Y_D of 32.05%. The maximum NTL_Y_D values of three of the parks increased by more than 50%.
- (3)
- Compared to pre- COVID-19, there are 10 parks with a NTL_BA_R index greater than 1, indicating that these parks were in better operating condition post-COVID-19 than pre-COVID-19. However, NTL_BA_D values of 11 of the parks were greater than 0, with a mean NTL_BA_D of 24.42%, which means that the NTL values of these parks in a month were lower than pre-COVID-19.
- (4)
- The impact of COVID-19 on surrounding areas was greater than the impact on the parks. Seven 10 km buffer zones around the parks showed a decline in NTL (NTL_Y_R < 1), while only three parks demonstrated a decline after the outbreak of COVID-19. Further, compared to the same period in the previous year, the parks also recovered better than the buffer zones, with the parks recovering 1–5 months earlier than their respective buffer zones.
- (5)
- The impact of COVID-19 on city areas was greater than that in rural areas in terms of both the mean NTL_BA_D and mean maximum NTL_Y_D values, in both parks and their 10 km buffer zones. Further, rural parks showed better recovery than urban parks.
Author Contributions
Funding
Institutional Review Board Statement
Informed Consent Statement
Data Availability Statement
Conflicts of Interest
References
- XIN Wang ANET. Spotlight: IMF Revises down Global Economy Forecast amid Mounting COVID-19 Fallout, Warning of Rec-ord Debt Levels. Available online: http://www.xinhuanet.com/english/2020-06/25/c_139164949.htm (accessed on 20 April 2021).
- Chinadaily. COVID-19 a “Labor Market Crisis”. Available online: https://www.chinadailyhk.com/article/126024 (accessed on 20 April 2021).
- Croft, T.A. Burning Waste Gas in Oil Fields. Nature 1973, 245, 375–376. [Google Scholar] [CrossRef]
- Donaldson, D.; Storeygard, A. The View from Above: Applications of Satellite Data in Economics. J. Econ. Perspect. 2016, 30, 171–198. [Google Scholar] [CrossRef] [Green Version]
- Doll, C.N.; Muller, J.-P.; Morley, J.G. Mapping regional economic activity from night-time light satellite imagery. Ecol. Econ. 2006, 57, 75–92. [Google Scholar] [CrossRef]
- Henderson, J.V.; Storeygard, A.; Weil, D.N. Measuring Economic Growth from Outer Space. Am. Econ. Rev. 2012, 102, 994–1028. [Google Scholar] [CrossRef] [Green Version]
- Chen, X.; Nordhaus, W.D. Using luminosity data as a proxy for economic statistics. Proc. Natl. Acad. Sci. USA 2011, 108, 8589–8594. [Google Scholar] [CrossRef] [Green Version]
- Galimberti, J.K. Forecasting GDP Growth from Outer Space. Oxf. Bull. Econ. Stat. 2020, 82, 697–722. [Google Scholar] [CrossRef] [Green Version]
- Hu, Y.; Zhang, Y. Global Nighttime Light Change from 1992 to 2017: Brighter and More Uniform. Sustainability 2020, 12, 4905. [Google Scholar] [CrossRef]
- Henderson, J.V.; Squires, T.; Storeygard, A.; Weil, D. The Global Distribution of Economic Activity: Nature, History, and the Role of Trade1. Q. J. Econ. 2018, 133, 357–406. [Google Scholar] [CrossRef]
- Wang, X.; Sutton, P.C.; Qi, B. Global Mapping of GDP at 1 km2 Using VIIRS Nighttime Satellite Imagery. ISPRS Int. J. Geo-Information 2019, 8, 580. [Google Scholar] [CrossRef] [Green Version]
- Li, X.; Zhan, C.; Tao, J.; Li, L. Long-Term Monitoring of the Impacts of Disaster on Human Activity Using DMSP/OLS Nighttime Light Data: A Case Study of the 2008 Wenchuan, China Earthquake. Remote Sens. 2018, 10, 588. [Google Scholar] [CrossRef] [Green Version]
- Wang, R.; Wan, B.; Guo, Q.; Hu, M.; Zhou, S. Mapping Regional Urban Extent Using NPP-VIIRS DNB and MODIS NDVI Data. Remote Sens. 2017, 9, 862. [Google Scholar] [CrossRef] [Green Version]
- Liu, Q.; Sha, D.; Liu, W.; Houser, P.; Zhang, L.; Hou, R.; Lan, H.; Flynn, C.; Lu, M.; Hu, T.; et al. Spatiotemporal Patterns of COVID-19 Impact on Human Activities and Environment in Mainland China Using Nighttime Light and Air Quality Data. Remote Sens. 2020, 12, 1576. [Google Scholar] [CrossRef]
- Ghosh, T.; Elvidge, C.; Hsu, F.-C.; Zhizhin, M.; Bazilian, M. The Dimming of Lights in India during the COVID-19 Pandemic. Remote Sens. 2020, 12, 3289. [Google Scholar] [CrossRef]
- Elvidge, C.; Ghosh, T.; Hsu, F.-C.; Zhizhin, M.; Bazilian, M. The Dimming of Lights in China during the COVID-19 Pandemic. Remote Sens. 2020, 12, 2851. [Google Scholar] [CrossRef]
- Yin, R.; He, G.; Jiang, W.; Peng, Y.; Gong, C. Night-Time Light Imagery Reveals China’s City Activity during the COVID-19 Pandemic Period in Early 2020. IEEE J. Sel. Top. Appl. Earth Obs. Remote Sens. 2021, 14, 5111–5122. [Google Scholar] [CrossRef]
- Nguyen, H.T.T.; Nguyen, T.T.; Dam, V.A.T.; Nguyen, L.H.; Vu, G.T.; Nguyen, H.T.; Le, H.T. COVID-19 Employment Crisis in Vietnam: Global Issue, National Solutions. Front. Public Health 2020, 8, 590074. [Google Scholar] [CrossRef]
- Goldsztejn, U.; Schwartzman, D.; Nehorai, A. Public policy and economic dynamics of COVID-19 spread: A mathematical modeling study. PLoS ONE 2020, 15, e0244174. [Google Scholar] [CrossRef]
- Pan, W.; Huang, G.; Shi, Y.; Hu, C.; Dai, W.; Pan, W.; Rongsheng, H. COVID-19: Short-Term Influence on China’s Economy Considering Different Scenarios. Glob. Chall. 2021, 5, 2000090. [Google Scholar] [CrossRef]
- Mostafa, M.K.; Gamal, G.; Wafiq, A. The impact of COVID 19 on air pollution levels and other environmental indicators—A case study of Egypt. J. Environ. Manag. 2021, 277, 111496. [Google Scholar] [CrossRef]
- Wyche, K.P.; Nichols, M.; Parfitt, H.; Beckett, P.; Monks, P.S. Changes in ambient air quality and atmospheric composi-tion and reactivity in the south east of the UK as a result of the COVID-19 lockdown. Sci. Total Environ. 2021, 755, 142526. [Google Scholar] [CrossRef]
- Wang, Y.; Peng, D.; Yu, L.; Zhang, Y.; Yin, J.; Zhou, L.; Zheng, S.; Wang, F.; Li, C. Monitoring Crop Growth During the Period of the Rapid Spread of COVID-19 in China by Remote Sensing. IEEE J. Sel. Top. Appl. Earth Obs. Remote Sens. 2020, 13, 6195–6205. [Google Scholar] [CrossRef]
- Erokhin, V.; Gao, T. Impacts of COVID-19 on Trade and Economic Aspects of Food Security: Evidence from 45 Developing Countries. Int. J. Environ. Res. Public Health 2020, 17, 5775. [Google Scholar] [CrossRef]
- Hossain, M. The effect of the COVID-19 on sharing economy activities. J. Clean. Prod. 2021, 280, 124782. [Google Scholar] [CrossRef]
- Levin, N. The impact of seasonal changes on observed nighttime brightness from 2014 to 2015 monthly VIIRS DNB composites. Remote Sens. Environ. 2017, 193, 150–164. [Google Scholar] [CrossRef]
- Song, T.; Liu, W.; Liu, Z.; Wuzhati, Y. Chinese overseas industrial parks in Southeast Asia: An examination of policy mobility from the perspective of embeddedness. J. Geogr. Sci. 2018, 28, 1288–1306. [Google Scholar] [CrossRef] [Green Version]
- Liu, Z.; Dunford, M.; Liu, W. Coupling national geo-political economic strategies and the Belt and Road Initiative: The China-Belarus Great Stone Industrial Park. Politi-Geogr. 2021, 84, 102296. [Google Scholar] [CrossRef]
- Li, H.M.; Wu, M.Q.; Niu, Z.; Li, Q. Information dataset of China’s overseas industrial parks from 1992 to 2018. China Sci. Data 2019, 4. [Google Scholar]
- Elvidge, C.D.; Baugh, K.; Zhizhin, M.; Hsu, F.C.; Ghosh, T. VIIRS night-time lights. Int. J. Remote Sens. 2017, 38, 5860–5879. [Google Scholar] [CrossRef]
- Zhu, Y.; Xu, D.; Ali, S.H.; Ma, R.; Cheng, J. Can Nighttime Light Data Be Used to Estimate Electric Power Consumption? New Evidence from Causal-Effect Inference. Energies 2019, 12, 3154. [Google Scholar] [CrossRef] [Green Version]
- Shen, X.; Cai, C.; Li, H. Socioeconomic restrictions slowdown COVID-19 far more effectively than favorable weather-evidence from the satellite. Sci. Total Environ. 2020, 748, 141401. [Google Scholar] [CrossRef] [PubMed]


| Parameters | Usage | Comparison Object |
|---|---|---|
| NTL_BA_R | Evaluate the overall changes before and after the outbreak of COVID-19 | Pre-COVID-19 |
| NTL_BA_Ri | Evaluate the monthly changes before and after the outbreak of COVID-19 | |
| NTL_BA_D | Evaluate the maximum monthly decline in NTL after the epidemic | |
| NTL_Y_R | Evaluate the annual changes between 2019 and 2020 | 2019 |
| NTL_Y_Ri | Evaluate the monthly changes between 2019 and 2020 | |
| MAX NTL_Y_Di | Evaluate the maximum monthly decline between 2019 and 2020 |
| SN | Name | Abbreviation | Country | Year of Construction | Area (km2) | Number of Pixels | Cloudless Month | Months with Cloud Cover < 50% | Park Type |
|---|---|---|---|---|---|---|---|---|---|
| 1 | Laos Boten Economic Development Zone | BEDZ | Laos | 2015 | 1.23 | 129 | 23 | 0 | Comprehensive industrial park |
| 2 | Saiseta Comprehensive Development Zone, Vientiane, Laos | SCDZ | Laos | 2010 | 3.30 | 319 | 21 | 0 | Comprehensive industrial park |
| 3 | Thailand China Rayong Industrial Park | TCRIP | Thailand | 2006 | 30.69 | 3092 | 19 | 4 | Comprehensive industrial park |
| 4 | Vietnam Longjiang Industrial Park | VLIP | Vietnam | 2008 | 7.04 | 688 | 21 | 2 | Comprehensive industrial park |
| 5 | Sihanouk Port Special Economic Zone, Cambodia | SPSEZ | Cambodia | 2007 | 5.79 | 580 | 18 | 3 | Light industrial park |
| 6 | Malaysia China Kuantan Industrial Park | MCKIP | Malaysia | 2013 | 2.96 | 301 | 23 | 0 | Comprehensive industrial park |
| 7 | Vietnam China (Haiphong Shenzhen) Economic and Trade Cooperation Zone | VCETCZ | Vietnam | 2016 | 1.66 | 174 | 23 | 0 | Light industrial park |
| 8 | Malaysia China Taman Renewable Resources Park | MCTRRP | Malaysia | / | 1.64 | 161 | 23 | 1 | Resource utilization type |
| 9 | Fujian Cambodia Industrial Park | FCIP | Cambodia | 2018 | 0.26 | 25 | 21 | 0 | Manufacturing type |
| 10 | Yunzhong Industrial Park, Beijiang Province, Vietnam | YIP | Vietnam | 2013 | 3.43 | 356 | 24 | 0 | High-tech park |
| 11 | Cambodia China Comprehensive Investment and Development Pilot Zone | CCCIDPZ | Cambodia | 2008 | 453.23 | 45,299 | 19 | 0 | Comprehensive industrial park |
| 12 | Tianhong Haihe Industrial Zone | THIZ | Vietnam | 2014 | 3.41 | 332 | 20 | 3 | Light industrial park |
| Park Name | Park | 10 km Buffer Zone | ||||||
|---|---|---|---|---|---|---|---|---|
| NTL_BA_R | First Month NTL_BA_Ri < 1 | NTL_Y_R | First Month NTL_Y_Ri < 1 | NTL_BA_R | First Month NTL_BA_Ri < 1 | NTL_Y_R | First Month NTL_Y_Ri < 1 | |
| BEDZ | 0.93 | April | 0.98 | February | 0.88 | April | 0.88 | February |
| SCDZ | 1.86 | April | 2.34 | -- | 0.99 | April | 0.99 | May |
| TCRIP | 1.03 | July | 0.94 | March | 1.05 | April | 1.05 | March |
| VLIP | 0.84 | April | 1.12 | Aug. | 0.82 | April | 0.82 | February |
| SPSEZ | 1.34 | -- | 1.15 | February | 0.82 | April | 0.82 | February |
| MCKIP | 1.09 | May | 0.76 | January | 0.86 | April | 0.86 | February |
| VCETCZ | 1.25 | April | 1.42 | December | 1.11 | April | 1.11 | October |
| MCTRRP | 1.49 | May | 1.24 | January | 0.98 | April | 0.98 | January |
| FCIP | 1.50 | April | 1.24 | January | 1.07 | April | 1.07 | February |
| YIP | 1.16 | April | 1.23 | March | 1.16 | April | 1.16 | February |
| CCCIDPZ | 1.09 | April | 1.04 | March | 0.73 | April | 0.73 | March |
| THIZ | 1.42 | December | 1.06 | January | 1.00 | April | 1.00 | February |
| Park | NTL_BA_D | Max NTL_Y_Di | Month of First NTL_BA_Ri > 1 | Month of First NTL_Y_Ri > 1 |
|---|---|---|---|---|
| BEDZ | 52.42% | 54.21% | May | April |
| SCDZ | 0.03% | −65.40% | May | April |
| TCRI | 4.91% | 34.02% | April | June |
| VLIP | 32.36% | 24.16% | November | April |
| SPSEZ | −10.13% | 25.55% | April | April |
| MCKIP | 29.83% | 62.93% | April | August |
| VCETCZ | 33.19% | 26.77% | May | April |
| MCTRRP | 5.57% | 23.45% | April | May |
| FCIP | 17.93% | 46.51% | May | May |
| YIP | 28.22% | 45.43% | May | April |
| CCCIDPZ | 38.39% | 30.81% | August | December |
| THIZ | 60.32% | 76.15% | April | April |
| Park Buffer Zone | Land-Use Type | NTL_BA_D | Max NTL_Y_Di | Month of First NTL_BA_Ri > 1 | Month of First NTL_Y_Ri > 1 |
|---|---|---|---|---|---|
| BEDZ | Rural | 53.36% | 57.67% | July | May |
| SCDZ | City | 28.97% | 29.26% | December | April |
| TCRIP | City | 5.58% | 32.85% | July | April |
| VLIP | City | 92.41% | 85.57% | October | November |
| SPSEZ | City | 75.37% | 75.69% | August | June |
| MCKIP | City | 85.45% | 85.84% | May | July |
| VCETCZ | City | 26.14% | 27.02% | May | April |
| MCTRRP | City | 4.17% | 39.83% | June | July |
| FCIP | Rural | 38.59% | 13.10% | June | April |
| YIP | City | 24.45% | 23.07% | June | April |
| CCCIDPZ | Rural | 50.17% | 73.61% | August | June |
| THIZ | Small City | 33.87% | 54.51% | June | May |
| Area | Parameter | Rural | Urban |
|---|---|---|---|
| Parks | Affected number | 3 | 8 |
| Mean NTL_BA_D | 40.03% | 20.47% | |
| Mean Max (NTL_Y_D) | 47.72% | 28.11% | |
| number of NTL_Y_Ri > 1 | 3 | 8 | |
| 10 km buffer zones | Affected number | 3 | 9 |
| Mean NTL_BA_D | 47.37% | 41.82% | |
| Mean Max (NTL_Y_D) | 48.12% | 50.40% | |
| number of NTL_Y_Ri > 1 | 3 | 7 |
Publisher’s Note: MDPI stays neutral with regard to jurisdictional claims in published maps and institutional affiliations. |
© 2022 by the authors. Licensee MDPI, Basel, Switzerland. This article is an open access article distributed under the terms and conditions of the Creative Commons Attribution (CC BY) license (https://creativecommons.org/licenses/by/4.0/).
Share and Cite
Wu, M.; Ye, H.; Niu, Z.; Huang, W.; Hao, P.; Li, W.; Yu, B. Operation Status Comparison Monitoring of China’s Southeast Asian Industrial Parks before and after COVID-19 Using Nighttime Lights Data. ISPRS Int. J. Geo-Inf. 2022, 11, 122. https://doi.org/10.3390/ijgi11020122
Wu M, Ye H, Niu Z, Huang W, Hao P, Li W, Yu B. Operation Status Comparison Monitoring of China’s Southeast Asian Industrial Parks before and after COVID-19 Using Nighttime Lights Data. ISPRS International Journal of Geo-Information. 2022; 11(2):122. https://doi.org/10.3390/ijgi11020122
Chicago/Turabian StyleWu, Mingquan, Huichun Ye, Zheng Niu, Wenjiang Huang, Pengyu Hao, Wang Li, and Bo Yu. 2022. "Operation Status Comparison Monitoring of China’s Southeast Asian Industrial Parks before and after COVID-19 Using Nighttime Lights Data" ISPRS International Journal of Geo-Information 11, no. 2: 122. https://doi.org/10.3390/ijgi11020122
APA StyleWu, M., Ye, H., Niu, Z., Huang, W., Hao, P., Li, W., & Yu, B. (2022). Operation Status Comparison Monitoring of China’s Southeast Asian Industrial Parks before and after COVID-19 Using Nighttime Lights Data. ISPRS International Journal of Geo-Information, 11(2), 122. https://doi.org/10.3390/ijgi11020122