
Analysis of Factors Affecting Adoption of Volunteered Geographic Information in the Context of National Spatial Data Infrastructure


Abstract
:1. Introduction
2. Theoretical Background
2.1. Spatial Data
2.2. Spatial Data Infrastructure
2.3. Volunteered Geographic Information
2.4. SDI and VGI
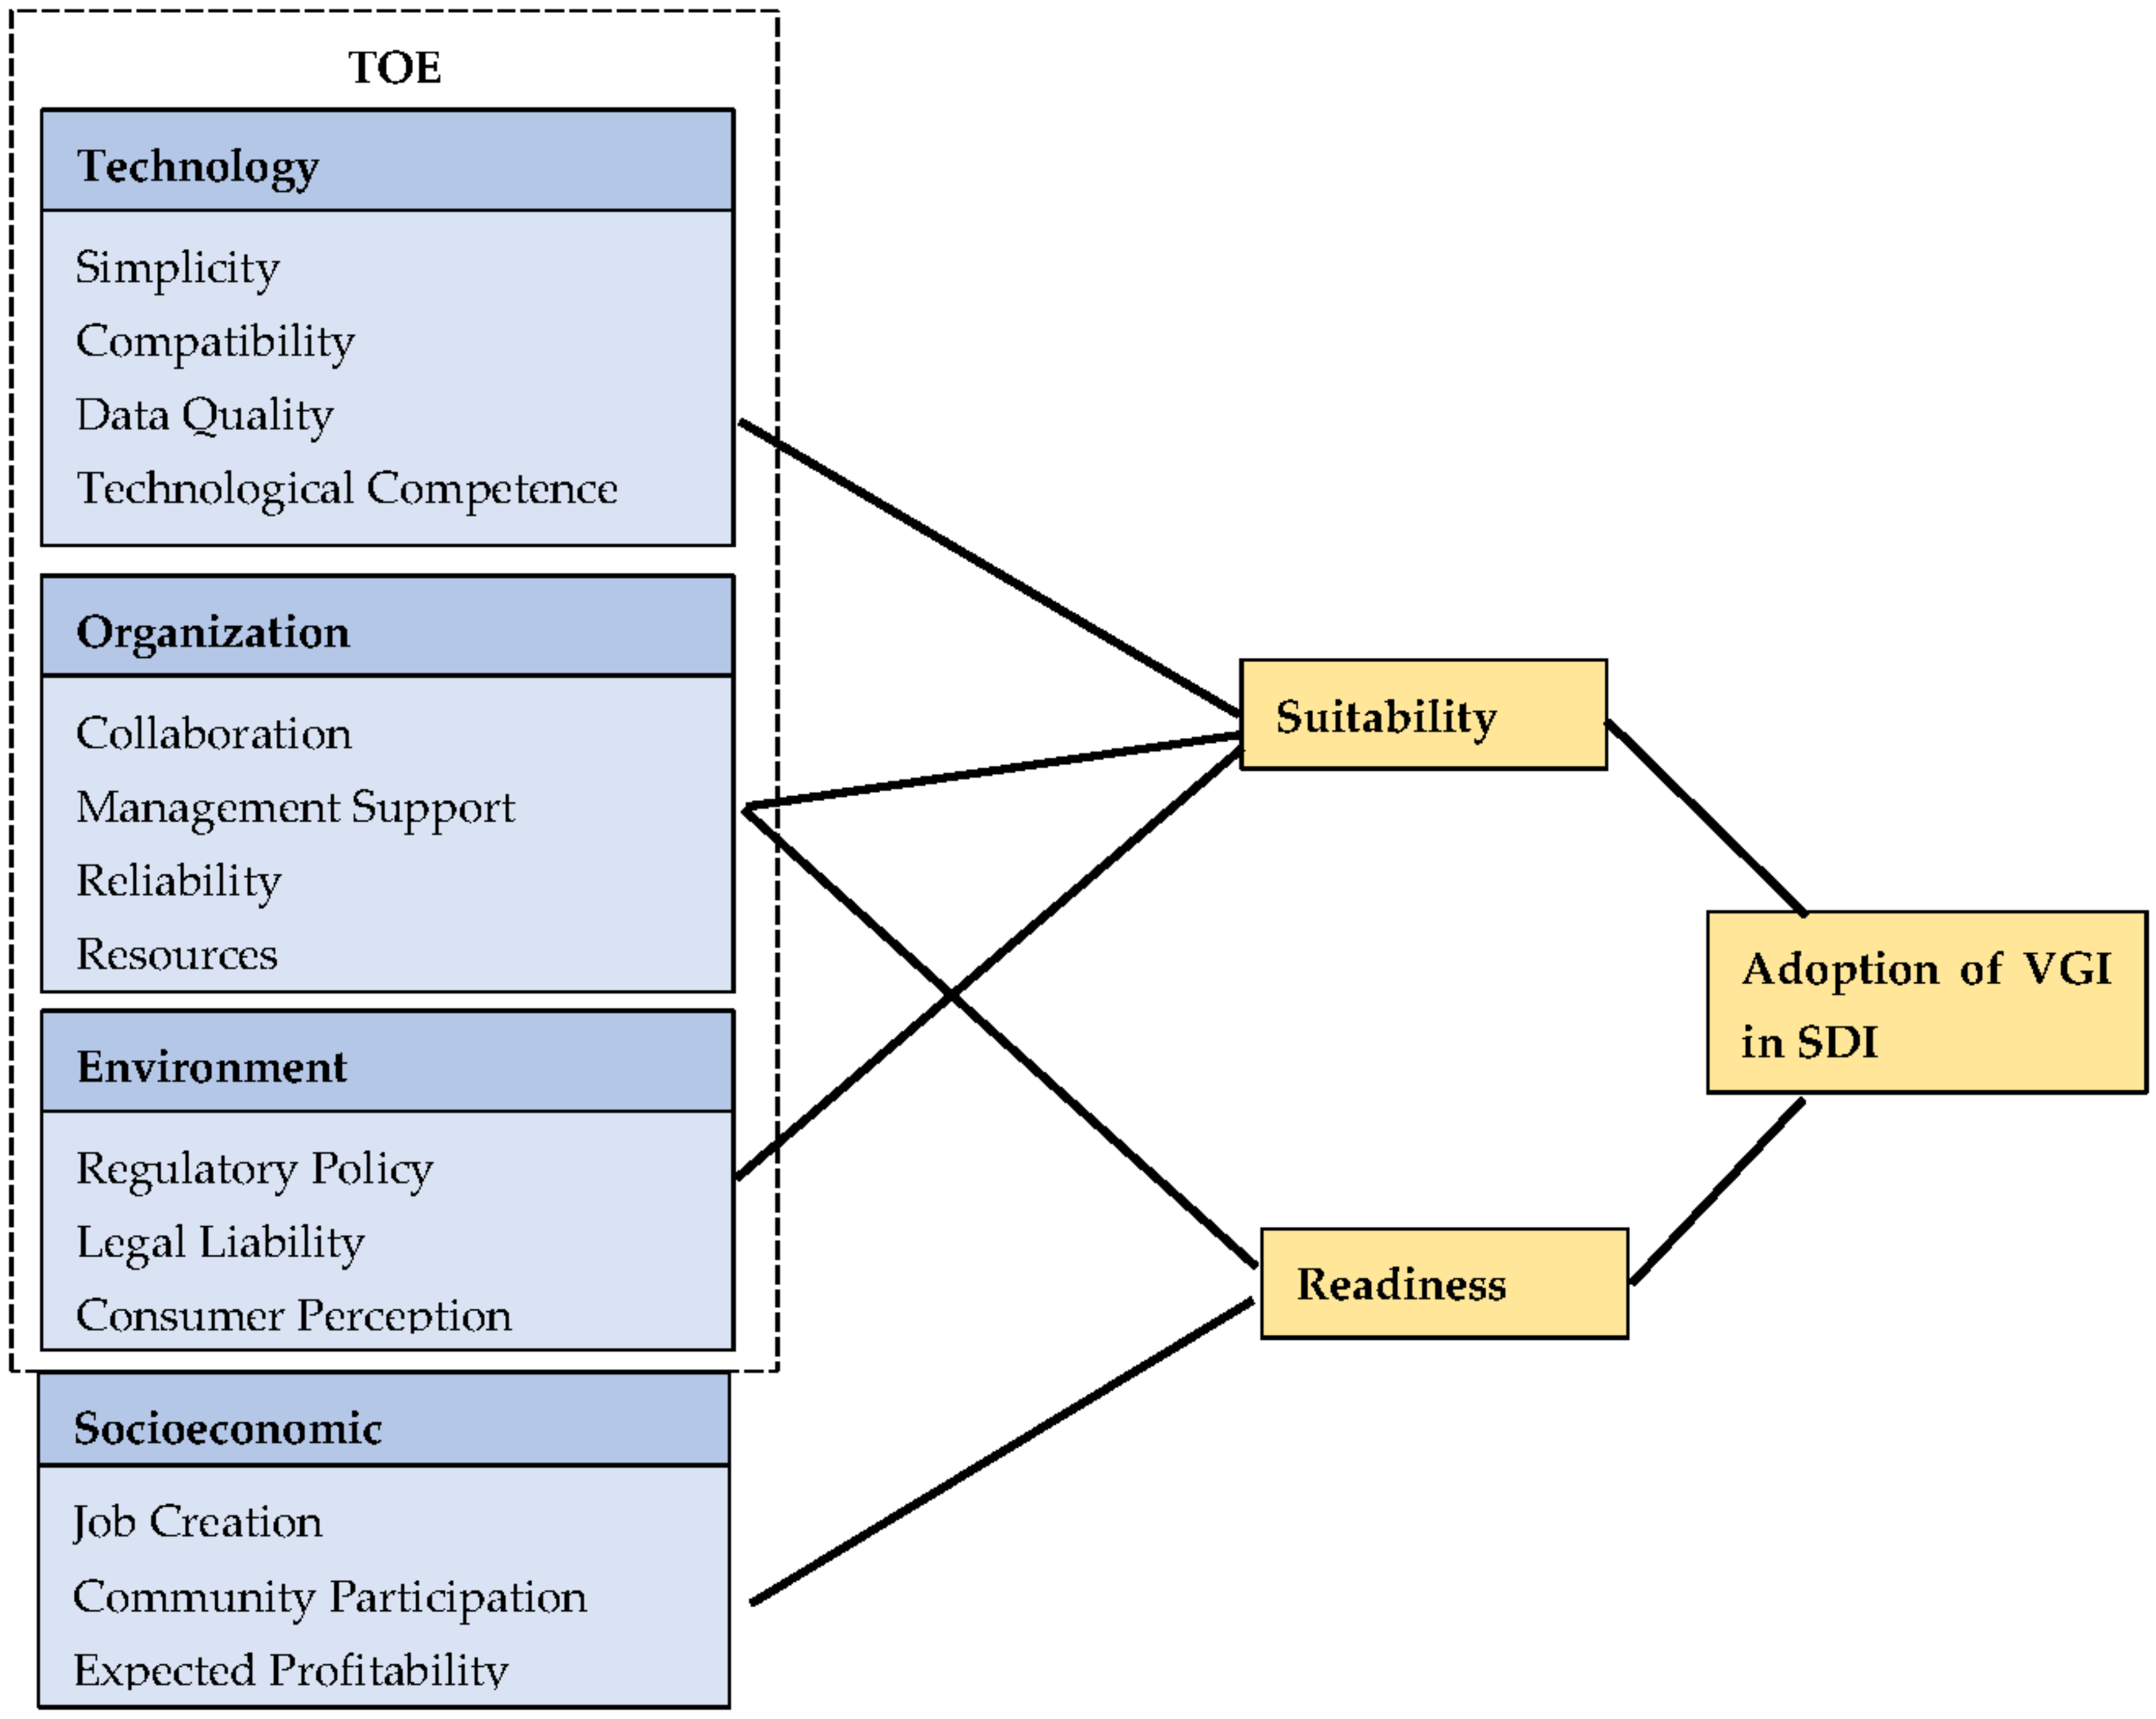
3. Research Model and Hypotheses Development
3.1. Research Model
Reasons behind the Selection of the TOE Framework
- •
- Most of the adaptation theories available that deal with information technology and communication aspects emerge from the TOE framework. These theories either shorten or extend the contexts of the TOE framework. For example, the Institutional Theory [43] divides TOE aspects and deals mainly with the environmental context of the TOE framework. In the same pattern, the DoI theory [47] describes the technology and organizational context of the TOE framework.
- •
- As far as the adoption of new technology within the organization is concerned, TOE is the most utilized framework to test such a kind of adoption [46].
3.2. Hypothesis Development
3.2.1. Technology Context
3.2.2. Organization Context
3.2.3. Environment Context
3.2.4. Socioeconomic Context
3.2.5. Suitability
3.2.6. Readiness
4. Materials and Methods
4.1. PLS-SEM
- •
- •
- PLS-SEM is quite useful to simultaneously evaluate the factors of the measurement model and structural model [86].
- •
- •
- As the size of the sample is small, the PLS-SEM method is used because it can perform well even when the sample size is small [87].
- •
- PLS-SEM helps to investigate the relationship of observed and unobserved variables, while other above-mentioned methods work on observed variables only [89].
- •
- Moreover, the effects of moderators can be directly observed with the help of the PLS-SEM technique [83].
4.2. Sample and Measures
- •
- We have used already-established factors such as complexity, compatibility, data quality, technological competence, collaboration, management support, reliability, resources, regulatory policy, legal liability, consumer perception, community participation, suitability, and readiness from the available research studies. The factors are fine-tuned to meet the requirement of this study. The factors of expected profitability and job creation are self-developed for this study. Table 1 delivers details about the abbreviations for latent variables and a description as well as code of item for each factor.
- •
- We keep the questions simple and avoided the confusing and more technical terminologies in establishing the questionnaire.
- •
- Questions were developed by getting feedback from the researchers working on the concepts of the NSDI and VGI.
- •
- Questions were proofread by language experts to avoid any grammar mistakes.
5. Results
5.1. Factor Analysis
5.2. Reliability Analysis
5.3. Validity Analysis
5.4. Hypothesis Testing
6. Discussion
6.1. Technology Context
6.2. Organizational Context
6.3. Environmental Context
6.4. Socioeconomic Context
6.5. Implications
6.5.1. Theoretical Implications
6.5.2. Practical Implications
6.6. Limitations
7. Conclusions
Future Directions
Author Contributions
Funding
Institutional Review Board Statement
Informed Consent Statement
Data Availability Statement
Conflicts of Interest
Appendix A. Survey Questionnaire

| Latent Variables (LV) | Questions |
|---|---|
| Complexity (CMP) | Do you think organizations do not adopt VGI when they perceive that? Efforts are required to use VGI |
| Handling the VGI data is challenging | |
| Multiple platforms of VGI production exist, so it is difficult to choose and decide | |
| Searching and browsing the relevant VGI data is difficult | |
| Compatibility (COM) | Do you think organizations adopt VGI when they perceive that? VGI is compatible with existing datasets |
| VGI is compatible with the existing database schema | |
| VGI is interoperable with other GIS formats | |
| VGI is easy compared to some data formats and datasets which are too complex | |
| Data Quality (QTY) | Do you think organizations do not adopt VGI when they perceive that? The data quality of VGI is poor |
| VGI has limited metadata to attain quality | |
| Data coverage of VGI is not uniform | |
| Lack of metadata standards in VGI | |
| Lack of data standards in VGI | |
| Technological Competence (TEC) | Do you think organizations do not adopt VGI when they perceive that? VGI requires the development of specialized web-based infrastructure |
| VGI requires the maintenance of a web-based platform | |
| VGI requires analysis skills | |
| Collaboration (COL) | Do you think organizations do not adopt VGI when? Collaboration of stakeholders in the data production of VGI does not exist |
| It is difficult to encourage key stakeholders to use VGI-based data | |
| Collaboration among organizations requires the growth of experience and skills within government organizations | |
| Management Support (MGS) | Do you think the adoption of VGI by government organizations is hindered due to the reasons mentioned below? Management support is required to change the organizational priorities to use VGI |
| Poor planning of the VGI project fails the implementation of VGI projects | |
| Permission from government organizations hampers the implementation of VGI projects | |
| Restrictive top-level management’s timelines hamper VGI implementation processes | |
| Reliability (REL) | Do you think organizations do not adopt VGI when they perceive that? VGI is junk data as it is produced by volunteers |
| The reliability of VGI is questionable if utilized in official work | |
| No one guarantees the reliability of VGI data | |
| Resources (RES) | Do you think organizations do not adopt VGI when they perceive that? Additional workload is required to process the collected VGI |
| Additional time is required to process the collected VGI | |
| Additional manpower is required to process the collected data | |
| Regulatory Policy (RGP) | Do you think organizations do not adopt VGI when they perceive that? Existing policies do not promote the use of VGI data |
| Existing policies do not promote the inclusion of VGI data in the official working environment | |
| It takes years to make new regulatory policies to facilitate VGI adoption | |
| Legal Liability (LEL) | Do you think organizations do not adopt VGI when they perceive that? No one is legally responsible for incorrect VGI data |
| Anonymized contribution is a challenge to including VGI in the official dataset | |
| Intellectual property and licensing issues are associated with VGI | |
| Consumer Perception (COP) | Do you think organizations do not adopt VGI when they perceive that? VGI data are produced by non-professionals so they are not valuable |
| Data from non-professionals should not be mixed with official data | |
| No consumer perception reports are available regarding VGI | |
| Job Creation (JBC) | Do you think organizations adopt VGI when they perceive that? Volunteers’ involvement in official work reduces government job opportunities |
| Job reduction is favorable to the sitting government | |
| VGI adoption impose less burden on employers | |
| Community Participation (CUP) | Do you think organizations do not adopt VGI when they perceive that? Motivating contributors to participate in VGI is a challenge |
| Community support to participate in the VGI projects is required | |
| Direct liaison with the contributors is required for the sustainability of the VGI project | |
| Expected Profitability (EXP) | Do you think organizations do not adopt VGI when they perceive that? Expected profit cannot be calculated without the successful implementation of a single VGI project |
| A lot of investment is required for the implementation of the VGI project | |
| No study available on the expected profitability regarding VGI adoption | |
| Suitability (SUT) | As per my understanding: The common perception is that VGI is not suitable for decision making |
| Empirical research studies are needed to prove the suitability of VGI for decision making | |
| Policy makers’ role in advocating VGI is deficient | |
| Readiness (RED) | As per my understanding: A VGI readiness index needs to be developed and tested |
| VGI readiness use-cases are significantly very few in number | |
| The VGI readiness concept is still in its infancy | |
| Adoptability (ADP) | As per my understanding: A top-down approach for VGI adoptability is missing |
| Common factors impeding VGI adoptability are not addressed | |
| A VGI-adoptability matrix needs to be developed and tested |
References
- Masser, I. GIS Worlds: Creating Spatial Data Infrastructures; ESRI press: Beijing, China, 2005. [Google Scholar]
- Mummidi, L.N.; Krumm, J. Discovering Points of Interest from Users’ Map Annotations. GeoJournal 2008, 72, 215–227. [Google Scholar] [CrossRef] [Green Version]
- Rajabifard, A.; Williamson, I.P. Spatial Data Infrastructures: Concept, SDI Hierarchy and Future Directions. Proceedings of GEOMATICS 2001. Available online: https://minerva-access.unimelb.edu.au/handle/11343/33897 (accessed on 30 November 2021).
- Ali, A.; Imran, M. National Spatial Data Infrastructure vs. Cadastre System for Economic Development: Evidence from Pakistan. Land 2021, 10, 188. [Google Scholar] [CrossRef]
- Asmat, A. Potential of Public-Private Partnership for NSDI Implementation in Pakistan. Master Thesis, International institute for Geo-information Science and Earth Observation, Enschede, Netherlands, 2008. [Google Scholar]
- Vilches-Blázquez, L.M.; Ballari, D. Unveiling the Diversity of Spatial Data Infrastructures in Latin America: Evidence from an Exploratory Inquiry. Cartogr. Geogr. Inf. Sci. 2020, 47, 508–523. [Google Scholar] [CrossRef]
- Rajabifard, A.; Feeney, M.E.F.; Williamson, I.P. Future Directions for SDI Development. Int. J. Appl. Earth Obs. Geoinf. 2002, 4, 11–22. [Google Scholar] [CrossRef]
- Sadeghi-Niaraki, A.; Rajabifard, A.; Kim, K.; Seo, J. Ontology Based SDI to Facilitate Spatially Enabled Society. In Proceedings of the GSDI 12 World Conference, Suntec, Singapore, 19–22 October 2010. [Google Scholar]
- Ali, A.; Imran, M.; Jabeen, M.; Ali, Z.; Mahmood, S.A. Factors Influencing Integrated Information Management: Spatial Data Infrastructure in Pakistan. Available online: https://journals.sagepub.com/doi/abs/10.1177/02666669211048483?journalCode=idva (accessed on 30 November 2021).
- GoP Surveying and Mapping Act; National Assembly of Pakistan: Islamabad. 2014. Available online: https://na.gov.pk/uploads/documents/1397721138_588.pdf (accessed on 30 November 2021).
- See, L.; Mooney, P.; Foody, G.; Bastin, L.; Comber, A.; Estima, J.; Fritz, S.; Kerle, N.; Jiang, B.; Laakso, M.; et al. Crowdsourcing, Citizen Science or Volunteered Geographic Information? The Current State of Crowdsourced Geographic Information. ISPRS Int. J. of Geo-Inf. 2016, 5, 55. [Google Scholar] [CrossRef]
- Papapesios, N.; Ellul, C.; Shakir, A.; Hart, G. Exploring the Use of Crowdsourced Geographic Information in Defence: Challenges and Opportunities. J. Geogr. Syst. 2019, 1, 133–160. [Google Scholar] [CrossRef] [Green Version]
- Goodchild, M.F. Citizens as Sensors: The World of Volunteered Geography. GeoJournal 2007, 69, 211–221. [Google Scholar] [CrossRef] [Green Version]
- Fischer, F. VGI as Big Data. A New but Delicate Geographic Data-Source. GeoInformatics 2012, April/May, 46–47. Available online: https://www.academia.edu/1505065/VGI_as_Big_Data._A_New_but_Delicate_Geographic_Data-Source (accessed on 30 November 2021).
- Shiau, S.J.H.; Huang, C.Y.; Yang, C.L.; Juang, J.N. A Derivation of Factors Influencing the Innovation Diffusion of the OpenStreetMap in STEM Education. Sustainability 2018, 10, 3447. [Google Scholar] [CrossRef] [Green Version]
- Bright, J.; de Sabbata, S.; Lee, S.; Ganesh, B.; Humphreys, D.K. OpenStreetMap Data for Alcohol Research: Reliability Assessment and Quality Indicators. Health Place 2018, 50, 130–136. [Google Scholar] [CrossRef]
- Briem, L.; Heilig, M.; Klinkhardt, C.; Vortisch, P. Analyzing OpenStreetMap as Data Source for Travel Demand Models A Case Study in Karlsruhe. Transp. Res. Proc. 2019, 41, 104–112. [Google Scholar] [CrossRef]
- Herfort, B.; Lautenbach, S.; Porto de Albuquerque, J.; Anderson, J.; Zipf, A. The Evolution of Humanitarian Mapping within the OpenStreetMap Community. Sci. Rep. 2021, 11, 1–15. [Google Scholar] [CrossRef] [PubMed]
- Muzaffar, H.M.; Tahir, A.; Ali, A.; Ahmad, M.; McArdle, G. Quality Assessment of Volunteered Geographic Information for Educational Planning. In Volunteered Geographic Information and the Future of Geospatial Data; IGI Global: Hershey, PA, USA, 2017. [Google Scholar]
- Munir, A.; Asmat, A.; Malik Sikander, H.K. Potential of Volunteered Geographic Information for Adoptation of Climate Change Effects in Pakistan. In Proceedings of the 4th International Conference on Energy, Environment and Sustainable Development, Mehran University of Engineering and Technology, Jamshoro, Pakistan, 1–3 November 2016. [Google Scholar]
- Munir, A.; Asmat, A.; Malik Sikander, H.K. Promoting Heritage Tourism in Pakistan Using Volunteered Geographic Information: An Investigative Outlook. In Proceedings of the 24th International Conference of Historians of Asia, National Institute of Historical and Cultural Research (NIHCR) a Center of Excellence of the Quaid-i-Azam University, Islamabad, Pakistan, 14–16 December 2016. [Google Scholar]
- Castelein, W.; Grus, L.; Crompvoets, J.; Bregt, A. A Characterization of Volunteered Geographic Information. 2010. Available online: https://agile-online.org/conference_paper/cds/agile_2010/shortpapers_pdf/106_doc.pdf (accessed on 30 November 2021).
- Genovese, E.; Roche, S. Potential of VGI as a Resource for SDIs in the North/South Context. Geomatica 2010, 64, 439–450. [Google Scholar]
- Bordogna, G.; Carrara, P.; Kliment, T.; Frigerio, L.; Sterlacchini, S. Spatial Data Infrastructures Empowered by Interoperable Volunteered Geographic Information. Plurimondi 2017, 16, 107–113. [Google Scholar]
- Shakeri, M.; Sadeghi Niaraki, A.; Alimohammdi, A.; Alesheikh, A.A. Volunteered Spatial Data Infrastructure (VSDI) to Develop Collaboration System in Transportation. J. Geomat. Sci. Technol. 2018, 7, 1–13. [Google Scholar]
- Sevinç, H.K.; Karaš, I.R. The Role of Volunteered Geographic Information Applications in Disaster Management. In Proceedings of the International Archives of the Photogrammetry, Remote Sensing and Spatial Information Sciences-ISPRS Archives, Istanbul, Turkey, 18–21 March 2018. [Google Scholar]
- Chen, H.; Zhang, W.C.; Deng, C.; Nie, N.; Yi, L. Volunteered Geographic Information for Disaster Management with Application to Earthquake Disaster Databank & Sharing Platform. In Proceedings of the IOP Conference Series: Earth and Environmental Science; 2017, Beijing, China, 16–17 May 2016. [Google Scholar]
- Dasgupta, A.; Ghosh, S.K. A Volunteered Geographic Information (VGI) Framework for Disaster Management Based on Mobile Services and SDI. In Geospatial Infrastructure, Applications and Technologies: India Case Studies; Springer: Singapore, 2018; pp. 121–129. [Google Scholar]
- Arapostathis, S.G. Fundamentals of Volunteered Geographic Information in Disaster Management Related to Floods. In Flood Impact Mitigation and Resilience Enhancement. 2020. Available online: https://www.intechopen.com/chapters/72104 (accessed on 30 November 2021).
- Rollason, E.; Bracken, L.J.; Hardy, R.J.; Large, A.R.G. The Importance of Volunteered Geographic Information for the Validation of Flood Inundation Models. J. Hydrol. 2018, 562, 267–280. [Google Scholar] [CrossRef]
- Siriba, D.N.; Dalyot, S. Adoption of Volunteered Geographic Information into the Formal Land Administration System in Kenya. Land Use Policy 2017, 63, 279–287. [Google Scholar] [CrossRef]
- Poorazizi, M.; Hunter, A.; Steiniger, S. A Volunteered Geographic Information Framework to Enable Bottom-Up Disaster Management Platforms. ISPRS Int. J. Geo-Inf. 2015, 4, 1389–1422. [Google Scholar] [CrossRef] [Green Version]
- Koswatte, S.; McDougall, K.; Liu, X. SDI and Crowdsourced Spatial Information Management Automation for Disaster Management. Surv. Rev. 2015, 47, 307–315. [Google Scholar] [CrossRef]
- Yulfa, A.; Aditya, T.; Sutanta, H. Towards SDI Services for Crowdsourcing Spatial Data in Disaster Response. In Proceedings of the 2017 7th International Annual Engineering Seminar, Yogyakarta, Indonesia, 1–2 August 2017. [Google Scholar]
- Rahmatizadeh, S.; Rajabifard, A.; Kalantari, M. A Conceptual Framework for Utilising VGI in Land Administration. Land Use Policy 2016, 56, 81–89. [Google Scholar] [CrossRef]
- Navratil, G.; Frank, A.U. Vgi for Land Administration-a Quality Perspective. Available online: https://www.int-arch-photogramm-remote-sens-spatial-inf-sci.net/XL-2-W1/159/2013/ (accessed on 30 November 2021).
- Hameed, M.; Fairbairn, D.; Speak, S. Determining the Potential Role of VGI in Improving Land Administration Systems in Iraq. In Proceedings of the Lecture Notes in Computer Science (including subseries Lecture Notes in Artificial Intelligence and Lecture Notes in Bioinformatics). Available online: https://eprints.ncl.ac.uk/238224?__hstc=76754698.99a265337744294b740e0787aea508c4.1554854400284.1554854400285.1554854400286.1&__hssc=76754698.1.1554854400287&__hsfp=1817143912 (accessed on 30 November 2021).
- Moreri, K.K. Using Kappa Methodology to Consider Volunteered Geographic Information in Official Land Administration Systems in Developing Countries. Spat. Inf. Res. 2020, 28, 299–311. [Google Scholar] [CrossRef]
- Moreri, K.K.; Fairbairn, D.; James, P. Volunteered Geographic Information Quality Assessment Using Trust and Reputation Modelling in Land Administration Systems in Developing Countries. Int. J. Geogr. Inf. Sci. 2018, 32, 931–959. [Google Scholar] [CrossRef] [Green Version]
- Zhang, H.; Jiang, J.; Huang, W.; Yang, L. Design and Implementation of Crowdsourcing Based China’s National Public Geospatial Information Collection System. In Proceedings of the International Archives of the Photogrammetry, Remote Sensing and Spatial Information Sciences-ISPRS Archives, Enschede, The Netherlands, 10–14 June 2019. [Google Scholar]
- Kotsev, A.; Minghini, M.; Tomas, R.; Cetl, V.; Lutz, M. From Spatial Data Infrastructures to Data Spaces—A Technological Perspective on the Evolution of European SDIs. ISPRS Int. J. Geo-Inf. 2020, 9, 176. [Google Scholar] [CrossRef] [Green Version]
- DePietro, R.; Wiarda, E.; Fleischer, M. The Context for Change: Organization, Technology and Environment. Process Technol. Innov. 1990, 199, 151–175. [Google Scholar]
- Oliveira, T.; Martins, M.F.; Lisboa, U.N. Literature Review of Information Technology Adoption Models at Firm Level. Rev. Econ. Stud. 2011, 14, 110–121. [Google Scholar]
- Baker, J. The Technology–Organization–Environment Framework. In Information Systems Theory; University of Hamburg: Hamburg, Germany, 2011. [Google Scholar]
- Awa, H.O.; Ukoha, O.; Igwe, S.R. Revisiting technology-organization-environment (T-O-E) theory for enriched applicability. Bottom Line 2017, 30, 2–22. [Google Scholar] [CrossRef]
- Rogers, E.M.; Singhal, A.; Quinlan, M.M. Diffusion of Innovations. In An Integrated Approach to Communication Theory and Research, 5th ed.; Routledge: London, UK, 2003. [Google Scholar]
- DiMaggio, P.J.; Powell, W.W. The Iron Cage Revisited: Institutional Isomorphism and Collective Rationality in Organizational Fields. Am. Sociol. Rev. 1983, 48, 147–160. [Google Scholar] [CrossRef] [Green Version]
- Kandil, A.M.N.A.; Ragheb, M.A.; Ragab, A.A.; Farouk, M. Examining the Effect of TOE Model on Cloud Computing Adoption in Egypt. Bus. Manag. Rev. 2018, 9, 113–123. [Google Scholar]
- Al-Hujran, O.; Al-Lozi, E.M.; Al-Debei, M.M.; Maqableh, M. Challenges of Cloud Computing Adoption from the TOE Framework Perspective. Int. J. e-Bus. Res. 2018, 14, 77–94. [Google Scholar] [CrossRef]
- Kamarulzaman, M.S.; Hassan, N.H.; Bakar, N.A.A.; Maarop, N.; Samy, G.A.L.N.; Aziz, N. Factors Influencing Blockchain Adoption in Government Organization: A Proposed Framework. In Proceedings of the 2021 International Conference on Computer & Information Sciences (ICCOINS), Kuching, Malaysia, 13–15 July 2021. [Google Scholar]
- Jain, M.; Nhat Hanh Le, A.; Ying-Chao Lin, J.; Ming-Sung Cheng, J.; Professor, A. Exploring the Factors Favoring MCommerce Adoption among Indian MSMEs: A TOE Perspective. Tunghai Manag. Rev. 2011, 13, 147–188. [Google Scholar]
- Wang, Y.S.; Li, H.T.; Li, C.R.; Zhang, D.Z. Factors Affecting Hotels’ Adoption of Mobile Reservation Systems: A Technology-Organization-Environment Framework. Tour. Manag. 2016, 53, 163–172. [Google Scholar] [CrossRef]
- Daradkeh, M.K.; Sabbahein, H.A.S. Factors Influencing the Adoption of Mobile Application Development Platforms: A Qualitative Content Analysis of Developers’ Online Reviews. Int. J. Enterp. Inf. Syst. 2019, 15, 43–59. [Google Scholar] [CrossRef]
- Effendi, M.I.; Sugandini, D.; Istanto, Y. Social Media Adoption in SMEs Impacted by COVID-19: The TOE Model*. J. Asian Finance Econ. Bus. 2020, 7, 915–925. [Google Scholar] [CrossRef]
- Low, C.; Chen, Y.; Wu, M. Understanding the Determinants of Cloud Computing Adoption. Ind. Manag. Data Syst. 2011, 111, 1006–1023. [Google Scholar] [CrossRef] [Green Version]
- Klug, W.E. The Determinants of Cloud Computing Adoption by Colleges and Universities. Ph.D. Thesis, Northcentral University, Scottsdale, AZ, USA, 2014. [Google Scholar]
- Hsu, P.F.; Ray, S.; Li-Hsieh, Y.Y. Examining Cloud Computing Adoption Intention, Pricing Mechanism, and Deployment Model. Int. J. Inf. Manag. 2014, 34, 474–488. [Google Scholar] [CrossRef]
- Heinrich, B.; Klier, M.; Kaiser, M. A Procedure to Develop Metrics for Currency and Its Application in CRM. J. Data Inf. Qual. 2009, 1, 1–28. [Google Scholar] [CrossRef] [Green Version]
- Orr, K. Data Quality and Systems Theory. Commun. ACM 1998, 41, 66–71. [Google Scholar] [CrossRef]
- Eppler, M.J. Managing Information Quality, 2nd ed.; Springer: Berlin/Heidelberg, Germany, 2006. [Google Scholar]
- Nasr, M.; Shaaban, E.; Gabr, M.I. Data Quality Dimensions. In Lecture Notes in Networks and Systems; Springer: Berlin/Heidelberg, Germany, 2020. [Google Scholar]
- Svetlana, J. Data Quality Dimensions to Ensure Optimal Data Quality. Rom. Econ. J. 2017, 20, 89–103. [Google Scholar]
- Zhu, K.; Kraemer, K.L.; Xu, S. The Process of Innovation Assimilation by Firms in Different Countries: A Technology Diffusion Perspective on e-Business. Manag. Sci. 2006, 52, 1557–1576. [Google Scholar] [CrossRef] [Green Version]
- Zhu, K.; Dong, S.; Xu, S.X.; Kraemer, K.L. Innovation Diffusion in Global Contexts: Determinants of Post-Adoption Digital Transformation of European Companies. Eur. J. Inf. Syst. 2006, 15, 601–616. [Google Scholar] [CrossRef]
- Drazin, R. The Processes of Technological Innovation. J. Technol. Transf. 1991, 16, 45–46. [Google Scholar] [CrossRef]
- Leung, D.; Lo, A.; Fong, L.H.N.; Law, R. Applying the Technology-Organization-Environment Framework to Explore ICT Initial and Continued Adoption: An Exploratory Study of an Independent Hotel in Hong Kong. Tour. Recreat. Res. 2015, 40, 391–406. [Google Scholar] [CrossRef]
- Yoon, T. An Empirical Investigation of Factors Affecting Organizational Adoption of Virtual Worlds. The Florida State University. Available online: https://diginole.lib.fsu.edu/islandora/object/fsu:253879 (accessed on 30 November 2021).
- Grover, V. An Empirically Derived Model for the Adoption of Customer-based Interorganizational Systems. Decis. Sci. 1993, 24, 603–640. [Google Scholar] [CrossRef]
- Jahanshahi, A.A.; Brem, A. Sustainability in SMEs: Top Management Teams Behavioral Integration as Source of Innovativeness. Sustainability 2017, 9, 1899. [Google Scholar] [CrossRef] [Green Version]
- McGuire, M. Collaborative Public Management: Assessing What We Know and How We Know It. Public Adm. Rev. 2006, 66, 33–43. [Google Scholar] [CrossRef]
- Ensminger, D.C.; Surry, D.W.; Porter, B.E.; Wright, D. Factors Contributing to the Successful Implementation of Technology Innovations. Educ. Technol. Soc. 2004, 7, 61–72. [Google Scholar]
- Venkatesh, V.; Morris, M.G.; Davis, G.B.; Davis, F.D. User Acceptance of Information Technology: Toward a Unified View. MIS Q. Manag. Inf. Syst. 2003, 27, 425–478. [Google Scholar] [CrossRef] [Green Version]
- Qasem, Y.A.M.; Abdullah, R.; Yaha, Y.; Atana, R. Continuance Use of Cloud Computing in Higher Education Institutions: A Conceptual Model. Appl. Sci. 2020, 10, 6628. [Google Scholar] [CrossRef]
- Hochstatter, J. Legal Liability. In Global Encyclopedia of Public Administration, Public Policy, and Governance; Farazmand, A., Ed.; Springer International Publishing: Cham, Switzerland, 2018. [Google Scholar]
- Schmitt, G.; Mladenow, A.; Strauss, C.; Schaffliauser-Linzatti, M. Smart Contracts and Internet of Things: A Qualitative Content Analysis Using the Technology-Organization-Environment Framework to Identify Key-Determinants. Proc. Comp. Sci. 2019, 160, 189–196. [Google Scholar] [CrossRef]
- Lachapelle, P.R.; Austin, E.K. Community Participation. Encyclopedia of Quality of Life and Well-Being Research; Springer: Berlin/Heidelberg, Germany, 2014. [Google Scholar]
- Kim, S.; Park, J.; Kim, E.; Park, J. A study on big-data application methods and their expected effect analysis—Impact of data analysis to improve employee decision making in domestic firms. J. Inf. Technol. Archit. 2015, 12, 159–170. [Google Scholar]
- Raven, A.; Le, E.; Park, C.W. Digital Video Presentation and Student Performance: A Task Technology Fit Perspective. Int. J. Inf. Commun. Technol. Educ. 2010, 6, 17–29. [Google Scholar] [CrossRef] [Green Version]
- Koo, S.-H.; Shin, M.-S. The Study on the Impact of the Task-Technology Fit Model and Organizational Characteristics of the Mobile Office System on the Job Performance. J. Korea Acad.-Ind. Coop. Soc. 2013, 14, 644–654. [Google Scholar] [CrossRef]
- Parasuraman, A. Technology Readiness Index (Tri): A Multiple-Item Scale to Measure Readiness to Embrace New Technologies. J. Serv. Res. 2000, 2, 307–320. [Google Scholar] [CrossRef]
- Dewar, R.D.; Dutton, J.E. The Adoption of Radical and Incremental Innovations: An Empirical Analysis. Manag. Sci. 1986, 32, 1422–1433. [Google Scholar] [CrossRef]
- Ifinedo, P. An Empirical Analysis of Factors Influencing Internet/e-Business Technologies Adoption by Smes in Canada. Int. J. Inf. Technol. Decis. Mak. 2011, 10, 731–766. [Google Scholar] [CrossRef]
- Lewis, J.R. Multipoint Scales: Mean and Median Differences and Observed Significance Levels. Int. J. Hum.-Comput. Interact. 1993, 5, 383–392. [Google Scholar] [CrossRef]
- Jöreskog, K.G.; Sörbom, D. LISREL 8: Structural Equation Modeling with the SIMPLIS Command Language; Scientific Software International: Skokie, IL, USA, 1993; Available online: https://psycnet.apa.org/record/1993-97878-000 (accessed on 30 November 2021).
- Byrne, B.M. Structural Equation Modeling with EQS: Basic Concepts, Applications, and Programming, 2nd ed.; Routledge: London, UK, 2013. [Google Scholar]
- Chinn, W.W. The Partial Least Squares Approach to Structural Equation Modelling. Mod. Methods Bus. Res. 1998, 29, 295–336. [Google Scholar]
- Härdle, W.K.; Simar, L. Applied Multivariate Statistical Analysis; Pearson: London, UK, 2013. [Google Scholar]
- Walczuch, R.; Lemmink, J.; Streukens, S. The Effect of Service Employees’ Technology Readiness on Technology Acceptance. Inf. Manag. 2007, 44, 206–215. [Google Scholar] [CrossRef]
- Cox, E.P., III. The Optimal Number of Response Alternatives for a Scale: A Review. J. Mark. Res. 1980, 17, 407–422. [Google Scholar] [CrossRef]
- Zhu, K.; Kraemer, K.L.; Xu, S.; Dedrick, J. Information Technology Payoff in E-Business Environments: An International Perspective on Value Creation of E-Business in the Financial Services Industry. J. Manag. Inf. Syst. 2004, 21, 17–54. [Google Scholar] [CrossRef]
- Featherman, M.S.; Pavlou, P.A. Predicting E-Services Adoption: A Perceived Risk Facets Perspective. Int. J. Hum. Comput. Stud. 2003, 59, 451–474. [Google Scholar] [CrossRef] [Green Version]
- Yang, Z.; Sun, J.; Zhang, Y.; Wang, Y. Understanding SaaS Adoption from the Perspective of Organizational Users: A Tripod Readiness Model. Comput. Hum. Behav. 2015, 45, 254–264. [Google Scholar] [CrossRef]
- Chong, K.W.; Kim, Y.S.; Choi, J. A Study of Factors Affecting Intention to Adopt a Cloud-Based Digital Signature Service. Information 2021, 12, 60. [Google Scholar] [CrossRef]
- Janssen, M.; Charalabidis, Y.; Zuiderwijk, A. Benefits, Adoption Barriers and Myths of Open Data and Open Government. Inf. Syst. Manag. 2012, 29, 258–268. [Google Scholar] [CrossRef] [Green Version]
- Khan, Z.T.; Johnson, P.A. Citizen and Government Co-Production of Data: Analyzing the Challenges to Government Adoption of VGI. Can. Geogr. 2020, 64, 374–387. [Google Scholar] [CrossRef]
- Brent Hall, G.; Chipeniuk, R.; Feick, R.D.; Leahy, M.G.; Deparday, V. Community-Based Production of Geographic Information Using Open Source Software and Web 2.0. Int. J. Geogr. Inf. Sci. 2010, 24, 761–781. [Google Scholar] [CrossRef]
- Johnson, P.A.; Sieber, R.E. Situating the Adoption of VGI by Government. In Crowdsourcing Geographic Knowledge: Volunteered Geographic Information (VGI) in Theory and Practice; Springer: Dordrecht, The Netherlands, 2013. [Google Scholar]
- Coleman, D.J. Potential Contributions and Challenges of VGI for Conventional Topographic Base-Mapping Programs. In Crowdsourcing Geographic Knowledge: Volunteered Geographic Information (VGI) in Theory and Practice; Springer: Dordrecht, The Netherlands, 2013. [Google Scholar]
- European Commission. Open Science Policy Platform Recommendations. 2018. Available online: https://ec.europa.eu/research/openscience/pdf/integrated_advice_opspp_recommendations.pdf#view=fit&pagemode=none (accessed on 28 September 2020).
- Johnson, P.A. Models of Direct Editing of Government Spatial Data: Challenges and Constraints to the Acceptance of Contributed Data. Cartogr. Geogr. Inf. Sci. 2017, 44, 128–138. [Google Scholar] [CrossRef] [Green Version]
- Scassa, T. Legal Issues with Volunteered Geographic Information. Can. Geogr. 2013, 57, 1–10. [Google Scholar] [CrossRef]
- Leguina, A. A Primer on Partial Least Squares Structural Equation Modeling (PLS-SEM). Int. J. Res. Method in Educ. 2015, 38, 220–221. [Google Scholar] [CrossRef]
- Williams, J.S.; Child, D. The Essentials of Factor Analysis; Contemporary Sociology, American Sociological Association: Washington, DC, USA, 1974. [Google Scholar]
- Yong, A.G.; Pearce, S. A Beginner’s Guide to Factor Analysis: Focusing on Exploratory Factor Analysis. Tutor. Quant. Methods Psychol. 2013, 9, 79–94. [Google Scholar] [CrossRef]
- Yoon, C.; Kim, S. A Tutorial on PLS Structural Equating Modeling Using R: (Centering on) Exemplified Research Model and Data. Inf. Syst. Rev. 2014, 16, 89–112. [Google Scholar] [CrossRef]
- Hair, J.F.; Ringle, C.M.; Sarstedt, M. PLS-SEM: Indeed a Silver Bullet. J. Mark. Theory Pract. 2011, 19, 139–152. [Google Scholar] [CrossRef]
- Cortina, J.M. What Is Coefficient Alpha? An Examination of Theory and Applications. J. Appl. Psychol. 1993, 78, 98. [Google Scholar] [CrossRef]
- Fornell, C.; Larcker, D.F. Evaluating Structural Equation Models with Unobservable Variables and Measurement Error. J. Mark. Res. 1981, 18, 39–50. [Google Scholar] [CrossRef]
- Ballatore, A.; Bertolotto, M.; Wilson, D.C. Geographic Knowledge Extraction and Semantic Similarity in OpenStreetMap. Knowl. Inf. Syst. 2013, 37, 61–81. [Google Scholar] [CrossRef] [Green Version]
- Lemmens, R.; Falquet, G.; de Sabbata, S.; Jiang, B.; Bucher, B. Querying VGI by Semantic Enrichment. In European Handbook of Crowdsourced Geographic Information; Ubiquity Press: London, UK, 2016. [Google Scholar]
- Khan, Z.T.; Johnson, P.A. Coproducing Spatial Information: Exploring Government Approaches and Motivations at the Local Level. JeDEM-eJournal eDemocr. Open Gov. 2021, 13, 110–132. [Google Scholar] [CrossRef]
- Attard, M.; Haklay, M.; Capineri, C. The Potential of Volunteered Geographic Information (VGI) in Future Transport Systems. Urban Plan. 2016, 1, 6–19. [Google Scholar] [CrossRef]
- Falco, E.; Kleinhans, R. Beyond Technology: Identifying Local Government Challenges for Using Digital Platforms for Citizen Engagement. Int. J. Inf. Manag. 2018, 40, 17–20. [Google Scholar] [CrossRef]
- Ganapati, S. Using Geographic Information Systems to Increase Citizen Engagement; IBM Center for the Business of Government: Washington, DC, USA, 2010. [Google Scholar]
- Bertot, J.C.; Jaeger, P.T.; Hansen, D. The Impact of Polices on Government Social Media Usage: Issues, Challenges, and Recommendations. Gov. Inf. Q. 2012, 29, 30–40. [Google Scholar] [CrossRef]
- Rak, A.; Coleman, D.J.; Nichols, S. Legal Liability Concerns Surrounding Volunteered Geographic Information Applicable to Canada. In Proceedings of the GSDI World Conference, Quebec City, QC, Canada, 14–17 May 2012. [Google Scholar]
- World Bank. Identifying Success Factors in Crowdsourced Geographic Information Use in Government; World Bank: Washington, DC, USA, 2018. [Google Scholar]
| Latent Variables (LV) | Item Code | Descriptions of the Codes | Source |
|---|---|---|---|
| Complexity (CMP) | CMP1 | Efforts are required to use it | [15,92,93,94] |
| CMP2 | Handling the data is challenging | ||
| CMP3 | Multiple platforms exist difficult to choose and decide | ||
| CMP4 | Difficulty in searching and browsing the relevant data | ||
| Compatibility (COM) | COM1 | Compatibility with existing datasets | [15,94] |
| COM2 | Compatibility with existing database schema | ||
| COM3 | Interoperability with other GIS formats | ||
| COM4 | Some data formats and datasets are too complex | ||
| Data Quality (QTY) | QTY1 | The data quality of VGI is poor | [94,95] |
| QTY2 | VGI has limited metadata to attain quality | ||
| QTY3 | Data coverage of VGI is not uniform | ||
| QTY4 | Lack of metadata standards in VGI | ||
| QTY5 | Lack of data standards in VGI | ||
| Technological Competence (TEC) | TEC1 | It requires development of specialized web-based infrastructure | [95] |
| TEC2 | It requires maintenance of web-based platform | ||
| TEC3 | It requires analysis of VGI data | ||
| Collaboration (COL) | COL1 | It involves other stakeholders to collaborate in the data production of VGI | [95,96,97,98] |
| COL2 | It is difficult to encourage key stakeholders to use VGI-based data | ||
| COL3 | Collaboration among organizations requires growth of experience and skills within government organizations | ||
| Management Support (MGS) | MGS1 | Management support is required to change organizational priorities to use VGI | [95] |
| MGS2 | Poor planning of the VGI project fails the implementation of VGI projects | ||
| MGS3 | Permission from government organizations hampers the implementation of VGI projects | ||
| MGS4 | Restrictive top-level management’s timelines hamper VGI implementation processes | ||
| Reliability (REL) | REL1 | It is junk data as it is produced by volunteers | [95,97] |
| REL2 | Its reliability is questionable if utilized in official work | ||
| REL3 | No one guarantees the reliability of VGI data | ||
| Resources (RES) | RES1 | Additional workload is required to process the collected VGI | [95] |
| RES2 | Additional time is required to process the collected VGI | ||
| RES3 | Additional manpower is required to process the collected data | ||
| Regulatory Policy (RGP) | RGP1 | Existing policies do not promote the use of VGI data | [99] |
| RGP2 | Existing policies do not promote the inclusion of VGI data in the official working environment | ||
| RGP3 | It takes years to make new regulatory policies | ||
| Legal Liability (LEL) | LEL1 | No one is legally responsible for incorrect data | [94,100,101] |
| LEL2 | Anonymized contribution is a challenge to including VGI in the official dataset | ||
| LEL3 | Intellectual property and licensing issues are associated with VGI | ||
| Consumer Perception (COP) | COP1 | VGI data are produced by non-professionals so they are not valuable | [97] |
| COP2 | Data from non-professionals should not be mixed with official data | ||
| COP3 | No consumer perception reports are available | ||
| Job Creation (JBC) | JBC1 | Volunteers’ involvement in official work reduces government job opportunities | [Authors] |
| JBC2 | Job reduction is favorable to the sitting government | ||
| JBC3 | Less burden on employers | ||
| Community Participation (CUP) | CUP1 | Motivating contributors to participate in VGI is a challenge | [95,97] |
| CUP2 | Community support to participate in the VGI projects is required | ||
| CUP3 | Direct liaison with the contributors is required for the sustainability of the VGI project | ||
| Expected Profitability (EXP) | EXP1 | Expected profit cannot be calculated without the successful implementation of a single VGI project | [Authors] |
| EXP2 | A lot of investments are required for the implementation of the VGI project | ||
| EXP3 | No study available on the expected profitability | ||
| Suitability (SUT) | SUT1 | The common perception is that VGI is not suitable for decision making | |
| SUT2 | Empirical research studies are needed to prove the suitability of VGI for decision making | ||
| SUT3 | Policy makers’ role in advocating VGI is deficient | ||
| Readiness (RED) | RED1 | VGI readiness index needs to be developed and tested | |
| RED2 | VGI readiness use-cases are significantly very few in number | ||
| RED3 | VGI readiness concept is still in its infancy | ||
| Adoptability (ADP) | ADP1 | Atop-down approach for VGI adoptability is missing | |
| ADP2 | Common factors impeding VGI adoptability are not addressed | ||
| ADP3 | A VGI-adoptability matrix needs to be developed and tested |
| Profile Category | Frequency | Percentage (%) |
|---|---|---|
| Gender | ||
| Male | 116 | 82 |
| Female | 25 | 18 |
| Education | ||
| Postgraduate | 40 | 28 |
| Graduate | 67 | 48 |
| Undergraduate | 34 | 24 |
| Sector | ||
| Public Sector | 80 | 57 |
| Private Sector | 16 | 11 |
| Academia | 45 | 32 |
| Map Usage | ||
| Frequent | 52 | 37 |
| Often | 69 | 49 |
| Never | 20 | 14 |
| CMP | COM | QTY | TEC | MGS | REL | RGP | LEL | COP | COL | RES | JBC | CUP | EXP | SUT | RED | ADP | |
|---|---|---|---|---|---|---|---|---|---|---|---|---|---|---|---|---|---|
| CMP1 | 0.813 | −0.065 | 0.019 | 0.022 | 0.021 | −0.032 | −0.006 | −0.071 | −0.077 | −0.001 | 0.15 | 0.072 | 0.054 | −0.014 | −0.01 | −0.004 | −0.106 |
| CMP2 | 0.828 | 0.042 | −0.006 | −0.037 | 0.052 | −0.121 | 0.067 | 0.042 | −0.06 | −0.049 | 0.068 | 0.151 | −0.032 | −0.003 | −0.056 | 0.124 | −0.14 |
| CMP3 | 0.789 | 0.054 | 0.038 | −0.005 | −0.014 | 0.182 | 0.037 | −0.006 | −0.008 | 0.012 | −0.235 | −0.148 | −0.023 | 0.008 | −0.023 | −0.063 | 0.082 |
| CMP4 | 0.813 | −0.031 | −0.05 | 0.02 | −0.059 | −0.021 | −0.098 | 0.034 | 0.145 | 0.039 | 0.009 | −0.082 | 0.001 | 0.009 | 0.09 | −0.061 | 0.169 |
| COM1 | 0.028 | 0.89 | 0.043 | −0.058 | −0.108 | −0.004 | 0.017 | 0.082 | −0.02 | −0.048 | −0.071 | −0.077 | 0.066 | 0.069 | 0.074 | −0.01 | 0.035 |
| COM2 | −0.014 | 0.905 | 0.001 | 0.011 | 0.081 | 0.016 | 0.046 | −0.037 | 0.017 | 0.048 | 0.043 | −0.029 | −0.065 | −0.033 | −0.055 | 0.02 | −0.037 |
| COM3 | 0.043 | 0.913 | −0.053 | −0.014 | 0 | −0.076 | −0.046 | −0.051 | 0.013 | 0.019 | 0.031 | 0.081 | −0.029 | 0.012 | −0.008 | 0.018 | 0.013 |
| COM4 | −0.055 | 0.928 | 0.01 | 0.059 | 0.025 | 0.063 | −0.015 | 0.009 | −0.011 | −0.02 | −0.005 | 0.023 | 0.03 | −0.045 | −0.01 | −0.027 | −0.01 |
| QTY1 | 0.013 | 0.14 | 0.769 | −0.066 | 0.152 | 0.055 | 0.056 | 0.019 | −0.022 | 0.038 | −0.042 | −0.051 | −0.137 | 0.012 | 0.037 | −0.056 | 0.088 |
| QTY2 | 0.105 | −0.006 | 0.848 | −0.106 | −0.114 | −0.028 | 0.107 | −0.031 | 0.025 | −0.009 | 0.034 | 0.031 | 0.091 | −0.004 | −0.064 | −0.001 | −0.005 |
| QTY3 | −0.06 | −0.074 | 0.82 | 0.075 | −0.142 | −0.068 | −0.113 | −0.007 | −0.03 | −0.04 | 0.026 | −0.003 | 0.081 | 0.017 | 0.04 | −0.029 | 0.074 |
| QTY4 | −0.006 | −0.074 | 0.87 | 0.037 | 0.03 | −0.039 | 0.131 | 0.037 | 0.02 | −0.052 | −0.055 | 0.089 | 0.014 | 0.037 | 0.002 | 0.069 | −0.142 |
| QTY5 | −0.054 | 0.027 | 0.827 | 0.056 | 0.085 | 0.088 | −0.188 | −0.018 | 0.004 | 0.069 | 0.035 | −0.076 | −0.06 | −0.063 | −0.011 | 0.009 | 0 |
| TEC1 | 0.147 | 0.032 | 0.077 | 0.761 | −0.009 | −0.25 | −0.184 | 0.011 | −0.077 | −0.078 | 0.158 | 0.089 | −0.013 | 0.024 | 0.009 | 0.188 | −0.146 |
| TEC2 | −0.035 | −0.054 | 0.041 | 0.859 | −0.034 | 0.132 | 0.091 | −0.009 | 0.048 | 0.018 | −0.133 | −0.075 | 0.053 | 0.015 | −0.037 | −0.023 | 0.015 |
| TEC3 | −0.095 | 0.026 | −0.109 | 0.859 | 0.042 | 0.09 | 0.072 | −0.001 | 0.02 | 0.051 | −0.007 | −0.003 | −0.042 | −0.036 | 0.03 | −0.144 | 0.114 |
| MGS1 | −0.015 | 0.02 | 0 | 0.019 | 0.827 | 0.007 | 0.139 | 0.048 | −0.088 | 0.103 | 0.008 | −0.024 | 0.309 | −0.147 | −0.069 | 0.003 | −0.091 |
| MGS2 | 0.025 | 0.008 | 0.087 | −0.024 | 0.819 | −0.044 | −0.124 | 0.002 | −0.005 | −0.086 | 0.175 | −0.175 | −0.009 | −0.14 | −0.031 | −0.066 | 0.031 |
| MGS3 | 0.004 | 0.071 | −0.06 | 0.076 | 0.837 | 0.028 | −0.013 | 0.019 | −0.023 | −0.052 | −0.135 | 0.1 | −0.099 | −0.024 | 0.108 | 0.022 | 0.014 |
| MGS4 | −0.015 | −0.102 | −0.027 | −0.074 | 0.806 | 0.009 | −0.003 | −0.07 | 0.12 | 0.036 | −0.046 | 0.098 | −0.205 | 0.318 | −0.01 | 0.041 | 0.047 |
| REL1 | 0.053 | 0.003 | 0.019 | −0.063 | −0.013 | 0.928 | −0.016 | 0.009 | 0.036 | 0.025 | −0.045 | −0.031 | 0 | 0.109 | −0.032 | −0.008 | −0.012 |
| REL2 | −0.079 | −0.053 | −0.004 | 0.107 | −0.062 | 0.84 | −0.058 | 0.025 | 0.012 | −0.117 | 0.222 | −0.031 | 0.012 | −0.072 | 0.027 | 0.078 | 0.078 |
| REL3 | 0.018 | 0.045 | −0.015 | −0.033 | 0.068 | 0.932 | 0.068 | −0.031 | −0.046 | 0.081 | −0.155 | 0.059 | −0.01 | −0.044 | 0.007 | −0.063 | −0.058 |
| RGP1 | 0.021 | 0.047 | −0.026 | −0.016 | 0.131 | 0.003 | 0.935 | 0.024 | −0.033 | −0.021 | 0.018 | −0.032 | −0.035 | −0.011 | −0.054 | 0.095 | −0.031 |
| RGP2 | −0.045 | −0.028 | −0.011 | 0.025 | −0.12 | −0.042 | 0.928 | −0.025 | 0.054 | 0.014 | 0.077 | 0.048 | 0.077 | −0.008 | 0.005 | −0.05 | 0.062 |
| RGP3 | 0.024 | −0.02 | 0.038 | −0.009 | −0.013 | 0.039 | 0.924 | 0.001 | −0.02 | 0.008 | −0.096 | −0.016 | −0.042 | 0.02 | 0.05 | −0.046 | −0.031 |
| LEL1 | −0.018 | −0.01 | −0.08 | 0.061 | 0.052 | 0.029 | −0.014 | 0.897 | 0.049 | 0.036 | −0.043 | −0.042 | 0.056 | −0.043 | −0.041 | −0.009 | 0.021 |
| LEL2 | −0.01 | 0.084 | 0.048 | −0.044 | −0.145 | −0.019 | 0.016 | 0.883 | −0.035 | −0.076 | 0.007 | 0.111 | 0.093 | −0.017 | 0.043 | −0.036 | 0.004 |
| LEL3 | 0.028 | −0.071 | 0.032 | −0.018 | 0.089 | −0.01 | −0.002 | 0.923 | −0.013 | 0.038 | 0.035 | −0.065 | −0.143 | 0.058 | −0.002 | 0.044 | −0.024 |
| COP1 | 0.003 | −0.065 | 0 | −0.028 | 0.081 | 0.067 | 0.051 | −0.007 | 0.9 | 0.005 | −0.022 | 0.002 | −0.047 | −0.078 | −0.054 | −0.026 | −0.022 |
| COP2 | −0.018 | 0.068 | 0.042 | 0.007 | −0.045 | 0.014 | 0.007 | −0.015 | 0.915 | −0.037 | 0.011 | −0.003 | 0.055 | 0.055 | 0.012 | 0.048 | −0.027 |
| COP3 | 0.015 | −0.004 | −0.041 | 0.02 | −0.033 | −0.077 | −0.055 | 0.022 | 0.947 | 0.031 | 0.01 | 0.002 | −0.009 | 0.021 | 0.04 | −0.022 | 0.047 |
| COL1 | −0.003 | 0.033 | −0.058 | −0.066 | 0.089 | −0.05 | 0.036 | −0.034 | −0.001 | 0.826 | −0.081 | 0.013 | −0.069 | −0.011 | 0.095 | −0.062 | 0.019 |
| COL2 | −0.015 | −0.071 | 0.047 | 0.02 | −0.057 | 0.109 | 0.034 | −0.011 | −0.036 | 0.872 | 0.002 | 0.011 | 0.051 | 0.011 | −0.025 | 0.084 | −0.133 |
| COL3 | 0.019 | 0.043 | 0.008 | 0.044 | −0.029 | −0.065 | −0.072 | 0.046 | 0.039 | 0.826 | 0.079 | −0.025 | 0.015 | −0.001 | −0.069 | −0.026 | 0.121 |
| RES1 | 0.147 | 0.017 | −0.008 | −0.091 | 0.104 | 0.441 | −0.061 | 0.009 | −0.027 | 0.036 | 0.705 | −0.098 | −0.04 | 0.178 | −0.065 | −0.015 | −0.189 |
| RES2 | −0.127 | −0.027 | 0.035 | 0.116 | −0.117 | −0.081 | −0.033 | 0.012 | 0.109 | −0.132 | 0.828 | −0.106 | 0.085 | 0.007 | 0.142 | 0.115 | −0.063 |
| RES3 | 0.002 | 0.013 | −0.029 | −0.039 | 0.03 | −0.302 | 0.087 | −0.02 | −0.088 | 0.104 | 0.808 | 0.194 | −0.052 | −0.162 | −0.088 | −0.105 | 0.229 |
| JBC1 | 0.019 | −0.019 | 0.067 | 0.045 | −0.025 | 0.02 | 0.02 | −0.045 | −0.01 | −0.005 | −0.034 | 0.91 | 0.066 | −0.022 | 0.03 | −0.05 | 0.104 |
| JBC2 | 0.023 | −0.011 | 0.049 | −0.075 | −0.123 | −0.074 | −0.146 | −0.019 | −0.033 | −0.037 | 0.112 | 0.9 | 0.045 | 0.098 | 0.047 | −0.033 | 0.063 |
| JBC3 | −0.046 | 0.033 | −0.126 | 0.031 | 0.161 | 0.058 | 0.137 | 0.07 | 0.048 | 0.046 | −0.085 | 0.831 | −0.12 | −0.082 | −0.084 | 0.09 | −0.182 |
| CUP1 | 0.021 | −0.053 | −0.003 | 0.059 | −0.069 | −0.066 | −0.038 | 0.024 | 0.031 | 0.009 | 0.071 | −0.013 | 0.95 | 0.042 | −0.034 | −0.004 | 0.005 |
| CUP2 | −0.047 | 0.026 | −0.004 | −0.023 | 0.061 | 0.058 | 0.04 | −0.002 | −0.029 | 0.008 | −0.048 | −0.009 | 0.957 | −0.022 | 0.052 | 0.025 | −0.051 |
| CUP3 | 0.026 | 0.026 | 0.007 | −0.036 | 0.008 | 0.007 | −0.003 | −0.022 | −0.002 | −0.017 | −0.022 | 0.022 | 0.958 | −0.02 | −0.018 | −0.022 | 0.046 |
| EXP1 | 0.035 | −0.036 | −0.023 | 0.03 | 0.053 | −0.072 | 0.057 | −0.022 | −0.016 | 0.075 | 0.011 | 0.002 | 0.007 | 0.93 | 0.013 | −0.043 | −0.061 |
| EXP2 | 0.013 | 0.007 | −0.005 | 0.001 | 0.037 | 0.013 | −0.028 | −0.021 | −0.013 | −0.074 | −0.021 | −0.007 | 0.006 | 0.929 | −0.02 | 0.093 | 0.003 |
| EXP3 | −0.048 | 0.029 | 0.028 | −0.032 | −0.091 | 0.059 | −0.029 | 0.043 | 0.03 | 0 | 0.01 | 0.005 | −0.013 | 0.925 | 0.006 | −0.05 | 0.059 |
| SUT1 | 0.027 | −0.008 | 0.02 | 0.052 | −0.053 | −0.053 | 0.035 | −0.012 | 0.025 | −0.028 | 0.007 | 0.183 | 0.058 | 0.091 | 0.859 | −0.018 | 0.065 |
| SUT2 | 0.008 | −0.033 | −0.01 | 0.03 | −0.025 | 0.04 | −0.058 | 0.061 | −0.024 | −0.027 | −0.008 | −0.113 | 0.015 | −0.051 | 0.905 | 0.018 | 0.031 |
| SUT3 | −0.033 | 0.041 | −0.009 | −0.08 | 0.075 | 0.01 | 0.025 | −0.05 | 0.001 | 0.053 | 0.002 | −0.061 | −0.07 | −0.035 | 0.908 | −0.001 | −0.092 |
| RED1 | 0.002 | −0.096 | 0.021 | 0.039 | −0.055 | 0.043 | −0.047 | −0.03 | 0.006 | 0.056 | 0.025 | 0.042 | 0.048 | −0.004 | −0.053 | 0.886 | −0.16 |
| RED2 | 0.039 | 0.002 | −0.027 | 0.01 | 0.026 | 0.004 | 0.163 | 0.043 | 0.038 | −0.022 | −0.037 | 0.022 | −0.01 | −0.069 | 0.015 | 0.909 | −0.057 |
| RED3 | −0.044 | 0.098 | 0.007 | −0.051 | 0.029 | −0.049 | −0.126 | −0.015 | −0.048 | −0.035 | 0.013 | −0.068 | −0.039 | 0.079 | 0.04 | 0.845 | 0.229 |
| ADP1 | −0.023 | 0.011 | −0.013 | 0.007 | 0.046 | 0.06 | −0.088 | 0.016 | 0.012 | −0.05 | −0.018 | −0.124 | −0.026 | 0.015 | −0.007 | 0.06 | 0.891 |
| ADP2 | 0.018 | −0.03 | 0.021 | −0.042 | −0.067 | 0.008 | 0.206 | 0.001 | 0.042 | 0.004 | −0.004 | 0.019 | 0.049 | 0.046 | 0.037 | 0.051 | 0.922 |
| ADP3 | 0.004 | 0.02 | −0.008 | 0.035 | 0.022 | −0.068 | −0.125 | −0.017 | −0.055 | 0.045 | 0.022 | 0.104 | −0.024 | −0.063 | −0.032 | −0.113 | 0.895 |
| DG’s rho (Composite Reliability) | Cronbach’s α | |
|---|---|---|
| CMP | 0.885 | 0.826 |
| COM | 0.95 | 0.93 |
| QTY | 0.916 | 0.884 |
| TEC | 0.867 | 0.768 |
| MGS | 0.893 | 0.84 |
| REL | 0.928 | 0.883 |
| RGP | 0.95 | 0.921 |
| LEL | 0.928 | 0.884 |
| COP | 0.944 | 0.91 |
| COL | 0.879 | 0.794 |
| RES | 0.825 | 0.68 |
| JBC | 0.912 | 0.855 |
| CUP | 0.969 | 0.952 |
| EXP | 0.949 | 0.92 |
| SUT | 0.92 | 0.87 |
| RED | 0.912 | 0.855 |
| ADP | 0.93 | 0.886 |
| AVE | Full Collinearity VIFs | |
|---|---|---|
| CMP | 0.657 | 1.719 |
| COM | 0.826 | 1.085 |
| QTY | 0.685 | 1.747 |
| TEC | 0.685 | 1.651 |
| MGS | 0.676 | 2.94 |
| REL | 0.812 | 2.128 |
| RGP | 0.864 | 2.597 |
| LEL | 0.812 | 1.449 |
| COP | 0.848 | 1.472 |
| COL | 0.708 | 1.821 |
| RES | 0.612 | 2.345 |
| JBC | 0.776 | 1.911 |
| CUP | 0.912 | 1.953 |
| EXP | 0.862 | 1.754 |
| SUT | 0.794 | 1.652 |
| RED | 0.775 | 2.26 |
| ADP | 0.815 | 3.081 |
| CMP | COM | QTY | TEC | MGS | REL | RGP | LEL | COP | COL | RES | JBC | CUP | EXP | SUT | RED | ADP | |
|---|---|---|---|---|---|---|---|---|---|---|---|---|---|---|---|---|---|
| CMP | 0.811 | ||||||||||||||||
| COM | 0.152 | 0.909 | |||||||||||||||
| QTY | 0.346 | 0.106 | 0.828 | ||||||||||||||
| TEC | 0.505 | 0.12 | 0.331 | 0.828 | |||||||||||||
| MGS | 0.377 | 0.059 | 0.432 | 0.286 | 0.822 | ||||||||||||
| REL | 0.483 | 0.201 | 0.333 | 0.418 | 0.324 | 0.901 | |||||||||||
| RGP | 0.248 | 0.178 | 0.28 | 0.287 | 0.181 | 0.34 | 0.929 | ||||||||||
| LEL | 0.281 | 0.155 | 0.392 | 0.262 | 0.286 | 0.251 | 0.164 | 0.901 | |||||||||
| COP | 0.285 | 0.119 | 0.417 | 0.243 | 0.415 | 0.319 | 0.122 | 0.266 | 0.921 | ||||||||
| COL | 0.33 | 0.15 | 0.485 | 0.432 | 0.387 | 0.319 | 0.22 | 0.483 | 0.357 | 0.842 | |||||||
| RES | 0.377 | 0.194 | 0.264 | 0.388 | 0.3 | 0.584 | 0.621 | 0.177 | 0.202 | 0.26 | 0.782 | ||||||
| JBC | 0.417 | 0.135 | 0.467 | 0.315 | 0.519 | 0.473 | 0.202 | 0.361 | 0.41 | 0.403 | 0.28 | 0.881 | |||||
| CUP | 0.306 | 0.08 | 0.242 | 0.151 | 0.666 | 0.242 | 0.105 | 0.195 | 0.342 | 0.332 | 0.15 | 0.352 | 0.955 | ||||
| EXP | 0.342 | 0.08 | 0.21 | 0.325 | 0.545 | 0.405 | 0.139 | 0.295 | 0.151 | 0.274 | 0.246 | 0.39 | 0.334 | 0.928 | |||
| SUT | 0.393 | 0.132 | 0.382 | 0.377 | 0.379 | 0.382 | 0.33 | 0.314 | 0.204 | 0.4 | 0.347 | 0.469 | 0.259 | 0.379 | 0.891 | ||
| RED | 0.253 | 0.118 | 0.254 | 0.297 | 0.203 | 0.321 | 0.601 | 0.165 | 0.169 | 0.307 | 0.42 | 0.252 | 0.126 | 0.152 | 0.368 | 0.88 | |
| ADP | 0.371 | 0.183 | 0.307 | 0.35 | 0.245 | 0.37 | 0.705 | 0.215 | 0.185 | 0.307 | 0.526 | 0.32 | 0.18 | 0.217 | 0.441 | 0.723 | 0.903 |
| Hypothesis | Path | Std. Error | Path Coefficient | p-Value | Result |
|---|---|---|---|---|---|
| H1 | CMP -> SUT | 0.06 | 0.113 | 0.029 | Accept |
| H2 | COM -> SUT | 0.059 | 0.143 | 0.008 | Accept |
| H3 | QTY -> SUT | 0.06 | 0.066 | 0.137 | Reject |
| H4 | TEC -> SUT | 0.06 | 0.112 | 0.03 | Accept |
| H5 | MGS -> SUT | 0.059 | 0.115 | 0.027 | Accept |
| H6 | REL -> SUT | 0.06 | 0.111 | 0.031 | Accept |
| H7 | COL-> SUT | 0.06 | 0.089 | 0.068 | Reject |
| H8 | COL -> RED | 0.059 | 0.124 | 0.019 | Accept |
| H9 | RES -> RED | 0.057 | 0.327 | <0.001 | Accept |
| H10 | RGP -> SUT | 0.059 | 0.128 | 0.016 | Accept |
| H11 | LEL -> SUT | 0.06 | 0.077 | 0.098 | Reject |
| H12 | COP -> SUT | 0.06 | −0.103 | 0.043 | Accept |
| H13 | JBC -> RED | 0.06 | 0.108 | 0.035 | Accept |
| H14 | CUP -> RED | 0.06 | −0.087 | 0.074 | Reject |
| H15 | EXP -> RED | 0.06 | −0.107 | 0.037 | Accept |
| H16 | SUT -> ADP | 0.059 | 0.2 | <0.001 | Accept |
| H17 | RED -> ADP | 0.054 | 0.655 | <0.001 | Accept |
Publisher’s Note: MDPI stays neutral with regard to jurisdictional claims in published maps and institutional affiliations. |
© 2022 by the authors. Licensee MDPI, Basel, Switzerland. This article is an open access article distributed under the terms and conditions of the Creative Commons Attribution (CC BY) license (https://creativecommons.org/licenses/by/4.0/).
Share and Cite
Ahmad, M.; Khayal, M.S.H.; Tahir, A. Analysis of Factors Affecting Adoption of Volunteered Geographic Information in the Context of National Spatial Data Infrastructure. ISPRS Int. J. Geo-Inf. 2022, 11, 120. https://doi.org/10.3390/ijgi11020120
Ahmad M, Khayal MSH, Tahir A. Analysis of Factors Affecting Adoption of Volunteered Geographic Information in the Context of National Spatial Data Infrastructure. ISPRS International Journal of Geo-Information. 2022; 11(2):120. https://doi.org/10.3390/ijgi11020120
Chicago/Turabian StyleAhmad, Munir, Malik Sikandar Hayat Khayal, and Ali Tahir. 2022. "Analysis of Factors Affecting Adoption of Volunteered Geographic Information in the Context of National Spatial Data Infrastructure" ISPRS International Journal of Geo-Information 11, no. 2: 120. https://doi.org/10.3390/ijgi11020120
APA StyleAhmad, M., Khayal, M. S. H., & Tahir, A. (2022). Analysis of Factors Affecting Adoption of Volunteered Geographic Information in the Context of National Spatial Data Infrastructure. ISPRS International Journal of Geo-Information, 11(2), 120. https://doi.org/10.3390/ijgi11020120