Article

Site Selection of Natural Gas Emergency Response Team Centers in Istanbul Metropolitan Area Based on GIS and FAHP

by
Mehmet Şerif Sarıkaya
*,
Mustafa Yanalak
and
Himmet Karaman
Geomatics Engineering Department, Faculty of Civil Engineering, Istanbul Technical University, Sariyer, 34469 Istanbul, Turkey
*
Author to whom correspondence should be addressed.
ISPRS Int. J. Geo-Inf. 2022, 11(11), 571; https://doi.org/10.3390/ijgi11110571
Submission received: 21 August 2022 / Revised: 6 November 2022 / Accepted: 14 November 2022 / Published: 16 November 2022

Abstract

:
The location of natural gas emergency response team centers (NGERTCs) is critical in terms of addressing natural gas notifications that require a timely emergency response. The selection of NGERTCs in Istanbul has an important place in terms of providing better service, due to the necessity of responding to emergency natural gas notifications within 15 min, in addition to the over 200,000 natural gas notifications per year and heavy traffic conditions. Therefore, this study proposes a solution based on GIS and FAHP to determine suitable NGERTC locations in Istanbul Metropolitan Area. In the first stage of the study, the required 15-min coverage areas for emergency calls for 36 existing NGERTCs in Istanbul were extracted and the adequacy of their locations was analyzed. In the second stage of the study, the weights of seven criteria determined for new NGERTC site selection were calculated by the FAHP method. With spatial analysis made, 12 new NGERTC locations were proposed. Finally, re-coverage analysis was performed for proposed and existing NGERTCs, and changes in coverage area within a 15 min response time were analyzed. Natural gas network coverage increased from 70.04% to 83.86%, and natural gas subscriber coverage increased from 91.03% to 96.27%. The results show that GIS and FAHP are worth using in selecting suitable NGERTC locations.

1. Introduction

With an increasing need for energy in the world, the trend towards natural gas, one of the most important energy sources has also increased [1]. Natural gas, which has low greenhouse gas emission values, is known as the cleanest fossil fuel source today [2,3]. In transitioning to a low-carbon economy, natural gas is preferable to coal and oil [4]. Natural gas, which provides about a quarter of energy needs globally [5], is also a fossil fuel with the fastest increasing usage rate [6]. Growing industrialization and urbanization, along with rapid population growth, has made the use of natural gas important for heating and electricity production [7]. This situation has led to the preference of using natural gas instead of coal in cities [8,9,10]. The use of natural gas is included in the long-term energy plans of cities all over the world as a sustainable, reliable, and economical option [11,12]. For this reason, the number of residences and workplaces using natural gas in cities is increasing day by day. Natural gas is generally used to meet the basic needs of heating, hot water, and cooking. When natural gas consumption rates across the world are examined, urban areas are have the highest consumption with a rate of over 80% [13].
Although natural gas is a cleaner-burning fossil fuel, it is classified as a dangerous substance due to its flammability [14]. For this reason, natural gas leaks can lead to explosive hazards [15,16]. Natural gas is not a toxic gas, but natural gas leaking in a confined space can replace oxygen and cause death by suffocation [17]. In addition, carbon monoxide poisoning occurs due to the incomplete combustion of natural gas [18]. Apart from these situations, human errors and equipment failures can cause emergencies in the use of natural gas [19]. The existence of rapid, effective, and comprehensive response plans is important to ensure the continuity and safety of gas supply in emergencies. It is critical in terms of life and property safety that natural gas notifications are responded to promptly by expert teams in any situation that requires emergency intervention. For this reason, natural gas distribution companies have natural gas emergency response teams consisting of engineers and technicians [20,21,22].
When natural gas subscribers can detect a natural gas smell in residences and workplaces, such as in a natural gas service box at the entrance of a building, in an apartment or stairwell or on the streets outside a building, and realize that natural gas equipment is damaged, or in the event of an emergency, they can call national natural gas emergency lines that provide 24/7 service and report notifications to a natural gas distribution company [23]. Natural gas distribution companies must correctly position their emergency response teams in their service areas to respond to incoming notices in a timely manner. The locations of NGERTC are of vital importance, especially in metropolitan areas due to population and traffic density. Correct positioning of NGERTCs is one of the most important factors in reducing the response time after notification.
According to emergency response article 61 in Part 2 of the operation and service obligations under Part 3 of the natural gas market distribution and customer services regulation list of the Republic of Turkey Energy Market Regulatory Authority (EMRA), natural gas distribution companies must organize their teams to respond to notifications that require urgent action within fifteen minutes at the most [24]. For this reason, natural gas distribution companies need to be sensitive in choosing a location while planning their emergency response team centers. Especially in metropolitan cities such as Istanbul, the determination and implementation of site selection criteria are more vital. In the metropolis of Istanbul, which has a population of 16 million and natural gas subscribers of over 6.5 million, over 200,000 natural gas notifications are received annually [25]. The 15 min response time to emergency notifications specified in the legislation is sometimes exceeded in the province of Istanbul, which has a crowded population, dense urban settlement area and major traffic problems. This situation has led to a need for the correct planning of new NGERTC to be opened to achieve the target of an average response time of 15 min in the Istanbul metropolitan area. This study attempts to find a solution to this problem.
In general, most emergency service center location studies in the literature focus on the planning of ambulance and fire stations; no study has been found on natural gas emergency response team centers (NGERTC) location selection. The important factor in this is an assumption that the proposed approach and developed methods can be applied to most of the services that require emergency intervention. Although the problems are similar for these services, there can be important differences between them. Location selection has critical importance in the natural gas sector, as in all emergency services. In order to minimize damage, the response time to natural gas emergency calls is very important. In this context, this article investigates the most appropriate location selection method by examining fire and ambulance station location selection studies and methods, which serve as an example for the determination of NGERTC locations.
Many studies have been carried out to solve emergency service center location problems. Optimization models, multi-criteria decision making (MCDM) techniques and GIS methods were used in a majority of these studies. The first methods used for emergency service centers were mostly optimization models aiming at maximum coverage with a minimum number of centers [26,27,28]. Heuristic and metaheuristic optimization algorithms that can produce more comprehensive solutions have been applied, including constraints such as intervention time, call frequency, number of vehicles, traffic, cost, etc. [29,30,31]. Geographical information systems technology, which is actively used in spatial query and analysis processes, is preferred in selecting emergency service center locations with higher accuracy. Liu et al. [32] used integrated geographic information systems, multi-objective programming, and ant colony (ANT) approaches for location selection of new fire stations. In this study, it was considered that fire stations should be placed in such a way that they can serve the maximum area possible and at the same time reduce access times to accident zones. In Aktas et al. [33], fire station selection studies in the city of Istanbul are based on the integration of geographic information systems and thecluster coverage model. New stations have been proposed aiming to receive notifications in five minutes at the latest and to have 100% coverage. Spatial decision support systems are used by integrating GIS and MCDM methods in emergency service center location selection studies [34,35,36]. Erden and Çoşkun [37] conducted a fire station site selection study in Istanbul with the help of geographic information systems and the analytical hierarchy method, which is a MCDM technique. In their study, criteria such as population, traffic and risky areas were used to determine the most suitable fire station locations. Wang [38] created a multi-criteria decision-making method by using a fuzzy analytic hierarchy method and a geographic information system to decide the locations of fire stations. Swalehe and Aktas [39] carried out a study to reduce ambulance response times for the Odunpazarı district. In their work, they aimed to place ambulances according to demand and to ensure that the maximum ambulance demand coverage was realized with a small ambulance fleet. For this, the system state management technique and maximum coverage problem optimization model were used. By using GIS, the most suitable ambulance stations, which can be reached within 5 min by ambulance, were determined. Ateş et al. [40] found the most appropriate locations for ambulance stations providing emergency health services with GIS based on the standard average response time of 8 min. Terzi et al. [41] used a buffer analysis of the geographic information system to calculate 10-min coverage areas of ambulance stations. It was observed that changes in service areas have not been examined in detail in emergency service center location selection studies in the literature. In site selection planning, the spatial efficiency of the centers, spatial accessibility and relevant site selection criteria should be considered holistically. The contribution of this article is the proposal of a GIS-based fuzzy MCDM site selection model, which considers the adequacy and service area coverage of existing NGERTCs. In addition, the site selection study was carried out with the service area constraint of existing NGERTCs. Finally, results were evaluated in an integrated manner.
The literature review of emergency service center location studies highlighted that; many different criteria were used according to the scenarios preferred by the authors. At the same time, in the literature, it is seen that criteria such as distance to existing centers, proximity to main roads, population density, call frequency, and coverage area were frequently used [42,43,44]. However, based on the studies on natural gas safety [45,46,47] and national natural gas emergency response plans [20,48,49], this study used a holistic evaluation by adding important criteria such as proximity to natural gas lines and proximity to regulating stations. In addition, the opinions of three academics who are experts in spatial decision support and ten experts working on a natural gas emergency response team were considered in the weighting of the criteria in this study.
For the weighting of the criteria chosen for this study, multi-criteria decision-making methods (MCDMs) were investigated. The Analytical Hierarchy Method (AHP), developed by Thomas L. Saaty, is one of the most frequently used multi-criteria approaches. AHP enables the solution of complex problems; it can evaluate quantitative and qualitative criteria in decision-making, by considering them in a hierarchical structure. However, it has been criticized for its inability to use exact values to address the opinions of decision makers and to handle the ambiguity and carelessness in the pairwise comparison process [50,51]. Therefore, Fuzzy AHP (FAHP) was developed to express the uncertainty of the decision maker in making choices [52]. In FAHP, fuzzy numbers are used instead of exact numbers in pairwise comparisons. The weighting of the criteria with FAHP alleviates the difficulty in deciding and ensures that the weighted values obtained in line with the decisions of the decision makers give more accurate results.
Many researchers in literature have used the fuzzy AHP approach for different site selection problems [53,54,55,56]. After determining the criteria and giving the weight values, operations such as collecting, digitizing, and organizing the data of the criteria can be done with the help of GIS. There are various studies for the site selection problem that use the fuzzy analytic hierarchy method and GIS for SDSS. For example, these include site selection of solar farms [57], electric vehicle charging stations [58], landfill gas extraction facilities [59], and fire station sites [60].
In this study, a solution based on GIS and FAHP was proposed to determine the optimal locations of new NGERTCs. In this context, the contributions of this study to the literature can be summarized as follows:
-
No study has been found in the literature for the NGERTC site selection problem. With this study, a NGERTC site selection study was conducted for the first time and an important contribution was made to the literature.
-
The GIS-based FAHP method, which is used in many site-related selection studies, was used for the first time in a NGERTC site selection study. The results obtained show that this method is worth using in the determination of NGERTC locations.
-
In the literature, the change in the coverage of existing and proposed centers in GIS-based MCDM models applied for the problem of location selection of emergency response centers has not been examined in detail. This study fills this gap by examining the change in coverage area of existing and proposed NGERTCs within a 15 min response time in terms of accessibility to natural gas lines and natural gas subscribers.
-
In order to facilitate the solution of the NGERTC site selection problem, seven main site selection criteria are proposed by examining emergency response centers site selection, natural gas safety studies, and national natural gas emergency response plans in the literature. This study proposes site selection criteria for NGERTCs for the first time. This set of criteria provides a scientific framework and precedent for future NGERTC site selection studies. At the same time, the weighting of criteria was done comprehensively and consistently using FAHP in this study.
-
NGERTC site selection planning is very important in terms of life, property, and environmental safety in metropolises where natural gas use is intense. The study area was chosen as the Istanbul metropolitan area, which is the most populated city in Europe, with approximately 98% of its population using natural gas. In the current study, a spatial decision-making model for the NGERTC location selection problem was proposed based on metropolitan conditions where natural gas usage is intense.
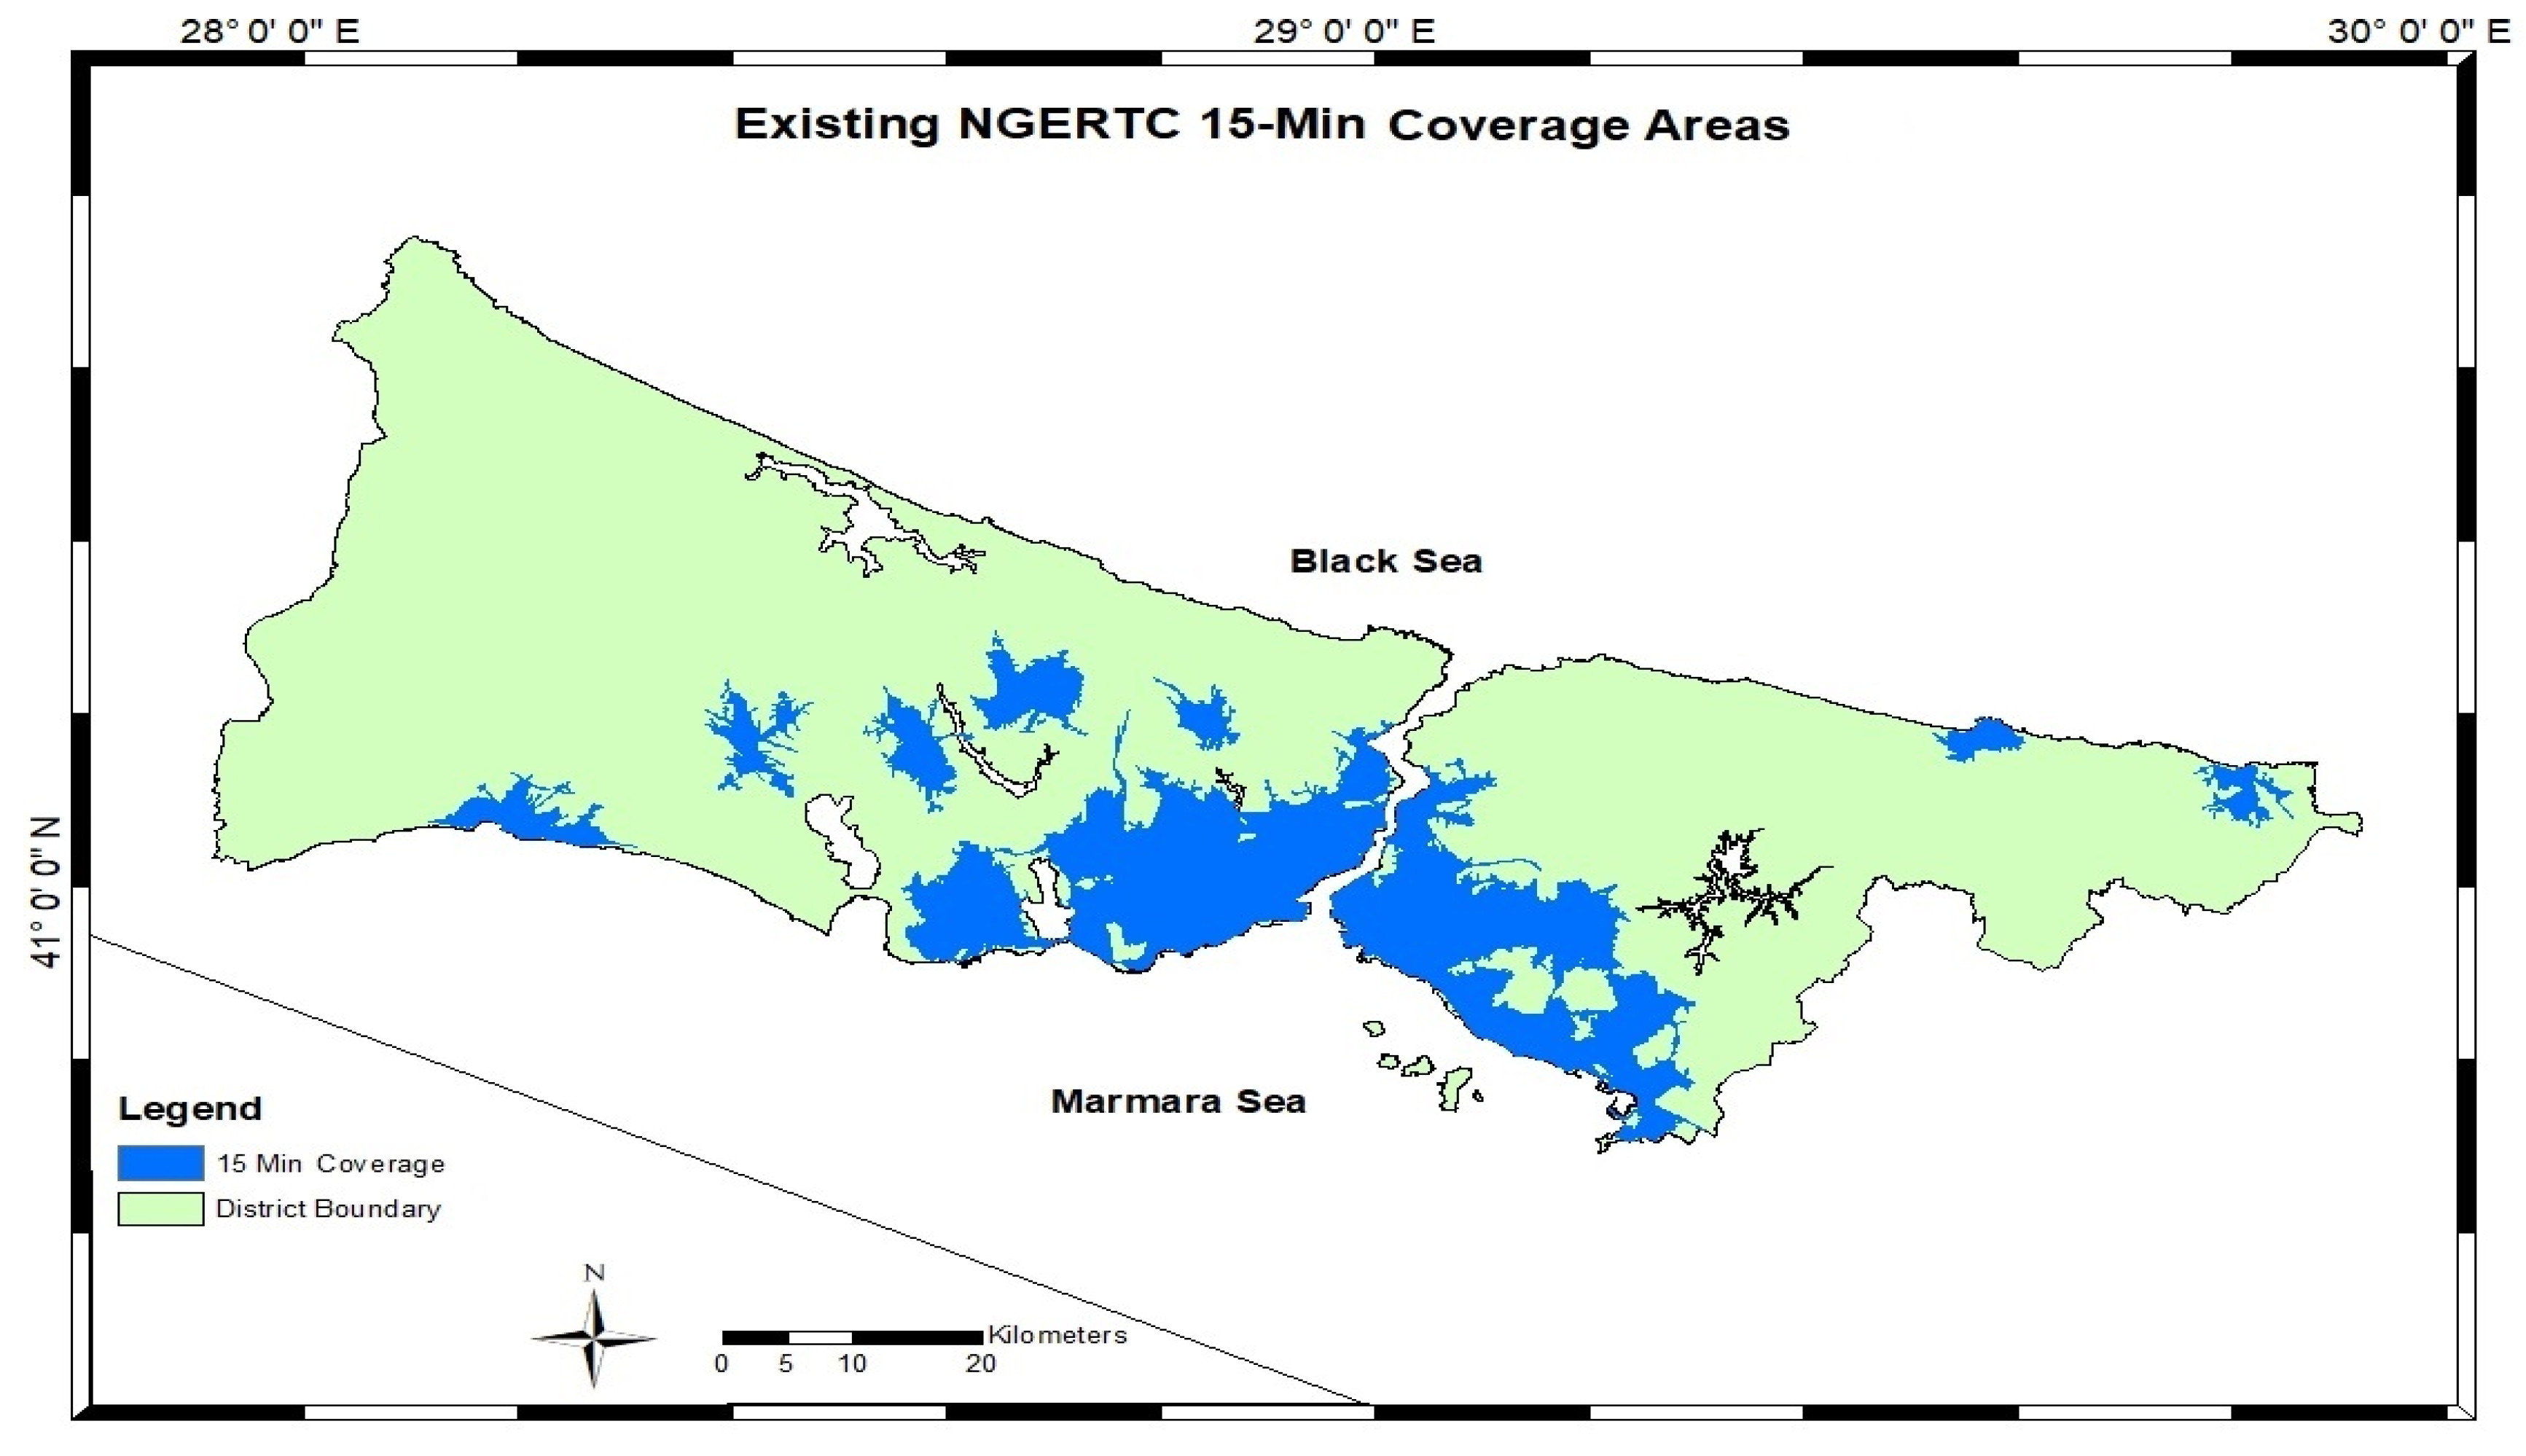
The main purpose of this study is to provide optimum location selection for new NGERTCs for the fastest and most effective response to natural gas notifications in the Istanbul metropolitan area. Firstly, 15 min coverage areas of existing NGERTCs were examined in the study. As a result of the network analysis, it was understood that the 15-min service areas were insufficient for the 26 existing NGERTCs due to the large working area, traffic density, or location. Spatial analyses were made with the integration of GIS and the fuzzy analytical hierarchy method (FAHP). As a result of the analyses, a location suggestion was made for the new NGERTCs. Within the scope of this study, the fuzzy analytic hierarchy method was chosen as a multi-criteria decision-making method, as it was possible to provide evaluation of uncertain judgments. Finally, the improvement in the 15-min coverage with a proposed 12 new NGERTCs was examined. This study also aims to make an important contribution to the literature, as it is the first study to determine locations of NGERTCs.
In the first section of the article, the importance of the use of natural gas in cities, the status of natural gas notifications, a literature review of emergency service centers site selection, and the purpose and method of the research are mentioned. In Section 2, the study area is specified. Section 3 outlines the methodology that is used. In Section 4 the analyses are discussed. Finally, in Section 5, conclusions and recommendations are given.

2. Study Area

Located in the north of the Marmara region of Turkey, Istanbul has coasts on the Marmara and Black Seas. It is located in both Europe and Asia, with latitude 41°00′16″ and longitude 28°58′59″. The surface area of Istanbul is 5461 km2. With a population approaching 16 million, it is the fourteenth largest city in the world and the most populous city in Europe and Turkey. It is one of the most important metropolises of Turkey with its ever-increasing population and growing economy.
The Istanbul metropolis, which consists of 39 districts and 988 neighborhoods as shown in Figure 1, was chosen as the study area. With the start of natural gas distribution activities in 1989, there has been a rapid transition from coal to natural gas in the city.
As seen in Figure 2, while there were 1.5 million natural gas subscribers in Istanbul in 2000, this number reached over 6.5 million subscribers in 2019. With this number of subscribers, Istanbul is the city with the highest number of natural gas subscribers in Europe. Nearly 38% of Turkey’s current natural gas subscribers are located in Istanbul [25]. Istanbul has the largest natural gas network line in Turkey, with a natural gas distribution line length of 23,967 km.
In many cities in the world, different communication channels are used for natural gas users to report notices. The most widely used method is the national natural gas emergency line, which provides 24/7 service. In the city of Istanbul, which has a high subscriber and notification density, the natural gas emergency line “187” is used so that the subscribers can report the notifications. At the point of responding to the notifications, each country implements its own national emergency management and operation plan. According to these plans, the response time to notifications may differ between countries. For example, it is necessary to respond to notifications within 15 min in Turkey, 30 min in Portugal, and 1 h in England [61,62]. In many countries, there is no legally defined period, and it is stated that the notifications should be responded to as soon as possible. At the same time, fire brigade and ambulance teams can also intervene in cases of an explosion, fire, injury, or similar incidents caused by natural gas.

Current Situation of NGERTCs in the Study Area

Natural gas notifications in Istanbul are responded to 24/7 by 553 personnel in 36 NGERTCs. As can be seen in Table 1, 32 separate natural gas intervention zones have been created by Istanbul gas distribution company (IGDAS) in the Istanbul metropolitan area in order to respond to the notifications in an effective and timely manner. Each NGERTC can only intervene in natural gas notifications in the regions where they are located. There may be more than one center in some regions, depending on the notification, subscriber density, and size of the region. For example, there are two NGERTCs in the natural gas emergency response zones of Çatalca, Kağıthane, Fulya, and Şile. There is one NGERTC in the remaining 28 natural gas emergency response zones. In total, there are 36 NGERTCs in 32 natural gas intervention zones, which were determined by the Istanbul gas distribution company (IGDAS).
On average, over 200,000 notifications are responded to annually. At the same time, the safety, periodical maintenance, and control of infrastructure and superstructure facilities are also carried out by natural gas emergency response teams. These teams work in three shifts. The first shift is scheduled to work 07:00–15:00, the second shift 15:00–23:00, the third shift between 23:00 and 07:00, with at least two crews and four people in each shift. Table 1 shows the number of NGERTCs, natural gas emergency response personnel, notification type (requiring and not requiring urgent intervention) and subscribers by region for 2019. As seen in Figure 3, NGERTCs generally consist of detached buildings, these are structures with an average area of 300 m2 with a parking lot and an area where emergency response teams can rest comfortably and place their equipment. There is typically a dressing room, equipment room, kitchen, WC, and technical team and storage rooms in the building.
These teams take an active role in disasters and emergencies apart from natural gas notifications and routine natural gas network control. Especially in the case of disasters and emergencies that may occur in the metropolis of Istanbul, which has a large natural gas network operation, natural gas emergency response teams have great responsibilities Controlled and rapid resolution of these cases of disasters and emergencies by the teams is very important in terms of safeguarding human life, ensuring the safety of structures and facilities, reducing the environmental effects of methane emissions and the resultant economic losses, and securing the energy supply. Emergency response teams are trained against possible risks that may arise in the natural gas network in the case of disasters and emergencies; periodic checks are made on natural gas lines, and disaster drills are frequently carried out. According to the size of the disaster and emergency, natural gas emergency response teams first make a damage assessment. They are responsible for securing the natural gas network as soon as possible, depending on the damage. When necessary, these teams are responsible for interrupting gas flow to ensure natural gas supply security, evacuating the gas in the lines safely, supplying natural gas to the facilities with priority in using gas, repairing the damaged natural gas lines, and normalizing the natural gas network [63,64]. In disasters and emergencies, NGERTCs are the primary logistics areas of use. For this reason, their location also has strategic importance.

3. Materials and Methods

This article explores optimum location selection based on spatial decision support systems for new NGERTCs in the Istanbul metropolitan area. Therefore, this study starts with the determination of the most suitable locations and coverage areas for NGERTCs to improve the current status. In this context, the workflow of the study was created as in Figure 4 to simplify the detailed process steps. First of all, the study area was determined, and spatial and non-spatial data of the study area were collected. A spatial database for the study area was created by converting obtained data into a vector format.
These digitization processes were carried out with Esri ArcGIS 10.5 software. A geographical coordinate system, ITRF92, datum: D_GRS_1980, was used for all data layers. After the GIS data of the study area were prepared, 15 min coverage areas of 36 existing NGERTCs were calculated by a network analysis method. For the new NGERTCs, which may be added in plans for the improvement of the current situation, the examples in the literature were examined, and seven main site selection criteria were determined. The weights of the criteria were calculated by the FAHP method as mentioned in Section 2. As seen in Figure 5, a location selection analysis model was created in Arcgis’s ModelBuilder interface to simplify the spatial analyses progress. The criteria were imported to the model in vector data format. Raster analysis was performed on notification and subscriber density criteria. Spatial analysis was performed using the Euclidean distance method for the criteria of natural gas lines, main roads, regional markets, existing NGERTCs and district regulating stations. All vector data were converted to raster data with 25 m × 25 m cell resolution and analyses were performed. With the reclassification analysis, conformity values between 1 and 5 were assigned according to the class ranges determined by the criteria. The map layers of the classified criteria were combined using a weighted overlay spatial analysis tool, and a suitability analysis was performed. From the obtained suitability analysis map, the areas that were within the 15 min coverage area of the existing NGERTCs and that did not use natural gas were removed. After this process, suitable places were determined for the new NGERTCs. As a result of this analysis, it was suggested to establish 12 new NGERTCs. Finally, a 15-min coverage analysis was made for 12 proposed NGERTCs and 36 existing NGERTCs using the network analysis method, and the change in coverage area was examined.

3.1. Service Area Analysis

In this study, the current positions of 36 NGERTCs in the Istanbul metropolitan area were evaluated within the scope of the obligation to respond to emergency notifications within 15 min in EMRA natural gas market legislation. In order to determine the service areas of the NGERTCs with 15 min access, a network dataset modeling the transportation network was created. The road data were created in accordance with the network analysis. In the attribute table of the road data, the road traffic direction, and speed as well as, road length and type information required for network analysis were entered according to the beginning and ending vertices of the vector drawings. Three different road types were defined, and average speed limits were determined based on Istanbul’s heavy traffic hours. These have been determined as 90 km/h for highways, 60 km/h for main roads and 30 km/h for local streets. Network analysis extension of ArcGIS 10.5 software was used to perform network analysis. First, the service areas of 36 NGERTC with 15-min access were examined, and it was determined that they covered 70.04% of the natural gas lines and 91.03% of natural gas subscribers (Figure 6).
Afterward, a comparison analysis was made of the 15 min access service areas of each NGERTC and the emergency response zone boundaries. The percentage of natural gas networks and natural gas subscribers covered by the 15 min service area of each NGERTC in the working area is given in Table 1. As a result of the network analysis, it was understood that NGERTC 15 min service areas were insufficient.

3.2. Site Selection Criteria

Seven criteria were selected to determine the suitable locations of new NGERTCs to be opened in Istanbul. These criteria were determined by a comprehensive review of the studies in the literature that reported on (i) site selection of ambulance and fire stations [26,27,34,35,37,38,39,41,61], (ii) natural gas safety [47,48,49] and (iii) national natural gas emergency response plans [20,50,51]. The criteria determined for this study were natural gas subscriber density, natural gas notification density, proximity to natural gas lines, proximity to main roads, distance to regional markets, distance to existing NGERTC, and proximity to district regulating stations. Table 2 provides a detailed description of the seven criteria used in this study. As listed in Table 3, criteria data were obtained from various institutions.
A GIS data layer was created for each criterion. In this study, spatial analysis and visualization of the data were performed using GIS. Spatial visualization is crucial for the easy interpretation of results. Schoppmeyer (1978) suggested specifying a maximum of seven tone values in cartographic representations [65]. Therefore, in this study, spatial visualization of criteria was classified into five representation classes with GIS. As in Table 4, sub-criteria values between 1–5 points were assigned to the criteria according to the degree of density or distance. Data classification can be done in GIS with manual, equal interval, quantile, natural breaks (jenks), and standard deviation methods [66]. In this study, equal interval and natural breaks (jenks) data classification methods were used because the criteria data do not have threshold values in the literature. Interpretation of the criteria is facilitated by the data classification methods used. With the sub-criteria created, the criteria were made suitable for weighted overlay analysis in raster data format (Figure 7).

3.2.1. Natural Gas Lines

There is a 23.967 km natural gas distribution network in Istanbul, consisting of steel and polyethylene pipelines. These pipelines can be exposed to corrosion over time due to exposure to air, salt, water, soil, and various other environmental effects. The progression of corrosion over time causes the pipes to be eroded, punctured and shut down. In addition, various unauthorized and uncontrolled excavations are carried out in the city. Uncontrolled gas outputs at high pressure or fire may occur along with puncturing, tearing or breakage in natural gas distribution lines. These situations can cause interruption of gas supply, damage, and accidents that may result in injury and death [67]. In these situations, which require urgent intervention, the teams need to reach the scene quickly and intervene [20,46,49,50]. Natural gas line data were obtained from the Istanbul gas distribution company and added to the study as a criterion. The classification was made at 500 m intervals [68,69]. Areas close to natural gas lines were given high scores.

3.2.2. Natural Gas Notification Density

Within the scope of this study, the distribution of natural gas notifications gives the density of the places with the most interventions in Istanbul. This was considered an important factor in the selection of the emergency center location. Xu et al. [70], Dong et al. [71], and Golabian et al. [72] evaluated notifications as criteria in the location selection of fire and ambulance stations. The 216,935 natural gas notifications in 2019, the records of which were kept by the Istanbul gas distribution company, were transferred to the GIS environment on a neighborhood basis. Natural gas notification density was calculated on a neighborhood basis, and classification was made according to the Natural Breaks (Jenks) method. Places with high density were given high points, and places with low density were given low points.

3.2.3. District Regulating Stations

Devices that can reduce 25 bar natural gas pressure up to 4 bars in the city are contained in district regulating stations. Routine controls of the district regulating stations are carried out at regular intervals by natural gas emergency response teams [73]. In some emergency notifications, it may be necessary to intervene directly at district regulating stations [47,74]. District regulating stations were evaluated as a criterion within the scope of this study. A total of 1952 district regulating stations in Istanbul were transferred to the GIS environment. The classification was made based on the distance between the regulating stations. Proximity to regulators was given a high score.

3.2.4. Existing Natural Gas Emergency Response Team Centers (NGERTCs)

It is necessary to pay attention to the location of the planned NGERTCs so that they are at a sufficient distance from other existing NGERTCs and take the maximum workload possible. It is important to open an optimal number of new centers and meet demand in the selection of emergency centers [75,76]. Many researchers have determined the distance to the existing centers as a criterion for new emergency response center location selection [26,27,37,60,77]. While planning NGERTCs settlement, the distance between two NGERTCs was determined as a minimum of 2 km by the Istanbul gas distribution company. The closest distance between the existing NGERTCs in Istanbul is 2 km. The classification was made based on this distance. Existing NGERTCs were given the highest score for the furthest distance and the lowest score for the closest distance.

3.2.5. Main Roads

Emergency response team vehicles should be connected to the main roads that are least affected by heavy traffic. Proximity to main roads was considered an essential criterion for ambulance and fire station location selection [34,35,36,37,60,77]. To respond quickly to notices, NGERTC should be planned to be located on main roads or on side streets within easy reach of a main road. For this reason, priority was given to the selection of places close to main roads. The classification was made at 50 m intervals [35].

3.2.6. Natural Gas Subscriber Density

Population density is one of the most important factors for emergency response center site selection studies [35,37,60,77,78]. In this study, natural gas subscriber density was used instead of population density to achieve more focused results for the aim of the model. There are over 6.5 million natural gas subscribers in the Istanbul metropolitan area. In places where the number of subscribers is high, the risk of emergencies arising from the use of natural gas is high. For this reason, it was suggested as a criterion that natural gas emergency response teams be located close to places with a high natural gas subscriber density. Natural gas subscriber density was calculated for each neighborhood and classification was made according to the Natural Breaks (Jenks) method. Area and subscriber number information was obtained from the Istanbul Metropolitan Municipality. Places with high subscriber density were given high scores, and places with low subscriber density were given low scores.

3.2.7. Regional Markets

Markets set up on the streets can extend the time for emergency response teams to reach and respond to the scene [79]. It is recommended that the emergency response centers should be 50 m away from the main roads [35], and the emergency response teams should not encounter any obstacles in reaching the main roads [38]. At the transportation point, NGERTCs should not be established on streets where markets are set up, as these will affect the vehicle’s time to reach the scene. That is why the information on 402 street markets in Istanbul from the Turkey Ministry of Commerce Market Registration System was transferred to the street-based GIS environment. Considering the traffic that may occur around marketplaces, classification was made at 50 m intervals. Areas close to regional markets were given low scores.
Table 2. Description of NGERTC site selection criteria.
No.CriteriaDescriptionReferences
1Proximity to Natural Gas LinesIn emergencies, it is necessary to intervene quickly in natural gas pipelines. NGERTCs should be close to natural gas pipelines.[20,46,48,49,50]
2Natural Gas Notification DensityRegions with high natural gas notification density need more NGERTCs.[39,41,70,71,72]
3Proximity to District Regulating StationsIt is necessary for NGERTC sites to be close to district regulating stations.[47,74]
4Distance to Existing NGERTCIt is necessary for new NGERTC sites to be far away from existing NGERTCs.[26,27,37,60,75,76,77]
5Proximity to Main RoadsIt is necessary for NGERTC sites to be close to main roadways.[34,35,36,37,60,77]
6Natural Gas Subscriber DensityRegions with high natural gas subscriber density need more NGERTCs.[35,37,60,77,78]
7Distance to Regional MarketsIt is necessary for NGERTCs to be far away from regional markets.[79]
Table 3. Source of criteria data and GIS analysis type.
No.CriteriaFormat of Raw DataData SourceAnalysis Type
1Proximity to Natural Gas LinesVectorIstanbul Gas Distribution Company (IGDAS)Euclidean Distance
2Natural Gas Notification DensityVectorIstanbul Gas Distribution Company (IGDAS)Density
3Proximity to District Regulating StationsVectorIstanbul Gas Distribution Company (IGDAS)Euclidean Distance
4Distance to Existing NGERTCVectorIstanbul Gas Distribution Company (IGDAS)Euclidean Distance
5Proximity to Main RoadsVectorOpen Street Map DataEuclidean Distance
6Natural Gas Subscriber DensityVectorIstanbul Metropolitan MunicipalityDensity
7Distance to Regional MarketsVectorTurkey Ministry of Commerce Market Registration SystemEuclidean Distance
Table 4. Criterion values for new NGERTCs.
No.CriteriaSub-CriterionValue
1Proximity to Natural Gas Lines0–500 m5
500–1000 m4
1000–1500 m3
1500–2000 m2
>2000 m1
2Natural Gas Notification Density800–1.6865
(per square kilometer)509–8004
264–5093
79–2642
0–791
3Proximity to District Regulating Stations0–150 m5
150–300 m4
300–450 m3
450–600 m2
600 m<1
4Distance to Existing NGERTC>8 km5
6–8 km4
4–6 km3
2–4 km2
0–2 km1
5Proximity to Main Roads0–50 m5
50–100 m4
100–150 m3
150–200 m2
>200 m1
6Natural Gas Subscriber Density16.727–36.2355
(per square kilometer)9.350–16.7274
4.629–9.3503
1.420–4.6292
0–1.4201
7Distance to Regional Markets>200 m5
150–200 m4
100–150 m3
50–100 m2
0–50 m1

3.3. Fuzzy Analytic Hierarchy Process (FAHP)

The analytical hierarchy method (AHP) developed by Satty is a decision-making process used to choose the best alternative by using more than one criterion in solving complex problems [80,81]. A hierarchical structure is created in line with the criteria and decision alternatives. Alternatives are selected and ranked according to the degree of weight given to the criteria. Although the analytic hierarchical method, which is one of several multi-criteria decision-making methods, is used in the solution of many problems, sometimes it is not sufficient for solving problems in uncertain and complex situations. The fuzzy logic theory was presented by Zadeh for the solution of uncertainty situations [82,83]. Thanks to this theory, decision makers are able to express the uncertainties in comparison rates more clearly by making intermittent evaluations instead of precise evaluations [84]. A fuzzy set A is defined by a function, each element of which has a membership degree ranging from 0 to 1. Triangular fuzzy numbers (TFNs), which are widely used among fuzzy numbers, are defined as M = (l, m, u) [85]. A triangular fuzzy number is shown in Figure 8.
The l, m, and u values represent triangular fuzzy numbers. l = lowest value, m = most likely value, and u = highest value. The membership function of a triangular fuzzy number is represented as A = (l, m, u).
In Equation (1), l, m, and u represent the lower limit, middle value and upper limit of the triangular fuzzy number A, respectively [86].
µ ( X ) = { x < m ,   1 ( x l ) / ( m l ) ,   1 x m ( u x ) / ( u m ) ,   m x u   0 ,   o t h e r w i s e .
While A1 = (l1, m1, u1) and A2 = (l2, m2, u2) are two triangular fuzzy numbers (TFNs), basic fuzzy operations (addition, subtraction, multiplication, division) on fuzzy numbers are defined in Equations (2)–(5) [87].
A 1 A 2 = ( l 1 + l 2 ,   m 1 + m 2 ,   u 1 + u 2 ) ,
A 1 A 2 = ( l 1 l 2 ,   m 1 m 2 ,   u 1 u 2 ) ,
A 1 A 2 = ( l 1 × l 2 ,   m 1 × m 2 ,   u 1 × u 2 ) ,
A 1 A 2 = ( l 1 ÷ l 2 ,   m 1 ÷ m 2 ,   u 1 ÷ u 2 ) ,
Before the fuzzy pairwise comparison matrix is built, the consistency of the comparison matrices should be tested. In order to measure the consistency of the judgments regarding pairwise comparison, the use of the consistency ratio suggested by Saaty [87]. The consistency ratio (CR) is calculated using Equation (6). If the consistency ratio is less than 0.1, the matrix is considered to be consistent. If this ratio is above 0.10, the matrices are considered inconsistent, and the evaluation needs to be re-considered.
C R = C I R I = λ m n n 1 .
where CI is the consistency index, λm is the principal eigenvalue of the comparison matrix, and RI is the random index which depends on the matrix size (n),
As a result of applying fuzzy logic in AHP, the Fuzzy Analytical Hierarchy Method (FAHP) is obtained. Thanks to FAHP, evaluation processes of decision makers are simpler than when using simple AHP. Different methods are used to integrate fuzzy logic and AHP [88,89,90]. In this study, the geometric mean method developed by Buckley [89] was used. As shown in Equation (7), a triangular fuzzy comparison matrix is created to express expert judgments.
A = ( a i j ) n x n = [ ( 1 ,   1 , 1 ) ( l 12 , m 12 , u 12 ) ( l 1 n , m 1 n , u 1 n ) ( l 21 , m 21 , u 21 ) ( 1 ,   1 , 1 ) ( l 2 n , m 2 n , u 2 n ) ( 1 ,   1 , 1 ) ( l n 1 , m n 1 , u n 1 ) ( l n 2 , m n 2 , u n 2 ) ( 1 ,   1 , 1 ) ] .
where a i j = ( l i j , m i j , u i j ) and a i j 1 = ( 1 / u i j , 1 / m i j , 1 / l i j ) for i, j = 1, …, n and ij
Table 5 shows the triangular fuzzy values in the pairwise comparison matrix used in the study.
Using the geometric mean method proposed by Buckley [89] in Equations (8) and (9), the fuzzy geometric mean and fuzzy weights of each criterion are calculated.
w ˜ i = r ˜ i ( r ˜ 1 r ˜ n ) 1
r ˜ i = ( a ˜ i 1 a ˜ i 2 a ˜ i n ) 1 / n
where r ˜ i is the geometric mean and w ˜ i is the fuzzy weighting of the criteria.
Using the center of area (COA) method given in Equation (10), the fuzzy weights are defuzzified.
w i = ( l + m + u   3 ) .
Finally, normalization of the weights obtained is done.
After obtaining the data for the criteria determined within the scope of the study and making the relevant transformations, the consistency ratio of the pairwise comparison matrices was tested using AHP. The CR value was calculated to be less than 0.1 and the comparison matrices were found to be consistent. In the study, the CR value was calculated as 0.04 and using the triangular fuzzy numbers in Table 5, new fuzzy pairwise comparison matrices were created. Then, a single fuzzy pairwise comparison matrix was created to synthesize expert judgments and the FAHP hierarchical structure of the study was designed as shown in Figure 9. The fuzzy weight matrix was created by using the geometric mean method in Equations (8) and (9). Defuzzification was done with the center of area (COA) approach in Equation (10). Finally, as shown in Table 6, the weights of the criteria were obtained by normalizing the de-fuzzified weights.

4. Results and Discussion

Within the scope of this study, a solution was developed by integrating the Geographic Information System (GIS) and Fuzzy Analytical Hierarchy Management (FAHP) to determine the optimal locations of NGERTCs in the Istanbul metropolis. First of all, an analysis of accessible areas within 15 min was carried out from 36 existing NGERTCs. Using the network analysis (in GIS), it was concluded that 70.04% of the natural gas lines and 91.03% of natural gas subscribers in the Istanbul metropolis are within the 15 min coverage area of the 36 existing NGERTCs. As seen in Table 1, all notifications can be reached within 15 min in nine natural gas intervention zones (Üsküdar, Yenibosna, Mecidiyeköy, Güngören, Fulya, Fatih, Bayrampaşa, Bağcılar, and Adalar). In addition, 100% of the natural gas lines and subscribers in these nine regions are within the 15 min coverage area of 10 NGERTCs. There are 10 natural gas intervention zones (Ataşehir, Avcılar, Bakırköy, Kadıköy, Kağıthane, Kartal, Maltepe, Sultangazi, Taksim and Ümraniye) with natural gas line coverage over 80% and natural gas subscriber coverage over 90%. There are 11 NGERTCs in these 10 natural gas intervention zones. Depending on the traffic density, the notifications in these regions may not be addressed within 15 min. There are 13 natural gas intervention zones (Arnavutköy, Başakşehir, Beykoz, Beylikdüzü, Çatalca, Eyüp, Kurtköy, Pendik, Küçükçekmece, Sancaktepe, Silivri, Şile, and Tarabya) with a coverage rate of less than 80% of natural gas lines and 90% of natural gas subscribers. The 15 NGERTCs in these 13 natural gas response zones cannot respond to some notifications within 15 min due to the size of the intervention zone area and heavy traffic. These results show a need for new NGERTCs to respond to natural gas notifications more effectively and quickly in the Istanbul metropolitan area. The proposed NGERTCs in this study, will be able to improve the response capability of these centers.
Secondly, the weighting of the seven criteria determined for the selection of the locations of the new NGERTCs using the FAHP approach supported by expert opinion, was made as shown in Table 6. The weights of the criteria are respectively natural gas subscriber density-29%, natural gas notification density: 26%; proximity to natural gas lines: 19%; proximity to main roads: 10%; distance to regional markets: 5%; distance to existing NGERTC: 4%; and proximity to district regulating stations: 6%. The consistency ratio (CR) was found to be 0.04 in the evaluation of the criteria. Since the CR value was less than 0.1, the criteria were considered to be consistent and reliable. Distance and proximity spatial analyses of the criteria, which were transformed into a spatial data layer, were made. As shown in Figure 7, a reclassification process was performed for each criterion, and suitability maps were prepared with value ranges between 1 and 5. Weighted overlay analysis was performed using the weights of the criteria obtained from the FAHP. As a result of this analysis, a suitability map (Figure 10) was obtained for NGERTCs.
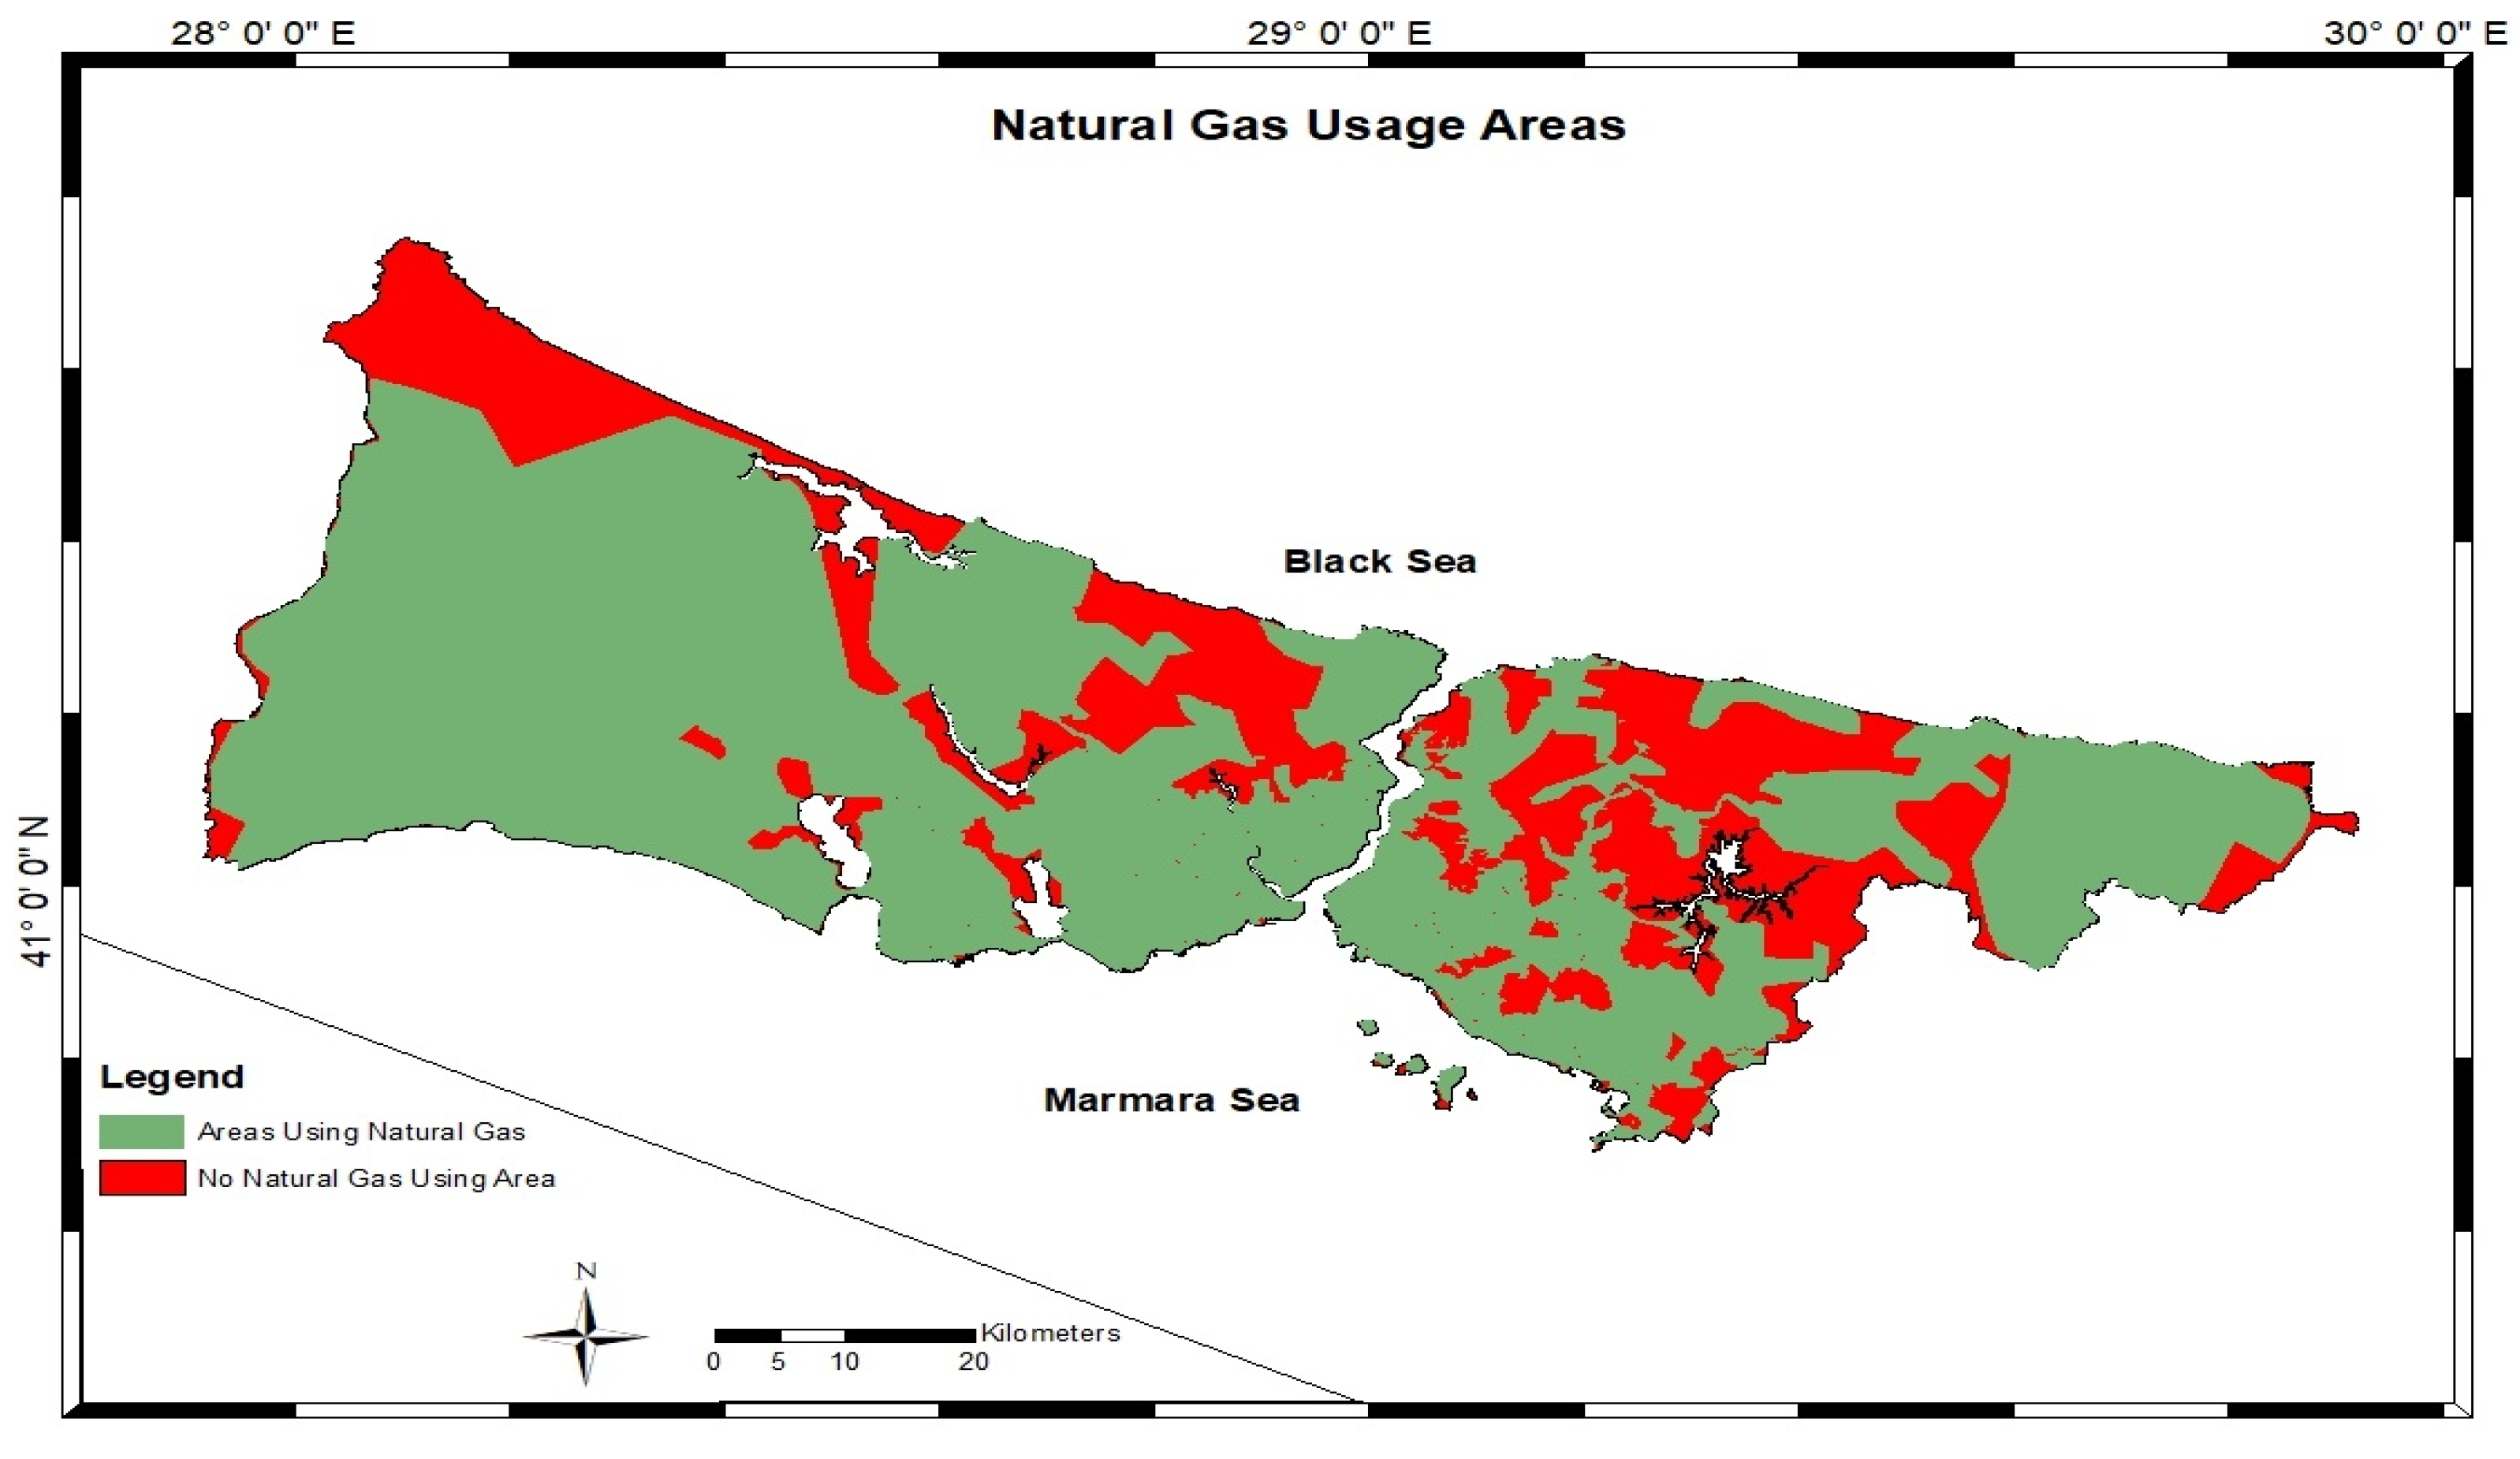
In this study, two restrictions were determined for the new NGERTC site selection. These restrictions are areas without natural gas use (Figure 11) and 15 min coverage areas of existing NGERTCs (Figure 12). These restriction areas were extracted from the NGERTC suitability map (Figure 10). After this process, the suitability map for proposed NGERTCs was obtained (Figure 13).
The resulting suitability map was classified according to unsuitable, less suitable, moderately suitable, suitable, and highly suitable areas. As a result of this analysis, it was proposed to open 12 new NGERTCs for the Istanbul metropolis. Seven NGERTCs on the European side and 5 NGERTCs on the Anatolian side were proposed. Two new NGERTCs for the Büyükçekmece district and one new NGERTC for the Esenyurt, Avcılar, Sultangazi, Eyüpsultan, Üsküdar, Çekmeköy, Sultanbeyli, Kartal and Tuzla districts were proposed. When the evaluation was made according to the natural gas intervention zones, three new NGERTCs were proposed for the Beylikdüzü natural gas intervention zone, where the number of subscribers is highest and traffic density is high. One new NGERTC has been proposed in the Avcılar intervention zone, where the number of notifications is highest and traffic density is high. One new NGERTC was proposed for the Küçükçekmece, Eyüp, and Sultangazi natural gas intervention zones on the European side. Two new NGERTCs were proposed for the Sancaktepe natural gas intervention zone, which has the highest number of subscribers and notifications on the Anatolian side. One new NGERTC was proposed for the Kartal, Ümraniye and Pendik emergency response areas located on the Anatolian side (Figure 14). In Table 7, the locations of the proposed 12 new NGERTCs and their features are given.
The number of natural gas subscribers in the proposed NGERTC regions 1, 2, 3, 9, and 10 has increased greatly in the recent years. Therefore, new NGERTCs were needed. On the other hand, in proposed NGERTC regions 4, 5, 7, 8 and 11, there are difficulties in reaching notifications due to the high natural gas subscriber density and traffic. Planning new NGERTCs for these regions has become crucial. Regions 6, 9, 10, and 12 are far from the current NGERTC coverage area and have high natural gas subscriber density. For this reason, it is recommended to open new NGERTCs in these regions. In addition, it has been observed that there is high natural gas alert density in the proposed NGERTC zones 3, 4 and 7.
When the locations of the proposed 12 NGERTC were examined, it was revealed that NGERTCs should be opened in the south and middle parts of the Istanbul metropolis where the population density is high. The Büyükçekmece and Esenyurt districts on the west side of the city center, the Tuzla district on the east side and the Sultanbeyli and Çekmeköy districts on the north side of the city center, in particular, have new settlements, and planning new NGERTCs for these districts is important due to the increasing population density. In addition, there is a need for new NGERTCs in the Üsküdar, Kartal, and Eyüpsultan districts, with high population and traffic densities located in the city center. Within the scope of this study, it is not recommended to open a new NGERTC for the regions located within the borders of Çatalca, Silivri, and Arnavutköy, located in the northwest of the city, and Şile, located in the northeast of the city. The main reason for this situation is the low density of natural gas subscribers, low number of natural gas lines and large coverage areas. At the same time, these areas are mostly rural, and the natural gas subscribers from these regions is less than 3% of the total number of natural gas subscribers in Istanbul. At the same time, it does not seem feasible to open new NGERTCs for these regions at this stage due to the large areas involved; the scattered settlement pattern of subscribers also makes this difficult to manage. In the near future, the potential for opening new NGERTCs should be re-evaluated based on the development of the new settlement areas and population growth that may occur in these regions.
Finally, a 15 min coverage analysis was conducted using the network analysis method for a total of 48 NGERTCs, including 36 existing NGERTCs and 12 proposed NGERTCs. As shown in Figure 15, as a result of 12 new NGERTCs added to the existing NGERTCs, it was seen that the coverage of the natural gas network in the Istanbul metropolis may increase from 70.04% to 83.86% for a 15 min response time. In addition, with the addition of the new NGERTC, the accessibility rate with regard to natural gas subscribers within 15 min would increase from 91.03% to 96.27%. The addition of the new NGERTCs would also increase the number of natural gas subscribers that can be reached in Istanbul from 6.053.056 to 6.400.078.
In this study, 12 NGERTCs were proposed for 9 of 32 natural gas intervention zones. The change in the coverage area of these nine natural gas intervention zones in terms of natural gas lines and natural gas subscribers was examined. The change in the 15-min coverage area is given in Table 8. Three NGERTCs were proposed for the Beylikdüzü natural gas intervention zone, which has the lowest natural gas subscriber coverage rate. Natural gas subscriber coverage in the Beylikdüzü zone would be increased from 56.21% to 99.07%. With a proposed NGERTC for the Küçükçekmece natural gas intervention, the coverage rate could reach 100%. By the proposal of a new NGERTC within the Avcılar, Ümraniye, Eyüp, Sultangazi, Kartal, Pendik and Sancaktepe natural gas intervention zones, the coverage rate of natural gas subscribers in these zones could exceed 97%.

5. Conclusions

Although attempts are made to address notifications requiring emergency response from the existing 36 NGERTCs spread throughout Istanbul as rapidly as possible, the legal limit of 15 min can be exceeded depending on the population and traffic density. Within the scope of this study, this situation was confirmed by first performing a 15 min coverage area analysis. In order to overcome this problem, the need to open new NGERTCa emerged. In the second phase of this study, a GIS-based multi-criteria FAHP approach was used to determine the most suitable locations of new NGERTCs in the Istanbul metropolitan area, which has over 6.5 million natural gas subscribers. Twelve suitable locations were determined by spatial analyses carried out in line with the criteria determined by experts. In the last stage of the study, the establishment of 12 new NGERTCs in the identified locations, in addition to the existing 36 NGERTCs was included, and a 15 min coverage analysis was made for 48 NGERTCs. Natural gas line coverage increased from 70.04% to 83.86%, and natural gas subscriber coverage increased from 91.03% to 96.27%.
The developing economy and urbanization of the city of Istanbul has caused an increase in the number of natural gas subscribers. At this point, NGERTC locations and numbers are of critical economic and social importance for the city of Istanbul. With this study, it was revealed that the number of natural gas subscribers is increasing day by day, and the existing NGERTCs are insufficient in responding to natural gas notifications. New NGERTC investments need to be planned against potential threats that may arise from the use of natural gas. NGERTCs planned in sufficient numbers and in the right location ensure the security of natural gas users and reduce possible economic losses. This study is the first GIS and multi-decision based study to determine the locations of NGERTCs. As a result of the study, the use of GIS and FAHP were e found to be adequate for solving the related problems. The results were found to be consistent and satisfactory in consultation with the experts in the natural gas sector.
One of the limitations of this study is the criteria used for new NGERTC site selection. In this study, site selection criteria were proposed for the first time for NGERTC. A change in criteria may have a causal effect on the model applied. This situation may also affect the optimum number of NGERTCs. In future studies, different site selection criteria can be used according to the study area, and other multiple decision support methods can be used by comparing the differences. Another limitation is that the purposes of opening the new NGERTCs may differ. Spatial coverage can be improved by using different mathematical models that consider the capacities and resource limits of existing NGERTCs.
The population of the city of Istanbul is increasing every year. For this reason, alternative NGERTCs should be planned by taking into account the new settlement area plans that may be zoned for construction in the near future. In addition, it is useful to evaluate alternative models in terms of rapid transportation to natural gas subscribers in the rural areas of the city. Finally, GIS-based MCDM methods can be applied to determine priority in terms of the proposed NGERTCs.

Author Contributions

Conceptualization, Mehmet Şerif Sarıkaya; methodology, Mehmet Şerif Sarıkaya and Mustafa Yanalak; software, Mehmet Şerif Sarıkaya; validation, Mehmet Şerif Sarıkaya, Mustafa Yanalak and Himmet Karaman; formal analysis, Mehmet Şerif Sarıkaya; investigation, Mehmet Şerif Sarıkaya and Mustafa Yanalak; resources, Mehmet Şerif Sarıkaya, Mustafa Yanalak and Himmet Karaman; data curation, Mehmet Şerif Sarıkaya and Himmet Karaman; writing—original draft preparation, Mehmet Şerif Sarıkaya; writing—review and editing, Mustafa Yanalak and Himmet Karaman; visualization, Mehmet Şerif Sarıkaya; supervision, Mustafa Yanalak and Himmet Karaman. All authors have read and agreed to the published version of the manuscript.

Funding

This research received no external funding.

Data Availability Statement

Not applicable.

Conflicts of Interest

The authors declare no conflict of interest.

References

  1. Economides, M.J.; Wood, D.A. The state of natural gas. J. Nat. Gas Sci. Eng. 2009, 1, 1–13. [Google Scholar] [CrossRef]
  2. Ma, X. Natural gas and energy revolution: A case study of Sichuan–Chongqing gas province. Nat. Gas Ind. B 2017, 4, 91–99. [Google Scholar] [CrossRef]
  3. Lin, J.; Mou, D. Analysis of the optimal spatial distribution of natural gas under ‘transition from coal to gas’ in China. Resour. Energy Econ. 2021, 66, 101259. [Google Scholar] [CrossRef]
  4. Solarin, S.A.; Shahbaz, M. Natural gas consumption and economic growth: The role of foreign direct investment, capital formation and trade openness in Malaysia. Renew. Sustain. Energy Rev. 2015, 42, 835–845. [Google Scholar] [CrossRef] [Green Version]
  5. Looney, B. Statistical Review of World Energy, 69th ed.; BP: London, UK, 2020; Available online: https://www.bp.com/content/dam/bp/business-sites/en/global/corporate/pdfs/energy-economics/statistical-review/bp-stats-review-2020-full-report.pdf (accessed on 5 November 2021).
  6. Kan, S.; Chen, B.; Meng, J.; Chen, G. An extended overview of natural gas use embodied in world economy and supply chains: Policy implications from a time series analysis. Energy Policy 2020, 137, 111068. [Google Scholar] [CrossRef]
  7. IGU. Global Gas Report 2018. In Proceedings of the 27th World Gas Conference, Washington, DC, USA, 23–29 June 2018; Available online: https://www.igu.org/resources/global-gas-report-2018/ (accessed on 10 April 2021).
  8. Kumar, V.V.; Shastri, Y.; Hoadley, A. A consequence analysis study of natural gas consumption in a developing country: Case of India. Energy Policy 2020, 145, 111675. [Google Scholar] [CrossRef]
  9. Greiner, P.T.; York, R.; McGee, J.A. Snakes in The Greenhouse: Does increased natural gas use reduce carbon dioxide emissions from coal consumption? Energy Research and Social Science 2018, 38, 53–57. [Google Scholar] [CrossRef]
  10. Riva, A.; D’Angelosante, S.; Trebeschi, C. Natural gas and the environmental results of life cycle assessment. Energy 2006, 31, 138–148. [Google Scholar] [CrossRef]
  11. de Almeida, A.T.; Lopes, A.C.; Carvalho, A.; Mariano, J.; Jahn, A.; Broege, M. Examining the potential of natural gas demand-side measures to benefit customers, the distribution utility, and the environment: Two case studies from Europe. Energy 2004, 29, 979–1000. [Google Scholar] [CrossRef] [Green Version]
  12. Liu, G.; Dong, X.; Jiang, Q.; Dong, C.; Li, J. Natural gas consumption of urban households in China and corresponding influencing factors. Energy Policy 2018, 122, 17–26. [Google Scholar] [CrossRef]
  13. Chambers, A.; Nakicenovic, N. World Energy Outlook 2008; International Energy Agency: Paris, France, 2008; Available online: https://www.iea.org/reports/world-energy-outlook-2008 (accessed on 16 July 2021).
  14. Wang, D.; Qian, X.; Ji, T.; Jing, Q.; Zhang, Q.; Yuan, M. Flammability limit and explosion energy of methane in enclosed pipeline under multi-phase conditions. Energy 2021, 217, 119355. [Google Scholar] [CrossRef]
  15. Jackson, R.B.; Down, A.; Phillips, N.G.; Ackley, R.C.; Cook, C.W.; Plata, D.L.; Zhao, K. Natural gas pipeline leaks across Washington, DC. Environ. Sci. Technol. 2014, 48, 2051–2058. [Google Scholar] [CrossRef] [PubMed]
  16. Kai, Y.; Shuran, L.; Jiancun, G.; Lei, P. Research on the coupling degree measurement model of urban gas pipeline leakage disaster system. Int. J. Disaster Risk Reduct. 2017, 22, 238–245. [Google Scholar] [CrossRef]
  17. Kumar, N.; Gupta, H. Methane: Risk assessment, environmental, and health hazard. Hazard. Gases 2021, 225–238. [Google Scholar] [CrossRef]
  18. Iqbal, S.; Clower, J.H.; Saha, S.; Boehmer, T.K.; Mattson, C.; Yip, F.Y.; Cobb, R.D.; Flanders, W.D. Residential carbon monoxide alarm prevalence and ordinance awareness. J. Public Health Manag. Pract. 2012, 18, 272–278. [Google Scholar] [CrossRef]
  19. Li, X.; Penmetsa, P.; Liu, J.; Hainen, A.; Nambisan, S. Severity of emergency natural gas distribution pipeline incidents: Application of an integrated spatio-temporal approach fused with text mining. J. Loss Prev. Process Ind. 2021, 69, 104383. [Google Scholar] [CrossRef]
  20. Enbridge. Emergency Response Plan. March 2021. Available online: https://www.enbridgegas.com/-/media/Extranet-Pages/Safety/emergency-procedures-manual.ashx (accessed on 7 August 2021).
  21. Northen Gas Networks. RIIO-GD2 Business Plan 2021–2026. Available online: https://www.northerngasnetworks.co.uk/wp-content/uploads/2019/12/NGN-RIIO-GD2-Business-Plan-2021-2026.pdf (accessed on 3 October 2021).
  22. IGDAS (Istanbul Gas Distrubition Company). 2018 Annual Report. Available online: https://cdn.igdas.com.tr/web/Docs/igdas-2018-fr-ingilizce_9644430.pdf (accessed on 23 May 2021).
  23. GAZBIR (Natural Gas Distribution Companies Association of Turkey). 187-Natural Gas Emergency Line. Available online: https://www.gazbir.org.tr/en/187-natural-gas-emergency-line/86 (accessed on 26 May 2021).
  24. EMRA (Republic of Turkey Energy Market Authority), Natural Gas Market Distribution and Customer Services Regulation, 2018 (Available İn Turkish Language). Available online: https://www.epdk.gov.tr/Detay/Icerik/23-2-1007/dogal-gaz-piyasasi (accessed on 16 June 2021).
  25. IGDAS (Istanbul Gas Distrubition Company). 2019 Annual Report. Available online: https://cdn.igdas.com.tr/web/Docs/2019igdas-faaliyet-raporu-eng_2197183.pdf (accessed on 25 May 2021).
  26. Yang, L.; Jones, B.F.; Yang, S.H. A fuzzy multi-objective programming for optimization of fire station locations through genetic algorithms. Eur. J. Oper. Res. 2007, 181, 903–915. [Google Scholar] [CrossRef] [Green Version]
  27. Şen, A.; Önden, I.; Gökgöz, T.; Şen, C. A Gis approach to fire station location selection. In Proceedings of the Gi4DM 2011—GeoInformation for Disaster Management, Antalya, Turkey, 3–8 May 2011. [Google Scholar]
  28. Ingolfsson, A.; Budge, S.; Erkut, E. Optimal ambulance location with random delays and travel times. Health Care Manag. Sci. 2008, 11, 262–274. [Google Scholar] [CrossRef]
  29. Adenso-Díaz, B.; Rodríguez, F. A simple search heuristic for the MCLP: Application to the location of ambulance bases in a rural region. Omega 1997, 25, 181–187. [Google Scholar] [CrossRef]
  30. Schmid, V.; Doerner, K.F. Ambulance location and relocation problems with time-dependent travel times. Eur. J. Oper. Res. 2010, 207, 1293–1303. [Google Scholar] [CrossRef]
  31. Srianan, T.; Sangsawang, O. Path-Relinking for Fire Station Location. Adv. Intell. Syst. Comput. 2019, 866, 531–538. [Google Scholar] [CrossRef]
  32. Liu, N.; Huang, B.; Chandramouli, M. Optimal Siting of Fire Stations Using GIS and ANT Algorithm. J. Comput. Civ. Eng. 2006, 20. [Google Scholar] [CrossRef] [Green Version]
  33. Aktaş, E.; Özaydin, Ö.; Bozkaya, B.; Ülengin, F.; Önsel, Ş. Optimizing fire station locations for the Istanbul Metropolitan Municipality. Interfaces 2013, 43, 209–296. [Google Scholar] [CrossRef] [Green Version]
  34. Khaki, A.M.; Mojaradi, B.; Ghobadipour, B.; Maghsoudy, S.; Naghibi, F. Integration of GIS and analytical hierarchy process method for locating road emergency medical services station. Geosystem Eng. 2015, 18, 92–103. [Google Scholar] [CrossRef]
  35. Chaudhary, P.; Chhetri, S.K.; Joshi, K.M.; Shrestha, B.M.; Kayastha, P. Application of an Analytic Hierarchy Process (AHP) in the GIS interface for suitable fire site selection: A case study from Kathmandu Metropolitan City, Nepal. Socio-Econ. Plan. Sci. 2016, 53, 60–71. [Google Scholar] [CrossRef]
  36. Wei, L.; Li, H.L.; Liu, Q.; Chen, J.Y.; Cui, Y.J. Study and implementation of fire sites planning based on GIS and AHP. Procedia Eng. 2011, 11, 486–495. [Google Scholar] [CrossRef] [Green Version]
  37. Erden, T.; Coşkun, M.Z. Multi-criteria site selection for fire services: The interaction with analytic hierarchy process and geographic information systems. Nat. Hazards Earth Syst. Sci. 2010, 10, 2127–2134. [Google Scholar] [CrossRef]
  38. Wang, W. Site selection of fire stations in cities based on geographic information system and fuzzy analytic hierarchy process. Ing. Des Syst. D’information 2019, 24, 619–626. [Google Scholar] [CrossRef]
  39. Swalehe, M.; Aktas, S.G. Dynamic Ambulance Deployment to Reduce Ambulance Response Times Using Geographic Information Systems: A Case Study of Odunpazari District of Eskisehir Province, Turkey. Procedia Environ. Sci. 2016, 36, 199–206. [Google Scholar] [CrossRef] [Green Version]
  40. Ates, S.; Aydınoglu, A.C.; Coskun, M.Z. Determining Optimum Ambulance Locations for Heart Attack Cases with GIS. In Proceedings of the 2011 Esri International User Conference, San Diego, CA, USA, 11–15 July 2011. [Google Scholar]
  41. Terzi, O.; Sisman, A.; Canbaz, S.; Dündar, C.; Peksen, Y. A geographic information system-based analysis of ambulance station coverage area in Samsun, Turkey. Singap. Med. J. 2013, 54, 653–658. [Google Scholar] [CrossRef]
  42. Degel, D.; Wiesche, L.; Rachuba, S.; Werners, B. Reorganizing an existing volunteer fire station network in Germany. Socio-Econ. Plan. Sci. 2014, 48, 149–157. [Google Scholar] [CrossRef]
  43. Nyimbili, P.H.; Erden, T. A Hybrid Approach Integrating Entropy-AHP and GIS for Suitability Assessment of Urban Emergency Facilities. ISPRS Int. J. Geo-Inf. 2020, 9, 419. [Google Scholar] [CrossRef]
  44. Habibi, K.; Lotfi, S.; Koohsari, M.J. Spatial analysis of urban fire station locations by integrating AHP model and IO logic using GIS (A case study of zone 6 of Tehran). J. Appl. Sci. 2008, 8, 3302–3315. [Google Scholar] [CrossRef]
  45. Agarwal, A.; Molwane, O.B.; Pitso, I. Analytical investigation of the influence of natural gas leakage & safety zone in a pipeline flow. Mater. Today: Proc. 2020, 39, 547–552. [Google Scholar] [CrossRef]
  46. Russo, P.; Parisi, F. Risk-targeted safety distance of reinforced concrete buildings from natural-gas transmission pipelines. Reliab. Eng. Syst. Saf. 2016, 148, 57–66. [Google Scholar] [CrossRef]
  47. Dadkani, P.; Noorzai, E.; Ghanbari, A.H.; Gharib, A. Risk analysis of gas leakage in gas pressure reduction station and its consequences: A case study for Zahedan. Heliyon 2021, 7, e06911. [Google Scholar] [CrossRef] [PubMed]
  48. AGA (The American Gas Association). Emergency Preparedness for Natural Gas Utilities. Available online: https://www.aga.org/contentassets/26fb8e97457449fc82bd97090c6d7bf7/aga-emergency-preparedness-handbook-final.pdf (accessed on 10 August 2021).
  49. The Pipeline Association for Public Awareness (Association). Pipeline Emergency Response Guidelines. Available online: https://pipelineawareness.org/media/1384/2018-pipeline-emergency-response-guidelines.pdf (accessed on 16 August 2021).
  50. Kılıc, O.M.; Ersayın, K.; Gunal, H.; Khalofah, A.; Alsubeie, M.S. Combination of fuzzy-AHP and GIS techniques in land suitability assessment for wheat (Triticum aestivum) cultivation. Saudi J. Biol. Sci. 2022, 29, 2634–2644. [Google Scholar] [CrossRef]
  51. Tesfamariam, S.; Sadiq, R. Risk-based environmental decision-making using fuzzy analytic hierarchy process (F-AHP). Stoch. Environ. Res. Risk Assess. 2006, 21, 35–50. [Google Scholar] [CrossRef]
  52. Cheng, C.H. Evaluating naval tactical missile systems by fuzzy AHP based on the grade value of membership function. Eur. J. Oper. Res. 1997, 96, 343–350. [Google Scholar] [CrossRef]
  53. Choudhary, D.; Shankar, R. An STEEP-fuzzy AHP-TOPSIS framework for evaluation and selection of thermal power plant location: A case study from India. Energy 2012, 42, 510–521. [Google Scholar] [CrossRef]
  54. Keprate, A.; Ratnayake, R.M.C. Enhancing offshore process safety by selecting fatigue critical piping locations for inspection using Fuzzy-AHP based approach. Process Saf. Environ. Prot. 2016, 102, 71–84. [Google Scholar] [CrossRef]
  55. Wang, Y.; Jung, K.A.; Yeo, G.T.; Chou, C.C. Selecting a cruise port of call location using the fuzzy-AHP method: A case study in east asia. Tour. Manag. 2014, 42, 262–270. [Google Scholar] [CrossRef]
  56. Kuo, R.J.; Chi, S.C.; Kao, S.S. A decision support system for selecting convenience store location through integration of fuzzy AHP and artificial neural network. Comput. Ind. 2002, 47, 199–214. [Google Scholar] [CrossRef]
  57. Noorollahi, E.; Fadai, D.; Shirazi, M.A.; Ghodsipour, S.H. Land suitability analysis for solar farms exploitation using GIS and fuzzy analytic hierarchy process (FAHP)—A case study of Iran. Energies 2016, 9, 643. [Google Scholar] [CrossRef] [Green Version]
  58. Guler, D.; Yomralioglu, T. Suitable location selection for the electric vehicle fast charging station with AHP and fuzzy AHP methods using GIS. Ann. GIS 2020, 26, 169–189. [Google Scholar] [CrossRef] [Green Version]
  59. Khademalhoseiny, M.S.; Ahmadi Nadoushan, M.; Radnezhad, H. Site selection for landfill gas extraction plant by fuzzy analytic hierarchy process and fuzzy analytic network process in the city of Najafabad, Iran. Energy Environ. 2017, 28. [Google Scholar] [CrossRef]
  60. Nyimbili, P.H.; Erden, T. GIS-based fuzzy multi-criteria approach for optimal site selection of fire stations in Istanbul, Turkey. Socio-Econ. Plan. Sci. 2020, 71, 100860. [Google Scholar] [CrossRef]
  61. Council of European Energy Regulators. 6th CEER Benchmarking Report on the Quality of Electricity and Gas Supply. 2016. Available online: https://www.ceer.eu/documents/104400/-/-/d064733a-9614-e320-a068-2086ed27be7f (accessed on 22 November 2021).
  62. Cadent Gas, Guaranteed Standards of Performance. Available online: https://cadentgas.com/nggdwsdev/media/Downloads/about/standards-of-service.pdf (accessed on 11 December 2021).
  63. Zeniewski, P.; Bolado-Lavin, R. A review of national gas emergency plans in the European Union. Energy Policy 2012, 49, 652–662. [Google Scholar] [CrossRef]
  64. Bai, J.; Zhang, X.; Zhang, L. Recommendations on the improvement of the proposed government new rules for the operation of natural gas pipeline networks and management of natural gas supply emergency in China. Nat. Gas Ind. 2021, 41, 172–178. [Google Scholar] [CrossRef]
  65. Schoppmeyer, J. Die Wahrnehmung Von Rastern und Die Abstufung Von Tonwertscalen in Der Kartographie. Ph.D. Thesis, Hohen Landwirtschaftlichen Fakultat der Rheinischen Friedrich Wilhelms-Universitat zu Bonn, Bonn, Germany, 1978. (In German). [Google Scholar]
  66. Erden, T.; Karaman, H. Analysis of earthquake parameters to generate hazard maps by integrating AHP and GIS for Küçükçekmece region. Nat. Hazards Earth Syst. Sci. 2012, 12, 475–483. [Google Scholar] [CrossRef]
  67. Liu, F.; Wang, X.; Qian, Y.; Kong, S.; Zheng, M. Emergency rescue decision assistant system based on GIS for natural gas pipeline. In ICPTT 2011: Sustainable Solutions for Water, Sewer, Gas, and Oil Pipelines, Proceedings of the International Conference on Pipelines and Trenchless Technology, Beijing, China, 26–29 October 2011; American Society of Civil Engineers: San Francisco, CA, USA, 2011. [Google Scholar] [CrossRef]
  68. Sánchez-Lozano, J.M.; García-Cascales, M.S.; Lamata, M.T. Identification and selection of potential sites for onshore wind farms development in region of murcia, Spain. Energy 2014, 73, 311–324. [Google Scholar] [CrossRef]
  69. Satkin, M.; Noorollahi, Y.; Abbaspour, M.; Yousefi, H. Multi criteria site selection model for wind-compressed air energy storage power plants in Iran. Renew. Sustain. Energy Rev. 2014, 32, 579–590. [Google Scholar] [CrossRef]
  70. Xu, Z.; Liu, D.; Yan, L. Evaluating spatial configuration of fire stations based on real-Time traffic. Case Stud. Therm. Eng. 2021, 25, 100957. [Google Scholar] [CrossRef]
  71. Dong, X.M.; Li, Y.; Pan, Y.L.; Huang, Y.J.; Cheng, X.D. Study on Urban Fire Station Planning based on Fire Risk Assessment and GIS Technology. Procedia Eng. 2018, 211, 124–130. [Google Scholar] [CrossRef]
  72. Golabian, H.; Arkat, J.; Tavakkoli-Moghaddam, R.; Faroughi, H. A multi-verse optimizer algorithm for ambulance repositioning in emergency medical service systems. J. Ambient. Intell. Humaniz. Comput. 2021, 13, 549–570. [Google Scholar] [CrossRef]
  73. Bubar, B.G. Valve Stations. In Pipeline Planning and Construction Field Manual; Elsevier: Amsterdam, The Netherlands, 2011; pp. 205–222. [Google Scholar] [CrossRef]
  74. Medvedeva, O.N.; Polyakov, A.S.; Kochetkov, A.V. Technical Solutions to Reduce Natural-Gas Pressure at Gas-Distribution Stations. Chem. Pet. Eng. 2017, 53, 469–473. [Google Scholar] [CrossRef]
  75. Maghfiroh, M.F.N.; Hossain, M.; Hanaoka, S. Minimising emergency response time of ambulances through pre-positioning in Dhaka city, Bangladesh. Int. J. Logist. Res. Appl. 2017, 21, 53–71. [Google Scholar] [CrossRef]
  76. Indriasari, V.; Mahmud, A.R.; Ahmad, N.; Shariff, A.R.M. Maximal service area problem for optimal siting of emergency facilities. Int. J. Geogr. Inf. Sci. 2010, 24, 213–230. [Google Scholar] [CrossRef]
  77. Kaveh, M.; Mesgari, M.S. Improved biogeography-based optimization using migration process adjustment: An approach for location-allocation of ambulances. Comput. Ind. Eng. 2019, 135, 800–813. [Google Scholar] [CrossRef]
  78. Aldabbas, M.; Venteicher, F.; Gerber, L.; Widmer, M. Finding the Adequate Location Scenario after the Merger of Fire Brigades Thanks to Multiple Criteria Decision Analysis Methods. Found. Comput. Decis. Sci. 2018, 43, 69–88. [Google Scholar] [CrossRef] [Green Version]
  79. Hung, H.K.; Wu, C.C. Impact of night markets on residents’ quality of life. Soc. Behav. Personal. 2020, 48, 1–12. [Google Scholar] [CrossRef]
  80. Chen, C.F. Applying the analytical hierarchy process (AHP) approach to convention site selection. J. Travel Res. 2006, 45. [Google Scholar] [CrossRef]
  81. Kittipongvises, S.; Phetrak, A.; Rattanapun, P.; Brundiers, K.; Buizer, J.L.; Melnick, R. AHP-GIS analysis for flood hazard assessment of the communities nearby the world heritage site on Ayutthaya Island, Thailand. Int. J. Disaster Risk Reduct. 2020, 48, 101612. [Google Scholar] [CrossRef]
  82. Zadeh, L.A. Fuzzy sets. Inf. Control 1965, 8, 338–353. [Google Scholar] [CrossRef] [Green Version]
  83. Ekmekcioğlu, Ö.; Koc, K.; Özger, M. Stakeholder perceptions in flood risk assessment: A hybrid fuzzy AHP-TOPSIS approach for Istanbul, Turkey. Int. J. Disaster Risk Reduct. 2021, 60, 102327. [Google Scholar] [CrossRef]
  84. Wang, L.; Chu, J.; Wu, J. Selection of optimum maintenance strategies based on a fuzzy analytic hierarchy process. Int. J. Prod. Econ. 2007, 107, 151–163. [Google Scholar] [CrossRef]
  85. Kaganski, S.; Majak, J.; Karjust, K. Fuzzy AHP as a tool for prioritization of key performance indicators. Procedia CIRP 2018, 72, 1227–1232. [Google Scholar] [CrossRef]
  86. Karimi, A.; Mehrdadi, N.; Hashemian, S.; Nabi-Bidhendi, G.; Tavakkoli-Moghaddam, R. Using of the fuzzy TOPSIS and fuzzy AHP methods for wastewater treatment process selection. Int. J. Acad. Res. 2011, 3, 737–745. [Google Scholar]
  87. Saaty, T.L. Decision making with the analytic hierarchy process. Int. J. Serv. Sci. 2008, 1, 83–98. [Google Scholar] [CrossRef]
  88. Chang, D.Y. Applications of the extent analysis method on fuzzy AHP. Eur. J. Oper. Res. 1996, 95, 649–655. [Google Scholar] [CrossRef]
  89. Buckley, J.J. Fuzzy hierarchical analysis. Fuzzy Sets Syst. 1985, 17, 233–247. [Google Scholar] [CrossRef]
  90. Deng, H. Multicriteria analysis with fuzzy pairwise comparison. Int. J. Approx. Reason. 1999, 21, 215–231. [Google Scholar] [CrossRef] [Green Version]
  91. Zabihi, H.; Alizadeh, M.; Wolf, I.D.; Karami, M.; Ahmad, A.; Salamian, H. A GIS-based fuzzy-analytic hierarchy process (F-AHP) for ecotourism suitability decision making: A case study of Babol in Iran. Tour. Manag. Perspect. 2020, 36, 100726. [Google Scholar] [CrossRef]
Figure 1. The map of the study area (Istanbul metropolitan area).
Ijgi 11 00571 g001
Figure 2. Number of natural gas subscribers by years in Istanbul.
Ijgi 11 00571 g002
Figure 3. Natural gas emergency response team center building in Ataşehir natural gas intervention zone.
Ijgi 11 00571 g003
Figure 4. The workflow of site selection study of natural gas emergency response team centers.
Ijgi 11 00571 g004
Figure 5. New natural gas emergency response team center location analysis model.
Ijgi 11 00571 g005
Figure 6. Natural gas emergency response team center 15 min coverage areas and natural gas intervention zones.
Ijgi 11 00571 g006
Figure 7. Raster maps of criteria. (a) proximity to natural gas lines; (b) natural Gas notification density; (c) proximity to district regulating stations; (d) distance to existing NGERTC; (e) proximity to main roads; (f) natural gas subscriber density; (g) distance to regional markets.
Ijgi 11 00571 g007aIjgi 11 00571 g007bIjgi 11 00571 g007c
Figure 8. Triangular fuzzy number, A = (l, m, u).
Ijgi 11 00571 g008
Figure 9. Hierarchical structure of FAHP.
Ijgi 11 00571 g009
Figure 10. Suitability map for NGERTCs.
Ijgi 11 00571 g010
Figure 11. Natural gas usage areas.
Ijgi 11 00571 g011
Figure 12. Existing NGERTC 15 min coverage areas.
Ijgi 11 00571 g012
Figure 13. Suitability map for proposed NGERTC.
Ijgi 11 00571 g013
Figure 14. Suitability map for proposed new NGERTC locations.
Ijgi 11 00571 g014
Figure 15. Existing and proposed NGERTC 15 min coverage areas.
Ijgi 11 00571 g015
Table 1. Coverage percentage, number of NGERTCs, staff by, intervention zones and natural gas notifications per subscriber.
No.Name of Natural Gas Intervention ZoneNumber of NGERTCsNumber of Staff in NGERTCNatural Gas Notifications per Subscriber15 Min Coverage Percentage (Natural Gas Lines)15 Min Coverage Percentage (Natural Gas Subscribers)
1Adalar1110.133100%100%
2Arnavutköy1150.05464.30%81.20%
3Ataşehir1200.03496.30%99.64%
4Avcılar1230.03889.90%93.49%
5Bakırköy1160.03381%94.51%
6Başakşehir1160.02560.20%78.96%
7Bayrampaşa1140.028100%100%
8Beykoz1170.03739.40%82.92%
9Beylikdüzü1240.03733.80%56.21%
10Çatalca2180.06334.20%77.32%
11Bağcılar1170.032100%100%
12Eyüp1170.03778.09%86.32%
13Fatih1180.037100%100%
14Fulya2170.030100%100%
15Güngören1160.029100%100%
16Kadıköy1170.02398.53%99.60%
17Kağıthane2170.02883.89%95.17%
18Kartal1160.02991.51%94.22%
19Kurtköy1190.03056.61%86.76%
20Küçükçekmece1190.03479.25%88.81%
21Maltepe1160.02683.47%92.28%
22Mecidiyeköy1160.026100%100%
23Pendik1170.02677.21%87.84%
24Sancaktepe1180.03569.12%86.32%
25Silivri1180.06321.27%77.40%
26Sultangazi1210.03486.22%92.71%
27Şile2170.02935.16%74.25%
28Taksim1140.02780.90%94.23%
29Tarabya1160.02745.68%88.34%
30Ümraniye1180.03487.76%94.21%
31Üsküdar1170.030100%100%
32Yenibosna1180.034100%100%
Total 365530.03370.04%91.03%
Table 5. The scale of FAHP pair-wise comparison [87,91].
Linguistic VariablesValueTriangular Fuzzy ScalingTriangular Fuzzy Reciprocal Scaling
Equal1(1, 1, 1)(1,1,1)
Moderate3(2, 3, 4)(1/4, 1/3, 1/2)
Strong5(4, 5, 6)(1/6, 1/5, 1/4)
Very Strong7(6, 7, 8)(1/8, 1/7, 1/6)
Extremely Strong9(9, 9, 9)(1/9, 1/9, 1/9)
Intermediate Values2, 4, 6, 8(1, 2, 3), (3, 4, 5), (5, 6, 7) (1/3, 1/2, 1), (1/5, 1/4, 1/3)
Table 6. Pairwise comparison matrix and weight values of criteria for natural gas emergency response team centers.
CriteriaNatural Gas LineNatural Gas NoticeDistrict Regulating StationsExisting NGERTCMain RoadsNatural Gas SubscriberRegional MarketsW (Normalized Weights)
Natural Gas Line(1, 1, 1)(1/3, 1/2, 1)(3, 4, 5)(3, 4, 5)(2, 3, 4)(1/3, 1/2, 1)(2, 3, 4)0.189
Natural Gas Notice(1, 2, 3)(1, 1, 1)(3, 4, 5)(6, 7, 8)(3, 4, 5)(1/3, 1/2, 1)(3, 4, 5)0.261
District Regulating Stations(1/5, 1/4, 1/3)(1/5, 1/4, 1/3)(1, 1, 1)(1, 2, 3)(1/3, 1/2, 1)(1/4, 1/3, 1/2)(1, 2, 3)0.072
Existing NGERTC(1/5, 1/4, 1/3)(1/8, 1/7, 1/6)(1/3, 1/2, 1)(1, 1, 1)(1/4, 1/3, 1/2)(1/7, 1/6, 1/5)(1/3,1/2, 1)0.039
Main Roads(1/4, 1/3, 1/2)(1/5, 1/4, 1/3)(1, 2, 3)(2, 3, 4)(1, 1, 1)(1/4, 1/3, 1/2)(2, 3, 4)0.100
Natural Gas Subscriber(1, 2, 3)(1, 2, 3)(2, 3, 4)(5, 6, 7)(2, 3, 4)(1, 1, 1)(4, 5, 6)0.289
Regional Markets(1/4, 1/3, 1/2)(1/5, 1/4, 1/3)(1/3, 1/2, 1)(1, 2, 3)(1/4,1/3, 1/2)(1/6, 1/5, 1/4)(1, 1, 1)0.051
Table 7. Locations of proposed NGERTCs and their features.
No.Natural Gas Intervention ZoneNeighborhoodDistrictProposed NGERTC Location Features
1BeylikdüzüMimarobaBüyükçekmeceIncrease in the number of natural gas subscribers
2BeylikdüzüAtatürkBüyükçekmeceIncrease in the number of natural gas subscribers
3BeylikdüzüBattalgaziEsenyurtIncrease in the number of natural gas subscribers, High natural gas notification
4AvcılarDenizköşklerAvcılarHigh subscriber, natural gas notice, and traffic density
5KüçükçekmeceHalkalıKüçükçekmeceHigh subscriber and traffic density
6SultangaziEski HabiplerSultangaziOutside the city center—High subscriber density
7EyüpKaradolapEyüpsultanHigh subscriber, natural gas notice and traffic density
8ÜmraniyeKüplüceÜsküdarHigh subscriber and traffic density
9SancaktepeMimar SinanÇekmeköyOutside the city center—Increase in the number of natural gas subscribers
10SancaktepeAhmet YeseviSultanbeyliOutside the city center—Increase in the number of natural gas subscribers
11KartalHürriyetKartalHigh subscriber and traffic density
12PendikMimar SinanTuzlaOutside the city center—High subscriber density
Table 8. Coverage percentage and number of existing and proposed NGERTCs by intervention zones.
NoName of Natural Gas Intervention ZonesProposed NGERTCsNumber of NGERTCs15 Min Coverage Percentage (Natural Gas Line)15 Min Coverage Percentage (Natural Gas Subscribers)
1Adalar01100%100%
2Arnavutköy0164.30%81.20%
3Ataşehir0196.30%99.64%
4Avcılar1299.38%99.79%
5Bakırköy0181%94.51%
6Başakşehir0160.20%78.96%
7Bayrampaşa01100%100%
8Beykoz0139.40%82.92%
9Beylikdüzü3496%99.07%
10Çatalca0234.20%77.32%
11Bağcılar01100%100%
12Eyüp1299.04%99.86%
13Fatih01100%100%
14Fulya02100%100%
15Güngören01100%100%
16Kadıköy0198.53%99.6%
17Kağıthane0283.89%95.17%
18Kartal1298.83%99.84%
19Kurtköy0156.61%86.76%
20Küçükçekmece12100%100%
21Maltepe0188.31%92.28%
22Mecidiyeköy01100%100%
23Pendik1290.21%97.92%
24Sancaktepe2383.12%97.64%
25Silivri0121.27%77.40%
26Sultangazi1293.86%98.83%
27Şile0235.16%74.25%
28Taksim0180.90%94.23%
29Tarabya0145.68%88.34%
30Ümraniye1298.76%99.72%
31Üsküdar01100%100%
32Yenibosna01100%100%
Total 124883.86%96.27%
Publisher’s Note: MDPI stays neutral with regard to jurisdictional claims in published maps and institutional affiliations.

