Abstract
The conceptual variations and divergences that permeate the debate on sustainability end up directly reflecting the choice of sustainability assessment (SA) processes, providing different methodological approaches. Among them, some researchers have pointed out challenges, but also opportunities to use geospatial data, techniques, and tools as resources to be explored in sustainability assessments. However, it was still unclear how geospatial tools have contributed in this context, as well as their future potential. Thus, through bibliometric mapping, this research answers these questions, through the identification of both the thematic fields of action of the geographic information system (GIS) in SA as well as the emerging research areas in this domain of knowledge. For this, we selected 1721 articles spanning 31 years (1990–2020). We observe that this is a subject of growing interest, as more than 50% of all publications were published after 2015. The main results indicated that, initially, the GIS supported sustainability assessments as a mapping tool associated mostly with environmental issues, however, the evolution of the analysis potential, through data modeling, gives rise to new application perspectives. This evolution takes place, in parallel, with the global discussion on sustainability, where multidimensionality starts to play a leading role, and sustainability indicators assume geographic positions.
1. Introduction
The debate on sustainability is as broad as it is old, and the problem surrounding its conceptualization is one of its main challenges. The use of terms that translated this meaning was first introduced in the literature by German researchers in 1713, who were concerned with forestry activities, in particular that the forest was never harvested more than it was able to replenish [1]. However, this discussion expanded globally from 1972 onwards, when concerns related to environmental issues were addressed at the UN General Assembly meeting at the Stockholm Conference, gaining an international priority status [2]. Later, in 1987, the term sustainable development (SD) was popularized from the report “Our Common Future” (Brundtland Report) into the one adopted by current generations to satisfy their needs without making it impossible for future generations to do the same, decreeing an intergenerational character to this concept [3].
Although widely accepted, the definition of SD adopted by the United Nations has been the subject of discussions about what it actually represents, as it is presented as a broad, ambiguous, imprecise, and sometimes contradictory concept [4]. These examinations are justified because it is an ingrained concept of cultural values that can define different principles [5], depending on the different interpretations that are given [6], making the evaluation process even more complex.
Such complexity translates into a huge diversity of sustainability assessment (SA) mechanisms found in the literature and which differ in their objectives, methods, and tools [7]. However, even if they differ in spatial and temporal scales, the SA ends up aiming to guide decision-making that leads the object of study to the path of sustainability [8]. This definition of SA can be expanded if, in addition to integrating sustainability issues into decision-making, it also promotes the sustainability objectives themselves, that is, being able to influence decision-makers, and this also contributes to the contextual interpretation of sustainability [9].
Among the SA methodologies that enable this exchange of information between evaluators and decision-makers, the application of sustainability indicators (SI) is probably the most popular internationally [5]. However, despite being popular, there is still no methodological (or even conceptual) consensus on the use of SI, and this is due to the very complexity of assessing what really matters for monitoring society’s progress towards sustainability [7].
Through a very constructive debate, Ramos [7] points out some possible future paths for SA with SI by identifying a set of challenges found in the literature. Among the challenges and opportunities raised, the author highlighted the use of geospatial technologies (for example, remote sensing) as new approaches to indicators, which can be an important solution to mitigate the limitations and availability of data, especially for certain scales of analysis. The use of satellite data, for example, is still relatively unexplored.
However, despite still being a challenge, the concern towards approaching sustainable development (SD) geospatially is not recent. Even in the 1990s, Manning [10] warned that the SD path involves understanding the relationship between biophysical and socioeconomic information and that this requires a better understanding of the spatial dimension of both the problems and the proposed solutions. In other words, decision-makers must be able to interrelate, even spatially, information from many different sectors. The author is categorical in stating that, in this sense, a vital tool to achieve these goals is the geographic information system (GIS).
Nevertheless, even after three decades, important studies continue to point to the GIS tool and techniques as trends in SD measurement [11]. This trend, to some extent, is perceived through preliminary research in scientific databases, and in studies from different areas of knowledge [12,13,14,15,16,17,18,19,20]. However, while there is a discussion about the different interpretations of sustainability, it is also necessary to consider that the geospatial approach in SA will also occur in different contexts.
In this way, we understand that the role of GIS in SA is a scientific gap still to be explored. Thus, we postulate that, for greater effectiveness of the GIS application, it is necessary to understand in a more holistic way the thematic fields in which these geospatial tools act in the evaluations that aim to measure sustainability. To reach this understanding, it is necessary to explore the historical paths of scientific research that approach this field of knowledge, to identify how research areas evolve over time, even showing future scientific ways to be considered.
This research tries to clarify these points by the means of a bibliometric review, organized as follows. After the introduction, where the gaps in and the main objective of the research are presented, an overview is presented in Section 2, where some highly visible works on the subject are discussed, bringing to light what is known, so far, of the proposed research field. In Section 3, the methods applied in the development of the research are outlined, followed by Section 4, where the results found are reported. In Section 5, the main results are highlighted together with the discussion on the historical evolution of the themes that contemplate the use of GIS in SA. In Section 6, the final conclusions are presented, highlighting the contributions to knowledge where new frontiers are opened for future research.
2. Background
Assessing sustainability is not an easy task. The complexity of the evaluation process occurs insofar as there are several ways to interpret the concept of sustainability itself. In the studies by Patterson et al. [6] some SA tools were methodologically detailed to identify their common characteristics, and to exemplify the complexity of this evaluation process, the authors list four different interpretations of sustainability on which the different methods can be supported, namely: ecological, economic, thermodynamic, and ecological–economic interpretations, as well as interpretation by public policy and planning theory. Therefore, we can infer that the use of geospatial data, techniques, and tools can also take place in different contexts depending on the sustainability approach on which the assessment is based.
The use of GIS in SA has been encouraged since the 1990s, mainly because it allows analyses that interrelate environmental and economic variables, providing a more holistic approach to the relationship between the natural and human environments [10]. Since then, several works have been developed in which the GIS supports assessments that aim to understand sustainability at different scales, whether macro (strategic) or micro (operational) [7].
However, when consulting different publications that stand out on the subject, and which have had great scientific visibility in the last 30 years, one can see a variety of approaches in which GIS can support SA processes. In general, there is a consensus that GIS is applied to works that involve the treatment of spatialized data and that it produces results in the form of mapping, and even tables or graphs.
Nevertheless, other scientific knowledge can be added to GIS to obtain even more accurate results. In studies by Forsyth [21], for example, some indigenous knowledge was incorporated into spatial analyzes to measure soil erosion to test the assumptions that land scarcity has increased cultivation on steeper slopes and that erosion is a problem for the degradation of the highlands. In this example, the debate on the concepts of sustainable knowledge and “hybridity” stands out; it uses local and indigenous knowledge, together with global scientific techniques, to achieve guidelines for sustainable development focused on environmental issues.
However, if on the one hand the GIS appears to support sustainability assessments based on the analysis of the damage caused by action, the opposite is also perceived. This is what Joerin et al. [22], who carried out mapping of land suitability for housing in a region of Switzerland, posited. This mapping incorporated a set of complex criteria that integrated the views of several stakeholders, and a GIS was used to assess the criteria requested in the definition and suitability of land for housing. Therefore, predictive mapping appears as an option to support assessments.
In addition, other sciences can enhance mapping capability when used in conjunction with GIS tools. This is the case of products derived from remote sensing (RS), such as images obtained via satellite. In the cases of Weng [23], Cheng and Masser [24], and Xiao et al. [25], remote sensing is integrated with geographic information systems to detect urban growth and assess its impact on urban sustainability, in which the detection of land use and cover change plays a key role. Therefore, evolution in the support of GIS to SA can be seen with the increase of new sciences of observation of the earth’s surface, however, this is still restricted to the use of biophysical data for the mapping of land uses. MacKerron and Mourato [26] differ in that they build a model that relates life satisfaction with a focus on air quality, in particular, using data from 400 London residents and GIS software to calculate pollutant concentrations in the vicinity of their homes. Despite this, GIS tools still appear to be applied in sustainability assessments that are directly related to environmental issues.
From the following decade, other examples of highly visible publications can be explored that show some sustainability approaches in which the evaluations applied, in different ways, use GIS tools in the methodological process.
Burkhard et al. [27] aimed to present and apply a concept of mapping, through GIS, the supply and demand of ecosystem services, which could be applicable at different scales and that allowed the comparison of different ecosystems, in addition to developing a tool in which landscape managers can rely on sustainability assessments. Jiang et al. [28] present a GIS-based approach to assessing the availability and distribution of agricultural waste in China, considering several conservation issues: resources (total amount, spatial and temporal distribution), economics (transport costs), environment, and technology, in order to assess the potential for conversion into bioenergy. In these studies, an ecological approach to sustainability is evident, where GIS presents itself as a support mechanism for decision-makers.
However, GIS allows, in essence, the application of variables from different categories, as long as they can be spatialized: not restricted to environmental/ecological data, but also to economic or social ones. In this sense, Bathrellos et al. [29] proposed an urban planning and sustainable development approach for Trikala City Hall (Western Thessaly, Central Greece). For this, several parameters were used and correlated by the method of the analytical hierarchical process (AHP) and incorporated in a GIS to produce the corresponding maps of suitability.
Therefore, we cite above some examples that can help to understand what is known, so far, of the support in which GIS techniques and tools provide the evaluations in which the authors indicate that they deal with sustainability. In agreement with what Patterson et al. [6] and Sala et al. [5] affirm, the previous examples expose the complexity of SA precisely because of the diversity of interpretations depending on the principles in which sustainability is presented. Among the cited studies, sustainability assessments were perceived from the perspective of land use and occupation and its urban and rural planning, by the selection and suitability of areas, by the relation of life satisfaction and air quality, and by the supply and demand of ecosystem services, for the bioenergetic potential of areas and for the quality and management of water resources. This scenario turns out to corroborate the idea that, despite the use of GIS being pointed out as a methodological trend in SA [11], there is still no clarity on the themes in which these geospatial techniques work. We might ask what the directions of its application in future works are, and if they are paths that can lead decision-makers to direct the studied areas towards sustainable development.
Thus, we understand that a broad analysis, which is capable of understanding several scientific publications on the subject, such as an analysis of scientific mapping through bibliometrics, can help to answer these questions. Bibliometric works can be understood as a set of methods that help in the analysis of academic literature in a quantitative manner, but also in understanding the changes that occur over time in the field of research being analyzed. One of the main methods for exploring a field of research is scientific mapping (or bibliometric mapping), which consists of revealing the conceptual, social, or intellectual structure of scientific research, in addition to its evolution and dynamic aspects over time [30].
However, we realize that there is still no work in this direction which is capable of revealing the main themes addressed by the field of research of SA supported by GIS, as well as the most recent problems faced. In addition, research from this perspective can assist in the study of thematic evolution and point out global trends in this field of research. Based on this, we propose a bibliometric analysis that is able to include all the research published on the topic, and that can identify future paths from a historical analysis.
3. Materials and Methods
We consider a methodological process that involves four steps, adapted from [31,32], for an analysis of scientific mapping, which is illustrated in Figure 1.
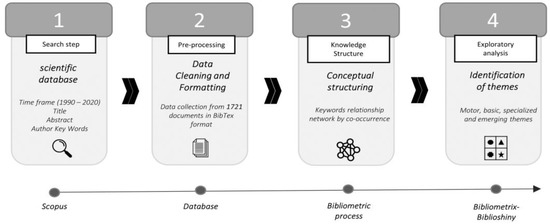
Figure 1.
Methodological steps.
The first step consists of retrieving data from a scientific database. This step begins with the definition of the scientific database to be consulted. In this case, we chose to use the Scopus database to search for publications related to the proposed research field. Scopus was chosen because it is considered the largest scientific literature review database in the world [33], in addition to indexing a greater number of abstracts and citations of peer-reviewed literature compared to other databases [34]. The main weak point of Scopus is that it has some limitations for older records: however, because of the subject of the analysis, we can consider it not constraining [35].
A crucial moment of this stage is the choice of primary keywords, which will serve for an initial search. Later, derivations will be identified that could be considered in a new search. Here, we chose to search for the terms “geographic information system”, “geospatial knowledge infrastructures”, “spatial data infrastructure”, “geoverse”, “geoai”, “Service-Oriented Mapping”, and “sustainable development”. This time, in the midst of a series of derivations, we decided to consider the documents that contained the terms: “geographic information system”, “geographical information system”, “GIS”, “spatial data infrastructure”, “sustainability indicator”, “sustainable development”, and “sustainability assessment”. The use of these terms resulted in a broader set of articles that meets the objectives of this work.
In addition, only the types of documents classified as articles or reviews were considered in the search. This decision is justified because journal articles are considered more reputable sources, in addition to having undergone a peer review process [11]. Furthermore, we performed the search considering the terms indexed in fields such as title, abstract, and keywords of the authors specifically [36], analyzing all the years of publication available in the Scopus database, finding a total period of 31 years from 1990 to 2020.
The second stage is to carry out a pre-processing of the data to avoid the use of documents that are not part of the topic to be analyzed. Thus, we performed data cleaning, which resulted in a corpus robust indexed research.
It is notable, and widely known, that the term GIS is commonly used to indicate the use of techniques and tools that make up the geographic information system. Thus, in countless works it is common to find the use of the term GIS in the titles of scientific works, in their abstracts, and also in the keywords, without necessarily indicating its meaning, leaving it to the author’s discretion to explain its meaning in the body of the text article. Therefore, the use of this term in the database searches generated the return of several documents that dealt with other subjects that were not related to the proposed research field. Thus, we cleaned the performed search, using keywords related to the GIS term found after a thorough exploration of the articles allocated in each Subject Area, and excluding them from the search process (examples: gigantea, green index, geographical indications and green infrastructure).
Therefore, we performed the following search query in the Scopus database, obtaining a total of 1721 articles:
((TITLE (“geographic* information syste*” OR “gis” OR “spatial data infrastructure” ) OR ABS (“geographic* information syste*” OR “gis” OR “spatial data infrastructure”) OR AUTHKEY (“geographic* information syste*” OR “gis” OR “spatial data infrastructure”)) AND (TITLE (“sustainable development” OR “sustainability assessment” OR “sustainability indicator*”) OR ABS (“sustainable development” OR “sustainability assessment” OR “sustainability indicator*”) OR AUTHKEY (“sustainable development” OR “sustainability assessment” OR “sustainability indicator*”)) AND NOT (TITLE (“life cycle” OR “grassroot* innovation*” OR “Glycemic index” OR “Green indicator*” OR “Green infrastructure” OR “green information syste*” OR “geographic* indication*” OR “gigantea” OR “gi-cheol” OR “green index” OR “grazing incidence” OR “green innovation* strategy” OR “green investment scheme”) OR ABS (“life cycle” OR “grassroot* innovation*” OR “Glycemic index” OR “Green indicator*” OR “Green infrastructure” OR “green information syste*” OR “geographic* indication*” OR “gigantea” OR “gi-cheol” OR “green index” OR “grazing incidence” OR “green innovation* strategy” OR “green investment scheme”) OR AUTHKEY (“life cycle” OR “grassroot* innovation*” OR “Glycemic index” OR “Green indicator*” OR “Green infrastructure” OR “green information syste*” OR “geographic* indication*” OR “gigantea” OR “gi-cheol” OR “green index” OR “grazing incidence” OR “green innovation* strategy” OR “green investment scheme”))) AND DOCTYPE (ar OR re) AND PUBYEAR < 2021.
For data collection, a BibTex file (.bib) was extracted with all the data necessary for the bibliometric analysis.
The third step corresponds to the selection of the unit of analysis and the relationship between them. In this study we propose the identification of the knowledge structure from the keywords present in the publications (conceptual structuring), thus building a relationship network through co-occurrence. This generated network can be understood as a graphic representation of co-occurrences from a set of terms that are extracted from the keyword lists of articles, titles, or abstracts. This graphic representation is also called a thematic map, formed from a Cartesian representation, where different clusters are defined and allocated into quadrants, facilitating the interpretation of research themes developed in a structure [37]. To carry out such analysis, we used the bibliometrix R package tool (http://www.bibliometrix.org, accessed on 9 June 2021) with the biblioshiny application, equipped with a set of scientometric tools, written in the R language. This tool was preferred to others because it provides efficient statistical algorithms and integrated visualization tools that allow a more comprehensive interpretation of the analyzed research field [38].
The fourth and final stage involves an exploratory and interpretive analysis that makes it possible to highlight the different topics included in this domain of knowledge, covering the entire period of publications and identifying the driving, basic, specialized, and emerging themes, as well as their trajectories over time.
4. Results
To illustrate the growing interest of the scientific community in works that develop SA and that, in their methodological process, use GIS techniques and tools, we historically detail the number of annual publications of all selected articles. Thus, a total of 1721 documents were collected based on a search strategy that includes articles (1642; 97%) and reviews (58; 3%). Based on these results and considering a time series that comprises thirty-one years, we have an annual average of approximately 55 publications. Furthermore, there has been a significant increase in documents published from 2008 onwards; in just over a decade, from 2008 to 2020, the growing interest in the study of SA supported by GIS led the scientific community to publish 1387 documents, representing more than 80% of all publications raised.
4.1. Knowledge Structure
The knowledge structure comprises the contextualization of science from the analysis of the conceptual structure, which was explored through thematic mapping using the keywords of the authors who composed the publications.
In this case, clusters are identified, which means that each cluster corresponds to an underlying theme, topic, or line of research [39]. In this work, we mapped the keyword clusters, making it possible to analyze the conceptual structure.
Conceptual Structure—Keyword Clusters
From the file generated after searching the Scopus database, we grouped similar keywords in order to avoid overlapping equivalent terms (e.g., GIS, geographic information system, geographical information system). After this process, we identified a total of 4673 different keywords for a total period of 31 years. Figure 2 shows the 20 keywords with the highest number of occurrences.
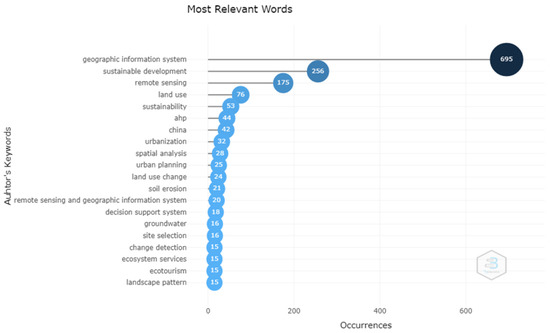
Figure 2.
Most frequent keywords.
Therefore, it is clear that the keywords “Geographic Information System”, “Sustainable Development”, and “Remote Sensing” not only occurred in high frequencies but also occurred throughout the analyzed period (1990 to 2020). However, terms such as “Land Use”, “China”, and “Urbanization” are terms that have appeared in high frequencies in the last ten years. The words ecotourism, urban planning, spatial analysis, and “AHP” grew in frequency from 2016 (that is, in the last 5 years analyzed).
In addition to quantifying each keyword separately, we also analyzed the relationship between them in order to point out groups that could be interpreted as sub-themes that represent specific research fields. This time, we generated a map (Figure 3) capable of highlighting the different themes in the domain of knowledge of SA supported by GIS. The map is divided into four quadrants, starting from two axes (X, Y). The X-axis indicates centrality: the degree of interaction of a cluster compared to other clusters, suggesting the importance of a theme. The Y-axis indicates density, meaning it can be understood as a measure of theme development (internal strength) [37].
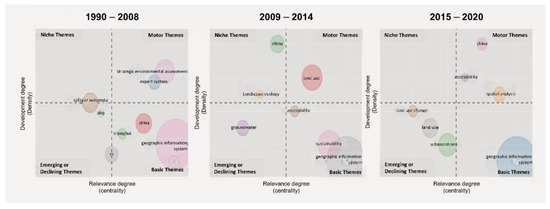
Figure 3.
Thematic maps of keywords 1990–2020.
The themes inserted in the upper right quadrant have high values of centrality and density, thus, they are important for the structuring of a research field. In this way, they are identified as motor themes. In the lower right quadrant, the basic themes are presented: general topics that can be transversal to different areas of the research field. In the lower-left quadrant are emerging or themes that are declining due to their weak development; they have low centrality and density. Top-left quadrant themes are known as highly developed and isolated themes, meaning they are of limited importance to the field [37].
The total period of analysis of publications (1990 to 2020) was divided here into three timeframes. This is because, as can be seen in Table 1, there was a change in behavior in the number of publications from 2008 onwards, with growing increments until 2014, reaching almost 50% of all publications. Thus, the years spanning 2015 to 2020 represent the other half of this indexed research corpus.

Table 1.
Quantification and characterization of keywords 1990–2020.
To identify the themes, we used only the keywords with a frequency equal to or greater than three occurrences, making it possible to identify the most representative themes. In this way, the detection of thematic clusters takes place with greater robustness and they are identified with the most frequent keywords.
In the initial time frame (1990 to 2008) the tool individualized eight clusters. A single cluster, which configures the environmental themes, appears with high centrality and density, represented by the keywords “environmental impact assessments” and “strategic”, characterizing itself as the driving theme of this first period. Among the basic themes, three clusters appear: the largest of them is formed by keywords that deal with the methodological process (“GIS”, “remote sensing”, “decision support systems”), general theoretical concepts (“sustainable development”, “sustainability”), and objects of study (“land use”); the other two basic clusters are represented by the keywords “China” and “Shanghai”, with lower centralities. Two themes appear as emerging in this field of research. Thus, the methodological processes that perform processing of satellite images from automated cell modeling have less centrality and greater isolation, but are still dealing with topics related to applied methodologies. The keyword “AHP” appears as an emerging model of multi-criteria analysis in the evaluated publications.
The subsequent time frame (2009 to 2014) presents seven individual clusters. During this period, themes related to land use mapping are strongly connected to risk assessments and present themselves as driving themes in the research field. Among the basic themes, we perceive the continuity of those identified in the first analyzed period. However, the theme “accessibility” presents itself with a methodological character linked to the application of AHP, which migrates from an emerging condition to a theme of high transversality to different areas. Thus, a single cluster appears as an emerging theme represented by the keywords “groundwater” and “sustainability indicators”. The cluster that is represented by the word “China”, which in the initial period appeared as a basic theme, now presents itself as a very specialized theme. Another cluster that is also characterized by its isolation in this period is represented by the keywords “ecological footprint” and “ecosystem services”, with low centrality.
In the third and last time frame (2015 to 2020) seven clusters are individualized. The cluster “China” now appears as an engine theme in this field of research. Two other themes present high density and centrality. The methodological theme represented by the keyword “spatial analysis” has a strong relationship with systems linked to “ecotourism” and “renewable energies”. With high density, but still with medium centrality, the theme “accessibility” appears, with a strong presence of the keywords “Sustainable Development Goals” (SDGs). This cluster has been a driving theme for this field of research since 2015. We highlight the AHP methodological process, which initially appeared as emerging, migrated from 2009, and remains as a cross-cutting theme until the final period of analysis. Themes related to the analysis of land use, ecosystem services, and urbanization lose centrality and density and this configures them as themes in decline.
5. Discussion
The works in SA that are supported by GIS have, historically, an approach mostly focused on the environmental dimension, but which present a global trend of changing focus to assessments that observe the premises of the SDGs, that is, characterized by multidimensionality, so that the spatial variable starts to incorporate not only the environmental dimension but also the social and economic ones.
These findings could be observed from the results obtained in the thematic mapping, where the behaviors of the themes were observed through the relationship between the authors’ keywords in the three time periods analyzed (Figure 4), making it possible to trace the evolution in the time of the research on SA supported by GIS.
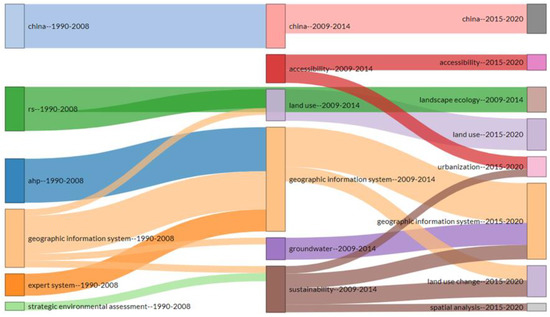
Figure 4.
Map of behavior and thematic evolution.
Therefore, we observed that initially, the questions that permeated the studies were mainly about research focused on environmental assessments. At that time, GIS was understood as a tool that favored this type of study due to its ability to integrate data and carry out spatial assessments that identify impacts on the environment [40]. In addition, works that were concerned with the study of urban planning emerged and used automaton cell modeling as a methodology together with remote sensing techniques and products. Studies that apply multi-criteria decision analysis models, especially AHP, which emerged as a topic of strong centrality, also stand out.
From 2009 onwards, there was a greater variation in the themes addressed in the works, and four movements emerged that best characterize this following period:
1st movement: The basic themes that appeared together with GIS are dismembered and come to appear more prominently. For example, the use of the term “sustainability” starts to relate more strongly to “urban areas”, specifically to the studies of urban sprawl from the mapping of changes in land use in cities, and assumes a transversality role among other topics.
2nd movement: China is no longer a basic topic and starts to act as a specialized subject as it becomes strongly linked to studies on the valuation of ecosystem services, and mainly works that assess the balance between supply and demand through the ecological footprint methodology. It is noteworthy that China accounts for more than a third of all publications surveyed, and this helps to explain its emergence as a research topic.
3rd movement: The works that addressed environmental assessments, and which previously assumed the position of the main engine of this field of research, give way to risk assessment studies, especially hydrological ones [41,42] and vulnerability to natural disasters [43] is frequently permeated by the use of GIS in land use mapping.
4th movement: Some studies emerge which are focused on the use of multidimensional sustainability indicators, applied to urban [44], rural [45], and environmental sustainability, are related to transport activity [46] among other themes.
The division between themes has intensified in recent years. Despite this, we highlight two moments that, in some way, are interconnected, and that well define the directions taken by the research in SA supported by the GIS between the years 2015 and 2020. At first, we perceive the highlight of the contextualization of the Sustainable Development Goals (SDG) of the 2030 Agenda (Transforming Our World: The 2030 Agenda for Sustainable Development) as one of the main driving themes in this period. At the same time, the use of spatial analysis has high centrality, which indicates the current use of a GIS-based approach [47,48,49]. In a second moment, we noticed that the studies focused more specifically on mapping land use and its changes, as well as those dedicated to the valuation of ecosystem services, decreased in centrality, indicating that they were taking a path of decline in research that deals with the SA supported by the GIS.
These perceptions strongly indicate that, even if there are previous publications that have addressed sustainability from the integration of different dimensions, it is from 2015 that the use of the term “sustainability” intensifies the application of socioecological variables in order to assess environmental, social, and ecological performance. This period coincides with the expansion of the debate on sustainable development after the creation of the 2030 Agenda, which introduces 17 SDGs along with 169 related targets [50].
Therefore, our results corroborate what Estoque [51] exposes: the demonstration of the application of earth observation data in the production of sustainability indicators and sub-indicators, or even the use of GIS as a SA platform where the entire assessment process takes place geospatially, from the insertion of indicators, weighing, normalization, and aggregation, as proposed by Graymore et al. [52] and Boggia et al. [53] for regional analyses. This may also indicate a reflection of the versatility of GIS, which enables multi-thematic and multi-tasking performance.
6. Conclusions
This paper started from the consideration that still the role of GIS in the development of SA has not been fully explored and that, conversely, understanding the subject areas may instead improve their use. Understanding therefore the development and evolution of research areas carried out through a bibliometric approach can be a valuable contribution.
Some studies on the subject of sustainability, as well as its evaluation processes, have pointed to the use of GIS as a trend. However, it was still unclear how geospatial tools have contributed in this context, as well as their future potential. The bibliometric analyses carried out in this study were able to demonstrate that, despite the temporal dynamism of the themes addressed in the works that involve SA and the application of GIS resources, strictly environmental themes are predominant. This reflects the conceptual confusion around sustainability, a topic discussed extensively in several scientific works. Thus, we can conclude that, for the most part, evaluations are observed that consider the use of one-dimensional or strictly biophysical indicators.
However, from the year 2009 and especially in the last analyzed period (2015–2020), the results show that there is a trend of the multidimensional approach and that the SDGs, discussed worldwide in recent years, have become guides for SA. This may indicate a direction for future works in this field: to adopt the use of GIS techniques not only in spatialization but also in the generation of environmental, social, and economic sustainability indicators. In other words, these multidimensional indicators can carry, in addition to environmental and socioeconomic information, also geospatial information, where their geographic positions are fundamental in the assessment of progress towards sustainability.
Therefore, there is the realization that the GIS, which initially supported the SA as a mapping tool associated with environmental issues (in which spatialized data were mostly used to determine the use and occupation of the land) gives rise to other application possibilities, mainly due to the evolution of geospatial techniques and tools associated with other sciences. These new perspectives develop in parallel with the global discussion on sustainability, that is, the evolution of use, and even technology, follows the evolution of the concept of sustainability.
7. Study Limitations/Strengths
Scopus is the largest database that indexes a greater number of abstracts and citations from peer-reviewed literature than other scientific research databases [34]. However, not using other databases can limit the scope of the research.
Furthermore, this work analyzed a total of 1721 articles, providing a systematic analysis of the authors’ use of keywords, bringing important information about the sources that stand out to be consulted, and pointing out directions for future work.
Author Contributions
Conceptualization, Victor Tomaz de Oliveira, Denilson Teixeira and Lucia Rocchi; data curation, Victor Tomaz de Oliveira; methodology, Victor Tomaz de Oliveira and Denilson Teixeira; software, Victor Tomaz de Oliveira; formal analysis, Victor Tomaz de Oliveira; writing—original draft preparation, Victor Tomaz de Oliveira, Denilson Teixeira, Lucia Rocchi and Antonio Boggia; writing—review and editing, Victor Tomaz de Oliveira, Denilson Teixeira, Lucia Rocchi and Antonio Boggia; supervision, Denilson Teixeira and Lucia Rocchi; All authors have read and agreed to the published version of the manuscript.
Funding
This research received no external funding.
Institutional Review Board Statement
Not applicable.
Informed Consent Statement
Not applicable.
Data Availability Statement
Not applicable.
Conflicts of Interest
The authors declare no conflict of interest.
References
- Kuhlman, T.; Farrington, J. What is Sustainability? Sustainability 2010, 2, 3436–3448. [Google Scholar] [CrossRef]
- Vitor, E.; Oliveira, P.B.; Vieira, L.M.; Schmitz, M.H.; Ferreira, D. Integrating Environmental, Geographical and Social Data to Assess Sustainability in Hydrographic Basins: The ESI Approach. Sustainability 2020, 12, 3057. [Google Scholar]
- WCED, Special Working Session. World commission on environment and development. Our Common Future 1987, 17, 1–91. [Google Scholar]
- Janoušková, S.; Hák, T.; Moldan, B.; Janouškov, S. Global SDGs assessments: Helping or confusing indicators? Sustainability 2018, 10, 1540. [Google Scholar] [CrossRef]
- Sala, S.; Ciuffo, B.; Nijkamp, P. A systemic framework for sustainability assessment. Ecol. Econ. 2015, 119, 314–325. [Google Scholar] [CrossRef]
- Patterson, M.; Mcdonald, G.; Hardy, D. Is there more in common than we think? Convergence of ecological footprinting, emergy analysis, life cycle assessment and other methods of environmental accounting. Ecol. Model. 2017, 362, 19–36. [Google Scholar] [CrossRef]
- Ramos, B. Sustainability Assessment: Exploring the Frontiers and Paradigms of Indicator Approaches. Sustainability 2019, 11, 824. [Google Scholar] [CrossRef]
- Bond, A.; Morrison-Saunders, A.; Pope, J. Sustainability assessment: The state of the art. Impact Assess. Proj. Apprais. 2012, 30, 53–62. [Google Scholar] [CrossRef]
- Waas, T.; Hugé, J.; Block, T.; Wright, T.; Benitez-Capistros, F.; Verbruggen, A. Sustainability assessment and indicators: Tools in a decision-making strategy for sustainable development. Sustainability 2014, 6, 5512–5534. [Google Scholar] [CrossRef]
- Manning, E.W. Geographic information systems and sustainable development. Gov. Inf. Q. 1990, 7, 329–342. [Google Scholar] [CrossRef]
- Olawumi, T.O.; Chan, D.W.M. A scientometric review of global research on sustainability and sustainable development. J. Clean. Prod. 2018, 183, 231–250. [Google Scholar] [CrossRef]
- Ramos, B.; Caeiro, S.; Disterheft, A.; Deutz, P.; Spangenberg, J.H.; Monta, M. Rethinking sustainability: Questioning old perspectives and developing new ones. J. Clean. Prod. 2020, 258, 120769. [Google Scholar] [CrossRef]
- Yadav, M.S.; Yadav, P.P.S.; Yaduvanshi, M.; Verma, D.; Singh, A.N. Sustainability assessment of sodic land reclamation using remote sensing and GIS. J. Indian Soc. Remote Sens. 2010, 38, 269–278. [Google Scholar] [CrossRef]
- Sahani, S.; Raghavaswamy, V. Analyzing urban landscape with City Biodiversity Index for sustainable urban growth. Environ. Monit. Assess. 2018, 190, 471. [Google Scholar] [CrossRef] [PubMed]
- Mamat, A.; Halik, Ü.; Rouzi, A. Variations of ecosystem service value in response to land-use change in the Kashgar Region, Northwest China. Sustainability 2018, 10, 200. [Google Scholar] [CrossRef]
- Delgado, M.I. Soil loss as a result of the interactions between natural landscape attributes and human activities in Ventania, Argentina. Ecol. Austral 2018, 28, 74–80. [Google Scholar] [CrossRef]
- Zhang, L.; Liu, Y.; Wei, X. Forest fragmentation and driving forces in Yingkou, Northeastern China. Sustainability 2017, 9, 374. [Google Scholar] [CrossRef]
- Wightman, J.L.; Ahmed, Z.U.; Volk, T.A.; Castellano, P.J.; Peters, C.J.; DeGloria, S.D.; Duxbury, J.M.; Woodbury, P.B. Assessing Sustainable Bioenergy Feedstock Production Potential by Integrated Geospatial Analysis of Land Use and Land Quality. BioEnergy Res. 2015, 8, 1671–1680. [Google Scholar] [CrossRef]
- Bryan, B.A.; Nolan, M.; McKellar, L.; Connor, J.D.; Newth, D.; Harwood, T.; King, D.; Navarro, J.; Cai, Y.; Gao, L.; et al. Land-use and sustainability under intersecting global change and domestic policy scenarios: Trajectories for Australia to 2050. Glob. Environ. Chang. 2016, 38, 130–152. [Google Scholar] [CrossRef]
- Graymore, M.L.M.; Wallis, A.M.; Richards, A.J. An Index of Regional Sustainability: A GIS-based multiple criteria analysis decision support system for progressing sustainability. Ecol. Complex. 2009, 6, 453–462. [Google Scholar] [CrossRef]
- Forsyth, T. Science, myth and knowledge: Testing Himalayan environmental degradation in Thailand. Geoforum 1996, 27, 375–392. [Google Scholar] [CrossRef]
- Joerin, F.; Thérialult, M.; Musy, A. Using GIS and outranking multicriteia analysis for land-use suitability assesment. Int. J. Geogr. Inf. Sci. 2001, 15, 153–174. [Google Scholar] [CrossRef]
- Weng, Q. A remote sensing?GIS evaluation of urban expansion and its impact on surface temperature in the Zhujiang Delta, China. Int. J. Remote Sens. 2001, 22, 1999–2014. [Google Scholar] [CrossRef]
- Cheng, J.; Masser, I. Urban growth pattern modeling: A case study of Wuhan City, PR China. Landsc. Urban Plan. 2003, 62, 199–217. [Google Scholar] [CrossRef]
- Xiao, J.; Shen, Y.; Ge, J.; Tateishi, R.; Tang, C.; Liang, Y.; Huang, Z. Evaluating urban expansion and land use change in Shijiazhuang, China, by using GIS and remote sensing. Landsc. Urban Plan. 2006, 75, 69–80. [Google Scholar] [CrossRef]
- MacKerron, G.; Mourato, S. Life satisfaction and air quality in London. Ecol. Econ. 2009, 68, 1441–1453. [Google Scholar] [CrossRef]
- Burkhard, B.; Kroll, F.; Nedkov, S.; Müller, F. Mapping ecosystem service supply, demand and budgets. Ecol. Indic. 2012, 21, 17–29. [Google Scholar] [CrossRef]
- Jiang, D.; Zhuang, D.; Fu, J.; Huang, Y.; Wen, K. Bioenergy potential from crop residues in China: Availability and distribution. Renew. Sustain. Energy Rev. 2012, 16, 1377–1382. [Google Scholar] [CrossRef]
- Bathrellos, G.D.; Gaki-Papanastassiou, K.; Skilodimou, H.D.; Papanastassiou, D.; Chousianitis, K.G. Potential suitability for urban planning and industry development using natural hazard maps and geological-geomorphological parameters. Environ. Earth Sci. 2012, 66, 537–548. [Google Scholar] [CrossRef]
- Cobo, M.J.; López-Herrera, A.G.; Herrera-Viedma, E.; Herrera, F. An approach for detecting, quantifying, and visualizing the evolution of a research field: A practical application to the Fuzzy Sets Theory field. J. Informetr. 2011, 5, 146–166. [Google Scholar] [CrossRef]
- Gutiérrez-Salcedo, M.; Martínez, M.Á.; Moral-Munoz, J.A.; Herrera-Viedma, E.; Cobo, M.J. Some bibliometric procedures for analyzing and evaluating research fields. Appl. Intell. 2018, 48, 1275–1287. [Google Scholar] [CrossRef]
- Secinaro, S.; Brescia, V.; Calandra, D.; Biancone, P. Employing bibliometric analysis to identify suitable business models for electric cars. J. Clean. Prod. 2020, 264, 121503. [Google Scholar] [CrossRef]
- Campos-medina, F. International trends in mining tailings publications: A descriptive bibliometric study. Resour. Policy 2021, 74, 102272. [Google Scholar] [CrossRef]
- Aghaei Chadegani, A.; Salehi, H.; Md Yunus, M.M.; Farhadi, H.; Fooladi, M.; Farhadi, M.; Ale Ebrahim, N. A comparison between two main academic literature collections: Web of science and scopus databases. Asian Soc. Sci. 2013, 9, 18–26. [Google Scholar] [CrossRef]
- Peter Bernard Keenan, P.J. Spatial Decision Support Systems: Three decades on. Decis. Support Syst. 2019, 116, 64–76. [Google Scholar] [CrossRef]
- Tibaná-Herrera, G.; Fernández-Bajón, M.T.; De Moya-Anegón, F. Categorization of E-learning as an emerging discipline in the world publication system: A bibliometric study in SCOPUS. Int. J. Educ. Technol. High. Educ. 2018, 15, 21. [Google Scholar] [CrossRef]
- Aria, M.; Alterisio, A.; Scandurra, A.; Pinelli, C.; Aniello, B.D. The scholar’ s best friend: Research trends in dog cognitive and behavioral studies. Anim. Cogn. 2020, 24, 541–553. [Google Scholar] [CrossRef]
- Aria, M.; Cuccurullo, C. bibliometrix: An R-tool for comprehensive science mapping analysis. J. Informetr. 2017, 11, 959–975. [Google Scholar] [CrossRef]
- Chen, C. CiteSpace: A Practical Guide for Mapping Scientific Literature; Nova Science Publishers: Hauppauge, NY, USA, 2016. [Google Scholar]
- Vanderhaegen, M.; Muro, E. Contribution of a European spatial data infrastructure to the effectiveness of EIA and SEA studies. Environ. Impact Assess. Rev. 2005, 25, 123–142. [Google Scholar] [CrossRef]
- Saidi, S.; Bouri, S.; Ben Dhia, H.; Anselme, B. Assessment of groundwater risk using intrinsic vulnerability and hazard mapping: Application to Souassi aquifer, Tunisian Sahel. Agric. Water Manag. 2011, 98, 1671–1682. [Google Scholar] [CrossRef]
- Gimpel, A.; Stelzenmüller, V.; Cormier, R.; Floeter, J.; Temming, A. A spatially explicit risk approach to support marine spatial planning in the German EEZ. Mar. Environ. Res. 2013, 86, 56–69. [Google Scholar] [CrossRef] [PubMed]
- Wisner, B.; Blaikie, P.; Cannon, T.; Davis, I. At. Risk: Natural Hazards, Peoples Vulnerability and Disasters; Taylor and Francis: London, UK, 2014; ISBN 9780203714775/0415252156. [Google Scholar]
- Yigitcanlar, T.; Dur, F. Developing a sustainability assessment model: The sustainable infrastructure, Land-use, environment and transport model. Sustainability 2010, 2, 321–340. [Google Scholar] [CrossRef]
- Tolón-Becerra, A.; Lastra-Bravo, X.; Galdeano-Gómez, E. Planning and neo-endogenous model for sustainable development in Spanish rural areas. Int. J. Sustain. Soc. 2010, 2, 156–176. [Google Scholar] [CrossRef]
- Paulsen, C.; Crist, P.J.; Kittel, G.; Varley, I. Regionwide cumulative effects analysis of long-range transportation plans. Transp. Res. Rec. 2010, 2158, 10–18. [Google Scholar] [CrossRef]
- Mentis, D.; Howells, M.; Rogner, H.; Korkovelos, A.; Arderne, C.; Zepeda, E.; Siyal, S.; Taliotis, C.; Bazilian, M.; De Roo, A.; et al. Lighting the World: The first application of an open source, spatial electrification tool (OnSSET) on Sub-Saharan Africa. Environ. Res. Lett. 2017, 12, 085003. [Google Scholar] [CrossRef]
- Chow, J. Mangrove management for climate change adaptation and sustainable development in coastal zones. J. Sustain. For. 2018, 37, 139–156. [Google Scholar] [CrossRef]
- Avtar, R.; Aggarwal, R.; Kharrazi, A.; Kumar, P.; Kurniawan, T.A. Utilizing geospatial information to implement SDGs and monitor their Progress. Environ. Monit. Assess. 2020, 192, 35. [Google Scholar] [CrossRef]
- United Nations. Transforming Our World: The 2030 Agenda for Sustainable Development. 2015. Available online: https://sdgs.un.org (accessed on 1 July 2022).
- Estoque, R.C. A Review of the Sustainability Concept and the State of SDG Monitoring Using Remote Sensing. Remote Sens. 2020, 12, 1770. [Google Scholar] [CrossRef]
- Graymore, M.L.M.; Sipe, N.G.; Rickson, R.E. Regional sustainability: How useful are current tools of sustainability assessment at the regional scale? Ecol. Econ. 2008, 67, 362–372. [Google Scholar] [CrossRef]
- Boggia, A.; Massei, G.; Pace, E.; Rocchi, L.; Paolotti, L.; Attard, M. Spatial multicriteria analysis for sustainability assessment: A new model for decision making. Land Use Policy 2018, 71, 281–292. [Google Scholar] [CrossRef]
Publisher’s Note: MDPI stays neutral with regard to jurisdictional claims in published maps and institutional affiliations. |
© 2022 by the authors. Licensee MDPI, Basel, Switzerland. This article is an open access article distributed under the terms and conditions of the Creative Commons Attribution (CC BY) license (https://creativecommons.org/licenses/by/4.0/).