Article

Evaluation of Coastal Erosion in the Watersheds of Municipality of Buenaventura, Colombia: Using Geospatial Techniques and the Composite Vulnerability Index

by
Jose Eduardo Fuentes
1,2,3,*,
Robin Alexis Olaya
4 and
Cesar Edwin Garcia
4
1
AGESAT Research Group, Geography Department, Universidad del Valle, Cali 760031, Colombia
2
TERRITORIOS Research Group, Geography Department, Universidad del Valle, Cali 760031, Colombia
3
INCIMAR Institute of Marine Sciences and Limnology, Universidad del Valle, Cali 760031, Colombia
4
School of Civil and Geomatics Engineering, Universidad del Valle, Cali 760031, Colombia
*
Author to whom correspondence should be addressed.
ISPRS Int. J. Geo-Inf. 2022, 11(11), 568; https://doi.org/10.3390/ijgi11110568
Submission received: 27 October 2022 / Revised: 10 November 2022 / Accepted: 14 November 2022 / Published: 15 November 2022
(This article belongs to the Special Issue Geo-Information for Watershed Processes)

Abstract

:
Buenaventura on the Colombian Pacific coast has experienced a wide range of threats, mainly due to the effects of coastal erosion and flooding. Globally, millions of people will experience increased vulnerability in the coming decades due to climate change. The change in the coastline (1986–2020) over time was analyzed with remote sensors and the Digital Shoreline Analysis System (DSAS) in conjunction with GIS. A total of 16 indicators were selected to quantitatively evaluate exposure, sensitivity, and adaptive capacity to construct a composite vulnerability index (COVI). The endpoint rate (EPR) of the change in the coastline was estimated. The results showed that 35% of the study area was stable, 18% of the coastline experienced erosion processes, and 47% experienced accretion. The COVI analysis revealed that coastal watersheds show great spatial heterogeneity; 31.4% of the area had moderate vulnerability levels, 26.5% had low vulnerability levels, and 41.9% had high vulnerability levels. This analysis revealed that the watersheds located in the northern (Málaga Bay) and central (Anchicaya, Cajambre, and Rapposo basins) parts of the coastal zone were more vulnerable than the other areas.

1. Introduction

The coastal areas of Colombia cover less than 7% of the land surface of the country and support a population of 6 million inhabitants [1]. In recent years, the Colombian Pacific coast has experienced a wide range of catastrophic threats to its ecosystems, population, and infrastructure, mainly due to the effects of coastal erosion and flooding [2]. The destruction of ecosystems, climate change, population growth, and human activities, such as deforestation and mining, will increase vulnerability even more in the coming decades [3,4,5,6]. Globally, approximately 10 million people experience negative effects from tropical storms, coastal erosion, floods, and storm surges each year, which is expected to increase to 50 million by 2080 due to climate change and high sociodemographic pressure [7]. Coastal flooding and sea level are expected to increase significantly by the middle of the century [8]. How vulnerability should be assessed to generate adaptation and resilience strategies in the face of potentially disastrous events in the coastal zone is a global concern of scientific communities. [8,9]. However, the intensity and severity of hazardous events vary spatially, and they often become disasters when combined with the vulnerable socioeconomic environment of the human population [10]. Vulnerability is the degree to which a system is susceptible to natural hazards and social changes; it is a concept with multiple dimensions, encompassing the economic, political, physical, social, and environmental dimensions [11]. Vulnerability to any event can be explained as a function of exposure, sensitivity, and the ability to adapt or cope [12]. The definition of vulnerability implemented by the Intergovernmental Panel on Climate Change (IPCC) is one of the most widespread concepts in the world for conducting vulnerability assessments of multiple hazards [7]. To address this problem in Colombia, it has been proposed to include coastal erosion in disaster risk management as a public policy approach [13,14].
In recent years, evaluation of coastal vulnerability with an emphasis on geomorphological and physical factors has focused on the use of the coastal vulnerability index (CVI). This index was designed to estimate areas of risk caused by environmental and socioeconomic hazards and is widely used to implement decision-making within the framework of risk reduction. The CVI approach was initially developed by Gornitz [15,16] to study the vulnerability of the east coast of the United States of America due to sea level rise. The index allows to relate six physical variables in a quantifiable way and produces numerical data that cannot be directly equated with particular physical effects, but it does highlight the regions where the various effects of sea level rise may be greater [17]. Subsequently, the CVI was used to assess vulnerability along the Atlantic coast by the United States Geological Survey (USGS) in the study of Thieler and Hammar-Klose [18]. In the analysis of coastline change, some studies focused on analyzing the geomorphological and physical factors of the CVI but also included socioeconomic variables to develop resilience to the threats of climate change [19,20,21,22,23,24]. The state of vulnerability can be determined based on a group of conditions and processes resulting from physical, environmental, and socioeconomic factors that increase the susceptibility of people living in coastal areas to natural hazards, including their ability to adapt and respond to disasters [25,26].
Based on the CVI, other indices have been developed that focus more extensively on the conceptual structure of the vulnerability index using a process of analytical hierarchy, and this index is called the composite vulnerability index (COVI). Recently, several researchers have used this method to evaluate coastal vulnerability by incorporating different factors that indicate different dimensions (physical, ecological, social, and economic), including parameters such as biophysical exposure, sensitivity, and adaptive capacity or resilience to evaluate multiple hazards. For example, Zhang et al. [27] evaluated the coastal vulnerability to climate change of Bohai in China considering fifteen factors related to ecological, physical, and socioeconomic conditions in a COVI. Ghosh and Mistri [28] evaluated coastal vulnerability as a function of multiple factors with the composite vulnerability index in the lower delta of the Sundarban, India considering 22 indicators, mainly physical, climatic, and socioeconomic variables. Sahana and Sajjad [29] evaluated floods focusing on storm surge with a vulnerability index composed of remote sensing information in the Sundarban Biosphere Reserve, India considering seventeen factors. Finally, Furlan et al. [30] developed a multidimensional CVI to evaluate vulnerability to flood scenarios along the Italian coast considering multiple indicators. Although there are studies that evaluate the general vulnerability of the coasts of Buenaventura [13,21,22,31,32], these have focused mainly on geomorphological and physical dimensions. Numerous studies have been conducted around the world to examine different aspects of coastal vulnerability with a geospatial approach using the CVI and COVI (Table 1).
The objective of this work is to analyze coastal erosion at the watershed level using remote sensors in conjunction with GIS to build a COVI. Selection of indicators and the weighting assigned to each indicator are important parts of the study. Incorporation of physical, environmental, and socioeconomic variables to evaluate various indices using a weighting method allows a comprehensive view of spatial vulnerability considering that coastal watershed is the most appropriate scale to assess vulnerability to natural and anthropogenic changes.

2. Materials and Methods
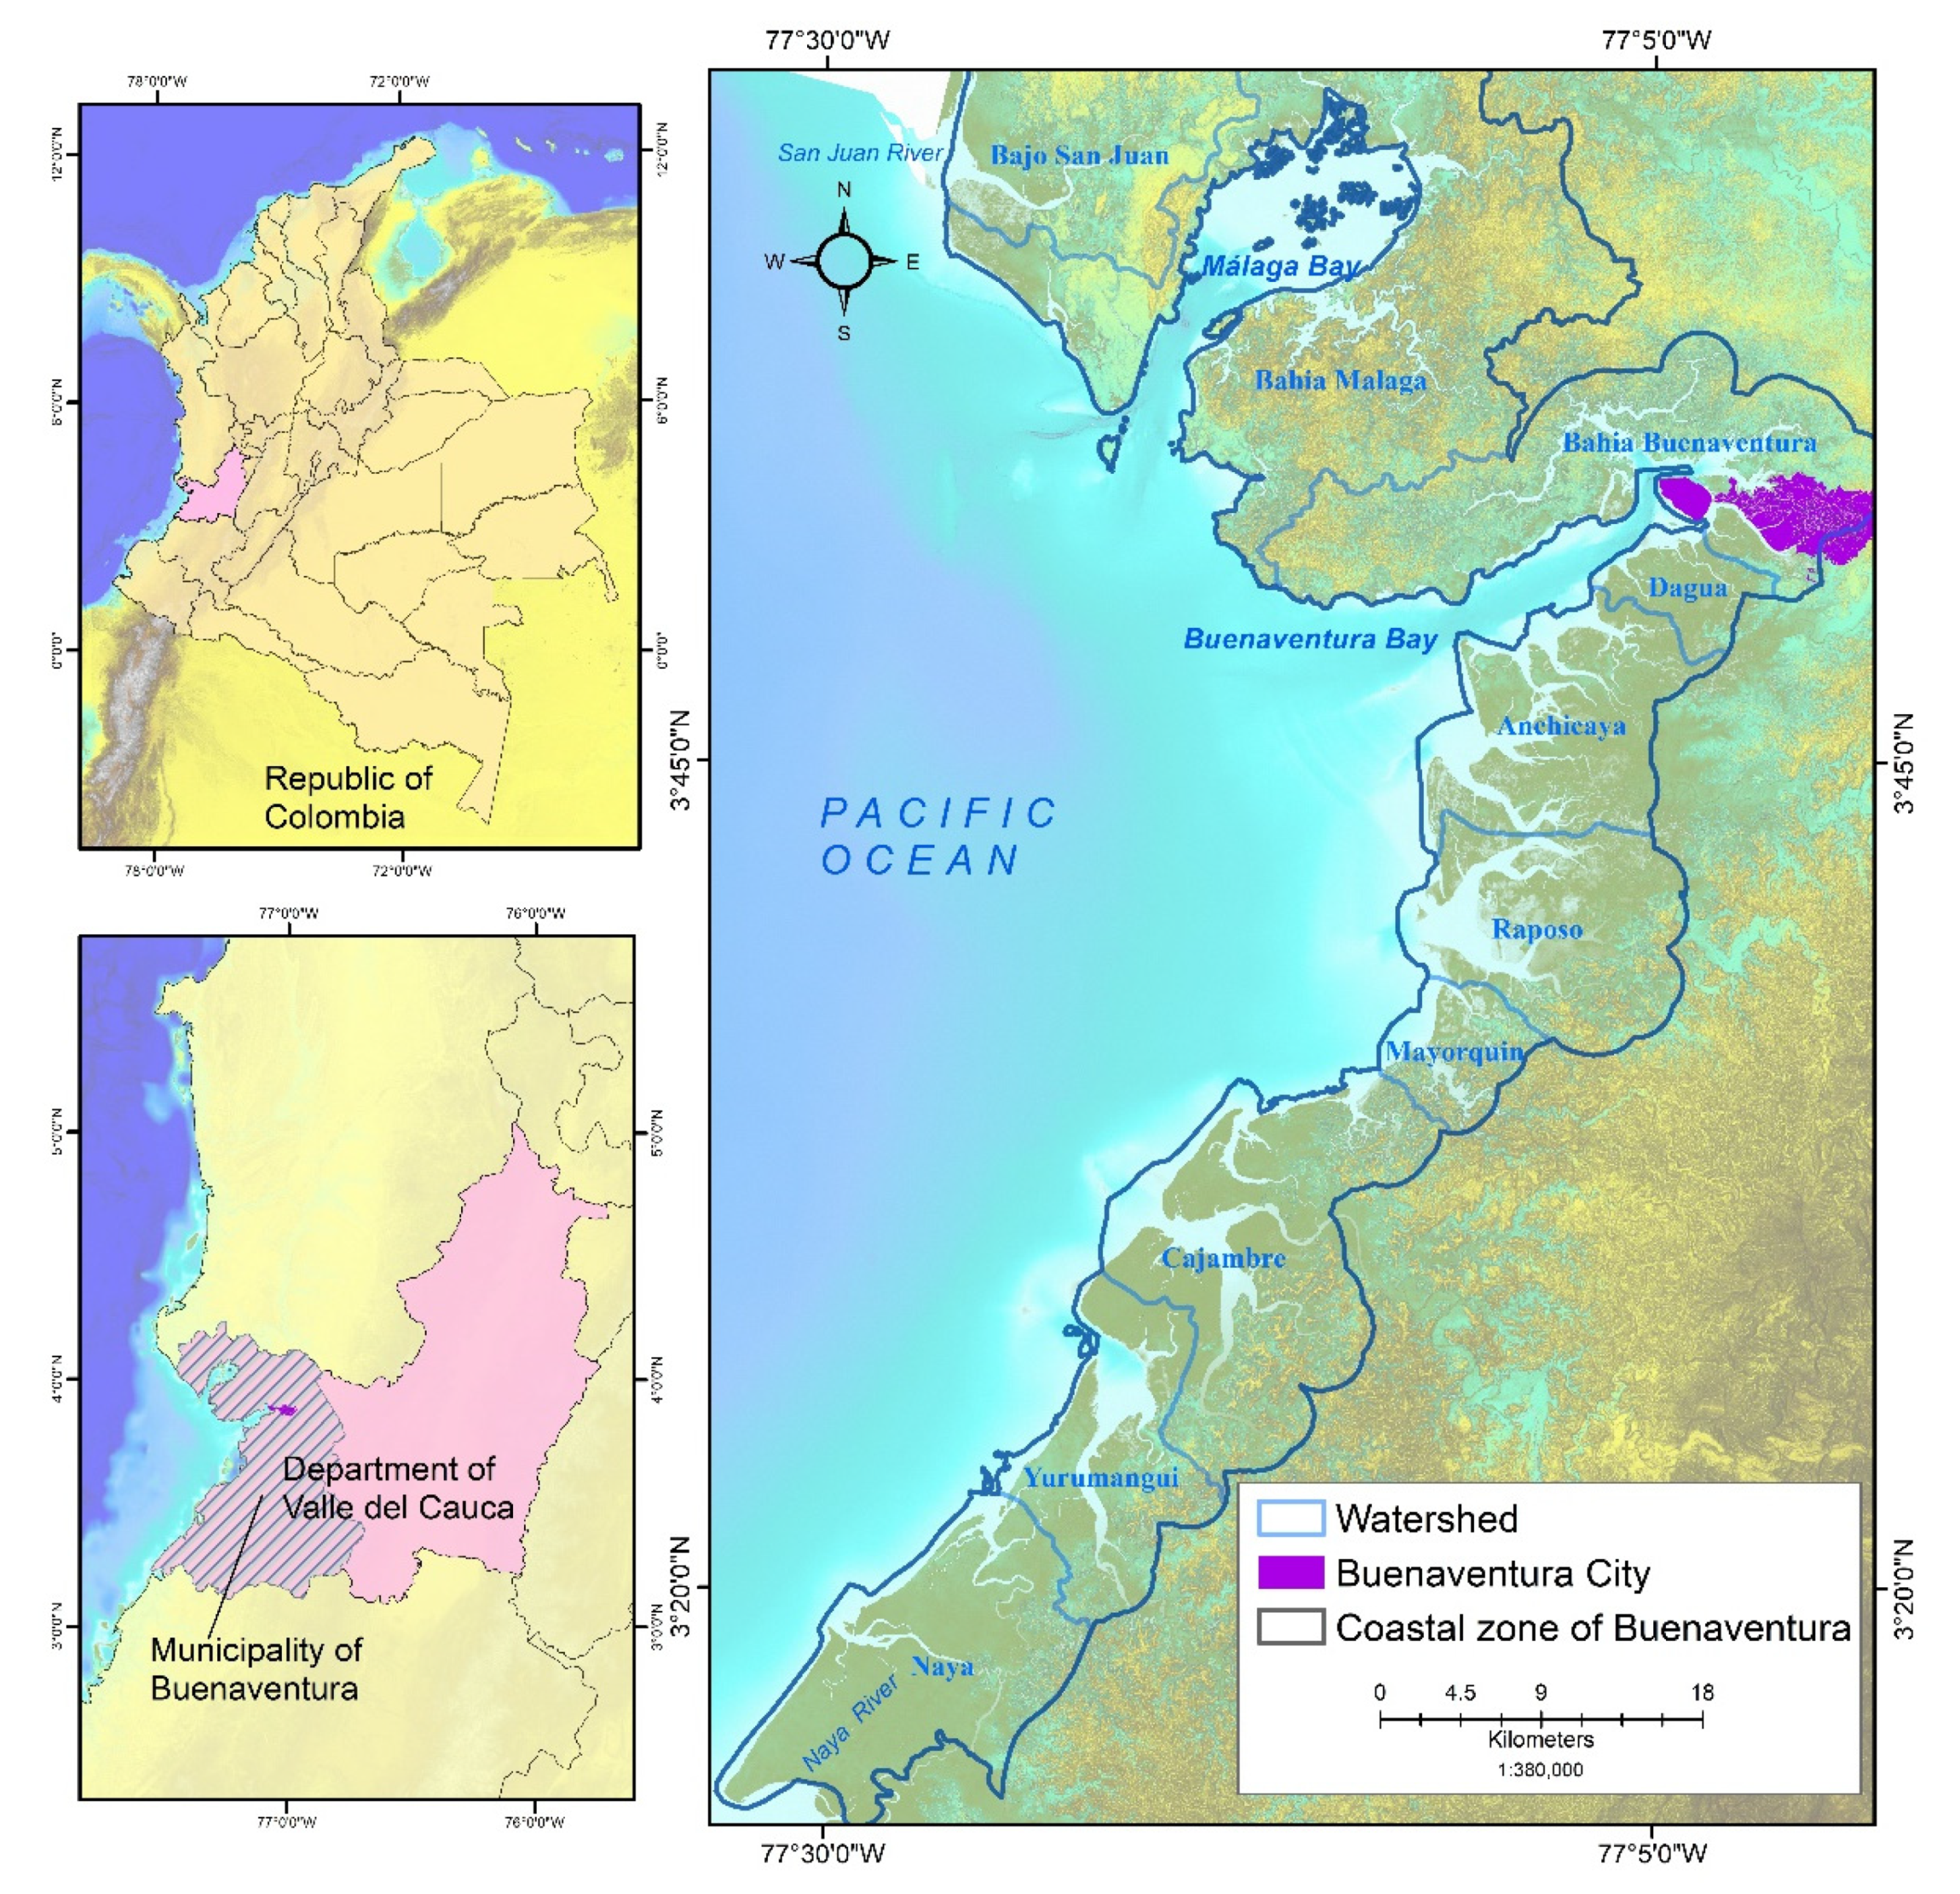
2.1. Study Area

Buenaventura is located in the Valle del Cauca in the central zone of the Colombian Pacific in one of the four Colombian departments on the coast of the Pacific Ocean. It encompasses the extensive area of the municipality and special port district of Buenaventura. It is bounded by the San Juan River to the north and by the Naya River to the south, semienclosed by two bays: Bay of Buenaventura and Bay of Malaga. Geographically, the coastal area has a total coastline of approximately 686 km and extends over the coordinates 4°2.23′82″ N and 77°26′18.87″ W, at 3°13′33.21′ N and 77°32′41.63″ W, as shown in Figure 1. The coastline is composed of barrier islands, intertidal zones, rocky cliffs, rocky platforms, alluvial and intertidal plains, estuaries, sandy beaches, and salt marshes [42]. The beaches of Buenaventura are of natural origin according to the sedimentological description from the granulometric analysis made by the Institute of Marine and Coastal Research of Colombia (INVEMAR) on beach samples for the sectors of Punta Soldado, La Bocana, and Piangüita in the department of Valle del Cauca. The average grain size distribution in different sampling campaigns in the years 2012, 2014, and 2015, indicates that, in this area of the municipality of Buenaventura, sediments showed a tendency mostly to a fine grain size [1]. The Chocó Biogeografico (biodiversity hotspot) includes the Pacific coastline between Darién in Panama and northwestern Ecuador, passing through the entire coastal strip of Colombia.
Within this hotspot, mangroves are one of the most important ecosystems in Valle del Cauca, covering 140 km2 [43]. The tides of the Colombian Pacific coast are regular semidiurnal, that is, with two high tides and two low tides per day with a period of approximately 12.25 h, and their tidal range can reach slightly more than 4 m [44]. Precipitation generally shows monomodal behavior, with an annual average between 6821 mm and 7673 mm, and there are approximately 228 days with rain. The average annual temperature for the Pacific is 25.7 °C [45]. Structurally, Buenaventura is characterized by a flat morphology in the south and cliff formations to the north. There are three levels of terraces present in the river courses that seem to indicate recent tectonic activity of uplift and subsidence, formed by Quaternary deposits [44]. Economically, the port area of Buenaventura consists of several maritime terminals that provide port and logistics services in the most important port of the Colombian Pacific through which a large part of Colombia’s foreign trade occurs. This port moves 47% of Colombian exports and imports, including those related to mining, oil, and its derivatives [46]. Its population for 2020 was approximately 311,827 inhabitants, demographically composed of African descendants and mixed-ancestry and indigenous communities [47,48]. A percentage of the population lives in stilt houses located at or close to the shoreline exposed to waves, increasing their degree of exposure to the tidal regime [45]. Insufficient resources, multidimensional poverty, and remoteness are great challenges for the community. Almost 33.3% of the population lives below the poverty level [47]. Regarding studies of the coastal zone of Buenaventura related to vulnerability, the study by Ricaurte et al., 2021 [11] stands out, where the dominance of each component of the threat in the Colombian Pacific region was analyzed and it was established that it is determined by fragility, mainly social, economic, and institutional. Coca and Ricaurte 2019 [21] studied the town of La Barra since 2013, when a process of avulsion towards the sea began; associated with this event, an accelerated coastal erosion process could be measured, where the vulnerability of the population was evaluated. Gallego and Selvaraj 2019 [22] applied the coastal vulnerability index (CVI) using eight variables, three physical/hydrodynamic, three geological/geomorphological, and two socioeconomic variables. The coastline was classified into five relative vulnerability ranges. Cifuentes et al., 2017 [31] focused on studying the magnitude of shoreline change north of Buenaventura District over a 30-year period. On average, they found a rate of change of −0.2 m per year in the coastline, reflecting its erosional trend, with maximum EPR values of 26.9 m of accretion and −21 m of coastal erosion. Uribe et al., 2020 [32] explored the degree of vulnerability of ecosystem services in the northern area of Buenaventura to natural and anthropogenic hazards. Sea level rise and coastal erosion are the most likely threats to ecosystem services. One of the most significant dangers that threatens the study area is coastal erosion. To evaluate vulnerability, the analyses were grouped using the division of coastal watersheds (Figure 1).

2.2. Shoreline Change

The change in a coastline is an important parameter that can have a natural or anthropogenic origin and indicates the pattern of accretion/erosion in conjunction with different processes, such as waves, tides, sea levels, and topographic shape [49]. The coastline represents the boundary between the sea and the landmass. Evaluating coastal erosion is essential for planning future management strategies, land use planning, and risk management [50]. Historical photographs and high-resolution satellite data were used to monitor coastline changes during a period of 34 years (from 1986 to 2020). Initially, orthomosaics were created for 1986 based on data acquired from official datasets (aerial photos) of the Agustín Codazzi Geographical Institute (IGAC). Two sets of airborne synthetic aperture radar images (synthetic-aperture radar SAR) were used, the first for 2009 and the second of 2015, being the most accurate public use datasets available for the terrain of Buenaventura (Table 2). In addition, 19 high-resolution orthorectified images of the PlanetScope satellite from 2020 were acquired. The constellation of PlanetScope satellites consists of groups of individual high-resolution satellites; each satellite has a 3U CubeSat format (10 cm by 10 cm by 30 cm). The complete constellation of PlanetScope is approximately 130 satellites and is capable of taking images of the entire Earth’s surface with four spectral bands (blue, green, red, and near infrared (NIR)); it has a spatial resolution of 3 m and a high temporal resolution (24 h) [51]. All sensors were used to extract the multitemporal coastline (Table 2).
To reduce uncertainty during the vectorization of the coastline from remote sensing data at the time of image capture, the tidal fluctuation error was taken into account [52]. The tidal errors were considered low since the acquired images showed the tides oscillating between 0.4 and ±2.3 m based on the data from the port of Buenaventura tide gauge, obtained from tide tables for the study area [53]. Taking into account the spatial resolution of 3 m, the possible displacement of the coastline by the tide was within the spatial uncertainty of the data. A visual interpretation of the coastline was performed using Catalyst software (v 2022, PCI Geomatics, Ontario, Canada) and ArcGIS (v 10.8, ESRI, Redlands, California, USA), in conjunction with Digital Shoreline Analysis System (DSAS) software, which complements ArcGIS and was developed by the Coastal Change Hazards project of the US Geological Survey. The DSAS allows the user to calculate rate of change statistics from multiple historical coastal positions; the rate of shoreline disposal/change was estimated through the software by calculating the end point rate (EPR) statistical parameter. The EPR is obtained by dividing the distance of coastline movement with the elapsed time between the oldest and youngest coastline position [54]. From the digitized coastlines for the four examined years (Figure 2), the date, uncertainty value, and type of coastline were standardized as required by the DSAS format. To create a uniform baseline, an interval of 25 m was used to create transects perpendicular to coastlines.

2.3. Justification of the Indicators

A methodology was implemented to estimate vulnerability as a function of exposure, sensitivity, and adaptive capacity in conjunction with an analysis of coastal erosion at the basin level to understand how to mitigate and adapt to the risks from disasters in the coastal zone of Buenaventura in the Colombian Pacific. According to IPCC [26], vulnerability is explained in terms of exposure, sensitivity, and adaptive capacity. In this work, the COVI refers to the extent to which coastal systems are susceptible to the impacts of coastal erosion and global change. The COVI was developed based on the exposure index (EI), the sensitivity index (SI), and the adaptive capacity index (ACI) modified from the Sahana and Sajjad methodology [29], where resilience is replaced by adaptive capacity. The index allowed the relationship of physical variables in a quantifiable way with the decision-making approach using spatial analysis, giving equal weight to the indicators. Exposure and sensitivity together have a potential impact on coastal systems and are positively correlated with vulnerability based on the propensity of populations and coastal properties to be negatively affected by natural hazards [25]. In contrast, adaptive capacity helps to generate resilience against the adverse consequences of hazards, and this is negatively correlated with vulnerability [26,55].
Based on bibliographic research (Table 1), a total of 16 indicators were selected for the quantitative evaluation of the vulnerability indices, the exposure index, the sensitivity index, and the adaptability index. A detailed description of the selected indicators and their functional relationships with vulnerability are shown in Table 3. After the establishment of the index system, values were assigned and weighted using the appropriate formulas. Each variable was rated from 1 (very low) to 5 (very high) in qualitative ranges. To evaluate coastal vulnerability in the context of environmental hazards, the multicriteria spatial analysis (MCSA) approach and the simple average method (SAM) were used; these quantitative methods are widely used to evaluate vulnerability in the framework of coastal risk reduction [27,28,29,30,40,41].

2.4. Exposure Index (EI)

An EI includes the eight factors that trigger the risk of biophysical exposure, and these factors were compiled from an extensive review of previous studies and expert opinions. The shape of a coastline is fundamental in analyzing vulnerability due to the degree of relative resistance that a coastal geoform can have against erosion [56]. To determine the geomorphology in the coastal zone of Buenaventura, the geomorphological maps developed by the Institute of Marine and Coastal Research of Colombia (INVEMAR) [45] and the geomorphological maps of the Center for Oceanographic and Hydrographic Research of Colombia (CIOH) [57] were used. The geomorphological units were reinterpreted and adjusted to a finer scale (1:10,000) using a geomorphometric analysis [58] with the digital terrain model (DTM) derived from the 2015 radar data. The degree of topographic variation influences the processes through which hydrometeorological events can expose a coast to floods and coastline retreat [26,59]. To determine the slope in the coastal zone, the 2015 radar DTM was used. The rate of coastline change indicated change characteristics that were largely due to erosion and accretion, and the rate of change was calculated with the DSAS software to determine EPR.
One of the aspects that can generate the greatest vulnerability in coastal areas is sea level rise [59]. To analyze this aspect, raster data of monthly and annual sea level averages from satellite observations for the global ocean from 1993 to 2020 were used, and they were provided by the Copernicus Marine Environment Monitoring Service (CMEMS) [60]. This dataset provides global estimates of sea level based on satellite altimetry measurements, and these estimates are calculated with respect to an average reference period of twenty years (1993–2012) using updated altimetry standards. The data are provided in NetCDF format with a horizontal resolution of 0.25° × 0.25°. To define the mean tidal range (MTR), the values obtained for the municipality of Buenaventura from the analysis of Gallego and Selvaraj [20] were used. The MTR was obtained using the mean high tide difference (MHW), a record of at least 19 years, and the mean low tide (MLW) from the recorded data of the Buenaventura tide gauge provided by the University of Hawaii Sea Level Center (UHSLC) [22]. Significant wave height is a representation of wave energy that is related to the movement and transport of coastal sediments [22]. For the study area, the significant wave height data were provided by the CMEMS information system. This information was compiled with data from the European Center for Medium-Range Weather Forecasts (ECMWF) [61] in the ERA5, an analysis of historical data. The analysis combines monthly averages of model data with observations from around the world in a globally complete and consistent dataset. Three points were selected from the global grid ERA5 at a relative depth of 15 m located between coordinates 3°49′44.25″ N, 77°23′32.05″ W, and 3°49′58.67″ N, 77°7′46.89″ W. The data were recalculated in a regular latitude and longitude grid with a horizontal resolution of 0.25° × 0.25° for 1959 to 2020. Significant wave height dataset has been extracted for the Colombian Pacific area in NetCDF format.
The risk of flooding due to hydrometeorological processes was determined using hazard maps at a scale of 1:100,000 from the Institute of Hydrology, Meteorology and Environmental Studies (IDEAM). These maps showed flooding from 1 m to 6 m as a result of storm surge, heavy rains due to historical accumulation, and flooding due to the El Niño Southern Oscillation (ENSO). The percentage of area under the different flood risk levels was calculated to evaluate the average flood risk. Terrain roughness can be defined generally as a characteristic related to the irregularity or topography of the terrain [62]. This represents the resistance of the land surface to water intrusion. The greater the roughness and sinuosity of land surfaces, the lower the vulnerability is [63]. From the 2015 digital elevation model, the roughness values were obtained.
The EI was determined by Equation (1) as:
Exposure index = (EX1 + EX2 + EX3 + EX4 + EX5 + EX6 + EX7 + EX8)/8
where the EI is a function of the ranges of geomorphology (EX1), slope (EX2), shoreline change rate (EX3), sea level rise rate (EX4), mean tidal range (EX5), significant wave height (EX6), flood inundation risk (EX7), and terrain roughness (EX8).

2.5. Sensitivity Index (SI)

Sensitivity is expressed as the elements at risk where a potential danger could be triggered. A very important aspect of sensitivity is population density since it plays a very influential role in the vulnerability of the coastal zone. The population density was calculated from the last National Population and Housing Census, which was in 2018 [48]. The multidimensional poverty factor was obtained from official census data. In Colombia, the index for measuring multidimensional poverty was designed by the National Planning Department (DNP) based on an adaptation of the methodology of Alkire and Foster (2011) [64]. For Colombia, the direct method evaluates the results of satisfaction (or no deprivation) that an individual has with respect to certain demographic characteristics that are considered vital, such as health, education, and employment [65]. In the study area, the coastal settlements were located within 6 km of the coastline, and their coastal vulnerability increases as the settlements are located closer to the coast. These data were obtained from the National Administrative Department of Statistics (DANE) from the national geostatistical framework (NGF). This layer contains the political-administrative divisions of Colombia: departments and municipalities, population centers, and other geostatistical areas where populations appear. Finally, this study used land cover and land use data at municipal level that were developed by the Regional Autonomous Corporation of Valle del Cauca (CVC) using the Corine Land Cover methodology adapted for Colombia [66]. Determining the land use and land cover in different human settlements is critical when assessing coastal vulnerability due to the possible socioeconomic impacts and their impacts on communities.
The SI was determined by Equation (2) as follows:
Sensitivity index = (SE1 + SE2 + SE3 + SE4)/4
where the sensitivity index is the function of the ranges of multidimensional poverty (SE1), settlements (SE2), land use and land cover (SE3), and population (SE4).

2.6. Adaptive Capacity Index (ACI)

Adaptive capacity is the potential ability of a system to resist the adverse impact of hazards using available resources, skills, and technology [26]. Therefore, it is a crucial factor in determining the impacts of climate change. The distance to road networks was used to determine transportation services by generating a map of proximity to the road network using a specific distance, and this area was divided into five buffer zones. Generally, an increase in the distance to the roads increases exposure due to the difficulty of accessing or exiting an area. The vulnerable population based on access to medical services was quantified from the geostatistical data of the 2018 National Population and Housing Census [48]. The availability of medical services in rural areas helps to strengthen health services in case of hazardous events. The economic activity factor was calculated as an aggregation of five factors that can be affected by coastal hazards, and they were industrial fishing, artisanal fishing, ecotourism, landscapes, and recreation/beaches, which are vulnerable to varying degrees.
These indicators have a negative correlation with vulnerability and help increase the resistance of coastal communities to natural disasters. The ACI was determined by Equation (3) as follows:
Adaptive capacity index = (AC1 + AC2 + AC3 + AC4)/4
where the ACI is a function of the ranges of economic activities (AC1), medical services (AC2), distances to roads (AC3), and literacy rates (AC4).

2.7. Composite Vulnerability Index (COVI)

The composite vulnerability index (COVI) was calculated as positively correlated with the EI and SI but negatively correlated with the ACI. Using the three indices, the vulnerability was determined by Equation (4) as follows:
COVI = (Exposure x Sensitivity) − Adaptive capacity
It was calculated by a simple average of normalized scores (Equation (4)). The value lies between 0 and 1, denoting very low to very high coastal vulnerability. There are several studies [27,28,40] that, in recent years, have validated Equation (4); in the case of India, Sahana and Sajjad 2019 [29] used a variation that replaces the term adaptive capacity with resilience.

3. Results

3.1. Rate of Coastline Displacement

Coastline movements with respect to erosion and accretion are a direct indicator of risk. The EPR statistical parameter of the multitemporal coastlines (1986 to 2020) was estimated after calculating 7818 transects with the DSAS tool; the coastline of Buenaventura was 406 km long. Further, 35% of the transects on the analyzed coastline in the study area were identified as stable. However, 18% of the coastline reflected erosion processes, and 47% reflected accretion processes (Figure 3a).
Grouping the results of the watershed analysis, the watersheds and the places with the greatest erosion and accretion are identified in Table 4. The greatest change in coastline (erosion–accretion) according to the EPR analysis was −96.23 m/year adjacent to the Raposo watershed in the Bocana de Raposo zone (Figure 3b) and 95.83 m/year adjacent to the Málaga Bay watershed in Playa La Concepción (Figure 3c). The general trend of the coastline was accretion according to the average EPR (2.84 m/year).

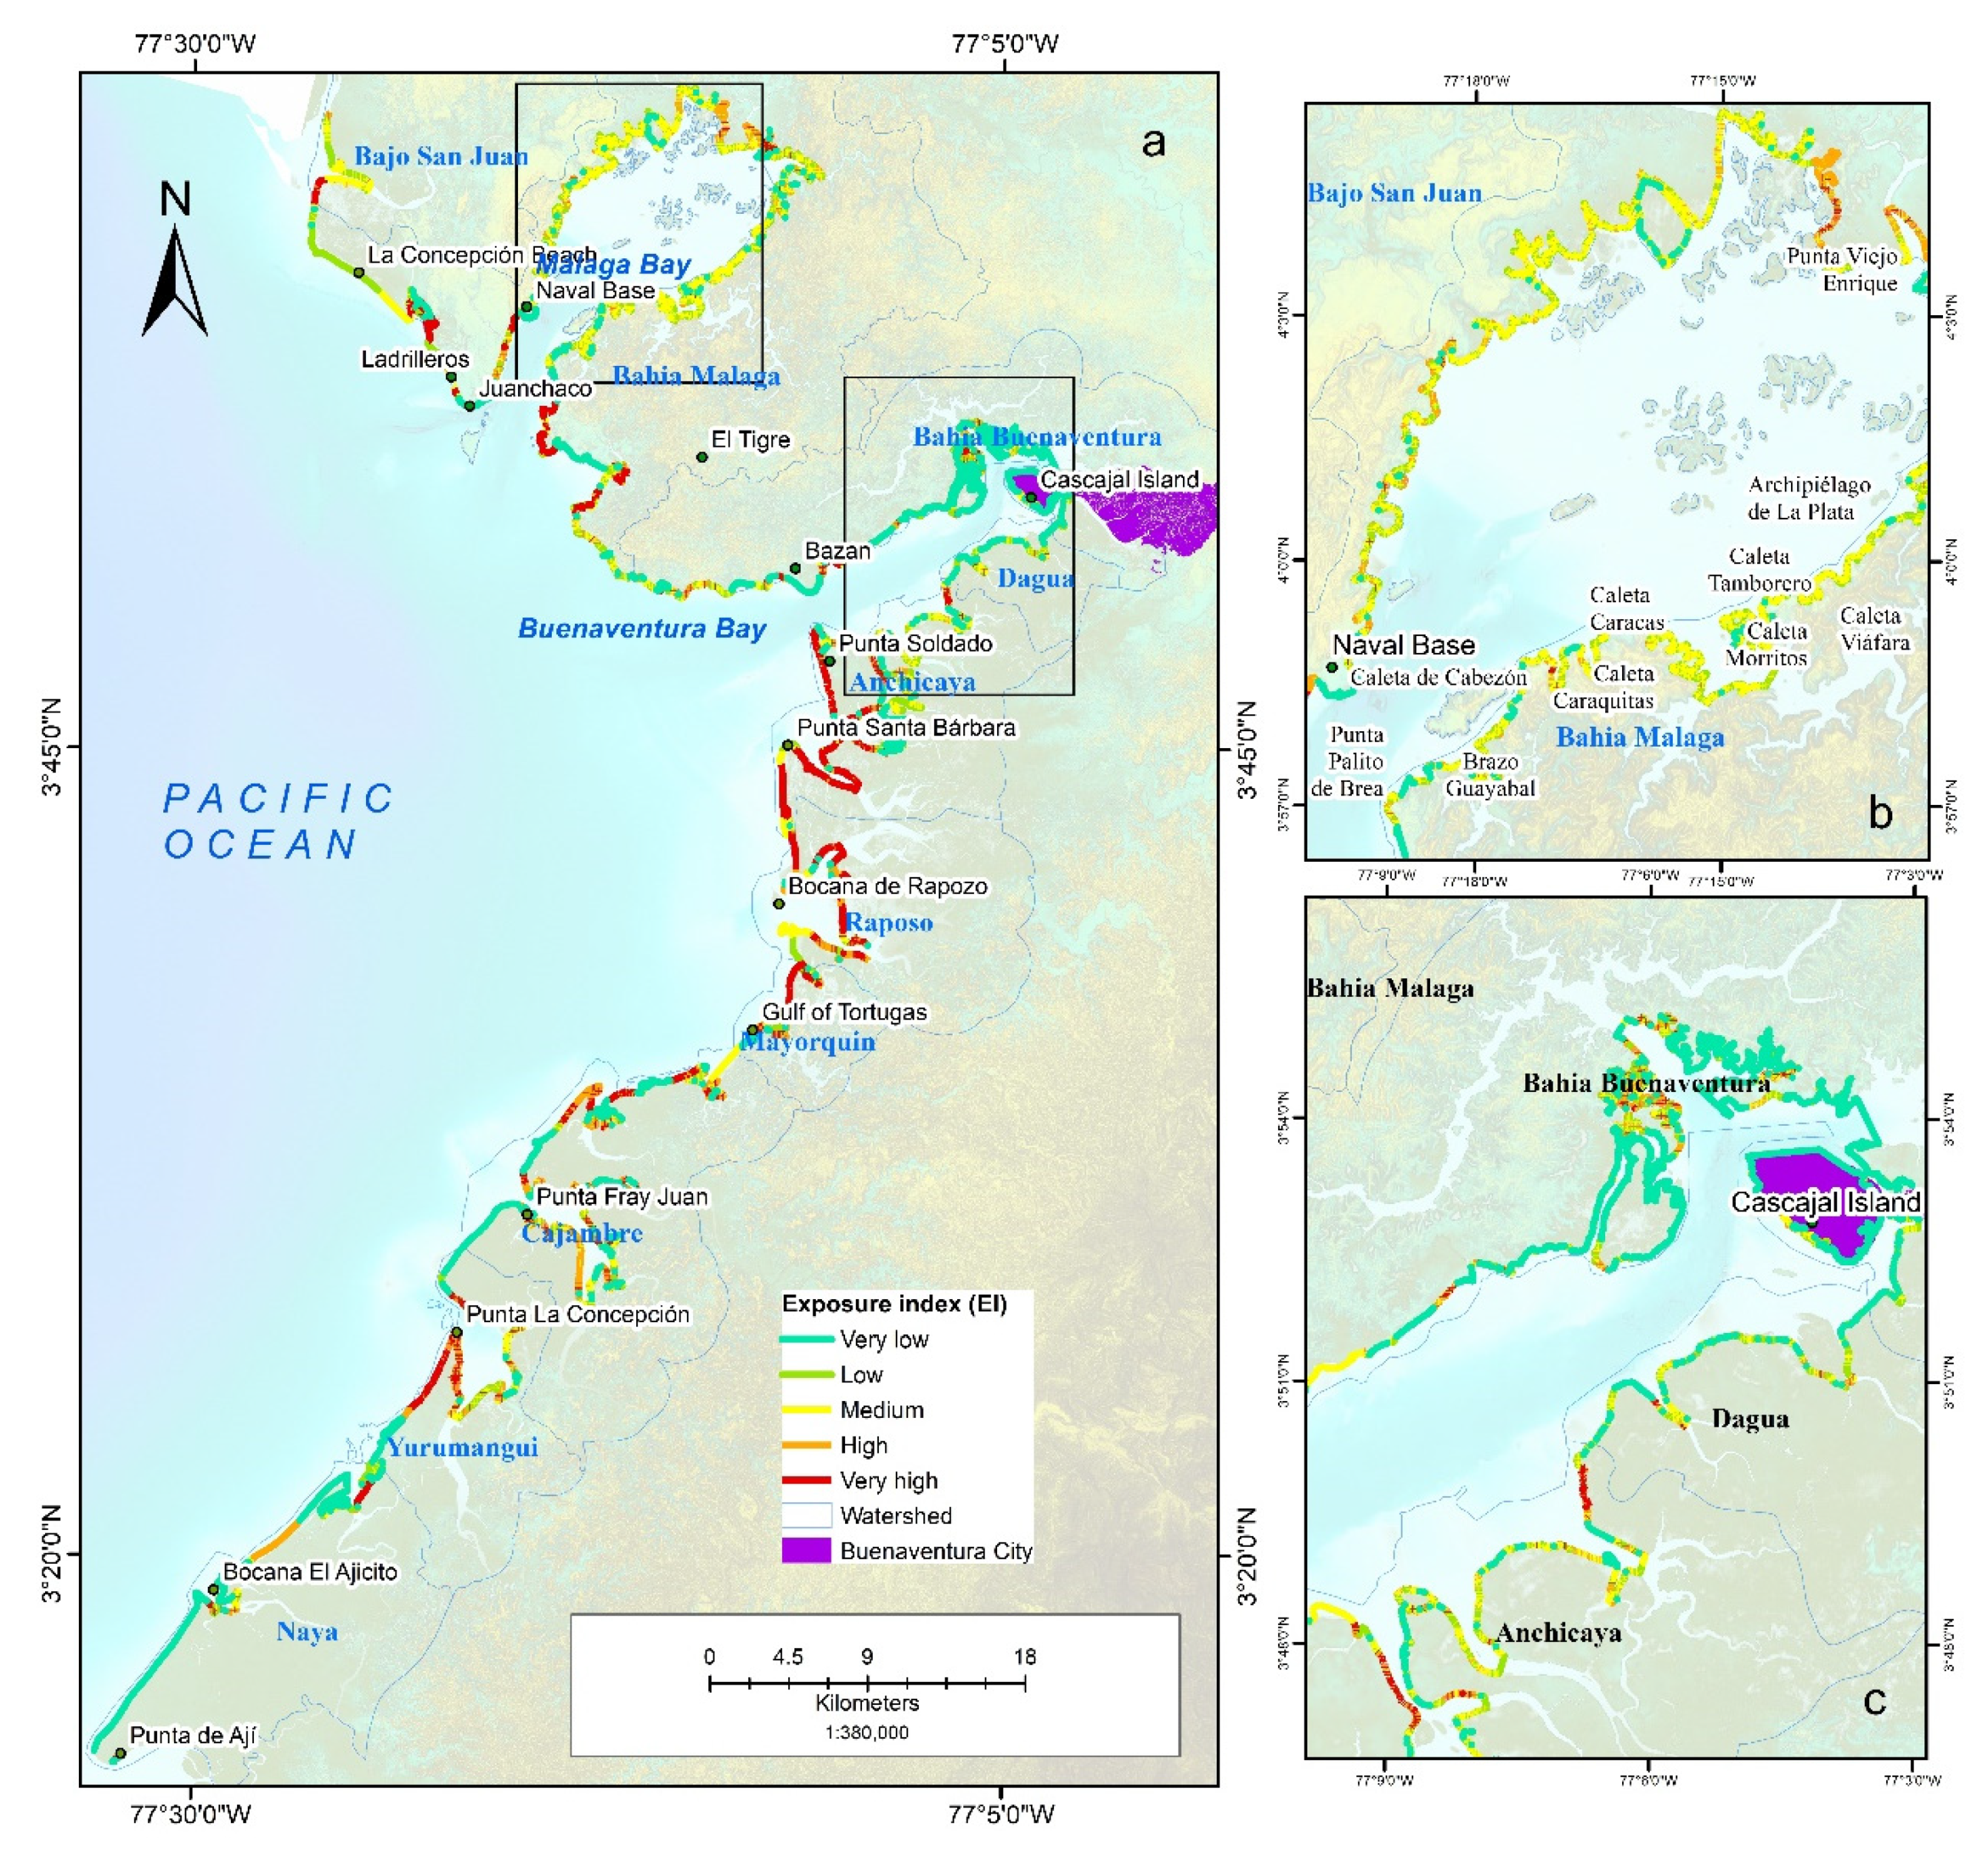
3.2. Exposure to Coastal Erosion

Approximately 31.7% of the watersheds, concentrated in the central and southern regions of the municipality of Buenaventura, had low to very low exposure scores, while the remaining areas had medium exposure scores (23.2%). Of the total watersheds (10), at least four watersheds were highly exposed to coastal erosion (44.9%) in the high to very high ranges (Figure 4a). The EI values varied with geographic heterogeneity among the coastal watersheds, with Málaga Bay registering the highest values. This is mainly attributed to the relatively higher scores for slope, average wave height, coastal erosion, and risk of flooding over the area of the watershed directly exposed to the sea (Figure 4a). The places in the outermost part of the bay are defined as estuarine areas and directly affected by intertidal processes, and they contain sandy beaches with sand of continental origin, transported by coastal rivers, and a moderate drainage density. In contrast, Málaga Bay has the lowest biophysical exposure (Figure 4b); this scenario also occurs in Buenaventura Bay, the area with the second lowest exposure value. The interior area of the bays is characterized by large areas of mangroves, small beaches, and cliffs, and the lower scores for this area were attributed mainly to the risk factors related to flooding, coastal erosion, and average wave height (Figure 4c).

3.3. Sensitivity to Coastal Erosion

The analysis of the SI revealed that approximately 37% of the areas were classified as having very low to low sensitivity scores, while the remaining areas were classified as having medium scores (32%); additionally, some watersheds were highly to very sensitive (29.4%), as shown in Figure 5a. Of all the coastal areas, the highest SI was calculated for the city of Buenaventura and the Dagua River watershed (Figure 5b) due to these areas having the highest scores for multidimensional poverty and population density and being the only large, urbanized areas. In contrast, the lowest SI was calculated for the interior of Málaga Bay, which was mainly due to the lower scores for population density and multidimensional poverty and its lack of urbanized areas (Figure 5c). Most coastal watersheds with mangrove forests and natural vegetation showed low sensitivity to coastal erosion.

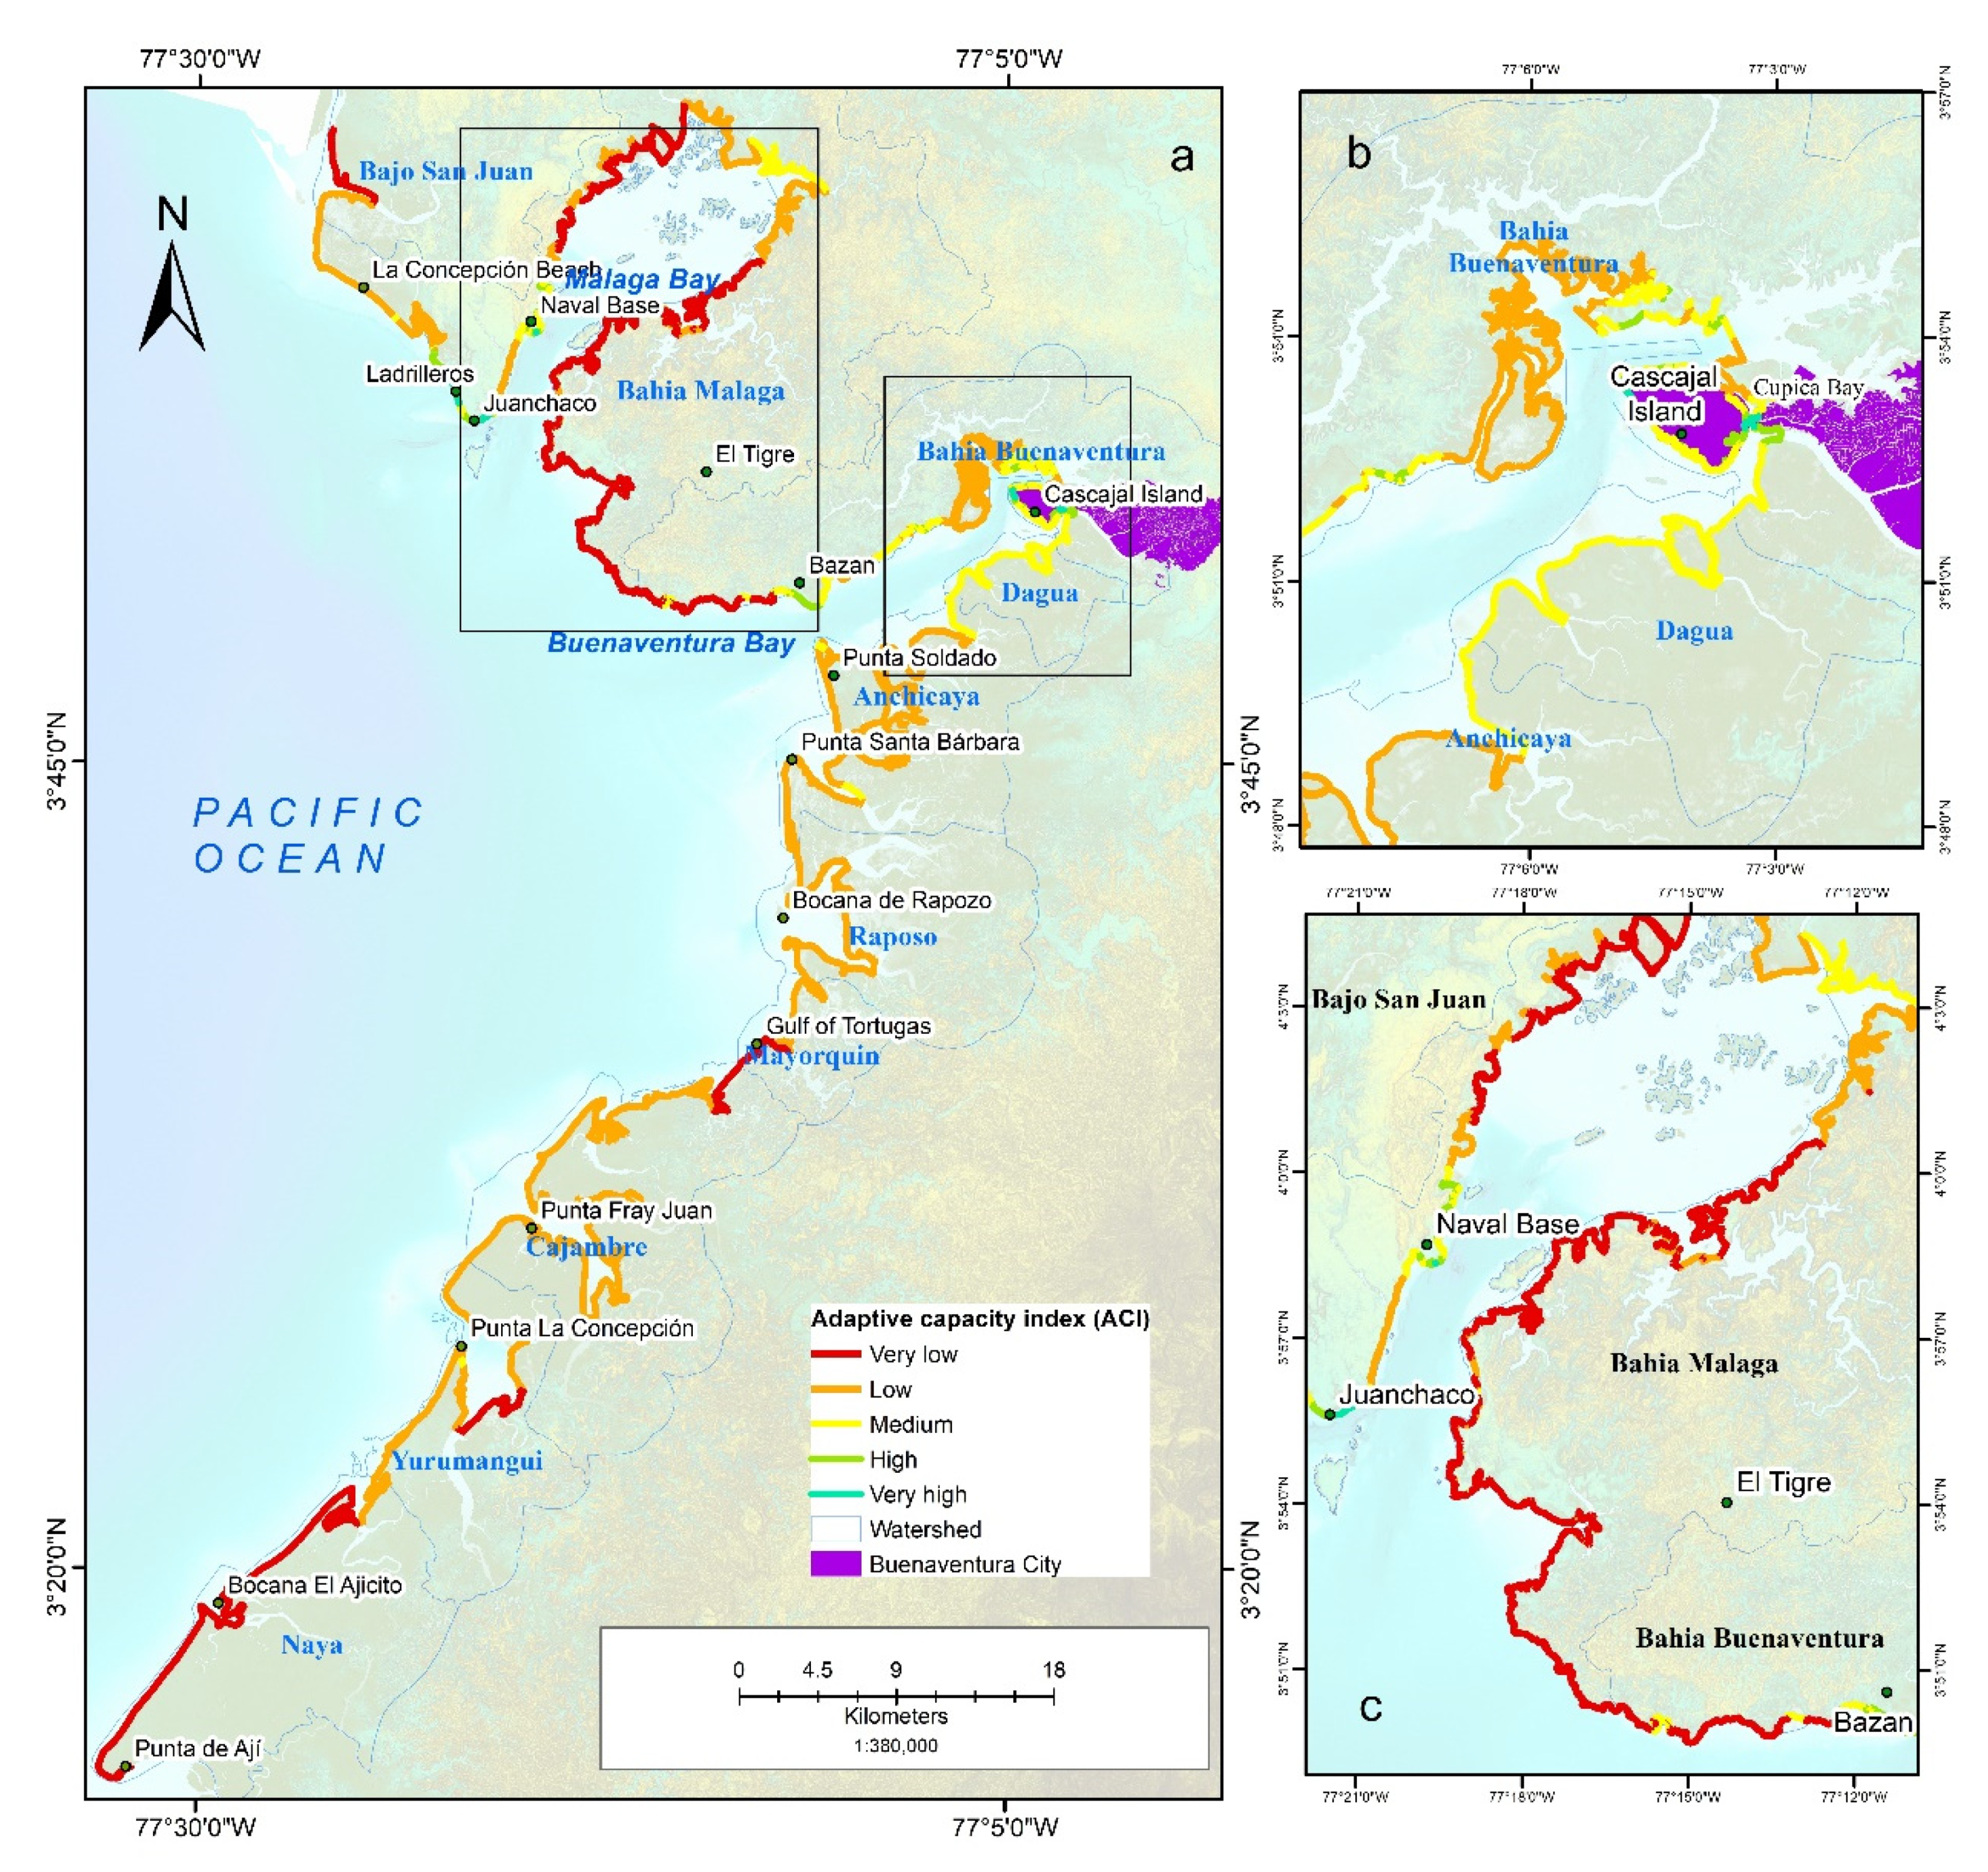
3.4. Adaptive Capacity to Coastal Erosion

The adaptive capacity of the Buenaventura watersheds was low since more than 85% of the total areas were characterized by low to very low resilience; places that generally have little or no infrastructure development have no connection to land by roads, and these areas depend on coastal resources and connections through maritime routes. The remaining watersheds had medium adaptive capacity scores of 11.2% and high to very high adaptive capacity scores of 3.1%. The ACI values showed great spatial heterogeneity between the coastal watersheds (Figure 6a), with the highest value occurring in Buenaventura Bay (Figure 6b) and the lowest value occurring in Málaga Bay (Figure 6c). The factor that most contributed to the high adaptation capacity of the Bay of Buenaventura was the existence of better facilities and greater access to public services, transportation routes, trade and tourism services, education, and medical services, while Málaga Bay’s adaptive capacity was reduced mainly by its relatively lower scores for these factors; in addition, its low literacy rate resulted in this area having little or no adaptive capacity.

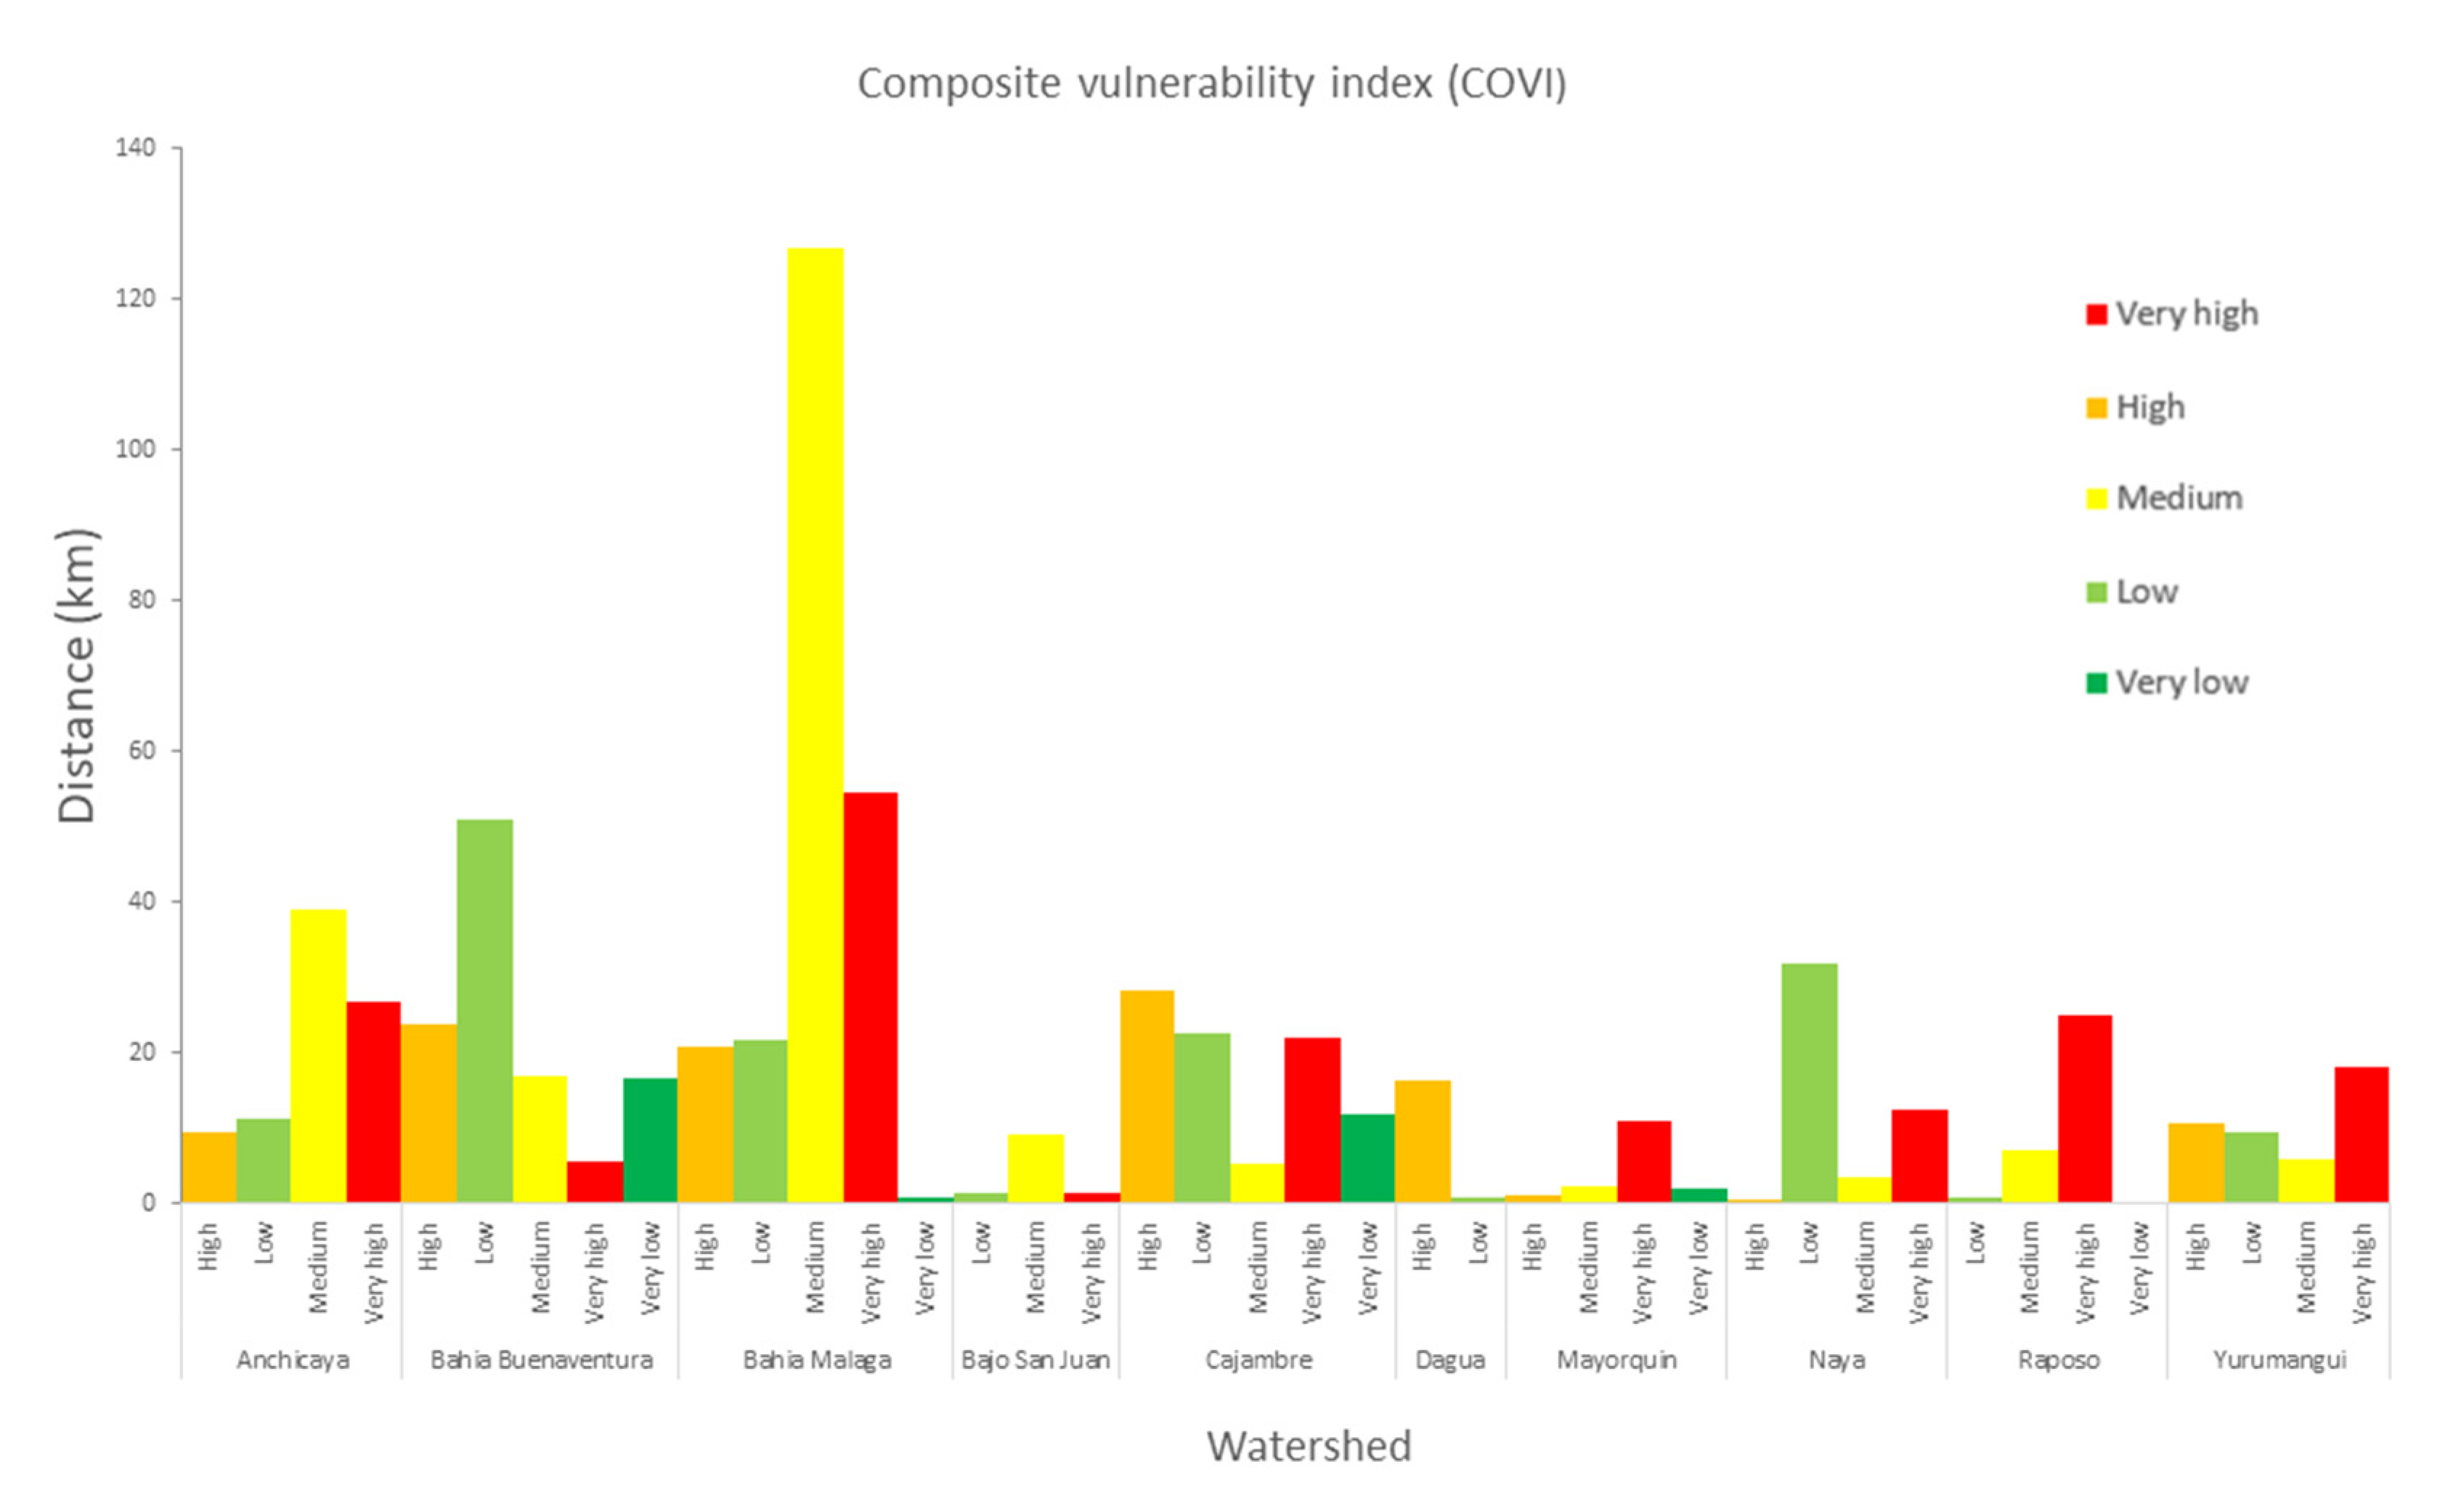
3.5. Results of the Composite Vulnerability Index

The COVI analysis revealed that the coastal watersheds showed great spatial heterogeneity in their vulnerability levels (Figure 7). In the coastal zone of Buenaventura, 31.4% of the area had moderate vulnerability values, 22% had low vulnerability values, and 4.5% had very low vulnerability values. In contrast, 16.18% of the area had high vulnerability values, followed by a 25.8% with very high vulnerability values, indicating that 41.9% of the study area had the highest combined vulnerability values. The marine areas exposed to the ocean in the Málaga Bay watershed (Figure 8a,b), such as the Anchicayá, Raposo, and Cajambre watersheds (Figure 8a,c), are very vulnerable to coastal erosion as they are located in the southern–central zone, where hydrodynamic forcing increases due to coastal relief change.
The causes of the high vulnerability levels of these watersheds were their lack of economic development and resilience, with greater rates of multidimensional poverty, illiteracy rates, coastal erosion, higher average wave height, and risk of flooding over the area of the basin directly exposed to the sea. Within these watersheds, there are places with high vulnerability levels, such as La Boca de La Barra, Ladrilleros, Juanchaco, La Base Naval, and the sectors between Punta Domingo and Punta Culo de Barco (Figure 8b). In the Málaga Bay watershed, the interior of the bay had moderate vulnerability levels. This watershed, although located in a remote, difficult-to-access area, has a high capacity for recovery of its biophysical environment since a national protected area (Parque Nacional Natural Uramba Málaga Bay) and a regional protected area (Parque Natural Regional La Sierpe) have been developed for environmental tourism development and ecosystem protection. This area also has a low population density and minimal effects from coastal erosion, but it is highly vulnerable in terms of its ability to adapt due to the low literacy rate of the population, its lack of public services, and minimal access to medical services. Watersheds with low to very low vulnerability levels occur in the central (Buenaventura) and southern (Naya) parts of the coastal zone.
Buenaventura has a network of urban roads and the most important port in Colombia, where most of the commercial activity is generated, whereas, around the port, infrastructure and services have been developed. In addition, this area has greater access to services, transportation, education, and medical services. This is associated with its relatively higher adaptive capacity and its lower biophysical exposure, which was mainly attributed to the lower vulnerability scores for flooding, coastal erosion, and average wave height. On the other hand, the community in this area had a very high sensitivity level due to its high multidimensional poverty level and highest population density of the entire coastal area. The Naya watershed has a low vulnerability level mainly due to minimal coastal erosion, whereas it has the highest accretion rate, low population density, and low multidimensional poverty. The COVI helped to estimate the most vulnerable coastal population as a function of coastal erosion. Currently, 82,008 people, representing 26.2% of the total coastal population of Buenaventura, live in the Málaga Bay watershed (Figure 8b) and the Anchicayá and Raposo basins, which are the most prone to erosion and have a greater number of people in areas with very high vulnerability levels compared to those in the other watersheds (Figure 8c). With the 2100 sea level rise, it is estimated that the number of highly threatened people will increase with respect to the current scenario.

4. Discussion

A coastal vulnerability assessment is important for spatial planning and disaster risk reduction [7,59]. In this study, remote sensing technology and GIS were integrated to study the change in the coastline in the long-term using active and passive sensors with reasonable precision. In the analysis with the DSAS tool from 1989 to 2020, the coastline was shown to experience the greatest change in erosion according to the EPRs, which were recorded as −96.2 m/year and 95.8 m/year per erosion and accretion event, respectively. There was a general trend in coastline accretion according to the average EPR of 2.8 m/year, with a total accretion of 48%. However, the Cifuentes [31] study from 1986 to 2015 showed that, on average, a change rate of −0.2 m/year occurred, reflecting an erosion trend with maximum EPR values of 26.9 m/year of accretion and −21 m/year of coastal erosion. The marked differences in the values of the previous study with those of this study may be explained from the higher temporal coverage used in this work, mainly in the La Concepción beach area. This scenario also explains why the study of Cifuentes [31] used data with a low spatial resolution (30 m). This study used the mean tidal range parameter from the work of Gallego and Selvaraj 2019 [22]; the data were taken from this study and integrated as a layer of analysis. We emphasize that, in our work, a higher spatial and temporal resolution was used in all physical and socioeconomic variables. Regarding the limitations of the study, oceanographic information was requested from the Colombian Center for Oceanographic Data, from which it was not possible to obtain a dataset that covered the entire period of analysis, so the global scale data from ERA5 were used.
This study used the COVI to estimate spatial vulnerability to coastal erosion through an analysis of coastal watersheds. The vulnerability in the Buenaventura area has been characterized by previous studies [13,20,21,22,31,32]. However, an evaluation of its vulnerability to multiple risks and physical, environmental, and socioeconomic parameters, such as the COVI, has received minimal attention in studies on the coastal zone of Buenaventura. The delineation of the COVI as a function of three indices (EI, SI, and ACI) indicates comprehensively the critical aspects of coastal vulnerability.
The general analysis of the indices showed that the Málaga Bay basin is highly exposed according to the EI of the oceanic portion of the coastal zone, mainly due to the weight of physical factors (slope, average wave height, coastal erosion, and risk of flooding). Consistent with the results of Uribe et al. [32], the most frequent natural and anthropogenic hazards occur in the external region of Málaga Bay, and hazards are mainly caused by water-related erosion, bioerosion, and landslides. Uribe et al. [32] stated that the beaches of Juanchaco and Ladrilleros in the Málaga Bay area are permanently exposed to strong waves and high-energy processes. By contrast, in the internal part of the same watershed, the lowest biophysical exposure occurs because it is protected by the bay, and this internal area has the lowest SI. Ricaurte et al. [13] stated that the factor determining the erosion threat in the Pacific region is vulnerability, mainly social, economic, and institutional vulnerability, and we agree with this conclusion. In this study, the influence that socioeconomic factors (lack of medical services, low literacy rates, and minimal economic activity) have on vulnerability scores was verified, and this impact results in a low ACI, hindering the ability to face coastal hazards. The watershed with the greatest sensitivity to erosion according to the SI is Buenaventura, mainly due to the high score for the multidimensional poverty factor and its highest population density. However, this watershed also shows the highest value of adaptive capacity (ACI) because it has the best facilities and greater access to all types of services as it is the most urbanized area. The EI showed low biophysical exposure within the area of the bay because its exposure to biophysical factors is reduced, a concept consistent with that in Gallego and Selvaraj [22], who affirmed that the biophysical system of Buenaventura Bay, due to its geomorphological characteristics, steep slopes, and high vegetation cover, provides it a lower degree of relative vulnerability.
The results of the study revealed that the high exposure (EI) and especially the lack of adaptive capacity (ACI) directly affected the high vulnerability of the study area, as shown by the COVI. Coastal watersheds, such as Málaga Bay and Anchicayá, Cajambre, and Raposo basins, are the most vulnerable to coastal hazards physically and socioeconomically. Socioeconomic factors are the main internal element that increases vulnerability. Further, 85% of the watersheds have low adaptive capacity, and households do not have access to drinking water and medical resources. Most households in the coastal area of Buenaventura live below the poverty level and have very limited access to economic resources, so they cannot cope with any type of extreme event. This work analyzed the socioeconomic, biophysical, and ecological aspects together to provide valuable information on the factors that are critical to vulnerability at the spatial level. Those responsible for decision-making will likely be able to act in the most vulnerable areas, using the results as an analytical basis to develop adaptation strategies in the face of vulnerability and climate change.

5. Conclusions

The use of the COVI provided a broad view of the coastal area of Buenaventura at a detailed scale; 41.9% of the coastal area has a high level of vulnerability to erosion, with approximately 82,000 people at risk. This analysis revealed that the watersheds located in the northern (Málaga Bay) and central (Anchicayá, Cajambre, and Raposo) parts of the coastal zone were more vulnerable. If this situation continues, then, clearly, the population will be extremely affected by the increase in potentially disastrous events, such as the rise in sea level and ENSO events.
Therefore, the vulnerability of the region to coastal erosion will increase in the near future, further affecting socioeconomic and ecological systems and making it necessary to plan disaster management actions. Structural and nonstructural measures are needed to improve the adaptive capacity of the inhabitants, improve the physical resilience of the environment, and improve the socioeconomic activities of the community. The results of this type of study can assist decision-makers in highlighting actions to prioritize coastal areas in the development of management plans and land use planning to improve the adaptability of coasts to climate change.
This vulnerability assessment can be refined by incorporating other factors into the indices, such as a three-dimensional hydraulic flood model, a valuation of ecosystem services, and broader sociodemographic aspects, for which more in situ data and complementary physical monitoring data are needed. This work used data available from optical sensors and radar; however, in the future, data from high-resolution active sensors, such as light detection and ranging (LIDAR), could be used as they can generate more accurate results in terms of modeling the terrain and coastline, providing a more accurate measurement of spatial vulnerability.

Author Contributions

Conceptualization, Jose Eduardo Fuentes and Cesar Edwin Garcia; methodology, Jose Eduardo Fuentes; software, Jose Eduardo Fuentes; validation, Jose Eduardo Fuentes and Cesar Edwin Garcia; formal analysis, Jose Eduardo Fuentes and Cesar Edwin Garcia; investigation, Jose Eduardo Fuentes and Robin Alexis Olaya; resources, Jose Eduardo Fuentes and Robin Alexis Olaya; data curation, Robin Alexis Olaya; writing—original draft preparation, Jose Eduardo Fuentes and Robin Alexis Olaya; writing—review and editing, Jose Eduardo Fuentes and Robin Alexis Olaya; visualization, Jose Eduardo Fuentes; supervision, Jose Eduardo Fuentes and Cesar Edwin Garcia; project administration, Jose Eduardo Fuentes; and funding acquisition, Jose Eduardo Fuentes and Robin Alexis Olaya. All authors have read and agreed to the published version of the manuscript.

Funding

This work was supported in part by the Vice-Rectory of Research of the Universidad del Valle under grant CI 4406—“Internal Call 124-2020” associated with the project “Multitemporal analysis of vulnerability by coastal erosion in the Coastal Environmental Unit Malaga Buenaventura”.

Institutional Review Board Statement

Not applicable.

Informed Consent Statement

Not applicable.

Data Availability Statement

Not applicable.

Conflicts of Interest

The authors declare no conflict of interest.

References

  1. INVEMAR. Informe del Estado de los Ambientes y Recursos Marinos y Costeros en Colombia, 2019; Invemar: Santa Marta, Colombia, 2020; p. 183. [Google Scholar]
  2. Ricaurte Villota, C.; Gonzélez Arteaga, M.E.; Coca Dominguez, O.; Bejarano Espinosa, H.M.; Morales Giraldo, D.F.; Correa Rojas, C.X.; Briceño Zuluaga, F.; Legarda, G.; Arteaga, M. Amenaza y Vulnerabilidad por Erosión Costera en Colombia: Enfoque Regional para la Gestión del Riesgo; INVEMAR, Ed.; Instituto de Investigaciones Marinas y Costeras “José Benito Vives De Andréis”: Santa Marta, Colombia, 2018; Volume 33, p. 268. [Google Scholar]
  3. Gabler, C.A.; Osland, M.J.; Grace, J.B.; Stagg, C.L.; Day, R.H.; Hartley, S.B.; Enwright, N.M.; From, A.S.; McCoy, M.L.; McLeod, J.L. Macroclimatic change expected to transform coastal wetland ecosystems this century. Nat. Clim. Change 2017, 7, 142–147. [Google Scholar] [CrossRef]
  4. Richard, J.T.K.; Nicholls, R.J.; Sachooda, R.; Michele, C.; James, A.; Buckley, E.N. Technological Options for Adaptation to Climate Change in Coastal Zones. J. Coast. Res. 2001, 17, 531–543. [Google Scholar]
  5. Hermelin, M. Geomorphological Landscapes and Landforms of Colombia. In Landscapes and Landforms of Colombia; Hermelin, M., Ed.; Springer International Publishing: Cham, Switzerland, 2016; pp. 1–21. [Google Scholar] [CrossRef]
  6. Lichter, M.; Zviely, D.; Klein, M.; Sivan, D. Sea-Level Changes in the Mediterranean: Past, Present, and Future—A Review. In Seaweeds and their Role in Globally Changing Environments; Seckbach, J., Einav, R., Israel, A., Eds.; Springer: Dordrecht, The Netherlands, 2010; pp. 3–17. [Google Scholar] [CrossRef]
  7. Adger, W.N. Vulnerability. Glob. Environ. Change 2006, 16, 268–281. [Google Scholar] [CrossRef]
  8. Church, J.A.; Clark, P.U.; Cazenave, A.; Gregory, J.M.; Jevrejeva, S.; Levermann, A.; Merrifield, M.A.; Milne, G.A.; Nerem, R.S.; Nunn, P.D. Sea Level Change; PM Cambridge University Press: Cambridge, UK, 2013. [Google Scholar]
  9. Nicholls, R.J. Analysis of global impacts of sea-level rise: A case study of flooding. Phys. Chem. Earth Parts A/B/C 2002, 27, 1455–1466. [Google Scholar] [CrossRef]
  10. Pandey, B.W. Geoenvironmental Hazards in Himalaya: Assessment and Mapping (the Upper Beas Basin); Mittal Publications: New Delhi, India, 2002. [Google Scholar]
  11. Vogel, C.; O’Brien, K.J. Vulnerability and global environmental change: Rhetoric and reality. Aviso Inf. Bull. Glob. Environ. Change Hum. Secur. 2004, 13, 1–8. [Google Scholar]
  12. McCarthy, J.J.; Canziani, O.F.; Leary, N.A.; Dokken, D.J.; White, K.S. Climate Change 2001: Impacts, Adaptation, and Vulnerability: Contribution of Working Group II to the Third Assessment Report of the Intergovernmental Panel on Climate Change; Cambridge University Press: Cambridge, UK, 2001; Volume 2. [Google Scholar]
  13. Ricaurte-Villota, C.; Santamaría-del-Ángel, E.; Coca-Domínguez, O.; Morales Giraldo, D.; González-Arteaga, M. Determining factors of the hazard and vulnerability by coastal erosion in Colombia. Rev. Geográfica Chile Terra Aust. 2021, 1, 129–139. [Google Scholar] [CrossRef]
  14. Rozemeijer, M.J.C. Marine and Coastal Ecological Potential for the Economic Development of Colombia; IMARES: Yerseke, The Netherlands, 2013. [Google Scholar]
  15. Gornitz, V. Vulnerability of the East Coast, U.S.A. to Future Sea Level Rise. J. Coast. Res. 1990, 9, 201–237. [Google Scholar]
  16. Gornitz, V.; White, T.W.; Cushman, R.M. Vulnerability of the US to Future Sea Level Rise; Oak Ridge National Lab.: Oak Ridge, TN, USA, 1991. [Google Scholar]
  17. Gornitz, V.M.; Daniels, R.C.; White, T.W.; Birdwell, K.R. The Development of a Coastal Risk Assessment Database: Vulnerability to Sea-Level Rise in the U.S. Southeast. J. Coast. Res. 1994, 12, 327–338. [Google Scholar]
  18. Thieler, E.R.; Hammar-Klose, E.S. National Assessment of Coastal Vulnerability to Sea-Level Rise: Preliminary Results for the US Atlantic Coast; US Geological Survey: Reston, VA, USA, 1999. [Google Scholar]
  19. Bera, R.; Maiti, R. An assessment of coastal vulnerability using geospatial techniques. Environ. Earth Sci. 2021, 80, 306. [Google Scholar] [CrossRef]
  20. Coca-Domínguez, O.; Ricaurte-Villota, C. Validation of the Hazard and Vulnerability Analysis of Coastal Erosion in the Caribbean and Pacific Coast of Colombia. J. Mar. Sci. Eng. 2019, 7, 260. [Google Scholar] [CrossRef] [Green Version]
  21. Coca-Domínguez, O.; Ricaurte-Villota, C. Análisis de la evolución litoral y respuesta de las comunidades afro-descendientes asentadas en la zona costera: Caso de estudio La Barra, Buenaventura, Pacífico Colombiano. Entorno Geográfico 2019, 17, 7–26. [Google Scholar] [CrossRef]
  22. Gallego Perez, B.E.; Selvaraj, J.J. Evaluation of coastal vulnerability for the District of Buenaventura, Colombia: A geospatial approach. Remote Sens. Appl. Soc. Environ. 2019, 16, 100263. [Google Scholar] [CrossRef]
  23. Pramanik, M.K.; Dash, P.; Behal, D. Improving outcomes for socioeconomic variables with coastal vulnerability index under significant sea-level rise: An approach from Mumbai coasts. Environ. Dev. Sustain. 2021, 23, 13819–13853. [Google Scholar] [CrossRef]
  24. Serafim, M.B.; Siegle, E.; Corsi, A.C.; Bonetti, J. Coastal vulnerability to wave impacts using a multi-criteria index: Santa Catarina (Brazil). J. Environ. Manag. 2019, 230, 21–32. [Google Scholar] [CrossRef]
  25. Arkema, K.K.; Guannel, G.; Verutes, G.; Wood, S.A.; Guerry, A.; Ruckelshaus, M.; Kareiva, P.; Lacayo, M.; Silver, J.M. Coastal habitats shield people and property from sea-level rise and storms. Nat. Clim. Change 2013, 3, 913–918. [Google Scholar] [CrossRef]
  26. Klein, R.J.; Midglev, G.; Preston, B.; Alam, M.; Berkhout, F.; Dow, K.; Shaw, M. Climate Change 2014: Impacts, Adaptation, and Vulnerability; IPCC Fifth Assessment Report; IPCC: Stockholm, Sweden, 2014. [Google Scholar]
  27. Zhang, Y.; Wu, T.; Arkema, K.K.; Han, B.; Lu, F.; Ruckelshaus, M.; Ouyang, Z. Coastal vulnerability to climate change in China’s Bohai Economic Rim. Environ. Int. 2021, 147, 106359. [Google Scholar] [CrossRef]
  28. Ghosh, S.; Mistri, B. Assessing coastal vulnerability to environmental hazards of Indian Sundarban delta using multi-criteria decision-making approaches. Ocean Coast. Manag. 2021, 209, 105641. [Google Scholar] [CrossRef]
  29. Sahana, M.; Sajjad, H. Vulnerability to storm surge flood using remote sensing and GIS techniques: A study on Sundarban Biosphere Reserve, India. Remote Sens. Appl. Soc. Environ. 2019, 13, 106–120. [Google Scholar] [CrossRef]
  30. Furlan, E.; Pozza, P.D.; Michetti, M.; Torresan, S.; Critto, A.; Marcomini, A. Development of a Multi-Dimensional Coastal Vulnerability Index: Assessing vulnerability to inundation scenarios in the Italian coast. Sci. Total Environ. 2021, 772, 144650. [Google Scholar] [CrossRef]
  31. Cifuentes-Ossa, M.A.; Rosero-Henao, L.V.; Josephraj-Selvaraj, J. Detección de cambios de la línea costera al norte del distrito de Buenaventura mediante el uso de sensores remotos. Boletín Investig. Mar. Costeras—INVEMAR 2017, 46, 137–152. [Google Scholar] [CrossRef]
  32. Uribe-Castañeda, N.; Satizabal, C.A.; Herrera-Orozco, L.; Cantera Kintz, J.R. Vulnerabilidad de los servicios ecosistémicos del área marina protegida Uramba. Boletín Investig. Mar. Costeras 2020, 49, 95–118. [Google Scholar] [CrossRef]
  33. Abdelaty, E.F. Coastal Erosion Assessment of the Nile Delta Coast using Remote Sensing, GIS, and Modified Coastal Vulnerability Index. Alex. Sci. Exch. J. 2021, 42, 645–655. [Google Scholar] [CrossRef]
  34. Boumboulis, V.; Apostolopoulos, D.; Depountis, N.; Nikolakopoulos, K. The Importance of Geotechnical Evaluation and Shoreline Evolution in Coastal Vulnerability Index Calculations. J. Mar. Sci. Eng. 2021, 9, 0423. [Google Scholar] [CrossRef]
  35. Sekovski, I.; Del Río, L.; Armaroli, C. Development of a coastal vulnerability index using analytical hierarchy process and application to Ravenna province (Italy). Ocean Coast. Manag. 2020, 183, 104982. [Google Scholar] [CrossRef]
  36. Koroglu, A.; Ranasinghe, R.; Jiménez, J.A.; Dastgheib, A. Comparison of Coastal Vulnerability Index applications for Barcelona Province. Ocean Coast. Manag. 2019, 178, 104799. [Google Scholar] [CrossRef]
  37. Mohd, F.A.; Abdul Maulud, K.N.; Karim, O.A.; Begum, R.A.; Awang, N.A.; Ahmad, A.; Wan Mohamed Azhary, W.A.H.; Kamarudin, M.K.A.; Jaafar, M.; Wan Mohtar, W.H.M. Comprehensive coastal vulnerability assessment and adaptation for Cherating-Pekan coast, Pahang, Malaysia. Ocean Coast. Manag. 2019, 182, 104948. [Google Scholar] [CrossRef]
  38. Hoque, M.A.-A.; Ahmed, N.; Pradhan, B.; Roy, S. Assessment of coastal vulnerability to multi-hazardous events using geospatial techniques along the eastern coast of Bangladesh. Ocean Coast. Manag. 2019, 181, 104898. [Google Scholar] [CrossRef]
  39. Hzami, A.; Heggy, E.; Amrouni, O.; Mahé, G.; Maanan, M.; Abdeljaouad, S. Alarming coastal vulnerability of the deltaic and sandy beaches of North Africa. Sci. Rep. 2021, 11, 2320. [Google Scholar] [CrossRef]
  40. Rehman, S.; Sahana, M.; Kumar, P.; Ahmed, R.; Sajjad, H. Assessing hazards induced vulnerability in coastal districts of India using site-specific indicators: An integrated approach. GeoJournal 2021, 86, 2245–2266. [Google Scholar] [CrossRef]
  41. Mullick, M.R.A.; Tanim, A.H.; Islam, S.M.S. Coastal vulnerability analysis of Bangladesh coast using fuzzy logic based geospatial techniques. Ocean Coast. Manag. 2019, 174, 154–169. [Google Scholar] [CrossRef]
  42. Casanova Rosero, R.F.; Zambrano Ortiz, M.M.; Velasco Vinasco, E.; Rodríguez Cuitiva, D.E.; Escobar Olaya, G.A.; Narváez Flórez, S.; Bautista Duarte, P.; Betancourt Portela, J.M.; Parra, J.P. Panorama de la Contaminación del Marina del Pacífico Colombiano, 2005–2010; Dirección General Marítima: Bogota, Colombia, 2012. [Google Scholar]
  43. Castellanos-Galindo, G.A.; Krumme, U.; Rubio, E.A.; Saint-Paul, U. Spatial variability of mangrove fish assemblage composition in the tropical eastern Pacific Ocean. Rev. Fish Biol. Fish. 2013, 23, 69–86. [Google Scholar] [CrossRef]
  44. INVEMAR. Informe del Estado de los Ambientes y Recursos Marinos y Costeros en Colombia, 2011; Invemar: Santa Marta, Colombia, 2012; Volume 8, p. 203. [Google Scholar]
  45. Posada Posada, B.O.; Henao Pineda, W.; Guzmán Ospitia, G. Diagnóstico de la Erosión y Sedimentación en la Zona Costera del Pacífico Colombiano; Instituto de Investigaciones Marinas y Costeras—INVEMAR: Santa Marta, Colombia, 2009. [Google Scholar]
  46. Vega, L.; Cantillo, V.; Arellana, J. Assessing the impact of major infrastructure projects on port choice decision: The Colombian case. Transp. Res. Part A Policy Pract. 2019, 120, 132–148. [Google Scholar] [CrossRef]
  47. Comovamos, B. Informe de Calidad de Vida de Buenaventura 2019–2020; Buenaventura Comovamos: Buenaventura, Colombia, 2021; p. 84. [Google Scholar]
  48. DANE. Censo Nacional de Población y Vivienda (CNPV). 2018. Available online: https://www.dane.gov.co/index.php/estadisticas-por-tema/demografia-y-poblacion/censo-nacional-de-poblacion-y-vivenda-2018 (accessed on 24 January 2021).
  49. Fletcher, C.; Rooney, J.; Barbee, M.; Lim, S.-C.; Richmond, B. Mapping Shoreline Change Using Digital Orthophotogrammetry on Maui, Hawaii. J. Coast. Res. 2003, 38, 106–124. [Google Scholar]
  50. Rangel-Buitrago, N.; Neal, W.J.; de Jonge, V.N. Risk assessment as tool for coastal erosion management. Ocean Coast. Manag. 2020, 186, 105099. [Google Scholar] [CrossRef]
  51. Inc, P.L. Specification, Planet Imagery Product; Planet Labs Inc.: San Francisco, CA, USA, 2020; p. 97. [Google Scholar]
  52. White, K.; El Asmar, H.M. Monitoring changing position of coastlines using Thematic Mapper imagery, an example from the Nile Delta. Geomorphology 1999, 29, 93–105. [Google Scholar] [CrossRef]
  53. Mareas, T.d. Tabla de Mareas, Valle del Cauca—Buenaventura. Available online: https://tablademareas.com/co/valle-del-cauca/buenaventura (accessed on 10 July 2021).
  54. Oyedotun, T.D. Shoreline geometry: DSAS as a tool for historical trend analysis. Geomorphol. Tech. 2014, 3, 1–12. [Google Scholar]
  55. Hahn, M.B.; Riederer, A.M.; Foster, S.O. The Livelihood Vulnerability Index: A pragmatic approach to assessing risks from climate variability and change—A case study in Mozambique. Glob. Environ. Change 2009, 19, 74–88. [Google Scholar] [CrossRef]
  56. López Royo, M.; Ranasinghe, R.; Jiménez, J.A. A Rapid, Low-Cost Approach to Coastal Vulnerability Assessment at a National Level. J. Coast. Res. 2016, 32, 932–945. [Google Scholar] [CrossRef]
  57. Álvarez, M.C.; Bermúdez-Rivas, C.; Niño, D.C. Caracterización de la geomorfología costera y sus coberturas vegetales asociadas, a través de sensores remotos en la Bahía de Buenaventura, Valle del Cauca. Boletín Científico CIOH 2016, 34, 49–63. [Google Scholar] [CrossRef]
  58. Reuter, H.I.; Hengl, T.; Gessler, P.; Soille, P. Chapter 4 Preparation of DEMs for Geomorphometric Analysis. In Developments in Soil Science; Hengl, T., Reuter, H.I., Eds.; Elsevier: Amsterdam, The Netherlands, 2009; Volume 33, pp. 87–120. [Google Scholar]
  59. Ashraful Islam, M.; Mitra, D.; Dewan, A.; Akhter, S.H. Coastal multi-hazard vulnerability assessment along the Ganges deltaic coast of Bangladesh—A geospatial approach. Ocean Coast. Manag. 2016, 127, 1–15. [Google Scholar] [CrossRef]
  60. CMEMS. Sea Level Daily Gridded Data from Satellite Observations for the Global Ocean from 1993 to Present. Available online: https://cds.climate.copernicus.eu/cdsapp#!/dataset/satellite-sea-level-global?tab=overview (accessed on 5 May 2021).
  61. ECMWF. ERA5 Monthly Averaged Data on Single Levels from 1959 to Present. Available online: https://cds.climate.copernicus.eu/cdsapp#!/dataset/reanalysis-era5-single-levels-monthly-means?tab=overview (accessed on 5 May 2021).
  62. Gisbert, F.J.G.; Martí, I.C. Rugosidad del terreno: Una característica del paisaje poco estudiada. Doc. Trab. 2010, 10, 1. [Google Scholar]
  63. Saaty, T.L. The Analytic Hierarchy and Analytic Network Processes for the Measurement of Intangible Criteria and for Decision-Making. In Multiple Criteria Decision Analysis: State of the Art Surveys; Greco, S., Ehrgott, M., Figueira, J.R., Eds.; Springer: New York, NY, USA, 2016; pp. 363–419. [Google Scholar] [CrossRef]
  64. Alkire, S.; Foster, J. Counting and multidimensional poverty measurement. J. Public Econ. 2011, 95, 476–487. [Google Scholar] [CrossRef]
  65. Angulo Salazar, R.C.; Díaz Cuervo, Y.; Pardo Pinzón, R. Índice de pobreza multidimensional para Colombia (IPM-Colombia). Arch. Econ. 2011, 382, 1997–2010. [Google Scholar]
  66. IDEAM. Leyenda Nacional de Coberturas de la Tierra: Metodología CORINE Land Cover Adaptada para Colombia: Escala 1:100.000; Ideam: Bogota, Colombia, 2010. [Google Scholar]
Figure 1. Map of the municipality of Buenaventura and its coastal watersheds.
Ijgi 11 00568 g001
Figure 2. Example of digitization of the coastline in Buenaventura Bay in different years: (a) aerial photography mosaic from 1986, (b) airborne radar image from 2009, (c) airborne radar image from 2015, (d) PlanetScope 2020 satellite image.
Ijgi 11 00568 g002
Figure 3. Results of the EPR parameter analysis showing the zones of erosion and coastal accretion. Locations b and c show places with areas of great change.
Ijgi 11 00568 g003
Figure 4. Exposure to coastal erosion in the study area.
Ijgi 11 00568 g004
Figure 5. Sensitivity to coastal erosion in the study area.
Ijgi 11 00568 g005
Figure 6. Adaptive capacity in the study area.
Ijgi 11 00568 g006
Figure 7. Distribution of vulnerability by watershed in the study area.
Ijgi 11 00568 g007
Figure 8. Composite vulnerability index in the study area.
Ijgi 11 00568 g008
Table 1. Studies conducted worldwide with a geospatial approach that uses coastal vulnerability indices.
IndexTools *YearCountryAuthor
Coastal Vulnerability
Index (CVI)
GIS, RS, DSAS2021IndiaBera and Maiti, 2021 [19]
GIS, RS, DSAS2021IndiaPramanik et al., 2021 [23]
GIS, RS, DSAS2021EgyptAbdelaty, 2021 [33]
GIS, RS, DSAS2021GreeceBoumboulis et al., 2021 [34]
GIS, RS, DSAS2020ItalySekovskia et al., 2020 [35]
GIS2019BrazilSerafim et al., 2019 [24]
GIS2019SpainKoroglua et al.,2019 [36]
GIS2019MalaysiaMohda et al.,2019 [37]
GIS, RS, DSAS2019BangladeshHoquea et al., 2019 [38]
GIS2019ColombiaCoca and Ricaute, 2019 [21]
GIS, RS, DSAS2019ColombiaGallego and Selvaraj, 2019 [22]
Composite Vulnerability
Index (COVI)
GIS, RS, DSAS2021TunisiaHzami et al., 2021 [39]
GIS2021ChinaZhang et al., 2021 [27]
GIS2021IndiaGhosh and Mistri 2021 [28]
GIS2021ItalyFurlan et al., 2021 [30]
GIS2020IndiaRehman et al., 2020 [40]
GIS2020IndiaSahana and Sajjad,2019 [29]
GIS, RS, DSAS2019BangladeshMullick et al., 2019 [41]
* Geographic information system (GIS), remote sensing (RS), and Digital Shoreline Analysis System (DSAS).
Table 2. Images and products of the remote sensors used for coastline data extraction.
YearSensorProduct *Spatial ResolutionSource
1986Aerial photographyOrthomosaic3 mGeographic Institute of Colombia (IGAC)
2009Synthetic-Aperture Radar Image—AirborneOrthomosaic, DSM, DTM3 mGeographic Institute of Colombia (IGAC)
2015Synthetic-Aperture Radar Image—AirborneOrthomosaic, DSM, DTM3 mRegional Autonomous Corporation of Valle del Cauca (CVC)
2020Satellite PlanetScopeOrthomosaic3 mThis project
* Digital surface model (DSM) and digital terrain model (DTM).
Table 3. Selected indicators to construct the composite vulnerability index.
ComponentsIndicatorsClassRange
ExposureGeomorphologyBarrier island, Flood plain, Intertidal flat without vegetation, Beach5—Very High
vegetated intertidal flat4—High
Alluvial valley3—Moderate
Island2—Low
Water body, Coastal lagoon, Hillocks and hills, Continental shelf, Marine terrace1—Very Low
Slope 0–18° 5—Very High
(degrees)18–25° 4—High
25–75°3—Moderate
75–80°2—Low
80–88°1—Very Low
Shoreline change rate−96.30 to −3.05—Very High
(m/year)−2.99 to 0.54—High
−0.49 to 0.53—Moderate
0.51 to 3.02—Low
3.1 to 95.91—Very Low
Sea level rise rate >95—Very High
(mm/year)6 to 94—High
3.9 to 63—Moderate
0 to 3.92—Low
<01—Very Low
Mean tidal range3.0 to 3.745—Very High
(m)2.25 to 2.994—High
1.26 to 2.243—Moderate
0.38 to 0.752—Low
0.26 to 0.381—Very Low
Significant wave height>65—Very High
(m)4 to 64—High
2 to 43—Moderate
1 to 22—Low
<1.01—Very Low
Flood inundation riskENSO floods5—Very High
Hydrometeorological flooding4—High
Roughness of terrain0.131 (Very rough)5—Very High
0.128 (Rough)4—High
0.047 (Roughly open)3—Moderate
0.020 (Open)2—Low
0.001 (Smooth)1—Very Low
SensitivityMultidimensional poverty70.1% to 98.5%5—Very High
50.1% to 70%4—High
40.1% to 50%3—Moderate
30.1% to 40%2—Low
4.15% to 30%1—Very Low
SettlementsUrbanized area5—Very high
Villages4—High
Rural3—Medium
No settlement2—Low
Land Use and Land CoverUrban zones, Artificial surfaces5—Very High
Cultivation areas, Banana, Coconut palm, Miscellaneous4—High
Shrubland, Guandal forest, Mangrove Forest, Mixed Forest, Natural grassland, Island, Cultivated grassland, Secondary vegetation3—Moderate
Temporary flooded areas, Natural areas, Other marshy areas2—Low
Shallows and intertidal flats, Littoral barriers, Artificial ponds, Ocean, Beaches, Rivers1—Very Low
Population (inhabitant/km2)80 to 20,6565—Very High
50 to 804—High
15 to 503—Moderate
5 to152—Low
1 to 51—Very Low
Adaptive capacityEconomic activitiesIndustrial fishing5—Very High
Artisanal fishing4—High
Ecotourism3—Moderate
Landscape2—Low
Recreation—beaches1—Very Low
Medical services (Health care provided)0 to 565—Very High
57 to1794—High
180 to 3273—Moderate
328 to 6282—Low
629 to 11861—Very Low
Distance to roads2000 m5—Very High
1000 m4—High
500 m3—Moderate
250 m2—Low
100 m1—Very Low
Literacy rate<67%5—Very High
67% to 73%4—High
73% to 81%3—Moderate
81% to 86%2—Low
>86%1—Very Low
Table 4. Watersheds and locations where erosion/accretion occurred along the coastline.
StateWatershedkmLocationkm
ErosionAnchicaya19.96Punta Soldado, Punta Santa Barbara18.27
Cajambre12.22Punta Bonita12.22
Yurumangui9.52Punta La Concepción8.31
Bajo San Juan9.16El Choncho6.87
Naya7.50El Ajicito beach4.7
Malaga Bay7.27The Bar6.05
AccretionNaya35.35Ajicito and Ají beach32.09
Malaga Bay32.83La Concepción Beach20.1
Bajo San Juan27.27Boca de Bajo San Juan20.08
Cajambre21.57Punta Fray Juan20.73
Raposo15.65Raposo mouth15.29
Publisher’s Note: MDPI stays neutral with regard to jurisdictional claims in published maps and institutional affiliations.

