

Spatiotemporal Evolution and Influential Factors of Rural Poverty in Poverty-Stricken Areas of Guizhou Province: Implications for Consolidating the Achievements of Poverty Alleviation

Abstract
:1. Introduction
2. Materials and Methods
2.1. Study Area
2.2. Data Sources and the Selection of the Influential Factors
2.3. Methodology
2.3.1. Spatiotemporal Analysis of Rural Poverty
2.3.2. Geographically and Temporally Weighted Regression (GTWR)
2.3.3. Variance Decomposition
3. Results
3.1. Spatiotemporal Dynamics of Rural Poverty
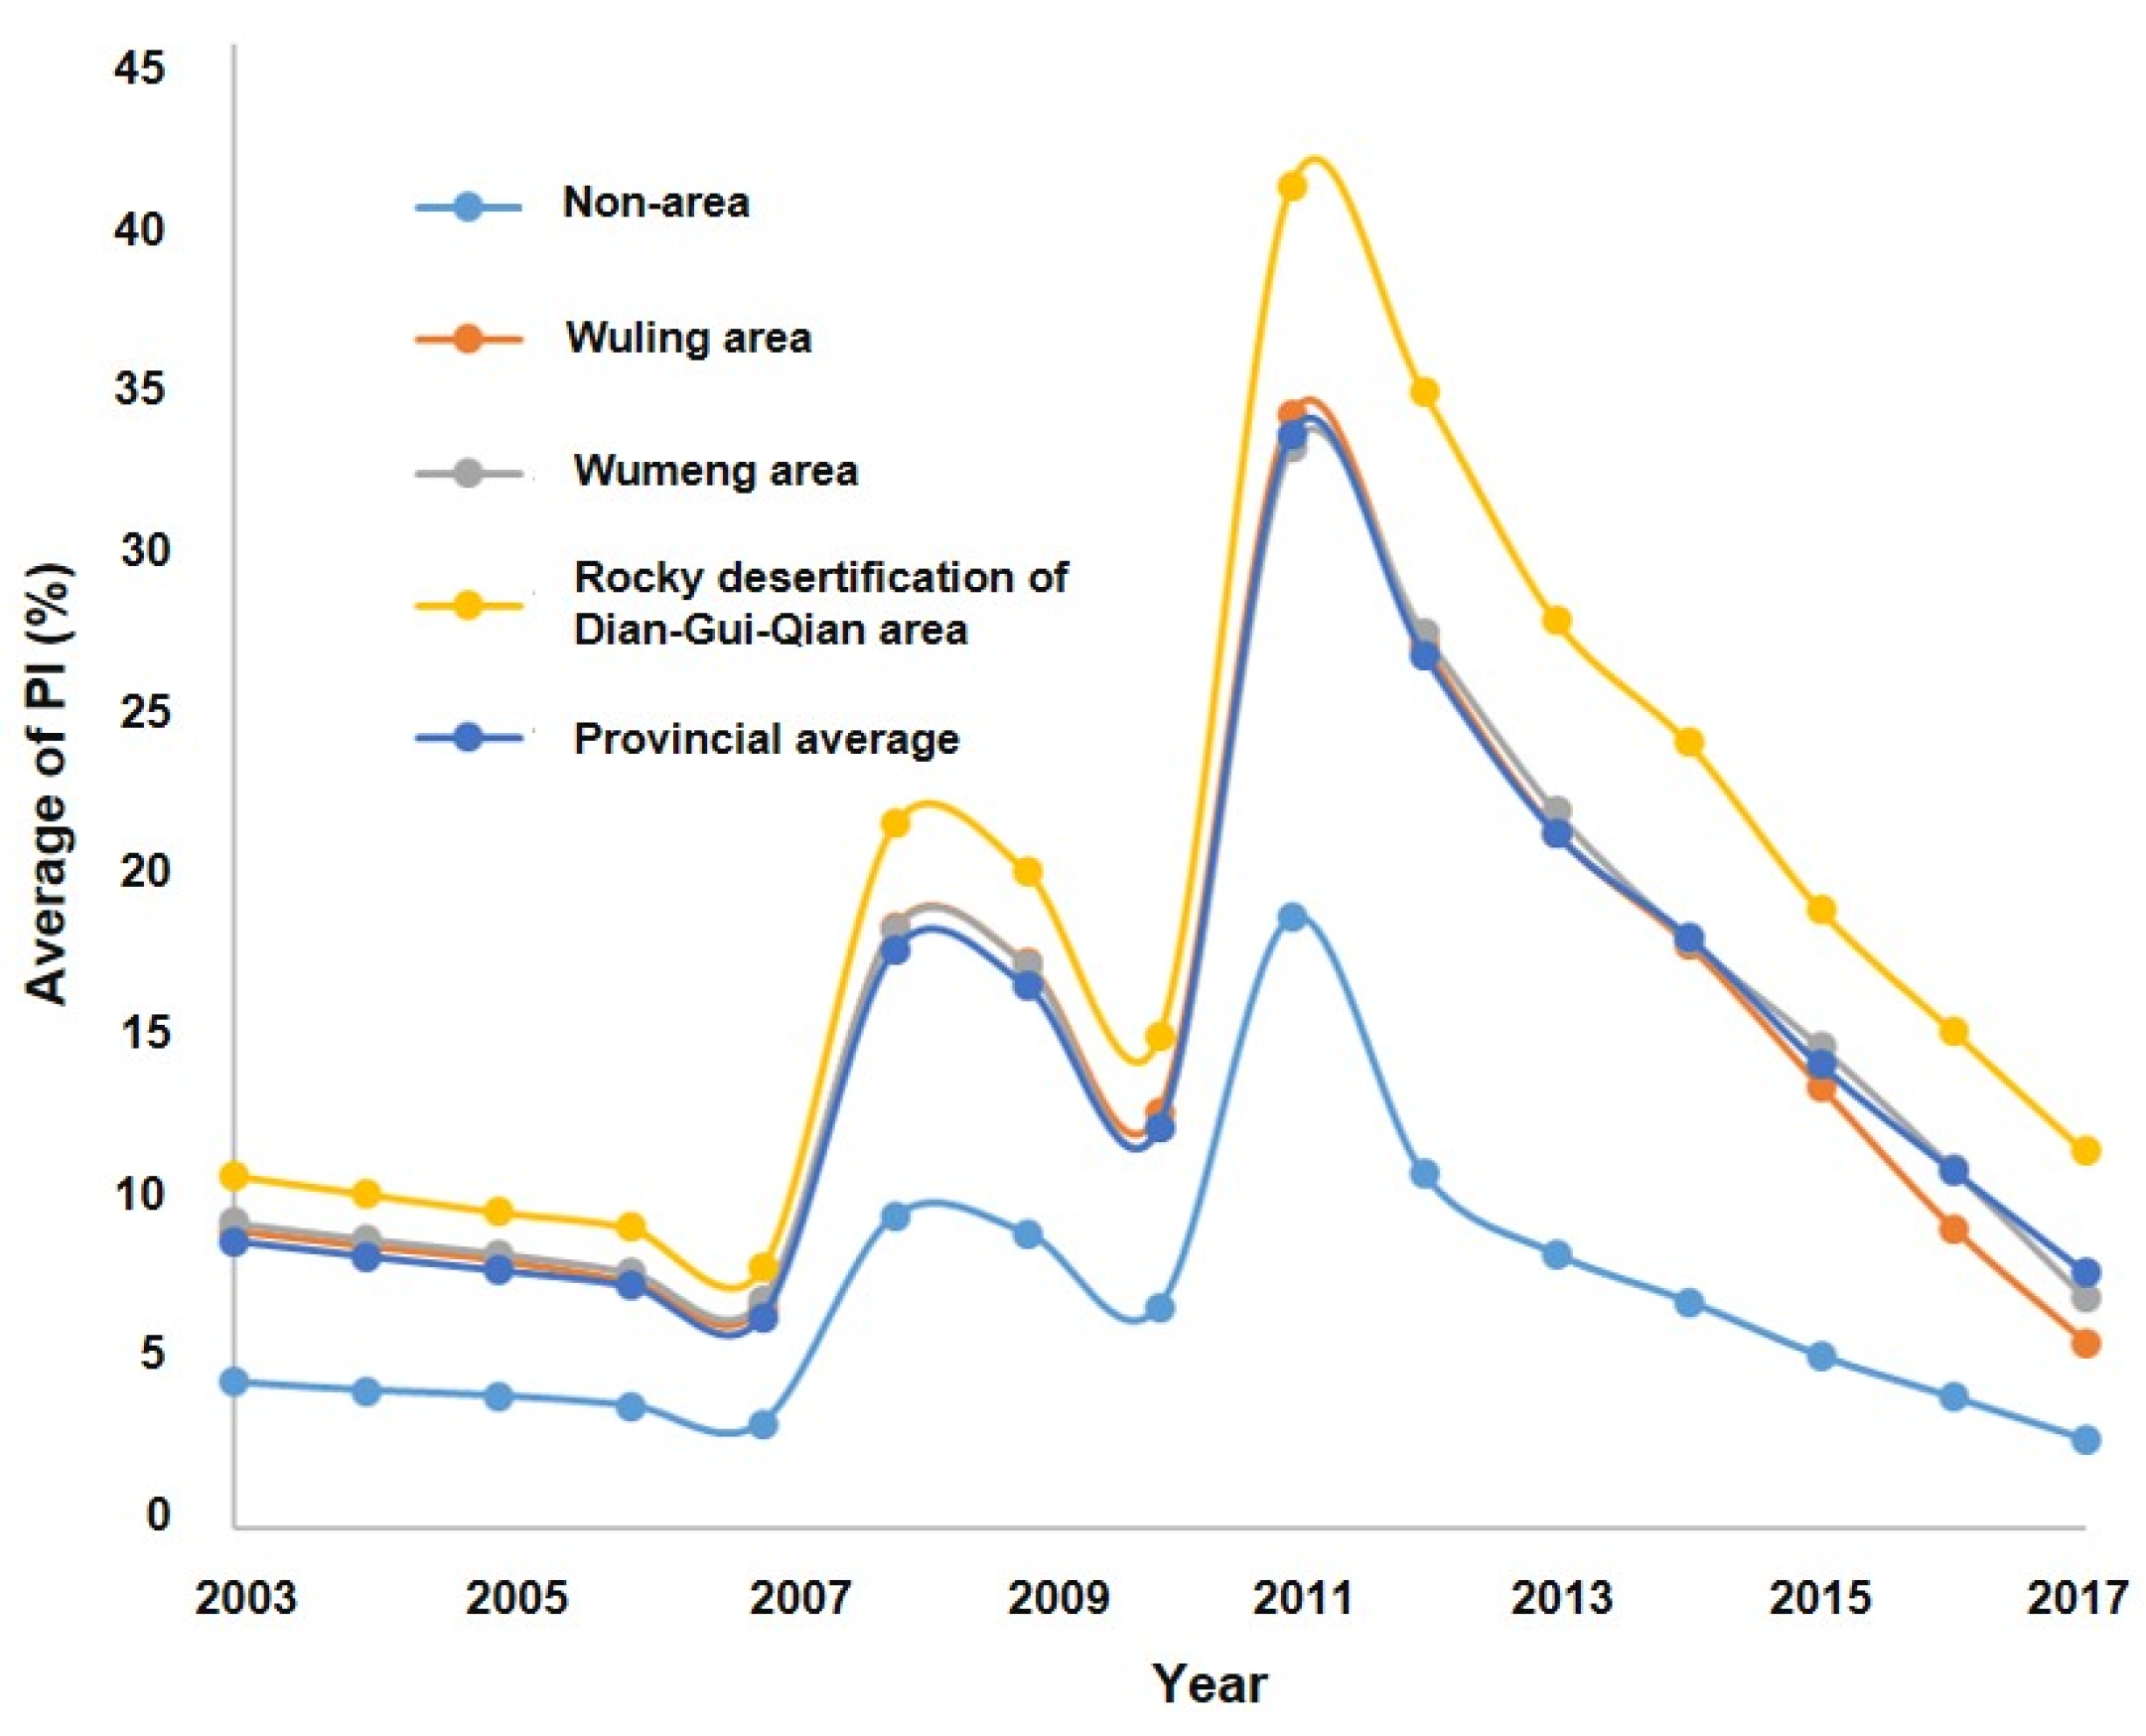
3.1.1. Analysis of the Change in Rural Poverty over the Years
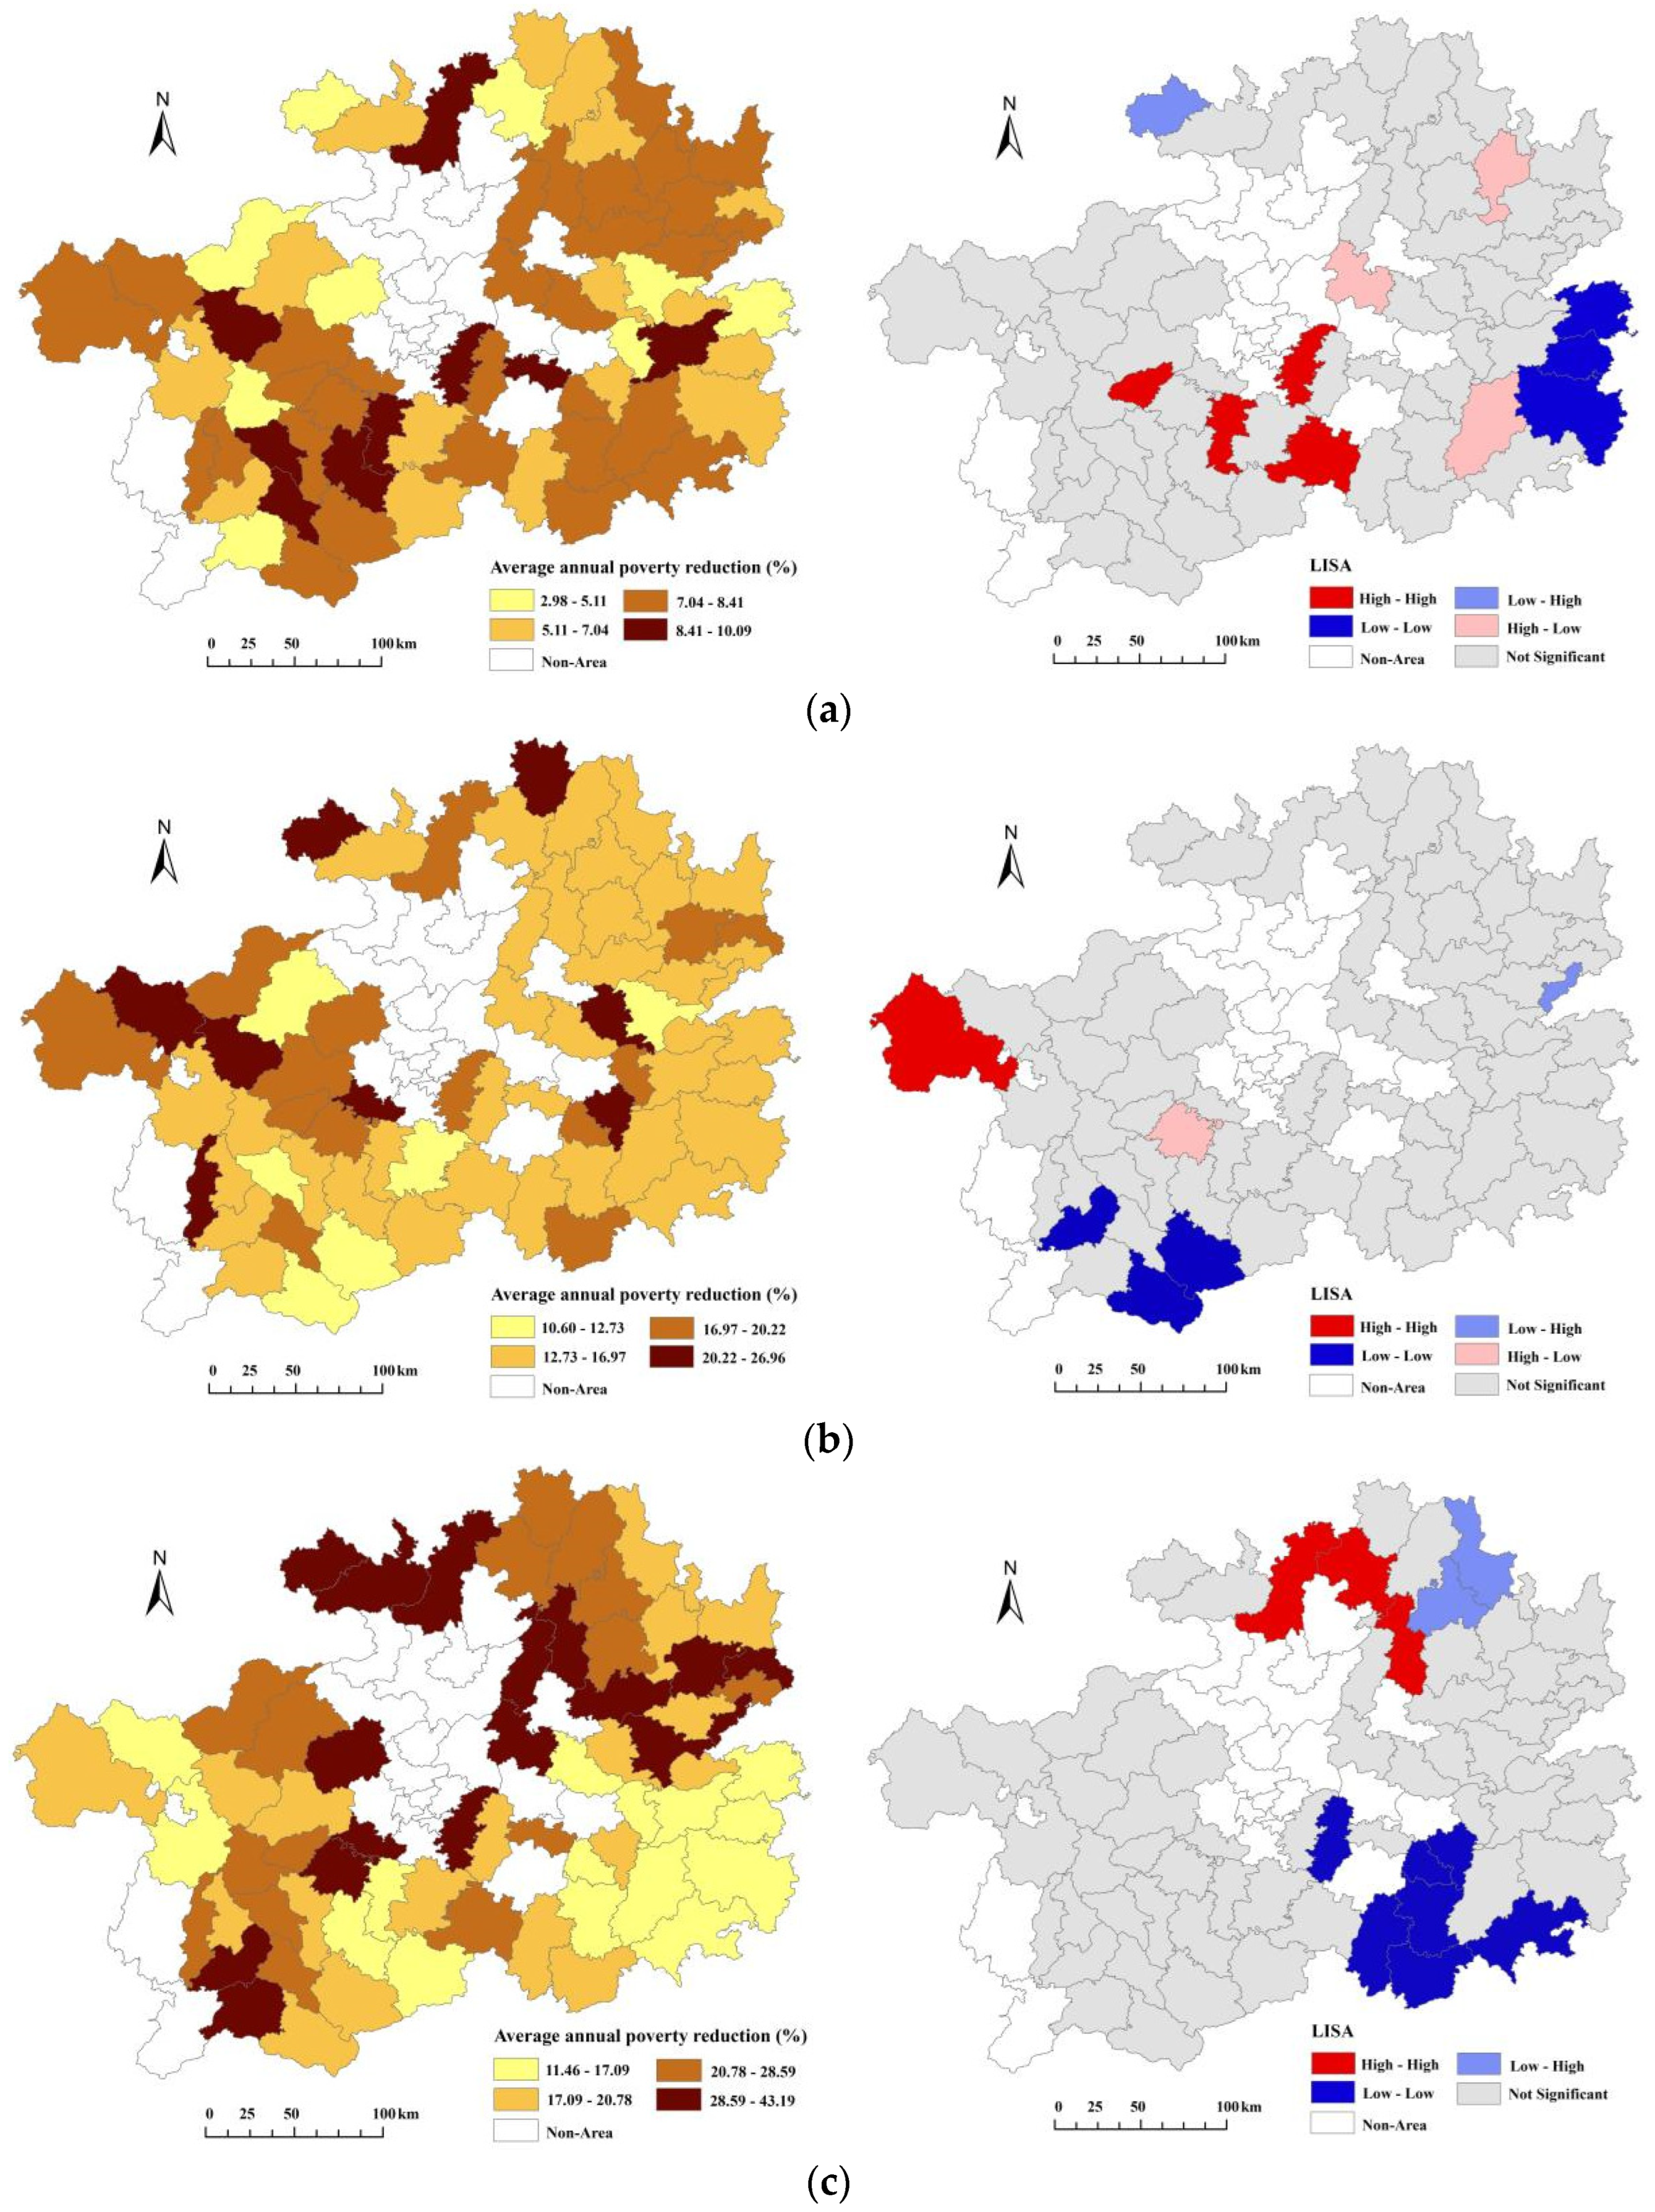
3.1.2. Spatial Pattern of the Rural Poverty Decreasing
3.1.3. Difference Analysis of Three Continuous Poverty-Stricken Areas
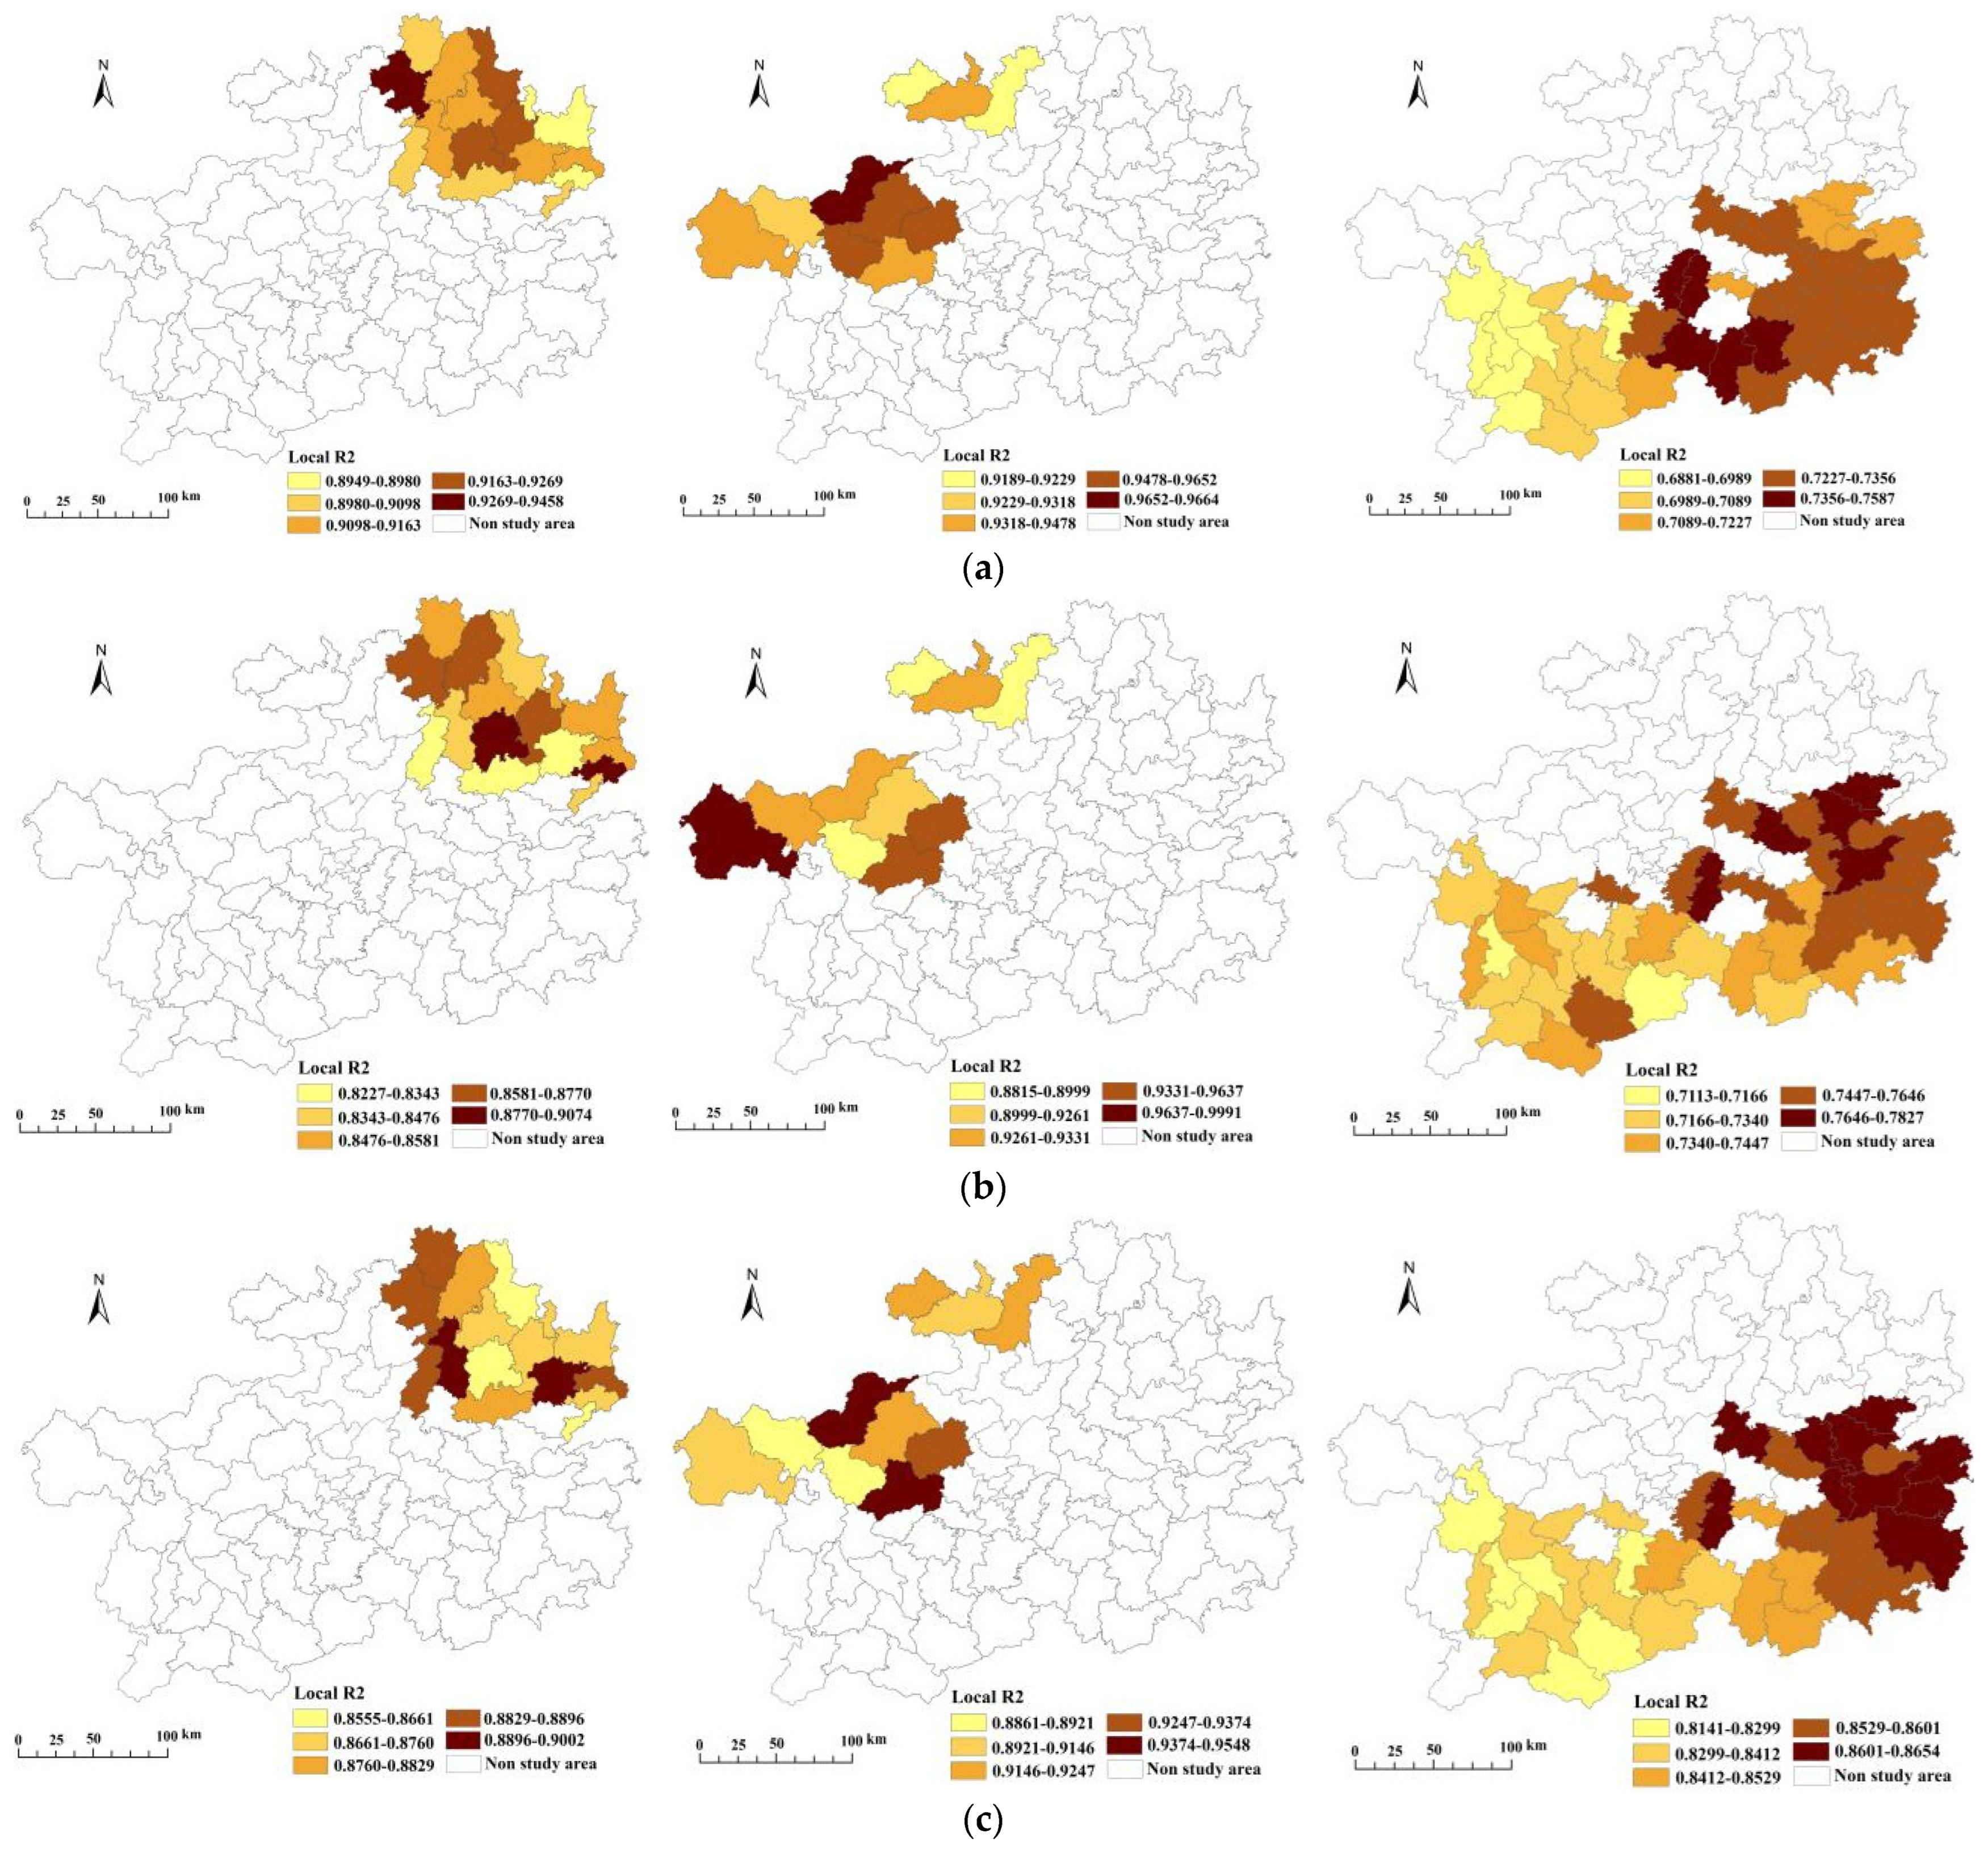
3.2. Spatiotemporal Dynamics of the Influential Factors on Rural Poverty
- 2003–2007;
- 2008–2010;
- 2011–2017.
3.3. Analysis of the Variance Decomposition Results of the Influential Factors
4. Discussion
5. Conclusions
Author Contributions
Funding
Data Availability Statement
Acknowledgments
Conflicts of Interest
Appendix A

| Year | Total of Levene | df1 | df2 | Significance |
|---|---|---|---|---|
| 2003 | 0.75 | 3 | 82 | 0.53 |
| 2004 | 0.73 | 3 | 82 | 0.54 |
| 2005 | 0.76 | 3 | 82 | 0.52 |
| 2006 | 0.72 | 3 | 82 | 0.54 |
| 2007 | 0.36 | 3 | 82 | 0.78 |
| 2008 | 0.23 | 3 | 82 | 0.87 |
| 2009 | 0.40 | 3 | 82 | 0.75 |
| 2010 | 0.16 | 3 | 82 | 0.93 |
| 2011 | 0.23 | 3 | 82 | 0.87 |
| 2012 | 1.10 | 3 | 82 | 0.35 |
| 2013 | 0.51 | 3 | 82 | 0.68 |
| 2014 | 1.19 | 3 | 82 | 0.32 |
| 2015 | 1.31 | 3 | 82 | 0.28 |
| 2016 | 2.02 | 3 | 82 | 0.12 |
| 2017 | 7.06 | 3 | 82 | 0.00 |
Appendix B
| Year | Sum of Squares | df | Mean Square | F | Significance | |
|---|---|---|---|---|---|---|
| 2003 | Between groups | 548.95 | 3 | 182.99 | 26.05 | 0.00 |
| Within group | 576.00 | 82 | 7.02 | |||
| Total | 1124.96 | 85 | ||||
| 2004 | Between groups | 495.03 | 3 | 165.01 | 26.51 | 0.00 |
| Within group | 510.41 | 82 | 6.23 | |||
| Total | 1005.44 | 85 | ||||
| 2005 | Between groups | 433.96 | 3 | 144.65 | 26.49 | 0.00 |
| Within group | 447.81 | 82 | 5.46 | |||
| Total | 881.77 | 85 | ||||
| 2006 | Between groups | 403.24 | 3 | 134.41 | 25.35 | 0.00 |
| Within group | 434.86 | 82 | 5.30 | |||
| Total | 838.10 | 85 | ||||
| 2007 | Between groups | 308.38 | 3 | 102.79 | 30.09 | 0.00 |
| Within group | 280.10 | 82 | 3.42 | |||
| Total | 588.48 | 85 | ||||
| 2008 | Between groups | 1956.57 | 3 | 652.19 | 28.80 | 0.00 |
| Within group | 1857.28 | 82 | 22.65 | |||
| Total | 3813.86 | 85 | ||||
| 2009 | Between groups | 1677.26 | 3 | 559.09 | 27.73 | 0.00 |
| Within group | 1653.18 | 82 | 20.16 | |||
| Total | 3330.44 | 85 | ||||
| 2010 | Between groups | 926.73 | 3 | 308.91 | 27.56 | 0.00 |
| Within group | 919.07 | 82 | 11.21 | |||
| Total | 1845.80 | 85 | ||||
| 2011 | Between groups | 6778.20 | 3 | 2259.40 | 27.56 | 0.00 |
| Within group | 6722.88 | 82 | 81.99 | |||
| Total | 13,501.07 | 85 | ||||
| 2012 | Between groups | 7741.53 | 3 | 2580.51 | 35.63 | 0.00 |
| Within group | 5938.17 | 82 | 72.42 | |||
| Total | 13,679.70 | 85 | ||||
| 2013 | Between groups | 5086.00 | 3 | 1695.33 | 36.27 | 0.00 |
| Within group | 3832.54 | 82 | 46.74 | |||
| Total | 8918.54 | 85 | ||||
| 2014 | Between groups | 3947.63 | 3 | 1315.88 | 35.89 | 0.00 |
| Within group | 3006.31 | 82 | 36.66 | |||
| Total | 6953.93 | 85 | ||||
| 2015 | Between groups | 2531.85 | 3 | 843.95 | 33.50 | 0.00 |
| Within group | 2065.53 | 82 | 25.19 | |||
| Total | 4597.38 | 85 | ||||
| 2016 | Between groups | 1758.53 | 3 | 586.18 | 23.45 | 0.00 |
| Within group | 2049.82 | 82 | 25.00 | |||
| Total | 3808.35 | 85 |
Appendix C
| 95% Confidence Interval | |||||||
|---|---|---|---|---|---|---|---|
| Year | Three Areas | Three Areas | Mean Difference | Standard Error | Significance | Lower Limit | Upper Limit |
| 2003 | 0 | 1 | −4.56 | 0.90 | 0.00 | −6.34 | −2.78 |
| 2 | −4.84 | 1.02 | 0.00 | −6.86 | −2.81 | ||
| 3 | −6.28 | 0.71 | 0.00 | −7.70 | −4.86 | ||
| 1 | 0 | 4.56 | 0.90 | 0.00 | 2.78 | 6.34 | |
| 2 | −0.28 | 1.08 | 0.80 | −2.43 | 1.87 | ||
| 3 | −1.72 | 0.80 | 0.04 | −3.32 | −0.13 | ||
| 2 | 0 | 4.84 | 1.02 | 0.00 | 2.81 | 6.86 | |
| 1 | 0.28 | 1.08 | 0.80 | −1.87 | 2.43 | ||
| 3 | −1.44 | 0.94 | 0.13 | −3.31 | 0.42 | ||
| 3 | 0 | 6.28 | 0.71 | 0.00 | 4.86 | 7.70 | |
| 1 | 1.72 | 0.80 | 0.04 | 0.13 | 3.32 | ||
| 2 | 1.44 | 0.94 | 0.13 | −0.42 | 3.31 | ||
| 2004 | 0 | 1 | −4.35 | 0.84 | 0.00 | −6.02 | −2.67 |
| 2 | −4.59 | 0.96 | 0.00 | −6.49 | −2.68 | ||
| 3 | −5.96 | 0.67 | 0.00 | −7.30 | −4.63 | ||
| 1 | 0 | 4.35 | 0.84 | 0.00 | 2.67 | 6.02 | |
| 2 | −0.24 | 1.02 | 0.81 | −2.27 | 1.79 | ||
| 3 | −1.62 | 0.76 | 0.04 | −3.12 | −0.12 | ||
| 2 | 0 | 4.59 | 0.96 | 0.00 | 2.68 | 6.49 | |
| 1 | 0.24 | 1.02 | 0.81 | −1.18 | 2.27 | ||
| 3 | −1.38 | 0.88 | 0.12 | −3.13 | 0.38 | ||
| 3 | 0 | 5.96 | 0.67 | 0.00 | 4.63 | 7.30 | |
| 1 | 1.62 | 0.76 | 0.04 | 0.12 | 3.12 | ||
| 2 | 1.38 | 0.88 | 0.12 | −0.38 | 3.13 | ||
| 2005 | 0 | 1 | −4.09 | 0.79 | 0.00 | −5.66 | −2.52 |
| 2 | −4.32 | 0.90 | 0.00 | −6.11 | 2.54 | ||
| 3 | −5.58 | 0.63 | 0.00 | −6.83 | −4.33 | ||
| 1 | 0 | 4.09 | 0.79 | 0.00 | 2.52 | 5.66 | |
| 2 | −0.23 | 0.95 | 0.81 | −2.13 | 1.67 | ||
| 3 | 1.49 | 0.71 | 0.04 | −2.90 | −0.08 | ||
| 2 | 0 | 4.32 | 0.90 | 0.00 | 2.54 | 6.11 | |
| 1 | 0.23 | 0.95 | 0.81 | −1.67 | 2.13 | ||
| 3 | −1.26 | 0.83 | 0.13 | −2.90 | 0.39 | ||
| 3 | 0 | 5.58 | 0.63 | 0.00 | 4.33 | 6.83 | |
| 1 | 1.49 | 0.71 | 0.04 | 0.08 | 2.90 | ||
| 2 | 1.26 | 0.83 | 0.13 | −0.39 | 2.90 | ||
| 2006 | 0 | 1 | −3.74 | 0.78 | 0.00 | −5.28 | −2.19 |
| 2 | −4.05 | 0.88 | 0.00 | −5.81 | −2.29 | ||
| 3 | −5.40 | 0.62 | 0.00 | −6.63 | −4.16 | ||
| 1 | 0 | 3.74 | 0.78 | 0.00 | 2.19 | 5.28 | |
| 2 | −0.31 | 0.94 | 0.74 | −2.18 | 1.56 | ||
| 3 | −1.66 | 0.70 | 0.20 | −3.05 | −0.27 | ||
| 2 | 0 | 4.05 | 0.88 | 0.00 | 2.29 | 5.81 | |
| 1 | 0.31 | 0.94 | 0.74 | −1.56 | 2.18 | ||
| 3 | −1.35 | 0.81 | 0.10 | −2.97 | 0.27 | ||
| 3 | 0 | 5.40 | 0.62 | 0.00 | 4.16 | 6.63 | |
| 1 | 1.66 | 0.70 | 0.02 | 0.27 | 3.05 | ||
| 2 | 1.35 | 0.81 | 0.10 | −0.27 | 2.97 | ||
| 2007 | 0 | 1 | −3.52 | 0.62 | 0.00 | −4.76 | −2.27 |
| 2 | −3.72 | 0.71 | 0.00 | −5.13 | −2.30 | ||
| 3 | −4.69 | 0.50 | 0.00 | −5.68 | −3.70 | ||
| 1 | 0 | 3.52 | 0.62 | 0.00 | 2.27 | 4.76 | |
| 2 | −0.20 | 0.75 | 0.79 | −1.70 | 1.30 | ||
| 3 | −1.18 | 0.56 | 0.04 | −2.29 | −0.06 | ||
| 2 | 0 | 3.72 | 0.71 | 0.00 | 2.30 | 5.11 | |
| 1 | 0.20 | 0.75 | 0.79 | −1.30 | 1.70 | ||
| 3 | −0.98 | 0.65 | 0.14 | −2.28 | 0.32 | ||
| 3 | 0 | 4.69 | 0.50 | 0.00 | 3.70 | 5.68 | |
| 1 | 1.18 | 0.56 | 0.04 | 0.04 | 2.29 | ||
| 2 | 0.98 | 0.65 | 0.14 | −0.32 | 2.28 | ||
| 2008 | 0 | 1 | −8.74 | 1.61 | 0.00 | −11.94 | −5.54 |
| 2 | −8.71 | 1.83 | 0.00 | −12.35 | −5.07 | ||
| 3 | −11.87 | 1.28 | 0.00 | −14.42 | −9.32 | ||
| 1 | 0 | 8.74 | 1.61 | 0.00 | 5.54 | 11.94 | |
| 2 | 0.03 | 1.94 | 0.99 | −3.84 | 3.89 | ||
| 3 | −3.14 | 1.44 | 0.03 | −6.00 | −0.27 | ||
| 2 | 0 | 8.71 | 1.83 | 0.00 | 5.07 | 12.35 | |
| 1 | −0.03 | 1.94 | 0.99 | −3.89 | 3.84 | ||
| 3 | −3.16 | 1.68 | 0.06 | −6.51 | 0.19 | ||
| 3 | 0 | 11.87 | 1.28 | 0.00 | 9.32 | 14.42 | |
| 1 | 3.14 | 1.44 | 0.03 | 0.27 | 6.00 | ||
| 2 | 3.16 | 1.68 | 0.06 | −0.19 | 6.51 | ||
| 2009 | 0 | 1 | −8.15 | 1.52 | 0.00 | −11.17 | −5.14 |
| 2 | −8.13 | 1.73 | 0.00 | −11.57 | −4.70 | ||
| 3 | −10.98 | 1.21 | 0.00 | −13.39 | −8.58 | ||
| 1 | 0 | 8.15 | 1.52 | 0.00 | 5.14 | 11.17 | |
| 2 | 0.02 | 1.83 | 0.99 | −3.63 | 3.67 | ||
| 3 | −2.83 | 1.36 | 0.04 | −5.53 | −0.13 | ||
| 2 | 0 | 8.13 | 1.73 | 0.00 | 4.70 | 11.57 | |
| 1 | −0.02 | 1.83 | 0.99 | −3.67 | 3.63 | ||
| 3 | −2.85 | 1.59 | 0.08 | −6.01 | 0.31 | ||
| 3 | 0 | 10.98 | 1.21 | 0.00 | 8.58 | 13.39 | |
| 1 | 2.83 | 1.36 | 0.04 | 0.13 | 5.53 | ||
| 2 | 2.85 | 1.59 | 0.08 | −0.31 | 6.01 | ||
| 2010 | 0 | 1 | −5.90 | 1.14 | 0.00 | −8.15 | −3.65 |
| 2 | −5.44 | 1.37 | 0.00 | −8.00 | −2.88 | ||
| 3 | −8.19 | 1.01 | 0.00 | −9.98 | −6.39 | ||
| 1 | 0 | 5.90 | 1.29 | 0.00 | 3.65 | 8.15 | |
| 2 | 0.46 | 1.37 | 0.74 | −2.26 | 3.18 | ||
| 3 | −2.29 | 1.18 | 0.03 | −4.31 | −0.28 | ||
| 2 | 0 | 5.44 | 0.90 | 0.00 | 2.88 | 8.00 | |
| 1 | −0.46 | 1.01 | 0.74 | −3.18 | 2.26 | ||
| 3 | −2.75 | 1.18 | 0.02 | −5.11 | −0.40 | ||
| 3 | 0 | 8.19 | 0.90 | 0.00 | 6.39 | 9.98 | |
| 1 | 2.29 | 1.01 | 0.03 | 0.28 | 4.31 | ||
| 2 | 2.75 | 1.18 | 0.02 | 0.40 | 5.11 | ||
| 2011 | 0 | 1 | −15.22 | 3.06 | 0.00 | −21.31 | −9.13 |
| 2 | −14.23 | 3.48 | 0.00 | −27.15 | −7.31 | ||
| 3 | −22.17 | 2.44 | 0.00 | −27.03 | −17.32 | ||
| 1 | 0 | 15.22 | 3.06 | 0.00 | 9.13 | 21.31 | |
| 2 | 0.99 | 3.70 | 0.79 | −6.36 | 8.35 | ||
| 3 | −6.95 | 2.74 | 0.01 | −12.41 | −1.50 | ||
| 2 | 0 | 14.23 | 3.48 | 0.00 | 7.31 | 21.15 | |
| 1 | −0.99 | 3.70 | 0.79 | −8.35 | 6.36 | ||
| 3 | −7.95 | 3.20 | 0.02 | −14.32 | −1.58 | ||
| 3 | 0 | 22.17 | 2.44 | 0.00 | 17.32 | 27.03 | |
| 1 | 6.95 | 2.74 | 0.01 | 1.50 | 12.41 | ||
| 2 | 7.95 | 3.20 | 0.02 | 1.58 | 14.32 | ||
| 2012 | 0 | 1 | −16.03 | 2.88 | 0.00 | −21.75 | −10.31 |
| 2 | −16.36 | 3.27 | 0.00 | −22.87 | −9.86 | ||
| 3 | −23.70 | 2.29 | 0.00 | −28.26 | −19.14 | ||
| 1 | 0 | 16.03 | 2.88 | 0.00 | 10.31 | 21.75 | |
| 2 | −0.33 | 3.47 | 0.92 | −7.24 | 6.58 | ||
| 3 | −7.67 | 2.58 | 0.00 | −12.79 | −2.54 | ||
| 2 | 0 | 16.36 | 3.27 | 0.00 | 9.86 | 22.87 | |
| 1 | 0.33 | 3.47 | 0.92 | −6.58 | 7.24 | ||
| 3 | −7.34 | 3.01 | 0.02 | −13.32 | −1.35 | ||
| 3 | 0 | −23.70 | 2.29 | 0.00 | 19.14 | 28.61 | |
| 1 | 7.67 | 2.58 | 0.00 | 2.54 | 12.79 | ||
| 2 | 7.34 | 3.01 | 0.02 | 1.35 | 13.32 | ||
| 2013 | 0 | 1 | −12.78 | 2.31 | 0.00 | −17.38 | −8.18 |
| 2 | −13.42 | 2.63 | 0.00 | −18.64 | −8.19 | ||
| 3 | −19.21 | 1.84 | 0.00 | −22.87 | −15.54 | ||
| 1 | 0 | 12.78 | 2.31 | 0.00 | 8.18 | 17.38 | |
| 2 | −0.64 | 2.79 | 0.82 | −6.19 | 4.91 | ||
| 3 | −6.43 | 2.07 | 0.00 | −10.55 | −2.31 | ||
| 2 | 0 | 13.42 | 2.63 | 0.00 | 8.19 | 18.64 | |
| 1 | 0.64 | 2.79 | 0.82 | −4.91 | 6.19 | ||
| 3 | −5.79 | 2.42 | 0.02 | −10.60 | −0.98 | ||
| 3 | 0 | 19.21 | 1.84 | 0.00 | 15.54 | 22.87 | |
| 1 | 6.43 | 2.07 | 0.00 | 2.31 | 10.55 | ||
| 2 | 5.79 | 2.42 | 0.02 | 0.98 | 10.60 | ||
| 2014 | 0 | 1 | −10.82 | 2.05 | 0.00 | −14.89 | −6.75 |
| 2 | −10.98 | 2.33 | 0.00 | −15.61 | −6.35 | ||
| 3 | −16.93 | 1.63 | 0.00 | −20.18 | −13.68 | ||
| 1 | 0 | 10.82 | 2.05 | 0.00 | 6.75 | 14.89 | |
| 2 | −0.16 | 2.47 | 0.95 | −5.08 | 4.76 | ||
| 3 | −6.11 | 1.83 | 0.00 | −9.76 | −2.47 | ||
| 2 | 0 | 10.98 | 2.33 | 0.00 | 6.35 | 15.61 | |
| 1 | 0.16 | 2.47 | 0.95 | −4.76 | 5.08 | ||
| 3 | −5.95 | 2.14 | 0.01 | −10.21 | −1.69 | ||
| 3 | 0 | 16.93 | 1.63 | 0.00 | 13.68 | 20.18 | |
| 1 | 6.12 | 1.83 | 0.00 | 2.47 | 9.76 | ||
| 2 | 5.95 | 2.14 | 0.01 | 1.69 | 10.21 | ||
| 2015 | 0 | 1 | −8.16 | 1.70 | 0.00 | −11.53 | −4.78 |
| 2 | −9.38 | 1.93 | 0.00 | −13.22 | −5.55 | ||
| 3 | −13.53 | 1.35 | 0.00 | −16.22 | −10.84 | ||
| 1 | 0 | 8.16 | 1.70 | 0.00 | 4.78 | 11.53 | |
| 2 | −1.23 | 2.05 | 0.55 | −5.30 | 2.85 | ||
| 3 | −5.38 | 1.52 | 0.00 | −8.40 | −2.35 | ||
| 2 | 0 | 9.38 | 1.93 | 0.00 | 5.55 | 13.22 | |
| 1 | 1.23 | 2.05 | 0.55 | −2.85 | 5.30 | ||
| 3 | −4.15 | 1.77 | 0.02 | −7.68 | −0.62 | ||
| 3 | 0 | 13.53 | 1.35 | 0.00 | 10.84 | 16.22 | |
| 1 | 5.38 | 1.52 | 0.00 | 2.35 | 8.40 | ||
| 2 | 4.15 | 1.77 | 0.02 | 0.62 | 7.68 | ||
| 2016 | 0 | 1 | −5.12 | 1.69 | 0.00 | −8.48 | −1.76 |
| 2 | −6.95 | 1.92 | 0.00 | −10.77 | −3.13 | ||
| 3 | −11.12 | 1.35 | 0.00 | −13.80 | −8.44 | ||
| 1 | 0 | 5.12 | 1.69 | 0.00 | 1.76 | 8.48 | |
| 2 | −1.83 | 2.04 | 0.37 | −5.89 | 2.23 | ||
| 3 | −6.00 | 1.51 | 0.00 | −9.01 | −2.99 | ||
| 2 | 0 | 6.95 | 1.92 | 0.00 | 3.13 | 10.77 | |
| 1 | 1.83 | 2.04 | 0.37 | −2.23 | 5.89 | ||
| 3 | −4.16 | 1.77 | 0.02 | −7.68 | −0.65 | ||
| 3 | 0 | 11.12 | 1.35 | 0.00 | 8.44 | 13.80 | |
| 1 | 6.00 | 1.51 | 0.00 | 2.99 | 9.01 | ||
| 2 | 4.16 | 1.77 | 0.02 | 0.65 | 7.68 | ||
References
- Bray, R.; de Laat, M.; Godinot, X.; Ugarteg, A.; Walker, R. Realising poverty in all its dimensions: A six-country participatory study. World Dev. 2020, 134, 105025. [Google Scholar] [CrossRef]
- Liu, M.; Hu, S.; Ge, Y.; Heuvelink, G.; Huang, X. Using multiple linear regression and random forests to identify spatial poverty determinants in rural China. Spat. Stat. 2020, 42, 100461. [Google Scholar] [CrossRef]
- Gava, O.; Ardakani, Z.; Delali, A.; Azzi, N.; Bartolini, F. Agricultural cooperatives contributing to the alleviation of rural poverty. The case of konjic (bosnia and herzegovina). J. Rural Stud. 2021, 82, 328–339. [Google Scholar] [CrossRef]
- Li, C.; Jiao, Y.; Sun, T.; Liu, A. Alleviating multi-dimensional poverty through land transfer: Evidence from poverty-stricken villages in china. China Econ. Rev. 2021, 69, 101670. [Google Scholar] [CrossRef]
- Fang, Y.; Zhang, F. The future path to China’s poverty reduction—Dynamic decomposition analysis with the evolution of China’s poverty reduction policies. Soc. Indic. Res. 2021, 158, 1–32. [Google Scholar] [CrossRef] [PubMed]
- Zhang, D.; Wang, W.; Wei, Z.; Zhang, X.; Jian, Z. The effect on poverty alleviation and income increase of rural land consolidation in different models: A China study. Land Use Policy 2020, 99, 104989. [Google Scholar] [CrossRef]
- Cheng, X.; Shuai, C.-M.; Wang, J.; Li, W.-J.; Shuai, J.; Liu, Y. Building a sustainable development model for China’s poverty-stricken reservoir regions based on system dynamics—ScienceDirect. J. Clean. Prod. 2018, 176, 535–554. [Google Scholar] [CrossRef]
- Chen, Q.; Lu, S.; Xiong, K.; Zhao, R. Coupling analysis on ecological environment fragility and poverty in south china karst. Environ. Res. 2021, 201, 111650. [Google Scholar] [CrossRef]
- Dhrifi, A.; Jaziri, R.; Alnahdi, S. Does foreign direct investment and environmental degradation matter for poverty? Evidence from developing countries. Struct. Chang. Econ. Dyn. 2020, 52, 13–21. [Google Scholar] [CrossRef]
- Medeiros, V.; Ribeiro, R.; Amaral, P.V.M.D. Infrastructure and household poverty in Brazil: A regional approach using multilevel models—ScienceDirect. World Dev. 2021, 137, 105118. [Google Scholar] [CrossRef]
- Quang, A.T.; Pundarik, M. Multidimensionl Poverty and The Role of Social Capital in Poverty Alleviation Among Ethnic Groups in Rural Vietnam: A Multilevel Analysis. Soc. Indic. Res. 2021, 159, 281–317. [Google Scholar]
- Nanhthavong, V.; Epprecht, M.; Hett, C.; Zaehringer, J.G.; Messerli, P. Poverty trends in villages affected by land-based investments in rural Laos. Appl. Geogr. 2020, 124, 102298. [Google Scholar] [CrossRef]
- Diwakar, V.; Shepherd, A. Sustaining escapes from poverty. World Dev. 2022, 151, 105611. [Google Scholar] [CrossRef]
- Ii, A.; Kk, B.; Tm, B.; Em, C.; Az, B. The impact of investing in social care on employment generation, time-, income-poverty by gender: A macro-micro policy simulation for turkey. World Dev. 2021, 144, 105476. [Google Scholar]
- Zhao, P.; Yu, Z. Rural poverty and mobility in China: A national-level survey. J. Transp. Geogr. 2021, 93, 103083. [Google Scholar] [CrossRef]
- Liao, W.; Qiao, J.; Xiang, D.; Peng, T.; Kong, F. Can labor transfer reduce poverty? Evidence from a rural area in China. J. Environ. Manag. 2020, 271, 110981. [Google Scholar] [CrossRef]
- Wan, G.; Hu, X.; Liu, W. China’s poverty reduction miracle and relative poverty: Focusing on the roles of growth and inequality. China Econ. Rev. 2021, 68, 101643. [Google Scholar] [CrossRef]
- Xin, Y.; Wang, D.; Zhang, L.; Ma, Y.; Chen, X.; Wang, H.; Wang, H.; Wang, K.; Long, H.; Chai, H.; et al. Cooperative analysis of infrastructure perfection and residents’ living standards in poverty-stricken counties in Qinghai province. Environ. Dev. Sustain. 2022, 24, 3687–3703. [Google Scholar] [CrossRef]
- Shuai, J.; Liu, J.; Cheng, J.; Cheng, X.; Wang, J. Interaction between ecosystem services and rural poverty reduction: Evidence from China. Environ. Sci. Policy. 2021, 119, 1–11. [Google Scholar] [CrossRef]
- Yang, L.; Lu, H.; Wang, S.; Li, M. Mobile internet use and multidimensional poverty: Evidence from a household survey in rural China. Soc. Indic. Res. 2021, 158, 1065–1086. [Google Scholar] [CrossRef]
- Guo, Y.; Liu, Y. Poverty alleviation through land assetization and its implications for rural revitalization in China. Land Use Policy. 2021, 105, 105418. [Google Scholar] [CrossRef]
- Min, M.; Lin, C.; Duan, X.; Jin, Z.; Zhang, L. Research on targeted land poverty alleviation patterns based on the precise identification of dominant factors of rural poverty: A case study of Siyang County, Jiangsu Province, China. Environ. Dev. Sustain. 2021, 23, 12791–12813. [Google Scholar] [CrossRef]
- Zhu, C.; Zhou, Z.; Ma, G.; Yin, L. Spatial differentiation of the impact of transport accessibility on the multidimensional poverty of rural households in karst mountain areas. Environ. Dev. Sustain. 2021, 24, 3863–3883. [Google Scholar] [CrossRef]
- Zhu, X.; Chen, X.; Cai, J.; Balezentis, A.; Hu, R.; Streimikiene, D. Rural financial development, spatial spillover, and poverty reduction: Evidence from China. Econ. Res.-Ekon. Istraživanja 2021, 34, 3421–3439. [Google Scholar] [CrossRef]
- Sen, Z.; Wu, X.; Zhou, J.; Pereira, P. Spatiotemporal tradeoffs and synergies in vegetation vitality and poverty transition in rocky desertification area. Sci. Total Environ. 2020, 752, 141770. [Google Scholar]
- Wang, Y.; Li, Y. Promotion of degraded land consolidation to rural poverty alleviation in the agro-pastoral transition zone of northern China—ScienceDirect. Land Use Policy 2019, 88, 104114. [Google Scholar] [CrossRef]
- Li, Y.; Li, Y.; Karácsonyi, D.; Liu, Z.; Wang, J. Spatio-temporal pattern and driving forces of construction land change in a poverty-stricken county of China and implications for poverty-alleviation-oriented land use policies. Land Use Policy 2019, 91, 104267. [Google Scholar] [CrossRef]
- Li, D.; Yang, Y.; Du, G.; Huang, S. Understanding the contradiction between rural poverty and rich cultivated land resources: A case study of heilongjiang province in northeast china. Land Use Policy 2021, 108. [Google Scholar] [CrossRef]
- Ge, Y.; Ren, Z.; Fu, Y. Understanding the relationship between Dominant Geo-Environmental Factors and Rural Poverty in Guizhou, China. ISPRS Int. J. Geo-Inf. 2021, 10, 270. [Google Scholar] [CrossRef]
- He, R.; Fan, J.; Li, G. Spatiotemporal evolution and formation mechanism of the poverty belt around Beijing and Tianjin. Econ. Geogr. 2018, 38, 1–9. [Google Scholar]
- Zhou, Y.; Li, X. Geographical pattern and mechanism of poverty differentiation in plain areas: A case study of Lixin county, Anhui Province. Sci. Geogr. Sin. 2019, 39, 1592–1601. [Google Scholar]
- Ge, Y.; Hu, S.; Ren, Z.; Jia, Y.; Chen, Y. Mapping annual land use changes in China’s poverty-stricken areas from 2013 to 2018. Remote Sens. Environ. 2019, 232, 111285. [Google Scholar] [CrossRef]
- Zhou, L.; Xiong, L.Y. Natural topographic controls on the spatial distribution of poverty-stricken counties in China. Appl. Geogr. 2018, 90, 282–292. [Google Scholar] [CrossRef]
- Xu, J.; Song, J.; Li, B.; Liu, D.; Cao, X. Do settlements isolation and land use changes affect poverty? Evidence from a mountainous province of China. J. Rural Stud. 2020, 76, 163–172. [Google Scholar] [CrossRef]
- Zhou, Y.; Liu, Y. The geography of poverty: Review and research prospects. J. Rural Stud. 2019, 93, 408–416. [Google Scholar] [CrossRef]
- Porterfield, S.L.; Mcbride, T.D. The effect of poverty and caregiver education on perceived need and access to health services among children with special health care needs. Am. J. Public Health 2007, 97, 323. [Google Scholar] [CrossRef]
- Wang, Y.; Qi, W. Multidimensional spatiotemporal evolution detection on China’s rural poverty alleviation. J. Geogr. Syst. 2021, 23, 63–96. [Google Scholar] [CrossRef]
- Aj, A.; Ma, B.; Hl, C.; Aj, D. The effect of poverty on street vending through sequential mediations of education, immigration, and unemployment. Sustain. Cities Soc. 2020, 62, 102316. [Google Scholar]
- Kendall, M.G. Rank correlation methods. Br. J. Psychol. 2021, 25, 86–91. [Google Scholar] [CrossRef]
- Wei, W.; Jing, Z.; Zhou, J.; Liang, Z.; Li, C. Monitoring drought dynamics in China using optimized meteorological drought index (OMDI) based on remote sensing data sets. J. Environ. Manag. 2021, 292, 112733. [Google Scholar] [CrossRef]
- Anselin, L. Interactive techniques and exploratory spatial data analysis. In Eographical Information Systems: Principles, Techniques, Management and Applications; Longley, G.M., Maguire, D., Rhind, D., Eds.; John Wiley & Sons: New York, NY, USA, 1999; pp. 253–266. [Google Scholar]
- Anselin, L. Thirty years of spatial econometrics. Pap. Reg. Sci. 2010, 89, 3–25. [Google Scholar] [CrossRef]
- Abdullah, M.E.; Syed, A.; Bener, A.; Al-Ohali, T. A simple program in basic for the one-way analysis of variance of experimental data. Int. J. Bio-Med. Comput. 1998, 22, 65–71. [Google Scholar] [CrossRef]
- Huang, B.; Wu, B.; Barry, M. Geographically and temporally weighted regression for modeling spatio-temporal variation in house prices. Int. J. Geogr. Inf. Sci. 2010, 24, 383–401. [Google Scholar] [CrossRef]
- Lütkepohl, H. Variance Decomposition. In Macroeconometrics and Time Series Analysis; Palgrave Macmillan: London, UK, 2010; pp. 369–371. [Google Scholar]
- Deng, Q.; Li, E.; Zhang, P. Livelihood sustainability and dynamic mechanisms of rural households out of poverty: An empirical analysis of Hua County, Henan province, China. Habitat Int. 2020, 99, 102160. [Google Scholar] [CrossRef]


| Influential Factors | Indicator | Abbreviation |
|---|---|---|
| Natural endowment | Elevation | P1 |
| Slope | P2 | |
| Ratio of slope areas above 15° | P3 | |
| Ratio of slope areas above 25° | P4 | |
| Ratio of slope areas above 30° | P5 | |
| Topographic relief | P6 | |
| NDVI | P7 | |
| Location | Distance to provincial capital city center | P8 |
| Distance to the city center | P9 | |
| Economy | Per capita regional gross domestic product (GDP) | P10 |
| Ratio of output value of primary industry in GDP | P11 | |
| Ratio of output value of secondary industry in GDP | P12 | |
| Ratio of output value of tertiary industry in GDP | P13 | |
| Per capita public revenue | P14 | |
| Per capita public expenditure | P15 | |
| Per capita net income of peasants | P16 | |
| Per capita grain output | P17 | |
| Per capita retail sales of social consumer goods | P18 | |
| Per capita deposit balance of financial institutions | P19 | |
| Education | Per capita education expenditure | P20 |
| Ratio of students to teachers in junior and senior high school | P21 | |
| Ratio of students to teachers in primary school | P22 | |
| Labor capital | Rural employees in primary industry as ratio to total rural employees | P23 |
| Rural employees in secondary industry as ratio to total rural employees | P24 | |
| Rural employees in tertiary industry as ratio to total rural employees | P25 | |
| Social development | Per capita investment in fixed assets | P26 |
| Number of junior and senior high schools per ten thousand people | P27 | |
| Number of primary schools per ten thousand people | P28 | |
| Number of fixed telephone users per ten thousand people | P29 | |
| Number of industrial enterprises per ten thousand people | P30 | |
| Number of beds in medical and health institutions per ten thousand people | P31 | |
| Number of social welfare adoptive agencies per ten thousand people | P32 | |
| Number of beds in social welfare adoptive agencies per ten thousand people | P33 | |
| Total power of agricultural machinery | P34 |
| 2003–2007 | Wuling area | Influential factor | P7 | P8 | P16 | P27 | P30 | P31 | ||
| Maximum | −0.32 | 0.83 | −2.10 | −0.36 | −0.49 | 0.68 | ||||
| Minimum | −0.40 | 0.65 | −1.93 | −0.58 | −0.51 | 0.52 | ||||
| Mean value | −0.37 | 0.73 | −2.02 | −0.49 | −0.48 | 0.62 | ||||
| Wumeng area | Influential factor | P9 | P15 | P16 | P28 | |||||
| Maximum | −0.87 | 3.98 | −5.41 | −2.76 | ||||||
| Minimum | −1.01 | 3.65 | −5.60 | −3.14 | ||||||
| Mean value | −0.92 | 3.77 | −5.52 | −2.92 | ||||||
| Rocky desertification of Dian-Gui-Qian area | Influential factor | P4 | P8 | P10 | P15 | P16 | P22 | P24 | P30 | |
| Maximum | 10.52 | −0.62 | −1.10 | 0.87 | −2.35 | −0.55 | −25.14 | −0.33 | ||
| Minimum | 8.88 | −0.75 | −1.48 | 0.73 | −2.56 | −0.82 | −28.71 | −0.48 | ||
| Mean value | 9.50 | −0.84 | −1.25 | 0.80 | −2.45 | −0.70 | −27.17 | −0.39 | ||
| 2008–2010 | Wuling area | Influential factor | P13 | P16 | P22 | |||||
| Maximum | −9.16 | −4.65 | −0.98 | |||||||
| Minimum | −12.68 | −5.00 | −1.30 | |||||||
| Mean value | −10.39 | −4.76 | −1.13 | |||||||
| Wumeng area | Influential factor | P1 | P9 | P16 | P34 | |||||
| Maximum | 1.24 | 0.67 | −5.81 | −2.10 | ||||||
| Minimum | 1.04 | 0.41 | −6.32 | −2.44 | ||||||
| Mean value | 1.11 | 0.51 | −6.04 | −2.29 | ||||||
| Rocky desertification of Dian-Gui-Qian area | Influential factor | P4 | P10 | P16 | P29 | P34 | ||||
| Maximum | 20.46 | −1.13 | −4.90 | −0.33 | −1.06 | |||||
| Minimum | 16.58 | −1.32 | −5.28 | −0.59 | −1.54 | |||||
| Mean value | 18.65 | −1.20 | −5.07 | −0.45 | −1.33 | |||||
| 2011–2017 | Wuling area | Influential factor | P10 | P14 | P16 | P24 | P26 | P28 | ||
| Maximum | −7.26 | 4.77 | −6.71 | 29.45 | 4.89 | 3.06 | ||||
| Minimum | −8.38 | 3.02 | −7.30 | 22.45 | 3.58 | 2.54 | ||||
| Mean value | −7.57 | 3.55 | −7.04 | 25.00 | 4.37 | 2.89 | ||||
| Wumeng area | Influential factor | P5 | P16 | P27 | P34 | |||||
| Maximum | −121.78 | −8.29 | −2.19 | −2.74 | ||||||
| Minimum | −128.53 | −8.68 | −2.46 | −3.08 | ||||||
| Mean value | −125.18 | −8.49 | −2.35 | −2.84 | ||||||
| Rocky desertification of Dian-Gui-Qian area | Influential factor | P1 | P5 | P10 | P16 | P26 | P30 | P34 | ||
| Maximum | −2.70 | 65.74 | −5.75 | −9.89 | 4.38 | 4.64 | −1.03 | |||
| Minimum | −3.28 | 55.09 | −6.77 | −11.18 | 3.11 | 2.79 | −1.92 | |||
| Mean value | −3.00 | 60.33 | −6.26 | −10.46 | 3.69 | 3.68 | −1.51 |
| Year | Area | Category | Variable | R2 | Adjusted R2 | Variance |
|---|---|---|---|---|---|---|
| 2003–2007 | Wuling area | Natural location (X1) | P7, P8 | 0.3891 | 0.3721 | a = 0.0329 b = 0.4215 c = 0.1053 d = 0.2856 g = 0.0438 f = 0.0547 e = 0.0009 R = 0.0573 |
| Economy (X2) | P16 | 0.7552 | 0.7518 | |||
| Social development(X3) | P27, P30, P31 | 0.2369 | 0.2047 | |||
| Wumeng area | Natural location (X1) | P9 | 0.0883 | 0.0693 | a = 0.1224 b = 0.8534 c = 0.1276 d = −0.1037 g = −0.0912 f = −0.0796 e = 0.1302 R = 0.0409 | |
| Economy (X2) | P15, P16 | 0.7973 | 0.7887 | |||
| Social development (X3) | P28 | 0.1057 | 0.0870 | |||
| Rocky desertification of Dian-Gui-Qian area | Natural location (X1) | P4, P8 | 0.2462 | 0.2384 | a = 0.1032 b = 0.3576 c = 0.0036 d = 0.0858 g = 0.1283 f = −0.0440 e = 0.0934 R = 0.2721 | |
| Socio-economy (X2) | P10, P15, P16, P30 | 0.6720 | 0.6651 | |||
| Education/Labor (X3) | P22, P24 | 0.1897 | 0.1813 | |||
| 2008–2010 | Wuling area | Economy (X1) | P13, P16 | 0.8189 | 0.8060 | a = 0.8594 b = −0.0534 c = 0.0595 R = 0.1345 |
| Education/Labor (X2) | P22 | 0.0287 | 0.0061 | |||
| Wumeng area | Natural location (X1) | P1, P9 | 0.2947 | 0.2425 | a = 0.0617 b = 0.6067 c = 0.1206 d = 0.2922 g = −0.0086 f = −0.0607 e = −0.0507 R = 0.0358 | |
| Economy (X2) | P16 | 0.8480 | 0.8426 | |||
| Social development (X3) | P34 | 0.0339 | 0.0006 | |||
| Rocky desertification of Dian-Gui-Qian area | Natural location (X1) | P4 | 0.1964 | 0.1894 | a = 0.0264 b = 0.3840 c = 0.0269 d = 0.0791 g = 0.1522 f = 0.0061 e = 0.0778 R = 0.2475 | |
| Economy (X2) | P10, P16 | 0.6984 | 0.6931 | |||
| Social development (X3) | P29, P34 | 0.2757 | 0.2630 | |||
| 2011–2017 | Wuling area | Economy(X1) | P10, P14, P16 | 0.8136 | 0.8081 | a = 0.1613 b = 0.0719 c = 0.0115 d = 0.5566 g = −0.0086 f = 0.0052 e = 0.0850 R = 0.1171 |
| Social development (X2) | P26, P28 | 0.7106 | 0.7049 | |||
| Education/Labor (X3) | P24 | 0.1018 | 0.0931 | |||
| Wumeng area | Natural location (X1) | P5 | 0.2292 | 0.2179 | a = 0.1004 b = 0.4543 c = 0.1195 d = 0.2352 g = 0.1474 f = −0.0557 e = −0.0620 R = 0.0609 | |
| Economy (X2) | P16 | 0.7782 | 0.7749 | |||
| Social development (X3) | P27, P34 | 0.1739 | 0.1492 | |||
| Rocky desertification of Dian-Gui-Qian area | Natural location (X1) | P1, P5 | 0.1619 | 0.1557 | a = 0.0342 b = 0.2780 c = 0.0005 d = −0.0181 g = 0.4060 f = 0.0326 e = 0.1070 R = 0.1598 | |
| Economy (X2) | P10, P16 | 0.7724 | 0.7709 | |||
| Social development (X3) | P26, P30, P34 | 0.5511 | 0.5461 |
Publisher’s Note: MDPI stays neutral with regard to jurisdictional claims in published maps and institutional affiliations. |
© 2022 by the authors. Licensee MDPI, Basel, Switzerland. This article is an open access article distributed under the terms and conditions of the Creative Commons Attribution (CC BY) license (https://creativecommons.org/licenses/by/4.0/).
Share and Cite
Li, G.; Jiao, Y.; Li, J.; Yan, Q. Spatiotemporal Evolution and Influential Factors of Rural Poverty in Poverty-Stricken Areas of Guizhou Province: Implications for Consolidating the Achievements of Poverty Alleviation. ISPRS Int. J. Geo-Inf. 2022, 11, 546. https://doi.org/10.3390/ijgi11110546
Li G, Jiao Y, Li J, Yan Q. Spatiotemporal Evolution and Influential Factors of Rural Poverty in Poverty-Stricken Areas of Guizhou Province: Implications for Consolidating the Achievements of Poverty Alleviation. ISPRS International Journal of Geo-Information. 2022; 11(11):546. https://doi.org/10.3390/ijgi11110546
Chicago/Turabian StyleLi, Guie, Yangyang Jiao, Jie Li, and Qingwu Yan. 2022. "Spatiotemporal Evolution and Influential Factors of Rural Poverty in Poverty-Stricken Areas of Guizhou Province: Implications for Consolidating the Achievements of Poverty Alleviation" ISPRS International Journal of Geo-Information 11, no. 11: 546. https://doi.org/10.3390/ijgi11110546
APA StyleLi, G., Jiao, Y., Li, J., & Yan, Q. (2022). Spatiotemporal Evolution and Influential Factors of Rural Poverty in Poverty-Stricken Areas of Guizhou Province: Implications for Consolidating the Achievements of Poverty Alleviation. ISPRS International Journal of Geo-Information, 11(11), 546. https://doi.org/10.3390/ijgi11110546