Article

Application-Based COVID-19 Micro-Mobility Solution for Safe and Smart Navigation in Pandemics

1
The Robotics Program, Department of Electrical Engineering, Korea Advanced Institute of Science and Technology, Daejeon 34141, Korea
2
Department of Information Technology, Manipal University Jaipur, Rajasthan 303007, India
3
Marie Skłodowska-Curie Actions TRAIN@ED Fellow, School of Law & School of Informatics, University of Edinburgh, Edinburgh EH89YL, UK
4
MagIC, NOVAIMS, Universidade Nova de Lisboa, 1070-312 Lisbon, Portugal
*
Author to whom correspondence should be addressed.
ISPRS Int. J. Geo-Inf. 2021, 10(8), 571; https://doi.org/10.3390/ijgi10080571
Submission received: 20 July 2021 / Revised: 6 August 2021 / Accepted: 21 August 2021 / Published: 23 August 2021
(This article belongs to the Special Issue Geo-Information Applications in Active Mobility and Health in Cities)

Abstract

:
Short distance travel and commute being inevitable, safe route planning in pandemics for micro-mobility, i.e., cycling and walking, is extremely important for the safety of oneself and others. Hence, we propose an application-based solution using COVID-19 occurrence data and a multi-criteria route planning technique for cyclists and pedestrians. This study aims at objectively determining the routes based on various criteria on COVID-19 safety of a given route while keeping the user away from potential COVID-19 transmission spots. The vulnerable spots include places such as a hospital or medical zones, contained residential areas, and roads with a high connectivity and influx of people. The proposed algorithm returns a multi-criteria route modeled on COVID-19-modified parameters of micro-mobility and betweenness centrality considering COVID-19 avoidance as well as the shortest available safe route for user ease and shortened time of outside environment exposure. We verified our routing algorithm in a part of Delhi, India, by visualizing containment zones and medical establishments. The results with COVID-19 data analysis and route planning suggest a safer route in the context of the coronavirus outbreak as compared to normal navigation and on average route extension is within 8%–12%. Moreover, for further advancement and post-COVID-19 era, we discuss the need for adding open data policy and the spatial system architecture for data usage, as a part of a pandemic strategy. The study contributes new micro-mobility parameters adapted for COVID-19 and policy guidelines based on aggregated contact tracing data analysis maintaining privacy, security, and anonymity.

1. Introduction

In the COVID-19 pandemic, public transport like buses, metro, and vehicle sharing services are seldom available or used. The situation leaves users with a limited choice of using personal two wheelers like motorbikes and cycles which in many places is not the preferred way to commute due to commuters’ behavior [1]. To avoid traffic, for small distances within a few kilometers, many may intend to choose either cycling or walking, bringing the focus on micro-mobility. Recent studies in medical science have found that airborne transmission may be the dominant route of COVID-19 spread [2]. Therefore, cycling and walking leave commuters more exposed to COVID-19 as compared to enclosed vehicles like cars. Moreover, the COVID-19 virus can be active on surfaces so cycling and walking make one a potential carrier of the virus to their living places. Airborne transmission of the coronavirus is highly virulent and could be the dominant route for the spread of COVID-19 [3,4]. Even with normal nasal breathing, inhalation of virus-bearing aerosols results in deep and continuous deposition into the human respiratory tract, and this transmission route typically requires a low dose. The COVID-19 pandemic has spread like wildfire across the globe and it is becoming harder for countries with a comparatively higher population density to manage the citizens [5,6]. With thousands of cases surfacing in some countries, it has become extremely hard to trace the virus and determine the probability of finding the virus in a particular location. Solutions which helped in alleviating the spread in one country are not working in another with different societal conditions [7,8]. In India, in particular, it might not be feasible to seclude a particular area altogether or cut off the daily commute of the working people. Many day-to-day commute patterns are from a pre-COVID-19 time and were not devised to handle a situation like this [9,10].
Given the COVID-19 contagion and micro-mobility as a necessity, micro-mobility is increasing around the globe using personal vehicles. In a study from Zurich, Switzerland, not only micro-mobility is preferred for long distance but also the usage component of an e-bike and e-scooter is showing different variation in usage [2]. Micro-mobility vehicles like an e-bike and e-scooter are shared vehicles, hence, in Louisville, Kentucky, in general, their usage declined during the COVID-19 peak [11]. In Sicily in South Italy, many users have started to prefer traveling by private cars, which is in disagreement with sustainability policies of the European cities [12]. The same scenario was observed, in New Delhi, India, too, during the initial phase of the COVID-19 lockdown where long distance commuters along with some local commuters were using personal vehicles, and immigrant workers’ pedestrian mass transit caused increasing main road traffic [13,14]. Given that short commutes are necessary to fulfill daily basic needs and given the increased main road traffic, users are preferring cycles or walking to a destination. The necessity of gaining a deeper understanding and promoting sustainable commute is prime for sustainable urban mobility to promote resilience and recovery of future transport [15]. Traditionally, mobility assistive technology like route traffic and signal notification [16], for sustainable policy emission estimation [17], and a tourist route guidance system [18] are leveraged. However, with this changed commuting behavior, using personal vehicle cycling and walking facilitation by cycling infrastructure, add-on and technology solutions are needed in these times. In the United Kingdom, cycle-to-work schemes went up by 200% in the number of bicycle orders [19], and major cities like Paris are looking to redesign their neighborhood to provide amenities within a 15-min walk or bike ride [20]. In the coming years, people will need to adapt to physical distancing norms, and municipal authorities will likely expand on recent measures to develop biking and walking infrastructure as a way to promote more livable, sustainable, and accessible cities. As a result, urban mobility will likely see an uptake in shared micro-mobility with residents selectively choosing when to take public transportation.
Choosing these modes can have their cons and pros. In contrast to cars and motorcycles where people are safe in the enclosed environment of a car or protected by wearing helmets on motorcycles, cycling and walking leaves them exposed to the external environment. Further traveling via a cycle, which is small enough to go through narrow lanes or the liberty of just walking through any given street, necessitates conveying COVID-19 risky lanes information. Hence, in this time of the pandemic, such short commuting needs to be tackled accordingly [10,21]. One such application area that requires an infection perimeter setting is the navigation or route planning from source to destination [22,23] avoiding infectious zones. The traditional process of creating an appropriate route is carried out by considering the possibility of a route, the traffic, and the efficiency of the route based on some objective metric [24,25]. These methods do not emphasize the type of safety required to alleviate the chances of catching the virus during a ride out or regular commutes [26,27]. In this work, we show the containment zones, the inner, middle, and outer regions for an area in Delhi, India, and discussed in Section 3 with figures depicting the random spread along the area geography. As it is not possible for everyone to know all containment zones or all hotspots of a region or a city, these conventional methods, being oriented for trivial situations, can introduce someone to a high containment zone. Now, with the local road traffic load going down and the need to be safe gaining a higher priority, a solution is required to merge infection safe routes with origin-destination points [28,29]. In this paper, we propose an algorithm that takes these requirements into consideration.
For the present study, the National Capital Region (NCR) of India including Delhi is considered. Delhi being the capital of India with a strong metropolitan society and connectivity is prone to a more severe infection outbreak. Further, being a historic city, it has quite a complex network of roads and streets with one of the busiest road traffics in India. In contrast to the unplanned street network, Delhi has a well-planned network of public commuting services, namely, the metro service and the bus service in addition to locally popular private cab services like OLA and UBER. The majority of people across cities, towns, and villages in India own motorbikes, and some cycle and walk. Mobility around the globe has been affected by COVID-19, including micro-mobility, wherein micro-modes are being used for longer commutes than was the case earlier [30]. This has been observed globally as well as in India [13,30,31]. In countries like India, where it is predicted that COVID-19 waves would periodically rear its head, migrant workers take to the roads on foot in thousands each time the infection threat rises. There must be some application-based solution to monitor such movements on the roads and inform people to make better decisions [14,32,33]. In comparison to other Indian states like Maharashtra, Tamil Nadu, West Bengal, where the infection cases curve was growing as t^2 power-law growth, and while Gujarat and Madhya Pradesh exhibited linear growth, Delhi (chosen as case study area in the present work) had reached √t growth phase until August 2020 [34]. However, studies predicted that of all the cases in Delhi, 96%–98% were undetected [2]. Furthermore, in a situation like the one prevalent in India and other developing countries, the threat of infection spread could certainly keep arising in the future again, showing a similar trend. The present application-based approach is a step in that direction to facilitate commuters to take safe routes whenever the situation worsens.
To study micro-mobility trends in a region, we decided to analyze Google map mobility API data. The mobility in Delhi as plotted using the recently released Google Community Mobility Reports [35] is shown in Figure 1. This represents the percentage change in trends of mobility commute to different locations, i.e., grocery and pharmacy stores, as well as workspaces. Google collected mobility data using crowdsourcing as they accumulate the data normally for Google Maps. The graph shows that the residential as well as groceries and pharmacy-related micro movements are significant. These are mostly local short distance commutes. The lockdown in Delhi was implemented in four phases and the unlock-down was implemented in two phases. Along with unlock, common movements are seen to be increasing. However, as soon as unlocks were implemented, the COVID-19 cases soared and were statistically analyzed [36]. Therefore, in such a situation, when the risk is high and the government is offering relaxation for necessity-based commuting, citizens themselves need to take initiative to prevent themselves from external environmental exposure.
In this work, we propose steps to achieve COVID-19-safe micro-mobility through spatial identification of possible infection hotspots and then algorithmically rerouting the paths for a safe commute (Figure 2). We discuss the design criteria and mathematical models which are most effective in amalgamating COVID-19 zones with mobility routes and provide map-based visualizations. We also bring up the data aspect in our discussions to point out the fact that open data, although quite useful and beneficial for research, are at the mercy of government rules and regulations, which until made conducive for research, cannot be openly used. The solutions devised in this study can be more effectively utilized for routing by the national contact tracing agencies of a country, which we present with available aggregated anonymized data. The results with selected data show that given the right data policies, and supply of unrestricted data, the proposed system can come out of its restricted data usage and provide results ubiquitously.
We present the overview of the paper in Figure 2, with each step shown in the figure being a section in the paper. This article is structured as Section 2, providing details of geospatial analysis of road networks using widely accepted libraries. Section 3 highlights the visualization of COVID-19 containment zones and hospitals. A safe route finding methodology is also discussed. Section 4 presents the route case study and optimal result highlights. Section 5 discusses the need for open data policy and technical architecture for data usage. Post-COVID-19 era governments are suggested to add properly scrutinized policy in the pandemic act for future references. Further limitations and future work are presented in Section 6, to fuse contact tracing data with mobility facilitation adhering to safety, privacy, and anonymization. Finally, a conclusion is drawn from the study with future scope recommendations followed by the list of references.

2. Background Theory and Data Usage

The background studies involved looking at the ground situation prevalent in times of pandemic, identifying the problem scenario and analyzing the causative factors leading to the problem. This led to counteractive measures of exploring technical aspects that might offer solutions to parts of the problem. In the COVID-19 pandemic, we faced severe mobility issues even for short travels. Moreover, ready solutions for COVID-19 safe travel for short distances were not available, especially not for walkers and cyclists. Hence, we embarked upon delivering a spatial solution to COVID-19 safe micro-mobility. Furthermore, based on literature review, it soon became clear that a solution would require combining spatial data analysis, open data on infectious zones, route framing, and visualization of COVID-19 zone data over point-to-point short commutes. The scheme of the work is summarized in Figure 2 as an overview of the steps followed in the study for safe micro-mobility in the pandemic, starting with spatial data collection for COVID-19 and routes, spatial analysis, situation determination, and new route suggestion with some data policy guidelines in the end. The background theory and techniques related to the various steps are explained in this section. As shown in Figure 2, the first requirement is to curate spatial road network, then comes COVID-19 data layering for hazard zonation. We implement a routing algorithm next to factor in COVID-19 zones and the roads passing through the zones where the system calls upon a betweenness centrality concept, explained in this section. Finally, visualization techniques are discussed.

2.1. Geospatial Analysis of Road Network

Given the ample and rich varieties of libraries to handle geospatial data, different analyses and ideas can be tested and realized quickly. The Jupyter ecosystem is an add-on to those libraries that support various types of visualization tools that spontaneously help a lot when trying to tune and fork the data by placing it in a visual context. This capability of Jupyter Notebooks along with supporting geospatial libraries are leveraged to share the project codes in academia as well as the professional world. The Python programming language has a very wide user community, and has ready-to-use visualization and data handling libraries and packages for different purposes. Hence, the combination of python packages with Jupyter attracts developers to build geospatial packages such as OSMnx [37] and geemap [38] for geospatial analysis.

2.2. Geospatial Data and Frameworks

OpenStreetMap (OSM) [39] is a crowdsourced geographic dataset that can be used to study the geographical area such as the road networks and their connectivity on a regional as well as on a national level. Services provided by OSM allow access to underlying geospatial data structures, such as road networks, treating intersections as nodes, and the roads as edges [40]. A spatial network analysis framework is needed to analyze the geocoded data points returned by the OSM application program interface (APIs). Networkx [41], which is a python library for the creation and modification of complex networks, is a very useful tool for network analysis. Furthermore, to strengthen Networkx applicability in the road network domain, another Python package OSMnx is built over the top of Networkx. OSMnx also leverages the usage of popular Python libraries such as GeoPandas [42], which makes working with geospatial data easier by adding support for geographic data to Pandas objects. Thus, using the OSMnx, we downloaded the road network data of the interested region. The OSM provides data of features for nodes and edges within the request region. The major edge commonly-updated features are OSMid, highway, one-way, length, geometry, name, etc. The major node features are osm_id and location (latitude, longitude).

2.3. Regional Containment Zones and Medical Facilities Data

For geospatial analysis, we need containment zones as well as the medical facilities data. As the governing administration is proactive to fight COVID-19 containment zones, data are regularly updated and maintained by the state government. Our region of interest being Delhi, we got the list of the containment zones from Delhi government website [43]. Further, the list of hospitals and medical facilities are available in [44]. The information on addresses and zones are available in the form of street addresses. However, geospatial analysis needs it in latitude and longitude form.
Geocoding is the process of converting an address to a coordinate pair (latitude/longitude). It can be performed using many map services provided by different providers like Google, Tom-Tom, OSM, and Here maps. For that service, providers offer their APIs with which users can pass street addresses in the API request and can get responses as latitude and longitude [45,46]. These APIs can be queried easily using Python or R programming and responses mostly available in JSON format. These JSON responses can be parsed to save useful information using the same Python or R programming. However, free services like that of OpenStreetMap Geocoding API known as “Nominatim” required the street addresses to be aligned in a specific manner and hardly allow casual addresses. On the other hand, paid web services such as Google Maps geocoding API are advanced and automatically detect casual addresses to exact addresses and provide geocodes. For our purpose, we used Google geocoding APIs.

2.4. Map Visualization

Visualization helps users to understand the importance of critical information in data by placing it in a visual context. Unnoticed patterns, trends, and correlations in the raw textual data structure can be noticed easily by visualization. Being an integral part of the data scientist’s toolkit, creating the visualizations is common owing to powerful visualization tools and libraries available in Python. Matplotlib [47], which is a python package for data visualization, is very powerful and has visualization ranging in different aspects and types of data like categorical and non-categorical. OSMnx having built up on top of these visualizing libraries let us download spatial geometries of road networks and assist to visualize, and explore real street networks from OpenStreetMap.
Further, Folium is a powerful data visualization library in Python that can be used to work with geographic data (Geo Data) interactively. It can be used to create a map of any part of the world using the location (latitude and longitude) of that place. After the map is rendered, it has a feature of making it interactive by adding the feature of zoom-in and zoom-out which comes in handy when working with geospatial data.

2.5. Traffic Flow and Betweenness Centrality (BC)

The traffic flow in an edge majorly depends on the connectivity that an edge offers based on its presence in the different routes, i.e., betweenness centrality. The betweenness centrality ( c B e ) of an edge is “proportional to the number of shortest paths between all pairs of nodes passing through it and can be measured by averaging over each pair of nodes and following the shortest path to the destination” [48]. High betweenness centrality corresponds to the edges of main roads and low is for small streets with low connectivity. Further, some studies show a high positive correlation between the traffic flow and the betweenness centrality values of the road [48]. Therefore, for searching a low connected street with less traffic flow, normalized edge betweenness centrality is a good parameter. There are inbuilt functions in Networkx that calculate the betweenness centrality of a given graph network [49].
c B e = s , t V σ s , t e σ s , t ,
where V is the set of nodes, σ(s,t) is the number of shortest (s,t)-paths, and σ(s,te) is the number of those paths passing through edge e. For normalization, “1/(n(n−1))” factor is multiplied for directed graphs where n is the number of nodes in G.

2.6. Problem Scope and Objectives
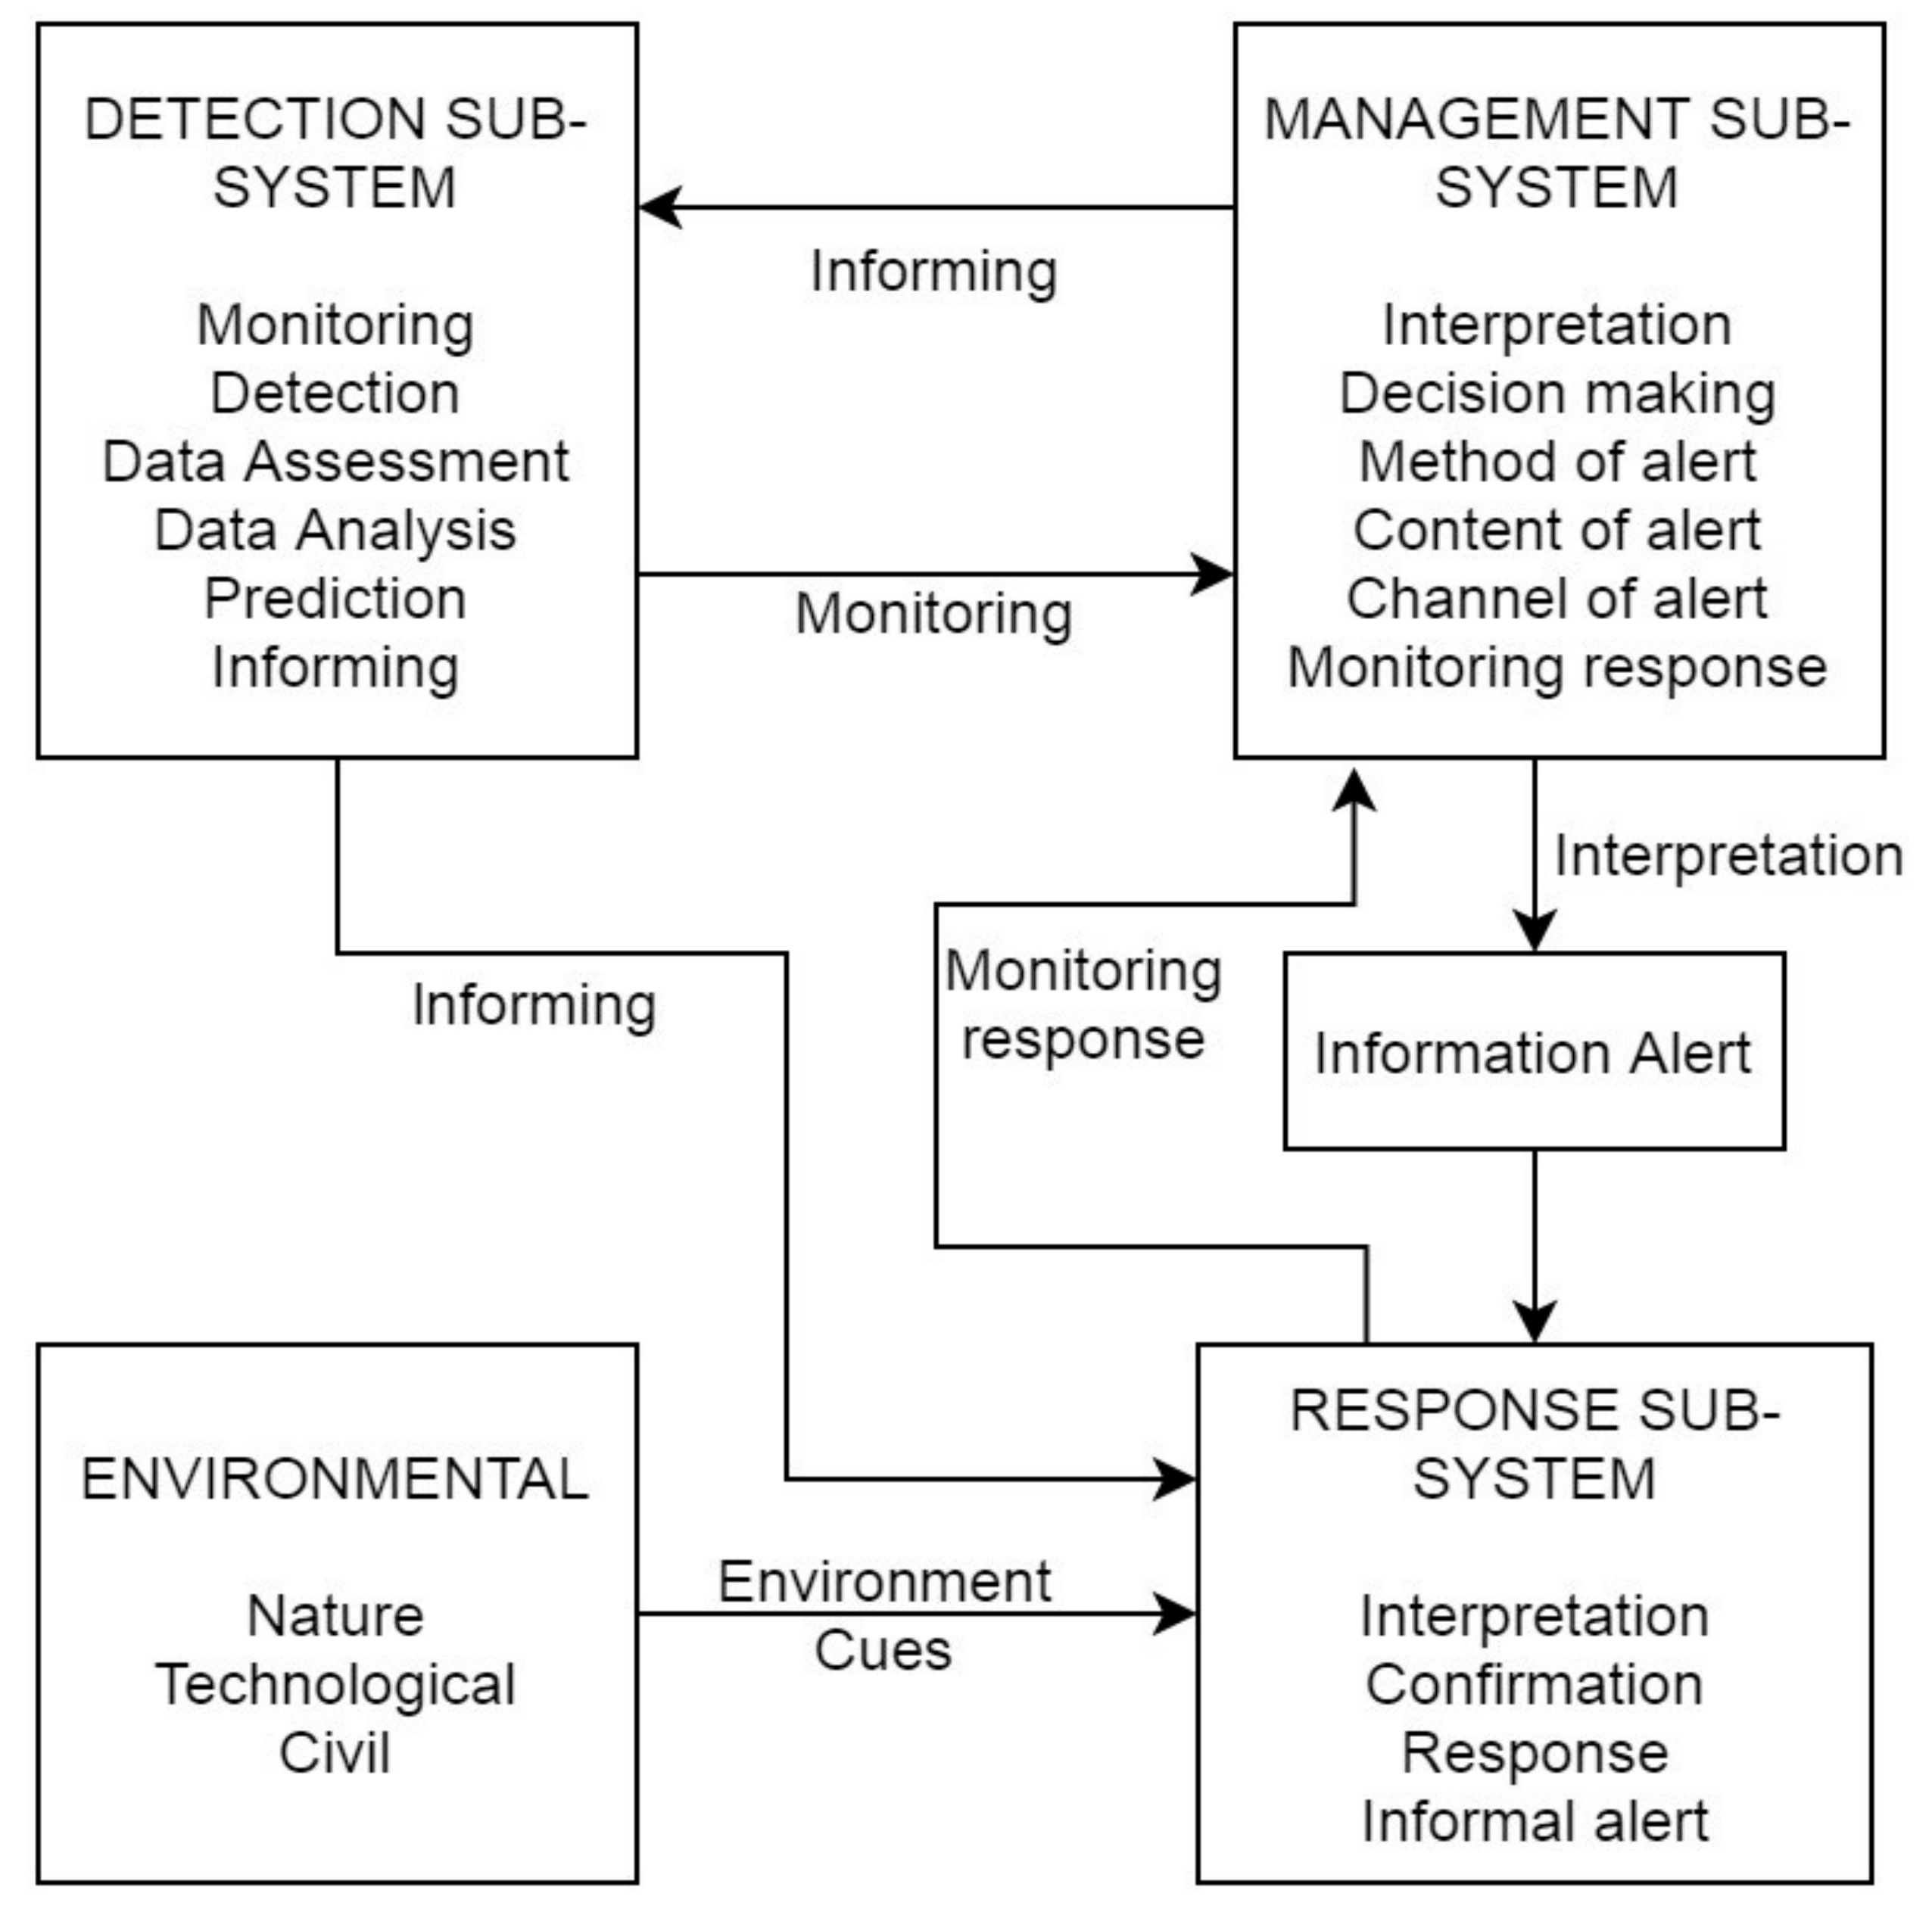
The problem scope stems from the fact that spatial correlation of COVID-19 hotspots and micro-mobility parameters has not been undertaken at a data analytics level. A usable solution and application oriented to providing users route guidance in pandemics such as COVID-19 is the need of the hour. Statistical analysis was performed to quantify the relationship between the incidence of daily COVID-19 cases and the six mobility types (retail and recreation, grocery and pharmacy, parks, transit stations, workplaces and residential) in Delhi as done in [14]. The study showed that the mobility related to retail, recreation, grocery, and pharmacy are significantly associated with the transmission of COVID-19 infection as these mobility categories have a positive coefficient of the quasi-likelihood estimate of β coefficient arising from the maximization of normality-based log-likelihood of COVID-19 cases by geography presented by the generalized estimating equation (GEE) Poisson log-linear model first introduced in [12], suggesting that an increase in the covariate will result in an increased number of COVID-19 cases over time. In addition, the coefficients of parks, transit stations, and residential-related mobility are not statistically significant, which implies that they do not affect changing COVID-19 cases over time. The test results demonstrate that although workplace-related mobility is significantly associated with the dependent variable, i.e., COVID-19 cases, the coefficient value for predicting the relationship is negative. The GEE Poisson log-linear model results using 14-day lagged mobility indicators variable, which is the symptom onset incubation period of COVID-19, shows a very similar outcome to the model which used the seven-day lagged mobility indicators [14]. In fact, the 14 days lagged average study indicates a significantly stronger coefficient estimate than the seven days lagged average for mobility related to grocery and pharmacy, re-affirming that visits to the six-places categories (grocery markets, food warehouses, farmers markets, specialty food shops, drug stores, pharmacies, and similar places) increase the chances of coronavirus infection. The use of 14-day lagged mobility indicators also reveals a more substantial negative coefficient value for workplace-related travel, highlighting that it poses the lowest risk of transmission of the virus among the six-place categories [14].
After having been affected adversely by pandemics of the scale of COVID-19, major transport services remain suspended and the commuters are left with cycling and pedestrian mode for small distance commute [50,51]. Further, Delhi is a cosmopolitan city with people from various states of India living here, and given the byzantine street network, everyone cannot know where the connected street to a place is and how far off is that place using those streets. Therefore, proper navigation assistance is needed to facilitate the pedestrians or cyclists for rerouting to unhabitual routes. We believe that the proposed work will help to navigate on a safe-short street route and will be effective for pedestrians and cyclists in Delhi.

3. Methodology

The methodology involves creating and visualizing spatial layers of routes within the area of interest and comparing them with COVID-19 hotspots data visualization in the area of interest. In this section, we describe the functions that support route and COVID-19 infection data analytics.

3.1. Visualizations and Rerouting Methodology

Visualization of the area of interest in Delhi using the data was done in two forms. The first is static which can be printed and shared through reports. Another being interactive which allows exploration of a data set, via zooming and toggling of overlays. Interactive maps leverage the use of web services to superimpose data over background map tiles from the web services. For visualization, the containment zones data used are of 12 July 2020. Three shades of color mapping are used for circular node markers with the highest color tone for nodes within 100 m of containment zone geocode point. The nodes within 100 m proximity of hospitals and medical facilities are plotted with violet color, as shown in Figure 3a. Note that most of the containment zones are near to each other and overlapping in the zoomed out map. It is inferred that most of the infection is spread via being nearby contaminated people which in turn increases with being in or near the containment zones. A zoomed-in region of the plot is shown in Figure 3b. For interactive visualization, the Folium library is used Figure 3c.

3.2. Design Criteria for Route Planning

The requirements of route planning are based on the current scenario mainly considering the safety and connectivity of the roads. We standardized the safety of a given route by checking if the chosen route involves any of the hazard factors defined by us. After having the risk gradient visualized, we would require the source and destination coordinates to calculate the route. The efficiency of a route is also taken into account by choosing the shortest path while considering the hazard factors to the destination to minimize user effort and external environment exposure time. The first hazard factors we consider are the proximity to containment zones. The gradient of the hazard was visualized with different shades of pink, with the shades getting lighter with the distance from the containment zone. The edges present within the 100 m from the containment zones are valued as the most hazardous edges to pass by in the context of the study. The hazard score (HAZ) decreases with every 100 m as the distance increases up to 300 m and is taken as 0.20, 0.16, and 0.12.
Another hazard factor considered is proximity to hospitals and medical facilities. The reason behind this consideration being the potential carrier of COVID-19 virus might be present near hospitals. Given the tremendous stress on the medical facilities, there is a possibility that there is a long queue of people waiting for their turn for medical examination. In those conditions, if a pedestrian or cyclist uses the pathway or side roads, the proximity with waiting people will increase, and so will the risk. Hence, we allotted the hazard score (HC) of 0.08 for the edges with the proximity of 100 m near the hospitals.
Navigational traffic risk must also be considered while route planning of pedestrians and cyclists. As discussed earlier, given the stress of traffic on main roads, streets are viable options. Usually, streets are not preferred for any type of traffic diversion as it is not appreciated by the locals. Furthermore, it is observed that traffic diversion like that of motorcycles increases the accident risk on local streets [52]. However, streets during this pandemic time are usually less occupied by local pedestrians as local persons living alongside the streets are advised to remain in their homes unless it is very necessary to go outside. Thus, normalized edge betweenness centrality (BC) is considered as a hazard score for navigational traffic risk. The betweenness centrality (BC) is normalized using a min-max scaler to lie in the range of 0 to 0.06. Here onwards, the equations use BC as a variable in data tables.
Another important requirement of the route is that it should not be much longer than that of the shortest route. For that to consider different hazards and betweenness centrality weight should be an empirically set factor of shortest path length. Other factors can also be considered related to traffic, like land-use patterns and areal population density. However, pedestrians and cyclists might not be traveling more than a few kilometers because of physical fatigue. For small distances like five kilometers, the land-use pattern and population density might be the same. If there is some variability, then it is hard to get that intelligence without empirical local expertise.

3.3. Cost Function Discussion

There are many shortest route-finding algorithms such as Dijkstra, Bellman-Ford, and A*. These routing algorithms need edge weight as input for every edge along the route to minimize the summation of weights for finding out the best optimal route. The edge weight should be set in a way that after summation of all the edge weights along the route do not undermine the hazard effect of any given edge in the route. For this to consider the hazard effect of any given edge, it should be comparable to the edge length of the total route. Further different types of hazard scores should be comparable so that one does not undermine the effect of others, altogether.
We allot the edge weight of each edge as per Equation (2). To find out the edge weight, a comparable constant to route length is taken which is weighted by the total hazard score. The comparable constant, which we used, is the shortest path length between the origin and destination point. We are considering a circle around the main point for the COVID-19 infection zone buffer, and circle radii follow the Euclidean distance principle. Since it is only through a zone around a point that COVID-19 infection number has to be estimated to warn movement in that buffer, we relied on radius originating from the point up to a pre-calculated length in all directions. An empirical intuition for different weights are presented in Section 4 of the result and case study. Further, to calculate normalized centrality of edges, we take a subnetwork by defining a square bounding box of a side equal to 4/3 of the shortest-path’s length with the center of the square as a Cartesian mid-point of destination and origin points. This ensures that centrality calculation does not take account of those routes between the set of nodes that are remote to any probable path between origin and destination. The hazard scores are set in a way to give most importance to containment zones, secondly to hospital presence, and lastly to connectivity. Allowing some complexity, the multi-objective function could also be made for a Pareto-optimal solution, if the objectives are competing. However, in our case, it is not a problem as there are generally many connecting streets available. Once the edge weight of a sub-network has been updated, the shortest pathfinding algorithm will search for an optimal path.
Edge   weight =   Edge   length + HAZ   +   HC   +   BC Shortest   path   length   between   origin   and   destination
where HAZ is containment zone Hazard score of edges, HC is hospital weight of edges, and BC is normalized betweenness centrality of the sub-network.

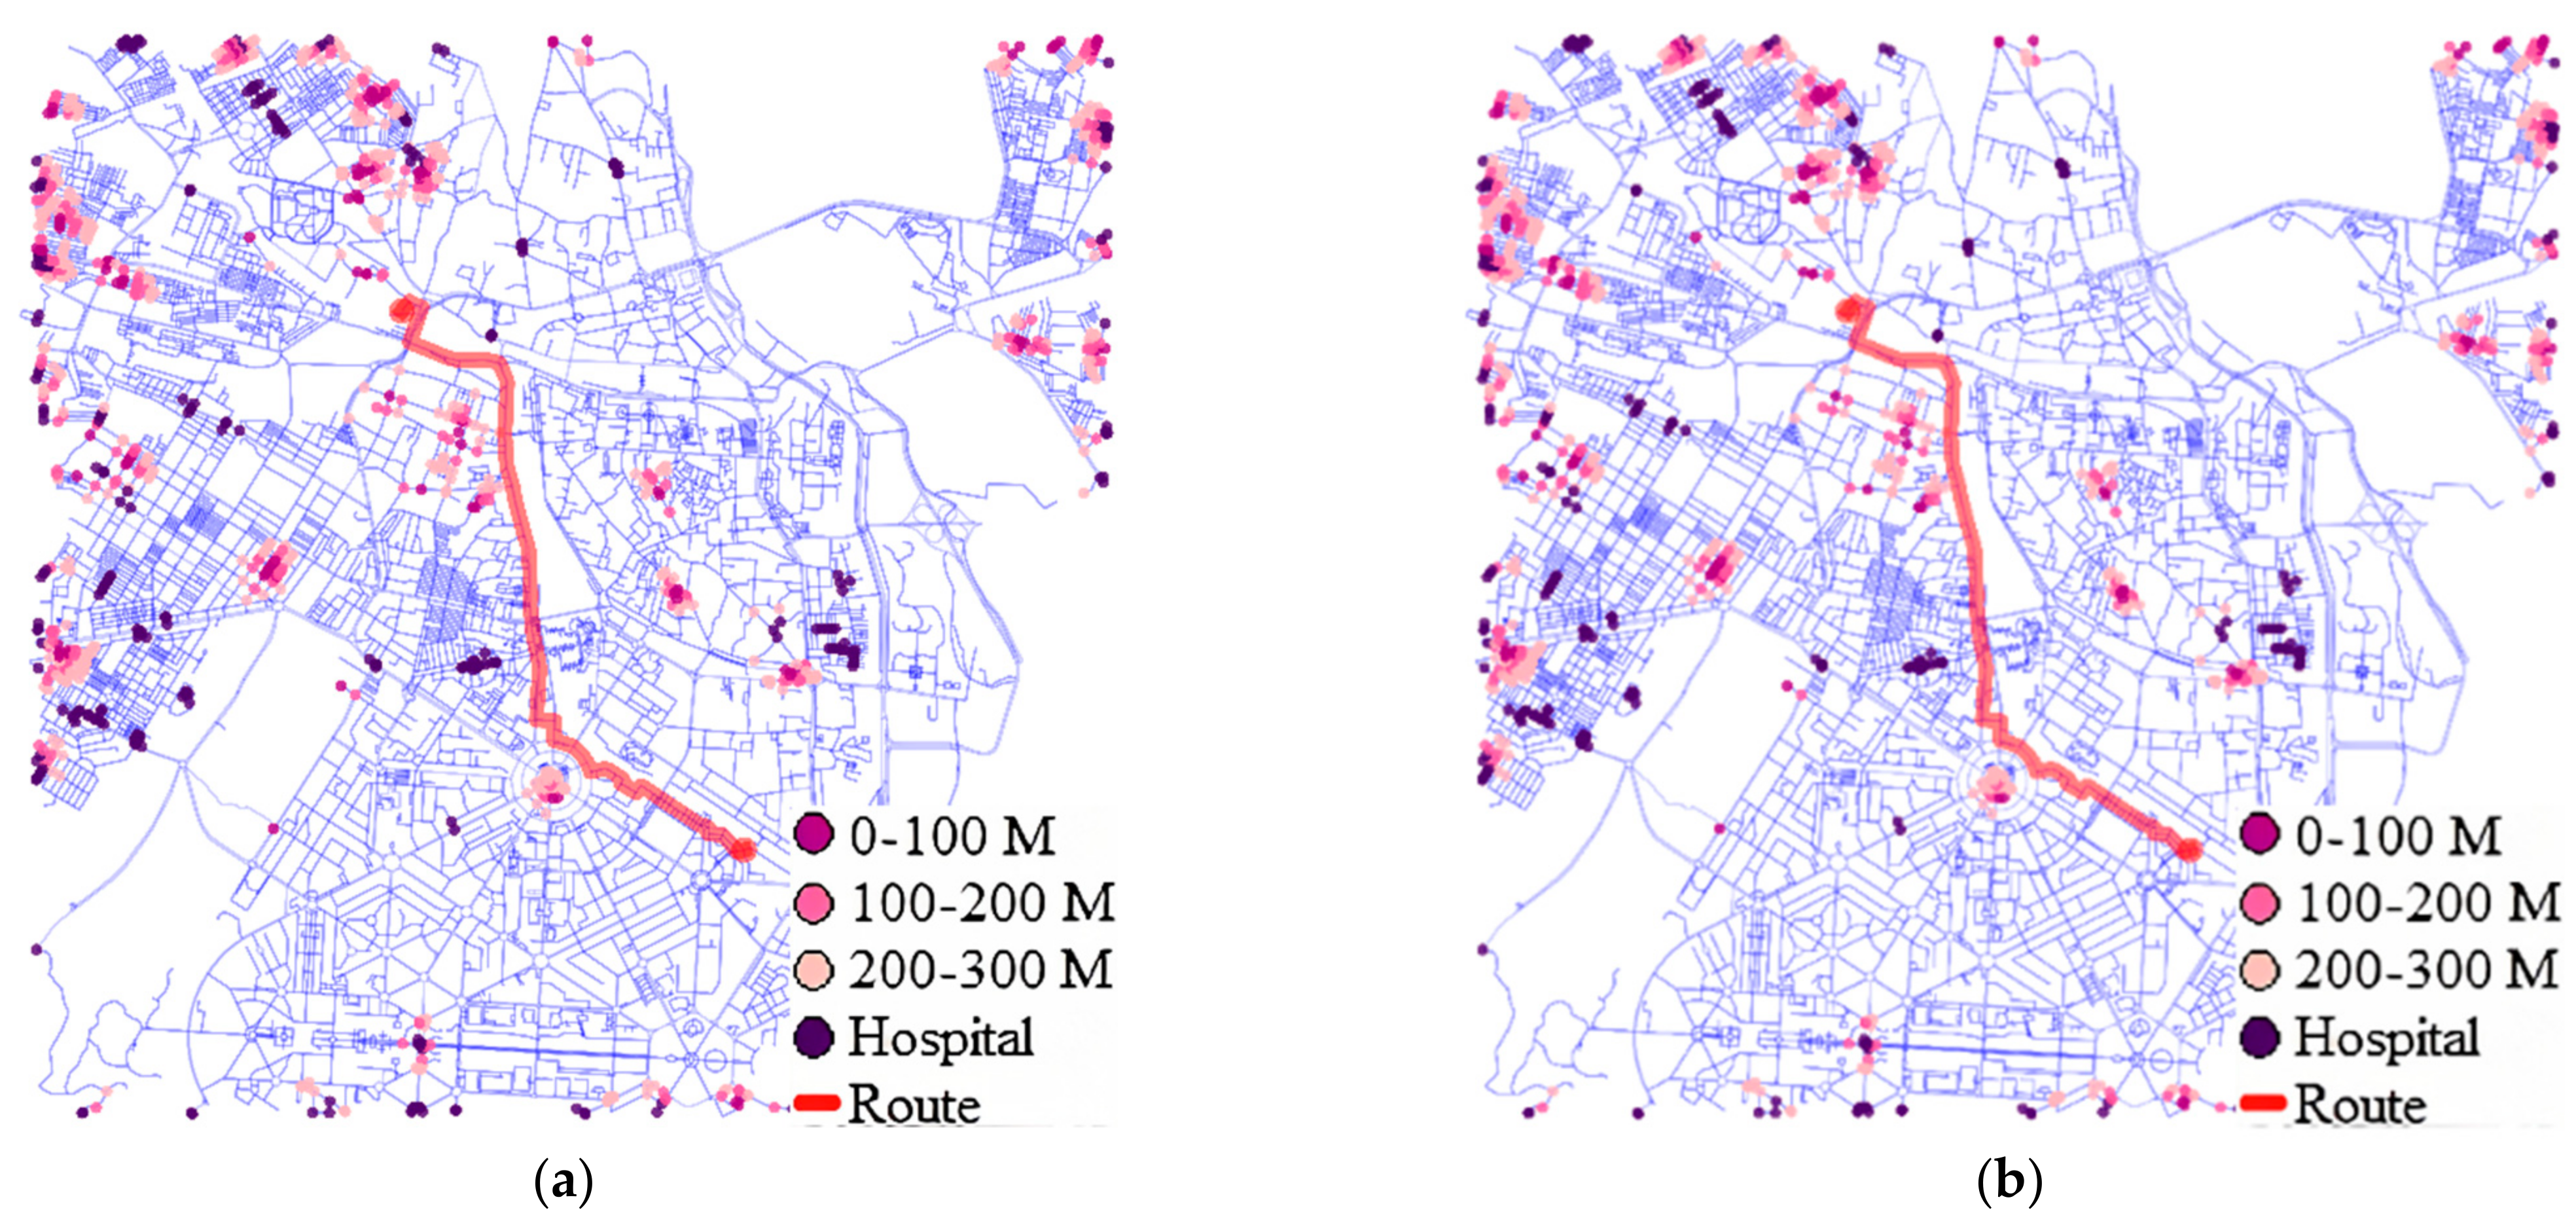
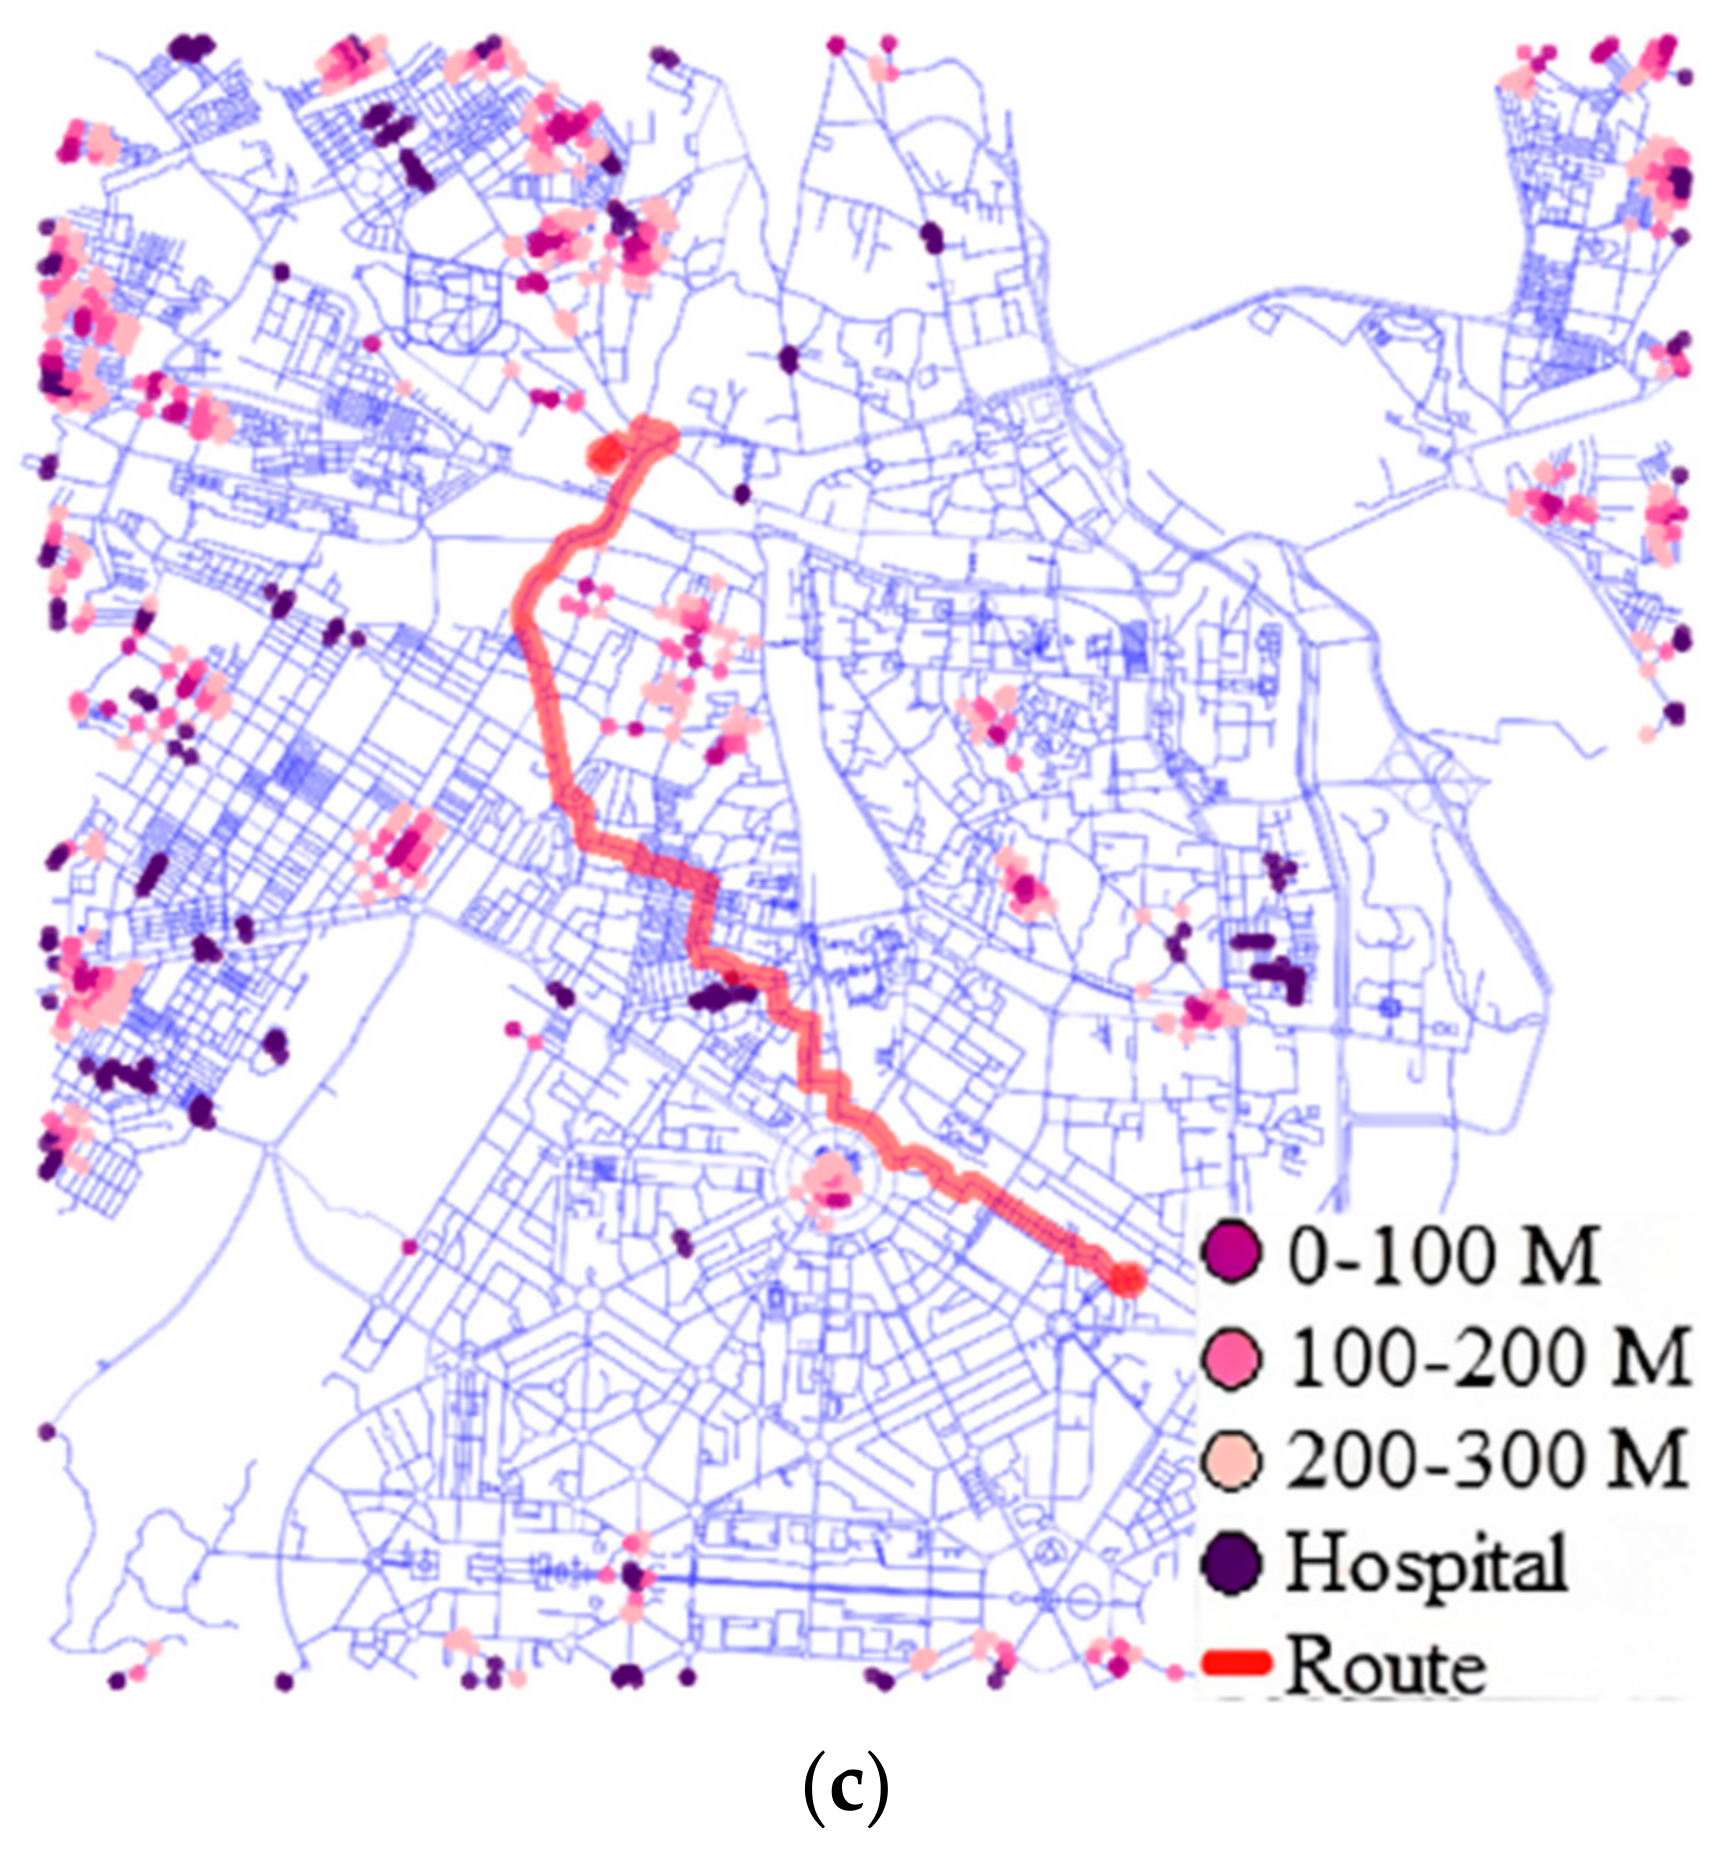
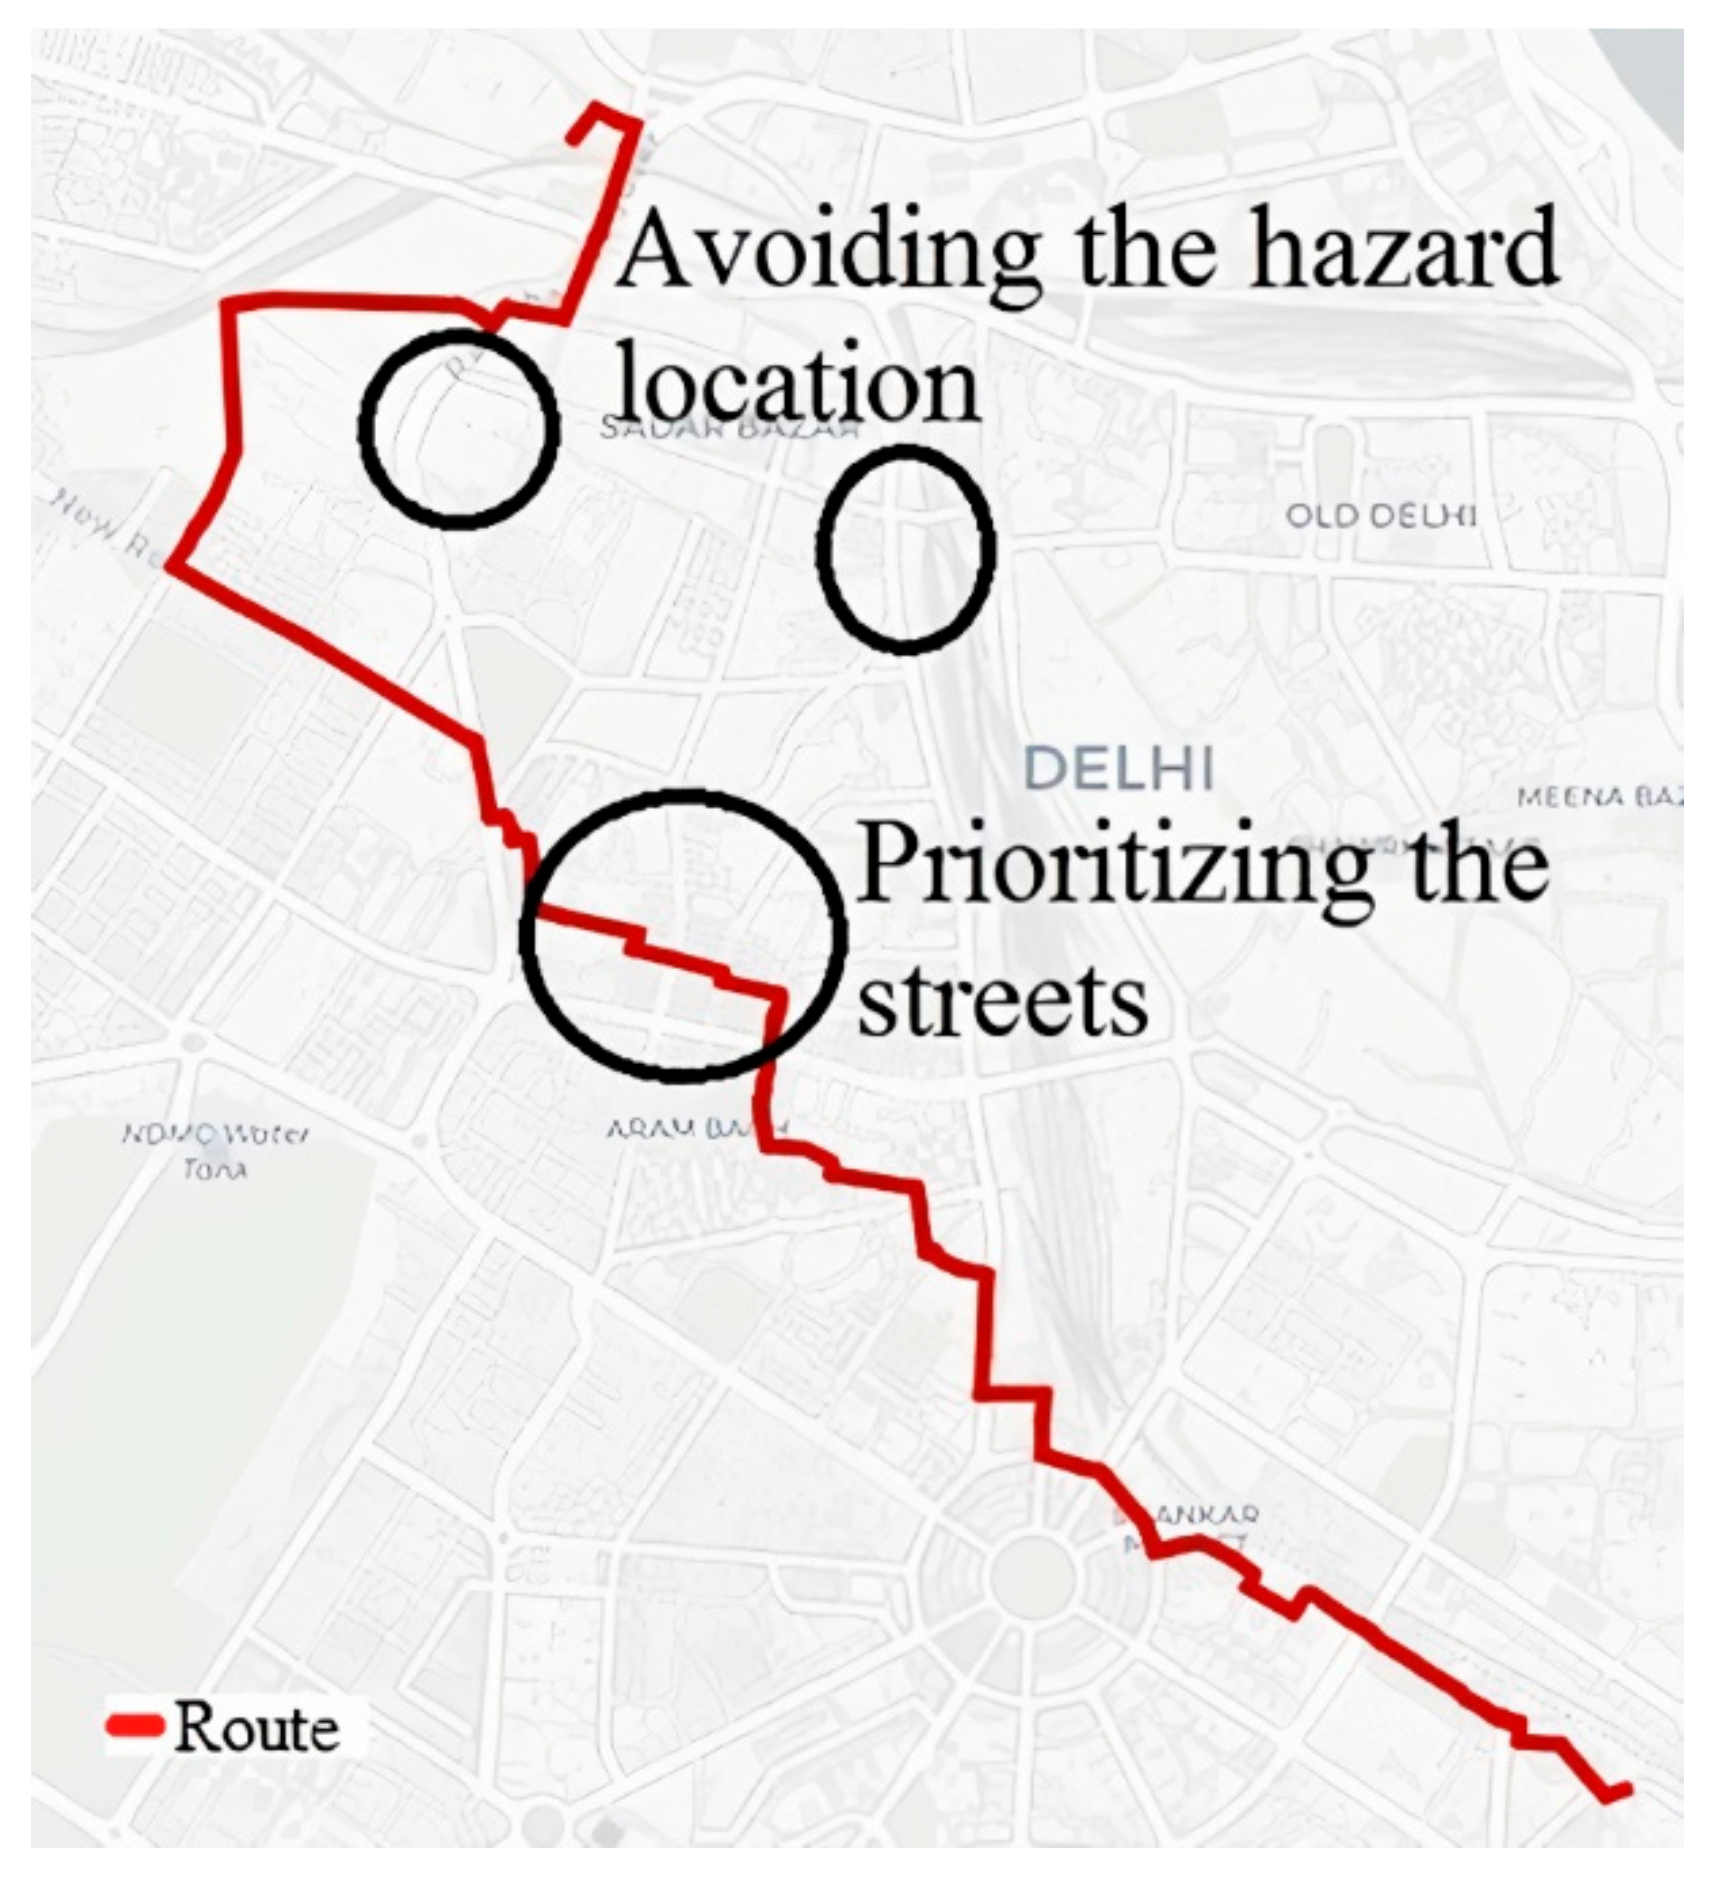
4. Route Case Study and Results

As discussed in Section 3, the required route should not be much longer than the shortest route as well as avoiding hazardous places and hospitals by choosing less connected roads. The cost of a route is a summation of all the road links costs, hence considering Equation (2), cost of a learned new-path (Cl) and cost of the shortest path (Cs) are presented in Equations (3) and (4), respectively. However, for Equations (3) and (4), weight factors (HAZ + HC + BC) of Equation (2) are taken directly without considering factors of shortest path length.
Cl   =   Length   of   new   path   + HAZ +   H C +   B C  
Cs   =   Length   of   shortest   path   + HAZ   +   HC   +   BC   .
For the learned path to be chosen: Cl < Cs. Hence:
Length   of   new   path   + HAZ +   HC +   BC <   Length   of   shortest   path   + HAZ   +   HC   +   BC ;
Length   of   new   path     Length   of   shortest   path   < HAZ +   H C +   B C HAZ +   H C +   B C .
If we put an empirical bound on new path length, it should not be more than 1.5 ∗ (Length of shortest path), thus, for maximum new path length, Equation (5) can be written as
0.5 Length   of   shortest   path < HAZ +   H C +   B C HAZ +   H C +   B C .
Moreover, if the weight of (HAZ’ + HC’ + BC’) is some factor of ‘Length of shortest path’. Therefore, we can replace ∑(HAZ’’ + HC’’ + BC’’) by X ∗ (Length of shortest path) and ∑(HAZ’ + HC’ + BC’) by Y ∗ (Length of shortest path). Thus, Equation (6) finally converts to Equation (7) below.
0.5 Length   of   shortest   path < X Length   of   shortest   path Y Length   of   shortest   path 0.5 < X     Y ,
where X is the summation of all HAZ, HC, and BC on the shortest path, and Y is the summation of all HAZ, HC, and BC on the new path. Empirically HAZ, HC, and BC should be allotted values such that if some hazard or hospital is available on all possible routes then it should select the route which is safer and also not too long compared to the shortest path. While selecting a route, it may go from less hazard prone points if the other possible route is too long in comparison to the prior. To analyze and test the proposed edge weight, we find the route between 1000 origin-destination (O-D) pairs in the Delhi region. These origin and destination pairs are chosen such that the Euclidean distance between them is between 4.5 km and 6.5 km. Dijkstra optimal route finding algorithm is used which is mainly employed by the majority of navigational systems. The average of 1000 short-route lengths as well as the average of 1000 new-routes lengths according to the proposed algorithm is noted, along with percentage change in Table 1. Hence, in general, the proposed algorithm outputs nearly comparable route lengths to that of the shortest route length.
For a given instance where origin is (28.666822, 77.207476) and destination is (28.628028, 77.235271), the shortest-route as well as the new-route according to the proposed algorithm are shown in Figure 4a,c, respectively. The resulting shortest route may include edges that have hazardous locations or nodes, whereas the resulting route from the proposed algorithm bypassed those hazardous edges instead of returning just the shortest path. Furthermore, Figure 4c and Figure 5 highlight that the proposed algorithm prioritizes the selection of streets over main roads. The shortest path length between origin and destination for this given O-D pair is 6423 m; however, for the new routes, the length is 8357 m using parameters of the first case in Table 1, and for the second and third case, it is 7161 m. The route in Figure 4b, as shown in Figure 5, avoids all the hazard points. For the optimal case, in case 2 of the table, the average increase is just 8.72% over the shortest route through risky zones, as shown in the “Percentage change” column in Table 1, which is acceptable given the risk avoided. In one of the selected sample runs shown in Figure 4, the best choice came out as a route in Figure 4b avoiding the main roads and a major COVID-19 hotspots while selecting the nodes of most outer HAZ regions, which is comparatively 17.93 percent longer than the shortest possible route lying in hot zones. After an empirical study on a 1000 different routes, we found that hyper parameters of case 2 in Table 1 are most viable and optimal considering both hazard weight (average empirical weight of new path) and length (average length of new path) are least. Further, weight component analysis is also done for the best set of weights (Case 2), for 1000 different routes. Weigh component analysis shows that maximum percentage change is attributed to inner hotspot region (0–100 m) and BC.

5. Policy Implications

To contain and facilitate relief for the COVID-19 pandemic, the Indian government invoked “The Epidemic Act of India 1897”. Clearly, at that time of initial pandemic act formation in the nineteenth century, real-time user data were hardly available. Therefore, there was no need for data-related privacy and dissemination policy formation. However, nowadays, data are a valuable commodity and fuel for every smart service. Given there are no primary guidelines nor acts on data usage that has been approved functionally by law-making bodies for facilitating pandemic applications, the policy and app architecture used by the government was somewhat slapdash and had major flaws and critical issues. The government has tried their best to alleviate such issues as soon as possible by offering open cash-prizes for searching for loopholes in the security of the Aarogya Setu application [53]. However, the initial issues cost the app credibility and users became reluctant to download it. Given the crowdsourcing requirement of contact tracing technology, it is effective only with increasing user-base. Therefore, this initial security problem hampered the technology itself. This highlights the urgent need for properly scrutinized policy and technological architecture for data usage in a pandemic, to be adopted by the government for the future post-COVID-19 world. This will help the third party and open-developer community to make smart solutions for facilitating mobility, supply-chain, medical facilitation, etc., in a pandemic time as per requirement.
To reinforce the policy decision-making scientifically, we propose an architecture for data sharing to assist COVID-19 mobility tools and related policy impact, as shown in Figure 6. It shows aspects of data sharing, contributing factors, encapsulating the whole spectrum of decision-making parameters. The presented data sharing policy architecture in Figure 6 throws critical light on the prospects of framing civic rules and regulations for pandemics such as COVID-19. As such, a multi-pronged analytical approach with well-defined systems, subsystems and modules, has been proven yet again to be most effective to tackle uncertainties, as demonstrated through the present work. Noting that, we capture the data sharing policy based solutions for such events in Figure 6, where we define how to detect, how to manage, and how to respond when struck with large-scale disturbances. We presented a generic architecture for data sharing that will have usage for mobility management information systems. The architecture comprises modules and sub-modules dedicated to different aspects of mobility and exposure contact tracing parameters. The system defines a monitoring and detection mechanism, an information management component, additional environmental parameters like spatial mapping, and a response mechanism. The information channelization happens between multiple modules such as Detection, Information management, and Response modules. It is of vital importance that the feedback loop processes the output parameters and refine the input data with each executed cycle. The detailed actions are shown in Figure 6. The system developed through the present study follows the diagrammatic flow of Figure 6 through data analysis, citation detection, technology management, hazard alertness, decision-making, and responses through dissemination. However, in the present study, the mobile COVID-19 sources are not considered and feedback for static hotspot data is done on a daily basis as is updated by the city governments. Following the discussed architecture might allow a direction for the officials to standardize data sharing policy for pandemic mobility solution integration with official COVID-19 tracking data. Given the standard data sharing policies in place, real-time update frequency is just a software development parameter that can be adjusted according to hardware processing and network connectivity. Using the system parameters in the response sub-system, micro-mobility re-routing is interpreted through hazard levels and the parameters are set for safe routing. With the help of adaptable parameters for safe micro mobility in the times of pandemics, governments can suggest various measures towards public mobility to check the spread of the situation and have better control over remedial procedures.
As of now, the main functionalities handled by the proposed solution are towards gathering cues from parameters through the static database. With data agreements, like Google and Apple’s joint effort on an Exposure Notification System [54] and also Indian government’s Aarogya Setu [53] mobile app data protection guidelines in place, the proposed system architecture can adhere to such principles. The contact tracing architecture follows the data exploitation restrictions stipulated in the formidable framework built by Google and Apple for any contact tracing app [54]. In addition to the former, India’s Aarogya Setu architecture [53] stores user location but does not provide the location data access to any third party. However, if the government agrees to share anonymous contact tracing location-range data in the form of dynamic cost for COVID-19 positive subjects then this can assist in containing COVID-19 very effectively. Respecting user privacy, the proposed system architecture can help with digital contact tracing along with smart mobility assistance thereby ensuring a safe and accurate infection spread prevention system.

6. Discussions and Future Scope

6.1. Limitations of Weight Allocation and Mobile Source Data Availability

In the present paper, for assisting micro-mobility in the COVID-19 pandemic, usage of established route search algorithms are leveraged rather than exploring the effectiveness of route search algorithm itself. Hence, for using the existing route search algorithm, weights are empirically proposed, given the mathematical intuition and analysis, to get desired safe route result. The architectural implementation level details are presented. For getting the same route results, multiple solutions of different weight components can be there with the similar proportion of smallest route length and the comparable differences between those weights. However, a critical analysis is warranted before choosing a set of weights which is presented for Delhi region.
Regarding the route model, the probable limitation can be that a given short direct ‘main-road’ route with ‘no-hotspot’ might not be selected, as our model is preferring streets over main-roads. The side route which is being selected may have an outer (200–300 m) hotspot, but as it is using side streets, the betweenness weight is balanced by the outer hotspot weight. It is a circumstantial balanced choice which the algorithm might choose as risk is involved both with the main road as well as outer hazard hotspot, but dynamic long-distance pedestrian and vehicle that may be the source and creating congestion which on other side increasing environmental exposure time is more for main road, but not side road.
Further, acquiring each individual’s location data in a much granular scale can be a great add-on for knowing where the virus is spreading and can significantly help in seclusion of the virus at a very early stage. Hence, it could help to alleviate the impact of the spread in a specific location. Knowing beforehand the places traveled by a COVID-19+ individual in the recent past could help to trace the contacts as soon as possible and with higher confidence. Recent studies on the people infected with the coronavirus have shown that 75% of them had been in close contact with someone they knew had COVID-19 [36,55]. However, presently, there is no standardized data sharing policy of the crowdsourced data collected by contact tracing technologies, hence, mobile COVID-19 sources are not considered and only static hotspot data are retrieved from the city municipality website in the present study. Hence, for considering the mobile source of COVID-19 data, we further discussed the data sharing policy framing and proposed a generic architecture.

6.2. Direction for Moving Source Info by Contact Tracing and Limitation Due to Privacy

As pointed out, having individual user’s geographic locations in a more nuanced and abstract way, a system can find routes considering mobile COVID-19 sources. However, it will be considered a privacy breach of having access to each individual’s data with such fine granularity. In [56], the authors discuss various techniques of accessing the user’s geographic data without affecting their privacy. Acquiring the user’s data in an anonymized manner could help to integrate the moving source data along with the static hotspots. The method helps in identifying the potential source of COVID-19, even if it is out and moving, hence, designing a dynamic route that warns about moving sources. However, because of security, governments are not sharing location intelligence gathered by contact tracing mobile applications. To ensure anonymity as well as to ensure COVID-19 containment, the government can provide an estimated range of moving infected-person locations by keeping individual identity anonymous. In fact, Aarogya Setu [53], a contact tracing application in India, uses previously visited locations of COVID-19 positive users for disinfecting the areas and taking other preventive measures.
Another dynamic source of COVID-19 could be crowds not obeying social distancing. The dynamic weight factors of crowds can be added in the proposed mobility assisting system for allotment of a safe route. For that, the source could be video surveillance hardware setup, like the Delhi government’s recently installed 140,000 CCTV cameras at public places to curb the surge in petty crimes [57]. These cameras can easily be installed with crowd-count software calculating the footfalls passing through a specific location, hence density calculation of the crowd in various edges of the network which could advise the user to avoid those roads or streets.
The usage and detection efficacy of contact tracing technologies in mobility is an open question that is being studied and apparently shows positive correlation with COVID-19 cases [58], the efficacy of contact tracing technology could prove to be the best available mobile source tracker. However, standardized architecture for anonymous-data sharing is needed that can improve accessibility of such technology to third parties for assisting micro-mobility in pandemics. For example, the presented routing algorithm is considering static weights, however, dynamic weight from anonymous location intelligence can boost application efficacy of such kinds of mobility solutions. A standard data sharing architecture can help governments to frame usage policies of such monitoring data. The monitoring data should be changed to area specific hash codes for hiding individual identities and consider providing intelligence on location or buffer zones in a collective manner. Therefore, governments can unworriedly encourage usage of zonal contact tracing data of mobiles collectively tracked within a local area without zeroing in on any particular mobile’s details, thereby ensuring community protection in data.

7. Conclusions

The proposed system implements a very timely and vital solution to mobility issues in densely populated regions such as India, based on data analytics and crowdsourced data. The paper lays down some facts of open data usability with privacy, security, and anonymity, thereby justifying policy-making sans worries. The pilot study has proven that the system works and future directions are expanded upon. Work is ongoing towards implementing dynamic route allotment using government data and other proprietary data that agree to terms of privacy protection and non-disclosure of personal information. The present work establishes algorithmic approaches to deduce safe paths for the mobility of pedestrians and cyclists. The scope of the study included test cases run in simulation at several locations in Delhi, India. These can be effectively scaled up for use in other places. The paper discussed the technicality of our objective function to assist in smart mobility and the studies found the function workable. The currently proposed system has deployed pandemic specific low processing mobility solutions and notification of exposure, without burdening itself with competing objectives for best route solution. Once governmental data transparency acts are established, the system proposed information management architecture for dynamic road weight calculation would incrementally become more accurate and versatile. For the same, a generic architecture is suggested that can be adopted by governments after scrutiny in the post-COVID-19 era for future pandemic assistance. The study helps policy making by demonstrating data protection to frame usage policies of such monitoring data through algorithms that hide personal details, thereby leaving it on location or buffer zones in a collective manner, based on cost. The policies can have provisions to encourage research based usage of zonal contact tracing data of mobiles collectively tracked within a local area without bringing up any particular mobile’s details, thereby ensuring crowd data protection.

Author Contributions

Conceptualization, Sumit Mishra and Devanjan Bhattacharya; methodology, Sumit Mishra; software, Sumit Mishra and Nikhil Singh; validation, Sumit Mishra and Devanjan Bhattacharya; formal analysis, Sumit Mishra and Devanjan Bhattacharya; investigation, Sumit Mishra and Devanjan Bhattacharya; resources, Sumit Mishra and Devanjan Bhattacharya; data curation, Sumit Mishra and Nikhil Singh; writing—original draft preparation, Sumit Mishra; writing—review and editing, Devanjan Bhattacharya; visualization, Sumit Mishra and Nikhil Singh; project administration, Devanjan Bhattacharya; funding acquisition, Devanjan Bhattacharya All authors have read and agreed to the published version of the manuscript.

Funding

The work has been a part of the project “Increasing safety and sustainability of micro-mobility modes in pandemic—MobilitySafe” funded by UKRI ESRC Impact acceleration grant, University of Edinburgh (grant reference ES/T50189X/1) and the APC was funded by University of Edinburgh. D.B. has been funded by the European Union’s Horizon 2020 research and innovation programme under the Marie Skłodowska-Curie COFUND grant agreement No. 801215: TRAIN@Ed: Transnational Research AND Innovation Network At Edinburgh, and the Edinburgh and South East Scotland City Region Deal Data-Driven Innovation Initiative.

Institutional Review Board Statement

Not applicable.

Acknowledgments

S.M. wants to acknowledge Luiz Felipe Vecchietti at KAIST for the stimulating discussion and expert insights. D.B. thanks University of Edinburgh, UKRI and EU H2020 TRAIN@ED for the support received.

Conflicts of Interest

The authors declare no conflict of interest.

References

  1. Gatalo, O.; Tseng, K.; Hamilton, A.; Lin, G.; Klein, E. Associations between phone mobility data and COVID-19 cases. Lancet Infect. Dis. 2021, 21, e111. [Google Scholar] [CrossRef]
  2. Li, A.; Zhao, P.; He, H.; Axhausen, K.W. Understanding the Variations of Micromobility Behavior before and During COVID-19 Pandemic Period. Arbeitsberichte Verkehrsund Raumplanung. 2020, Volume 1547, IVT, ETH Zurich. Available online: https://www.research-collection.ethz.ch:443/handle/20.500.11850/430395 (accessed on 14 July 2021).
  3. Aloi, A.; Alonso, B.; Benavente, J.; Cordera, R.; Echániz, E.; González, F.; Ladisa, C.; Lezama-Romanelli, R.; López-Parra, Á.; Mazzei, V.; et al. Effects of the COVID-19 Lockdown on Urban Mobility: Empirical Evidence from the City of Santander (Spain). Sustainability 2020, 12, 3870. [Google Scholar] [CrossRef]
  4. Martellucci, C.A.; Sah, R.; Rabaan, A.A.; Dhama, K.; Casalone, C.; Arteaga-Livias, K.; Sawano, T.; Ozaki, A.; Bhandari, D.; Higuchi, A.; et al. Changes in the spatial dis-tribution of COVID-19 incidence in Italy using GIS-based maps. Ann. Clin. Microbiol. Antimicrob. 2020, 19, 1–4. [Google Scholar] [CrossRef]
  5. Khanal, L.; Paudel, B.K.; Acharya, B.K. Community vulnerability to epidemics in Nepal A high-resolution spatial assessment amidst COVID-19 pandemic. Nepal. J. Zool. 2020, 4, 23–35. [Google Scholar] [CrossRef]
  6. Ramírez, I.J.; Lee, J. COVID-19 Emergence and Social and Health Determinants in Colorado: A Rapid Spatial Analysis. Int. J. Environ. Res. Public Health 2020, 17, 3856. [Google Scholar] [CrossRef] [PubMed]
  7. Boulos, M.N.K.; Geraghty, E.M. Geographical tracking and mapping of coronavirus disease COVID-19/severe acute respiratory syndrome coro-navirus 2 (SARS-CoV-2) epidemic and associated events around the world: How 21st century GIS technologies are supporting the global fight against outbr. Int. J. Health Geogr. 2020, 19, 1–12. [Google Scholar] [CrossRef]
  8. Zhou, C.; Su, F.; Pei, T.; Zhang, A.; Du, Y.; Luo, B. Geography and Sustainability COVID-19: Challenges to GIS with Big Data. Geogr. Sustain. 2020, 1, 77–87. [Google Scholar] [CrossRef]
  9. Konečný, V.; Brídziková, M.; Senko, Š. Impact of COVID-19 and Anti-Pandemic Measures on the Sustainability of Demand in Suburban Bus Transport. The Case of the Slovak Republic. Sustainability 2021, 13, 4967. [Google Scholar] [CrossRef]
  10. Murugesan, B.; Karuppannan, S.; Mengistie, A.T.; Ranganathan, M.; Gopalakrishnan, G. Distribution and Trend Analysis of COVID-19 in India: Geo-spatial Approach. J. Geogr. Stud. 2020, 4, 1–9. [Google Scholar] [CrossRef]
  11. Hosseinzadeh, A.; Kluger, R. Analyzing the Impact of COVID-19 Pandemic on Micromobility Transportation. In Proceedings of the International Conference on Transportation and Development 2021, American Society of Civil Engineers (ASCE), Virtual Conference, 8–10 June 2021; pp. 52–60. [Google Scholar]
  12. Campisi, T.; Basbas, S.; Skoufas, A.; Akgün, N.; Ticali, D.; Tesoriere, G. The Impact of COVID-19 Pandemic on the Resilience of Sustainable Mobility in Sicily. Sustainability 2020, 12, 8829. [Google Scholar] [CrossRef]
  13. Praharaj, S.; Han, H. A longitudinal study of the impact of human mobility on the incidence of COVID-19 in India. medRxiv 2020. [Google Scholar] [CrossRef]
  14. Li, A.; Zhao, P.; Haitao, H.; Mansourian, A.; Axhausen, K.W. How Did Micro-Mobility Change in Response to COVID-19 Pandemic? Arbeitsberichte Verkehrs-und Raumplanung, 1601. Available online: https://www.research-collection.ethz.ch:443/handle/20.500.11850/458649 (accessed on 14 July 2021).
  15. Moraci, F.; Errigo, M.; Fazia, C.; Campisi, T.; Castelli, F. Cities under Pressure: Strategies and Tools to Face Climate Change and Pandemic. Sustainability 2020, 12, 7743. [Google Scholar] [CrossRef]
  16. Mishra, S.; Bhattacharya, D.; Gupta, A. Congestion Adaptive Traffic Light Control and Notification Architecture Using Google Maps APIs. Data 2018, 3, 67. [Google Scholar] [CrossRef] [Green Version]
  17. Mishra, S.; Kushwaha, A.; Aggrawal, D.; Gupta, A. Comparative emission study by real-time congestion monitoring for stable pollution policy on temporal and meso-spatial regions in Delhi. J. Clean. Prod. 2019, 224, 465–478. [Google Scholar] [CrossRef]
  18. Bhattacharya, D.; Painho, M.; Mishra, S.; Gupta, A. Mobile traffic alert and tourist route guidance system design using geospatial data. Int. Arch. Photogramm. Remote Sens. Spat. Inf. Sci. ISPRS Arch. 2017, 42, 11–18. [Google Scholar] [CrossRef] [Green Version]
  19. Boom Time for Bikes? (n.d.). Available online: https://www.cyclinguk.org/article/boom-time-bikes (accessed on 14 July 2020).
  20. Moreno, C.; Allam, Z.; Chabaud, D.; Gall, C.; Pratlong, F. Introducing the “15-Minute City”: Sustainability, Resilience and Place Identity in Future Post-Pandemic Cities. Smart Cities 2021, 4, 93–111. [Google Scholar] [CrossRef]
  21. Jiang, Y.; Huang, X.; Li, Z. Spatiotemporal Patterns of Human Mobility and Its Association with Land Use Types during COVID-19 in New York City. ISPRS Int. J. Geo-Inf. 2021, 10, 344. [Google Scholar] [CrossRef]
  22. Udroiu, R.; Deaconu, A.; Nanau, C.S. Data Delivery in a Disaster or Quarantined Area Divided into Triangles Using DTN-Based Algorithms for Unmanned Aerial Vehicles. Sensors 2021, 21, 3572. [Google Scholar] [CrossRef]
  23. Tomás, R.; Fernandes, P.; Macedo, J.; Coelho, M. Carpooling as an Immediate Strategy to Post-Lockdown Mobility: A Case Study in University Campuses. Sustainability 2021, 13, 5512. [Google Scholar] [CrossRef]
  24. Bherwani, H.; Anjum, S.; Kumar, S.; Gautam, S.; Gupta, A.; Kumbhare, H.; Anshul, A.; Kumar, R. Understanding COVID-19 transmission through Bayesian probabilistic modeling and GIS-based Voronoi approach: A policy perspective. Environ. Dev. Sustain. 2021, 23, 5846–5864. [Google Scholar] [CrossRef]
  25. Kanga, S.; Sudhanshu; Meraj, G.; Farooq, M.; Nathawat, M.S.; Singh, S.K. Reporting the management of COVID-19 threat in India using remote sensing and GIS based approach. Geocarto Int. 2020, 1–8. [Google Scholar] [CrossRef]
  26. Zhang, C.H.; Schwartz, G.G. Spatial Disparities in Coronavirus Incidence and Mortality in the United States: An Ecological Analysis as of May 2020. J. Rural. Health 2020, 36, 433–445. [Google Scholar] [CrossRef] [PubMed]
  27. Smith, C.D.; Mennis, J. Incorporating Geographic Information Science and Technology in Response to the COVID-19 Pandemic. Prev. Chronic Dis. 2020, 17, E58. [Google Scholar] [CrossRef] [PubMed]
  28. Andrade, L.A.; Gomes, D.S.; Góes, M.A.D.O.; De Souza, M.S.F.; Teixeira, D.C.P.; Ribeiro, C.J.N.; Alves, J.A.B.; De Araújo, K.C.G.M.; Dos Santos, A.D. Surveillance of the first cases of COVID-19 in Sergipe using a prospective spatiotemporal analysis: The spatial dispersion and its public health implications. Rev. Soc. Bras. Med. Trop. 2020, 53, e20200287. [Google Scholar] [CrossRef]
  29. Rivera, E.N.B.; Esteves, A.J.F.; López, F.E.A.; Vásquez, P.H.V.; Acuña, M.S.M. Environmental and social analysis as risk factors for the spread of the novel coronavirus (SARS-CoV-2) using remote sensing, GIS and analytical hierarchy process (AHP): Case of Peru. medRxiv 2020. [Google Scholar] [CrossRef]
  30. TERI, Impact of COVID-19 on Urban Mobility in India: Evidence from a Perception Study. New Delhi. The Energy and Resources Institute (TERI). 2020. Available online: https://www.teriin.org/sites/default/files/2020-05/behavioural-effects-covid19_0.pdf (accessed on 14 July 2021).
  31. Liang, K.Y.; Zeger, S.L. Longitudinal data analysis using generalized linear models. Biometrika 1986, 73, 13–22. [Google Scholar] [CrossRef]
  32. Moslem, S.; Campisi, T.; Szmelter-Jarosz, A.; Duleba, S.; Nahiduzzaman, K.; Tesoriere, G. Best–Worst Method for Modelling Mobility Choice after COVID-19: Evidence from Italy. Sustainability 2020, 12, 6824. [Google Scholar] [CrossRef]
  33. Roychowdhury, A.; Das, A.; Ray, S.; Srivastav, S.; Gupta, S. Pandemic and Mobility: Lessons from the COVID-19 Crisis for Building Solutions, Centre for Science and Environment, New Delhi. 2020. Available online: http://www.indiaenvironmentportal.org.in/files/file/pandemic-mobility-CSE-paper.pdf (accessed on 14 July 2021).
  34. Bhattacharyya, R.; Bhaduri, R.; Kundu, R.; Salvatore, M.; Mukherjee, B. Reconciling epidemiological models with misclassified case-counts for SARS-CoV-2 with seroprevalence surveys: A case study in Delhi, India. MedRxiv 2020. [Google Scholar] [CrossRef]
  35. COVID-19 Community Mobility Report. (n.d.). Available online: https://www.google.com/covid19/mobility/ (accessed on 12 July 2020).
  36. COVID19 INDIA Tracker. (n.d.). Available online: https://www.covid19india.org/state/DL (accessed on 12 July 2020).
  37. Boeing, G. OSMnx: New methods for acquiring, constructing, analyzing, and visualizing complex street networks. Comput. Environ. Urban Syst. 2017, 65, 126–139. [Google Scholar] [CrossRef] [Green Version]
  38. Wu, Q. geemap: A Python package for interactive mapping with Google Earth Engine. J. Open Source Softw. 2020, 5, 2305. [Google Scholar] [CrossRef]
  39. Barrington-Leigh, C.; Millard-Ball, A. Correction: The world’s user-generated road map is more than 80% complete. PLoS ONE 2019, 14, e0224742. [Google Scholar] [CrossRef]
  40. Jalali, R.; Vaisi-Raygani, A.; Khaledi-Paveh, B.; Salari, N.; Mohammadi, M.; Sabbaghchi, M. Geographic information system (GIS): A reliable tool for monitoring COVID-19 in Iran and the world. J. Military Med. 2020, 22, 216–220. [Google Scholar] [CrossRef]
  41. Hagberg, A.; Swart, P.; Chult, D.S. Exploring Network Structure, Dynamics, and Function Using NetworkX (No. LA-UR-08-05495; LA-UR-08-5495); Los Alamos National Lab. (LANL): Los Alamos, NM, USA, 2008. [Google Scholar]
  42. GeoPandas 0.9.0. GeoPandas 0.9.0 - GeoPandas 0.9.0 documentation. (n.d.). Available online: https://geopandas.org/ (accessed on 14 July 2021).
  43. Delhi Containment Zones. (n.d.). Available online: http://revenue.delhi.gov.in/wps/wcm/connect/doit_revenue/Revenue/Home/Containment+Zone (accessed on 12 July 2020).
  44. Hospitals in New Delhi. (n.d.). Available online: https://www.medifee.com/hospitals-in-new-delhi (accessed on 14 August 2020).
  45. Gao, S.; Rao, J.; Kang, Y.; Liang, Y.; Kruse, J. Mapping county-level mobility pattern changes in the United States in response to COVID-19. SIG-SPATIAL Spec. 2020, 12, 16–26. [Google Scholar] [CrossRef]
  46. O’Sullivan, D.; Gahegan, M.; Exeter, D.J.; Adams, B. Spatially explicit models for exploring COVID-19 lockdown strategies. Trans. GIS 2020, 24, 967–1000. [Google Scholar] [CrossRef]
  47. Visualization with Python. (n.d.). Available online: https://matplotlib.org/ (accessed on 14 August 2020).
  48. Brandes, U. On variants of shortest-path betweenness centrality and their generic computation. Soc. Netw. 2008, 30, 136–145. [Google Scholar] [CrossRef] [Green Version]
  49. Liu, Y.; Wei, X.; Jiao, L.; Wang, H. Relationships between Street Centrality and Land Use Intensity in Wuhan, China. J. Urban Plan. Dev. 2016, 142, 05015001. [Google Scholar] [CrossRef]
  50. Shah, P.; Patel, C.R. Prevention is Better than Cure: An Application of Big Data and Geospatial Technology in Mitigating Pandemic. Trans. Indian Natl. Acad. Eng. 2020, 5, 187–192. [Google Scholar] [CrossRef]
  51. Mollalo, A.; Vahedi, B.; Rivera, K.M. GIS-based spatial modeling of COVID-19 incidence rate in the continental United States. Sci. Total Environ. 2020, 728, 138884. [Google Scholar] [CrossRef] [PubMed]
  52. Macfarlane, J. When apps rule the road: The proliferation of navigation apps is causing traffic chaos. It’s time to restore order. IEEE Spectr. 2019, 56, 22–27. [Google Scholar] [CrossRef]
  53. Aarogya Setu Mobile App. (n.d.). Available online: https://www.mygov.in/aarogya-setu-app/ (accessed on 14 August 2020).
  54. Exposure Notifications: Helping Fight COVID-19. (n.d.). Available online: https://www.google.com/covid19/exposurenotifications/ (accessed on 14 August 2020).
  55. Oliver, N.; Barber, X.; Roomp, K.; Roomp, K. The Covid19 Impact Survey: Assessing the Pulse of the COVID-19 Pandemic in Spain via 24 questions. arXiv 2020, arXiv:2004.01014. [Google Scholar]
  56. Nanni, M.; Andrienko, G.; Barabási, A.-L.; Boldrini, C.; Bonchi, F.; Cattuto, C.; Chiaromonte, F.; Comandé, G.; Conti, M.; Coté, M.; et al. Give more data, awareness and control to individual citizens, and they will help COVID-19 containment. arXiv 2020, arXiv:2004.05222. [Google Scholar]
  57. Anand, A. Installation of 1.4 Lakh Chinese CCTV Cameras by Delhi Govt Sparks Row. 12 July 2020. Available online: https://www.indiatoday.in/mail-today/story/installation-of-1-4-lakh-chinese-cctv-cameras-by-delhi-govt-sparks-row-1696032-2020-07-02 (accessed on 14 August 2020).
  58. Asad, A.; Srivastava, S.; Verma, M.K. Evolution of COVID-19 Pandemic in India. Trans. Indian Natl. Acad. Eng. 2020, 5, 711–718. [Google Scholar] [CrossRef]
Figure 1. Mobility Trends in Delhi, percentage change in comparison to pre-COVID-19 time.
Ijgi 10 00571 g001
Figure 2. An overview of the steps followed in the study for safe micro-mobility in pandemic, starting with data collection, spatial analysis, situation determination, and new route suggestion.
Ijgi 10 00571 g002
Figure 3. (a) Hospital and hotspot zone marked nodes in Delhi region. (b) A zoomed-in view of a region in Delhi. (c) Interactive visualization using the Folium library.
Ijgi 10 00571 g003aIjgi 10 00571 g003b
Figure 4. (a) Shortest path between origin and destination. (b) New-path between origin and destination based on case 1 of Table 1. (c) New-path between origin and destination based on case 2 of Table 1.
Ijgi 10 00571 g004aIjgi 10 00571 g004b
Figure 5. Map visualization and highlighted diversion.
Ijgi 10 00571 g005
Figure 6. Systemic approach to analyze policy making for micro-mobility during pandemics.
Ijgi 10 00571 g006
Table 1. Cost function hyper parameters analysis for 1000 different path lengths.
CaseHAZ
(for 0–100m)
HAZ
(for 100–200 m)
HAZ
(for 200–300 m)
HCBC (Max Range)Average Length of Shortest PathsAverage Length of New PathAverage Empirical Weight of New PathPercentage
Change
1.0.50.40.30.20.157184.908448.7613906.4917.59
2.0.20.160.120.080.067184.907814.7110378.138.76
3.0.30.240.180.120.097184.908019.7711612.9811.61
Weight Component analysis of Case 20.200007184.907415.537733.143.20
00.160007184.907289.067390.291.45
000.12007184.907259.957303.331.04
0000.0807184.907240.827324.480.78
00000.067184.907533.219024.404.85
0.20.160.12007184.907461.498114.773.85
Publisher’s Note: MDPI stays neutral with regard to jurisdictional claims in published maps and institutional affiliations.

