In this study, the CCH/CKB medical building was taken as the major research field. In the physical investigation, the outpatient areas from the first basement floor to the second floor of the medical building were used as the experiment site. In the first part of the study, we investigated the distribution and location of consultation rooms and examination rooms in the outpatient areas and recorded the type of signage and locations, then we applied space syntax to draw the paths and routes to anticipate the user behavior tendency and visual concentration areas. The experimental results of the participants’ wayfinding tasks were compared to the analysis results predicted by space syntax, to see if they are consistent. Finally, we applied axial mapping analysis and isovist analysis to make a consolidated summary in order to give suggestions on planning the wayfinding system at the research field.
4.1. Outpatient Areas Space Configuration and Signage Forms
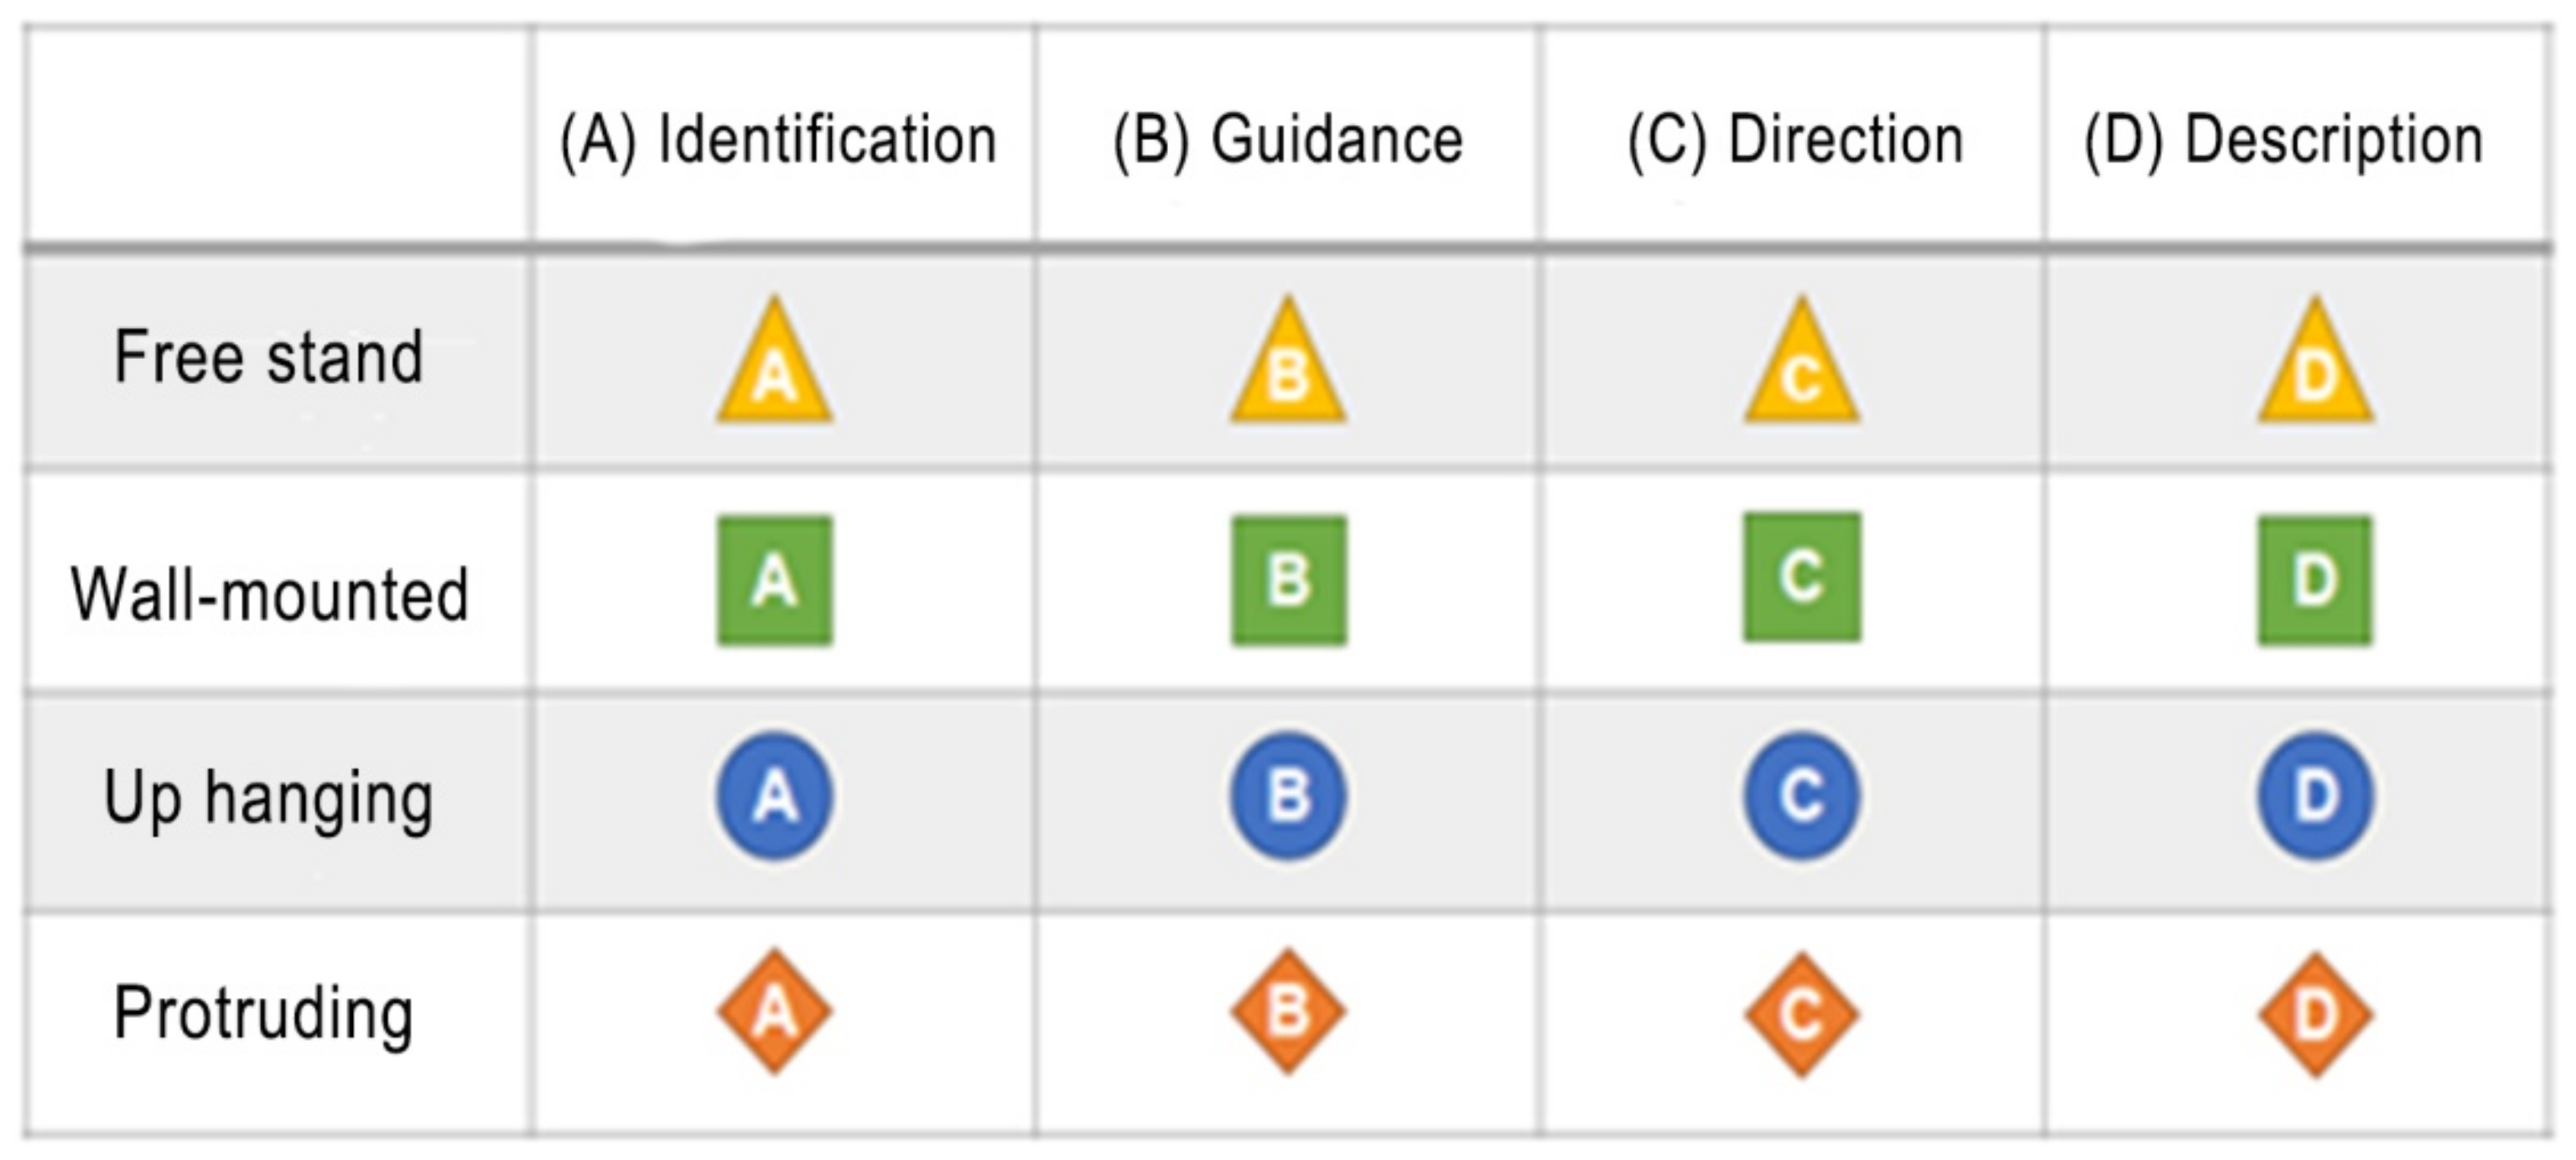
In this paper, we first analyzed and annotated the signage configuration and forms from the first basement floor to the second floor of the outpatient areas of the building, and used different symbols to represent the different attributes of the signage, and finally summarized them into two major blocks: (1) the contents of the signage: identification, guidance, direction and description, in total four types (
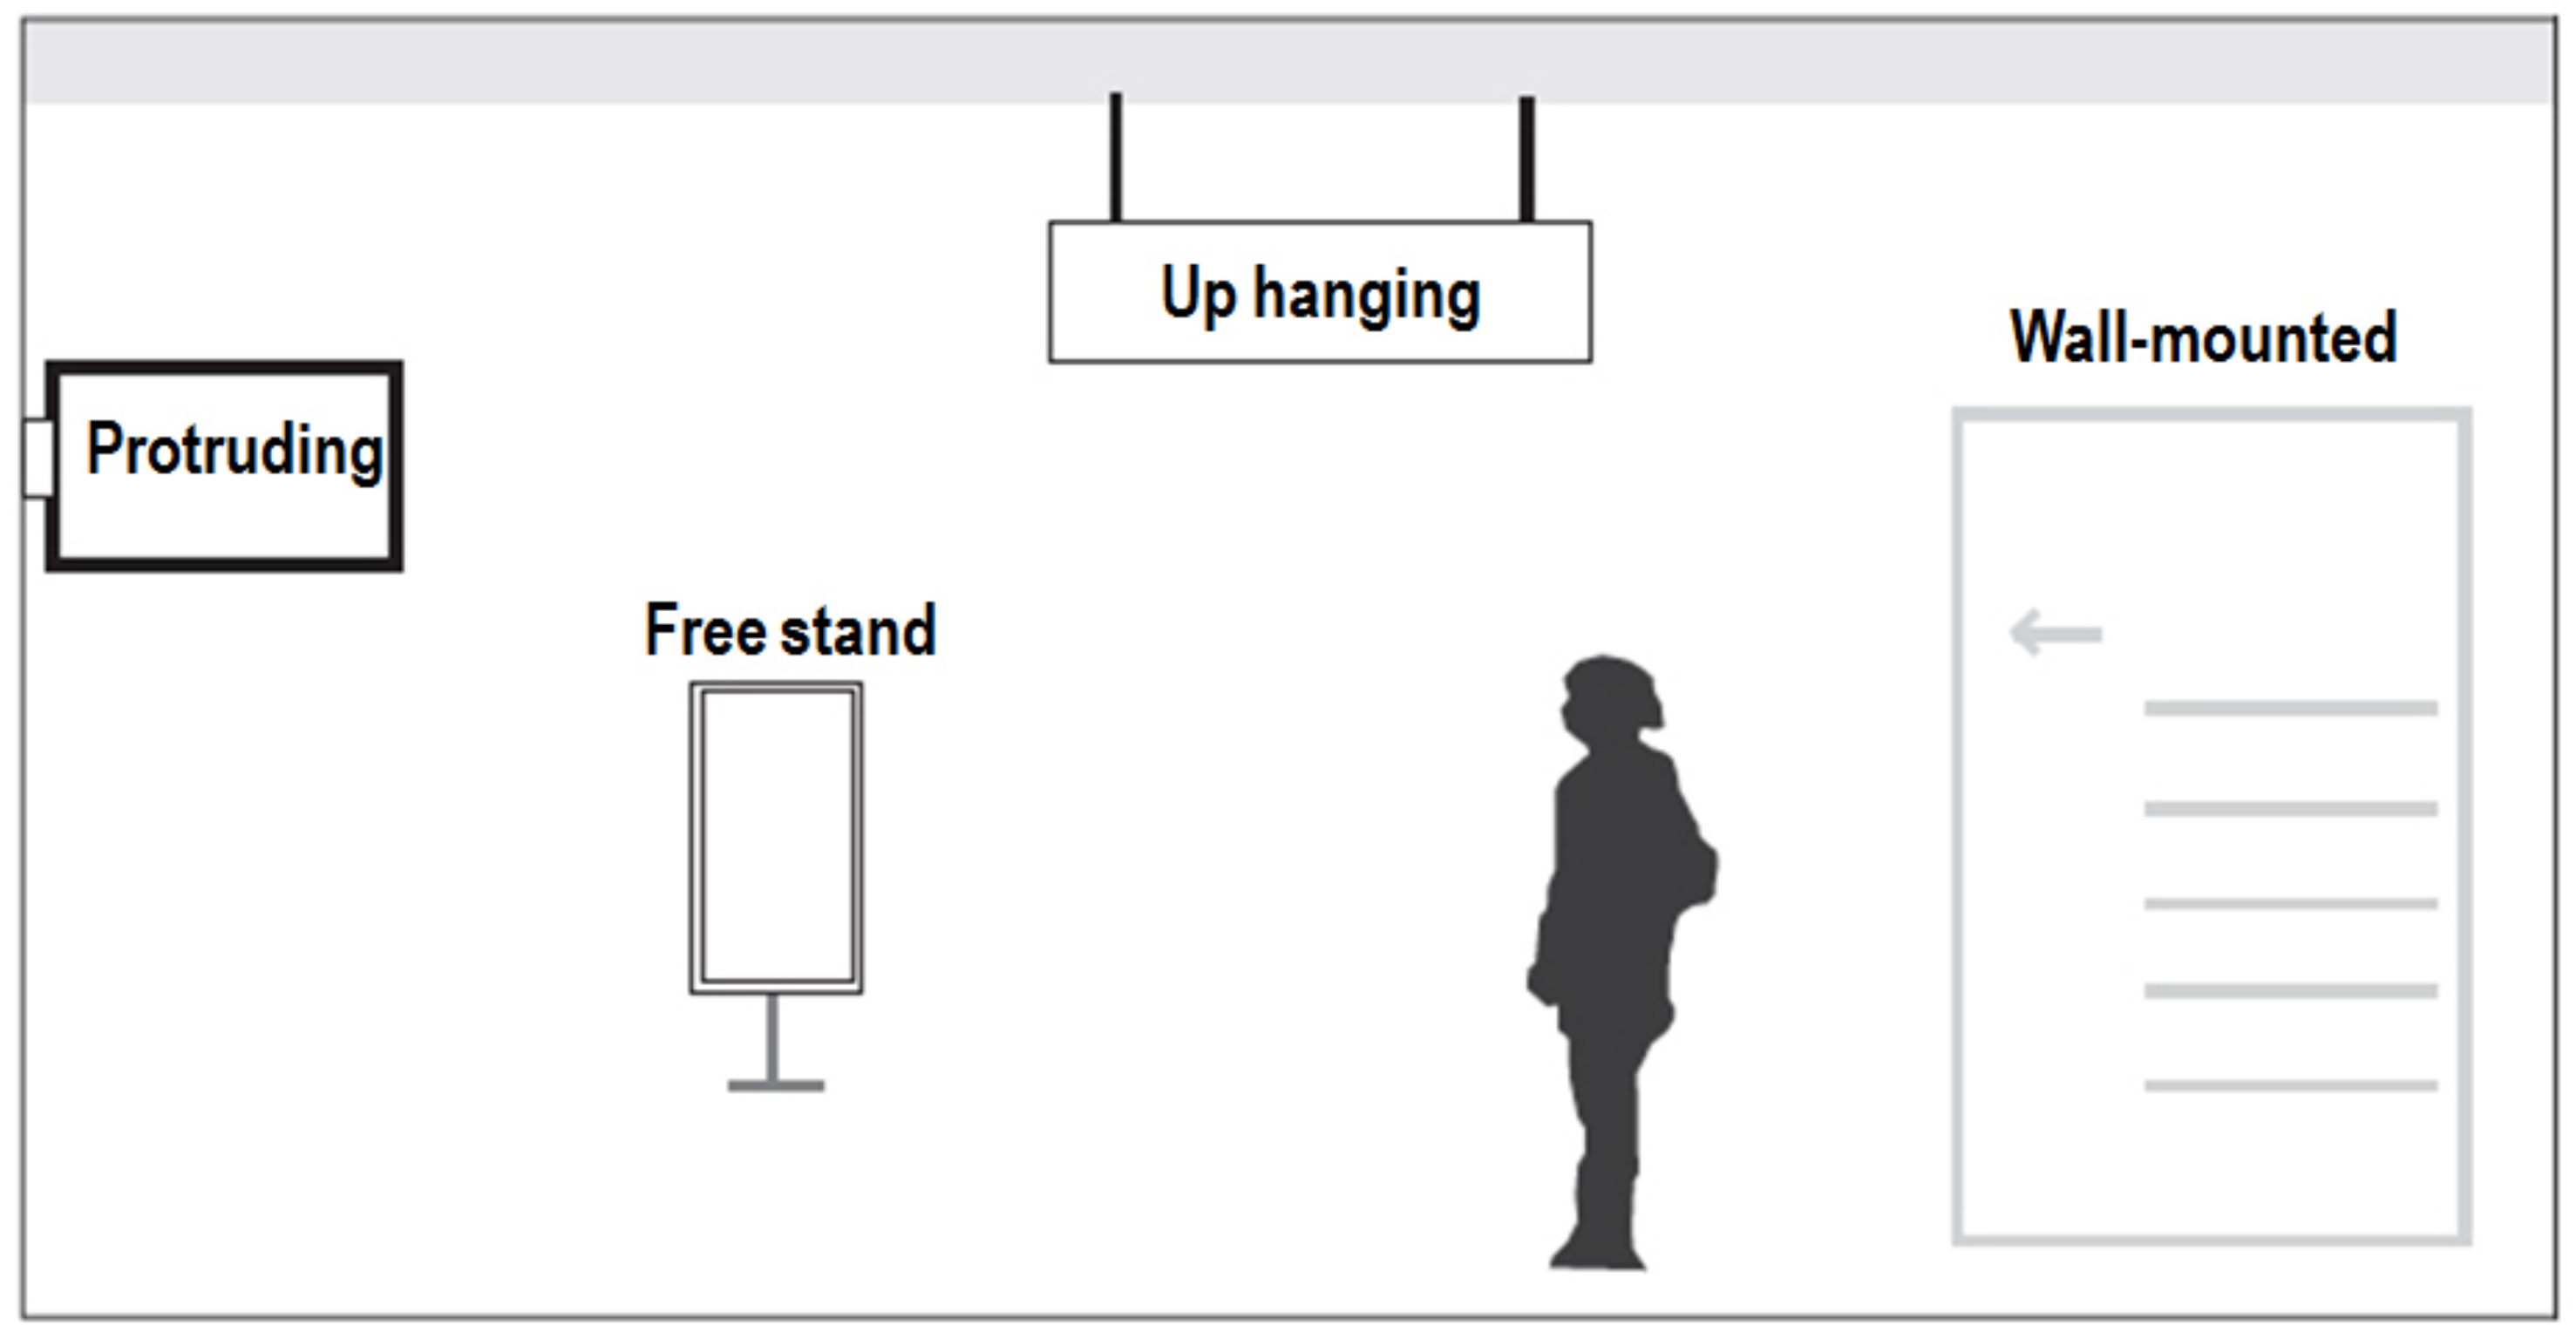
Figure 3); (2) the forms of the signage: free stand, up hanging, protruding and wall-mounted, in total four types (
Figure 4).
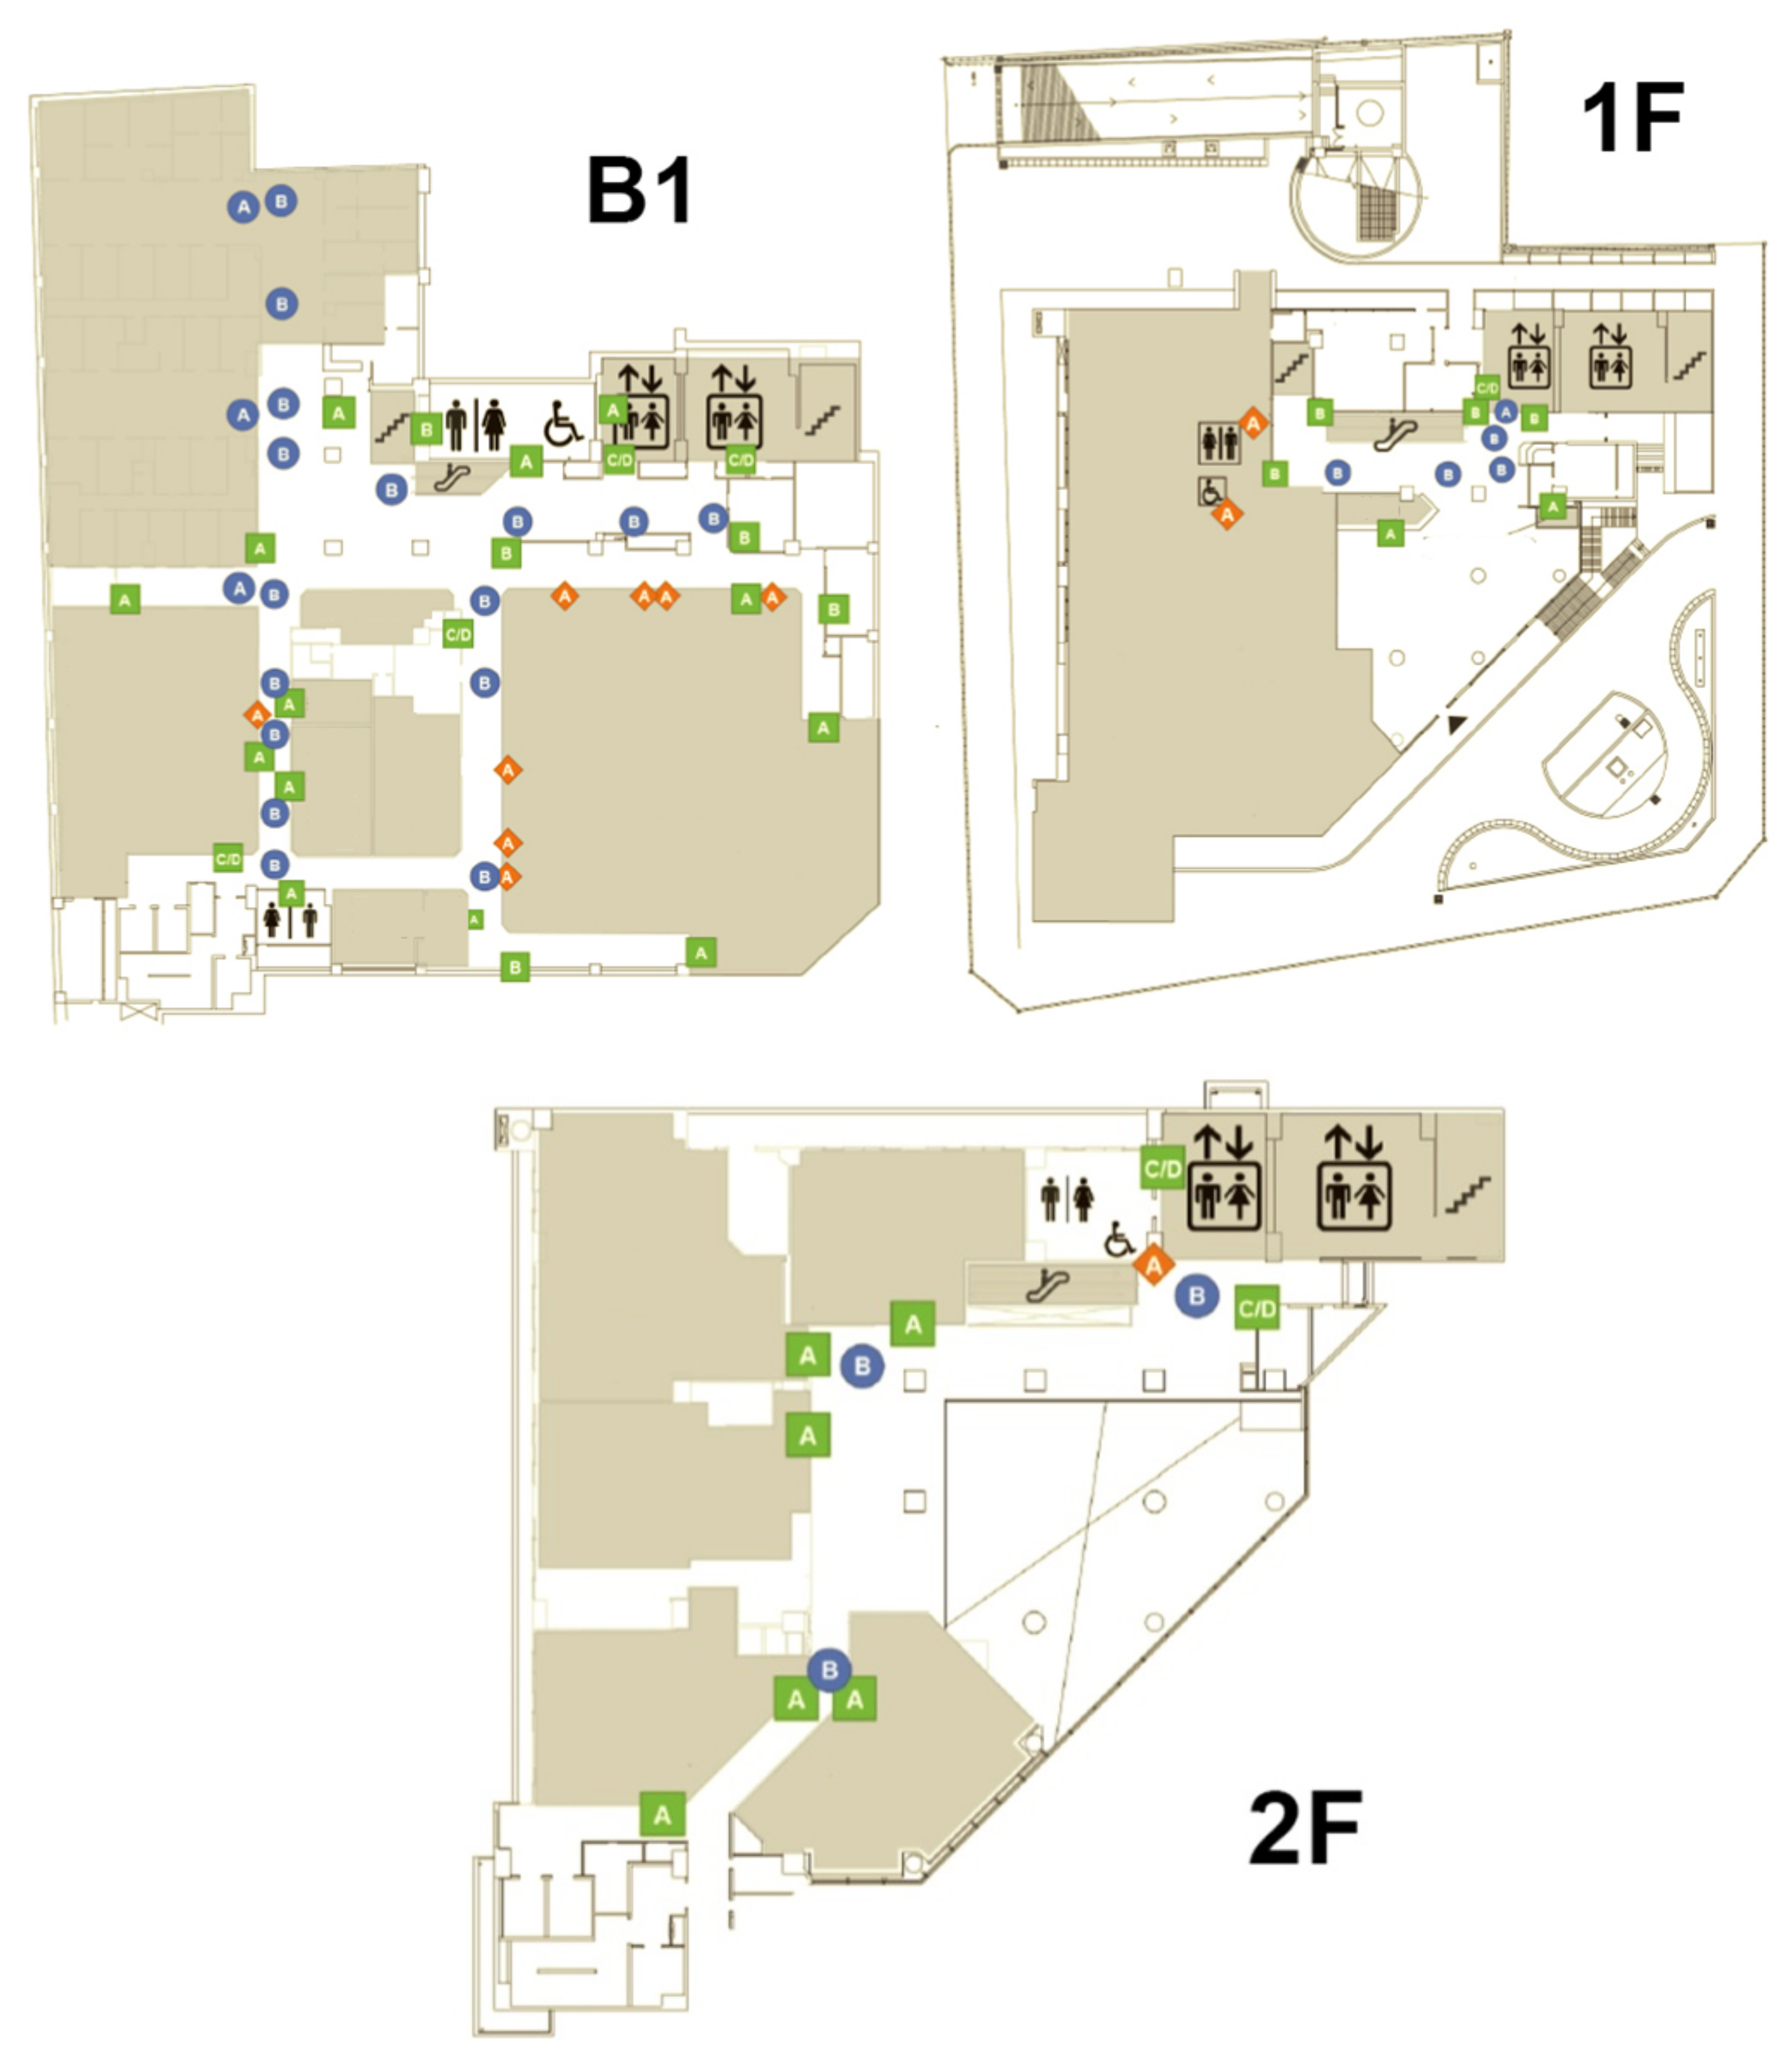
We actually went to CCH/CKB hospital to do fieldwork. Based on the above classification of the content and presentation format of signage, we investigated and recorded the signage configuration and distribution in the outpatient area from the first basement floor to the second floor. The detailed information is marked on the layout diagram of each floor. The analysis results are shown in
Figure 5.
The results showed that there are seven categories and 82 signs in the outpatient area from the first basement floor to the second floor. Among them, the distribution of the up hanging type with guidance contents has a maximum of 23 signs, accounting for 28.05% of the total. Next is the signage of the wall-mounted type with identification contents with 21 examples, accounting for 25.61% of the total. In addition, in terms of floor distribution, the number and types of the signage are the most on the first basement floor due to its larger area and more clinic and examination rooms, with a total of seven categories and 53 signs. The number and type distribution of the signage on each floor is shown in
Table 1.
4.3. Wayfinding Tasks Experiment Planning and Analysis
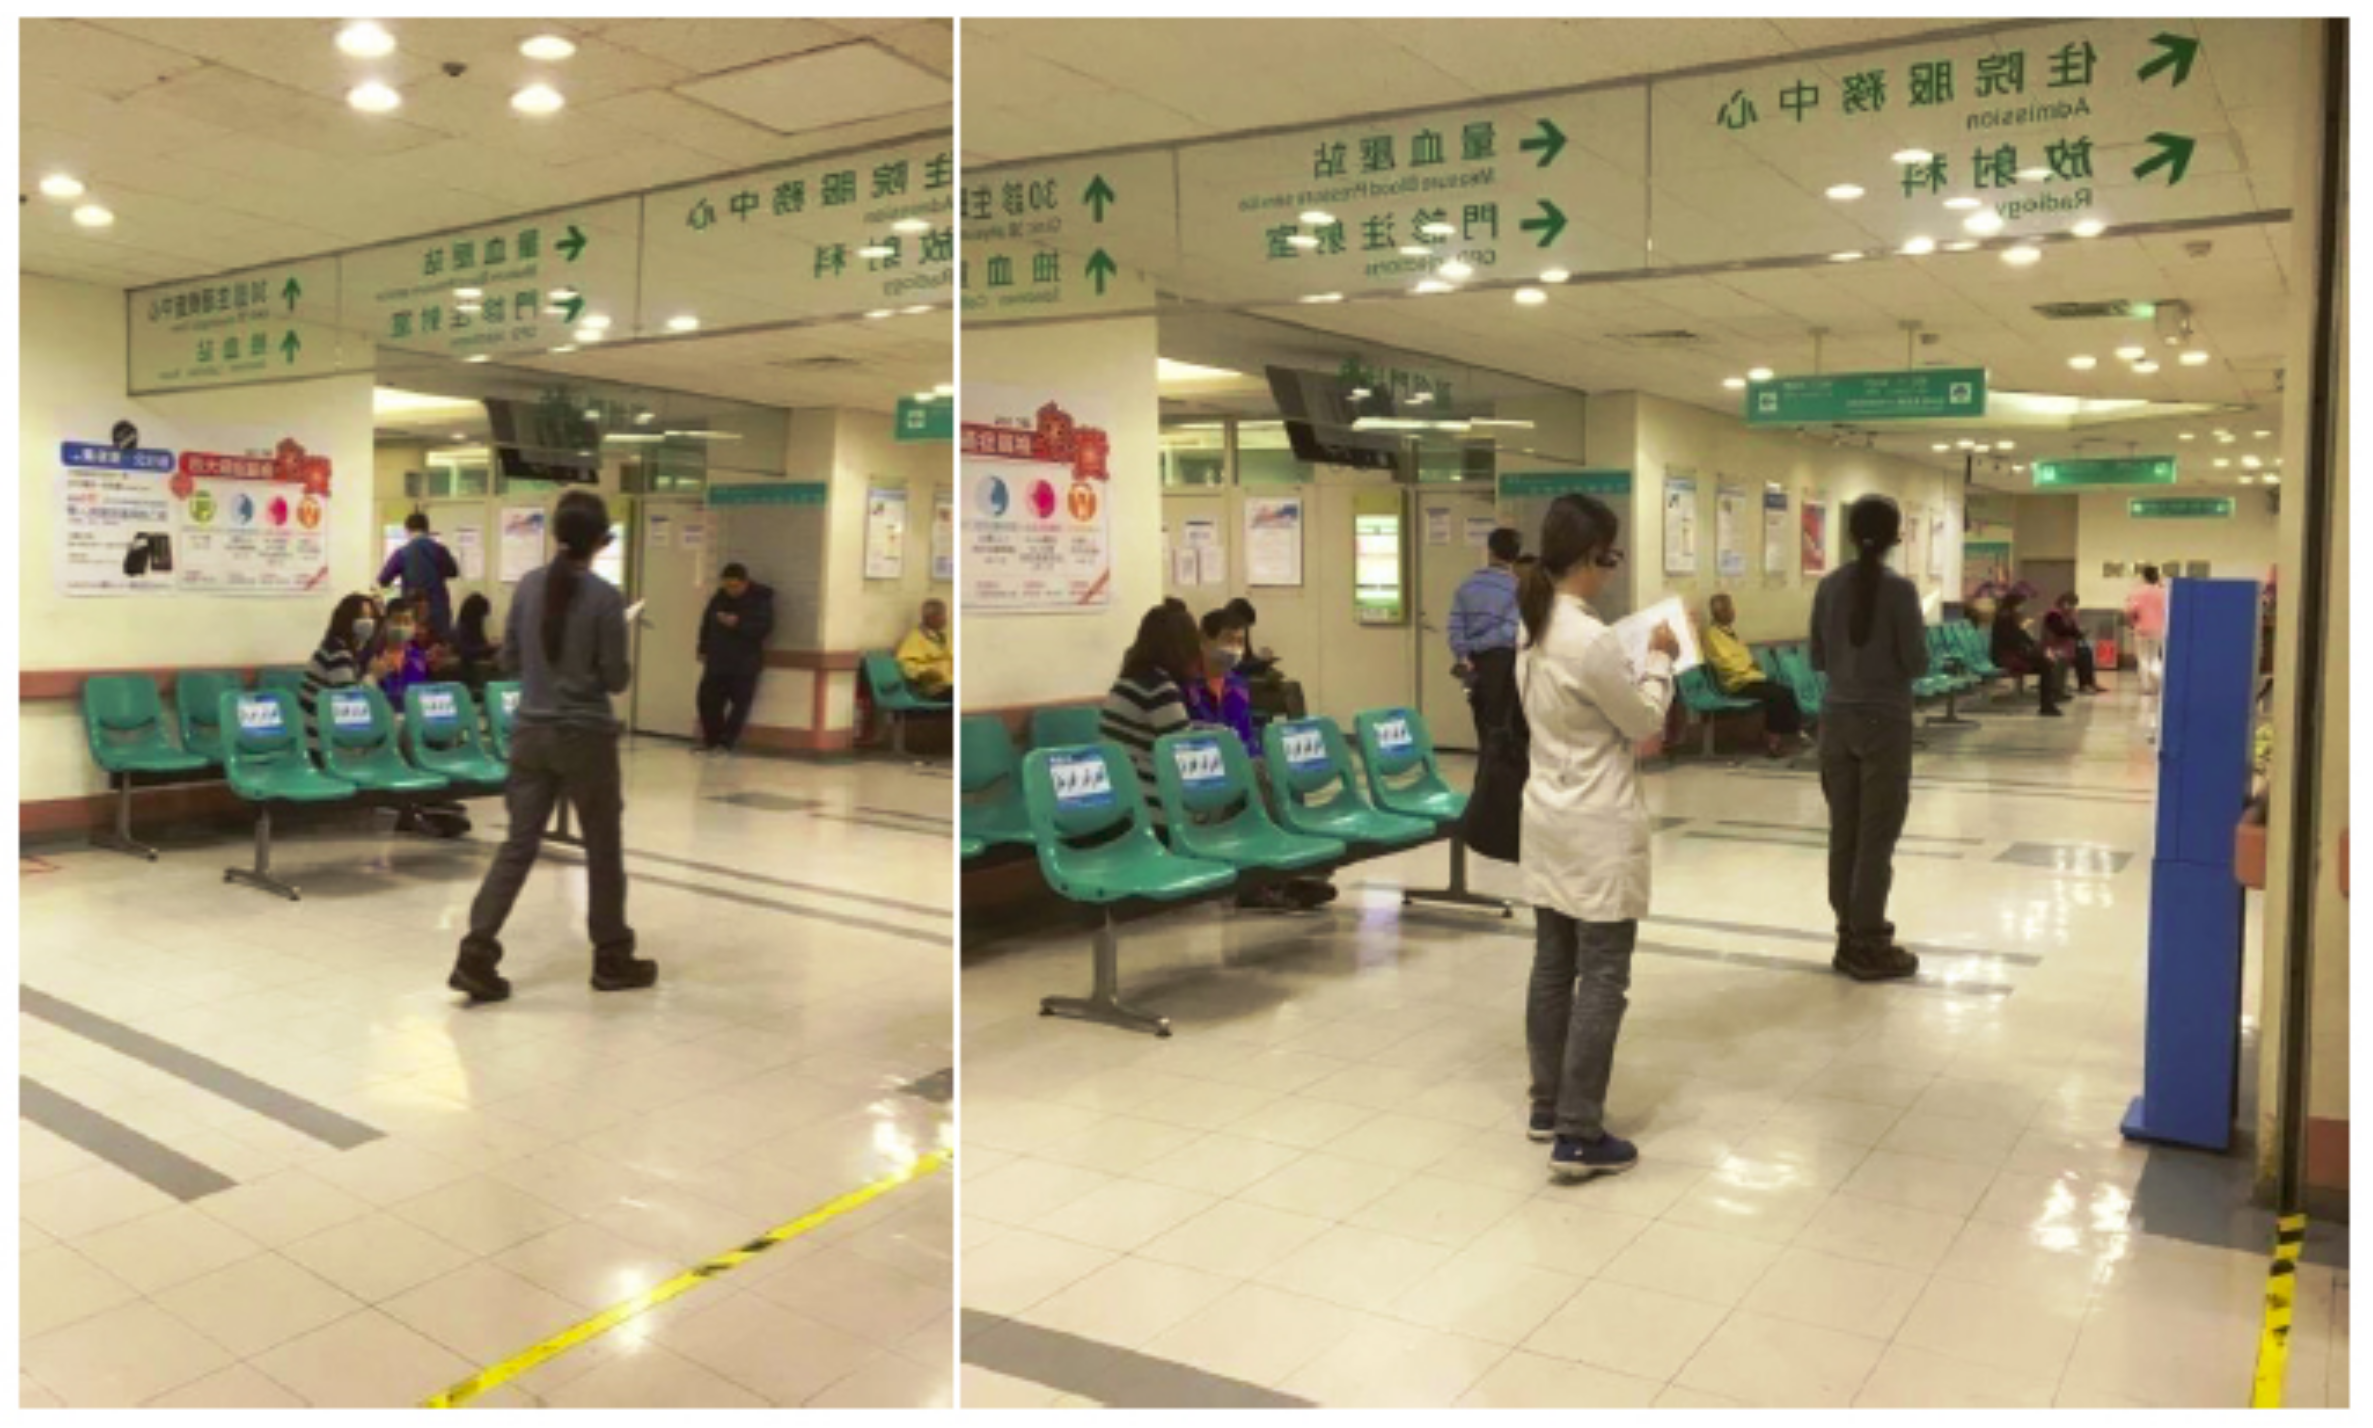
In the outpatient area of the medical building, the clinics and examination rooms are divided into different departments on different floors according to the business considerations of different departments. Meanwhile, each department has an independent diagnosis and treatment area. This can be regarded as the outpatient clinic area of each department as a spatial unit, which is then arranged and combined into the plane space of each floor. In order to objectively analyze wayfinding behaviors of the general public in the hospital, the recruitment object of this study was members of the general public who had never been to the experimental site before. The age range was between 19 and 64. The experiment participants were divided into three age groups (19–30, 31–44, 45–64). They were all assigned the same wayfinding tasks on the first floor, second floor and first basement floor of the outpatient area of the hospital. The wayfinding tasks were executed from the entrance of the first-floor gate of the hospital as a starting point. The participants had to complete the wayfinding tasks one by one in the order listed in
Table 5. During the experiment, the participants could only reach the destination according to the signage guiding system of the medical building. The main task of the research recorder was to confirm whether the participants did indeed complete each wayfinding task and record the time to complete the task (
Figure 9). The research recorder included two members, one of whom used the digital camera to record video images and record the whole wayfinding task of each participant, while the other followed the participants at a distance of about five meters, and observed and recorded whether the participants actually completed the wayfinding tasks for each floor. The recorder also wrote notes to record whether the participants had any wayfinding difficulties or became lost, such as whether there was a place or corner where they moved back and forth or stayed for a long time, and if so, the recorder wrote down the location and duration of stay. Afterwards, these notes were compared and analyzed with the video images. The criterion of this study is that if the experimental participant moved back and forth more than twice or stayed for more than 1 min in the same place or corner, they are judged as having lost their way. Research recorders were required to receive two hours of training and task instructions before actually performing the recording tasks to ensure that they could do their work. Finally, the time spent by the 30 participants (15 males and 15 females) when performing the wayfinding tasks was calculated after all experiments were completed. A comparative analysis of different genders and the time spent on wayfinding tasks with three different age groups (five males and females in each age group) of 19–30, 31–44, and 45–64 was also performed.
Basically, in
Table 6 it can be seen with regard to the average time spent on wayfinding tasks that women need less time (mean = 1621, SD = 327) than men (mean = 1697, SD = 236). To further examine whether gender has significant differences in the time spent on wayfinding tasks the independent samples
t-test was applied. The results also show that the significance value of 0.470 far exceeds the statistical significance value of 0.05 (
p < 0.05). Therefore, it can be determined that the influence of gender on the wayfinding tasks is a homogeneity factor. This means that the time spent by the participants in this experiment to perform wayfinding tasks was not significantly different with regard to gender.
In addition, it can be seen from
Table 7 that with regard to the three different age groups (19–30, 31–44, and 45–64) it was the group aged 19–30 years old that had the shortest wayfinding time (mean = 1531, SD = 258), and thus was most efficient, followed by the group aged 31–44 years old (mean = 1687, SD = 231), and finally that aged 45–64 years old (mean = 1758, SD = 282). The upper and lower values of the 95% confidence interval of mean indicate that the sample follows a normal distribution. Meanwhile, the homogeneity of variances is also calculated using a Levene test, with the results shown in
Table 8. The significance value of 0.815 is greater than the threshold value of 0.05. This means that these three sets of parameters are homogeneous. In order to verify whether the three different age groups have significant differences in the time spent on the wayfinding tasks, this study then used statistical one-way analysis of variance (ANOVA) to analyze the data. From the results in
Table 9 it can be seen that the significance value of
p is 0.028 under the statistically determined value of 0.05. Further post-hoc analysis was used to determine whether there were significant differences between the groups. The results in
Table 10 show that the main significant differences in the time spent on wayfinding tasks were between the groups aged 19–30 and 45–64. This means that the time spent by the participants in the experiment to perform the wayfinding task was significantly different due to the difference in age. In short, older people needed much more time to complete the wayfinding tasks, which means that they had poorer performance with regard to wayfinding efficiency. There are three possible reasons why the older participants needed to spend more time on the wayfinding tasks. The first may be the deterioration of physiological functions, especially in mobility, which is not as efficient as in younger people. The second reason may be the inability to see the signage system clearly due to poorer vision. The third is that the older participants may have had problems with reduced cognitive ability and thus, understanding of the graphic images, and so an inability to obtain the necessary and sufficient wayfinding information from the guiding signage system in order to reach the destinations in a short time. The detailed reasons for these results can be studied in future research.
The participants were given a questionnaire after performing the wayfinding tasks, and feedback was given for each task. The options were set as (1) very easy to find—one point; (2) easy to find—two points; (3) ordinary—three points; (4) not easy to find—four points; (5) very difficult to find—five points. The average number of points was calculated based on the responses of the 30 participants, and this was used to assess the degree of difficulty of each wayfinding task. This research analysis mainly selects wayfinding tasks with more than three points as those locations with significant wayfinding problems in the opinions of the 30 participants. The statistical results of wayfinding task difficulty are shown in
Table 5. Meanwhile, these results are supplemented by the axial analysis of the space syntax theory to cross-compare the factors that affect the wayfinding behaviors. In the questionnaire feedback, it was found that scores greater than three points were all scattered on the first basement floor of the medical building, including physiological examination room, blood collection station, aisle of urodynamic examination, extracorporeal shock wave lithotripsy room, MRI Room, 64-row computed tomography (CT) room, and angiography room (
Table 4). The results show that the route planning of the first basement floor is likely to cause trouble in wayfinding processes for patients visiting the clinic.
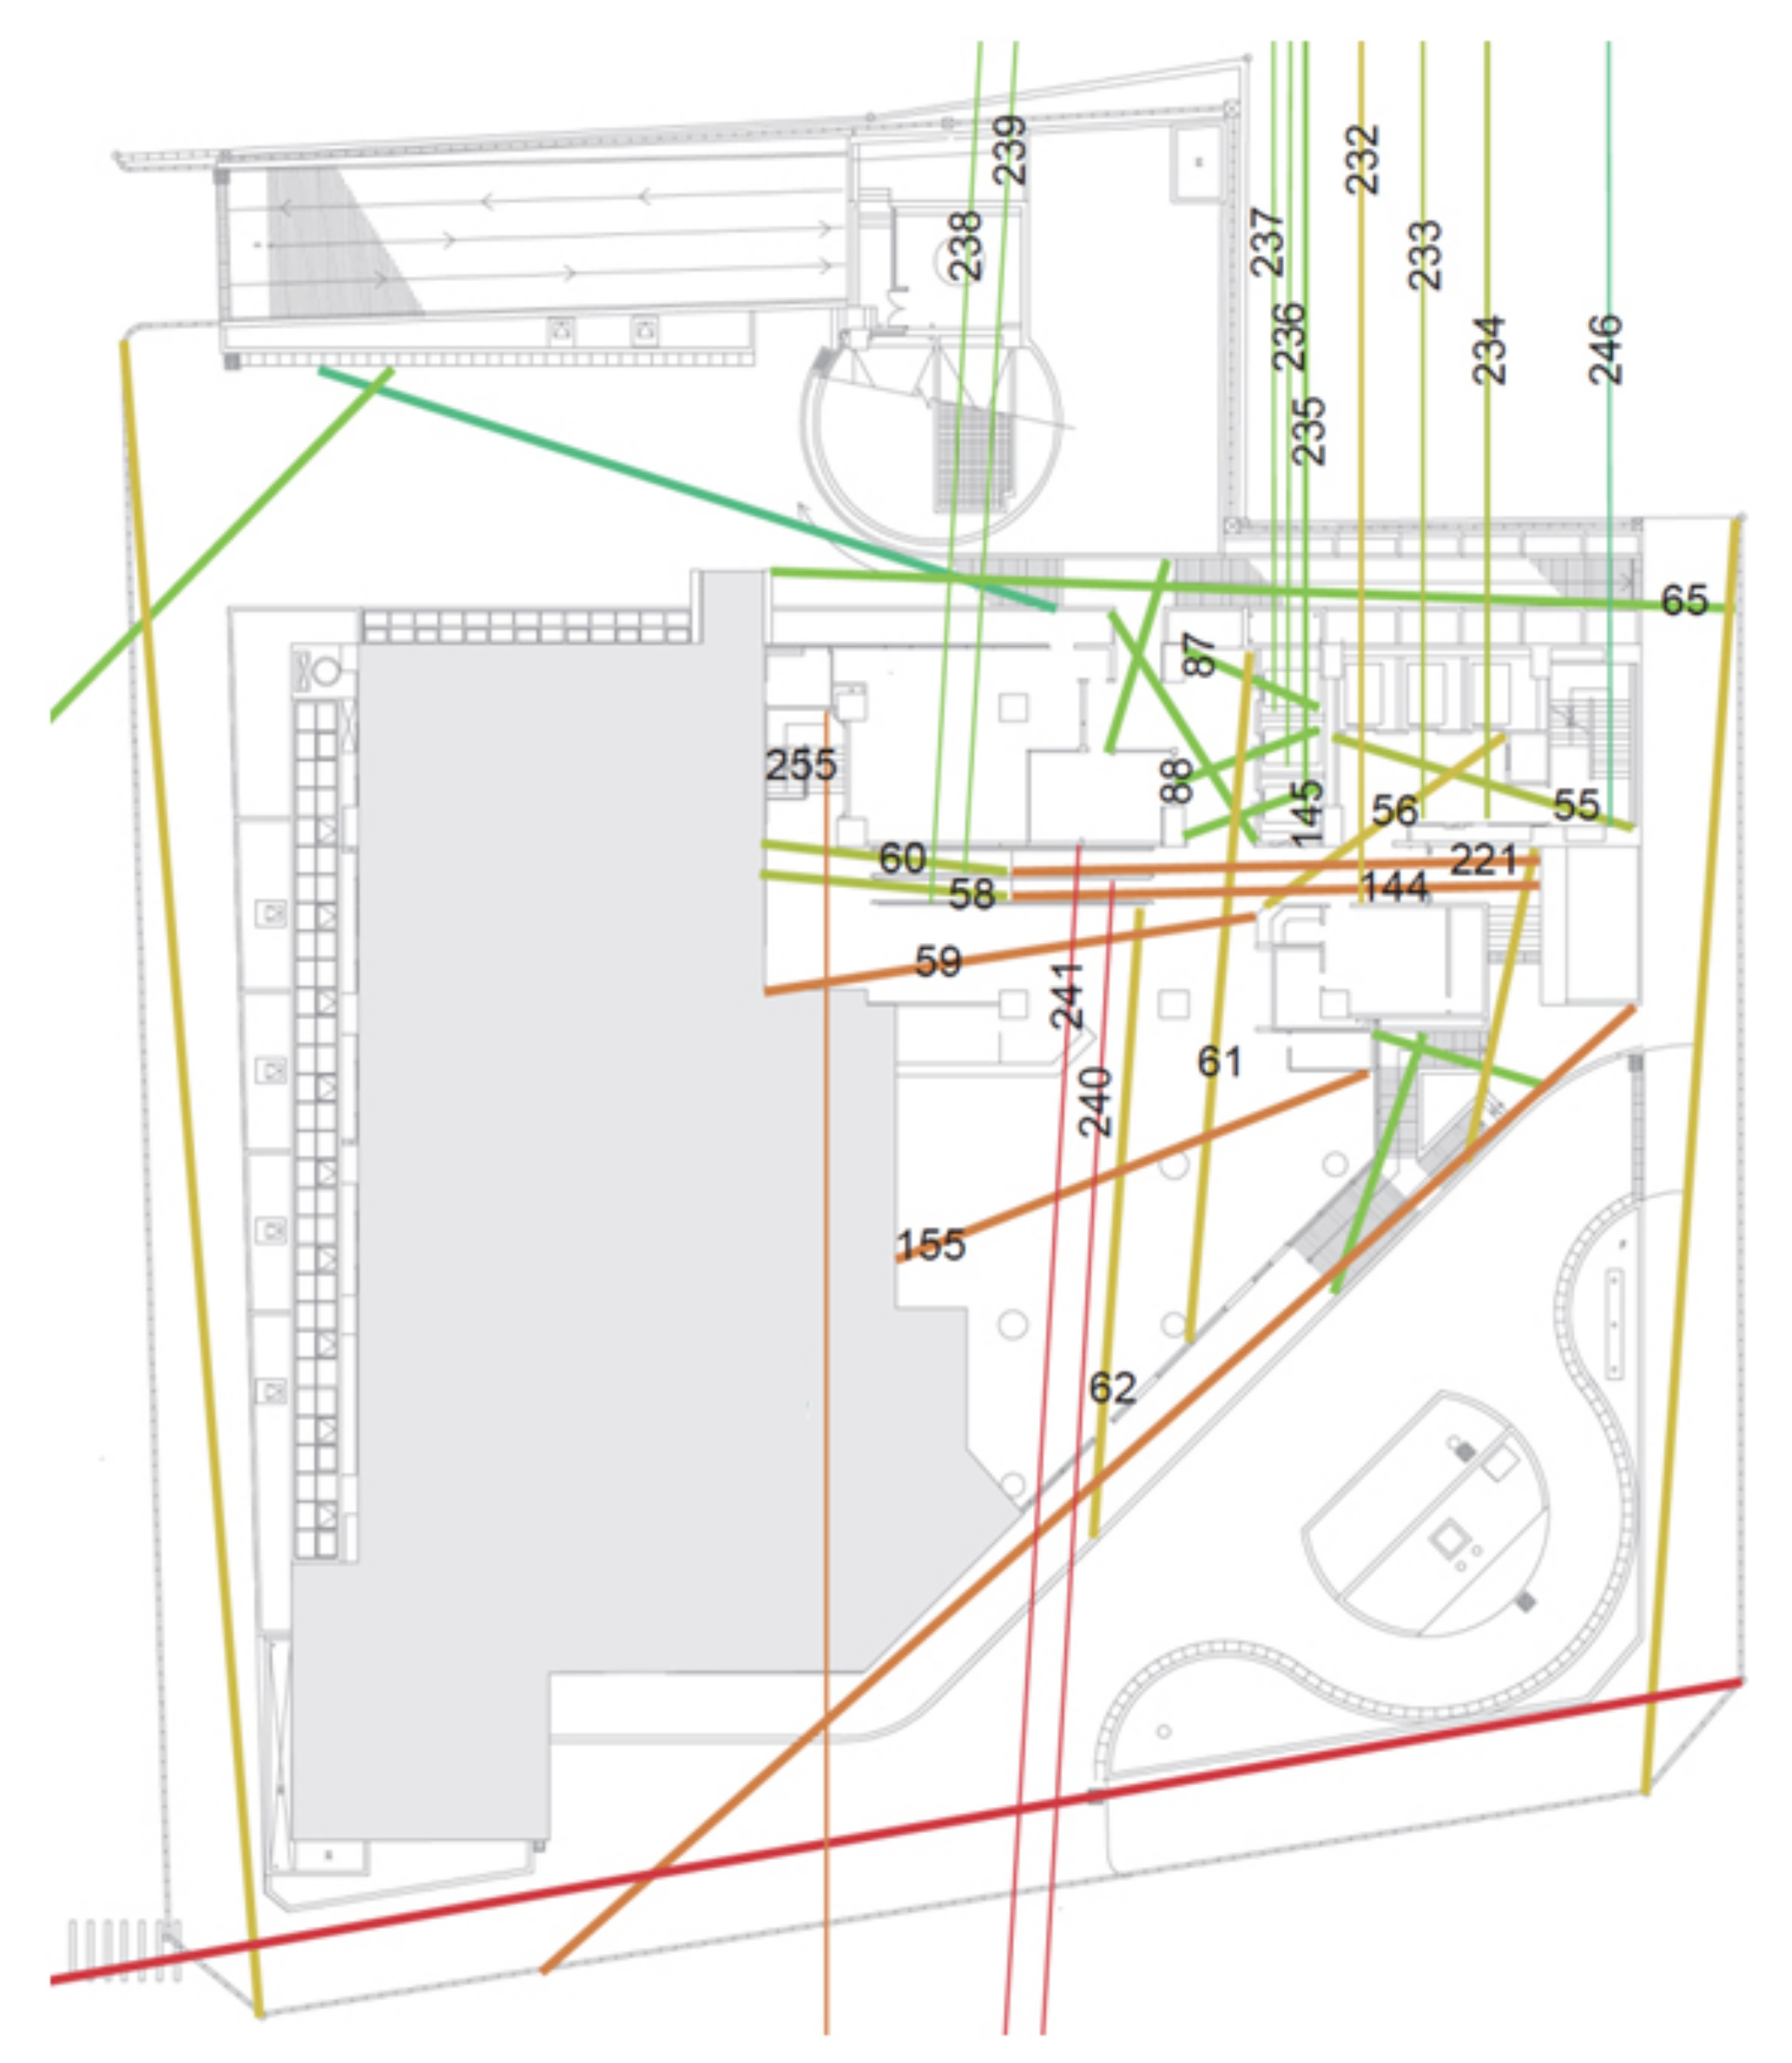
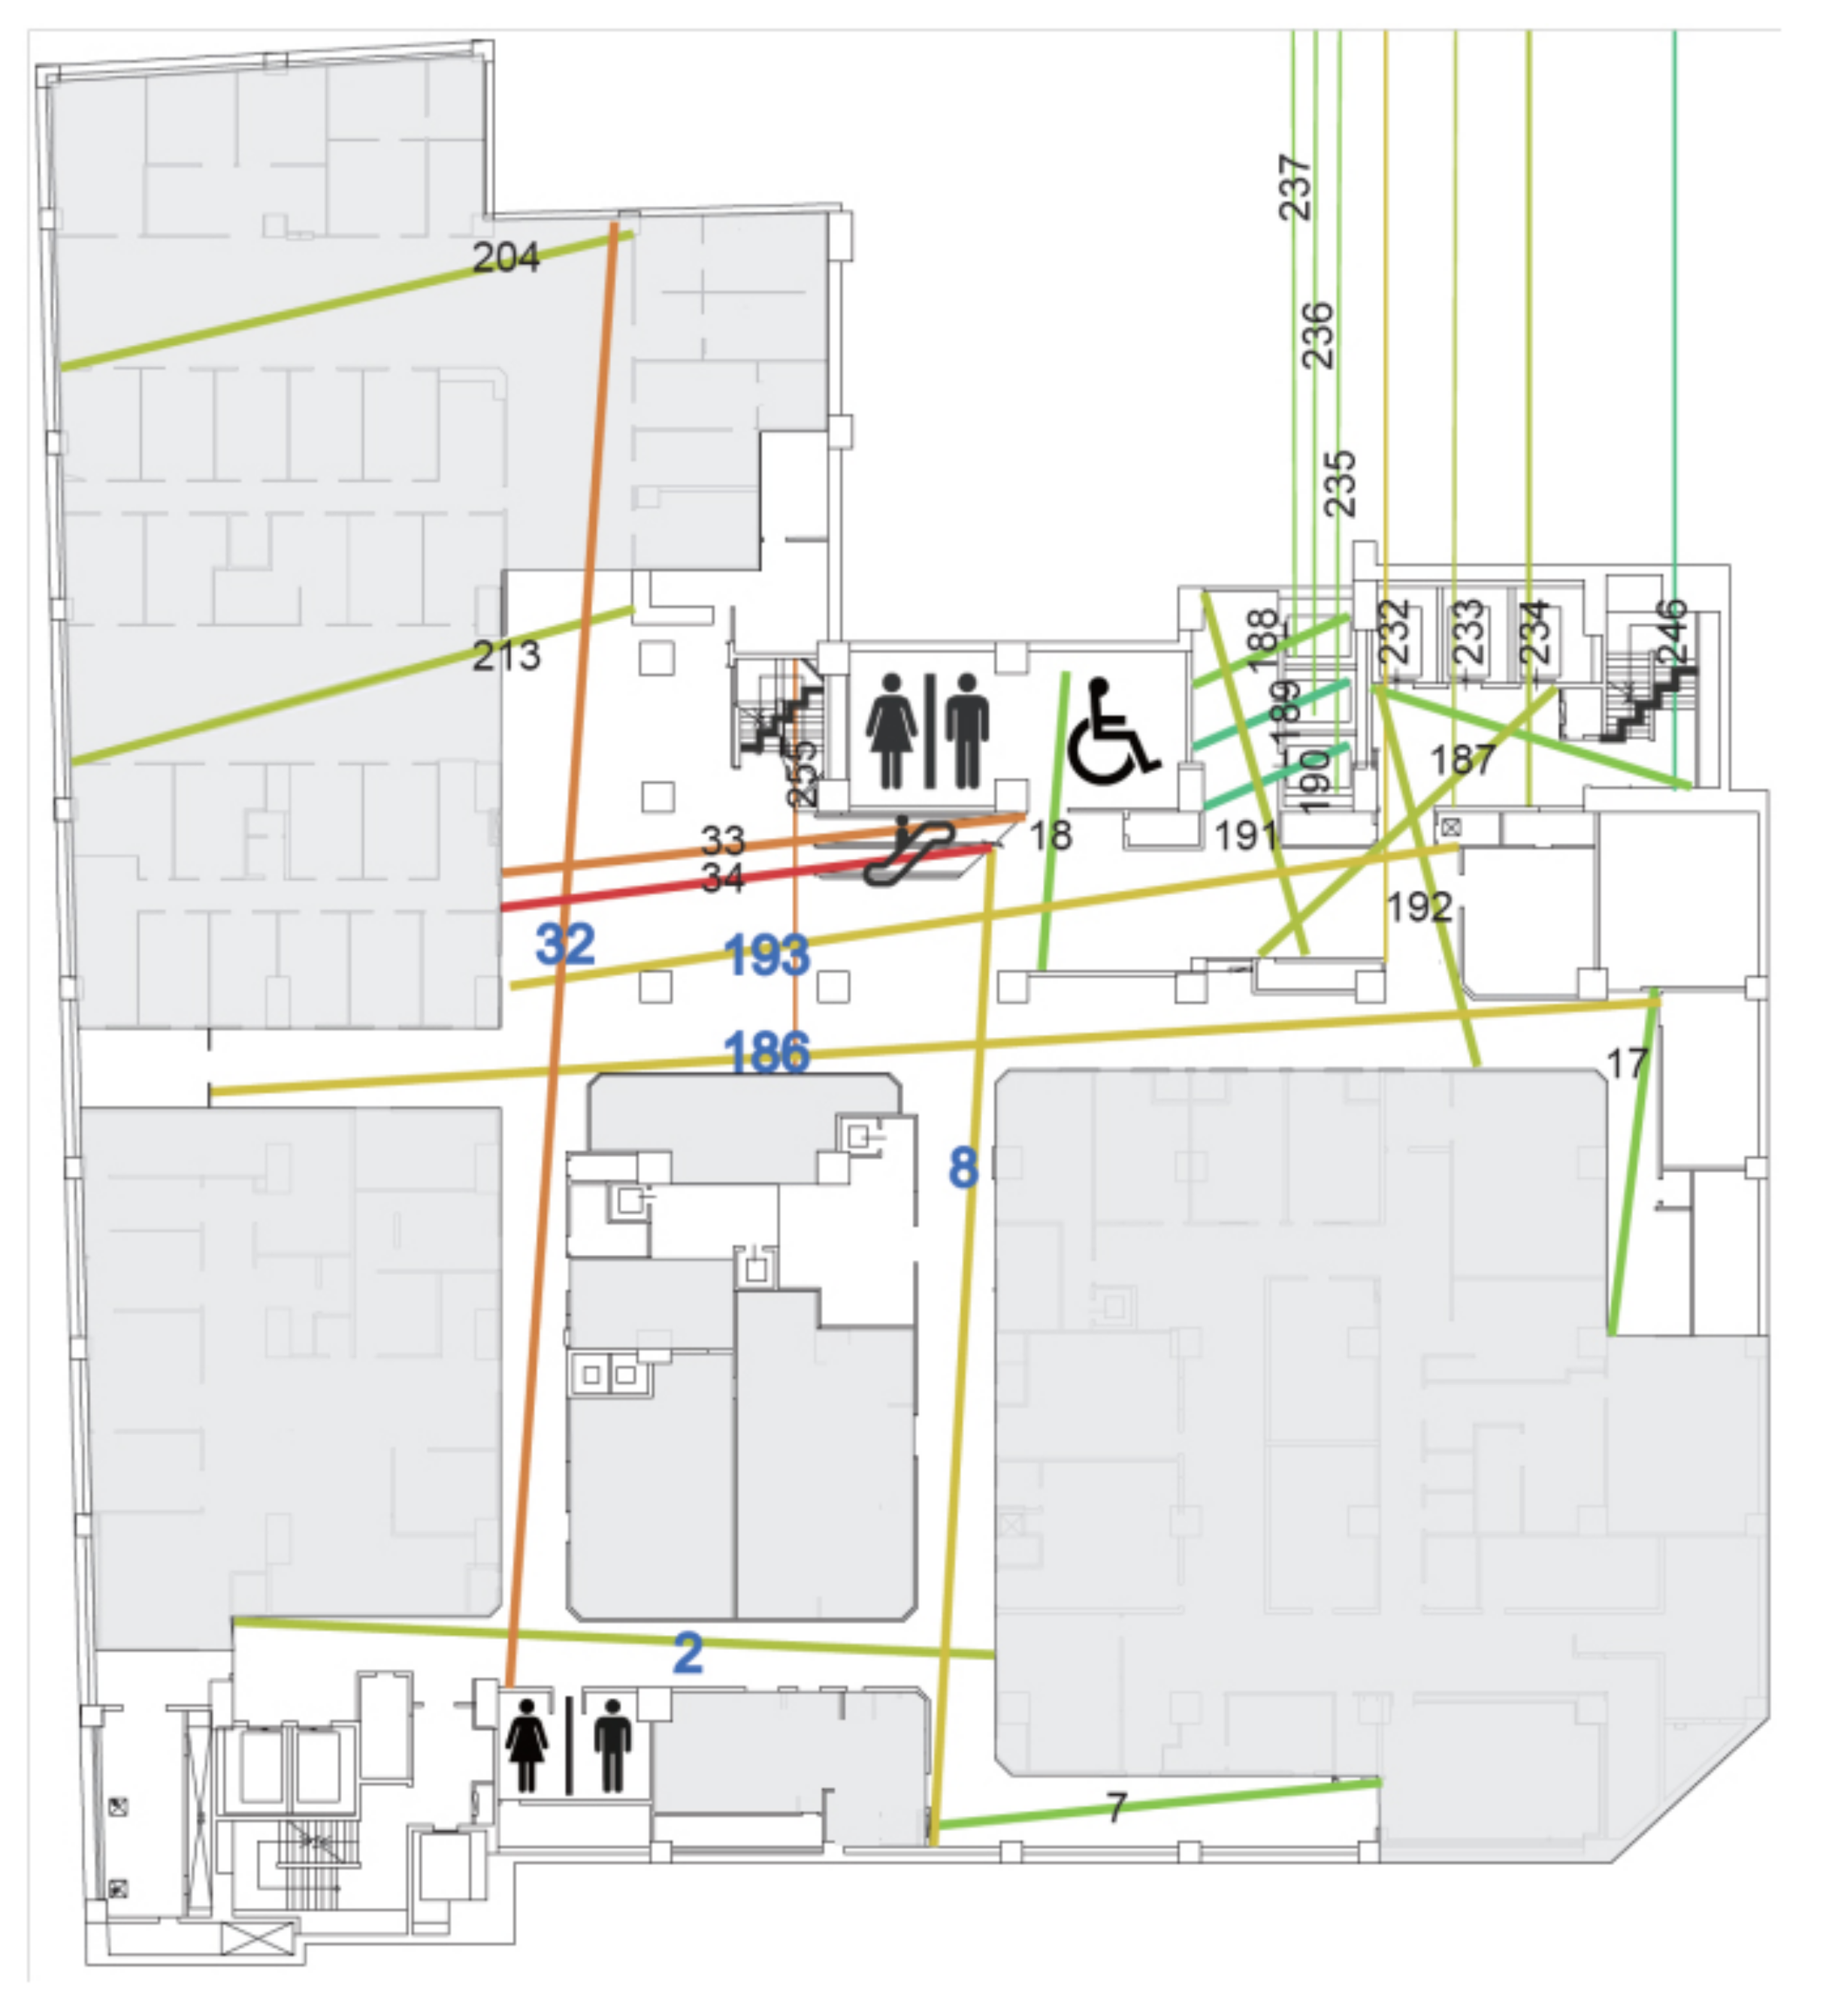
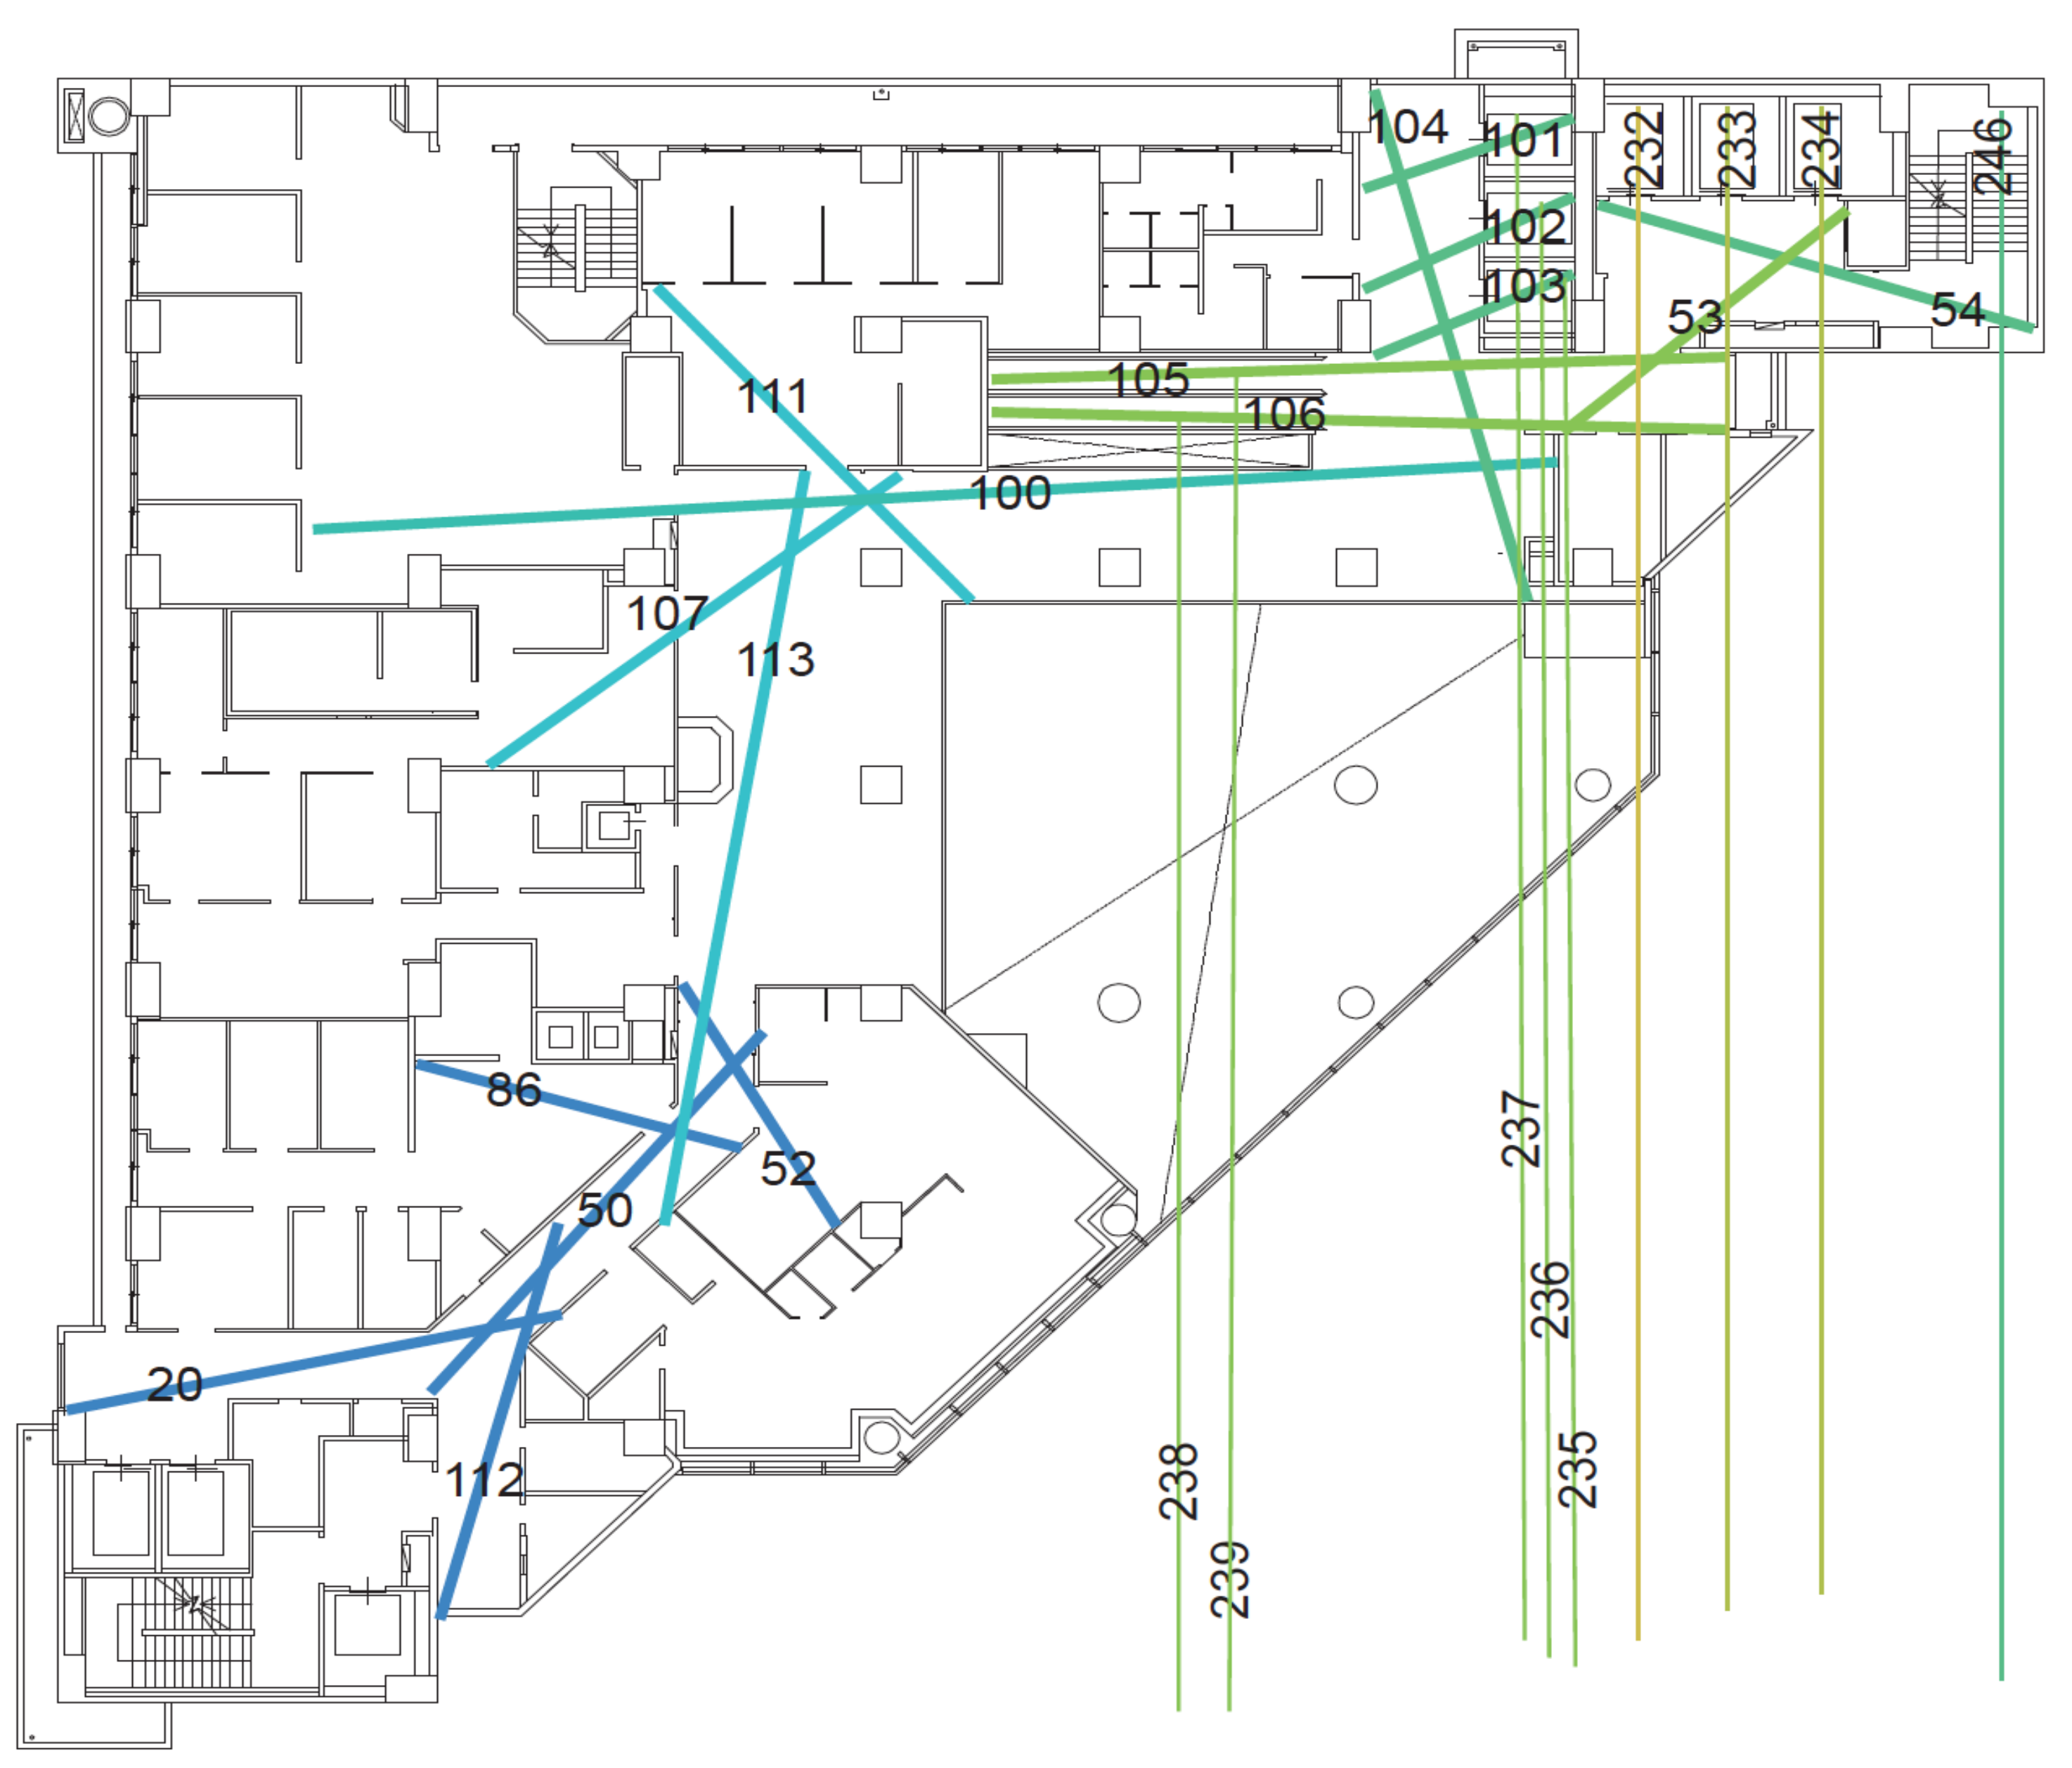
The results of the wayfinding experiment show that the first basement floor is the one where most people became lost. The behavioral annotation diagram (
Figure 10) shows that the five routes numbered 32, 193, 186, 2, and 8 are the open main routes (
Table 2), and they are also the most common routes on which people become lost. Compared with the axial analysis of space syntax theory, its global integration value, Rn, is a moderate value and the number of branch routes connected to each of these five open main routes exceeds six. This result validates Wang’s research [
19], which pointed out that when the longest moving route has a moderate Rn value (>6), it is likely to cause a higher proportion of lost wayfinding behaviors.
In addition, from the five open main routes in
Table 3 (routes 32, 193, 186, 8, and 2) and the behavioral annotation diagram and lost points on the first basement floor of the medical building in
Figure 10, it can be found that the ring structure formed by the routes 32, 186, 8, and 2 can be regarded as a “symmetrical ring” space pattern. We found that many participants moved back and forth on this ring structure aisle or stayed at corners for a long time. This phenomenon of becoming lost that was seen with the participants is consistent with Liu’s research [
33], which pointed out that a “symmetrical ring” spatial pattern is more likely to become a maze. Therefore, it is recommended that when designing and planning the guiding signage system for medical buildings, special attention should be paid to whether there is any confusion caused by the ring structure. The results of the wayfinding tasks and space syntax analysis presented in this study have consistent conclusions with regard to the locations where it is easy to become lost.
4.4. Isovist Analysis and Signage Planning
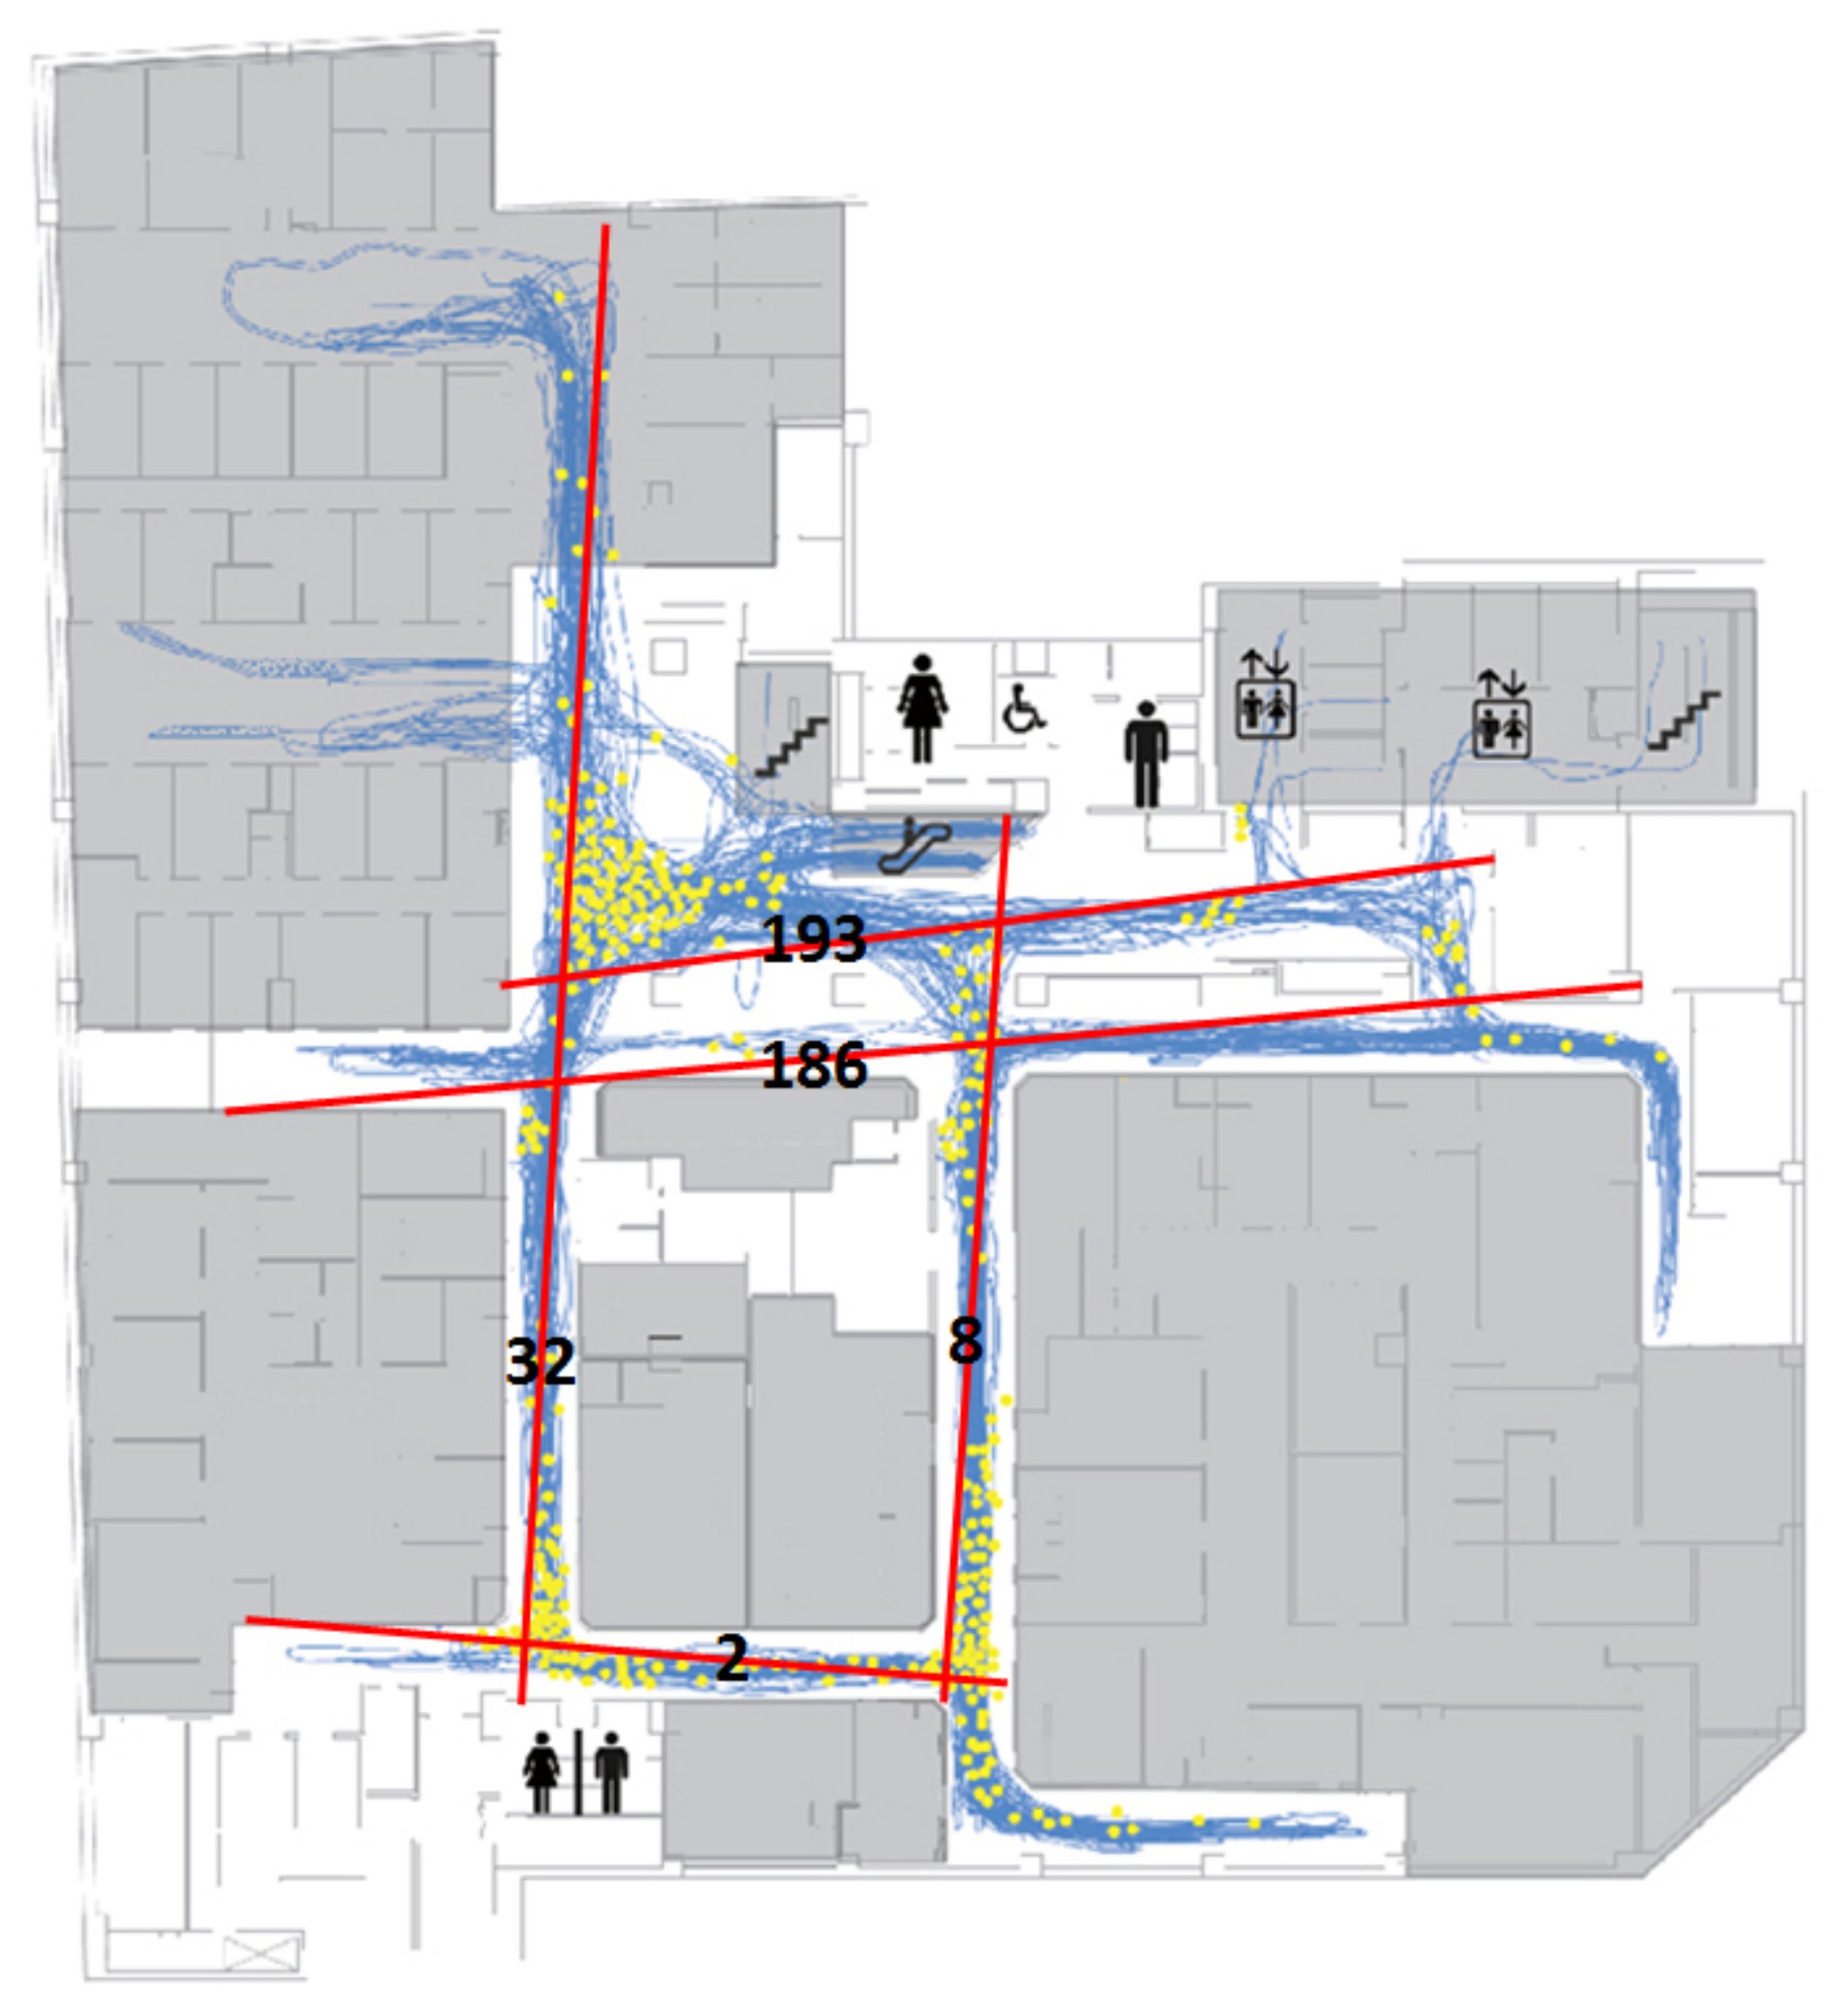
The relationship between space syntax and the signage types is mainly based on the degree of the visibility, as obtained by the results of isovist analysis and the size of the surrounding walls of the location. In principle, if the location has a wide visibility range and there are not too many walls, it is recommended to set up hanging signage. In contrast, if there is a large area of the wall, the wall-mount type of signage is recommended. As for spaces with a narrow field of view, the protruding type is recommended for these. If there are not too many walls at such locations, it is recommended that free stand signage is used. The spatial characteristics should be taken into account with regard to the type of wayfinding system so that the appropriate type and content of the signage are used. In the case of the first basement floor, where the current route planning is more likely to cause confusion and disorientation to the public, this can be easily seen from the major route isovist analysis (
Figure 11). The main visual dislocation is in the area surrounded by the walls of the aisle with route 34-32-186, followed by the intersection with route 186-8, then the intersection with route 32-2, and finally the intersection with route 2-8. However, the signage is configured densely at the five routes (routes 32, 193, 186, 8 and 2), and this could easily cause confusion. In line with Macminner [
30], it is proposed that there should not be too many signs here to avoid visual confusion caused by too many directories, so the signage should be placed at appropriate distances at decision points with easy-to-read, direct and conspicuous icons and contents, and the overall spatial design of the wayfinding system should be consistent.
In
Figure 11, the escalator leads to the first basement floor, and the first location is the open space formed by the routes 34, 32, 193 and 255, and the spatial characteristics of this location are transitional areas for selecting the main direction of movement via this position. The Depthmap calculates a 360° field of view at the subject location to obtain the visual field of this area. The main visual dislocation is in the area surrounded by the walls of the clinics and the route 34-32-186. The signage here should be a wall-mounted first basement floor plan, so that the patients can quickly determine the direction of their destination.
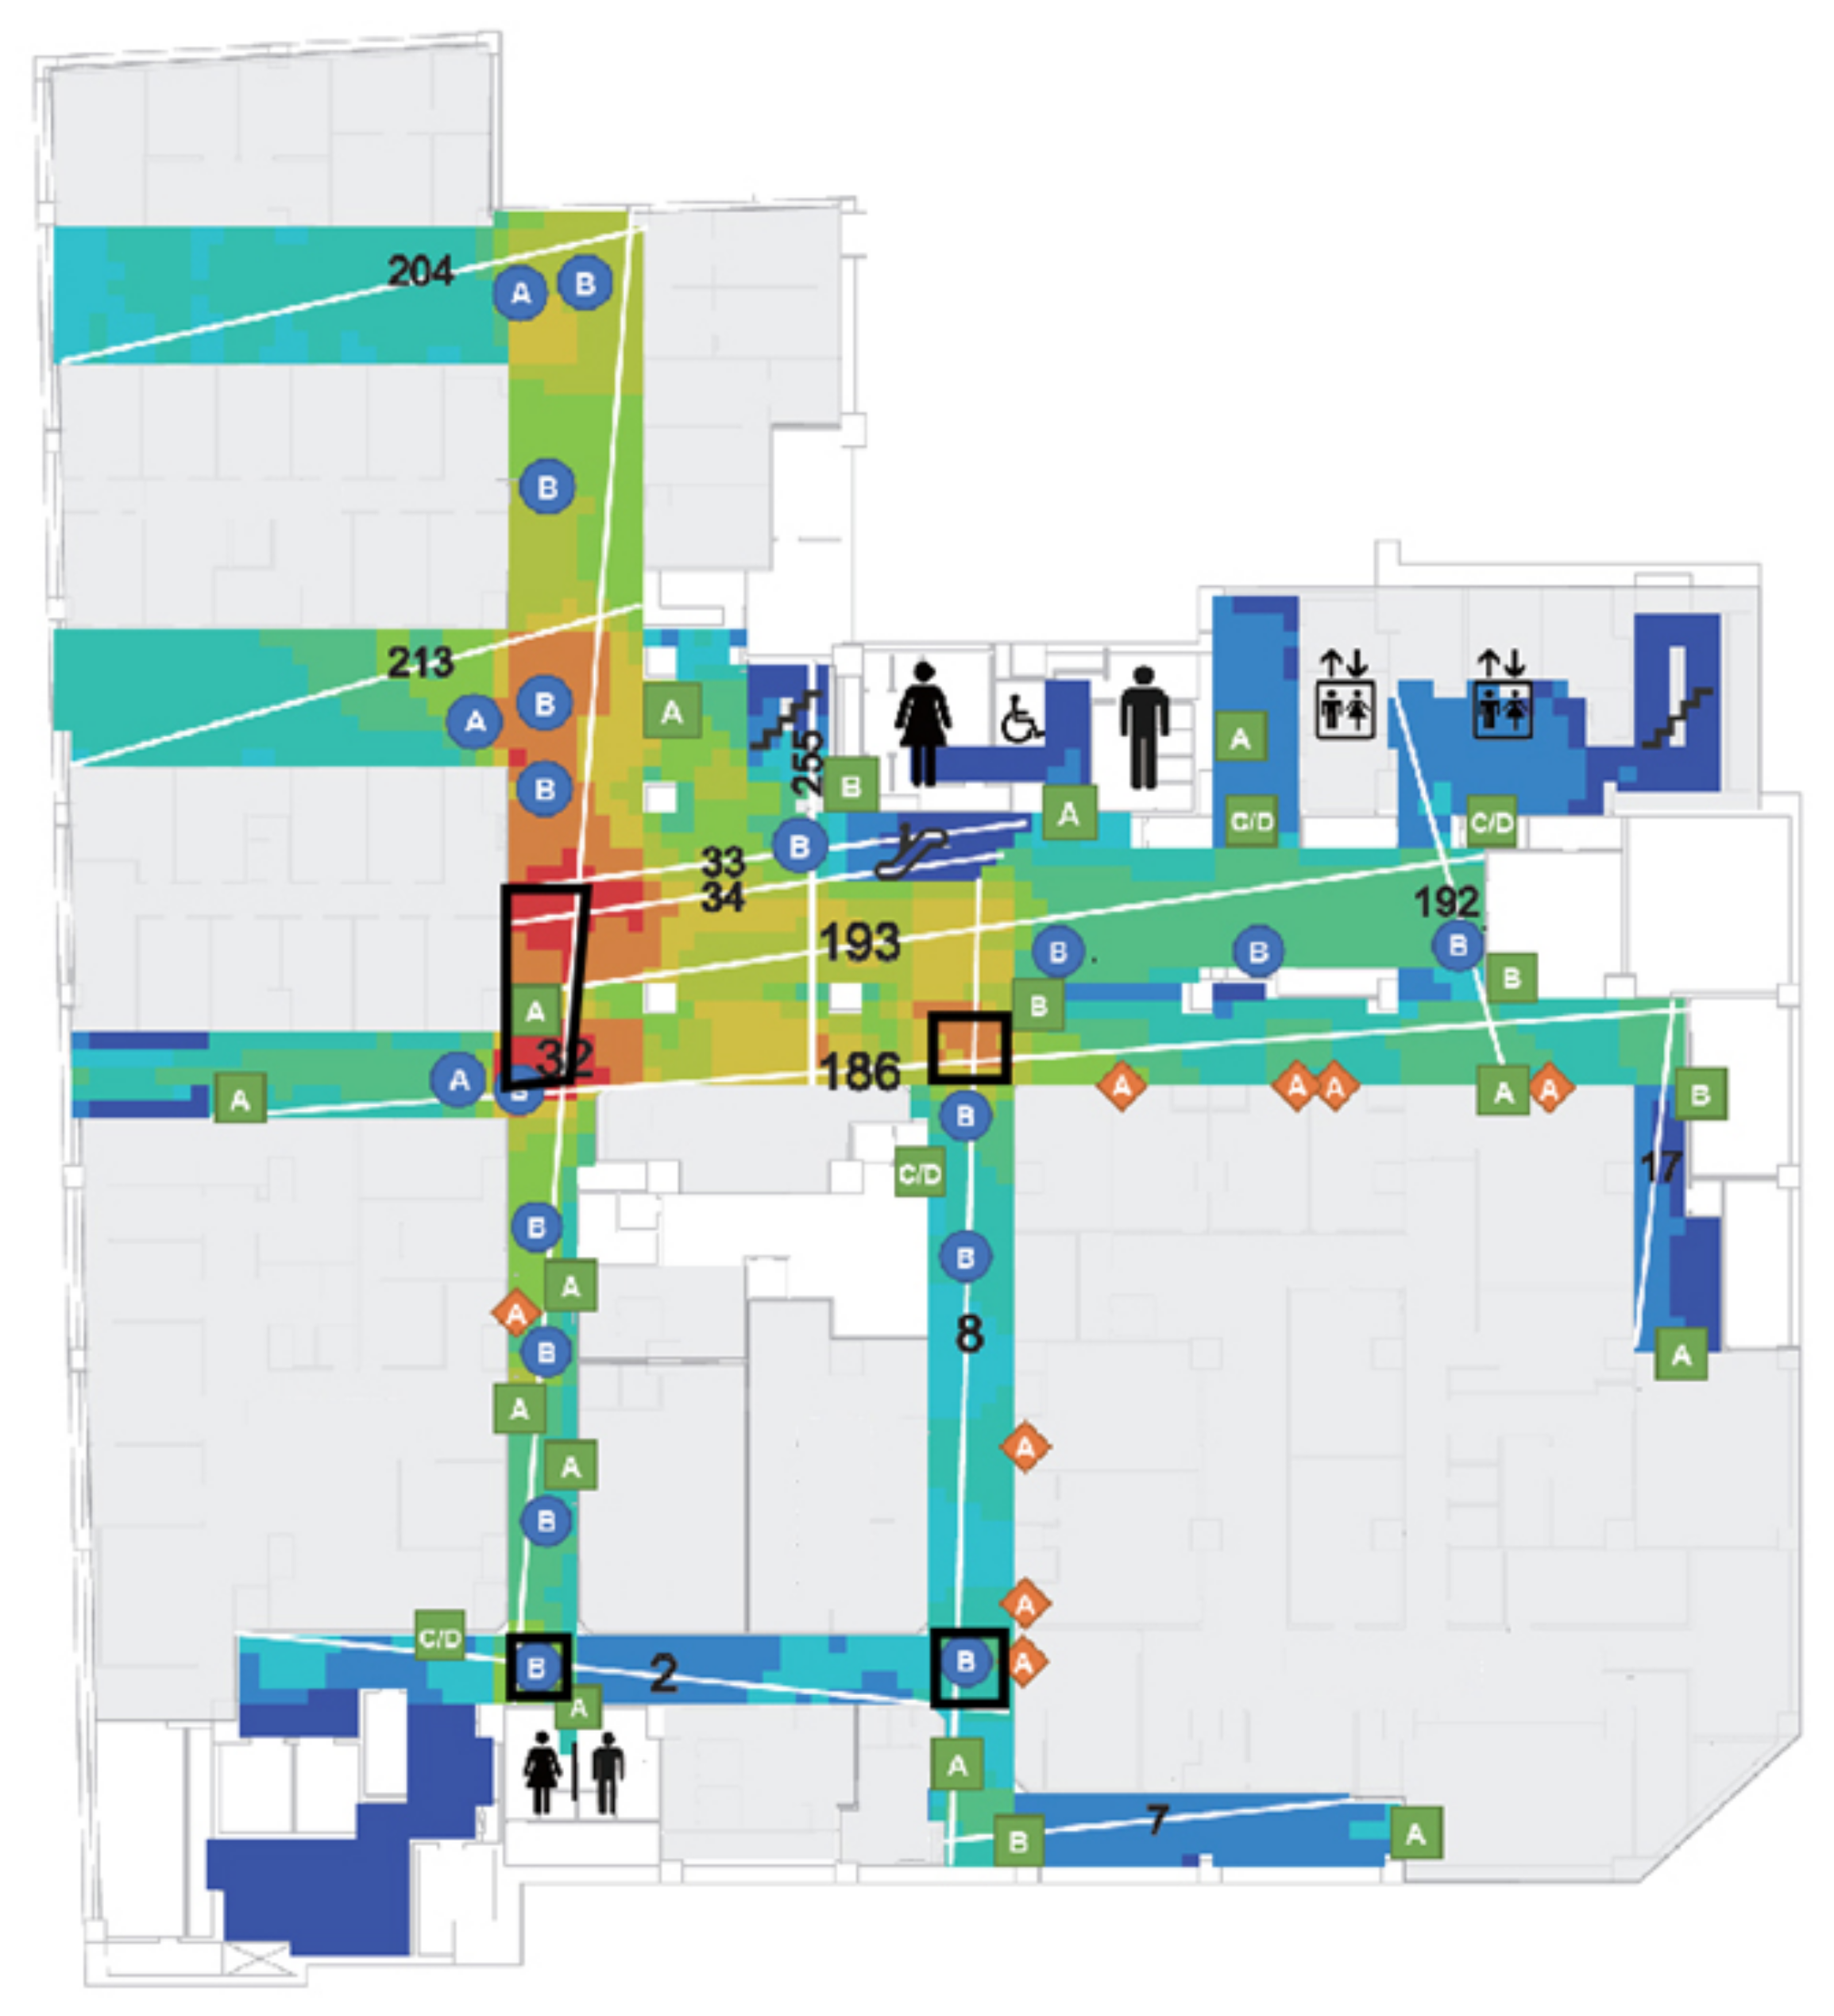
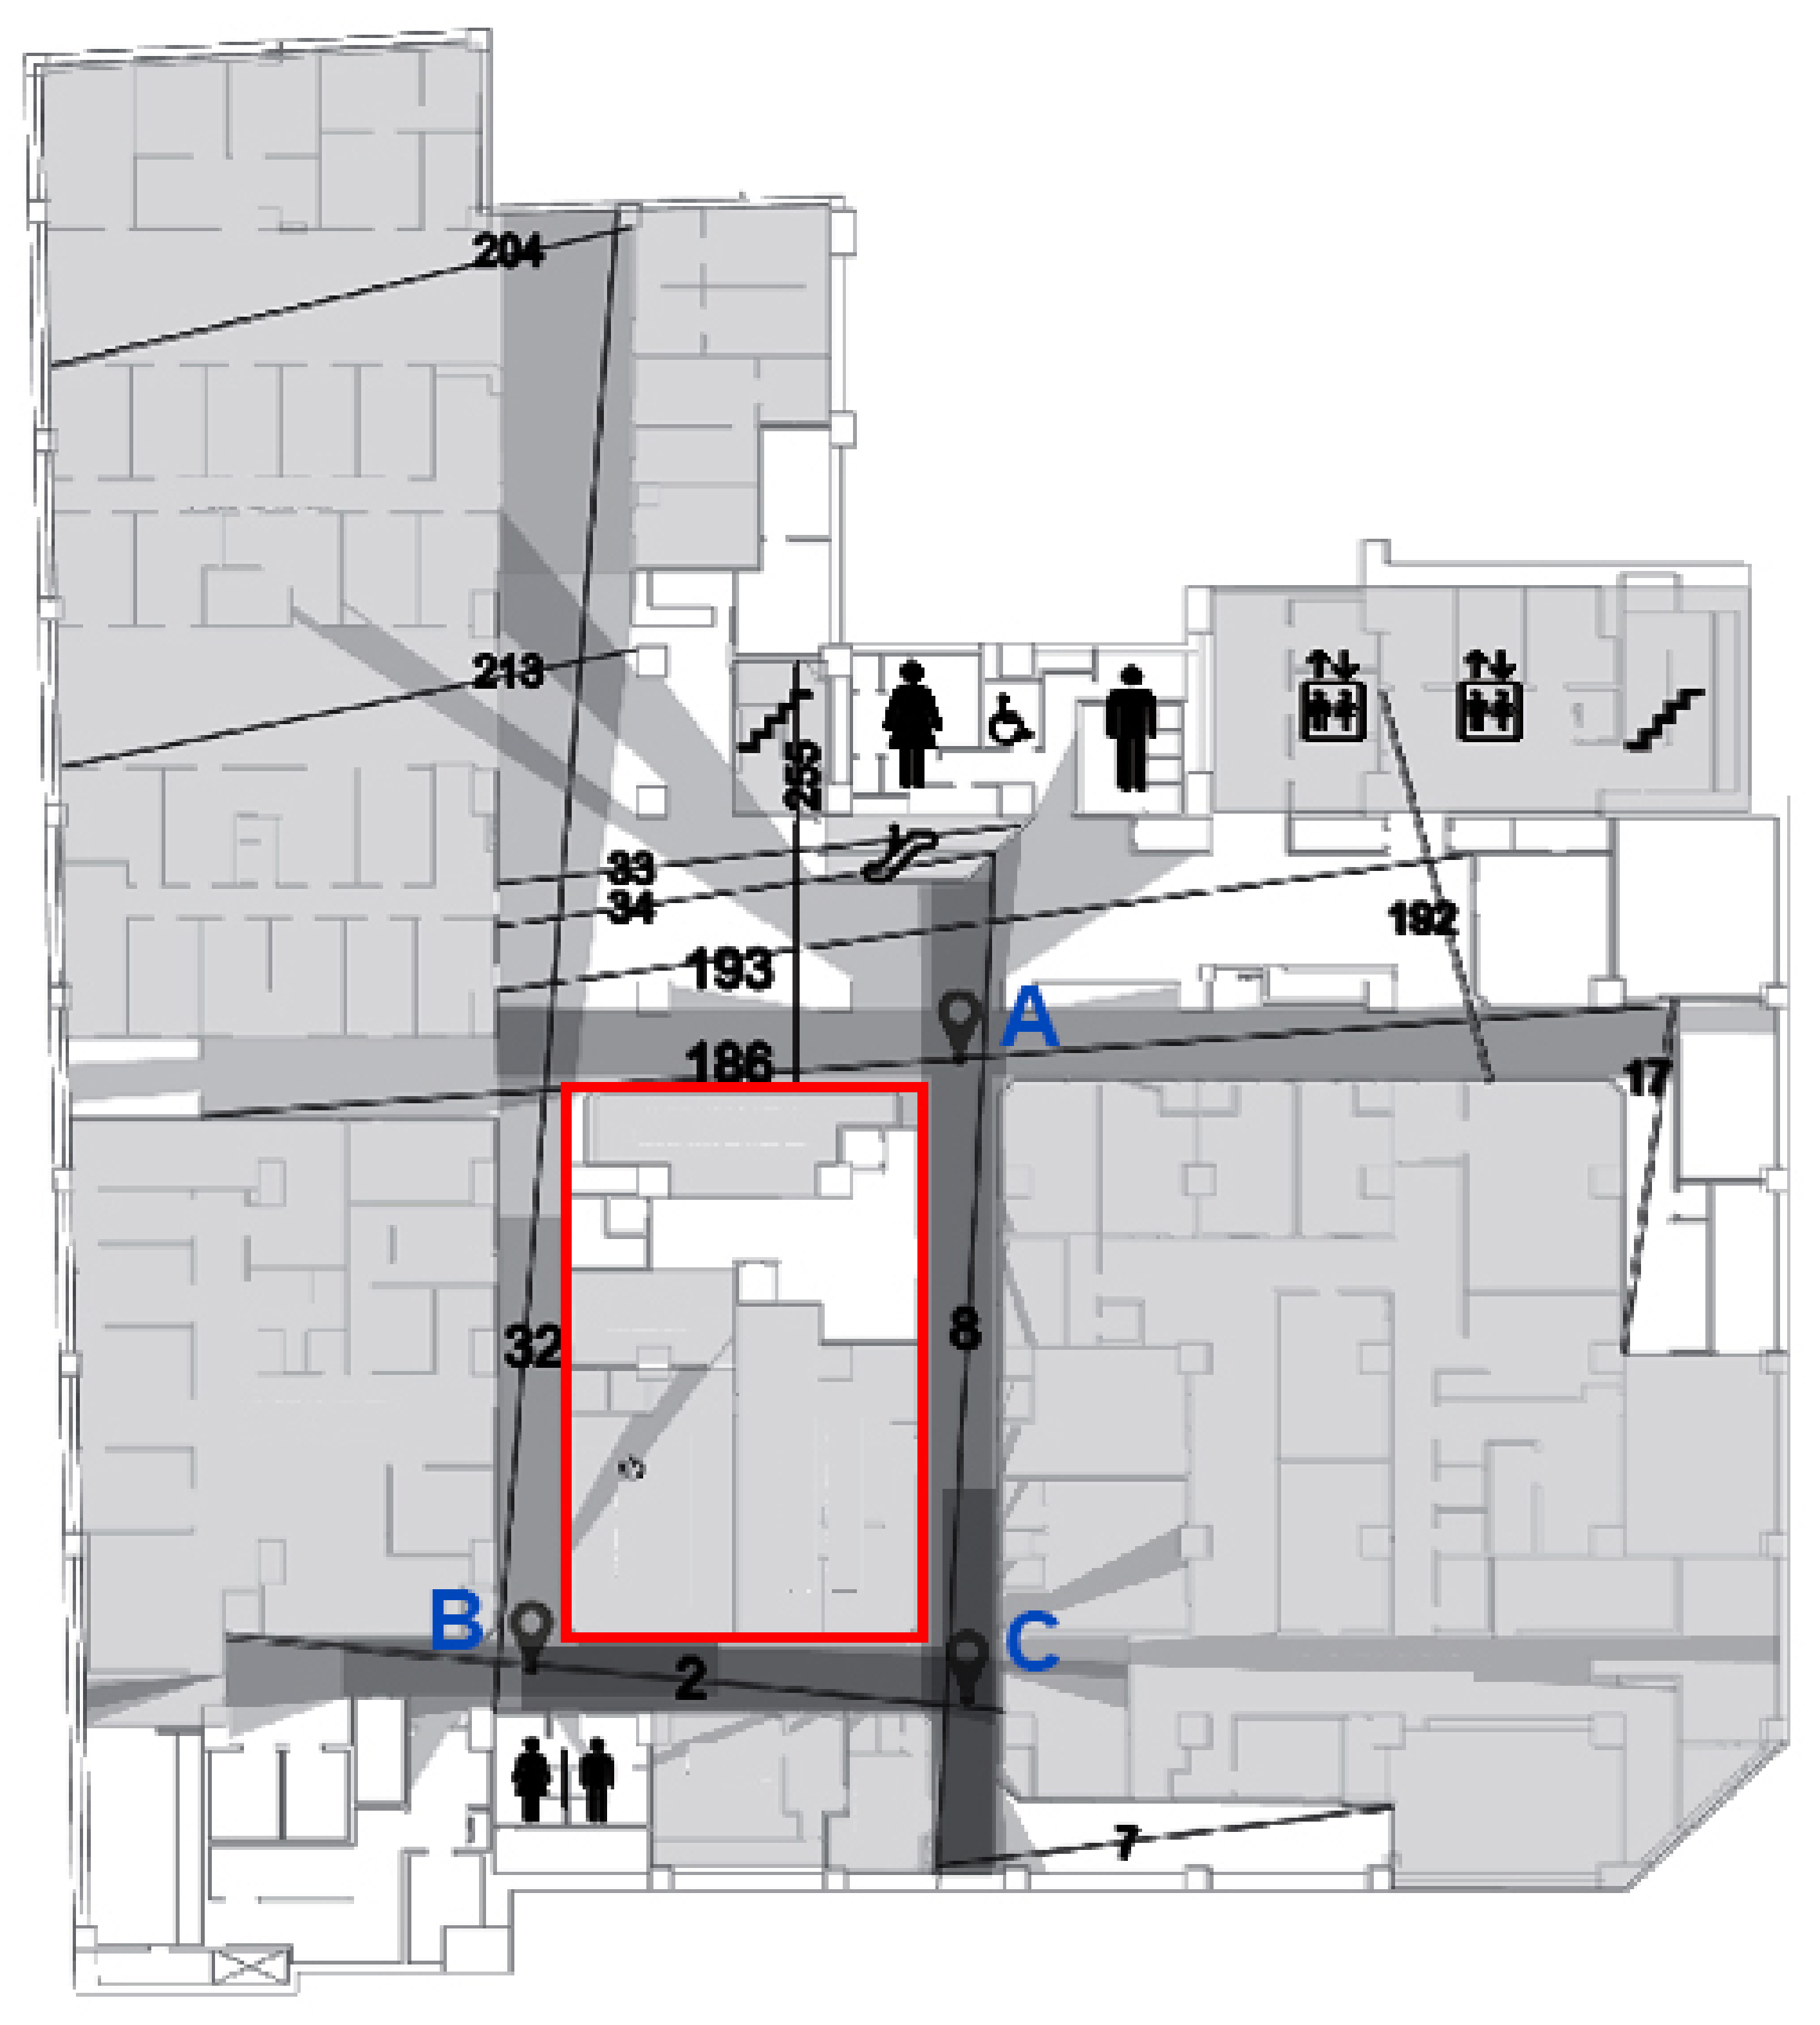
In
Figure 12, because of the intersection (point A) of the route number 186-8, and the fact that the spatial characteristics of this area are cross-shaped and located in the secondary visual axis staggering area, the sign type here should be an up hanging guiding sign, and the guiding content should be the identification space and examination room that the route mainly belongs to, and then supplemented by the target space and examination room that the secondary route belongs to, to show the primary and secondary structures of different routes. The main and secondary structures of the different routes are presented to facilitate the identification of the destination routes by the patients. The spatial characteristics will lead the patients to turn right intuitively and proceed to the intersection of route number 32-2 (point B) and follow route number 32 in the direction of number 2, which is a T-shaped space. Therefore, the wall at the intersection should be set up with wall-mounted guiding directories, and the guiding contents should be mainly the identification space and examination room that the route will pass through, so as to help people to reach the destination quickly. The up hanging signage along route 32 should be removed, and the location of the inspection room should be marked by protruding identification signage on the door of the inspection room. Finally, the intersection (point C) with the intersection of the route 2–8 is a T-shaped intersection, but there is also a route number 7 further down along route number 8, so the signage type that should be set up at this intersection should be an up hanging sign, and the guidance content should be the identification space and examination room that the route will pass through, and then the target space and examination room that the secondary route belongs to should be added. The primary and secondary structures of the different routes will be displayed to facilitate the identification of the destination by the patients.
Next, Depthmap software is used for the isovist analysis, and we can see that the escalator’s route 34 reaches the first floor of the basement, and the first thing is the open area formed by routes 33, 34, 193 and 255 (
Figure 12). When the spatial characteristics of this area are not clear enough, it is easy to be confused and not know how to move. In addition, for the ring-shaped area formed by the routes 32, 2, 186 and 8 the two opposite sides are of equal length, that is, there is a “symmetrical ring” spatial structure (
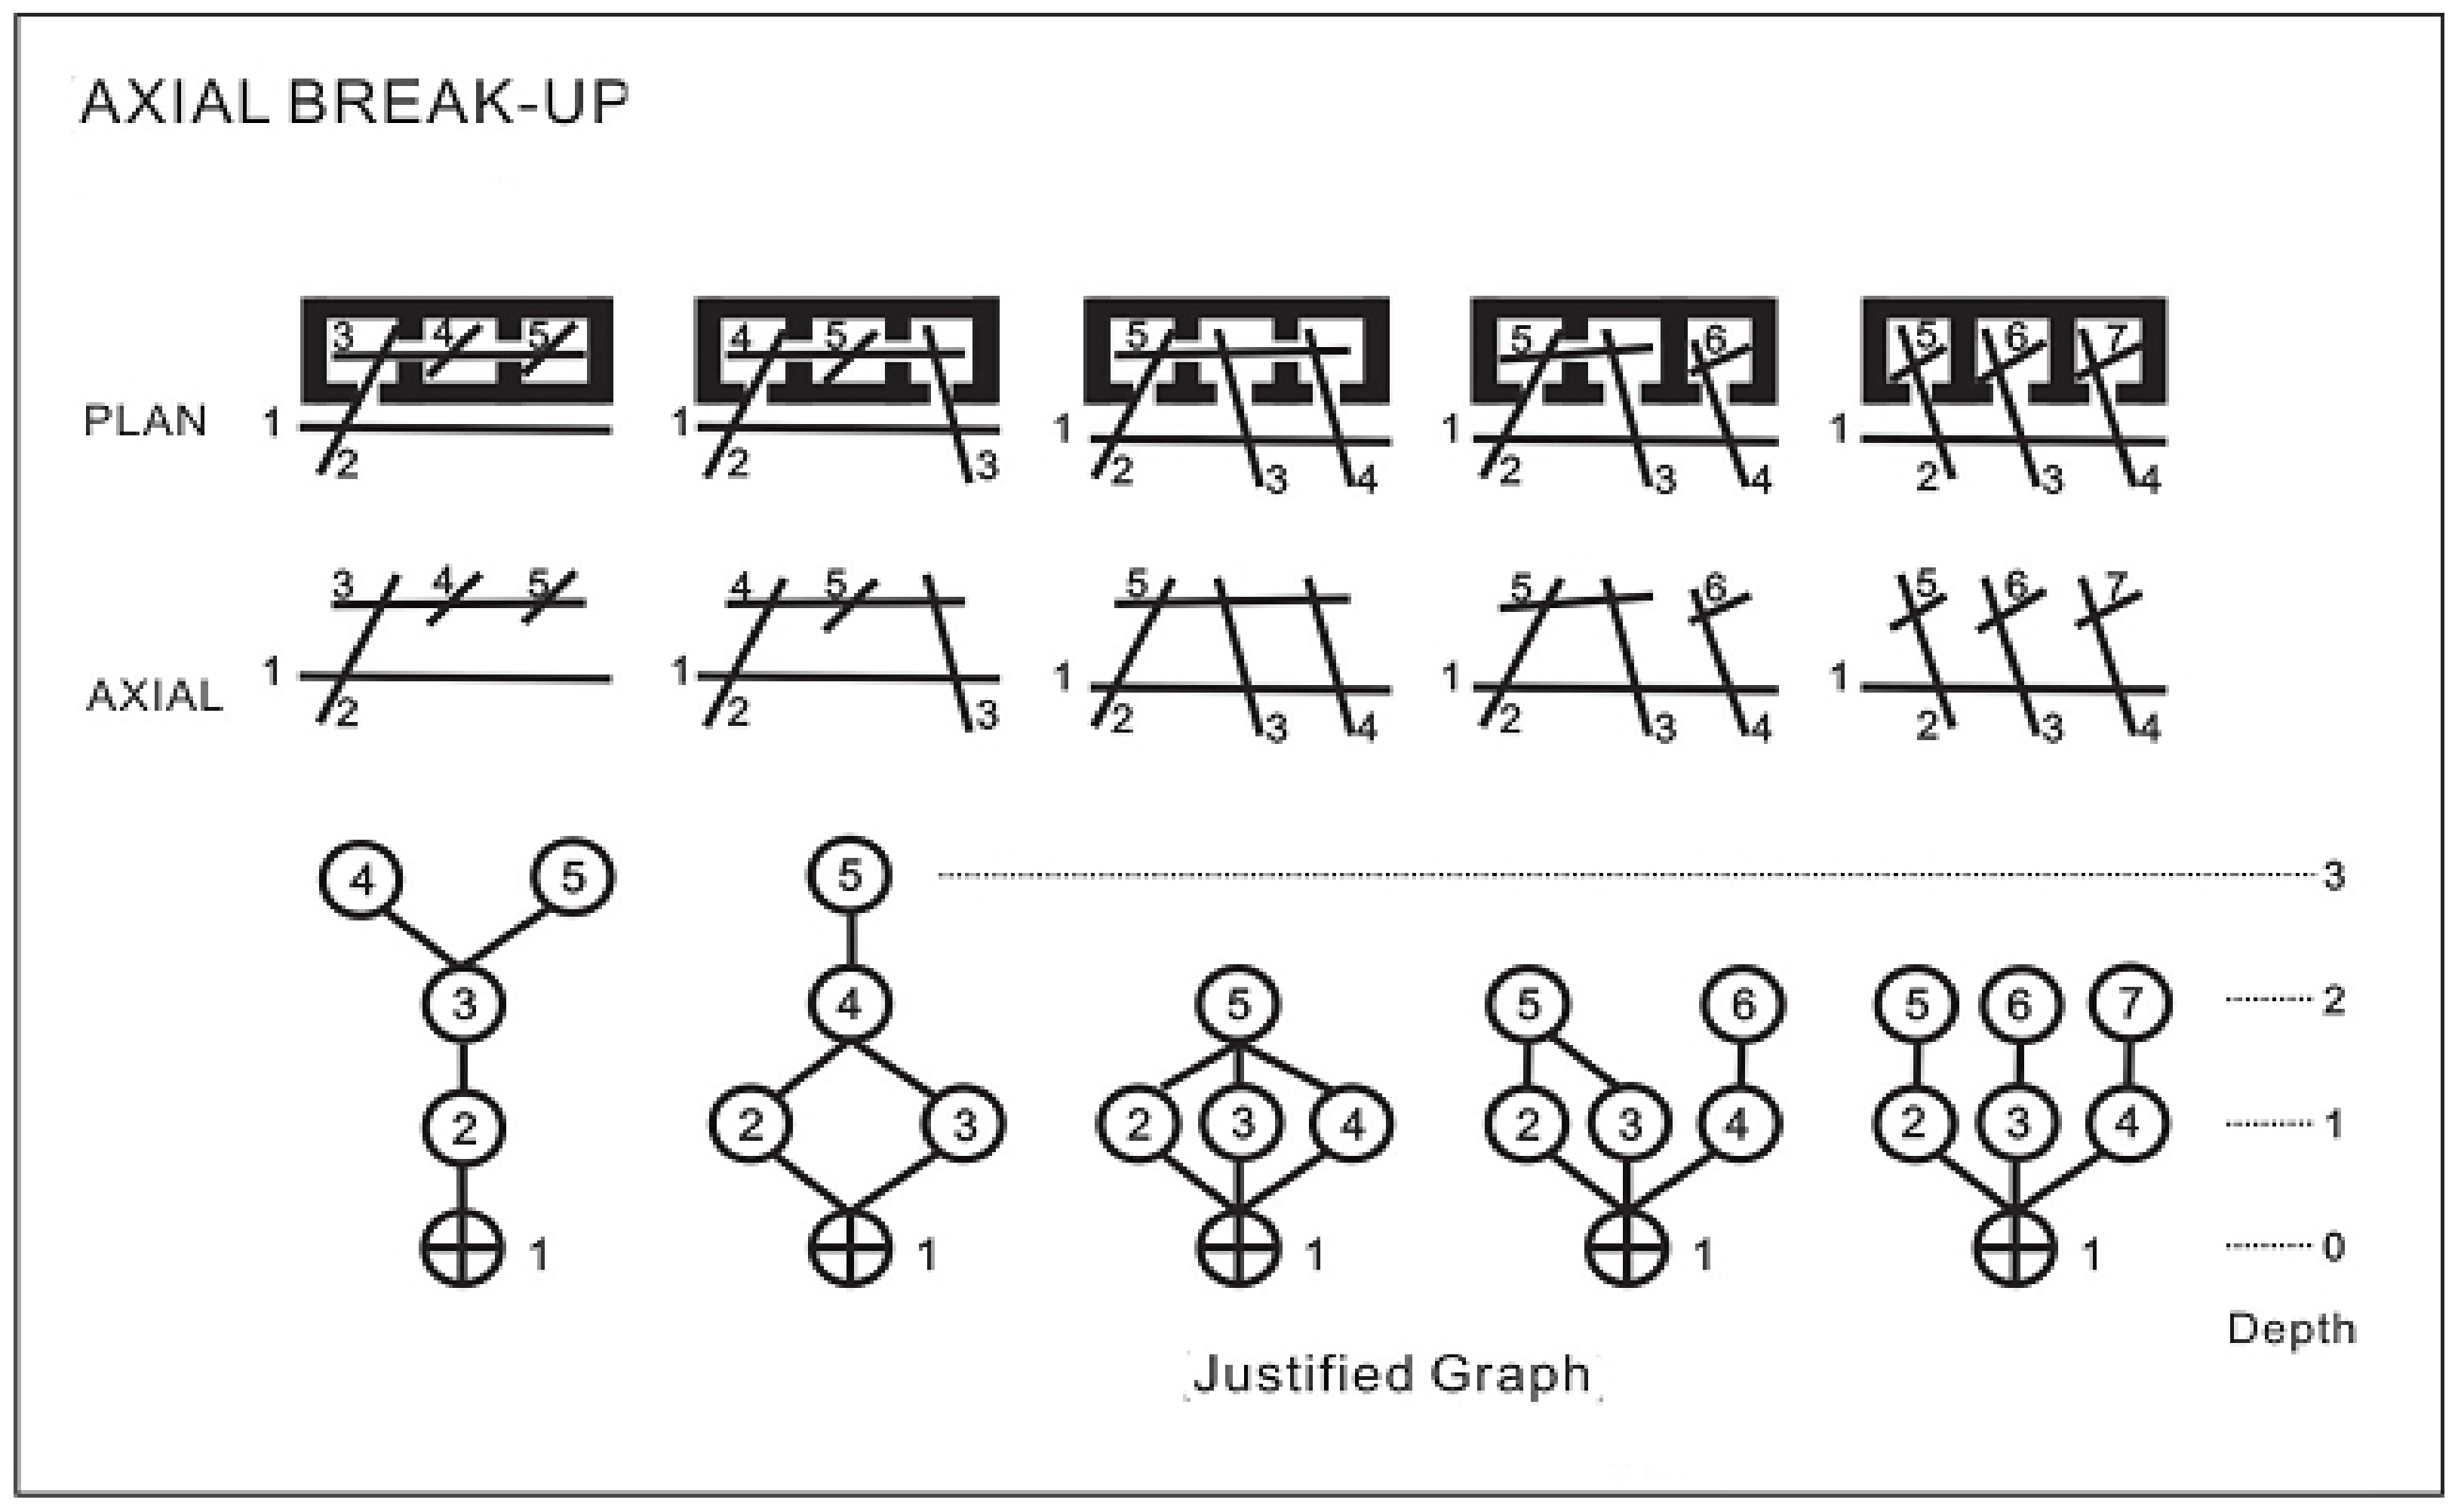
Figure 12, red rectangular area), making the spatial system of this area too homogeneous, and thus, it is difficult for people to identify the various routes and so they can easily become lost. It is recommended that a good outpatient area plan should be a symmetrical tree plan with clear indicators in areas that are easy to become lost in, as this will provide clear and precise information to the public.


