Abstract
Mobile map applications are increasingly used in various aspects of our lives, leading to an increase in different map use situations and, therefore, map use contexts. Several empirical usability studies have identified how map design is associated with and impacted by selected map use context attributes. This research seeks to expand on these studies and analyzes combinations of map use contexts to identify relevant contextual factors that influence mobile map design usability. In a study with 50 participants from Colombia, we assessed in an online survey the usability of 27 map design variations (consisting of three map-reading tasks, three base map styles, and three interactivity variants). We found that the overall map design is critical in supporting map-reading activities (e.g., identifying a location on a map was supported by a simplified base map, whereas selecting points on the map was supported by a more detailed base map). We then evaluated user patterns in the collected data with archetypal analysis. It was possible to create archetypal representations of the participants with a corresponding map design profile and establish a workflow for modeling patterns in usability and context data. We recommend that future research continues assessing archetypal analysis as it provides a means for context-based decision-making on map design adaptation and transferability.
1. Introduction
In our mobile digital society, mobile map applications are increasingly used in different aspects of our lives, leading to an increase in varying map use situations (i.e., map use contexts) [1]. Adjusting map design towards the contexts of use supports map users in their cognitive abilities to use mobile maps [2]. The evaluation of context attributes is therefore crucial for designing suitable maps and for defining how the map design should vary between map use contexts. As maps can be created in many ways [3], the question persists about how to design maps to account for these contextual differences in map use, i.e., users’ digital or spatial abilities, cognitive limits, domain knowledge, or temporal and environmental distractions. Analyzing these contextual factors helps identify suitable map designs in terms of usability and how the map design should vary between different contexts. Therefore, it is not only necessary to structure and model map use contexts [4] but also to understand which context attributes are most relevant to determining an adequate map design [5].
Research on map use contexts associated with the design of mobile map applications has been conducted since the early 2000s (e.g., see Reichenbacher [6] or Sarjakoski and Nivala [7]). While research on location-based services [8] has advanced since then, research on map use contexts and context-based map design has not received much attention in GIScience. In recent years, research on map use contexts regained interest through the concepts of map design transferability [5,9] and inclusive cartographic design principles [1]. However, most approaches to dealing with map use contexts and context-based map design have been developed on a theoretical basis, and practical guidelines are missing.
Hence, this study seeks to evaluate mobile map design usability associated with map use context attributes. Several empirical user studies have evaluated selected map design elements regarding individual context attributes of map use situations [9], e.g., user characteristics such as age and gender [5,10]. We expand this approach and analyze combinations of mobile map design elements (consisting of different base map styles and interactivity variants) and how their usability changes by varying map use contexts (i.e., map use activities and map users). We are further interested in modeling the collected context and usability data and identifying relevant map use context attributes, which modify map design usability. We base our methodology on the principles for context modeling outlined by Griffin et al. [5] and expand their approach by evaluating ways to computationally structure map use contexts to detect relevant context attributes for evaluating map design transferability.
We aim to first analyze user context attributes in their interplay with different mobile map design variations. Our second objective is to computationally model map use contexts associated with map design usability. In particular, we intend to answer the following research questions:
- How does the evaluation of map design usability differ between users and their map use contexts?
- What are relevant map use context attributes that influence the evaluation of map design usability?
- What is the best methodology to model differences and similarities between users in their map use contexts and evaluate the map design usability?
To answer these questions, we evaluated the usability of 27 different map design variations in relation to map use context attributes. Through an online survey with 50 participants from Colombia, we assessed how successful, comfortable, and confident they were using these varying map designs. Besides analyzing the survey data, we also examined differences and similarities between participants, their map use contexts, and the map design usability evaluation by applying archetypal analysis as a computation model.
2. Related Work
Context is commonly described as “any information that can be used to characterize the situation of an entity. An entity is a person, place, or object that is considered relevant to the interaction between a user and an application, including the user and applications themselves.” [11] (p. 305). The definition demonstrates how diverse context can be, possibly leading to a vast number of context attributes to describe a use situation. Reichenbacher [4] provides a structure to group context attributes into information about the user (e.g., spatial abilities), the map use situation (e.g., seasons, environment), activities that users might carry out (e.g., tasks, actions), the displayed information (e.g., geographic features), and the system itself (e.g., device, network). In a newer approach to modeling map use contexts, Griffin et al. [5] differentiate context information about the map user, the map itself, the map use activity, and the map use environment. The same authors argue that there is still a research gap regarding effectively describing contexts and implementing context-based map designs.
The assessment of users, their map use contexts, and the related emerging needs to the design of maps are integral to a user-centered design (UCD) approach. Documenting insights regarding the map design related to map use situations helps determine whether these insights are transferable to other map use situations [9,12]. Several user studies have been conducted to evaluate map design in regard to map use context attributes, e.g., in terms of differences in map use situation [13,14,15], digital and map use literacy [16,17], purposes of use [7,18,19], or cognitive abilities [20,21]. However, it is also necessary to learn more about how the map design is affected by factors such as environmental distractions or affective/emotional responses [5], which are context attributes that are currently underrepresented in user studies. Furthermore, while most map use studies focus on selected context attributes, we must acknowledge that context attributes are interdependent and need to be analyzed in an aggregated form if we aim to study real map use situations [5,6].
While categorizing context attributes supports structuring and documenting the information to describe each map use situation, it is essential to define what relevant context attributes are to distinguish map use situations for making a proper judgment on adjusting the map design [4] or transferring it to other contexts [9]. Therefore, Griffin et al. [5] offer an approach to identify relevant contextual factors by comparing map use situations. They propose to define relevant context attributes by analyzing differences between users in their map use contexts for a given situation. Identified differences between map use situations then indicate the relevance of context attributes on which map design decisions can potentially be based. However, this approach must be evaluated in terms of its applicability and usefulness in real-world map use contexts.
Computational methods and data science practices can build on the outlined principle by Griffin et al. [5] to detect the aforementioned differences between users in their map use contexts more easily and automatically. Data science methods such as clustering methods are commonly used to identify similarities between data points in a dataset. Established clustering methods are hierarchical clustering [22] or k-means [23], which group data points of a dataset into a predefined number of clusters. A typical requirement for the output of this analysis is that a data point can only be assigned to one of the clusters. Therefore, the interpretation of the results is more straightforward, but important information, such as the closeness of a data point to other clusters, is discarded. Another data-driven approach is dimensionality reduction, whereby only “relevant” features of a dataset that represent all other features are retained. However, commonly used dimensionality reduction methods, such as Principal Component Analysis [24] or Singular Value Decomposition [25], only focus on maximizing variance in the reduced space. Therefore, the algorithm can be used to select relevant features, but the interpretation of the results is difficult [26].
An alternative data-driven approach to detecting similarities and differences in a dataset is archetypal analysis, which can tackle the aforementioned limitations of the other methods [27]. When archetypal analysis is applied to a dataset, it is split into a predefined number of archetypes (similar to the number of clusters in clustering methods), which represent the dataset. Archetypes can be seen as a combination of characteristics that best describe the dataset. Contrary to clustering, in archetypal analysis, the data points are not assigned to a single cluster but are rather a blend of several archetypes (i.e., data points are positioned on a spectrum between archetypes). Every data point has a weight that represents the degree to which it is associated with an archetype. In the case of probabilistic archetypal analysis, all weights of the data points sum up to one [28]. The spectrum between archetypes allows us to understand stronger affiliations of data points to a certain archetype (exhibiting particular characteristics), similar to clustering methods. However, through the representation along a spectrum, the individual differences characterizing each data point are retained.
3. Experiment Methods
For our experiment, we designed 27 map design variations and tested these in an online survey with participants from the city of Cali, Colombia. We used the GeoCitizen mobile application (geocitizen.org) to design the maps and create the survey. The tested map design variations consisted of a combination of three different base map styles and three different interactivity variants. We combined these map design elements with three map-reading tasks that participants were asked to solve using the map. We applied a between-subjects study design, where each participant received a randomized subset of 15 map design variations (see Figure 1 for an example of a map design variation). We opted for a between-subjects study design to avoid overburdening participants by showing all the 27 map design variations. Instead, we selected only 15 map design variations to reduce the completion time of the survey.
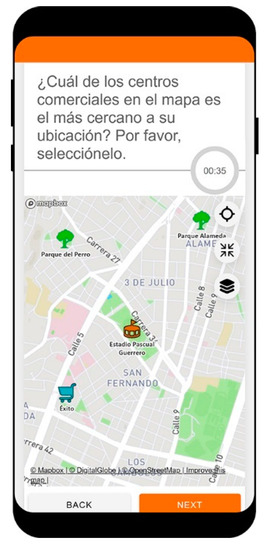
Figure 1.
Example of a map-reading task with a respective question and map design (English translation: “Which shopping mall is the closest to your location? Please select one.”).
Besides assessing the participants’ success in solving the map-reading tasks using the corresponding map, we also asked them about their comfort and confidence levels when solving the map-reading tasks. We also asked participants some general questions and collected general map design preferences (see the following sub-sections for more detail). In our experiment, we structured map use contexts based on the model by Griffin et al. [5] and differentiated between the map user (i.e., participant characteristics), the map use activity (i.e., map-reading tasks), and the map itself (i.e., the map design elements).
3.1. Participant Recruitment
Participants were predominantly recruited through social media channels, where we posted the link to the online survey in community and “blackboard” groups concerning citizens from Cali, Colombia. All participants were familiar with the map content as the maps centered on the city of Cali and featured commonly known landmarks of the city (see Section 3.2). In total, 85 participants started, and 50 participants completed the survey voluntarily. The survey data were collected anonymously. The mean age of all participants was 34 years (SD: 11.58). 30 women and 20 men completed the survey of which the majority (26 participants) had an undergraduate degree. On a 5-point Likert-scale (low to high values), participants were comfortable using smartphones with a mean of 4.32 (SD: 0.82) and using maps with a mean of 3.84 (SD: 0.98). Most participants were using maps about once a week (M: 1.8, SD: 0.67). Table 1 provides an overview of all measured participant characteristics.

Table 1.
Participant characteristics.
3.2. Materials
We created 27 different map design variations that were a combination of three different map-reading tasks, three base map styles, and three interactivity variants (Table 2).
Table 2.
Map-reading tasks, base map styles, and interactivity variants.
Each map design variation was presented along with a question (see Table S1). To answer the questions, participants had to interact with the map and carry out basic map-reading/interaction tasks [29,30,31], which were focused on visual searches [20]. Participants were asked to identify a location by tapping on the base map to create a marker (T1), select a single point feature (T2), and select multiple point features (T3). These types of map-reading/interaction tasks are commonly found in mobile map applications, requiring the participants to identify and locate, compare and interpret, and rank map features [31].
Following Konečný et al. [32] in terms of testing different base map styles, and Bestgen et al. [33], Edler et al. [34], and Liao et al. [20] in terms of testing different map detail densities, we presented three different base map styles which varied in their quantity of presented information and symbology. Different map detail densities and types of symbology potentially influence the cognitive load of the participants and, therefore, their efficiency and effectiveness in interpreting the map. Hence, we aimed to review the effect of varying base map styles (that differed in terms of the map detail densities and symbologies) in combination with different map-reading tasks and interactivity variants.
The base maps were all created with Mapbox Studio (studio.mapbox.com) and focused on the city of Cali, Colombia. The Landmark map (Figure 2) was created by selecting primary streets and water bodies of the Mapbox Streets base map to create a map with reduced information density. Based on simplified maps found in participatory community mapping projects [35,36], we collected the most important landmarks through local contact partners and included them as easy-to-read icons. For the icons, we adjusted the Mapbox Maki icons (labs.mapbox.com/maki-icons) by applying colors and increasing their size to highlight these landmarks. For the Simple map (Figure 3), we used the Mapbox Streets base map, selected only the primary and secondary streets, and removed the points of interest. Instead, we included the landmark icons from the Landmark map. As a third base map, we used the commonly used general-purpose Mapbox Streets base map without any alterations (Figure 4).
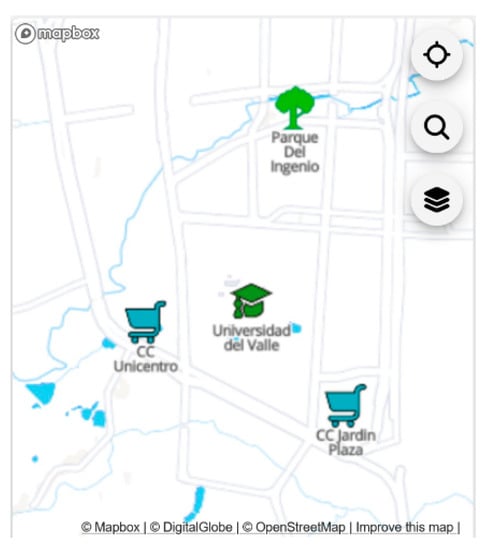
Figure 2.
Landmark map.
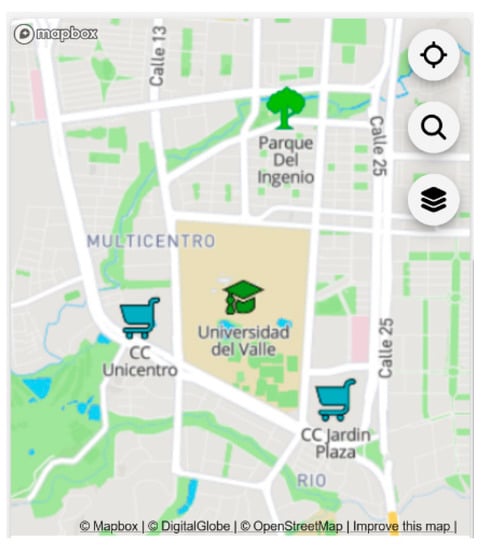
Figure 3.
Simple map.
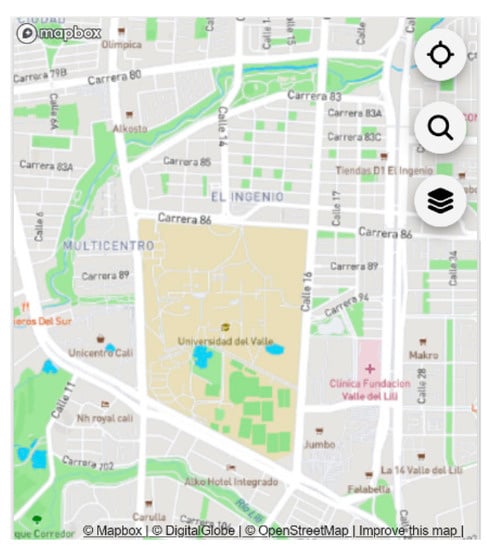
Figure 4.
Mapbox Streets.
Figure 5, Figure 6 and Figure 7 further visualize examples of the combination of map-reading tasks and base map style variants. Figure 5 illustrates the map-reading task where participants were asked to identify a location (T1) on the Mapbox Streets base map; Figure 6 shows the map-reading task requiring participants to select a single point feature (T2) on the Simple map; and Figure 7 depicts the map-reading task requiring participants to select multiple point features (T3) on the Landmark map.
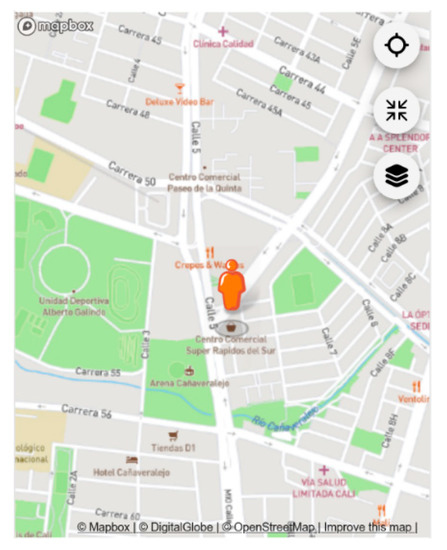
Figure 5.
Map-reading task T1 (identify a location on the map) with the Mapbox Streets base map.
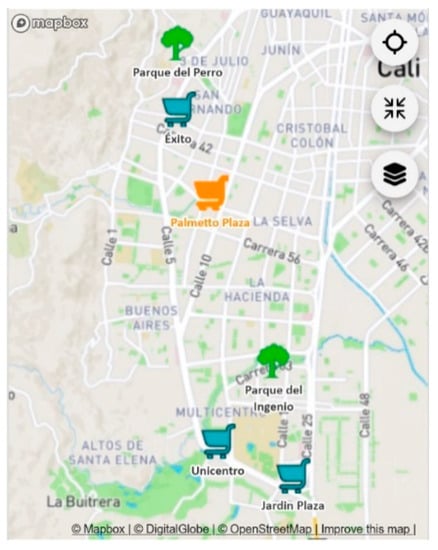
Figure 6.
Map-reading task T2 (select a point feature) with the Simple map.
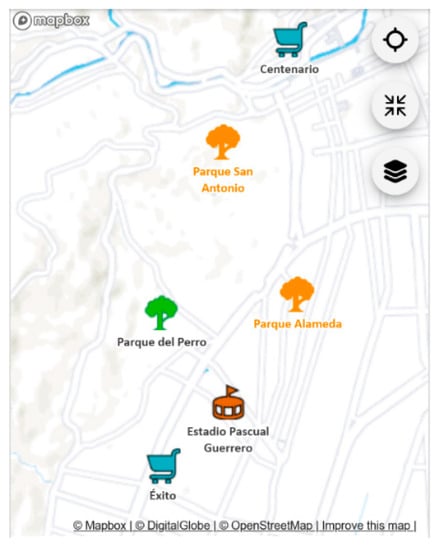
Figure 7.
Map-reading task T3 (select multiple point features) with the Landmark map.
We further built on the approach presented by Vincent et al. [37], testing different interface complexities in terms of scope and freedom. Their study indicated that interface complexity was relevant for the decision outcomes of their participants. Hence, we extended their approach by testing interface complexities in combination with different map-reading tasks and base map styles to examine whether different complexities could potentially be reduced by the overall map design. We selected three different degrees of interactivity: a static map, which did not allow the participants to zoom or pan on the map; a restricted map, where the participants could zoom and pan within defined bounds (supporting the participants to “not get lost” on the map); and, lastly, a non-restricted map, where the participants had no restrictions and were free to navigate on the map (which is the standard interactivity mode for map applications).
3.3. Survey Structure and Procedure
We divided the survey into three sections. In the first section, we provided instructions on how to solve the map-reading tasks on the maps. For this, we posed two pre-test map-reading tasks with a corresponding map design and provided a video tutorial to instruct the participants on how to solve the map-reading task and use the maps. The selected pre-test map design variations were (a) how to identify a location on the restricted Simple map and (b) how to select a point on a non-restricted Mapbox Streets base map.
In the second survey section, each participant was randomly assigned a subset of 15 map-reading tasks in random order. An integrated timer showed the elapsed time for each map-reading task and map design variation. After each map design variation, we posed two follow-up questions to understand the participants’ comfort and confidence levels while interacting with the map (Table 3):
Table 3.
Follow-up questions.
We distributed the survey in November and December 2019. The survey was written in Spanish. Participants received the survey as an online link and were asked to complete the survey on their mobile devices at their convenience.
3.4. Analysis
We calculated descriptive statistics to evaluate the task success rates, along with the participants’ comfort and confidence ratings for each of the map design variations. We also applied a logistic mixed-effects regression model [38] to evaluate possible statistical relationships between usability evaluation, map design elements (base map styles and interactivity variants), and map use activity (i.e., map-reading tasks) using the glmer-function of the “lme4” package in R (github.com/lme4/lme4).
We then structured the collected survey data and identified relevant map use context attributes to distinguish our participants in their map design usability evaluation. Since the outlined concepts in Griffin et al. [5] for modeling map use contexts have not been tested with real-world datasets, applying archetypal analysis provides new means to demonstrate the applicability of this approach. Hence, for our experiment, we calculated archetypes by applying archetypal analysis to the dataset. We used the “archetypes” package in R (cran.r-project.org/package=archetypes) and preprocessed and structured the data before feeding them into the model.
Since we applied a between-subjects study design, not all participants received all 27 map design variations. Each of the 50 participants received a subset of 15 map design variations, which resulted in null values for the rest of the 12 map design variations that the participants did not receive. Since archetypal analysis does not accept null values to be fed into the model, we calculated averaged map design usability result scores per participant (averaged task success, comfort, and confidence ratings) for each map design element (i.e., base map styles and interactivity variants) and map-reading tasks. This poses a limitation to the study, which we will elaborate on in Section 5.2.
To run the archetypal analysis, we created data subsets to only include the averaged usability result scores of the map design elements and map-reading tasks per participant without including the participant characteristics. Our goal was to create a reduced high-level representation of the averaged usability scores to identify which data points and features are similar. Subsequently, we correlated the resulting archetypes with the data on the map user (participant characteristics) (see below).
After preprocessing, we applied archetypal analysis to the dataset. As outlined in Section 2, the goal of the archetypal analysis is to identify archetypes in the dataset. The method follows an iterative process with two underlying principles [28]. First, each individual data point is approximated by a convex combination of the archetypes where the residual sum of squares (RSS) is minimized:
where by X is the dataset, is the coefficient of the archetypes, and Z is a matrix representing the archetypes.
The second principle is that the archetypes are convex combinations of the data points:
where by is the coefficient of the dataset.
The archetypal analysis method iterates between finding the best coefficients of the archetypes () and convex combinations of the data points () with respect to minimizing the RSS [28].
After calculating the archetypes, we merged the archetype results with the participant characteristics. We subsequently ran a correlation analysis with all variables. With this, we were able to identify correlations between archetypes and participant characteristics to determine whether participant characteristics influence the archetypal patterns (i.e., the resulting map design usability evaluation profile of each archetype).
4. Results
In the following sections, we first present the results of the descriptive analysis of the survey data and then continue by presenting the results of the archetypal analysis.
4.1. Overall Task Success, Comfort, and Confidence Ratings
Each map design variation was used on average 27.78 times. On average, 75% of the participants correctly solved the map-reading tasks in combination with the respective map design elements (11.26 of 15 map-reading tasks; SD: 0.19). On average, 82% of the participants felt comfortable solving the map-reading tasks (12.27 of 15 map-reading tasks; SD: 0.22), and 83% felt confident that the solution was correct (12.48 of 15 map-reading tasks; SD: 0.18).
Figure 8 shows the task success, comfort, and confidence ratings for each map-reading task. The map-reading task requiring participants to select a single point feature (T2) yielded the highest task success rate of 82%. In contrast, the lowest task success rate (69%) was achieved for the map-reading task requiring participants to select multiple point features (T3). The comfort and confidence ratings were similar for each map-reading task, but the map-reading task requiring the selection of a point (T2) received the highest scores.
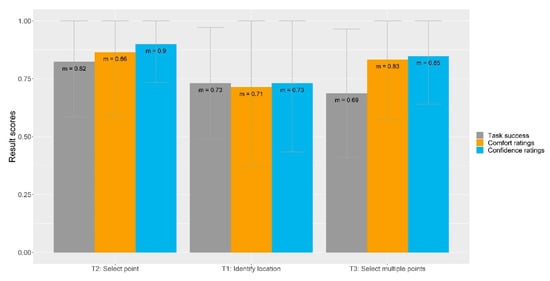
Figure 8.
Task success, comfort, and confidence ratings by task.
Figure 9 shows the task success, comfort, and confidence ratings for each base map style. The scores for all three base maps are very similar, and no clear distinction is visible. The Mapbox Streets base map exhibits the highest scores in task success, comfort, and confidence ratings.
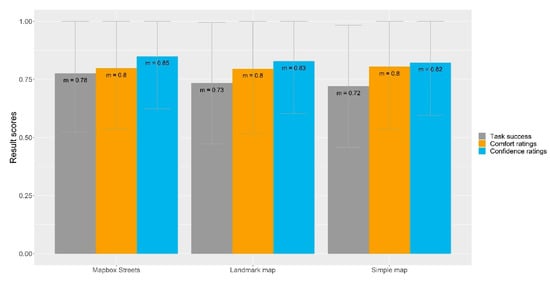
Figure 9.
Task success, comfort, and confidence ratings by base map.
In terms of general base map preferences, 92% of the participants preferred the Landmark map over the Simple map. The same preference was evident when comparing the Simple map with the Mapbox Streets base map, with a preference towards the Simple map (82%). In contrast, 76% of the participants preferred the Mapbox Streets base map over the Landmark map.
Lastly, Figure 10 shows the task success, comfort, and confidence ratings for each interactivity variant. The static map exhibits the highest scores (ranging between 87% and 94%). While the non-restricted variant shows a slightly higher task success rate (65%) than the restricted variant (63%), the comfort and confidence ratings were slightly higher for the restricted variant (80% and 78%, respectively) compared to the non-restricted one.
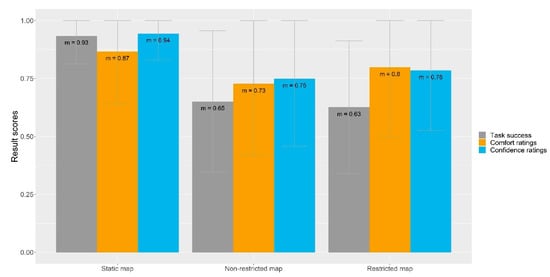
Figure 10.
Task success, comfort, and confidence ratings by interactivity variant.
4.2. Task Success, Comfort, and Confidence Ratings by Map Design Variation
In addition to the overall task success, comfort, and confidence ratings, we were also interested in the result scores for each map design variation by map-reading tasks. Figure 11 depicts the scores of each base map style by map-reading task. While the scores are similar for all base map styles regarding the comfort and confidence ratings of the participants (no statistically significant relationships were found), the results for the task success differ between base map styles. While for the map-reading task requiring participants to identify a location (T1), the Mapbox Streets base map shows the lowest task success rate (negatively correlated with p < 0.01), it yields the highest task success rate for the other two map-reading tasks (i.e., to select a point (T2) and to select multiple points (T3)). We also identified significant relationships that support this, namely a negative correlation between the Simple map (p < 0.05) and T2, and negative correlations between T3 and the Landmark map (p < 0.001) and the Simple map (p < 0.01).
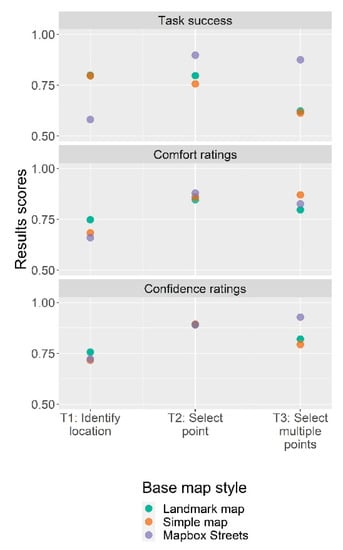
Figure 11.
Task success, comfort, and confidence ratings of base map by map-reading tasks.
Figure 12 shows the result scores for the interactivity variants by map-reading tasks. In contrast to the base map styles, the results differ more between the interactivity variants. In general, the static map exhibits the highest result scores, especially for the task success rate, and, in particular, for the map-reading task requiring participants to select multiple points (T3). The restricted and non-restricted variants are similar for the task success rate, but the non-restricted variant yielded slightly higher scores. For all map-reading tasks, the restricted and non-restricted maps are negatively correlated with the task success rate (all with p < 0.001 except for the non-restricted map and T2, which yielded a value of p < 0.01). Regarding comfort and confidence ratings, the restricted and non-restricted interactivity variants are similar for the map-reading tasks requiring participants to identify a location (T1) and select a point (T2). However, they differ slightly for the map-reading task requiring participants to select multiple points (T3), with the restricted variant yielding higher scores. Statistically significant relationships between the comfort ratings and the interactivity variants were found for the non-restricted map for T1 (negatively correlated with p < 0.05) and for the restricted and non-restricted maps for T3 (negatively correlated with p < 0.05 and p < 0.001, respectively). For the confidence ratings, the restricted and non-restricted maps were negatively correlated for all map-reading tasks (T1: p < 0.001 for both variants; T2: p < 0.05 for both variants; T3: p < 0.01 and p < 0.001 for the restricted and non-restricted variants, respectively).
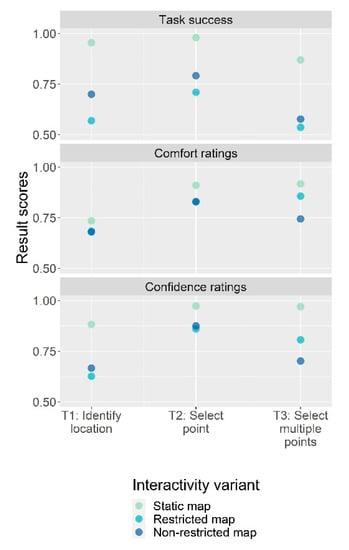
Figure 12.
Task success, comfort, and confidence ratings of interactivity variant by map-reading tasks.
In addition, we were interested in relating the interactivity variants to the base map styles (Figure 13). While the result scores for the static map are similar between the base map styles, they differ for the restricted and non-restricted interactivity variants, especially in terms of task success. For most of the interactivity variants, the Mapbox Streets base map exhibits the highest result scores. The statistical analysis did not yield any significant correlations.
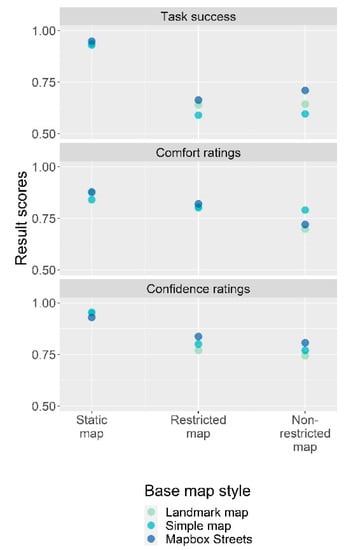
Figure 13.
Task success, comfort, and confidence ratings of interactivity variant by base map styles.
4.3. Archetypal Analysis
We applied archetypal analysis to understand patterns in the dataset and identify relevant similarities or differences between the participants and their evaluation of map design usability. We used the RSS of the calculated models to assess the optimal number of archetypes to represent the dataset (i.e., “elbow method”) and selected six archetypes to be used for further analyses (Figure 14). The RSS for the model with six archetypes amounts to 0.15.
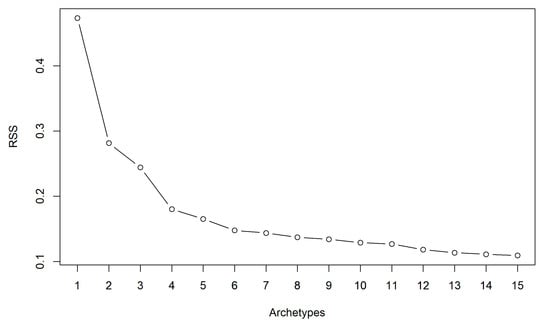
Figure 14.
Scree plot of RSS by number of archetypes.
The simplex plot shown in Figure 15 visualizes the distribution of the data points (i.e., the participants and their map design usability evaluation) on the spectrum of the six archetypes. Here, light grey/blue colors indicate low RSS values, and dark blue colors indicate high RSS values of each data point. Data points with high RSS values indicate that they are not well enough represented by the archetypal model (also see Table S2 for the residuals of each data point). Data points near archetypes are generally represented well by the model (low RSS values). However, some data points, mainly in the middle of the plot, seem not to be well enough represented (high RSS values). We discuss possible reasons for this in the discussion section.
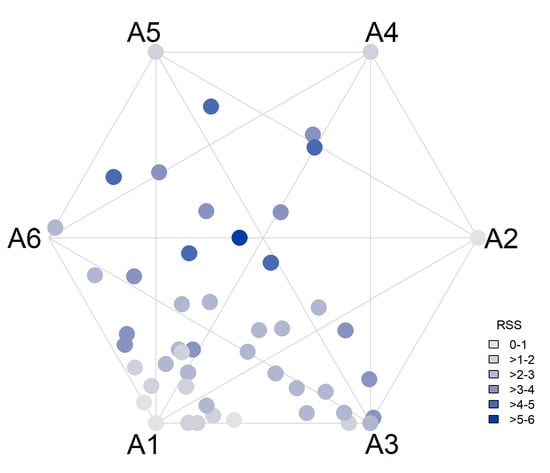
Figure 15.
Simplex plot with the RSS of six archetypes (with light grey/blue colors indicating low and dark blue colors indicating high RSS values).
Most of the data points are clustered around archetypes A1 and A3. The connecting lines between the archetypes can be used to identify relationships (i.e., a spectrum) between archetypes. While the data points near A1 indicate relationships with all other archetypes, the data points around A3 mostly have relationships with A1, A5, and A6. Possible outliers may be found around archetypes A2, A4, and A5.
Table 4 gives the corresponding usability evaluation profile for each archetype. As most of the data points are assigned large coefficient scores for archetypes A1 and A3, these are the archetypes of interest. Based on the metrics, participants near archetype A1 tend to exhibit high scores for any metric and any map design element and map-reading task. By contrast, participants closer to A3 have a reduced task success rate for most of the map design elements and map-reading tasks, but similar high comfort and confidence ratings as for A1. In particular, lower task success rates are found for the Simple base map style and the restricted and non-restricted interactivity variants.
Table 4.
Usability scores of map design variation categories by archetype (with purple colors indicating low values and green colors indicating high values on a standardized scale between 0 and 1).
While most of the data points show strong relationships with archetypes A1 and A3, they also exhibit relationships to other archetypes based on their coefficients. Therefore, most participants can be described as blends between archetypes A1 or A3 and other archetypes. In particular, many participants blend with archetype A6, which represents participants with a tendency to exhibit high task success scores but generally have lower comfort and confidence ratings. Furthermore, participants that blend with archetypes A2, A4, and A5 mostly show decreased task success scores for multiple map design elements and map-reading tasks. Hence, depending on the mixture of archetypes a participant is associated with, the combination of map design elements and map-reading tasks can be adjusted accordingly to support them when using the maps. For example, a participant that blends with archetype A5 would be supported by using a static Simple map instead of a non-restricted Landmark map in the map design.
We ran a correlation analysis to further evaluate the relationships between participant characteristics and archetypes (Figure 16). Based on the results, we were not able to depict strong relationships between participant characteristics and archetypes. However, we found that the variable map use frequency positively correlates with participants have had previous map use experience and are comfortable using maps. We further noticed a slight negative correlation between archetype A1 and all other archetypes. The same is also noticeable for archetype A3. This supports the results from the previous paragraphs in terms of the relevance of both archetypes A1 and A3 as they can be clearly distinguished from the other archetypes.
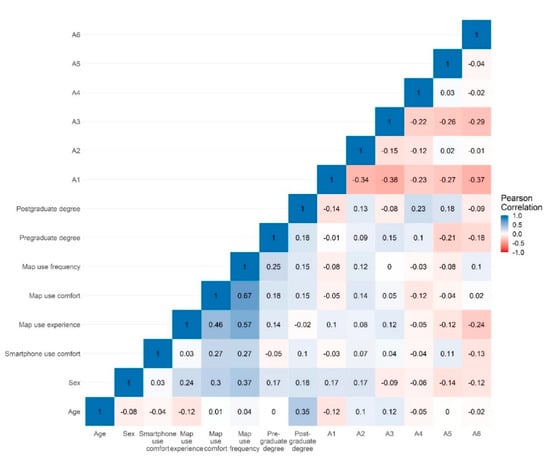
Figure 16.
Correlation matrix of participant characteristics and archetypes.
Using archetypal analysis, it was possible to reduce the dataset from 27 features (i.e., task success, comfort, and confidence ratings of each map design element and map-reading task) to six representative archetypes. To demonstrate the usefulness of the dimension reduction of applying archetypal analysis, we ran the same correlation analysis over the entire dataset before applying the archetypal analysis (see Figure S1). The complexity of interpreting the correlation matrix demonstrates the advantage of reducing the dataset to this archetypal representation of the participants.
The representation of participants through archetypes further helps to identify the affiliation of each participant to these archetypes. For example, one of our participants has a 99.9% affiliation to archetype A1, is 30 years old, has an undergraduate degree, and is a self-rated frequent and comfortable smartphone and map user. The usability evaluation of that person exhibits high task success rates, comfort, and confidence ratings for any map design element and map-reading task. In contrast, another participant, with a 56% affiliation to archetype A6 and a 44% affiliation to A2, is 23 years old, also has an undergraduate degree, and is also a self-rated frequent and comfortable smartphone and map user. However, the map design must be adjusted to suit this user as the usability evaluation revealed low task success scores with the restricted and non-restricted maps.
5. Discussion
In our usability evaluation with participants from Cali, Colombia, we analyzed the data of 50 participants interacting with map design variations. Besides analyzing the map usability experienced by these participants, we were also interested in understanding patterns in the collected data on map use contexts (i.e., map user, map use activity, map design) and usability evaluation. We were particularly interested in building on the approach outlined by Griffin et al. [5] to find differences between the map use contexts of participants and their usability evaluation and to find relevant contextual factors that distinguish these participants. In the following, we will discuss our findings, applied methodology, and limitations of the study.
5.1. Usability Evaluation
Our first research question was intended to help us understand our participants’ evaluation of the map design usability. The map-reading task requiring participants to select a single point (T2) achieved the best overall result scores in terms of the map-reading tasks. The map-reading task requiring participants to select multiple point features (T3) yielded the worst task success rate. Comfort and confidence ratings were only slightly lower for T3 than for T2. We assume that selecting multiple features might have led to a higher error rate because participants needed to find two suitable features (instead of just one as for T2) to correctly solve the map-reading task, leading to an increase in cognitive load [20]. For the map-reading task requiring participants to identify a location on the map (T1), participants were only slightly less successful than with T2. However, participants felt less comfortable and were less confident about their responses. We assume that the ability to choose from a predefined set of point overlay features (as for T2 and T3) was helping the participants to respond to the questions and to feel more comfortable and confident about their answers.
While the base map styles yielded similar usability scores, most participants preferred using either the Simple map or the Mapbox Streets base map. In addition, the map-reading task requiring participants to identify a location on the map (T1) was supported when combined with a Landmark map or Simple map. By contrast, the map-reading tasks requiring participants to select single or multiple point features (T2 and T3) were aided by the Mapbox Streets base map. Hence, for T1, we assume that the perceived increased difficulty in identifying a location on the map was overcome by a simplified base map that highlights relevant points of interest. We also observed that for the map-reading tasks, the result scores of the different base map styles differed more in terms of the task success while they were similar for the comfort and confidence ratings. We assume that highlighted points of interest on the map (with the Landmark map and Simple map) led to high result scores in the comfort and confidence ratings, but that a more detailed base map (Mapbox Streets) was better for making the correct choice to solve the map-reading tasks [34].
In terms of interactivity complexity, overall, the static map yielded the highest result scores [37]. When comparing the restricted and non-restricted interactivity variants, both are similar in terms of task success rates, but the restricted version yielded higher comfort and confidence ratings. While the task success rates of the static maps are clearly different from the other two interactivity variants, the comfort and confidence ratings of all variants are similar. The participants were more successful with the static map because the interaction with such a map was much easier. However, the result scores showed that participants were similarly comfortable and confident with the restricted and non-restricted maps, even though the task success was lower due to increased difficulty in navigating on the map. In terms of base map styles, high result scores were achieved in combination with the Mapbox Streets base map. However, the result scores differed significantly between the non-restricted interactivity variant and the other base map styles.
While some map design elements and map-reading tasks were perceived as more or less difficult by our participants, we also observed that the overall map design (i.e., the combination of map design elements and map-reading activities) plays a role in the success of map-reading tasks by overcoming complexities of individual map design elements [20]. This should be considered, in particular, when aiming to counteract possible usability-utility-tradeoffs [39]. In addition, as the recruited participants were citizens from Cali, Colombia, and all map features were commonly known landmarks, the participants were already familiar with the featured map extent and map features. Hence, testing the usability of the map material with participants without prior knowledge of the area, and therefore the map material, might lead to different results.
5.2. Archetypal Analysis
In addition to evaluating map design usability with our 50 participants, our study focused on improving our understanding of which map use context attributes were shaping participants’ usability evaluation, as well as assessing whether differences between participants and their usability evaluations can be observed.
The objective of the archetypal analysis is to reduce the dimensionality of the dataset, i.e., to condense the dataset to “artificial representatives”, which can be used to describe and differentiate the participants. We opted to run the analysis with only the map design usability evaluation data on the map-reading tasks and map design elements without including data on the participant characteristics. The correlation analysis was then used to evaluate whether the participant characteristics can be used to describe differences between the calculated archetypes.
Based on our results, we do not see any clear relationship between archetypal results and participant characteristics. However, it is possible to identify differences between our study participants (regarding their archetypal affiliation) in terms of their usability evaluation regarding map-reading tasks and map design elements. Subsequently, it is possible to determine participants’ needs in terms of the overall map design (i.e., participants close to archetype A2 need a different map design than those close to archetype A1) and create map design profiles for each archetype. While archetypes A1, A3, and A6 are similar (with participants being mostly successful, comfortable, and confident with the map design elements and map-reading tasks), the remaining archetypes differ more in their usability evaluation. However, it was not possible to derive explicit descriptors for each archetype, following the approach of Eugster and Leisch [28] and Seth and Eugster [40]. For example, the authors of the latter study calculated archetypes based on data of winter tourists in Austria, where the resulting archetypes were related to tourist types, e.g., sporty tourist, culturally inclined tourist, or wellness tourist. While one of the goals of this research was to identify descriptive categories based on archetypes, this was not possible based on the results we obtained in this study as no clear pattern emerged from the data on which to base clear archetypal descriptors.
A possible reason for not finding clear patterns to differentiate the archetypes might be the nature of the dataset that we used for the calculation. The dataset might have had an inherent bias in the data on participants’ characteristics (i.e., the self-rated skills of, e.g., smartphone and map use comfort) and self-rated comfort and confidence of the map design usability evaluation. In usability studies, biases in self-rated skills is a common phenomenon and typically the result of participants over-estimating their performance [41,42]. This has possibly affected the resulting archetypal patterns. Another reason might be our dataset preprocessing method. As we had to aggregate the usability evaluation on the map design category level, we lost relevant information on each of the 27 map design variations. Furthermore, usability data on only 50 participants might not have been sufficient to derive meaningful archetypal patterns. In the tourism example of Seth and Eugster [40], the authors used data from almost 3000 tourists for their analysis. Hence, in our case, more data might be useful to identify clear patterns in the archetypal results.
As the archetypes represent extreme values in the dataset, most participants are positioned on the spectrum between various archetypes. While keeping these individualities between participants is undoubtedly helpful to respond to individual map design needs, the interpretation of the archetypal blend of the participants can be difficult. A potential solution might be to assign a map design profile from one blended archetype to these participants and then apply A/B tests to assess whether another map design profile from another blended archetype is more suitable for these participants.
Using archetypal analysis is a novel method to model map use contexts in association with map design usability, and the approach must be tested with other, larger datasets on map use contexts and map design usability. With the study at hand, however, we identified a workflow on how to apply archetypal analysis to the approach outlined by Griffin et al. [5]. We, hence, demonstrated the applicability of both the approach of Griffin et al. [5] and applying archetypal analysis for map use context modeling. With this, we were able to identify a novel, computational way to model map use contexts for map design adaptations and transferability.
6. Conclusions
In this study, we sought to evaluate how map use context shapes mobile map design usability. We conducted an empirical usability study with 50 participants from Colombia, collecting participant characteristics and usability evaluation data of 27 map design variations. Based thereon, we analyzed the effects of map use contexts on map design usability and modeled these effects computationally.
We built on the approach of Griffin et al. [5] and collected context information on the users (i.e., participant characteristics), the maps (i.e., base map styles and interactivity variants), and the map use activities (i.e., map-reading tasks). We further sought to determine differences between our participants in their map design usability evaluation by applying archetypal analysis.
Our results showed that the overall map design (and combinations of map design elements) plays a crucial role in supporting the usability of different map-reading activities. While highlighting points of interest on simplified base maps supported the user experience in terms of comfort and confidence levels, the general-purpose base map of Mapbox Streets supported the task success rate of our participants. Interestingly, while static map interfaces (requiring no zooming or panning) were understandably most suitable for successfully completing the tasks, participants were also similarly comfortable and confident using the more interactivity-loaded map variants (i.e., restricted and non-restricted maps). Additionally, the map-reading task requiring participants to identify a location on the map was supported by simplified base maps (i.e., Landmark map and Simple map), whereas the map-reading tasks requiring participants to select predefined points on the map were supported by the general-purpose base map of Mapbox Streets.
In addition to evaluating the usability of map design variants, we applied an innovative archetypal analysis approach to model data on map use contexts and map design usability. We intended to structure the collected data of our empirical study and find relevant context attributes that distinguish our participants in terms of map use. While we faced several challenges in terms of the collected data (e.g., data preprocessing, participant bias, etc.), it provides the potential for computationally supported decision-making on map design transferability. With the applied workflow, we were able to create ideal map design profiles for each archetype. The workflow further potentially provides the means to detect correlated variables (e.g., participant characteristics), which distinguish and describe the archetypes.
While we faced several challenges with applying archetypal analysis to the dataset of our collected usability data, there is potential for testing and further validating the methods and the applied workflow with other datasets. This research effort supports closing the detected research gaps by improving methods to structure map use contexts, advance our understanding of how contexts modify map design usability, and develop methods to support map design transferability and adaptation. To continue research along these lines, we suggest collecting data on more participants in a within-subjects study design to test the approaches proposed in this article. Further, other map-reading tasks featuring cognitively more demanding map use interactions or other map designs might be interesting to evaluate as well. Future research efforts might also investigate ways in which to include contextual factors of the map use environment, which we have not included in this study but are part of the context model by Griffin et al. [5]. Since we measured the task success rates, comfort, and confidence ratings, it would also be interesting to include evaluation metrics such as learnability, memorability of spatial information, or decision-making accuracy [43,44,45].
Supplementary Materials
The following are available online at https://www.mdpi.com/article/10.3390/ijgi10080527/s1, Figure S1: Correlation matrix of participant characteristics and usability metrics (with TS=task success; Com=comfort ratings; Conf=confidence ratings) of map design variations, Figure S2: Residuals of data points of Archetypal Analysis (with P id = participant id; TS=task success; Com=comfort ratings; Conf=confidence ratings), Table S1: Map-reading tasks with respective question, Video S1: title.
Author Contributions
Conceptualization, Mona Bartling, Clemens R. Havas, Stefan Wegenkittl; Methodology, Mona Bartling, Clemens R. Havas, Stefan Wegenkittl; Validation, Mona Bartling, Clemens R. Havas, Stefan Wegenkittl, Tumasch Reichenbacher, Bernd Resch; Writing-Original Draft Preparation, Mona Bartling, Clemens R. Havas; Writing-Review & Editing, Mona Bartling, Clemens R. Havas, Stefan Wegenkittl, Tumasch Reichenbacher, Bernd Resch; Visualization, Mona Bartling; All authors have read and agreed to the published version of the manuscript.
Funding
This work was supported by the Federal Ministry for Economic Cooperation and Development, Germany under Grant 81206685 by the Austrian Science Fund (FWF), and the Doctoral College—GIScience, University of Salzburg, Austria under Grant W1237.
Data Availability Statement
The data presented in this study are available on request from the corresponding author. The data are not publicly available due to privacy reasons.
Acknowledgments
We would like to thank Fabio Castro, Erika Mosquera, and Aura Bravo (Alliance of Bioversity International and CIAT) for their technical support. We would further like to thank the anonymous reviewers for their helpful comments and suggestions. Open Access Funding by the Austrian Science Fund (FWF).
Conflicts of Interest
The authors declare no conflict of interest.
References
- Roth, R. What is Mobile First Cartographic Design? In ICA Joint Workshop on User Experience Design for Mobile Cartography; International Cartographic Association: Bern, Switzerland, 2019. [Google Scholar]
- Horbiński, T.; Cybulski, P.; Medyńska-Gulij, B. Web Map Effectiveness in the Responsive Context of the Graphical User Interface. ISPRS Int. J. Geo-Inf. 2021, 10, 134. [Google Scholar] [CrossRef]
- Słomska-Przech, K.; Gołębiowska, I.M. Do Different Map Types Support Map Reading Equally? Comparing Choropleth, Graduated Symbols, and Isoline Maps for Map Use Tasks. IJGI 2021, 10, 69. [Google Scholar] [CrossRef]
- Reichenbacher, T. Mobile Cartography: Adaptive Visualisation of Geographic Information on Mobile Devices; Verl. Dr. Hut: München, Germany, 2004; ISBN 3899630483. [Google Scholar]
- Griffin, A.L.; White, T.; Fish, C.; Tomio, B.; Huang, H.; Sluter, C.R.; Bravo, J.V.M.; Fabrikant, S.I.; Bleisch, S.; Yamada, M.; et al. Designing across map use contexts: A research agenda. Int. J. Cartogr. 2017, 3, 90–114. [Google Scholar] [CrossRef] [Green Version]
- Reichenbacher, T. Adaptive Methods for Mobile Cartography. In Proceedings of the 21st International Cartographic Conference (ICC): Cartographic Renaissance, Durban, South Africa, 10–16 August 2003. [Google Scholar]
- Sarjakoski, L.T.; Nivala, A.-M. Adaptation to Context—A Way to Improve the Usability of Mobile Maps. In Map-Based Mobile Services: Theories, Methods and Implementations; Meng, L., Reichenbacher, T., Zipf, A., Eds.; Springer: Berlin/Heidelberg, Germany, 2005; pp. 107–123. ISBN 978-3-540-26982-3. [Google Scholar]
- Huang, H.; Gartner, G.; Krisp, J.M.; Raubal, M.; van de Weghe, N. Location based services: Ongoing evolution and research agenda. J. Locat. Based Serv. 2018, 12, 63–93. [Google Scholar] [CrossRef]
- Roth, R.E.; Çöltekin, A.; Delazari, L.; Filho, H.F.; Griffin, A.; Hall, A.; Korpi, J.; Lokka, I.; Mendonça, A.; Ooms, K.; et al. User studies in cartography: Opportunities for empirical research on interactive maps and visualizations. Int. J. Cartogr. 2017, 3, 61–89. [Google Scholar] [CrossRef]
- White, T. Let’s Build a CartoBase! Reproducibility in Cartography—ICA Joint Workshop. 2018. Available online: https://cogvis.icaci.org/pdf/reproducibility2018/White_CartoBase_ICA2018.pdf (accessed on 20 June 2021).
- Abowd, G.D.; Dey, A.K.; Brown, P.J.; Davies, N.; Smith, M.; Steggles, P. Towards a Better Understanding of Context and Context-Awareness. In Handheld and Ubiquitous Computing; Goos, G., Hartmanis, J., van Leeuwen, J., Gellersen, H.-W., Eds.; Springer: Berlin/Heidelberg, Germany, 1999; pp. 304–307. ISBN 978-3-540-66550-2. [Google Scholar]
- Roth, R. How do user-centered design studies contribute to cartography? Geografie 2019, 124, 133–161. [Google Scholar] [CrossRef]
- Nivala, A.-M.; Sarjakoski, T.L. User Aspects of Adaptive Visualization for Mobile Maps. Cartogr. Geogr. Inf. Sci. 2007, 34, 275–284. [Google Scholar] [CrossRef]
- Zhang, D.; Adipat, B.; Mowafi, Y. User-Centered Context-Aware Mobile Applications—The Next Generation of Personal Mobile Computing. CAIS 2009, 24. [Google Scholar] [CrossRef]
- Raubal, M.; Panov, I. A Formal Model for Mobile Map Adaptation. In Location Based Services and TeleCartography II: From Sensor Fusion to Context Models; Cartwright, W., Gartner, G., Meng, L., Peterson, M.P., Rehrl, K., Eds.; Springer: Berlin/Heidelberg, Germany, 2009; pp. 11–34. ISBN 978-3-540-87392-1. [Google Scholar]
- Atzmanstorfer, K.; Eitzinger, A.; Marin, B.E.; Parra Arteaga, A.; Gonzalez Quintero, B.; Resl, R. HCI-Evaluation of the GeoCitizen-reporting App for citizen participation in spatial planning and community management among members of marginalized communities in Cali, Colombia. Giforum 2016, 1, 117–132. [Google Scholar] [CrossRef]
- Gottwald, S.; Laatikainen, T.E.; Kyttä, M. Exploring the usability of PPGIS among older adults: Challenges and opportunities. Int. J. Geogr. Inf. Sci. 2016, 30, 2321–2338. [Google Scholar] [CrossRef]
- Dransch, D. Activity and Context—A Conceptual Framework for Mobile Geoservices. In Map-based Mobile Services: Theories, Methods and Implementations; Meng, L., Reichenbacher, T., Zipf, A., Eds.; Springer: Berlin/Heidelberg, Germany, 2005; pp. 31–42. ISBN 978-3-540-26982-3. [Google Scholar]
- Elias, B.; Hampe, M.; Sester, M. Adaptive Visualisation of Landmarks using an MRDB. In Map-based Mobile Services: Theories, Methods and Implementations; Meng, L., Reichenbacher, T., Zipf, A., Eds.; Springer: Berlin/Heidelberg, Germany, 2005; pp. 73–86. ISBN 978-3-540-26982-3. [Google Scholar]
- Liao, H.; Wang, X.; Dong, W.; Meng, L. Measuring the influence of map label density on perceived complexity: A user study using eye tracking. Cartogr. Geogr. Inf. Sci. 2019, 46, 210–227. [Google Scholar] [CrossRef]
- Lokka, I.E.; Çöltekin, A.; Wiener, J.; Fabrikant, S.I.; Röcke, C. Virtual environments as memory training devices in navigational tasks for older adults. Sci. Rep. 2018, 8, 10809. [Google Scholar] [CrossRef] [PubMed]
- Fallucchi, F.; Luccasen, R.A.; Turocy, T.L. Identifying discrete behavioural types: A re-analysis of public goods game contributions by hierarchical clustering. J. Econ. Sci. Assoc. 2019, 5, 238–254. [Google Scholar] [CrossRef] [Green Version]
- Liu, Y.; Li, W.; Li, Y.-C. Network Traffic Classification Using K-means Clustering. In Proceedings of the Second International Multi-Symposiums on Computer and Computational Sciences (IMSCCS 2007), Iowa City, IA, USA, 13–15 August 2007; Ni, J., Ed.; The University of Iowa: Iowa City, IA, USA; IEEE: Piscataway, NJ, USA, 2007; pp. 360–365, ISBN 0-7695-3039-7. [Google Scholar]
- Bi, M.; Xu, J.; Wang, M.; Zhou, F. Anomaly detection model of user behavior based on principal component analysis. J. Ambient. Intell. Hum. Comput. 2016, 7, 547–554. [Google Scholar] [CrossRef]
- Hu, J.; Wright, F.A.; Zou, F. Estimation of Expression Indexes for Oligonucleotide Arrays Using the Singular Value Decomposition. J. Am. Stat. Assoc. 2006, 101, 41–50. [Google Scholar] [CrossRef]
- Mørup, M.; Hansen, L.K. Archetypal analysis for machine learning and data mining. Neurocomputing 2012, 80, 54–63. [Google Scholar] [CrossRef]
- Cutler, A.; Breiman, L. Archetypal Analysis. Technometrics 1994, 36, 338–347. [Google Scholar] [CrossRef]
- Eugster, M.J.A.; Leisch, F. From Spider-Man to Hero—Archetypal Analysis in R. J. Stat. Soft. 2009, 30. [Google Scholar] [CrossRef] [Green Version]
- Board, C. Map Reading Tasks Appropriate in Experimental Studies in Cartographic Communication. Cartogr. Int. J. Geogr. Inf. Geovisualization 1978, 15, 1–12. [Google Scholar] [CrossRef]
- Lobben, A.K. Tasks, Strategies, and Cognitive Processes Associated With Navigational Map Reading: A Review Perspective. Prof. Geogr. 2004, 56, 270–281. [Google Scholar] [CrossRef]
- Roth, R.E. Cartographic Interaction Primitives: Framework and Synthesis. Cartogr. J. 2012, 49, 376–395. [Google Scholar] [CrossRef]
- Konečný, M.; Kubíček, P.; Stachoň, Z.; Šašinka, Č. The usability of selected base maps for crises management—users’ perspectives. Appl. Geomat. 2011, 3, 189–198. [Google Scholar] [CrossRef]
- Bestgen, A.-K.; Edler, D.; Müller, C.; Schulze, P.; Dickmann, F.; Kuchinke, L. Where Is It (in the Map)? Recall and Recognition of Spatial Information. Cartogr. Int. J. Geogr. Inf. Geovisualization 2017, 52, 80–97. [Google Scholar] [CrossRef]
- Edler, D.; Keil, J.; Bestgen, A.-K.; Kuchinke, L.; Dickmann, F. Hexagonal map grids—An experimental study on the performance in memory of object locations. Cartogr. Geogr. Inf. Sci. 2019, 46, 401–411. [Google Scholar] [CrossRef]
- Corbett, J. Good Practices in Participatory Mapping: A Review Prepared for the International Fund for Agricultural Development (IFAD). 2009. Available online: https://agris.fao.org/agris-search/search.do?recordID=GB2013201933 (accessed on 20 June 2021).
- Sletto, B.I. We Drew What We Imagined. Curr. Anthropol. 2009, 50, 443–476. [Google Scholar] [CrossRef] [Green Version]
- Vincent, K.; Roth, R.E.; Moore, S.A.; Huang, Q.; Lally, N.; Sack, C.M.; Nost, E.; Rosenfeld, H. Improving spatial decision making using interactive maps: An empirical study on interface complexity and decision complexity in the North American hazardous waste trade. Environ. Plan. B Urban Anal. City Sci. 2019, 46, 1706–1723. [Google Scholar] [CrossRef] [Green Version]
- Hedeker, D. A mixed-effects multinomial logistic regression model. Stat. Med. 2003, 22, 1433–1446. [Google Scholar] [CrossRef] [PubMed]
- Roth, R.; Ross, K.; MacEachren, A. User-Centered Design for Interactive Maps: A Case Study in Crime Analysis. ISPRS Int. J. Geo-Inf. 2015, 4, 262–301. [Google Scholar] [CrossRef]
- Seth, S.; Eugster, M.J.A. Probabilistic archetypal analysis. Mach Learn 2016, 102, 85–113. [Google Scholar] [CrossRef] [Green Version]
- Moore, D.A.; Healy, P.J. The trouble with overconfidence. Psychol. Rev. 2008, 115, 502–517. [Google Scholar] [CrossRef] [PubMed] [Green Version]
- Biland, J.; Çöltekin, A. An empirical assessment of the impact of the light direction on the relief inversion effect in shaded relief maps: NNW is better than NW. Cartogr. Geogr. Inf. Sci. 2017, 44, 358–372. [Google Scholar] [CrossRef]
- Korporaal, M.; Ruginski, I.T.; Fabrikant, S.I. Effects of Uncertainty Visualization on Map-Based Decision Making Under Time Pressure. Front. Comput. Sci. 2020, 2. [Google Scholar] [CrossRef]
- Golebiowska, I.; Çöltekin, A. Rainbow Dash: Intuitiveness, interpretability and memorability of the rainbow color scheme in visualization. IEEE Trans. Vis. Comput. Graph. 2020. [Google Scholar] [CrossRef] [PubMed]
- Brügger, A.; Richter, K.-F.; Fabrikant, S.I. How does navigation system behavior influence human behavior? Cogn. Res. Princ. Implic. 2019, 4, 5. [Google Scholar] [CrossRef] [Green Version]
Publisher’s Note: MDPI stays neutral with regard to jurisdictional claims in published maps and institutional affiliations. |
© 2021 by the authors. Licensee MDPI, Basel, Switzerland. This article is an open access article distributed under the terms and conditions of the Creative Commons Attribution (CC BY) license (https://creativecommons.org/licenses/by/4.0/).