Article

Analysing the Impact of Large Data Imports in OpenStreetMap

1
HeiGIT gGmbH, Schloss-Wolfsbrunnenweg 33, 69118 Heidelberg, Germany
2
Institute of Geography, GIScience, Heidelberg University, 69120 Heidelberg, Germany
*
Author to whom correspondence should be addressed.
ISPRS Int. J. Geo-Inf. 2021, 10(8), 528; https://doi.org/10.3390/ijgi10080528
Submission received: 4 June 2021 / Revised: 29 July 2021 / Accepted: 2 August 2021 / Published: 6 August 2021

Abstract

:
OpenStreetMap (OSM) is a global mapping project which generates free geographical information through a community of volunteers. OSM is used in a variety of applications and for research purposes. However, it is also possible to import external data sets to OpenStreetMap. The opinions about these data imports are divergent among researchers and contributors, and the subject is constantly discussed. The question of whether importing data, especially large quantities, is adding value to OSM or compromising the progress of the project needs to be investigated more deeply. For this study, OSM’s historical data were used to compute metrics about the developments of the contributors and OSM data during large data imports which were for the Netherlands and India. Additionally, one time period per study area during which there was no large data import was investigated to compare results. For making statements about the impacts of large data imports in OSM, the metrics were analysed using different techniques (cross-correlation and changepoint detection). It was found that the contributor activity increased during large data imports. Additionally, contributors who were already active before a large import were more likely to contribute to OSM after said import than contributors who made their first contributions during the large data import. The results show the difficulty of interpreting a heterogeneous data source, such as OSM, and the complexity of the project. Limitations and challenges which were encountered are explained, and future directions for continuing in this field of research are given.

1. Introduction

OpenStreetMap is a global mapping project where anyone can collect and contribute geographical information. This information, along with its history, is freely accessible [1]. OSM is an example of so-called volunteered geographic information (VGI), which is an alternative to professionally collected geographic information [2]. The popularity of OSM has been increasing ever since the project was started in 2004 [3]. Given that the usage of OSM is free of cost and the data are frequently updated, OSM plays an important role in many different applications and in research. Moreover, for specific regions on the globe, OSM is the only source of geographical information. Therefore, OSM represents an alternative to map or geodata providers such as Google (https://www.google.de/maps, accessed on 15 February 2020) and Here (https://wego.here.com/, accessed on 15 February 2020) [2]. Given the availability and decreasing costs of hardware and software, the collection and maintenance of geographic information on a voluntary basis will continue to grow in popularity [2,4]. However, the quality of VGI, particularly OpenStreetMap data, cannot be easily determined and therefore has to be evaluated [5]. Since OpenStreetMap is one of the most prominent examples of VGI, the interest in OSM research is growing continuously [5,6,7]. Not only are the data of importance, but the social processes and interactions between the volunteers who are contributing to OSM are too [8]. Crowdsourced geographical information has many relevant applications (e.g., emergency responses, spatial decision making, participatory planning and citizen science), and with the availability and accuracy of global navigation satellite systems (GNSSs) and information technology (IT), their popularity will continually increase [7,8].
Not only do individuals contribute their knowledge to OSM, but imports of external data sources are conducted. These data sets range from small scale (e.g., a tree data set for a city (https://wiki.openstreetmap.org/wiki/Birmingham_City_Council_trees_data, accessed on 2 February 2020)) to large scale (e.g., road network for a country (https://wiki.openstreetmap.org/wiki/AND_data, accessed on 2 February 2020)) and are being provided by institutions, governments and companies [9,10]. The question arises of if and how data imports are benefiting community mapping projects such as OpenStreetMap. This issue is controversially discussed by contributors, the community [11,12,13] and researchers [14,15]. Some contributors point out that importation of external data sets has a negative impact on the development of the local community. Without an active group of contributors (also called mappers), OSM would not be updated as frequently [11]. It is important to investigate how the community acts before, during and after an import to see whether imported data stay untouched or not. Imports of large data sets especially, such as road networks, bring a lot of information to OSM in a short period of time. Publications (e.g., by Grinberger et al. [9], Zielstra et al. [15]) have shown rising interest in investigations of large-scale imports of data to OSM, and interest in whether these imports add value to OSM. Therefore, it is important to analyse and understand the effects that large data imports exert on OpenStreetMap. For investigating the effects of large data imports on OSM, the history of the data needs to be taken into account. By analysing the evolution of imported data, it is possible to make statements about the impacts on OSM.

Related Work

Different aspects of OSM are being investigated by researchers, e.g., motivations for participation, community development and the quality of OSM data. In Neis and Zielstra [7], the authors summarise the recent developments of OSM and outline future trends. OpenStreetMap has high accuracy and coverage in urban areas, resulting in applications utilising this free source of information, for example, for the creation of city maps or routing software [16,17]. Given that OSM is a global project where anyone can contribute, it is important to understand who participates and why. Budhathoki and Haythornthwaite [18] investigated the motivations for collecting geographic information and found differences between so-called serious and casual mappers. Coleman et al. [4] analysed and characterised the motivations of volunteers and tried to classify a spectrum of contributors. Haklay and Weber [19] summarised general motivations and technical details of OSM.
The heterogeneity of OSM is one of the main reasons for the importance of OSM data quality assessments [20]. Mooney et al. [6] developed quality metrics to assess and compare OSM data quality. The authors stated that if OSM is used in research, the variability of data quality has to be considered in the analysis. In the study by Keßler and de Groot [21], the authors defined trust measures to evaluate the quality of OSM (e.g., a high number of contributors is a positive indicator; corrections of elements are seen as a negative indicator).
Degrossi et al. [22] present a taxonomy of methods for data quality evaluation if no reference data sets are available. On the basis of a systematic review, 11 methods were identified which are useful for quality evaluation. A detailed review on the various subject areas of VGI in general can be found in Yan et al. [23]. The authors identify three different scientific subject areas: “VGI contributions and contributors”, “Main fields applying VGI” and “Conceptions and envisions.” The area “VGI contributions and contributors” is particularly relevant for this article and shows the importance of scientific studies dealing with the issues of data quality of VGI. In Arsanjani et al. [24], the authors developed a contribution index to better examine the dynamics of the contributions and forecast the future development of the contributions for the larger region of Stuttgart. In accordance with their results, they come to the conclusion that increasing contributions can be expected in the future. A corresponding review of the results has not yet taken place, but would be valuable and possible, since a review with real data is possible today. For this article, the outlook on data imports is particularly relevant, as the authors identified the influence of data importation as an important parameter for expanding their contribution index.
Depending on the application of OSM, a comparison to an external data set (so-called ground truth) is inevitable to decide whether to use OSM or not. In the context of evaluating quality, the intrinsic data quality analysis is suitable for the assessment [25]. Comparable data sets are often expensive or access to them is limited due to licensing processes. By using an intrinsic approach, no ground truth reference data set is needed; the data are compared with themselves [25]. Barron et al. [25] introduced a framework for intrinsic quality analysis which evaluates OSM data quality based on its history. Minghini et al. [26] also utilised an intrinsic approach to assess OSM data quality with the history of the data. Nasiri et al. [27] investigated the history of OSM to improve the quality of the data as well. They concluded that the historic contributions to OSM have mostly been neglected by the literature and that OSM’s history should be exploited for intrinsic quality analysis.
In regard to data imports in OpenStreetMap, several studies were already carried out. Zielstra et al. [15] analysed and evaluated the effect of data imports on the completeness of OpenStreetMap. The publication specifically focused on the TIGER/Line (https://wiki.openstreetmap.org/wiki/TIGER, accessed on 8 February 2020) (Topologically Integrated Geographic Encoding and Referencing System) import in the United States. The researchers assessed the accuracy of the imported data. Furthermore, they argued and discussed whether the road network of OSM should be updated through data imports from the public domain, or by edits of active contributors. The authors concluded that an interplay of data imports and updates by contributors could improve OSM data the most—e.g., by adding road traces of an external data set as an overlay in OSM editors. The paper by Juhász and Hochmair [14] analysed whether an import task leads to community growth or not. The authors found that there are differences in editing patterns between newly recruited users and established mappers. Moreover, they could not confirm a long-term engagement of the new mappers (GIS students who earned credits for import tasks). Neis et al. [28] investigated vandalism in OSM. Since anyone can alter OSM data, it is important to detect intentional deletions or manipulations of elements. With OSMPatrol, they introduced a tool to help identify users who damage OSM. For the analysis, it was crucial to include the history of OSM and the fact that a lot of data can be automatically changed via scripts or bots. The researchers were able to discover “illegal” imports and mass edits with the software. The work of Gröchenig et al. [29] tried to identify regional and temporal differences in the mapping progress by analysing the history of OSM. The authors stated that VGI data sets are heterogeneous because of technical, social, environmental and economic factors, resulting in neither a spatial nor a temporal equal distribution. The researchers found that regions benefit from imports in terms of data availability, but the imports had a negative influence on the community development. Furthermore, they stated that after an import or a crisis which triggers remote mapping activities, the affected regions lack continuous maintenance.
Yang et al. [30] examined the inequality of contributions and were able to determine that there were differences between the amounts of contributions in countries in which there were no large data imports into OSM (a small number of users who make the most contributions contrasts with the growing number of users who only make a small number of contributions). In countries with larger imports, they found higher fluctuations in contributions from contributors. In [31] the authors differentiated between professional and amateur mappers based on skill level. It is important to investigate the contributors and the influences of their affiliation and commitment towards OSM. Neis et al. [32] differentiated between three groups of mappers, “Senior Mappers” (>1000 nodes created), “Junior Mappers” (<1000 nodes created) and “Nonrecurring Mappers” (<10 nodes created).
Detailed and very up-to-date investigations of larger data production events were carried out by Schott et al. [33] and Grinberger et al. [34]. In this study, however, the focus does not lie on event-based data production, but the importation of data sets.
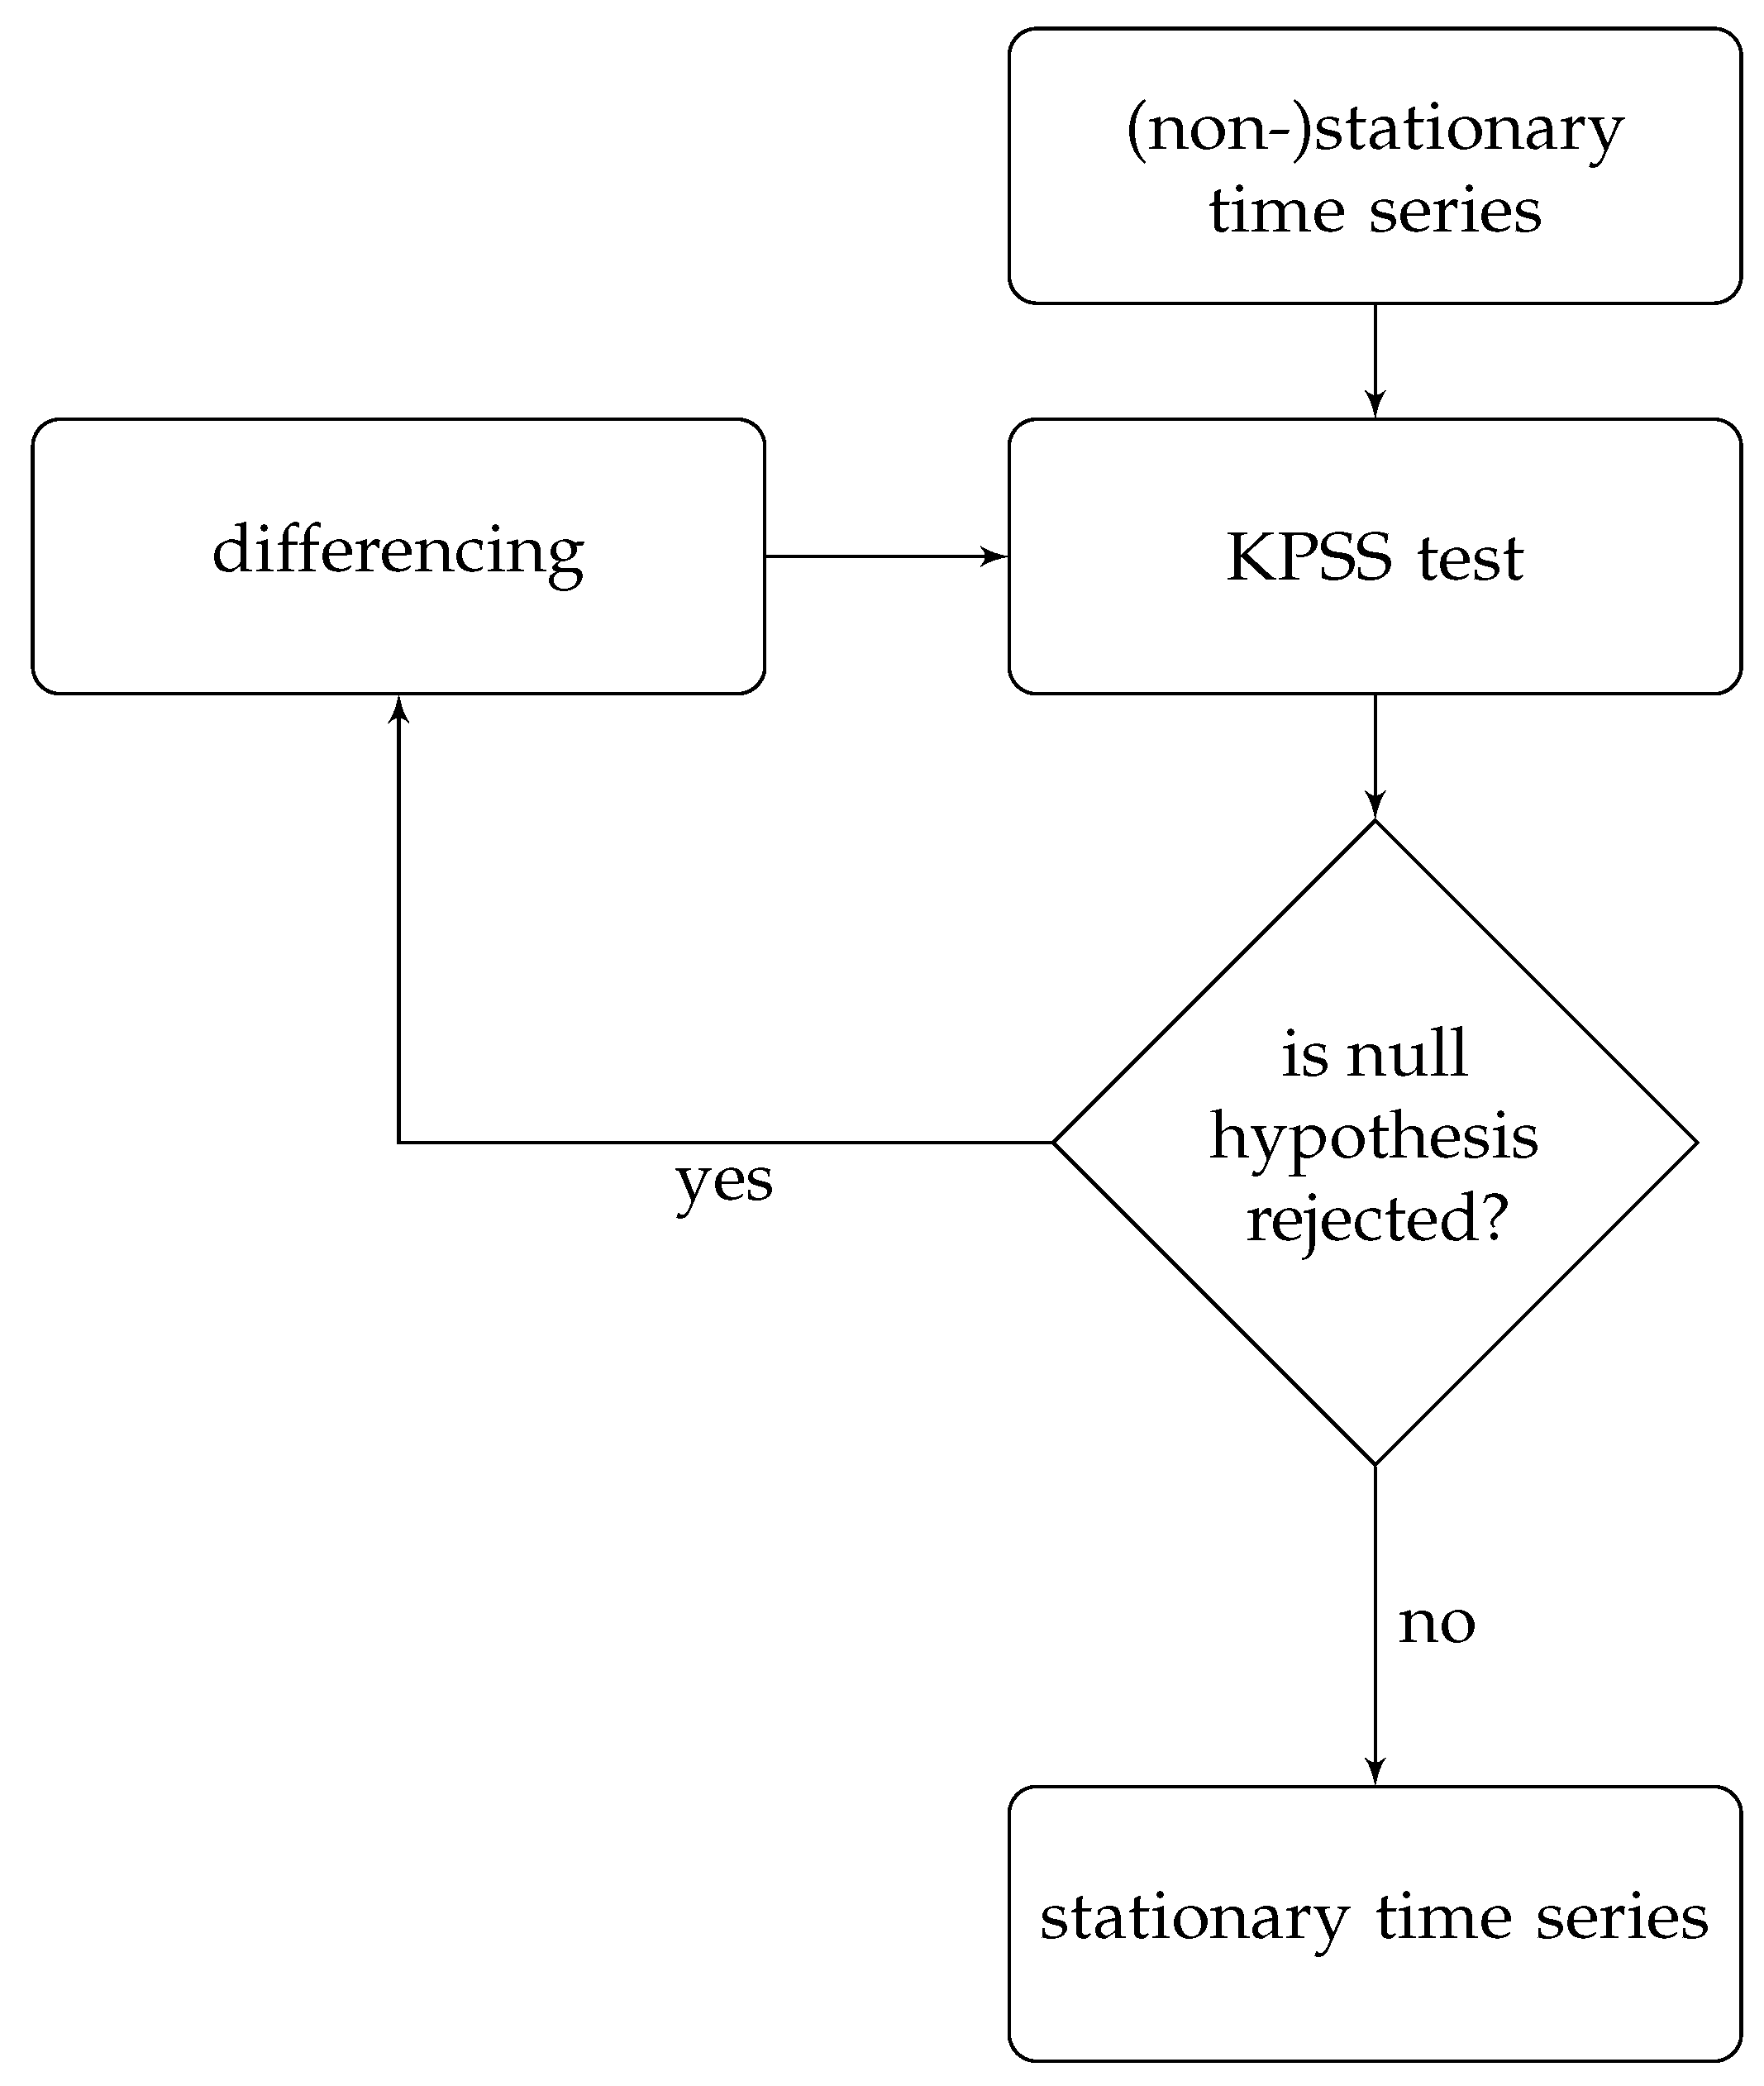
2. Materials and Methods

2.1. Data Imports

Data imports (sometimes referred to as bulk-imports [35]) in OpenStreetMap are seen as supplementary to data collection by contributors. However, the OSM wiki states that contributions by volunteers always have priority over data imports [10]. Data imports are conducted for different reasons. One of them is the generation of a “base line of geodata”, specifically in countries or regions with a less active OSM community [15]. In general, OpenStreetMap discourages large imports because it might impact the data which already have been contributed by individuals [10,15]. Imports must be planned and agreed upon in advance. For more information about data imports in OSM, please refer to Appendix A.
The OSM wiki characterises imports as large-scale if more than a few hundred nodes or data for an area, such as a whole country, are added [36]. This definition is vague, given that there is a difference between the quantity and distribution of imported data. In this study, large data imports are defined as imports which add a proportionally large amount of data to OSM compared to the number of elements before the import.
The accuracy and quality of external data sets play important roles as well. Zielstra et al. [15] found that even though a community has been established during the TIGER/Line import in the United States, the data were already outdated in some areas and had to be corrected after the import was executed. Grinberger et al. [9] concluded that imports could reflect the work of certain institutions, leading to biased data which are added to OSM. Therefore, it is crucial to analyse, discuss and compare a data set to OSM data before importing it.
When importing data from external sources, it is necessary to map the metadata to OSM tags. If information is considered useful to OSM, a prefix (e.g., “tiger:” for the TIGER/Line import) should be defined to associate it with its source [37]. Table 1 shows the global count of the tag key sources per element and the counts of different values (retrieved on 3 January 2020). More than 200 million elements are associated with this tag key. For way elements especially, the number of different values is very high (163,290).

2.2. Method

To analyse the impacts of large data imports into OpenStreetMap, several aspects have to be considered and defined. The following methodology was chosen. First, the study areas were selected. For this study, two study areas were analysed. After the identification of the study areas, OSM data for the selected regions were collected and the analysis environment (i.e., software) was set up. Second, the metrics for the analysis of the imports were defined. Third, the OSM data were investigated to select large data imports for the analysis. The observation periods within which the imported data were analysed were determined. Additionally, one time period per study area was chosen for which no large data import was conducted, so results can be compared and discussed (control group). Fourth, the data analysis was conducted. The defined metrics were computed with the OpenStreetMap History Database (OSHDB) (https://github.com/GIScience/oshdb, accessed on 15 October 2019) and subsequently analysed. The OSHDB provides functionality for processing the history of OSM data in a scalable way. By storing OSM data in a custom data structure which is based on the OSM data model, the software allows efficient data retrieval and computation [39].

2.2.1. Selection of Study Areas

To get better insights about the impact of large data imports into OpenStreetMap, two study areas were chosen. As a condition for the selection, at least two large data imports should be conducted in a study area. By analysing a variety of imports per study area, it was ensured that results can be compared and critically discussed.
Zielstra et al. [15] proposed to analyse areas in the Netherlands or India, given that large data imports (e.g., AND (Automotive Navigation Data) import) have been occurred from those countries [15]. Additionally, the prominence of the data donations was considered during the selection of the study areas, since the AND donation was one of the first large data imports to OSM. In the OSM import catalogue, eight entries are listed for the Netherlands and three entries for India [36]. Since both of the countries satisfy the condition, they were chosen as study areas.

2.2.2. Selection and Definition of Metrics

To investigate the impact of large imports, the OpenStreetMap data must be analysed. Specifically, two characteristics of OSM are of interest:
  • The contributor who created, edited or deleted an element
  • The element which is created, edited or deleted
    -
    Contribution type (creation, deletion, etc.)
    -
    Attributes
    *
    Number of unique tag keys
The number of contributors who are working on OpenStreetMap is of high importance, given that these volunteers are creating and maintaining the data. If the number increases, more individuals are participating and contributing, which likely leads to a growing community. If the amount stays the same or decreases, the community does not develop or shrinks as a consequence. Given that researchers found that specific imports have had negative impacts on OSM community development [14,29], it would be interesting to compare the development of active contributors during an import and during a time period where no imports have been executed. Moreover, a high number of active contributors is more likely to keep the data up-to-date, and thus lead to stable OSM data with better overall quality [21,25]. Therefore, the number of active contributors during a large data import could lead to new insights. Juhász and Hochmair [14] found that the majority of users who where involved in an import as their first contribution did not engage in OSM for the longer term, whereas mappers who were already active before the import were inclined to remain active. This aspect is addressed in this study as well. Based on the approach of the authors, the contributor engagement during a large data import could be investigated. By comparing the number of contributors who made their first contributions through a large data import and the number of contributors who participated in a large data import but were already active before, insights about the distributions of already existing mappers and novel mappers, who get involved during or due to a large data import, could be found. For this study, the following definitions of different mappers were created. Mappers who were contributing to OSM before an import are designated as pre-existing mappers. Mappers who contributed to OSM for the first time during an import are designated as import-inspired mappers. For the time period without an import (control group), the same definition was applied for simplicity (i.e., mappers who were contributing before the time period were pre-existing mappers, and mappers who were contributing for the first time during that time period were import-inspired mappers). Hereinafter, when referring to results of the period without a large data import, a control group is added for clarification.
The contribution types of OSM elements reflect how the data are changed. For example, a large number of geometry changes could indicate bad geographical accuracy of imported data. The fact that contributors manually carry out these changes or do so with the help of tools (e.g., scripts or bots) is of interest, specifically if large data imports are causing such automatic changes.
The development of OSM attributes during an import is relevant for getting an understanding of their impacts on OSM. Since tag keys specify the types or topics of elements, a higher number of tag keys leads to higher information density. The development of the number of unique tag keys is illustrated by the extent to which the OSM community is updating and refining the data. It is interesting to see whether the number of unique tag keys develops differently after a large data import.
The following metrics were selected for analysing the impact of large data imports in OpenStreetMap:
  • Contributors
    -
    Number of active contributors during the import
    -
    Contributor engagement
    *
    Number of contributors who were involved in an import and active before this import (pre-existing mappers)
    *
    Number of contributors who were involved in an import, but not active before the import (import-inspired mappers)
  • Contribution types
    -
    Number of contribution types during the import
  • Tags
    -
    Number of unique tag keys during the import

2.2.3. Data Investigation and Selection of Imports

For the selection of large data imports, the OpenStreetMap history data of the study areas were investigated. The OSM history file of the Netherlands was downloaded from Geofabrik (https://osm-internal.download.geofabrik.de/europe/netherlands.html, accessed on 15 October 2019) (size: 2.05 Gigabyte (GB)). Only data from the European mainland were used for the analysis of the Netherlands in this study. The OSM history file of India was downloaded from Geofabrik (https://osm-internal.download.geofabrik.de/asia/india.html, accessed on 15 October 2019) (size: 964 Megabyte (MB)).
General statistics about OSM history files were extracted using the tool OSMconvert (https://wiki.openstreetmap.org/wiki/Osmconvert, accessed on 15 October 2019). Table 2 displays the count of elements per country.
To set up the OSHDB environment locally on a machine, please refer to the OSHDB manual (https://github.com/GIScience/oshdb/tree/master/documentation/first-steps, accessed on 15 October 2019). Two OSH databases were created. The OSH database of the Netherlands was 13.0 GB large; the OSH database of India was 6.80 GB large. The databases contained all elements with their histories from 5 July 2005 until 6 October 2019 (Netherlands) and from 21 July 2006 until 6 October 2019 (India). For the investigative analyses, a time period from 1 January 2007 to 31 August 2019 was chosen to cover the same temporal extent (152 months in total). Hereinafter, this time span is referred to as them investigation period.

The Netherlands

To get an overview about the data development of the Netherlands, the count of OSM elements aggregated by month for the investigation period was computed with the OSHDB and plotted (Figure 1). By counting all creations and deletions of elements per timestamp, the contribution frequency for the investigation period can be visualised. Figure 1a shows the contribution frequency for every OSM element. High points (peaks) in this plot indicate that a large amount of data has been added in a short period of time given the temporal resolution in months. One can see that three large imports happened between 2007 and 2014 (in September 2007, from November 2009 to April 2011 and from December 2013 to September 2014). There were several months with more deletions than creations, especially for node elements. By looking at the sum of the three element types (Figure 1b), again the three imports can be seen. During the second import, a slight decrease in the number of node elements can be observed, confirming what already was seen in Figure 1a. Figure 1c displays the aggregated contribution count with a logarithmic scale because of the comparatively small amount of relations. This exposes a larger addition of relations around March 2010.
To get information about the kind of data that were imported, the tag keys are useful because imported data are normally characterised by specific tags, for example, source tags. The ten commonest tag keys from January 2007 until August 2019 were aggregated using the OSHDB. In Table 3, the commonest tag keys for September 2007 in the Netherlands are displayed.
By going through the list of tag keys and the respective values, the imports that were seen in Figure 1 were identified as the following:
  • AND
  • 3dShapes
  • BAG
All three imports are documented in the OSM wiki [36]. Given the significant amounts of data for the Netherlands which have been added to OSM during these imports, we chose this area. The following paragraphs outline background information about the imports.
AND (Automotive Navigation Data (https://www.and.com/, accessed on 1 December 2019)) donated a complete road data set for the Netherlands to OSM in 2007. Additionally, it included point of interest (POI) data (e.g., cities, bus stops, main stations) [41]. The details page in the OSM wiki (https://wiki.openstreetmap.org/wiki/AND_data, accessed on 20 July 2021) provides information about the import.
The 3dShapes import included building outlines, water bodies and landuse information. The data set was donated by the company Object Vision BV (http://www.objectvision.nl/) and covers all of the Netherlands [42]. The details page in the OSM wiki (https://wiki.openstreetmap.org/wiki/NL:3dShapes/Details, accessed on 20 July 2021) provides information about the import (in Dutch).
BAG (Basisregistratie Adressen en Gebouwen (https://www.geobasisregistraties.nl/basisregistraties/adressen-en-gebouwen, accessed on 4 December 2019)) data contain information about building outlines, addresses and some specialised objects (e.g., house boats). The goal of this import was to increase the quality of building data in the Netherlands [43]. The details page in the OSM wiki (https://wiki.openstreetmap.org/wiki/BAGimport, accessed on 20 July 2021) provides information about the import (partially in Dutch).

India

To get an overview about the data development of India, the number of elements (aggregated by month for the investigation period) was calculated as for the Netherlands. Figure 2 shows the contribution frequency and the contribution count per element. The contribution frequency for India did not yield obvious results, because there are many fluctuations (Figure 2a). However, one can see a peak in the beginning of the investigation period (from January 2008 to February 2008) and two peaks towards the end of the investigation period (from May 2015 to August 2015 and from March 2016 to Mai 2016). The sum of aggregated contributions (Figure 2b) and the logarithmic visualisation (Figure 2c) assert these observations.
For identifying the imports, the commonest tag keys were also aggregated for this study area from January 2007 until August 2019. By going through the tag keys, the following imports were found:
  • PGS
  • AND
  • building data
The first two imports are documented in the OSM wiki [36]. The PGS and AND import in India happened within two consecutive months (January and February 2007). From 2015, a lot of way data was added to OSM. More specifically, the tag keys indicate that the ways were tagged as buildings. However, there is no entry listed in the OSM import catalogue that confirms an import of building data in India. After investigating this case in detail, it was decided to include this case in the analysis due to the amount of data that was added. The following paragraphs outline background information about the imports.
PGS (Prototype Global Shoreline) data contain information about the pathway of coastlines for the whole globe. It was generated from Landsat satellite imagery with an automatic image recognition algorithm. Given the global coverage of the data, it was used as a starting point for coastlines in OpenStreetMap [44].
AND donated only the major road network for India [41]. As for the AND import in the Netherlands, ways did not have source tags associated with them.
Given the amount of way data added to OSM in a short period of time starting from 2015, this case was included in the analysis as a large data import (hereinafter also referred to as the building import).

2.2.4. The Analysis

Determination of Observation Periods

For the analysis of the impact of large data imports, the time period was investigated in which the majority of the data were imported. Hereinafter, this period is referred to as the observation period of an import. For some imports, data are still added to OSM after completion or the imports have not been completed by the end of the total investigation period (e.g., BAG import). To be able to focus on the main period of the imports, the observation periods were chosen as follows: a lower bound (10%) and an upper bound (90%) were defined to determine the start point and end point. The time step where the number of imported elements was greater than or equal to 10% of the total imported elements was selected as start time. The time step where the number of imported elements was greater than or equal to 90% of the total imported elements was selected as end time. Hence, within this time span, approximately 80% of the total data were imported to OSM. Additionally, one month was added before and after the determined timestamps as a buffer. Only elements within this time period were considered in the analysis. By determining the periods in this way it was ensured that the analysis covered the main import action and therefore the time period where the largest amount of data was added to OSM.
The selection of time periods without a large data import (control group) was done by visually investigating the development of aggregated contributions (Figure 1b and Figure 2b). For both study areas, from 1 February 2012 until 1 September 2012, no large data import happened. Therefore, this time interval was selected for the Netherlands and India.
Table 4 displays the time periods that were used to carry out the analysis for the respective imports.

2.2.5. Calculation of Metrics

The metrics were calculated using the OSHDB by applying and chaining different commands (e.g., filters, maps and aggregations) on the OSH databases of the study areas. Afterwards, the results were plotted and further analysed. Please refer to Supplementary Materials for access to the source code.
It is important to mention that heterogeneous data like OpenStreetMap data are hard to filter, because naming conventions for tags exist, but contributors are not forced to apply them [45]. Therefore, it is possible that elements could be overlooked because of spelling errors in the tags or simply because tags were not added to imported elements. Table 5 displays the tag keys and values which were used to filter out imported elements.

Contributors

First, the metrics (defined in Section 2.2.2) were computed for the respective oberservation periods with the OSHDB.
The number of active contributors per time step was retrieved by applying the countUniq operation on the aggregated contributor IDs. All types of contributions were considered (i.e., creations, deletions, tag changes and geometry changes). Deletions were included because data clean-up (e.g., deletion of duplicates) is also an important task during an import. As a result, the total number of active contributors per time step during an observation period was calculated.
For investigating the engagement of contributors, the contributor IDs of mappers were retrieved who imported an element or edited an imported element during the observation periods by applying tag filters (as seen in Table 5). To investigate if pre-existing mappers would stop to contribute to OSM after an import and if import-inspired mappers would remain active, the following time intervals were defined:
  • One year after the observation period ended, with the same duration as the observation period.
  • The last four months of the total investigation period (from 1 May 2019 to 31 August 2019).
Similarly to the study by Juhász and Hochmair [14], one year was chosen for the analysis. Additionally, the last four months of the total investigation period were analysed. For these two intervals, no tag filters were applied when retrieving the contributor IDs. The comparison of these intervals could outline differences in the engagement of the two types of contributors.
Secondly, the calculated metrics were analysed. The cross-correlation did not provide meaningful results and was excluded from the analysis as a consequence. Please refer to Appendix B for a description of the methodology. Changepoint detection (CP) seemed more promising to investigate the effect of imports on the contributor activity.
The changepoint detection was also carried out in R, by utilising the changepoint (https://github.com/rkillick/changepoint/, accessed on 7 January 2020) package (version 2.2.2). This package provides functionality for the detection of changepoints in time series—for example, significant changes in the mean or the variance [46]. To evaluate the impact of a large data import on the contributor activity in OSM, the most significant changepoint (i.e., single changepoint) in the contributor activity time series was computed. The results of this analysis could indicate how and to what extent the contributor activity changed during the observation period of an import. The target property for the computation was the mean. After the detection of the changepoint, the difference and the growth rate of the mean values before and after the changepoint were computed.
Regarding the contributor engagement, the ratio of users who were involved in an import (i.e., created or edited imported elements) during the observation period and the two intervals defined above was computed.
For pre-existing mappers, the ratio was calculated for users who made at least one edit before the observation period. For import-inspired mappers, the ratio was calculated for users who did not make an edit before the observation period. For simplicity, the same definitions were applied for the observation period without a large data import; i.e., pre-existing mappers for this period contributed at least once to OSM beforehand, and import-inspired mappers did the first contribution during this period.

Contribution Types

To analyse the development of contribution types during a large import and a period without a large import, the contribution type of each element was retrieved via OSHDB and aggregated per timestamp. Neither an element filter nor a tag filter was applied to analyse the general development of the contribution types in the observation periods.
The number of the different contribution types leads to deeper insights about how the community changes elements. High points (i.e., peaks) could indicate automatised processes (e.g., the usage of bots or scripts), whereas a continuous development of the numbers would signify a manual enhancement of the data. To find out how data were changed during an import, the number of peaks was determined using the find peaks algorithm of the Python library SciPy (https://docs.scipy.org/doc/scipy/reference/generated/scipy.signal.find_peaks.html#scipy.signal.find_peaks, accessed on 8 January 2020) [47]. By specifying the minimum height of a peak, the total number within the observation period was calculated. A multiple of the mean of the sum of the contribution types was used as the input value for the height argument of the algorithm (multiple of 3). This value ensured that strong deviations from the mean were detected as peaks.

Tags

Tags are one of the most important aspects of OSM elements because they describe the attributes of objects in the real world. The number of unique tags displays the variety of attributes that are comprised by OSM. By adding new tag keys to OSM, contributors describe elements more precisely. To get an understanding of how an import is affecting the number of unique tag keys, the count per time step was computed with the OSHDB. Additionally, for this analysis, neither an element filter nor a tag filter was applied. The results were plotted and visually analysed.

3. Results

3.1. Contributors

OSM import guidelines state that a dedicated user account has to be used for an import [37]. These accounts are included in the following results.

3.1.1. The Netherlands

Figure 3 shows the contributor activity and the development of the element count during the AND import in the Netherlands. The number of active contributors had sharply increased by the end of the import. For the other figures of the contributor activity, please refer to Appendix C.
Generally, the number of active contributors increased during large data imports. One difference occurred after the BAG import, where the contributor activity decreased towards the end of the observation period. Nonetheless, one can see that during the time most of the data were imported, the contributor activity rose (Figure A3).
The activity of contributors did not have a distinct increasing or decreasing trend during the observation period without a large data import (control group) in the Netherlands (Figure A4). Two consecutive days did not have any activity. After an online search in the category downtime of the OSM blog, it was found that OpenStreetMap was moved to a new server in the first days of April 2012, explaining the lack of contributors on those days [48].
In Figure 4, the ratio of pre-existing mappers to import-inspired mappers that were involved in an import in the Netherlands is displayed. The total number of contributors varied among the analysed observation periods:
  • One hundred and eight contributors for the AND import (36 pre-existing, 72 import-inspired)
  • Nine hundred and five contributors for the 3dShapes import (321 pre-existing, 584 import-inspired)
  • One thousand and thirty contributors for BAG import (515 pre-existing, 515 import-inspired)
  • Two thousand five hundred contributors for the observation period without a large data import (control group) (1063 pre-existing, 1437 import-inspired)
The number of import-inspired mappers (i.e., mappers that started contributing to OSM by importing or editing imported data) was higher than the number of pre-existing mappers in every observed time period with one exception (equal amount during the BAG import).
Figure 5 shows the ratio of contributors who were active during an import to those active later in the project. One can see that most of the pre-exsiting mappers were still active in OSM after one year, compared to only a fraction of import-inspired mappers. This applies also for the last four months of the investigation period.

3.1.2. India

In the diagram of the AND import in India, the PGS import can be seen in the beginning of the observation period, which is due to the temporal closeness of the events (Figure 6). With the AND import, one can see that the number of active contributors increased, similarly to the AND import of the Netherlands. For the other figures of the contributor activity, please refer to Appendix C.
The diagram for the building data displays three phases (Figure A6). In the beginning of the observation period, the largest amount of the data was created (phase 1). In the following weeks, the number of elements continued to grow in a linear manner, which was interrupted by a second, smaller creation of approximately one million elements (phase 2). Again, the number of elements continued to increase linearly. Towards the end of the observation period, the count increased more sharply than before (phase 3).
The graph of active contributors displays a strong increase in the beginning of phase 1, which dropped off after most of the elements were added. The second phase led to a stronger involvement of contributors after the import. With the start of the third phase, the contributor activity reached its maximum within the observation period (1152 active contributors in one week). However, given the duration of the observation period, this result does not represent the processes accurately. Therefore, the three phases were investigated separately. After manually choosing start and end timestamps for each phase, the changepoints were recomputed for the following intervals:
  • Phase 1: from 01.04.2015 to 30.12.2015
  • Phase 2: from 30.12.2015 to 05.10.2016
  • Phase 3: from 22.02.2017 to 03.10.2018
Figure A7 shows the contributor activity for the period without a large data import (control group) in India. The contributor activity fluctuated at around approximately 17 contributors per day, without a strong increase or decrease.
In Figure 7, the ratio of pre-existing mappers to import-inspired mappers that were involved in imports in India is shown. The total number of contributors varied among the analysed observation periods:
  • Five contributors for the PGS import (2 pre-existing, 3 import-inspired)
  • Eighteen contributors for the AND import (4 pre-existing, 14 import-inspired)
  • Eleven thousand six hundred and thirty-six contributors for the building import (732 pre-existing, 10,904 import-inspired)
    -
    One thousand seven hundred and forty-six contributors for phase 1 of the building import (371 pre-existing, 1375 import-inspired)
    -
    One thousand six hundred and two contributors for phase 2 of the building import (394 pre-existing, 1208 import-inspired)
    -
    Eight thousand one hundred and fifty-one contributors for phase 3 of the building import (719 pre-existing, 7432 import-inspired)
  • One thousand and thirty-four contributors for the observation period without a large data import (203 pre-existing, 831 import-inspired)
The numbers of contributors involved in the PGS and AND imports were very low in India. However, as already pointed out, the number of contributors was generally lower during the beginnings of OSM. Overall, the amount of import-inspired mappers who were involved in an import was higher than the number of pre-existing mappers, similarly to the distribution in Netherlands.
Figure 8 shows the ratio of contributors. Similarly to the results in the Netherlands, mostly pre-existing mappers were still contributing to OSM in the long run.

3.2. Contribution Types

The empty contribution type (“[]”) is excluded from the plots and the analysis, given that this contribution type originated from a software error in OpenStreetMap editors [49].

3.2.1. The Netherlands

Throughout the observation period of the AND import, mostly geometries of elements were changed (Figure A8).
A similar pattern emerged during the 3dShapes import (Figure A9). For most of the timestamps, the number of geometry changes was higher. However, the number of tag changes increased several times.
Before the BAG import was started, a large number of geometries were changed (Figure A10). During the import, most of changes were carried out on tags.
During the observation period without a large data import (control group) in the Netherlands, the graphs of geometry and tag changes were separated more clearly (Figure A11). Generally, the number of geometry changes was higher than the number of tag changes.

3.2.2. India

Mostly geometry changes were conducted during the PGS import (Figure A12). This could be explained with the bad geographical accuracy of the data source, which is stated in the OSM wiki [44].
The development of contribution types during the AND import in India is similar to the AND import of the Netherlands (Figure A13). Mainly geometry changes were performed within the observation period.
During the import of building data, the number of geometry changes exceeded the number of tag changes most of the time (Figure A14).
The development of contribution types without a large data import (control group) in India is also similar to the development in the Netherlands (Figure A15). The number of geometry changes was generally higher than the number of tag changes.

3.3. Tags

3.3.1. The Netherlands

The number of unique tag keys during the AND import increased in a linear manner until the import was started (Figure A16).
During the import of 3dShapes data, the number of unique tag keys also increased throughout the observation period (Figure A17).
The count of unique tag keys during the BAG import developed similarly, in a linear fashion (Figure A18).
For the observation period without a large data import (control group) in the Netherlands, the number of unique tag keys grew also in a linear manner (Figure A19).

3.3.2. India

The diagram for the development of unique tag keys during the PGS import shows an increase of the count before the import (Figure A20). After the completion of the import, the number increased rapidly.
The AND import in India also contributed to a fast increase of unique tag keys (Figure A21). Afterwards, the number continued to grow linearly, with a smaller, sharp increase towards the end of the observation period.
Towards the end of the observation period of the building import, the number of unique tag keys grew drastically within a few weeks (Figure A22). Before this increase, the number of unique tag keys grew linearly.
During the observation period without a large data import (control group) in India, the number of unique tag keys was also continuously growing (Figure A23). Again, the development is similar to the development of the control group in the Netherlands.

4. Discussion

4.1. Evaluation of the Results
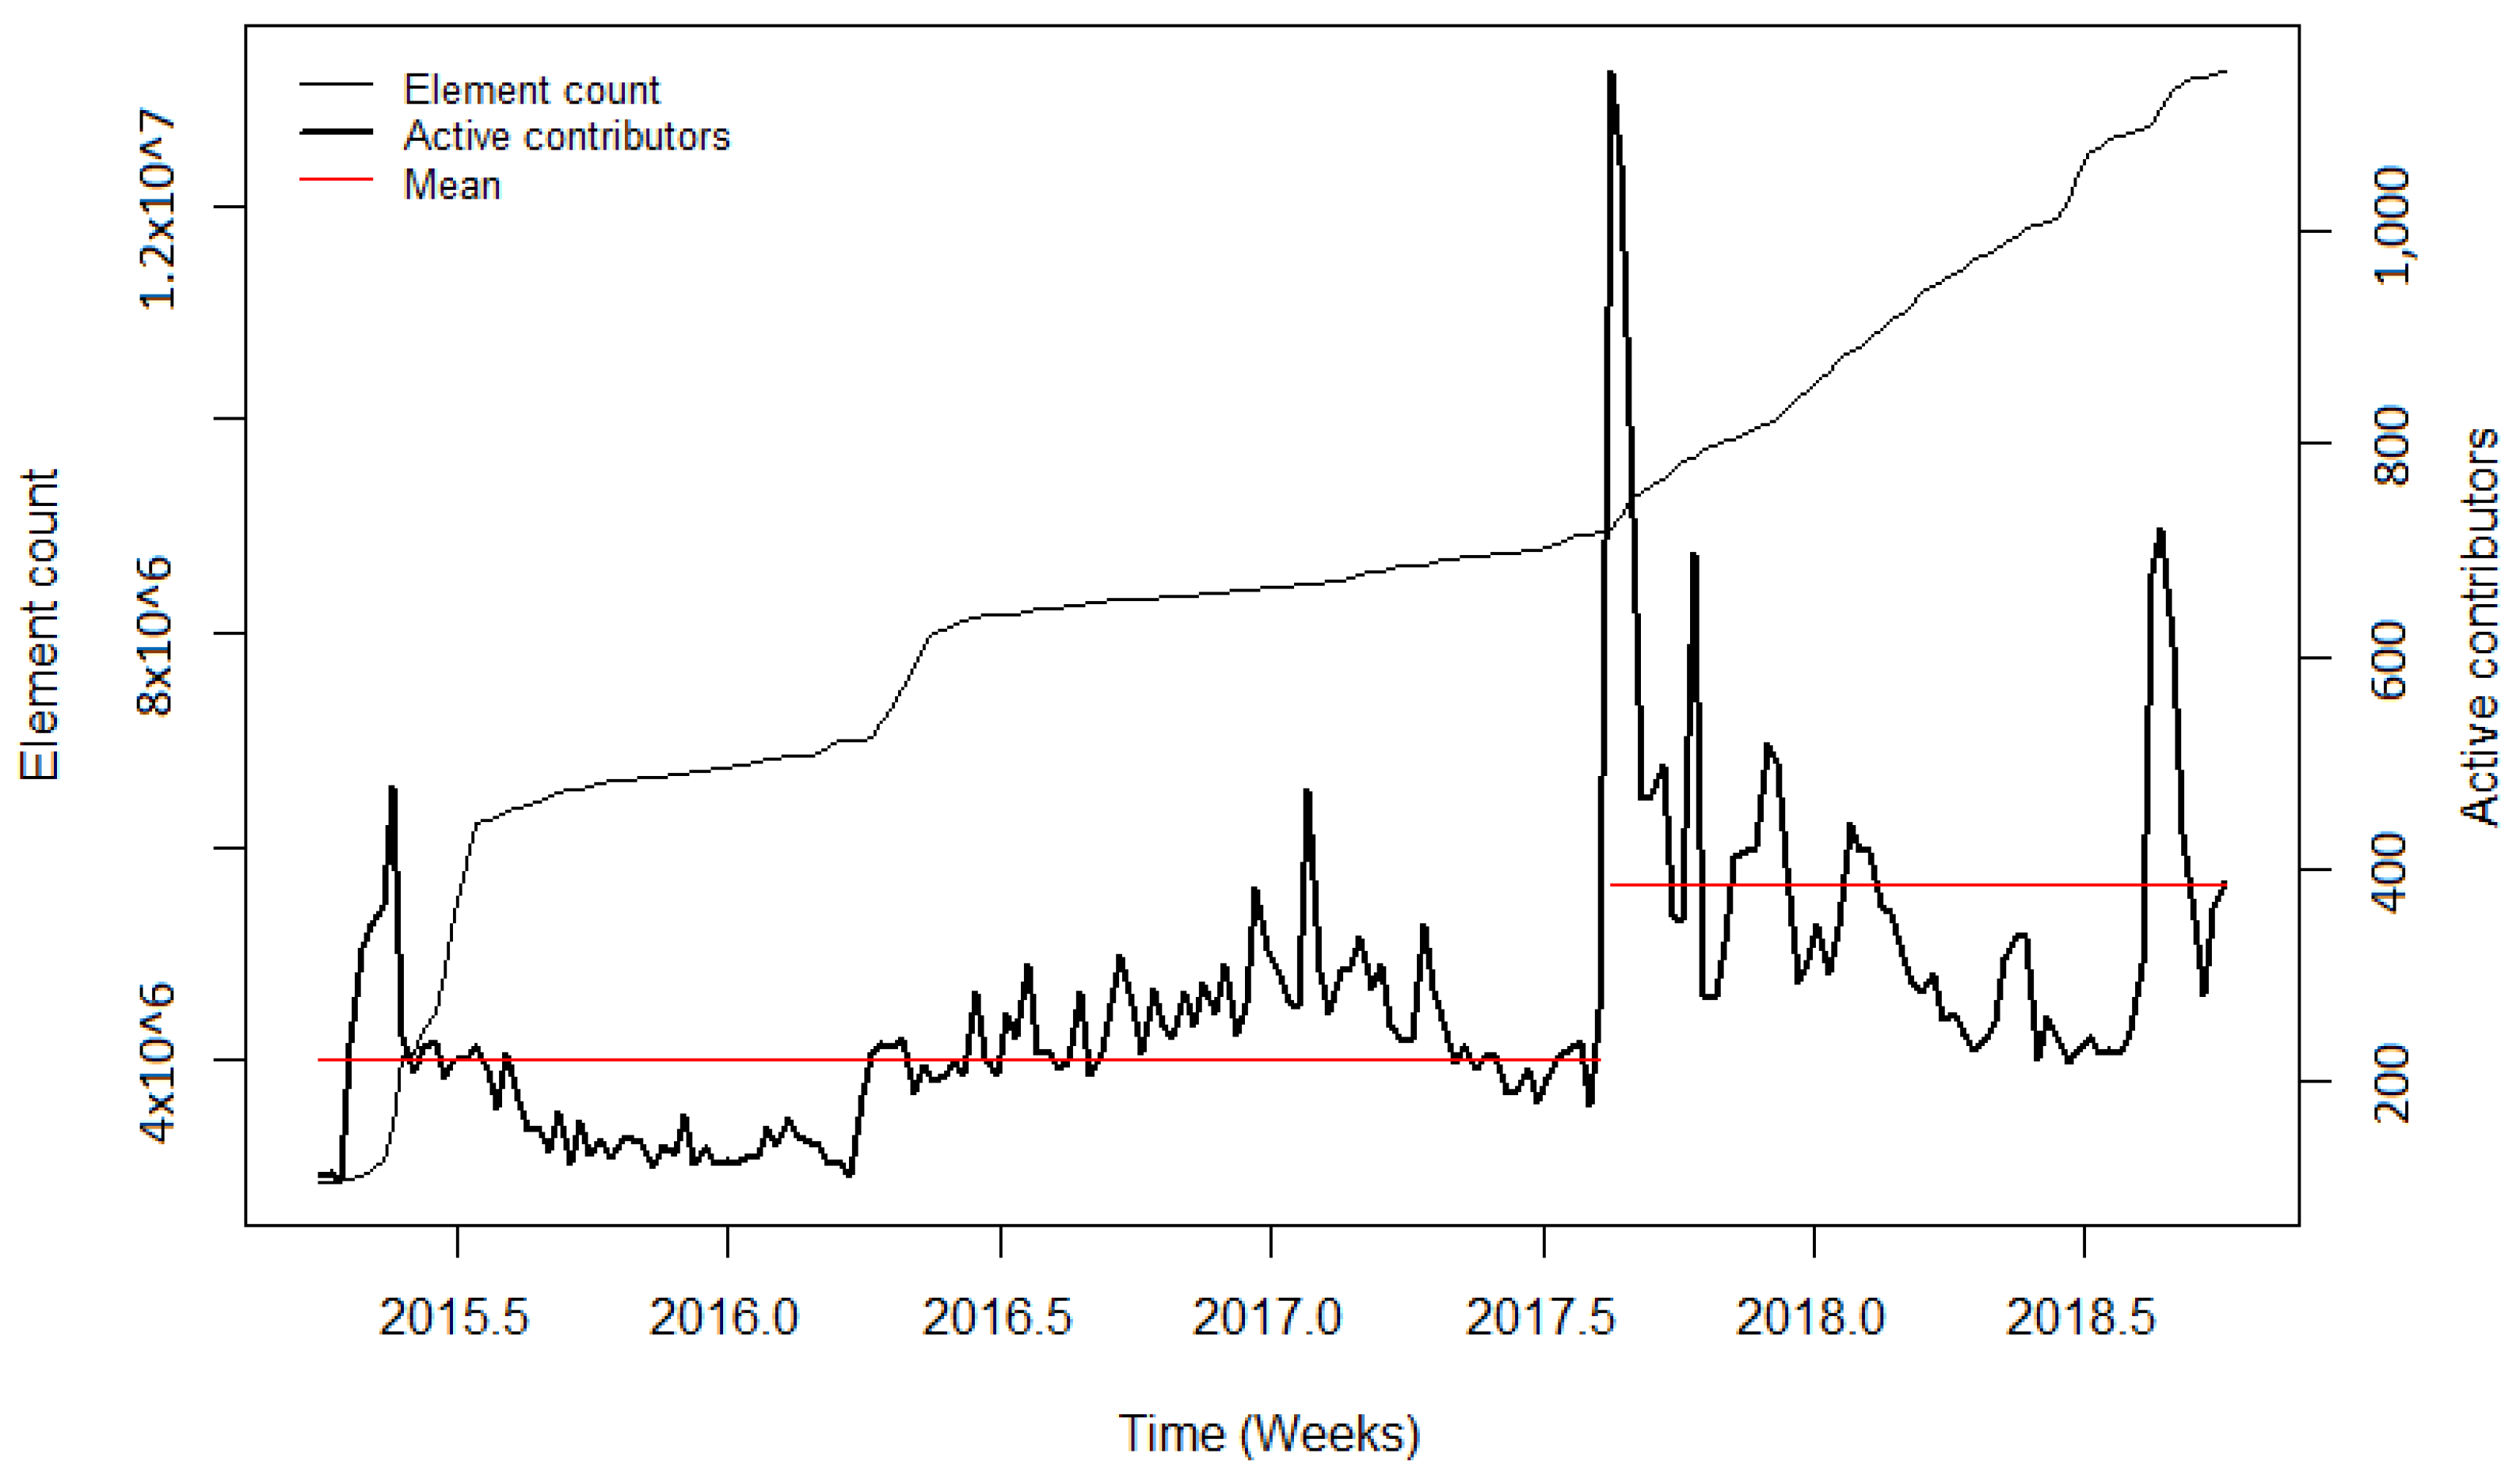
4.1.1. Contributors

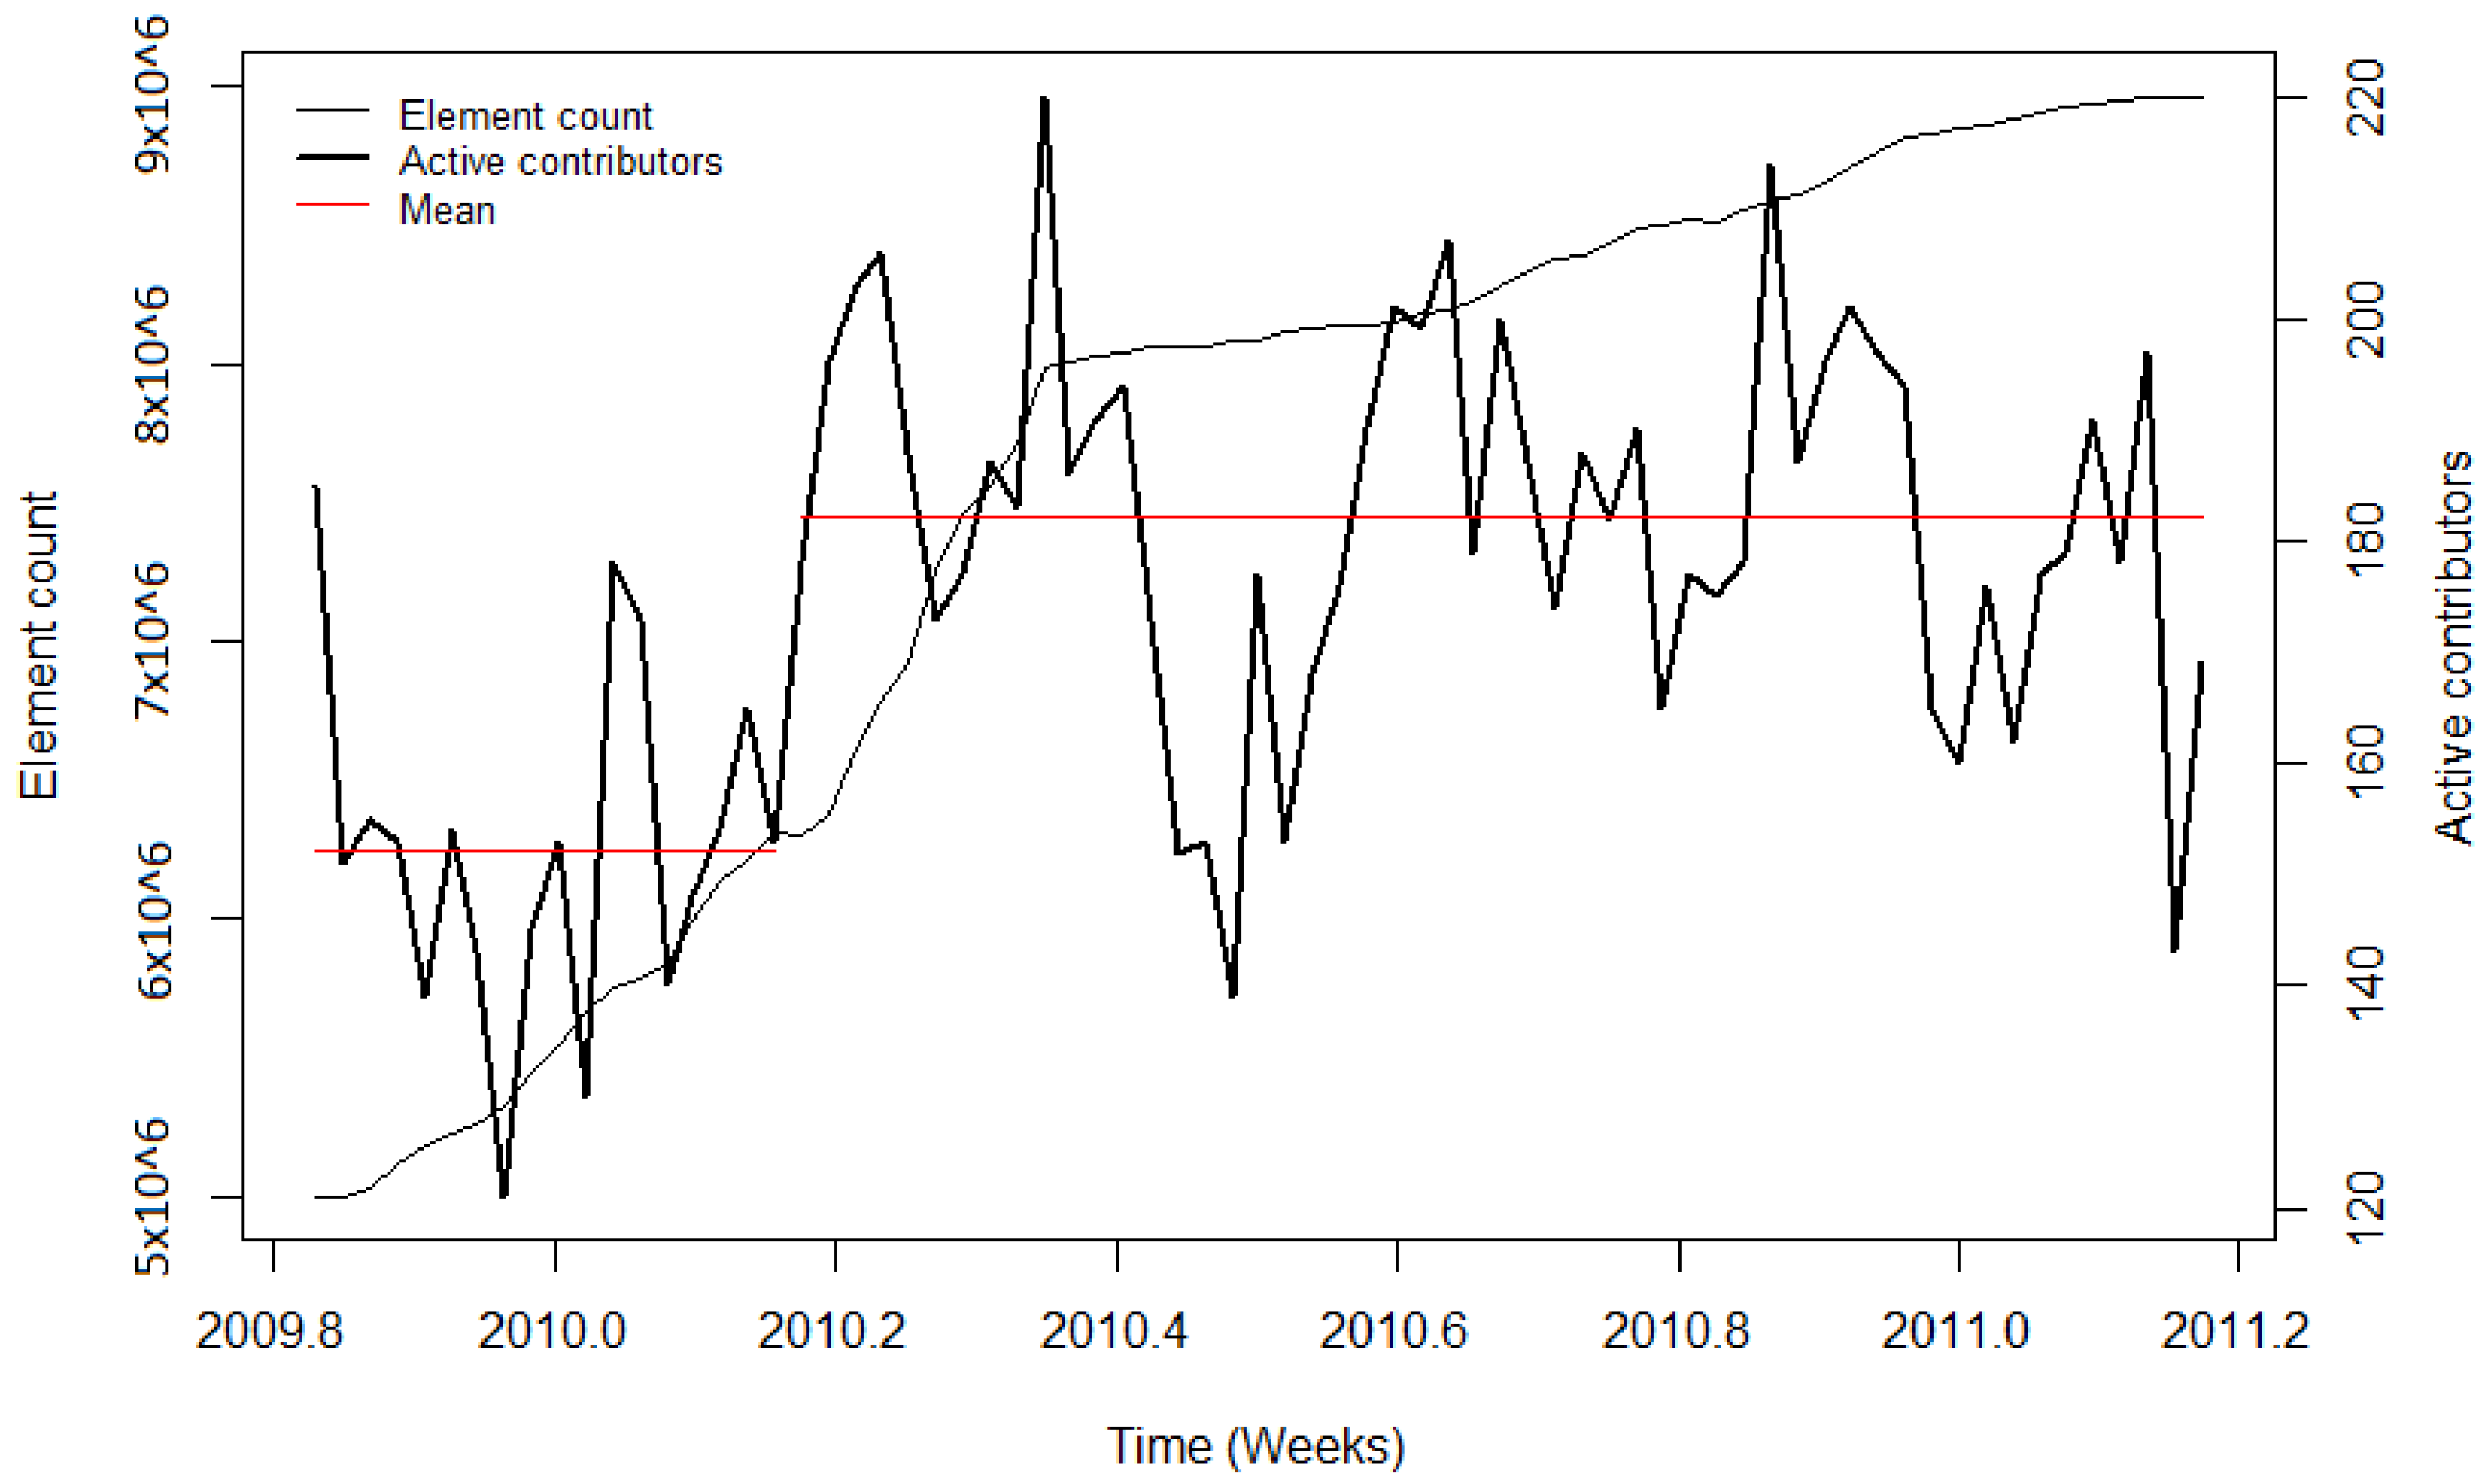
The number of active contributors during an import gives insights into how imports influence OSM contributor activity. The changepoint detection revealed that after the AND imports in the Netherlands and India, the mean number of active contributors rose significantly (by more than 200% in both study areas). A reason for that could be the state of OpenStreetMap itself at that time, since it only existed for about two and a half years. Consequently, the total number of contributors was relatively low. The publicity which was caused by the donation of the data set (through blog posts, radio interviews, etc. [
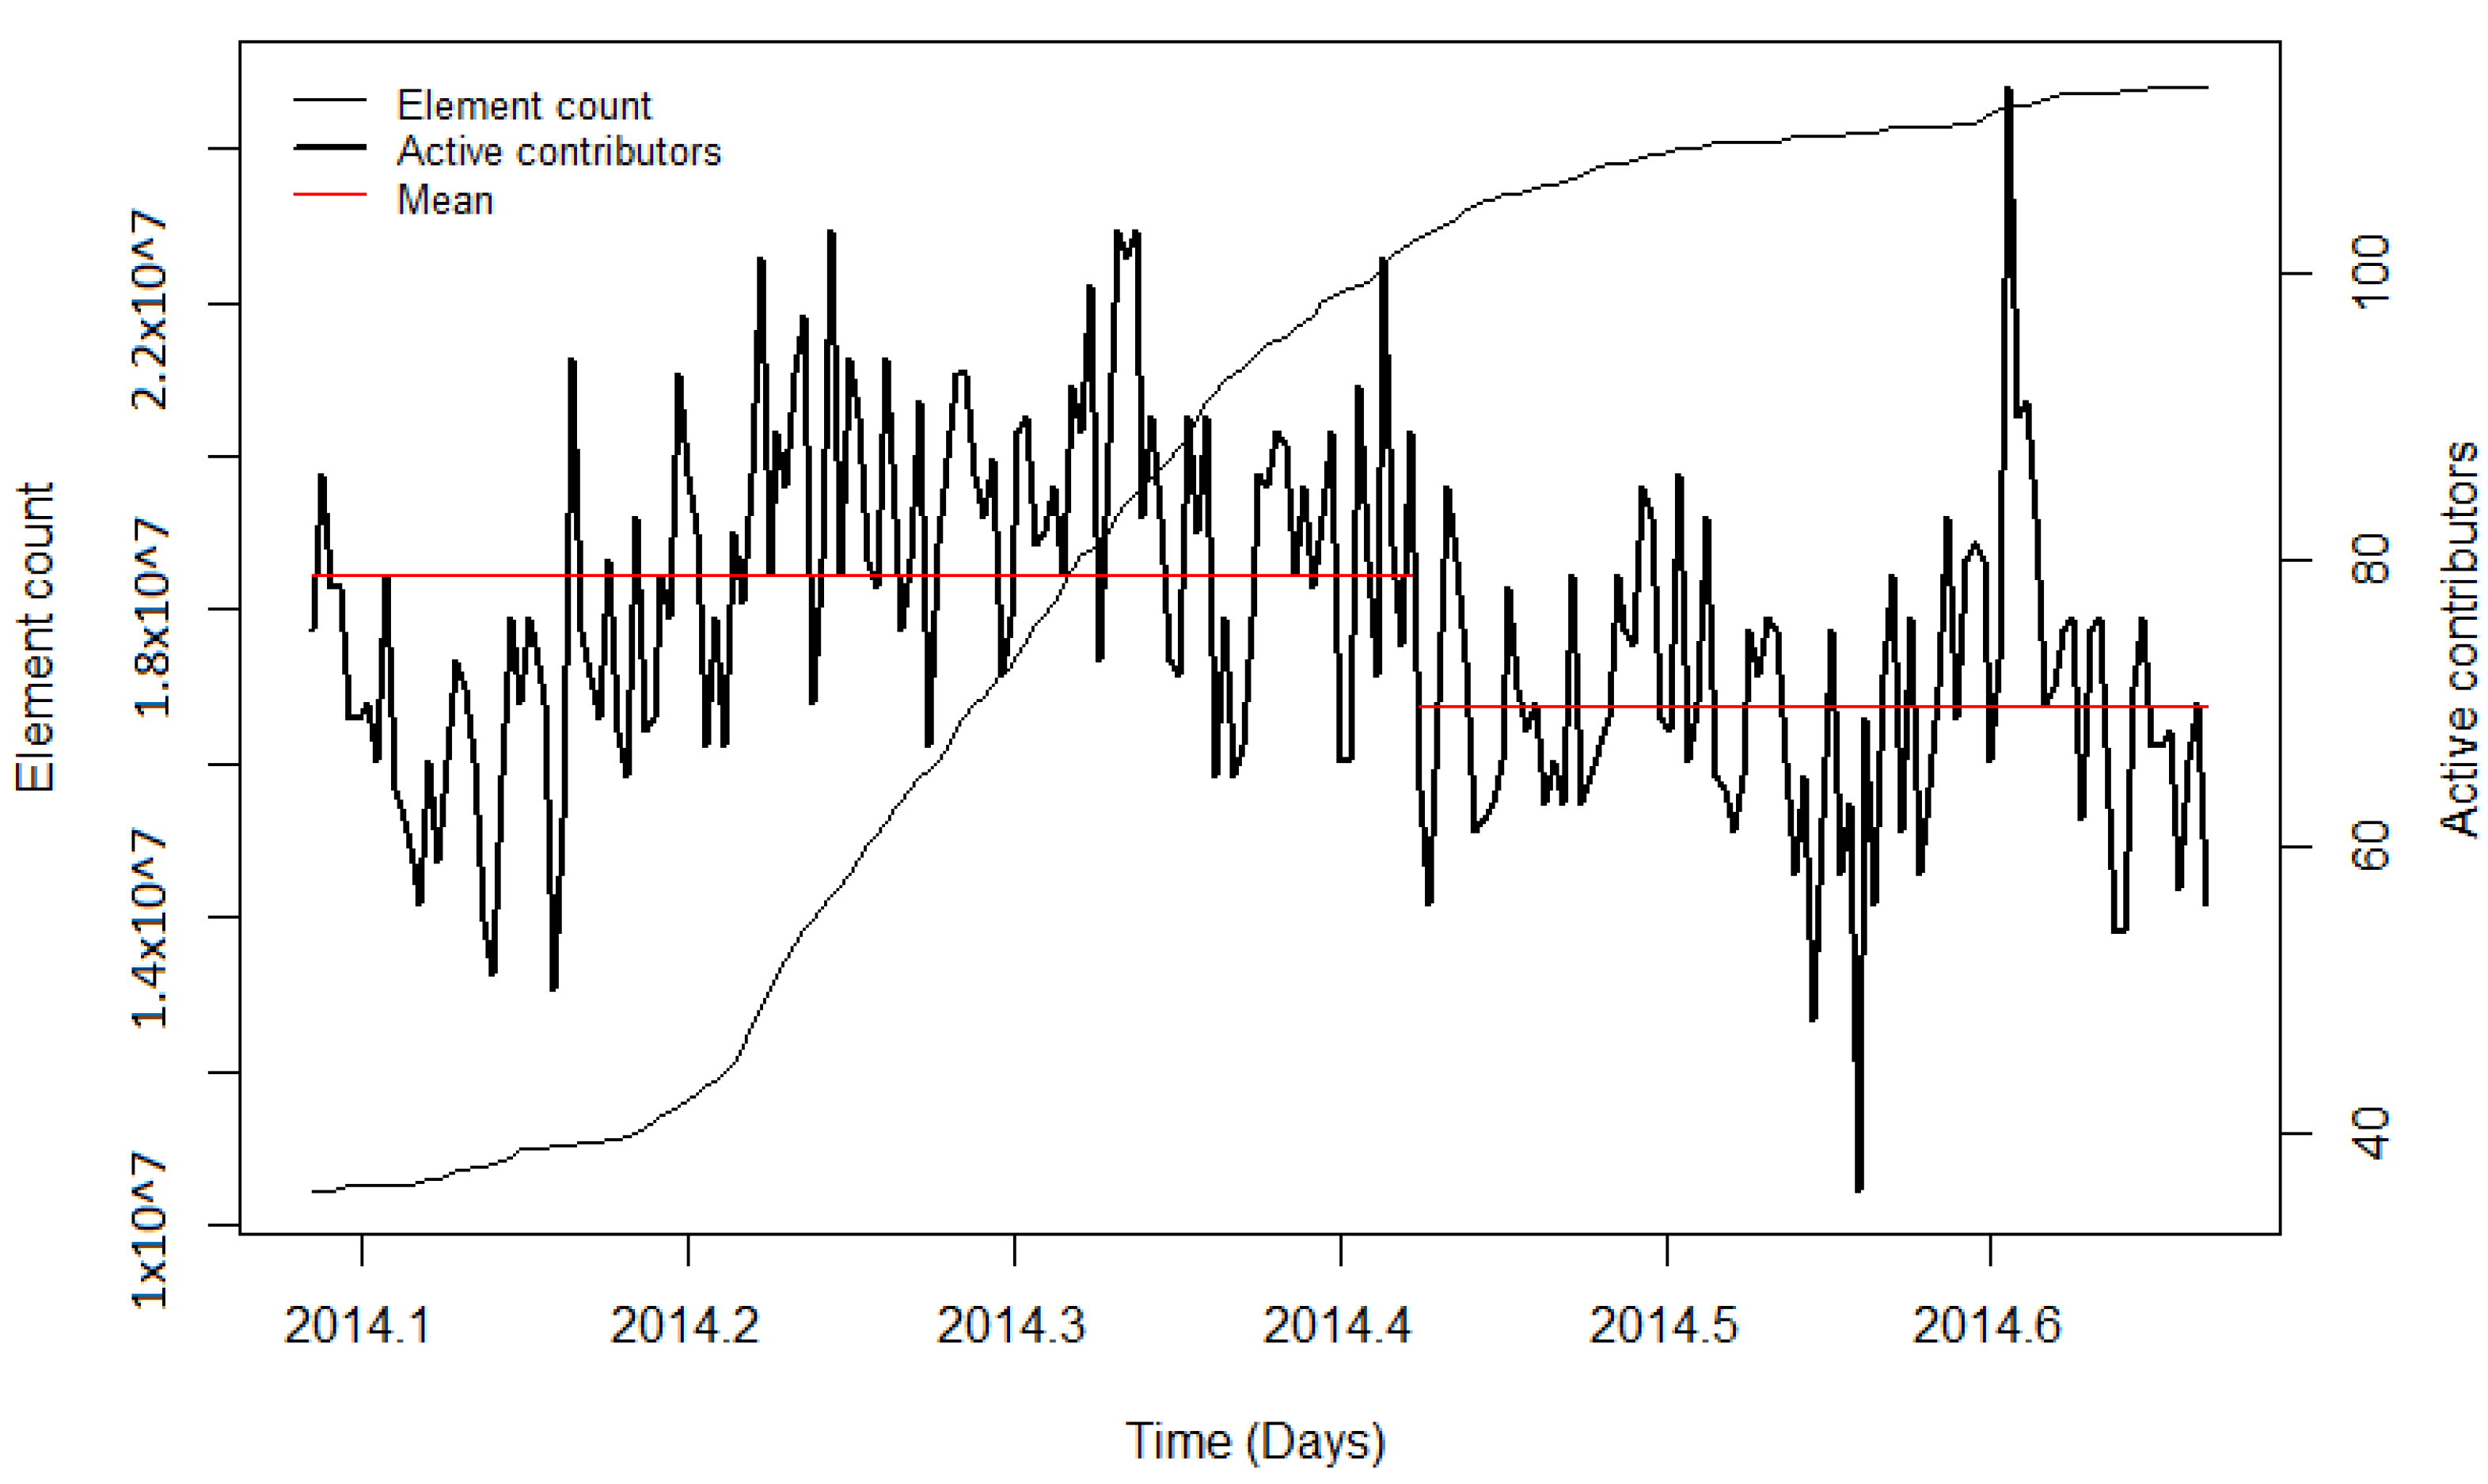
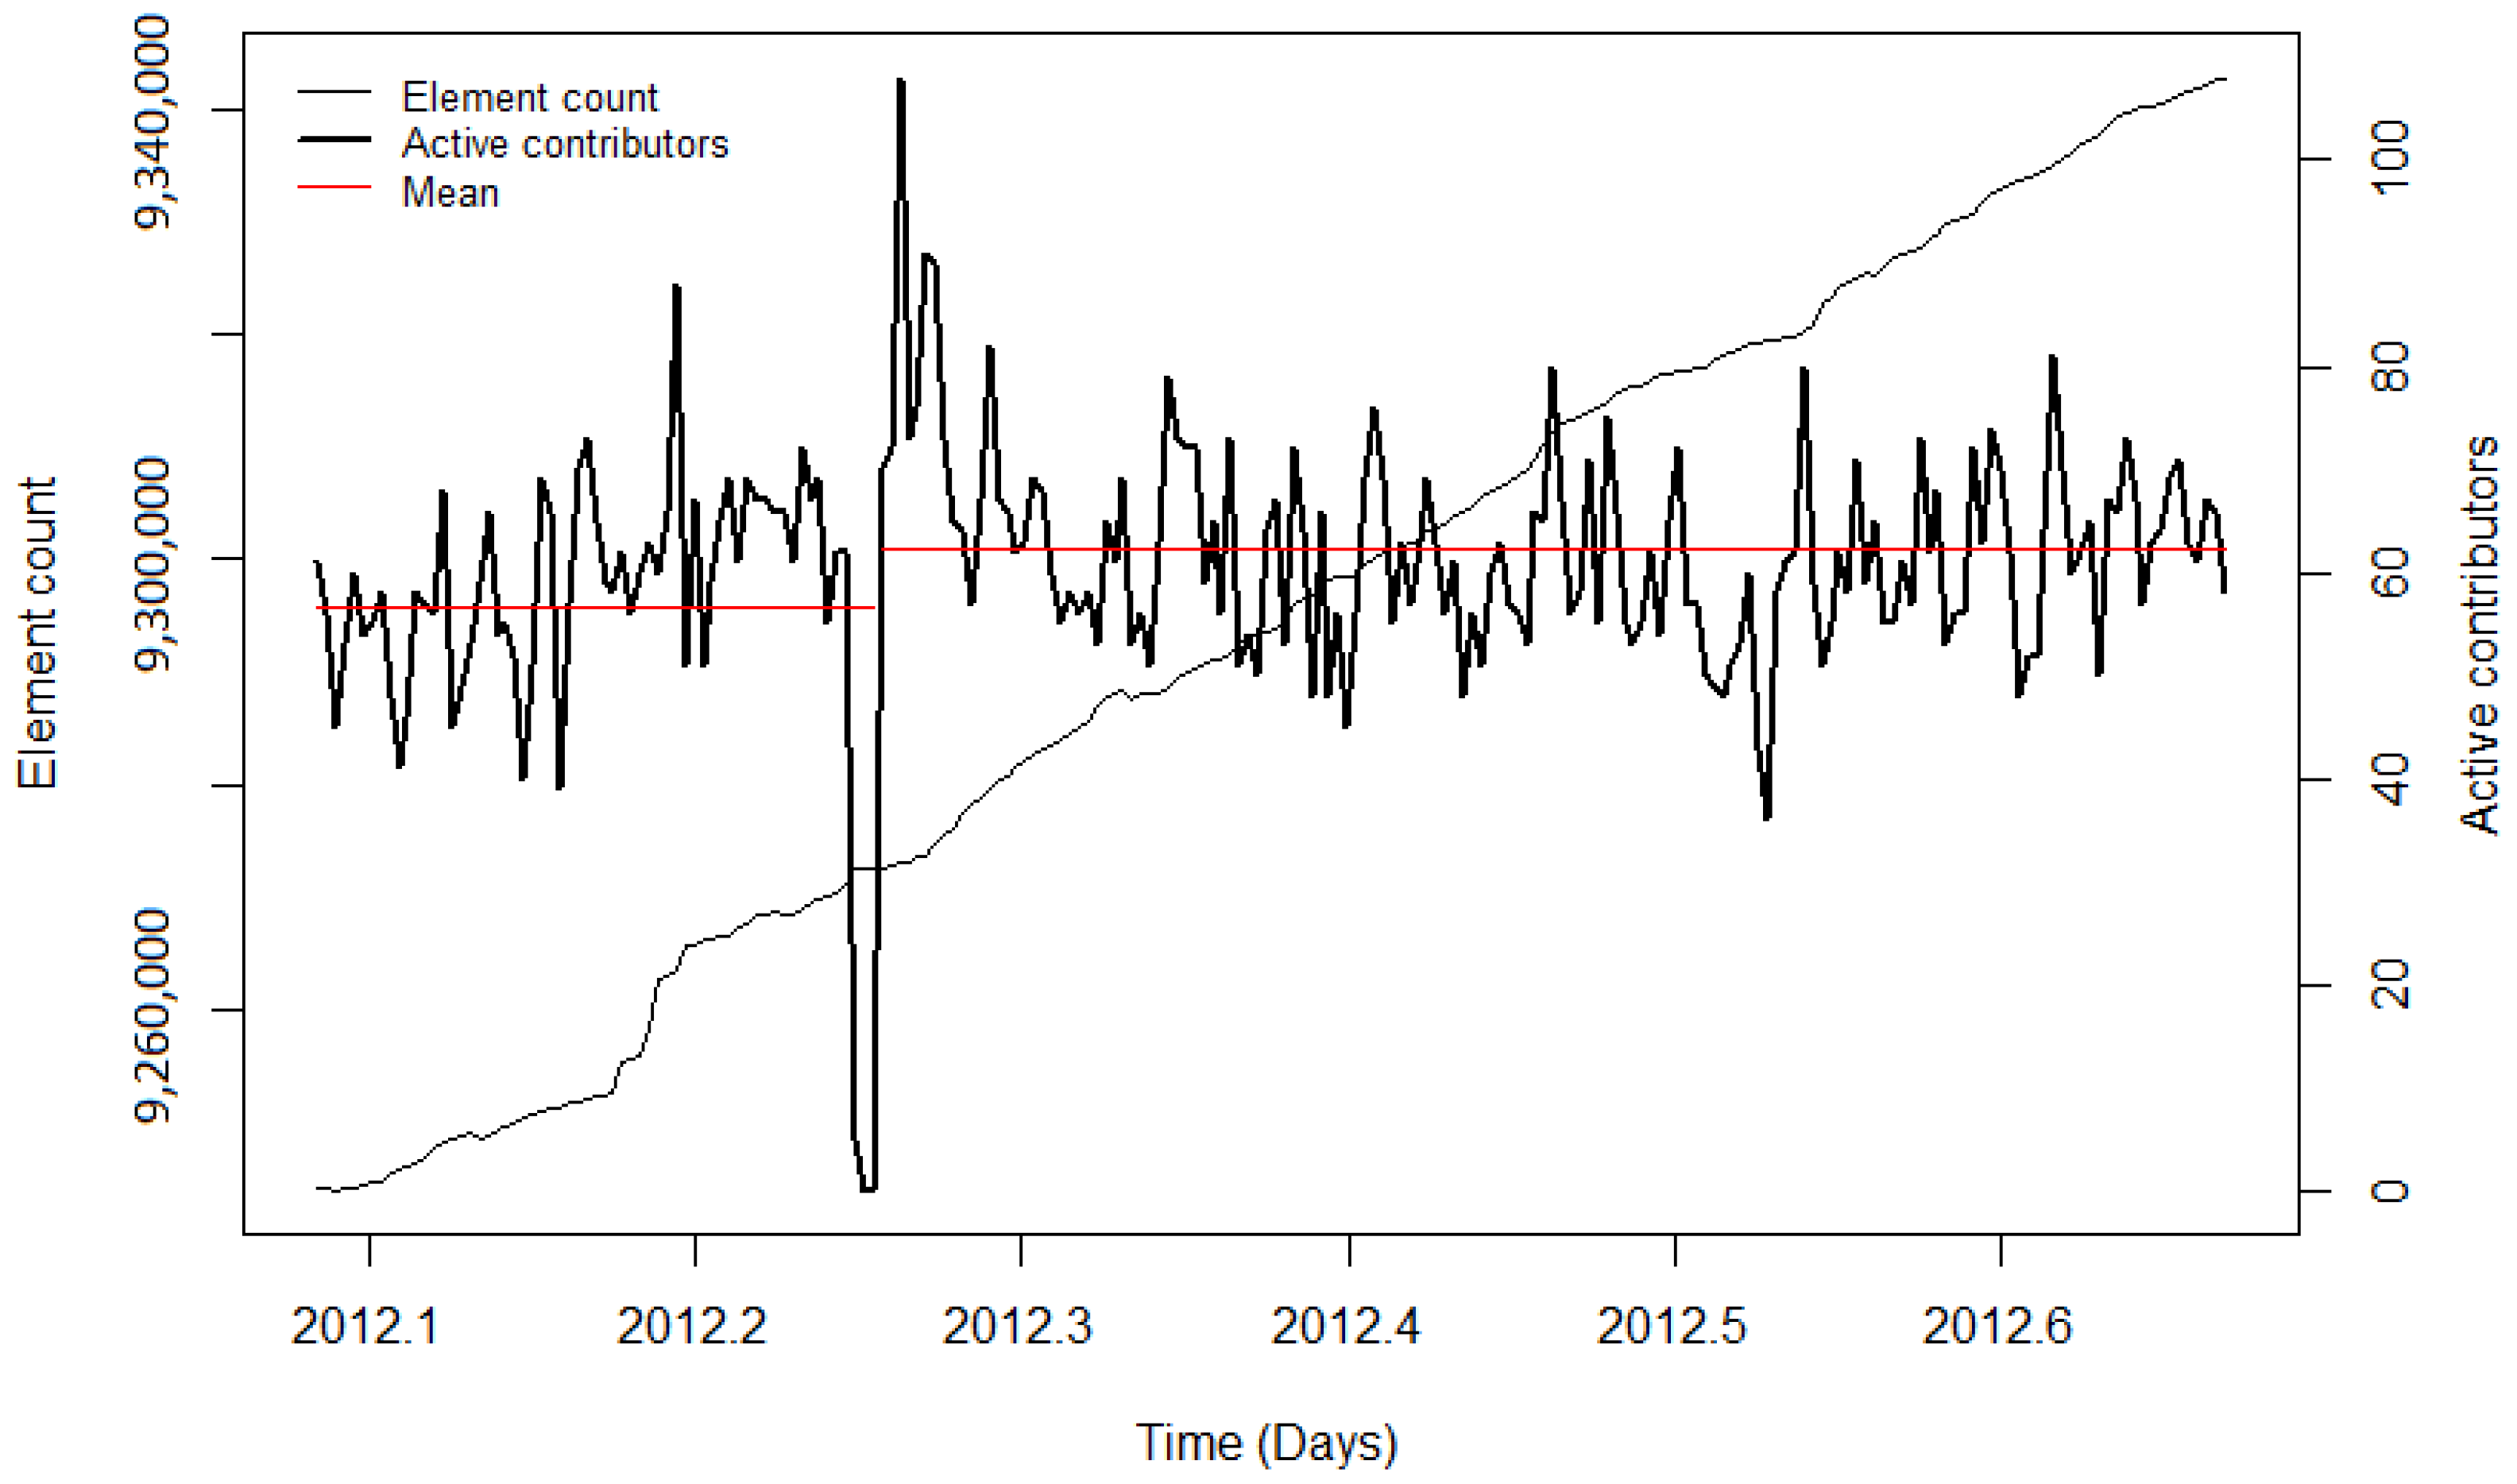
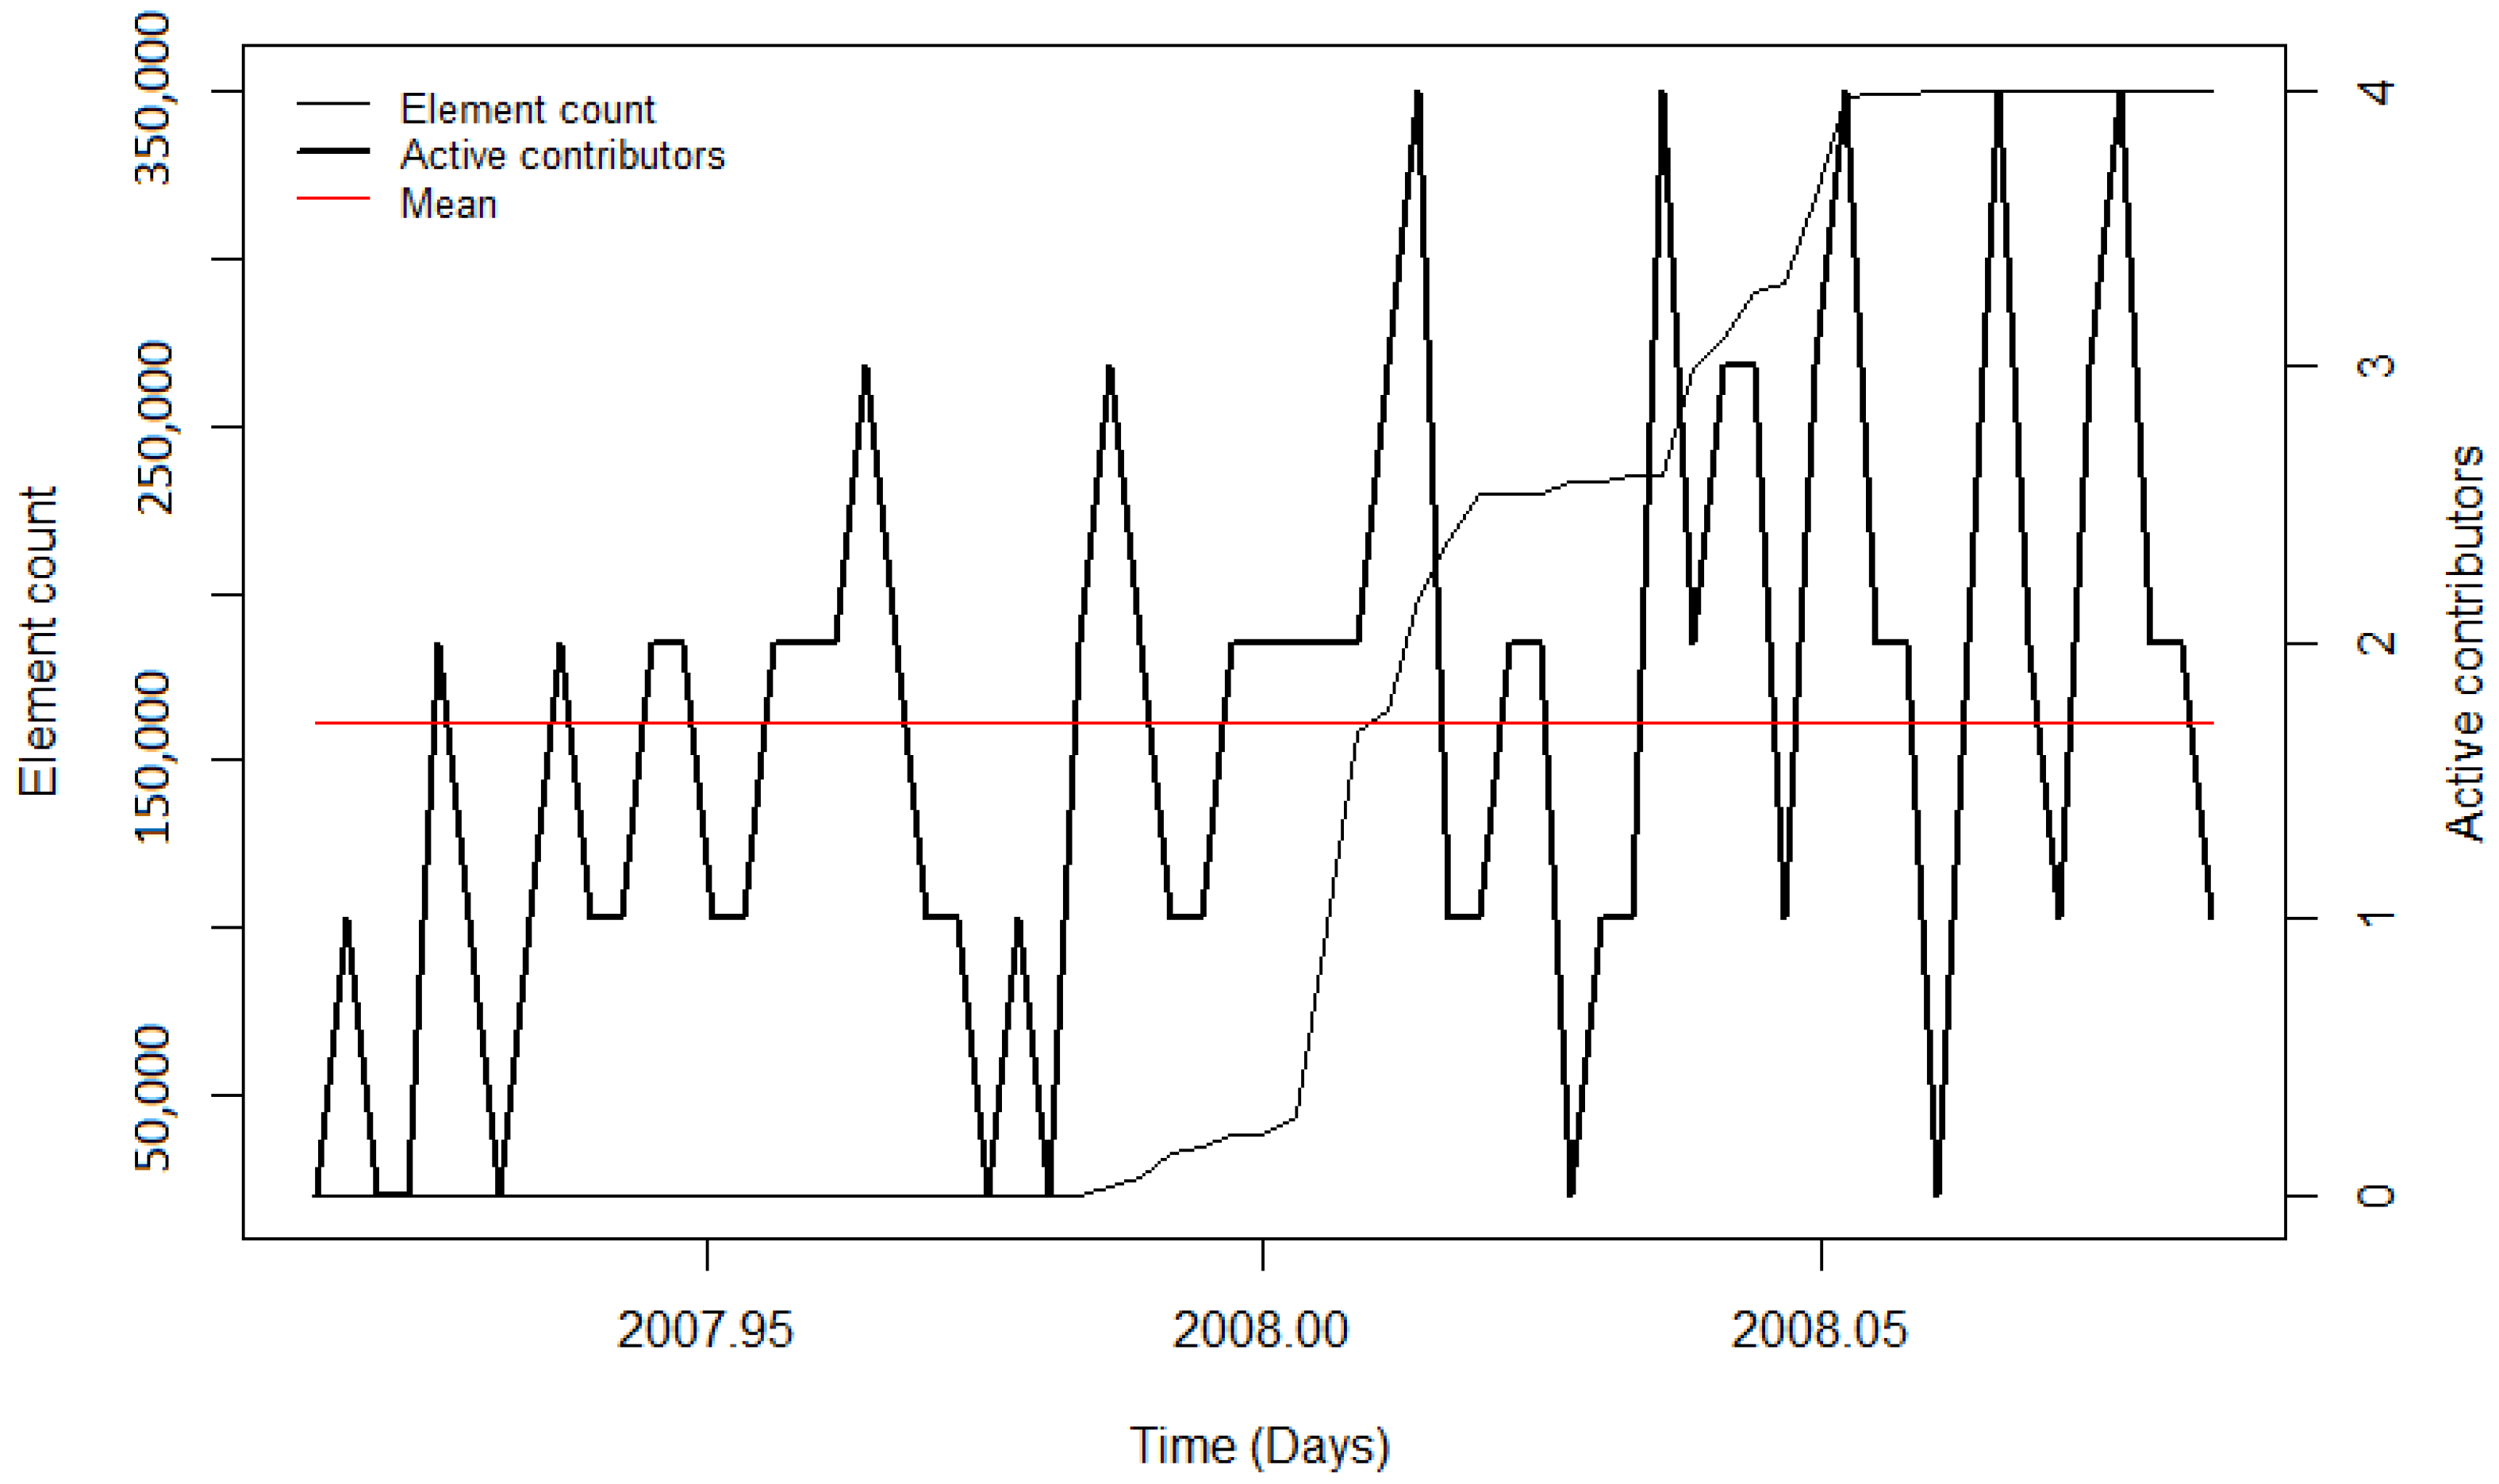
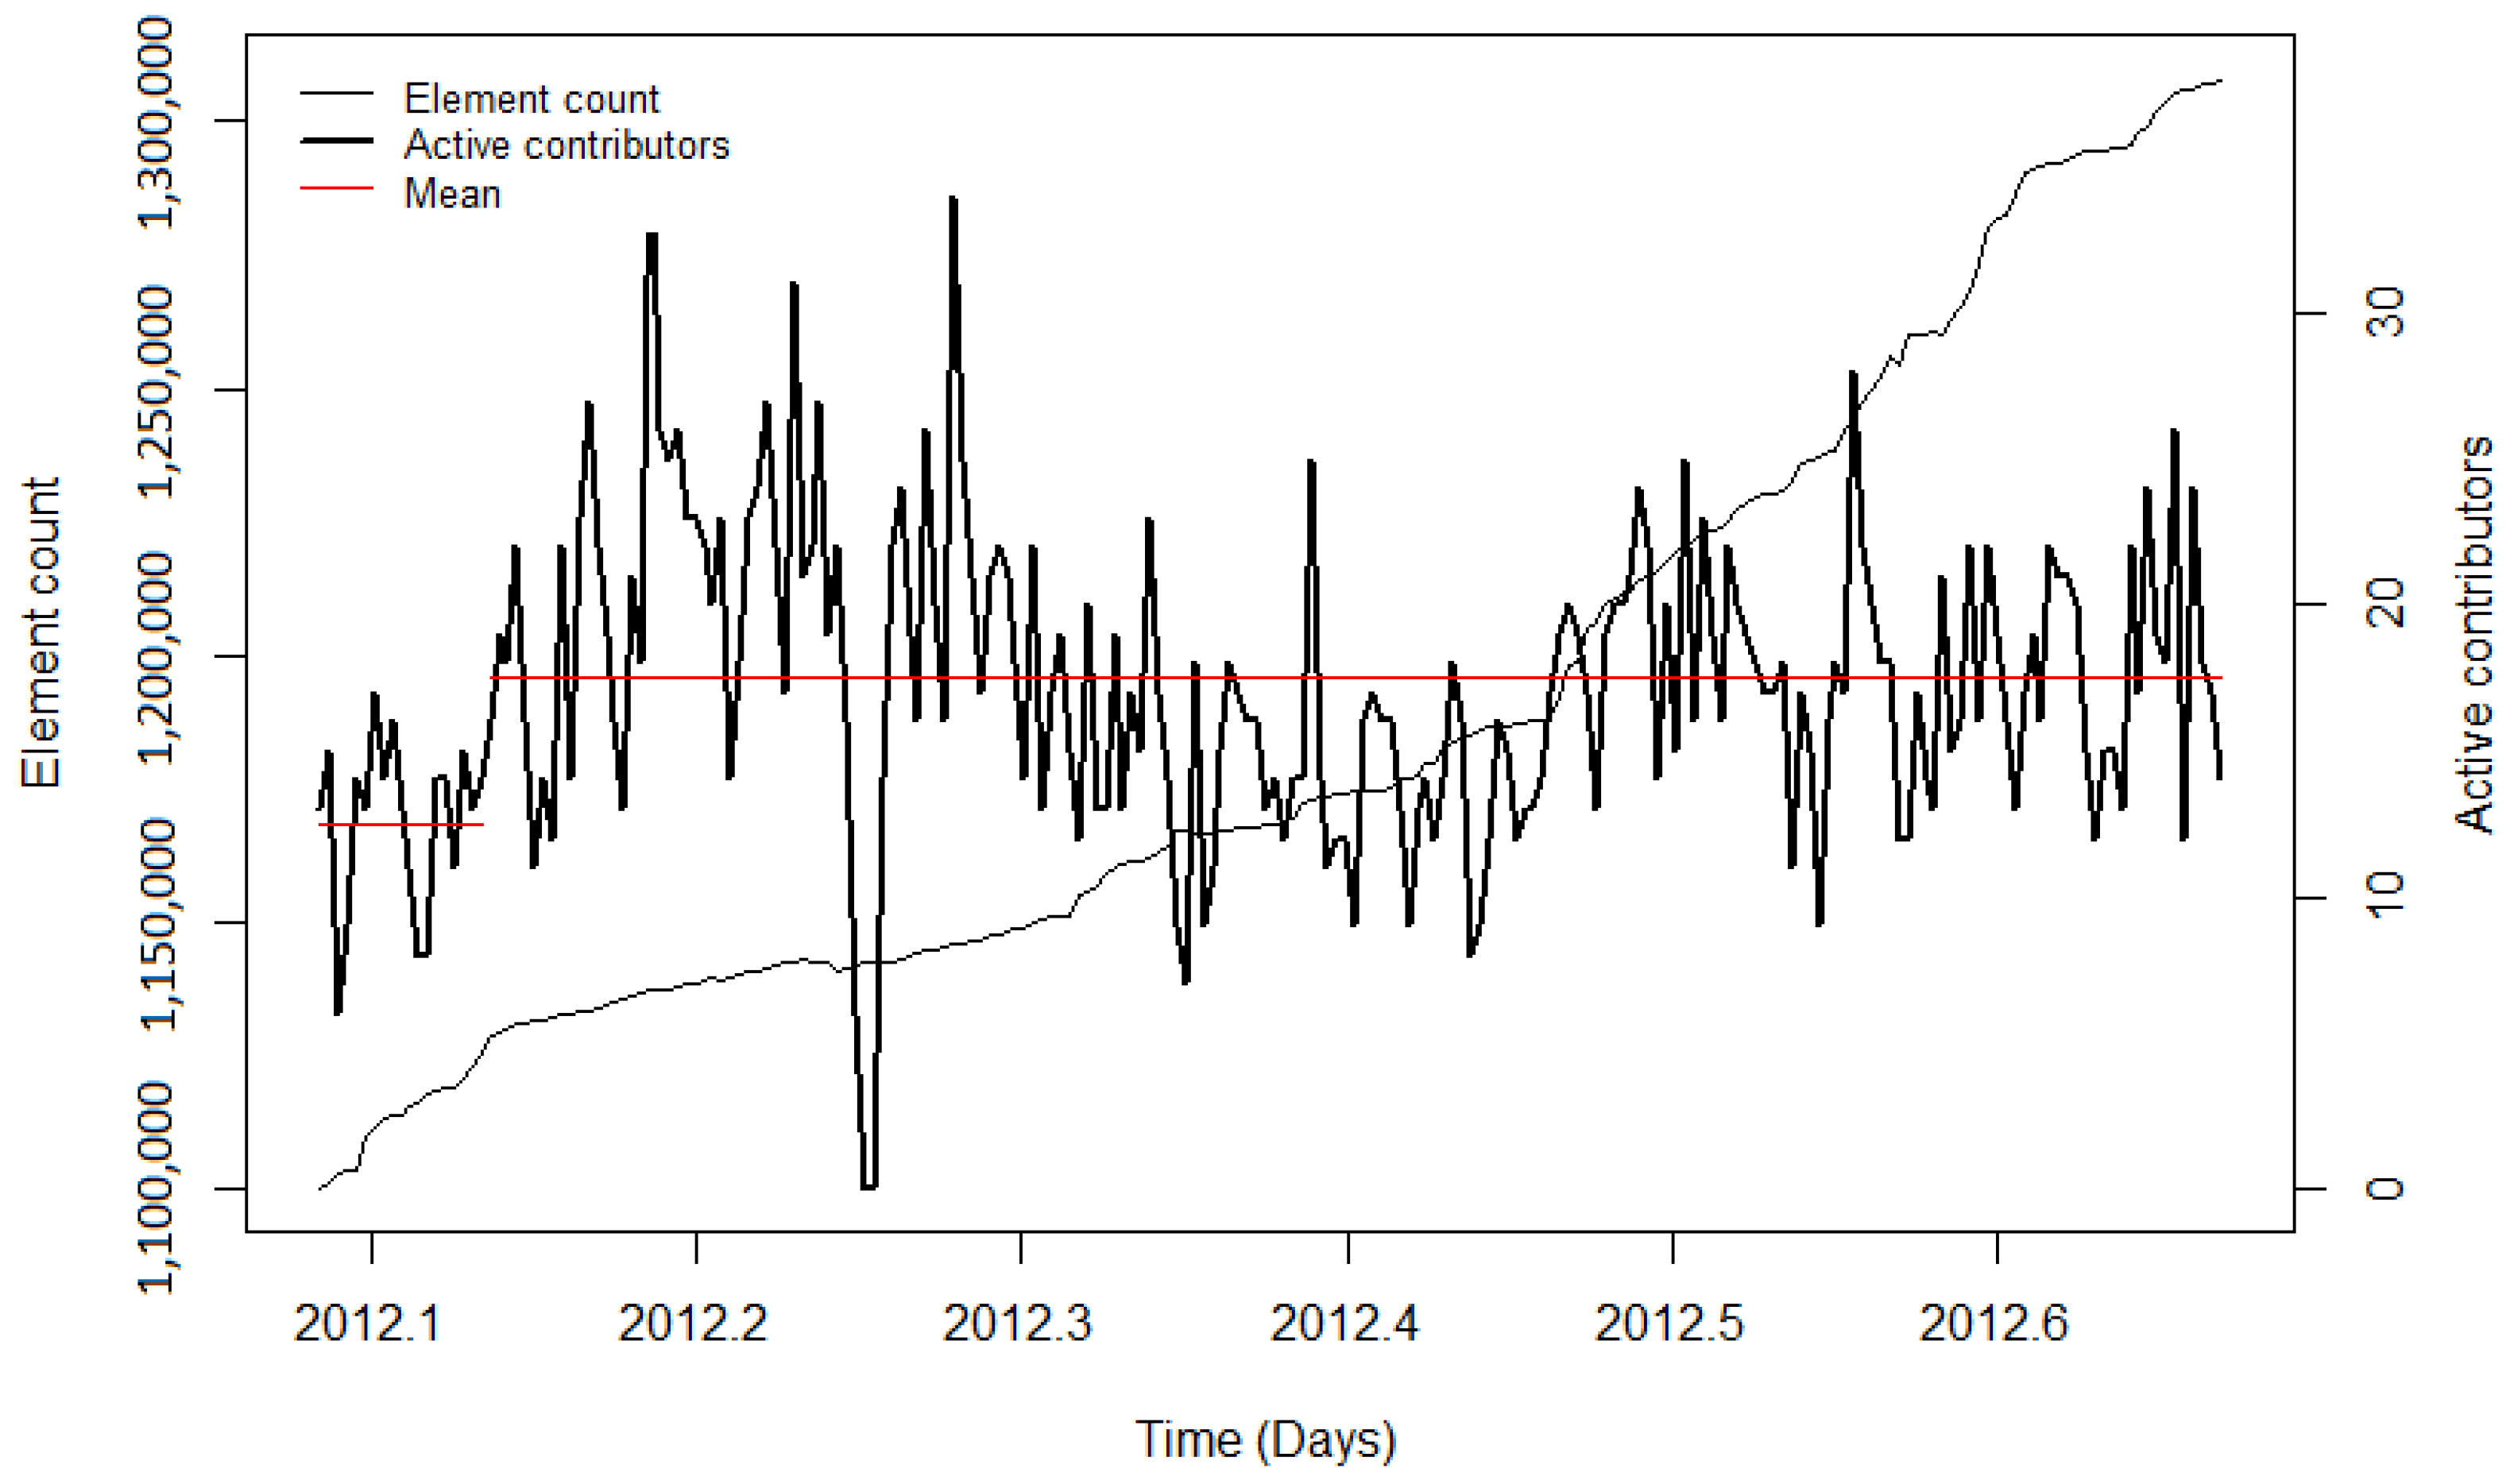
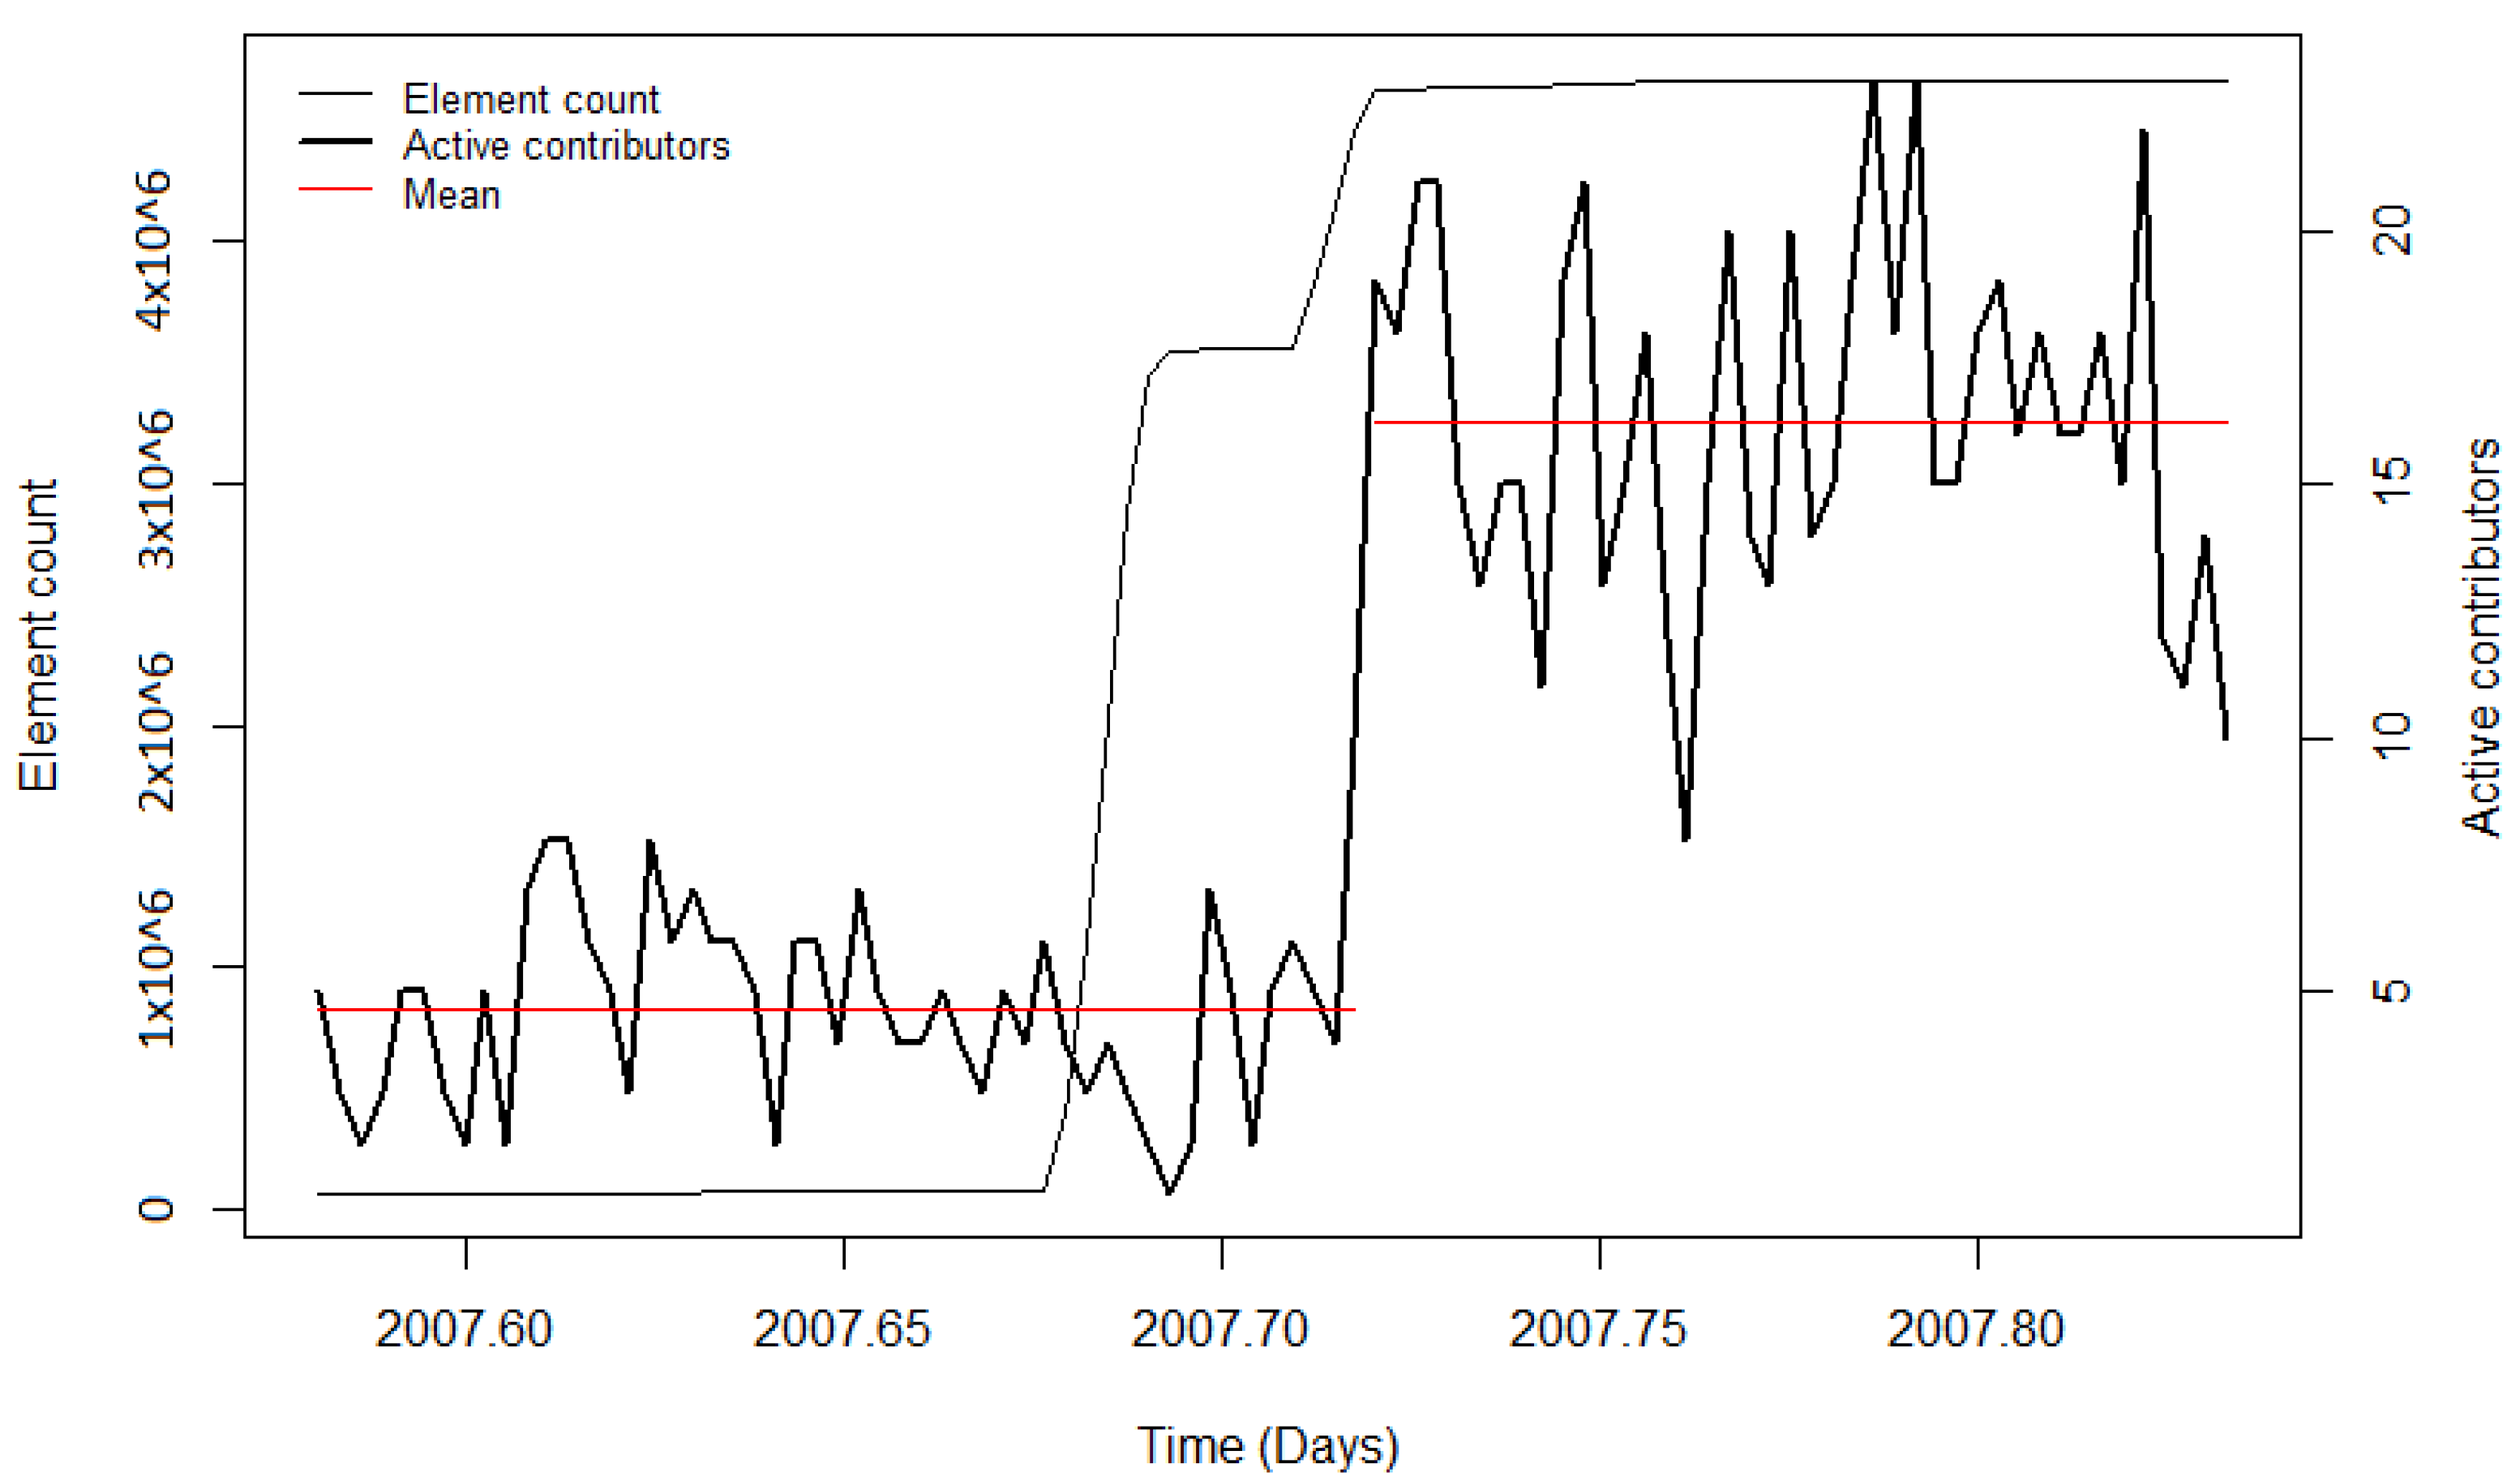
41]) likely benefitted the project, resulting in more volunteers who got involved in OSM to help with the execution of the import and the integration of the data. For the remaining imports, diverse results for the contributor activity were found. During the PGS import, no significant change in the user activity was detected. Additionally, for this import, the low activity could be explained by the newness of OSM, particularly in India. The observation periods of the BAG import and the first phase of the building import in India showed a decrease in mean contributor activity. Nonetheless, when looking at the diagrams, it can be seen that during both imports, the mean number of active contributors was high, indicating stronger user activity while importing the data, but decreased involvement afterwards. For the time periods without a large data import, the CP algorithm also detected changes in the mean. However, the changes could have been caused by other events (for example, in India) or because of the downtime of the servers (for example in the Netherlands). Summarising for the contributor activity, it was found that during and after most of the large data imports, the contributor activity was higher than before the import. Nonetheless, this was also the case for the analysed time intervals without large data imports. Table 6 displays the outcomes of the changepoint detection analysis, including the differences and growth rates for all observation periods.
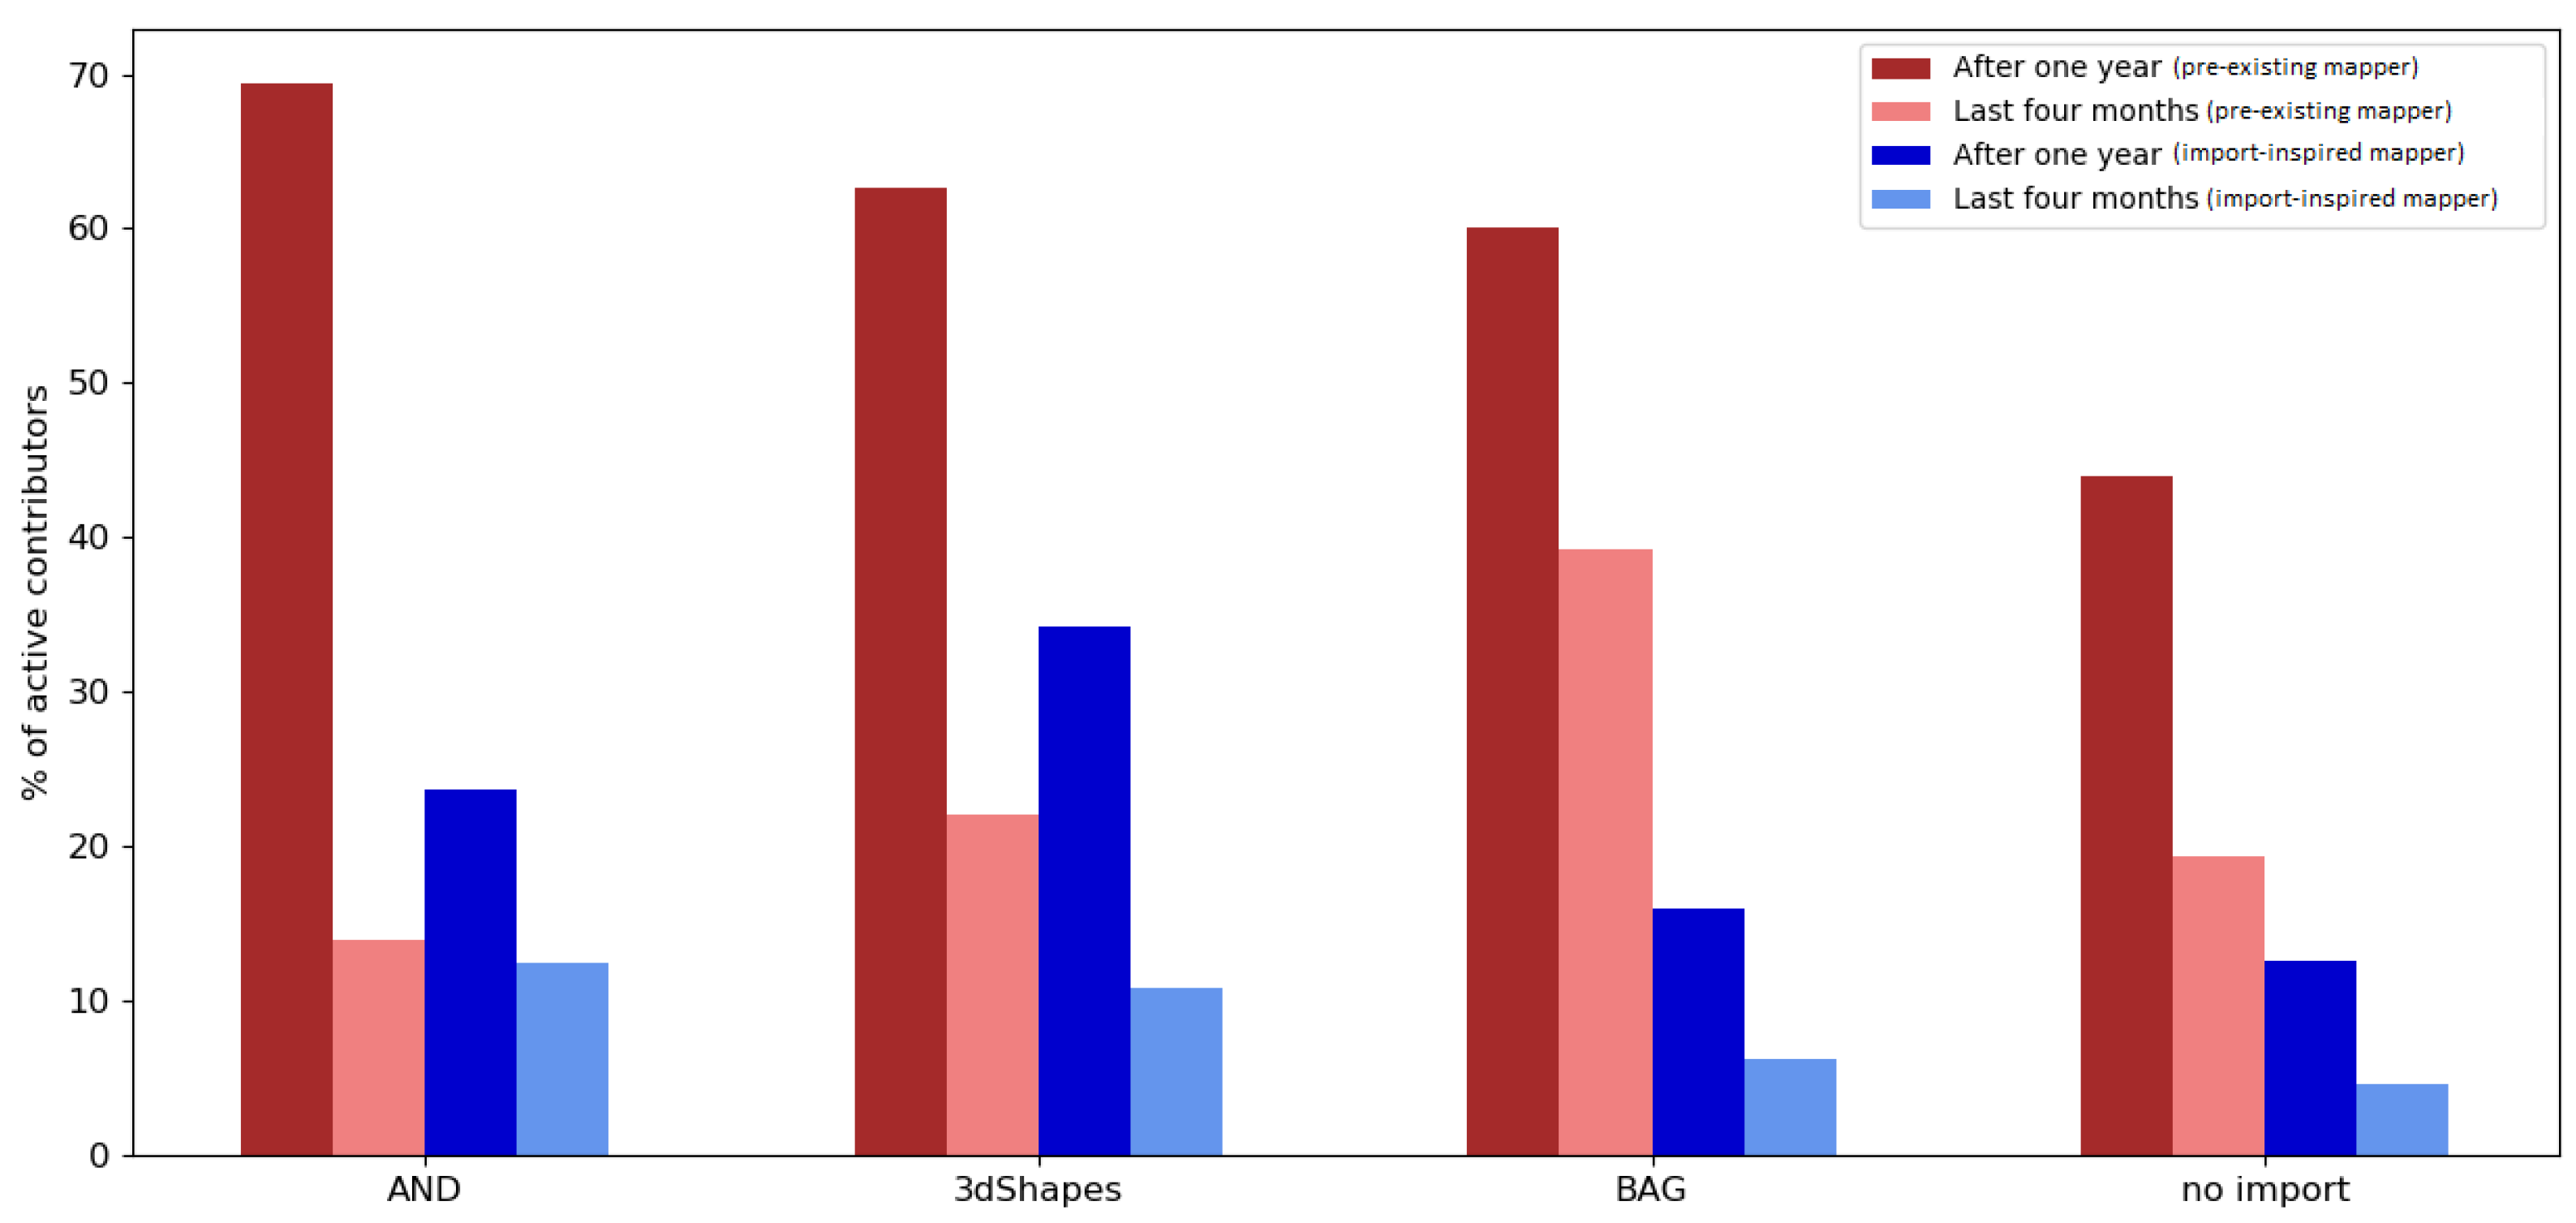
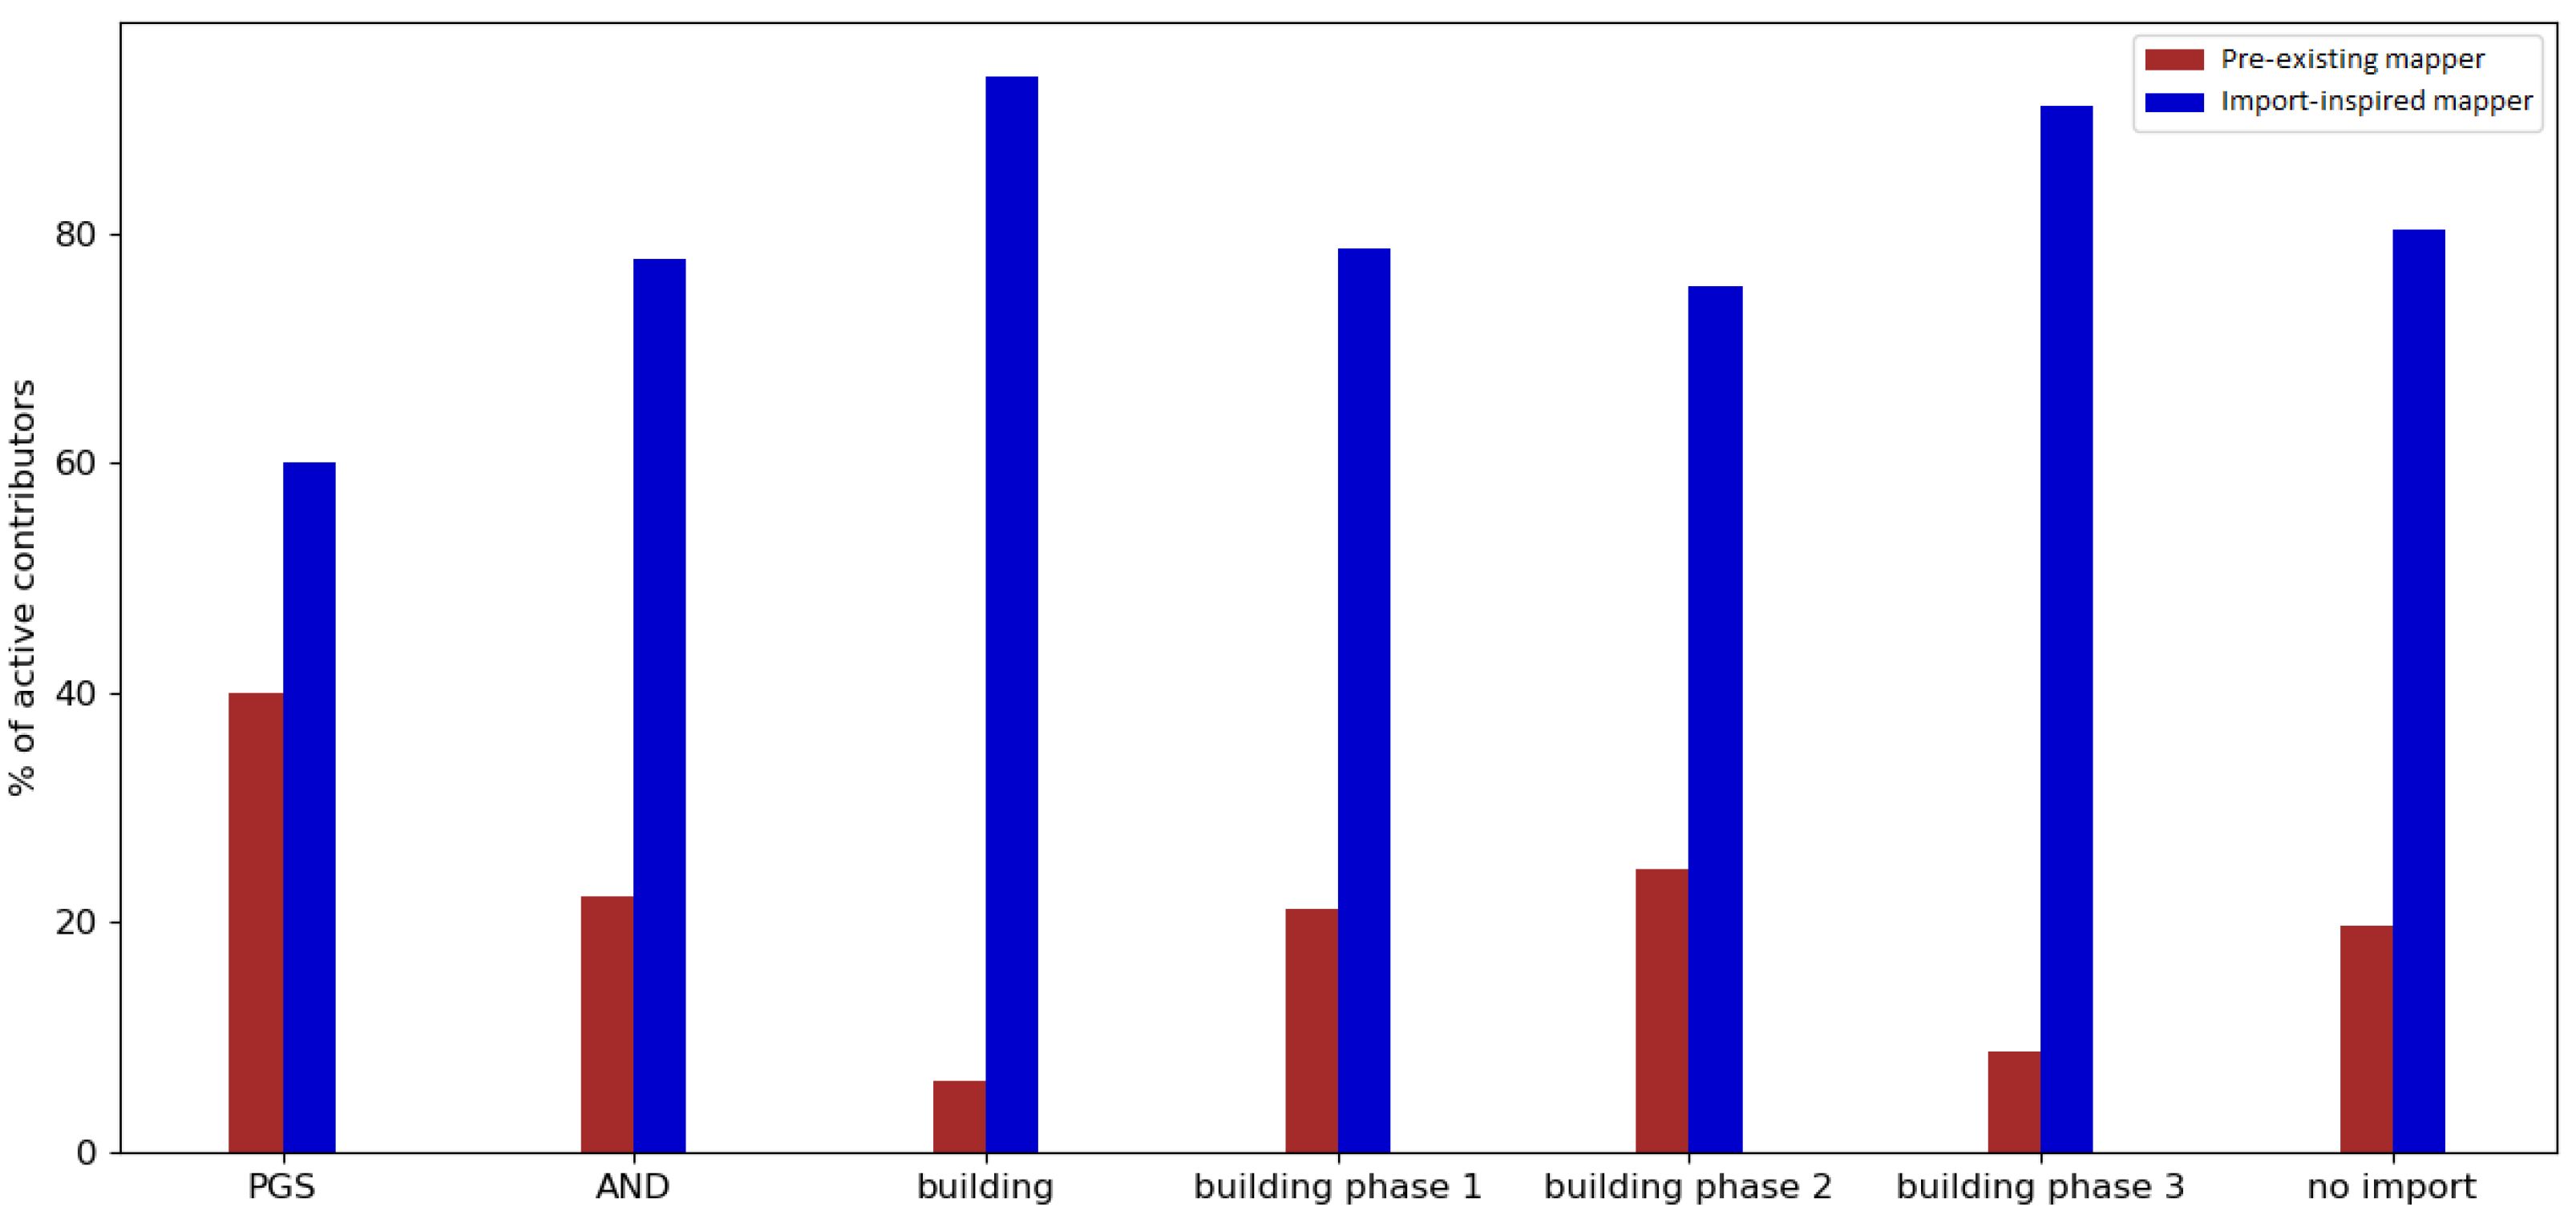
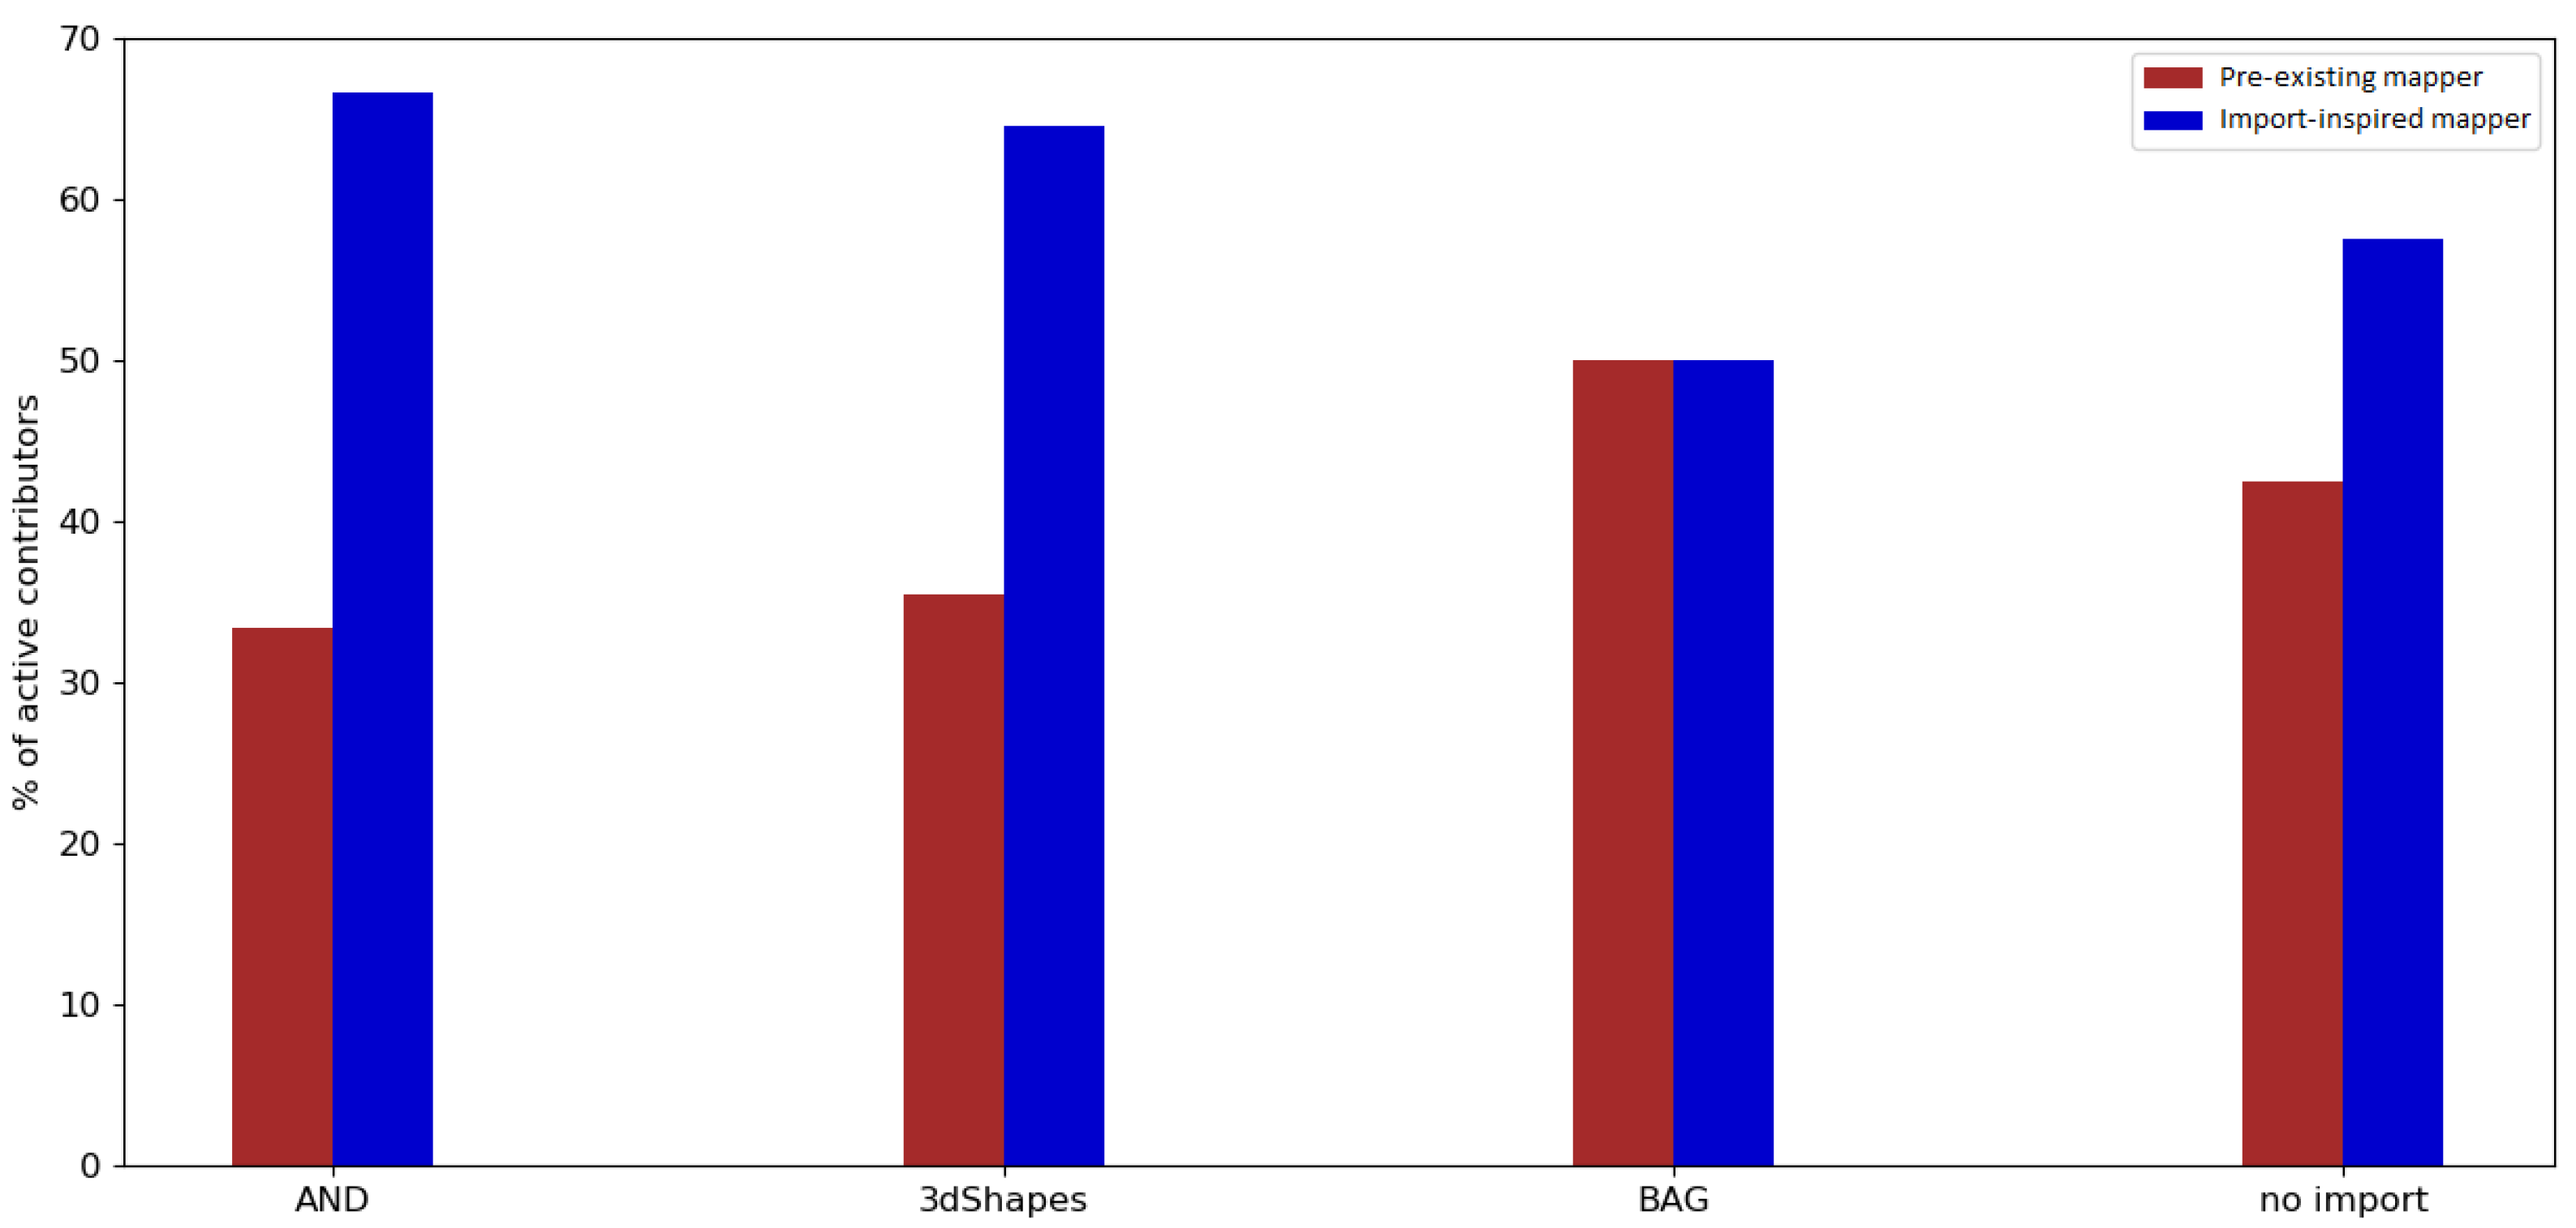
Regarding the engagement of contributors who were involved in an import, it was found that the majority of contributors who took part in a large data import were import-inspired mappers (contributors who made at least their first edits during the observation period). The same applied for the periods without any large data import. However, the involvement of contributors changed drastically after one year.
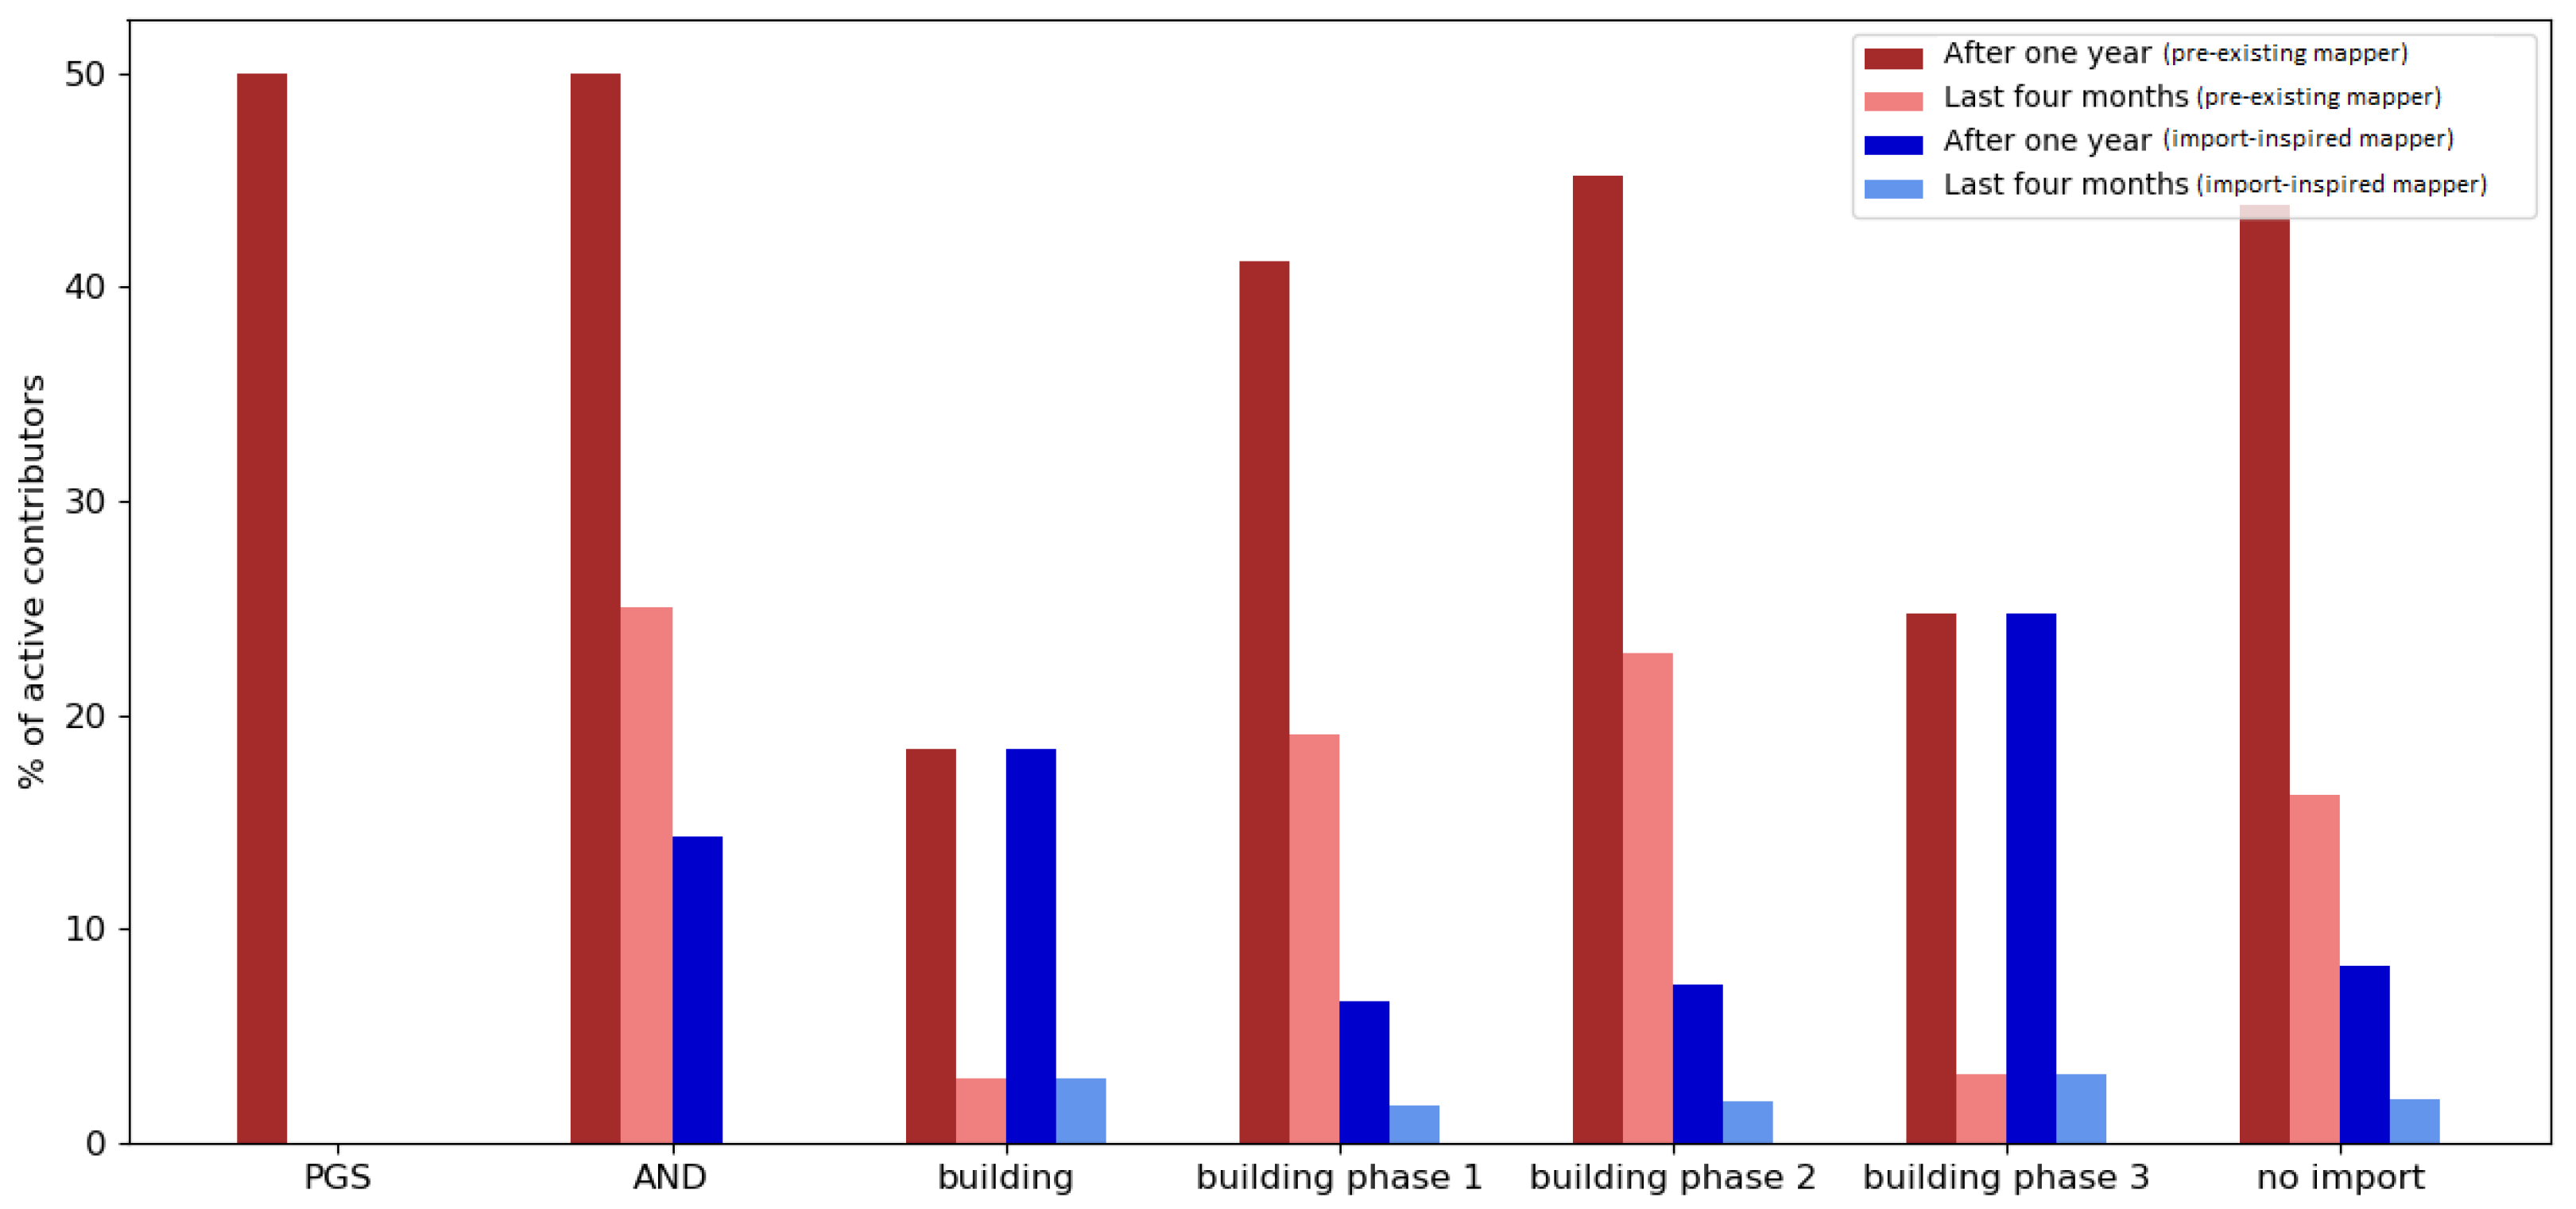
Pre-existing mappers who were editing or creating data in OSM before an import were more likely to remain active in OSM (e.g., for all the imports in the Netherlands, more than 60% of the pre-existing mappers were still contributing one year after the observation period). Most of the pre-existing mappers in the control group contributed to OSM after one year (approximately 50% in the Netherlands; approximately 40% in India).
Import-inspired mappers were found to not normally stay involved for longer than one year after the import (e.g., for the imports in the Netherlands, less than 35% of import-inspired mappers were still contributing one year after the observation period). A similar development can be seen when looking at the engagement of import-inspired mappers of the control group (less than 20% in the Netherlands and less than 10% in India were still active).
Looking at the ratio of pre-existing mappers who were contributing to OSM between 1 May 2019 and 31 August 2019, only a fraction of the users remained active. An example that stands out contradictorily is the BAG import in the Netherlands. More than 40% of pre-existing mappers were still active between 1 May 2019 and 31 August 2019. This could be explained with the timing of the import, given that it happened late in the project.
For import-inspired mappers who were participating in an import, less than 15% contributed to OSM between 1 May 2019 and 31 August 2019 overall, indicating a relatively low rate of involvement.
Altogether, it was found that the majority of OSM users who were involved in an import made their first edits within the import observation period. However, users who already had experience before being involved in an import were more likely to stay active. This applied to both the contributors who participated in large data imports and the contributors of the control group.

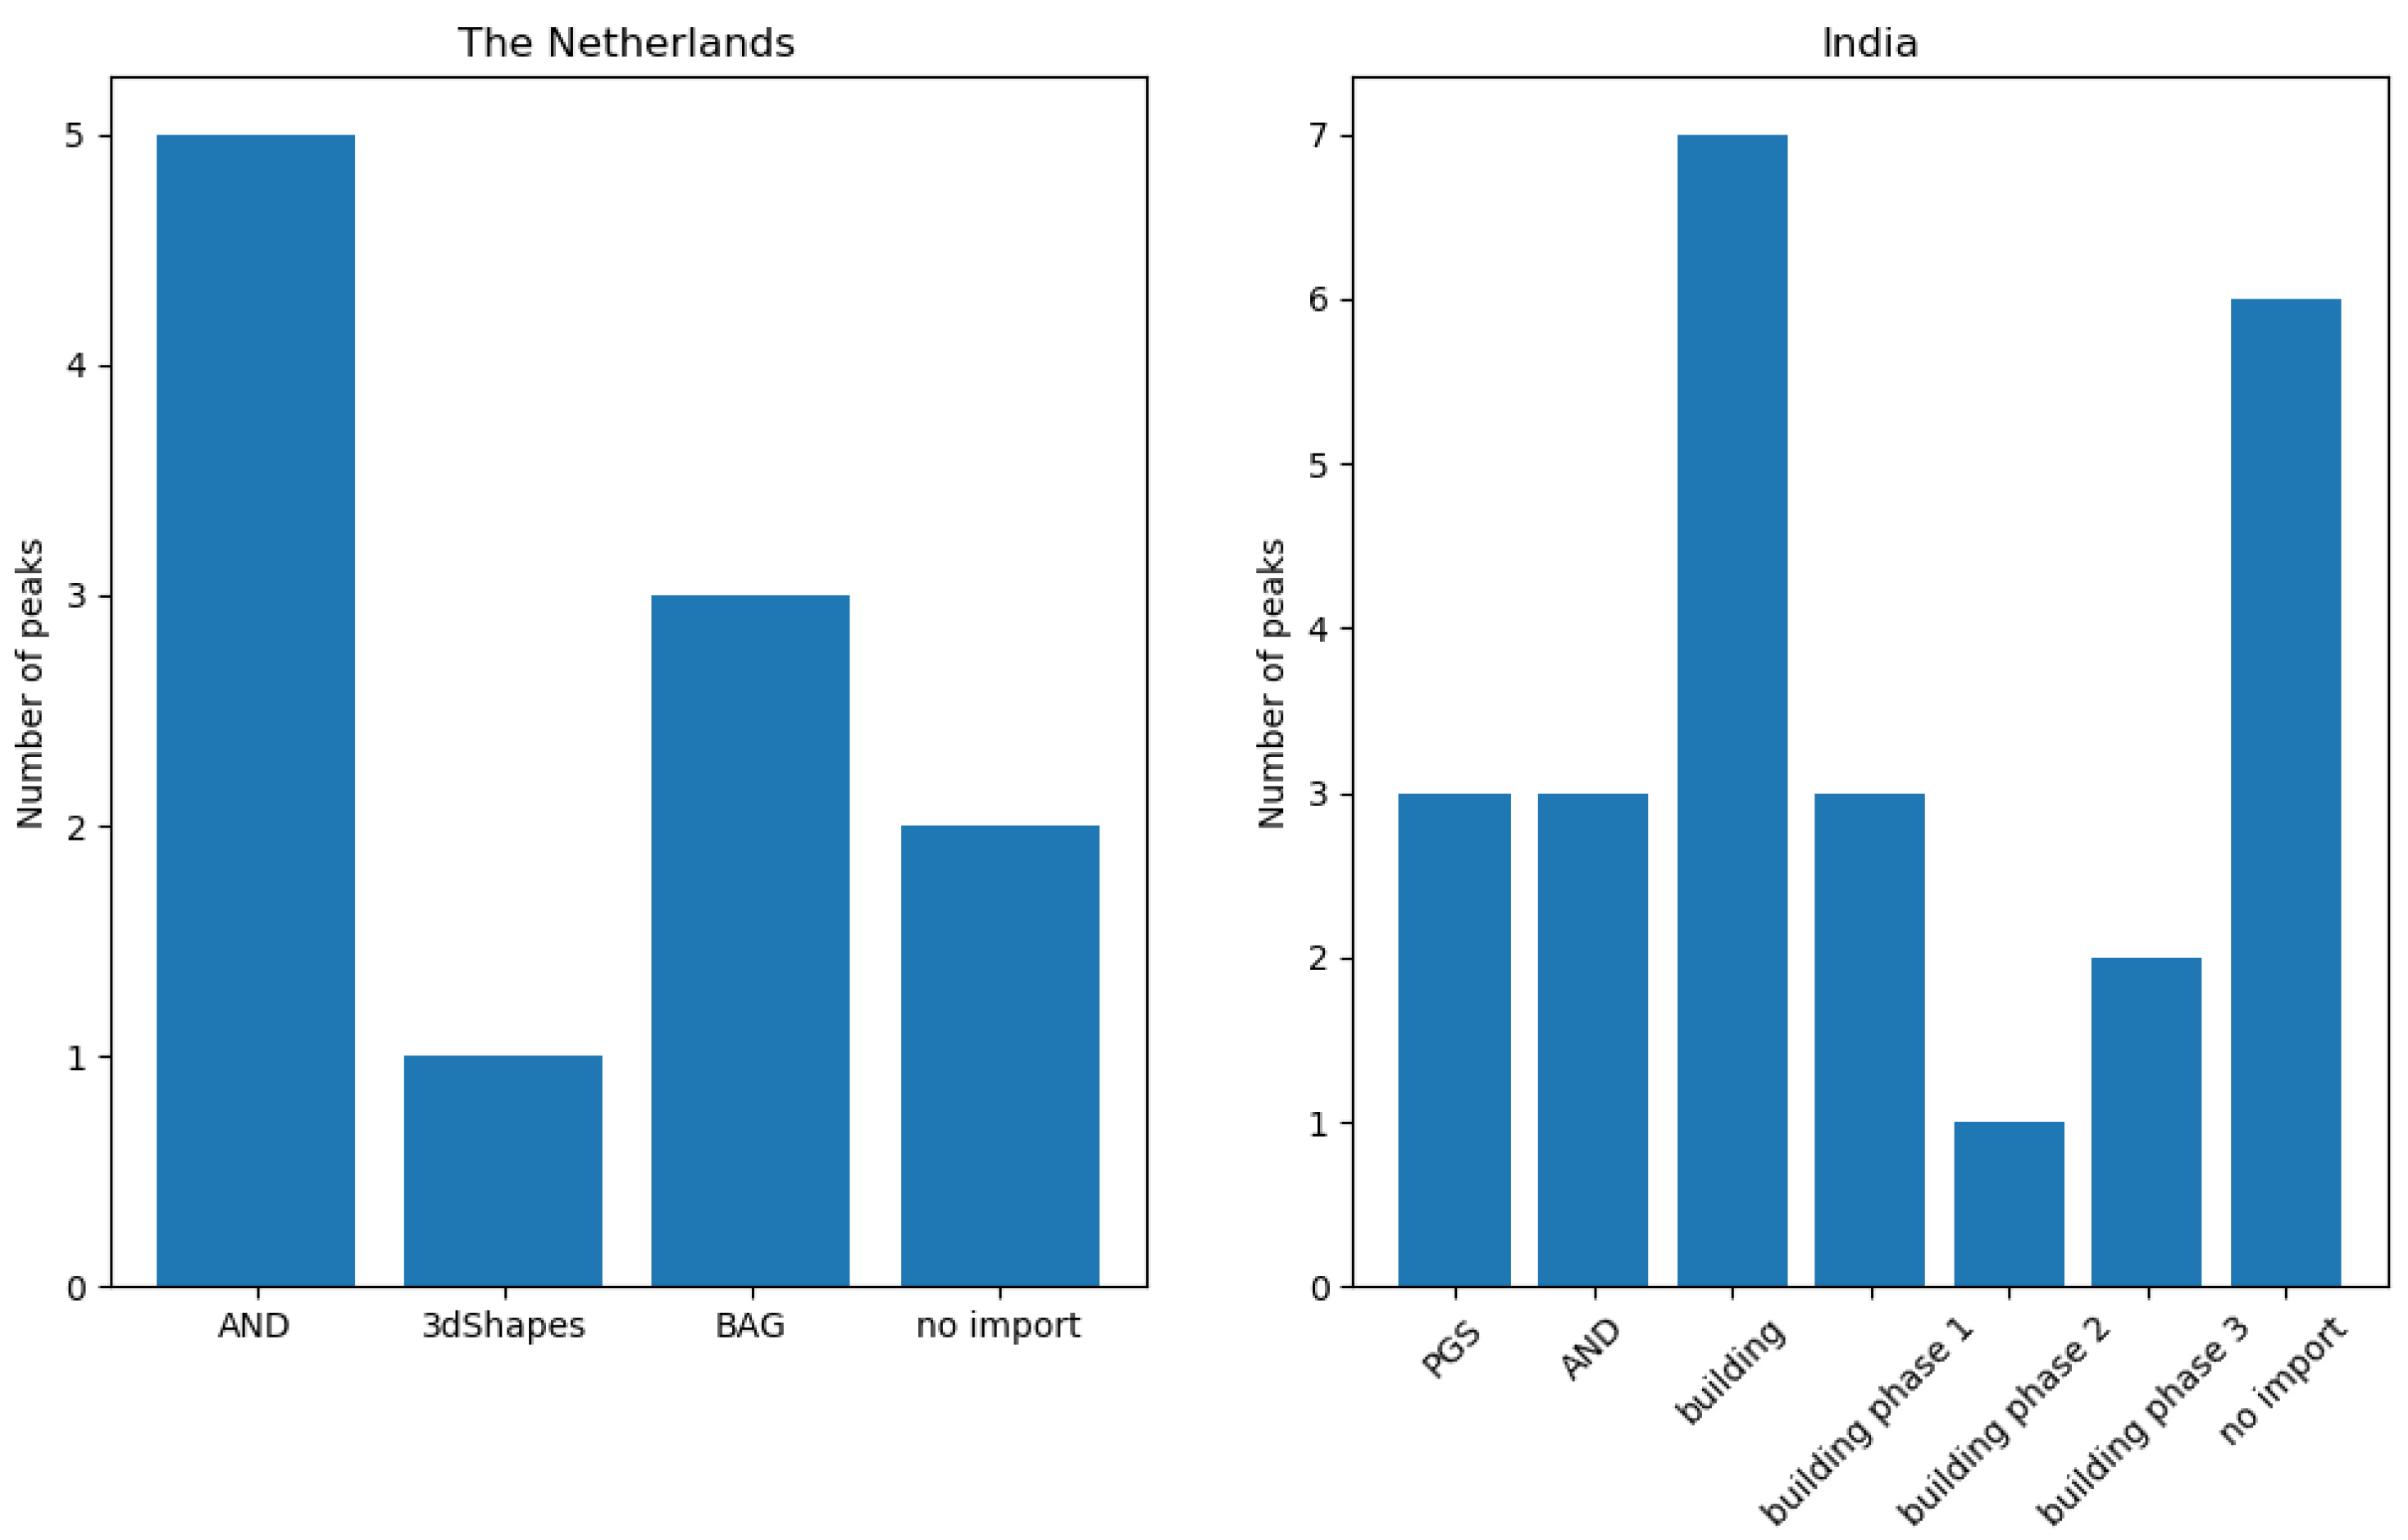
4.1.2. Contribution Types

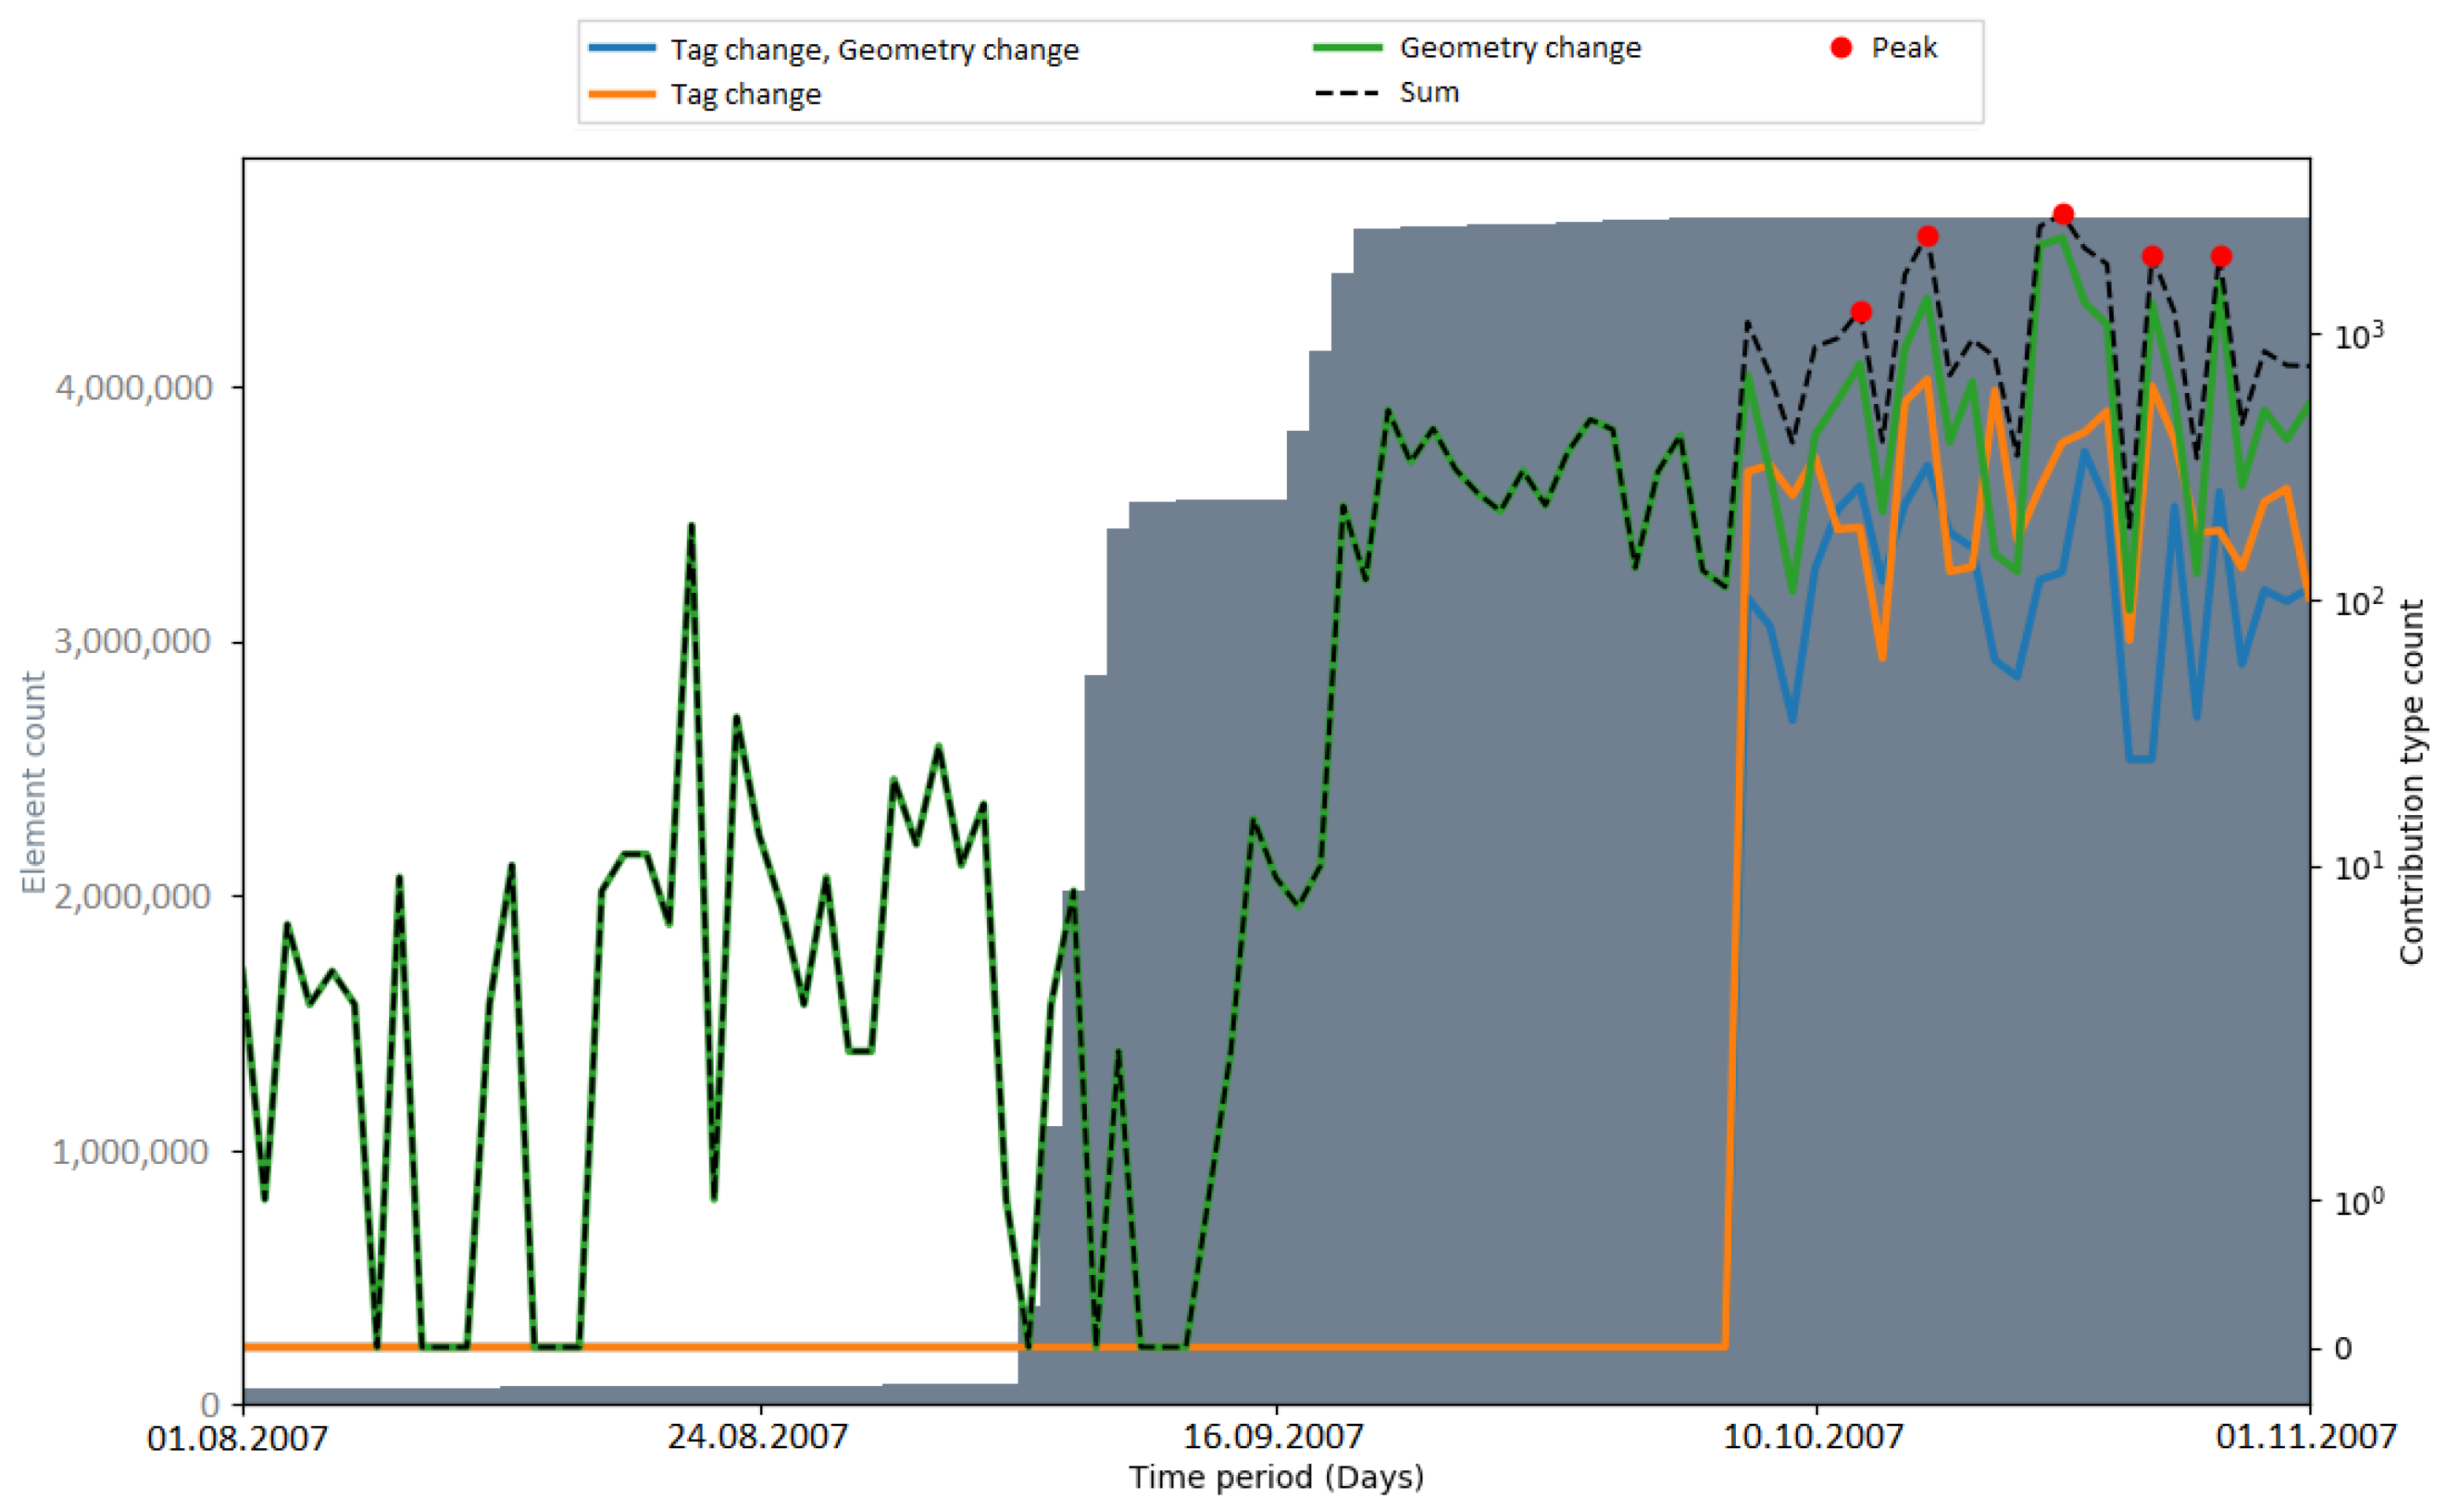
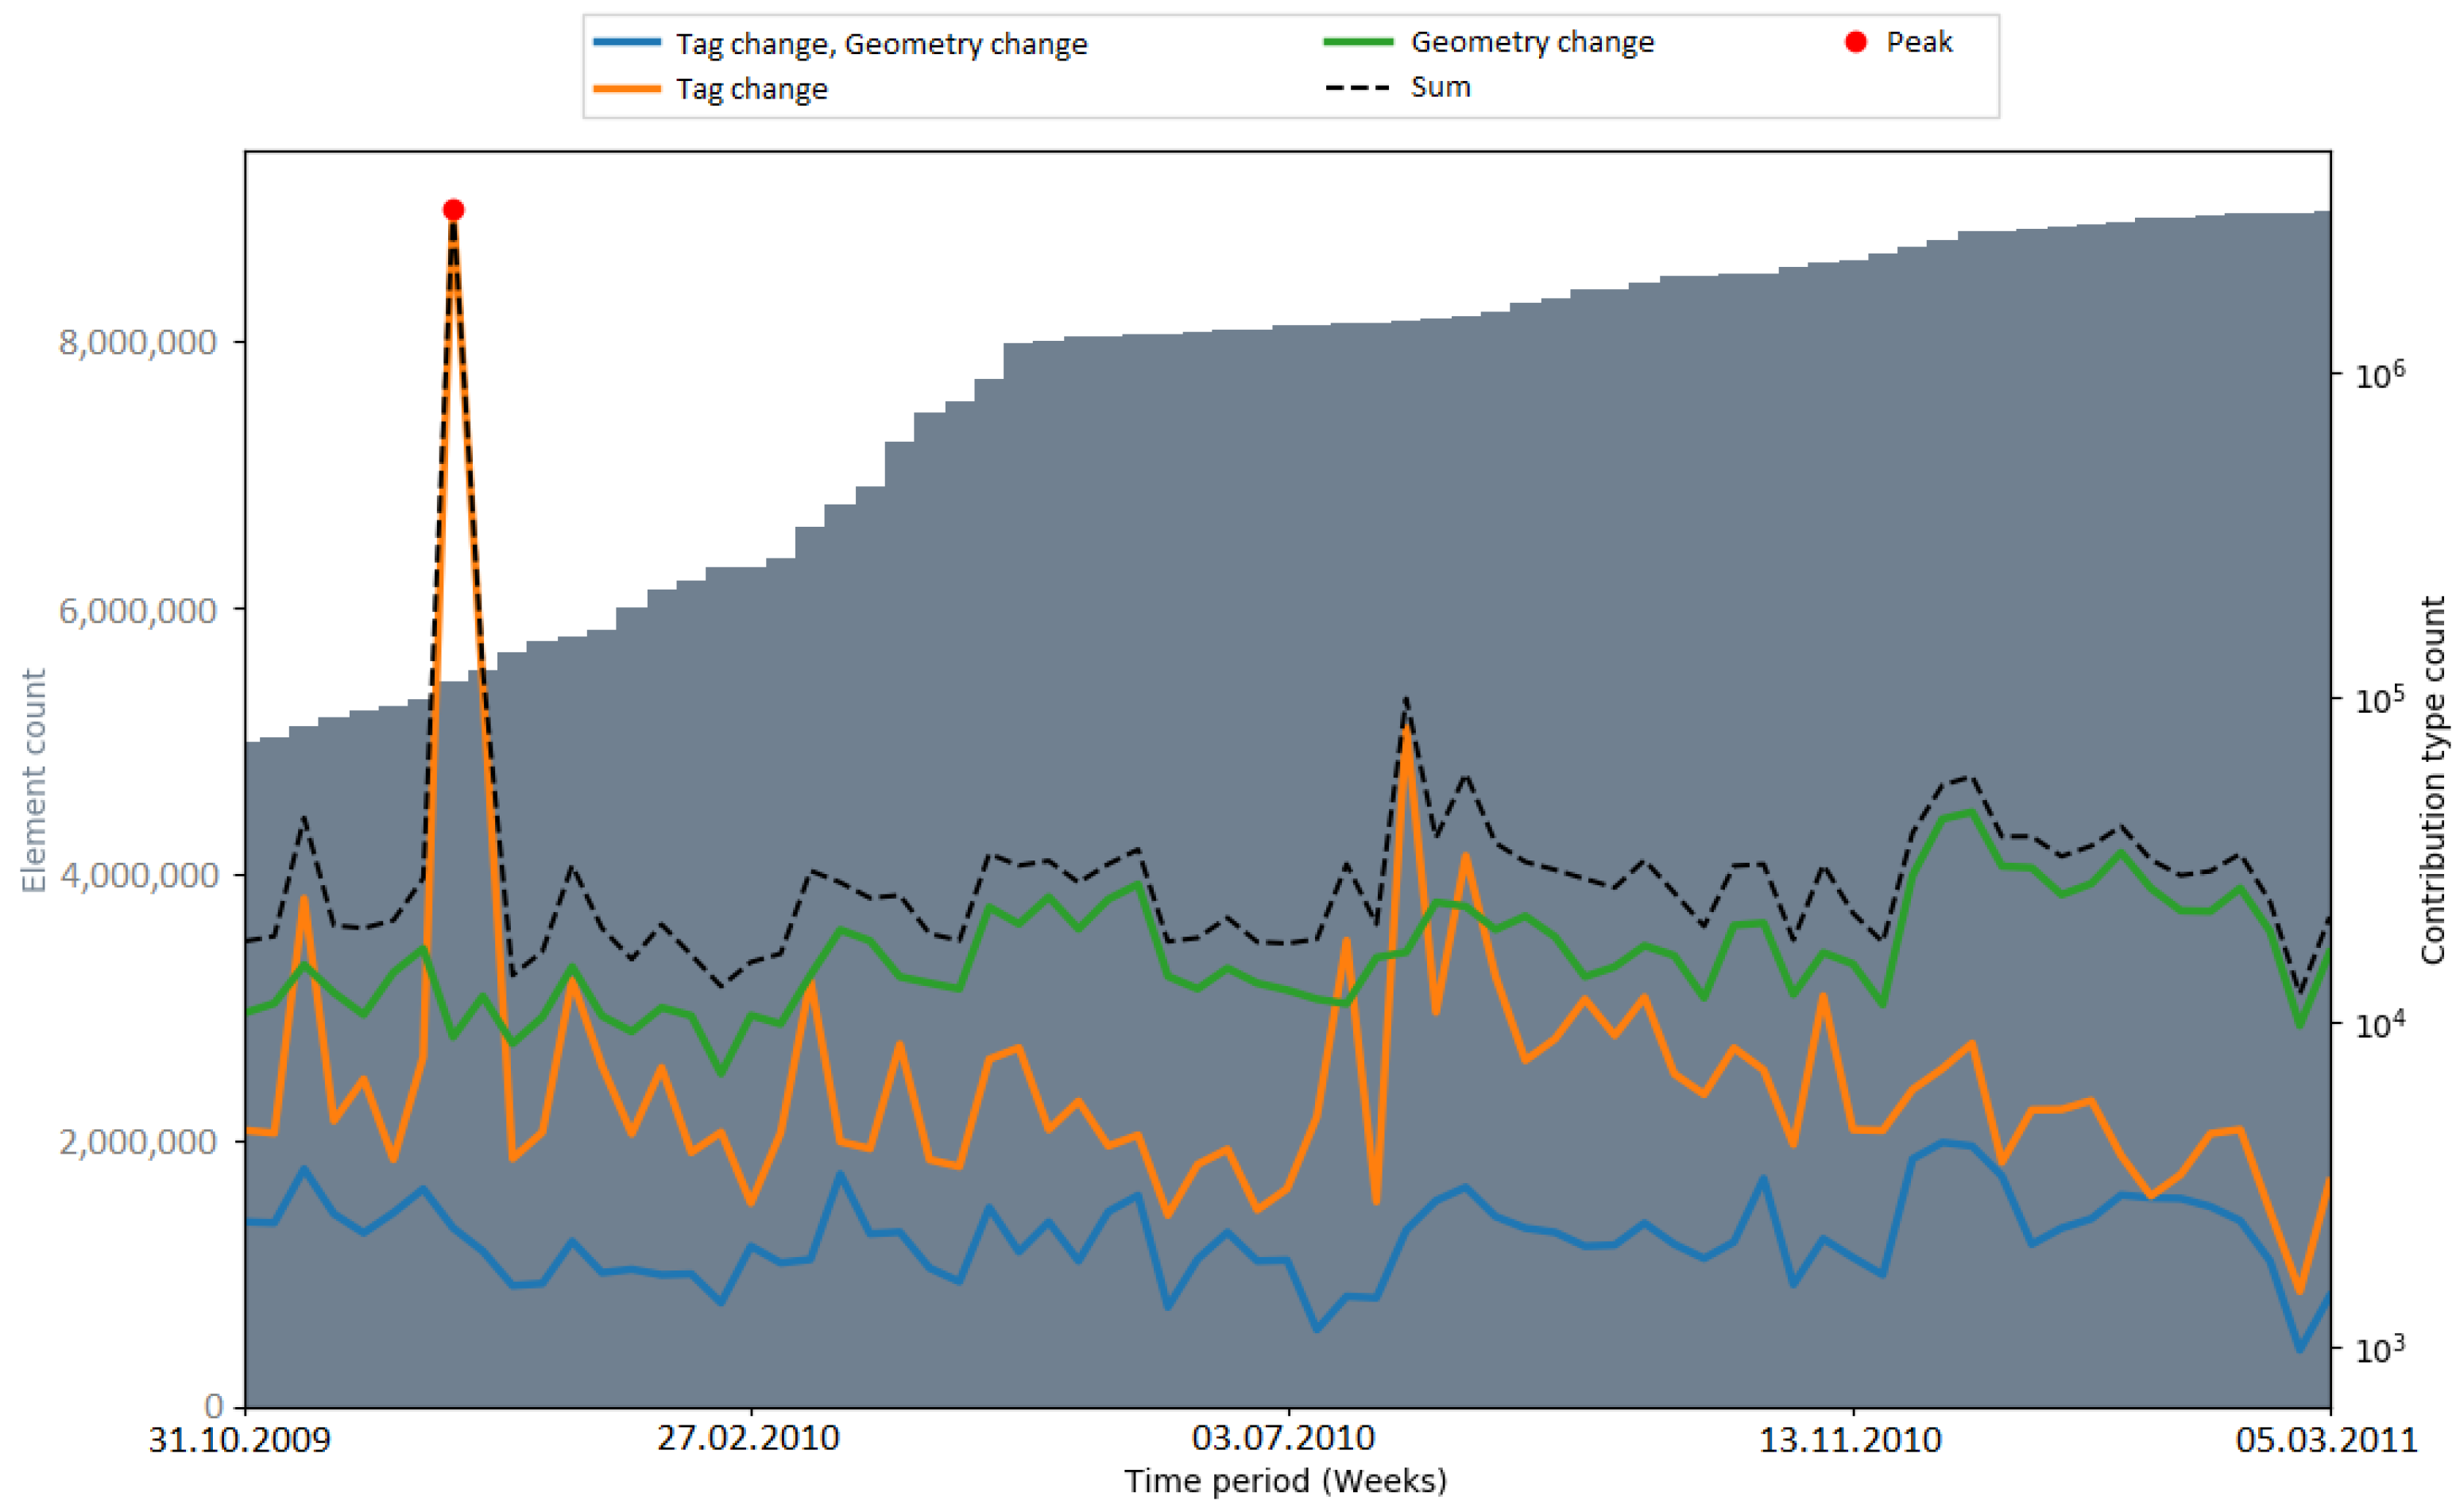
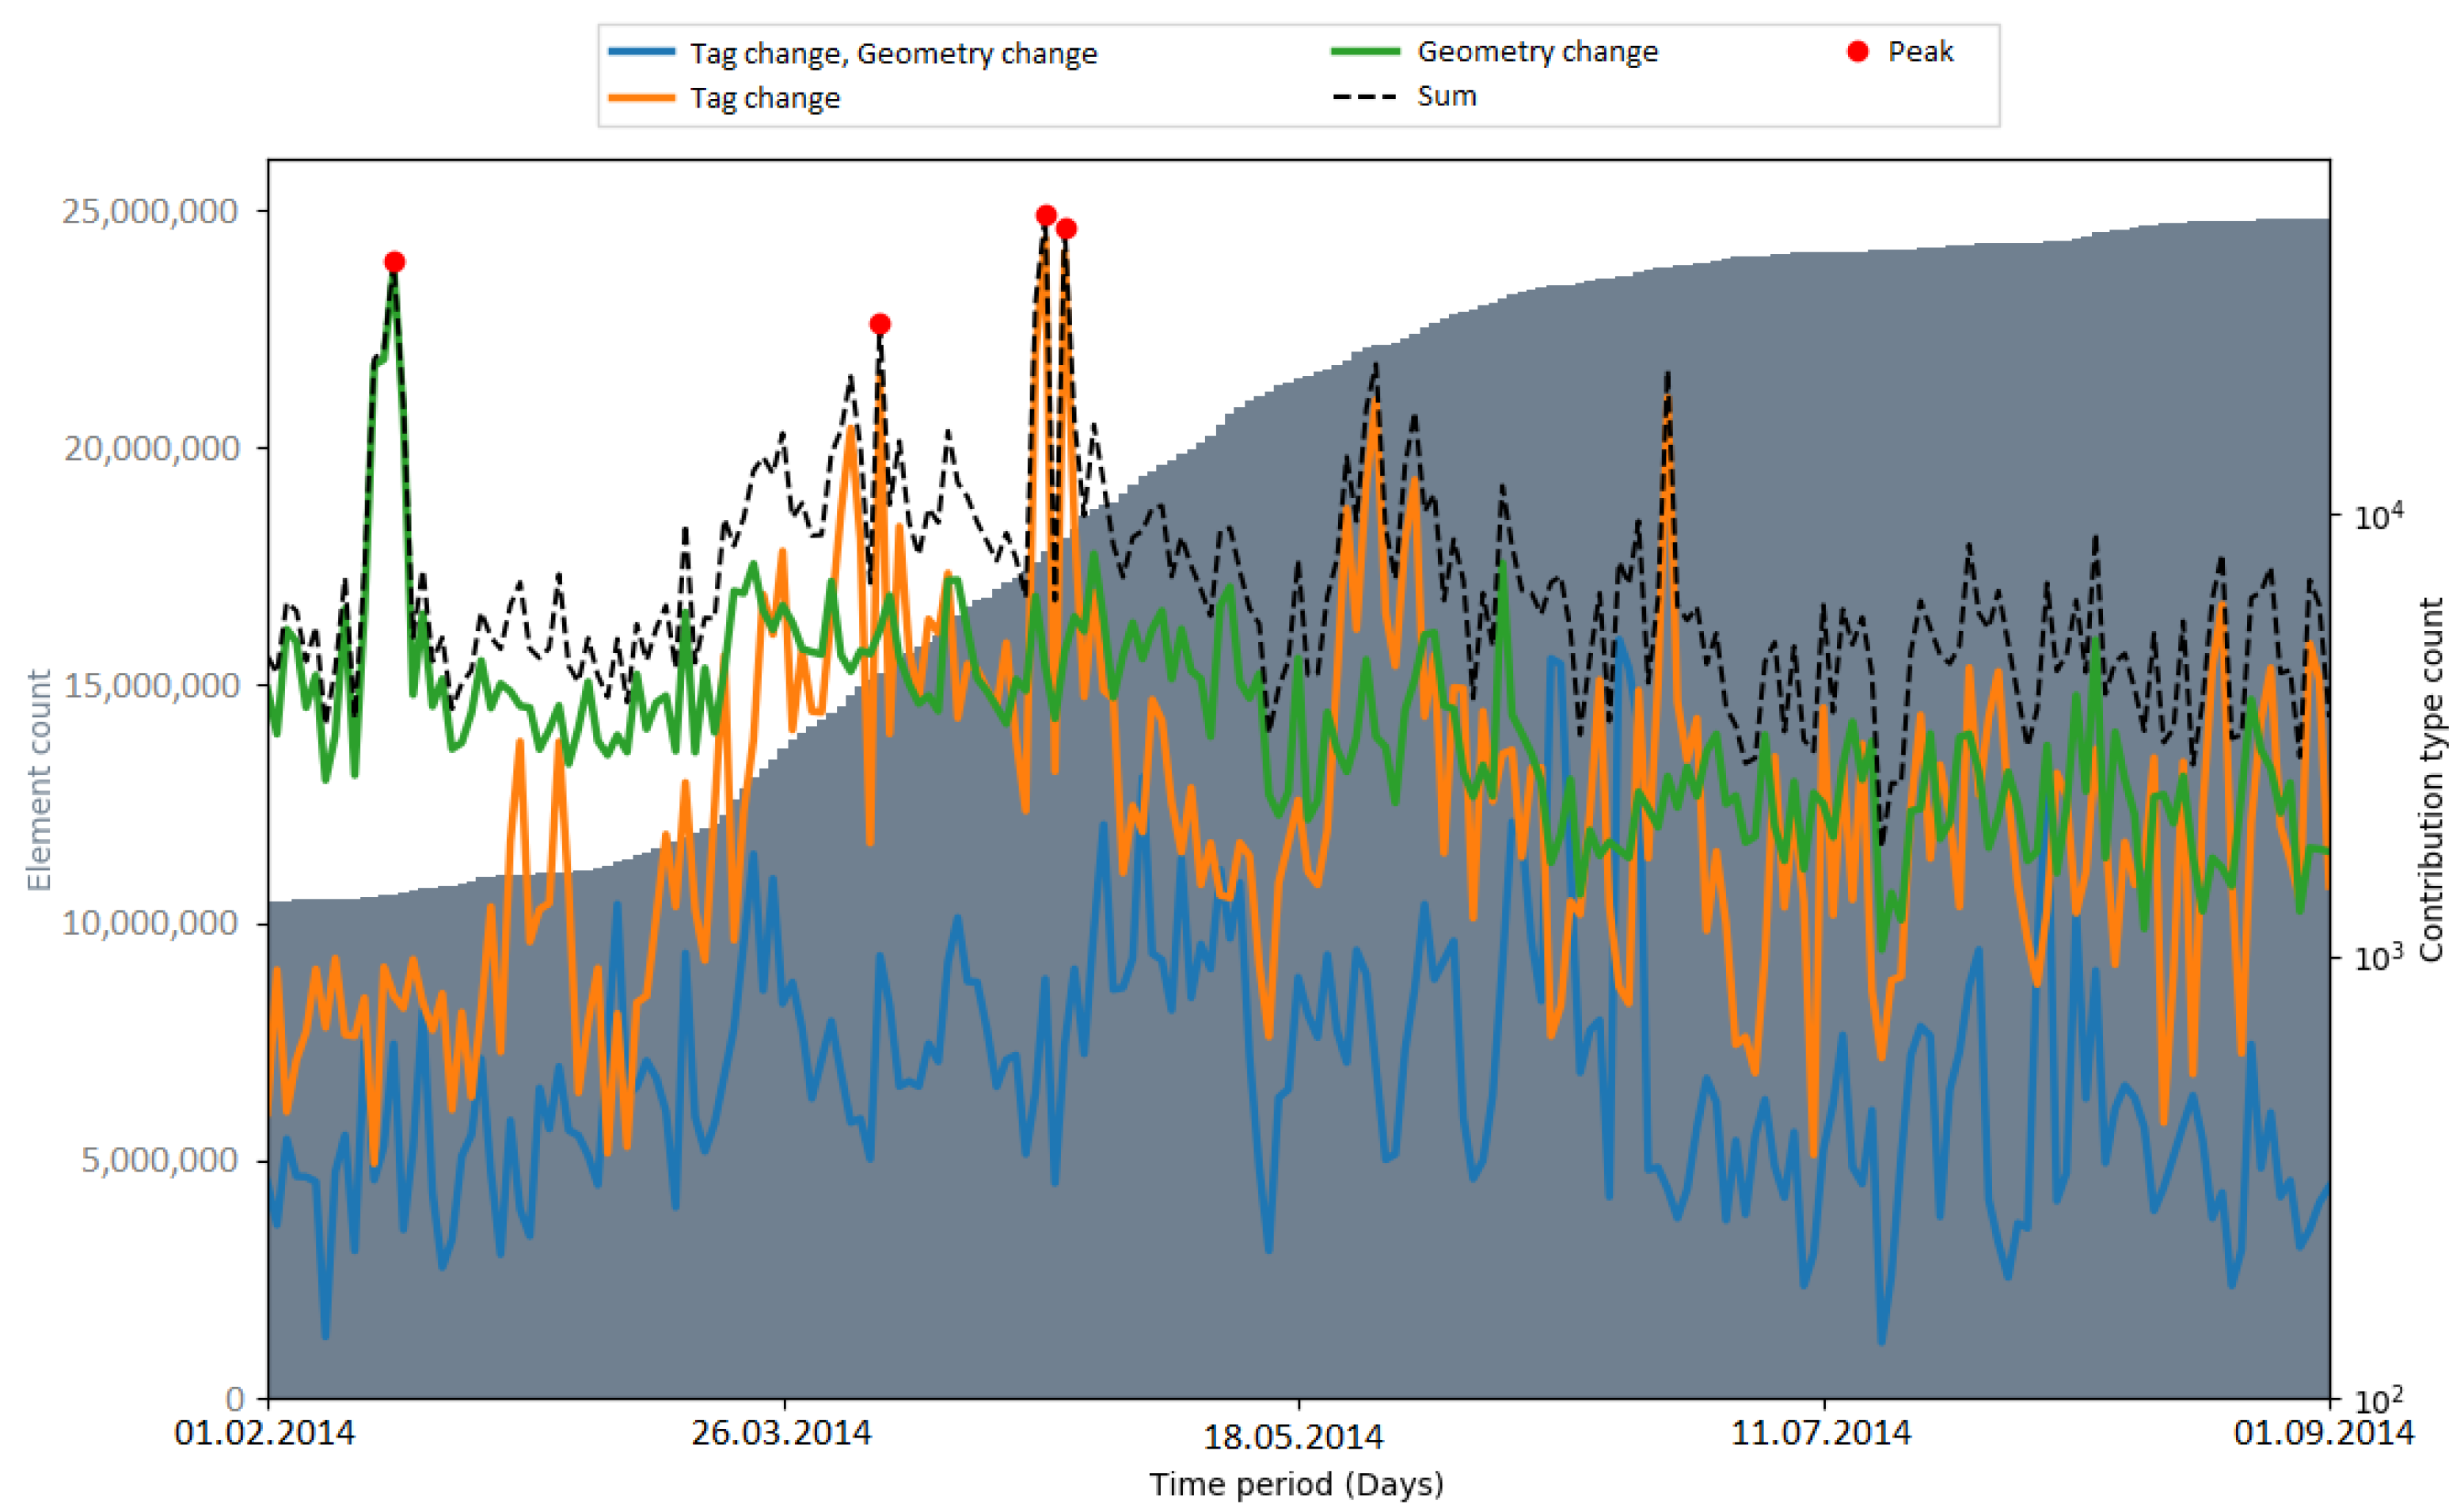
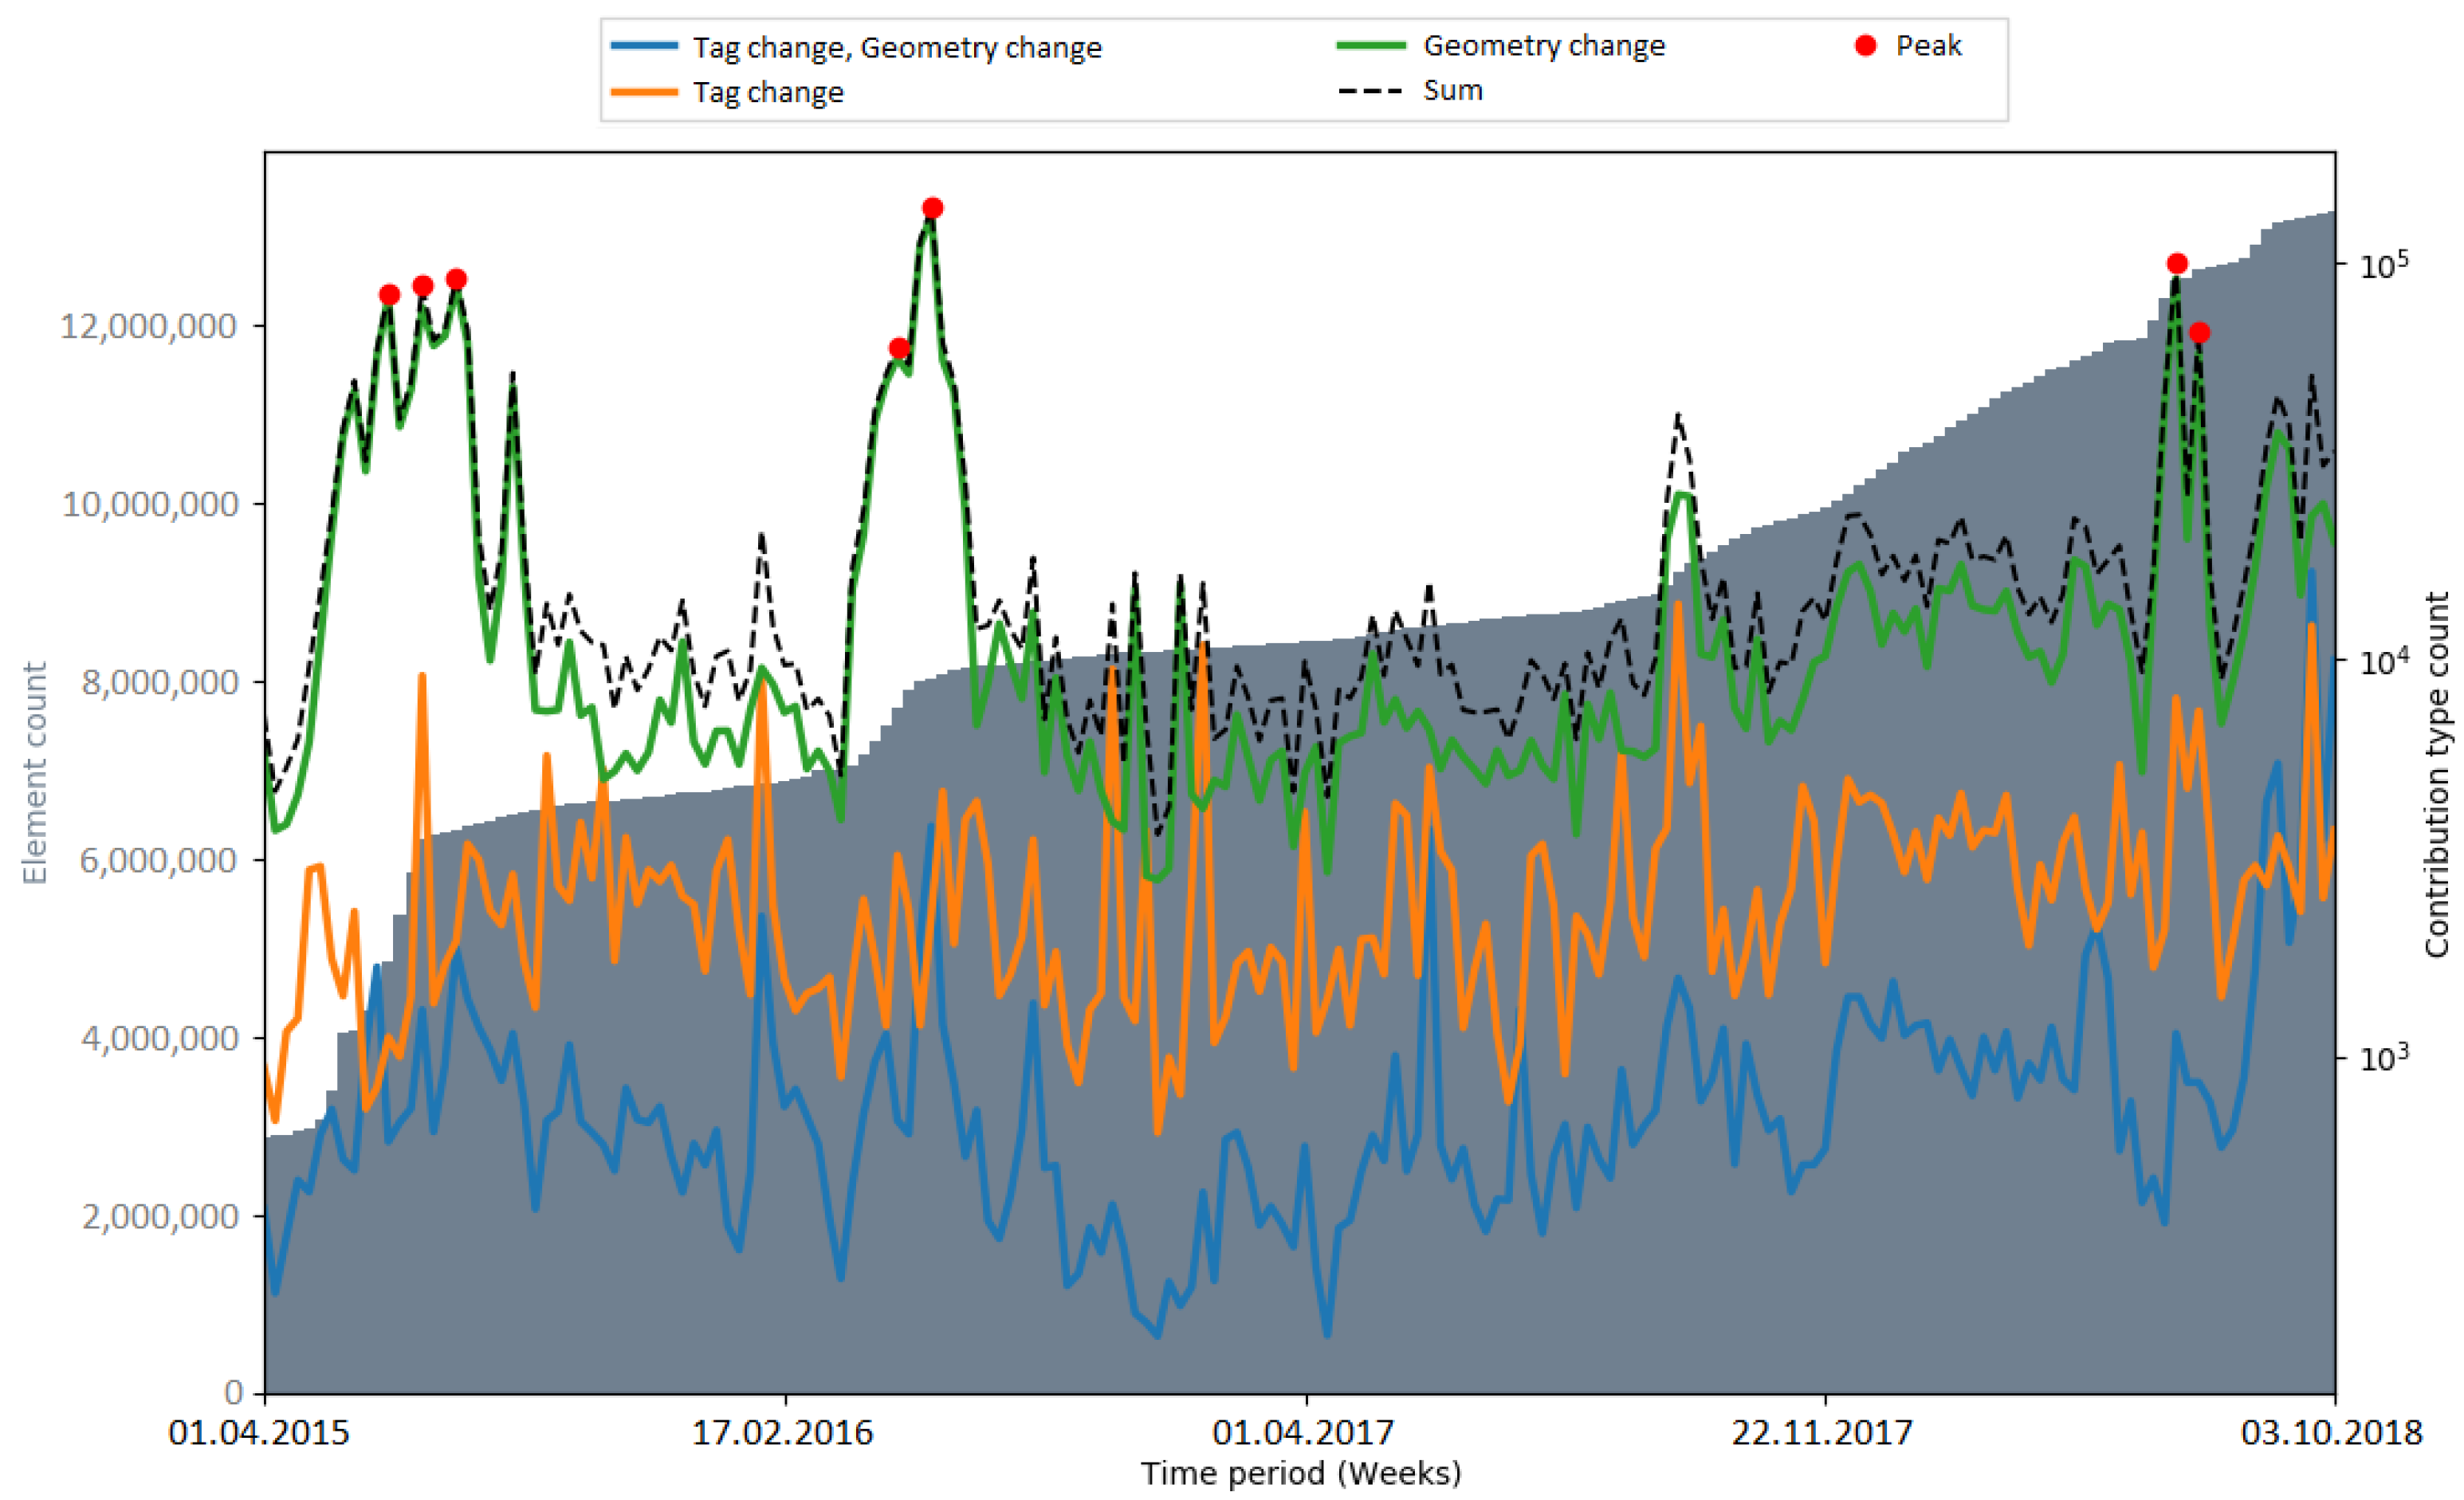
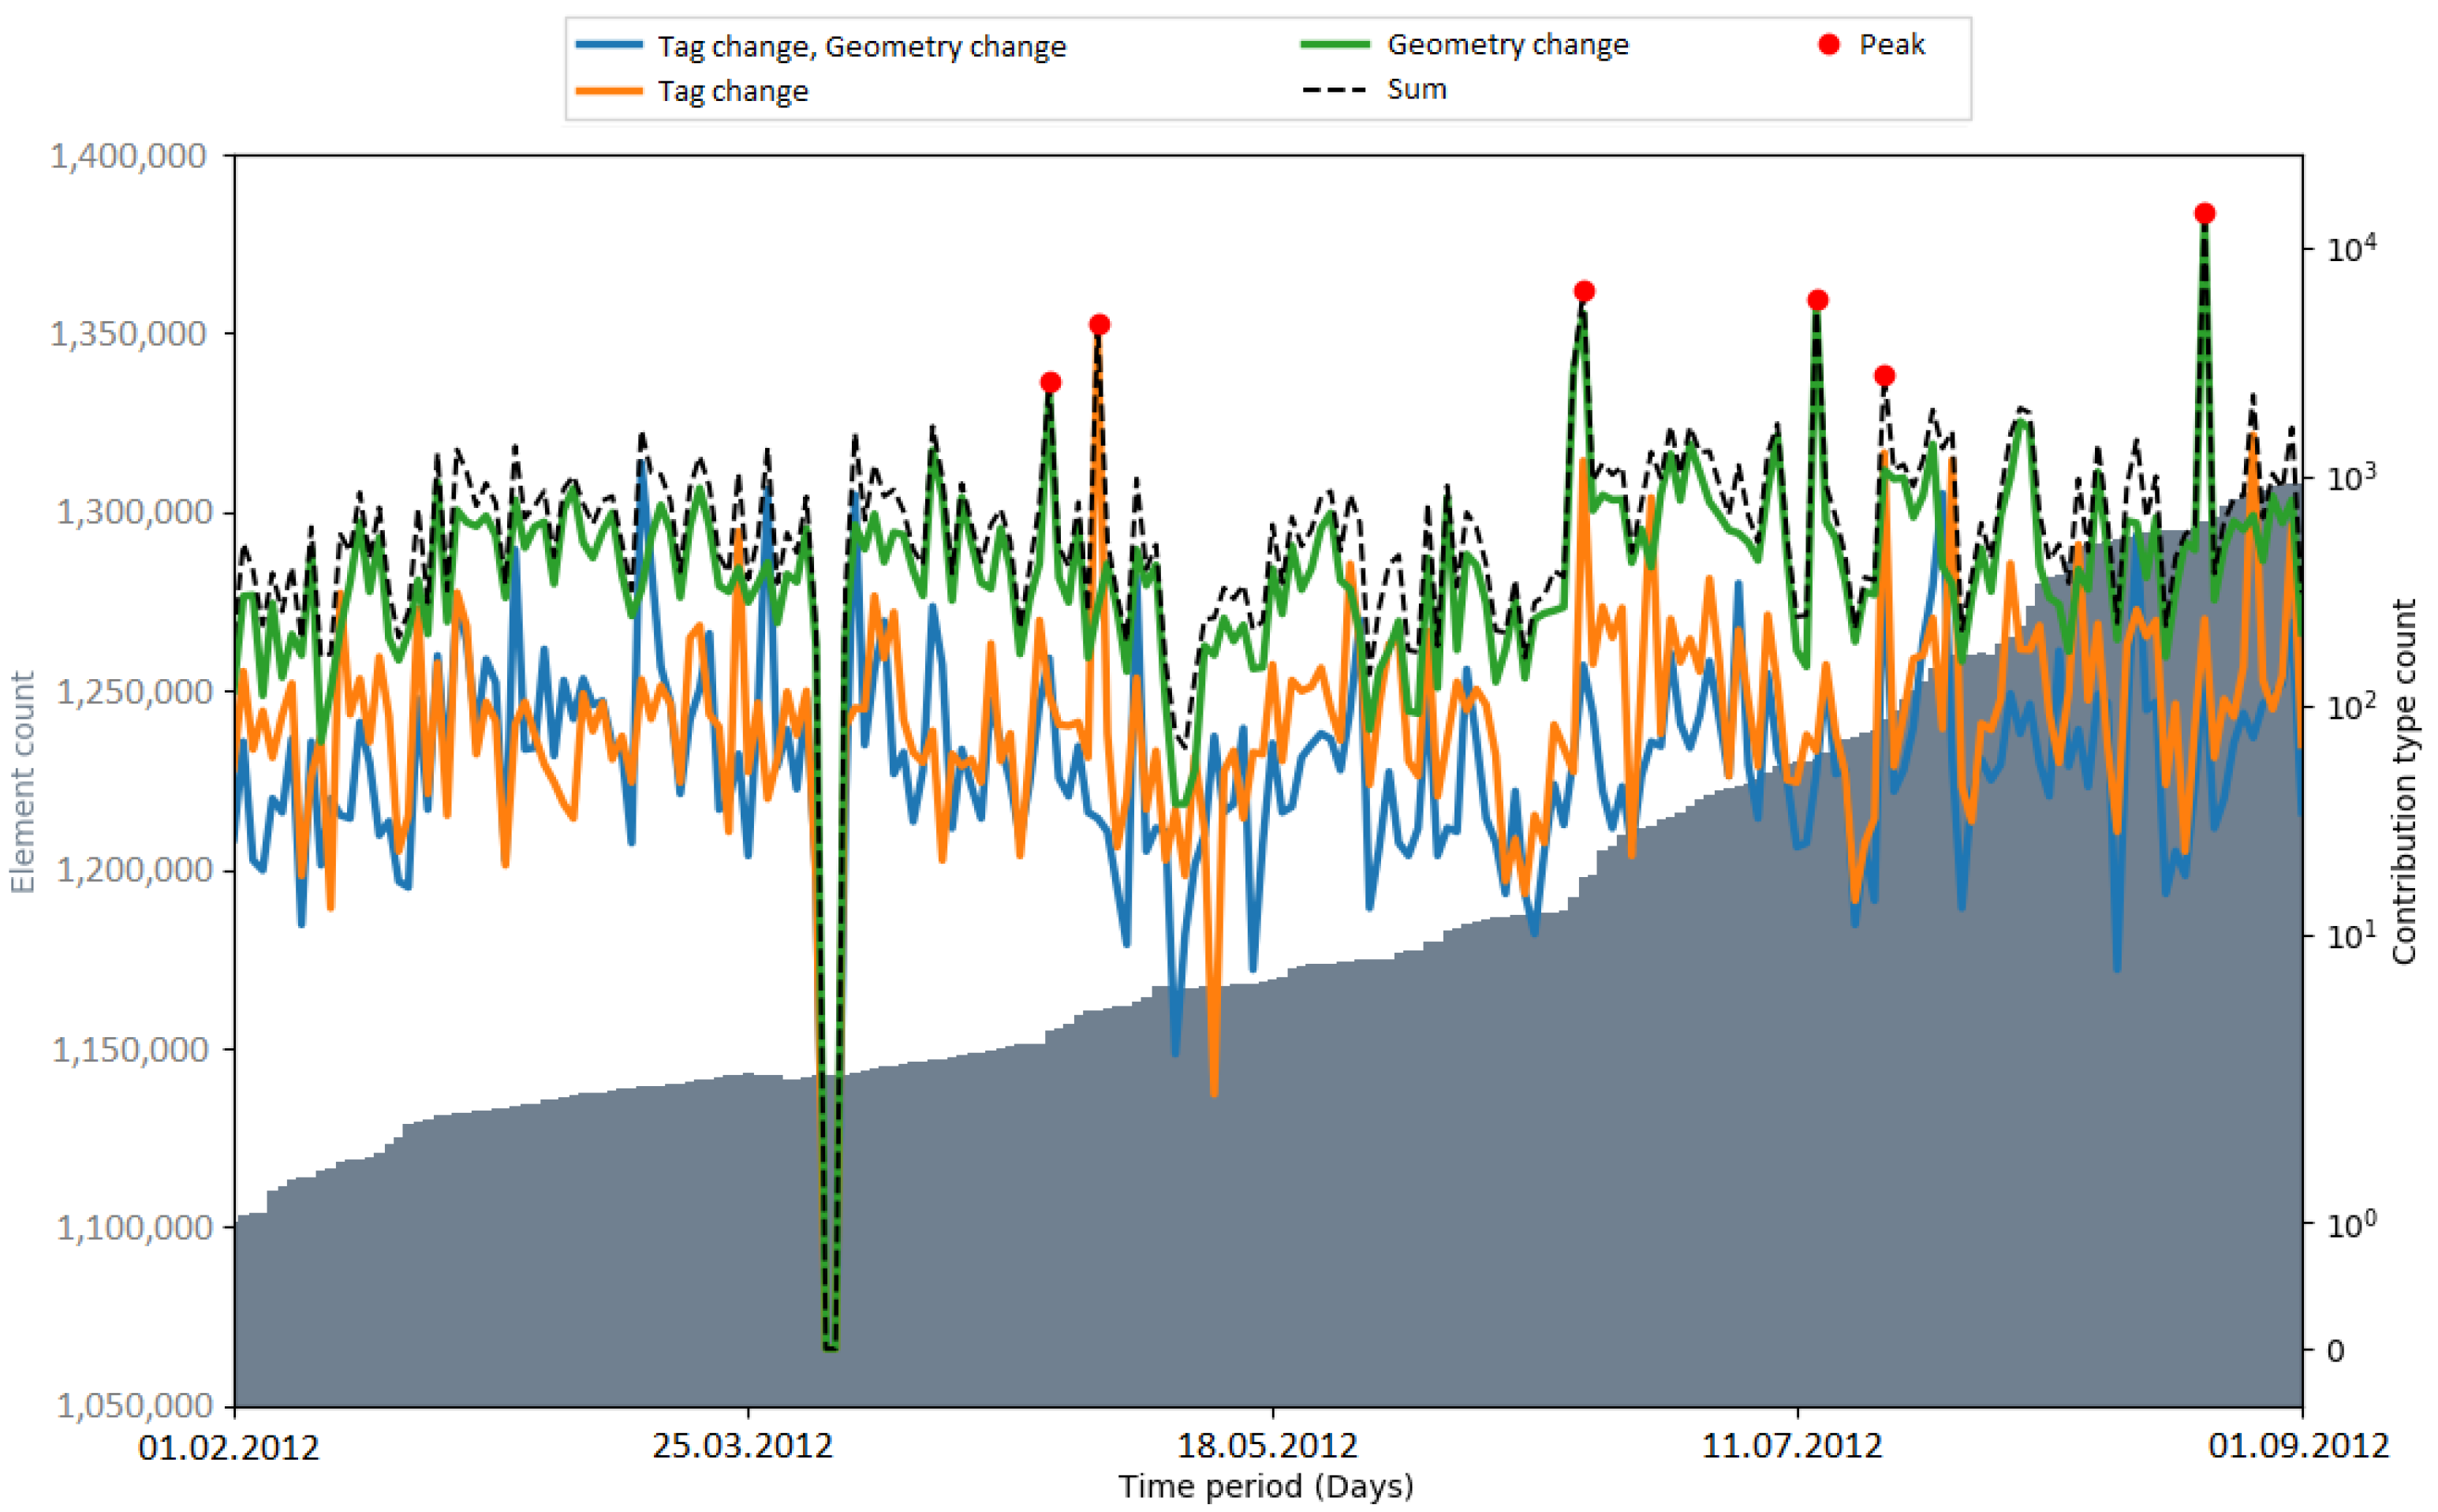
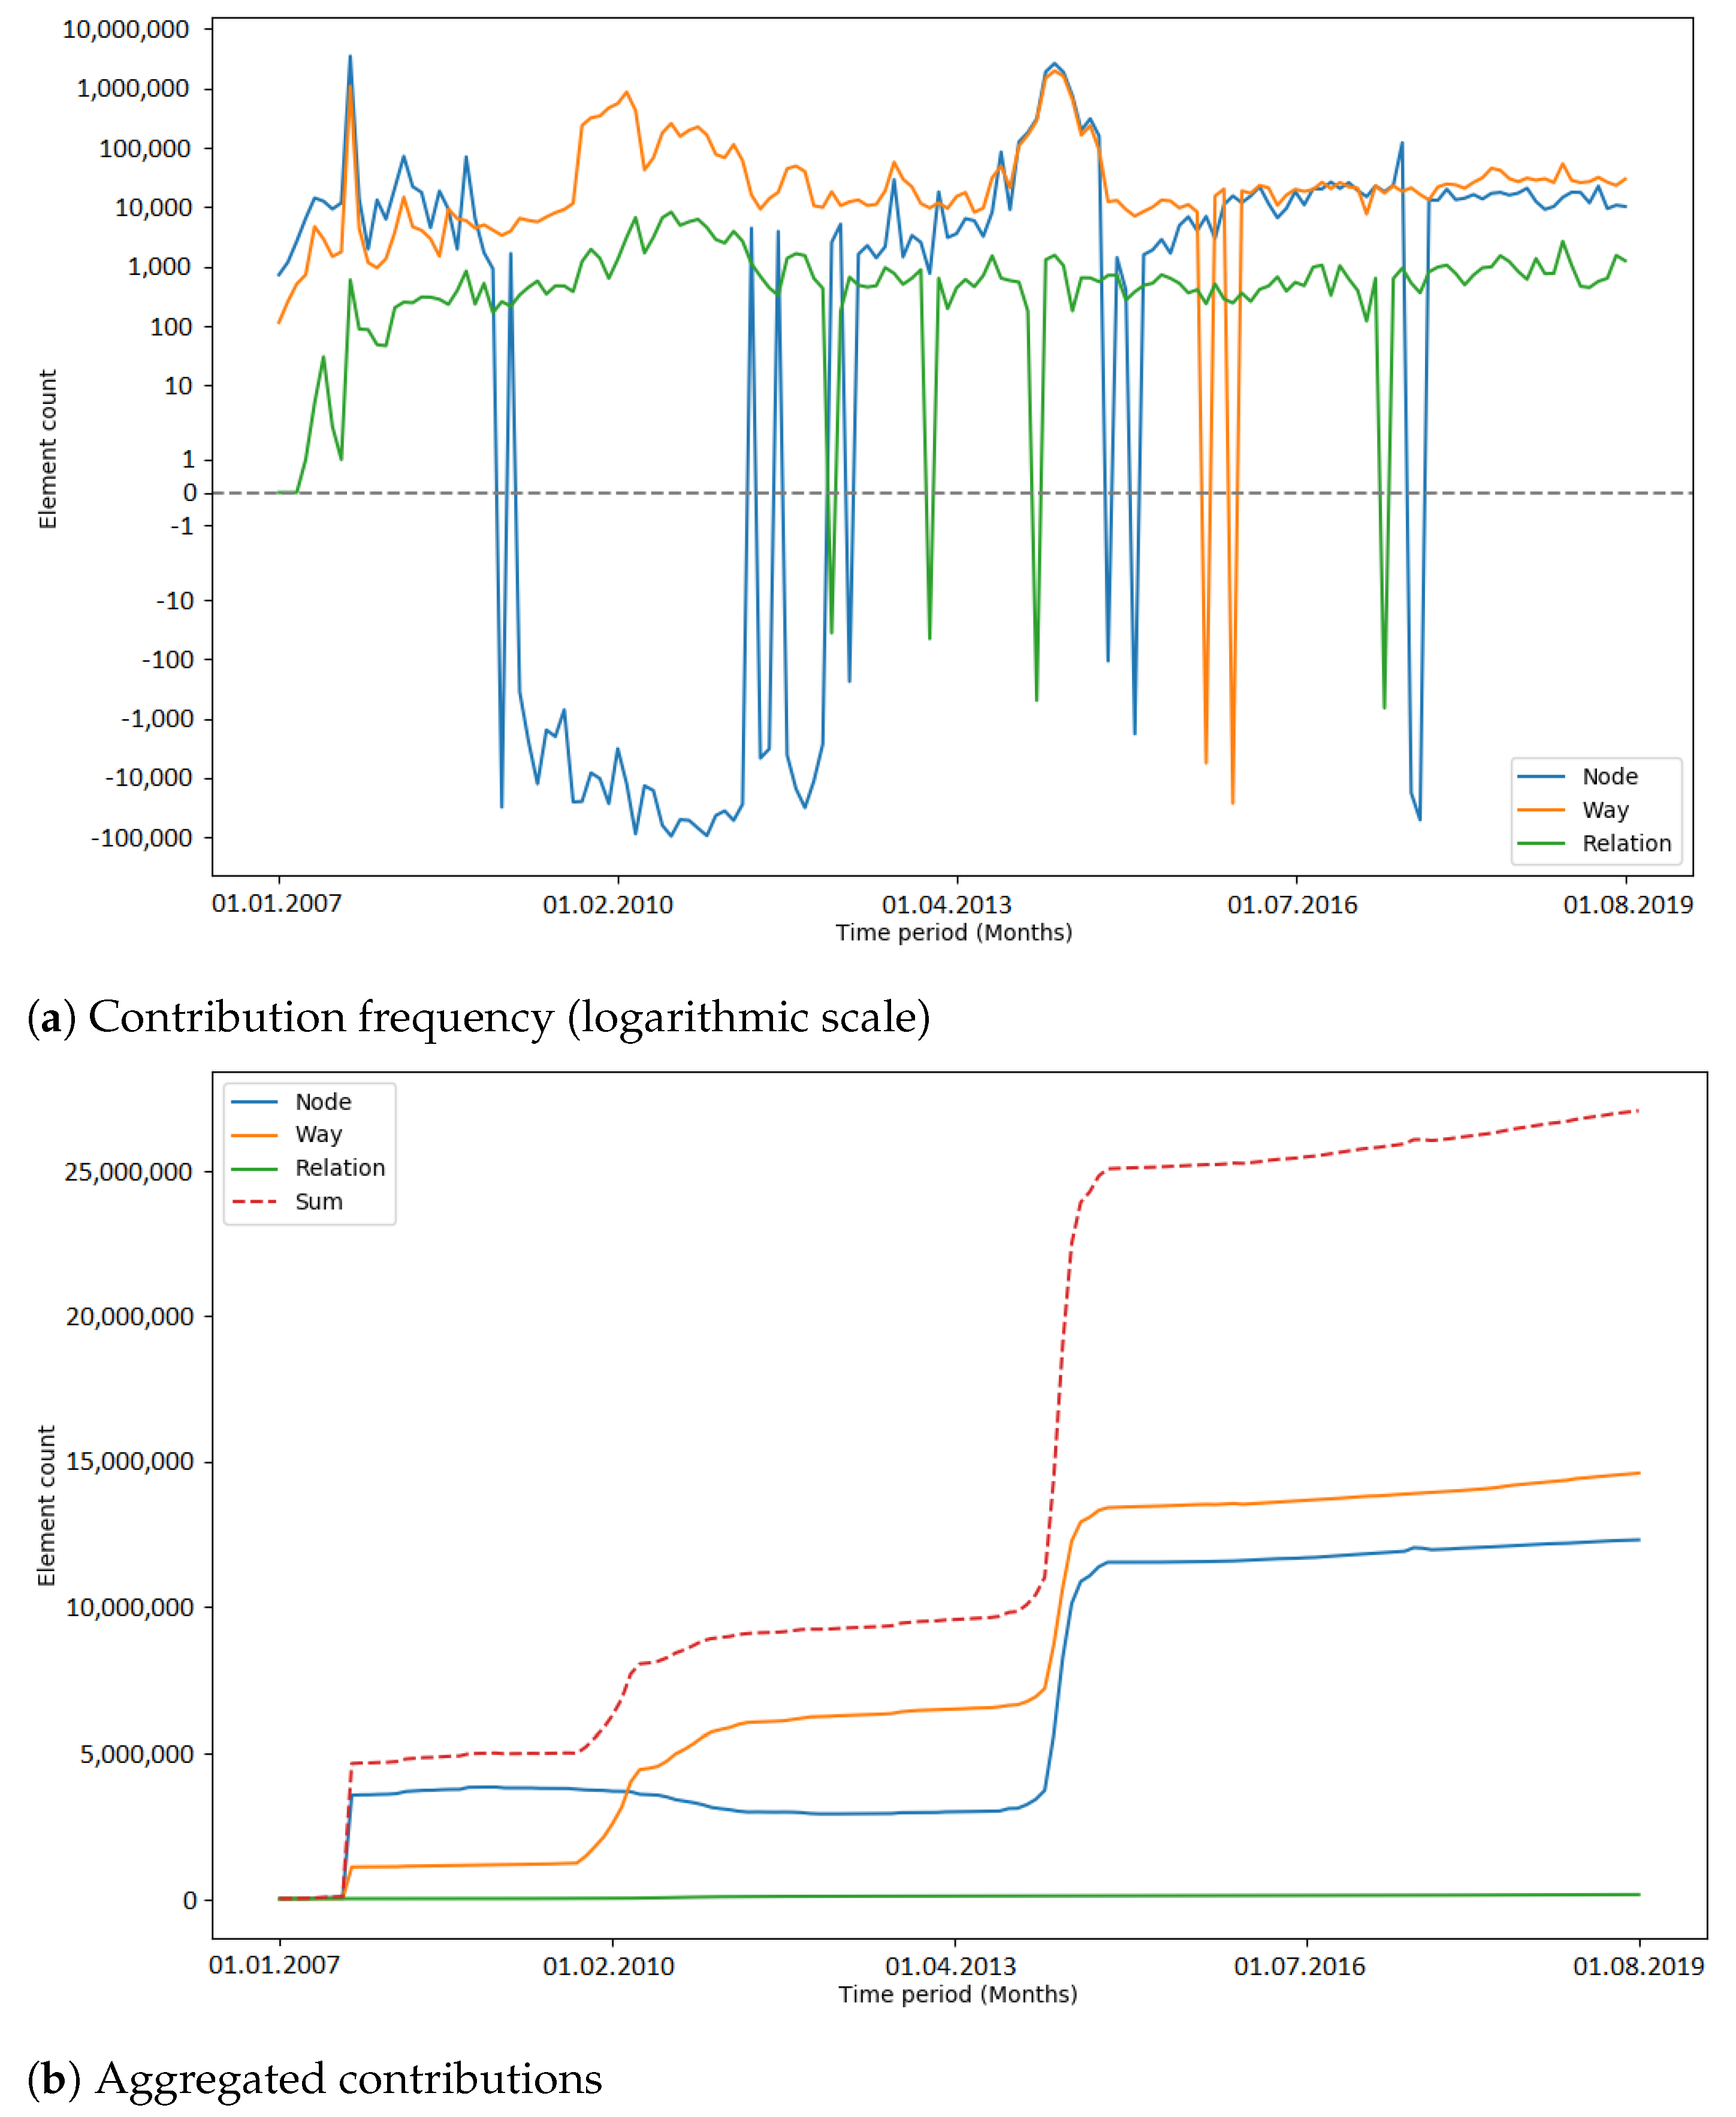
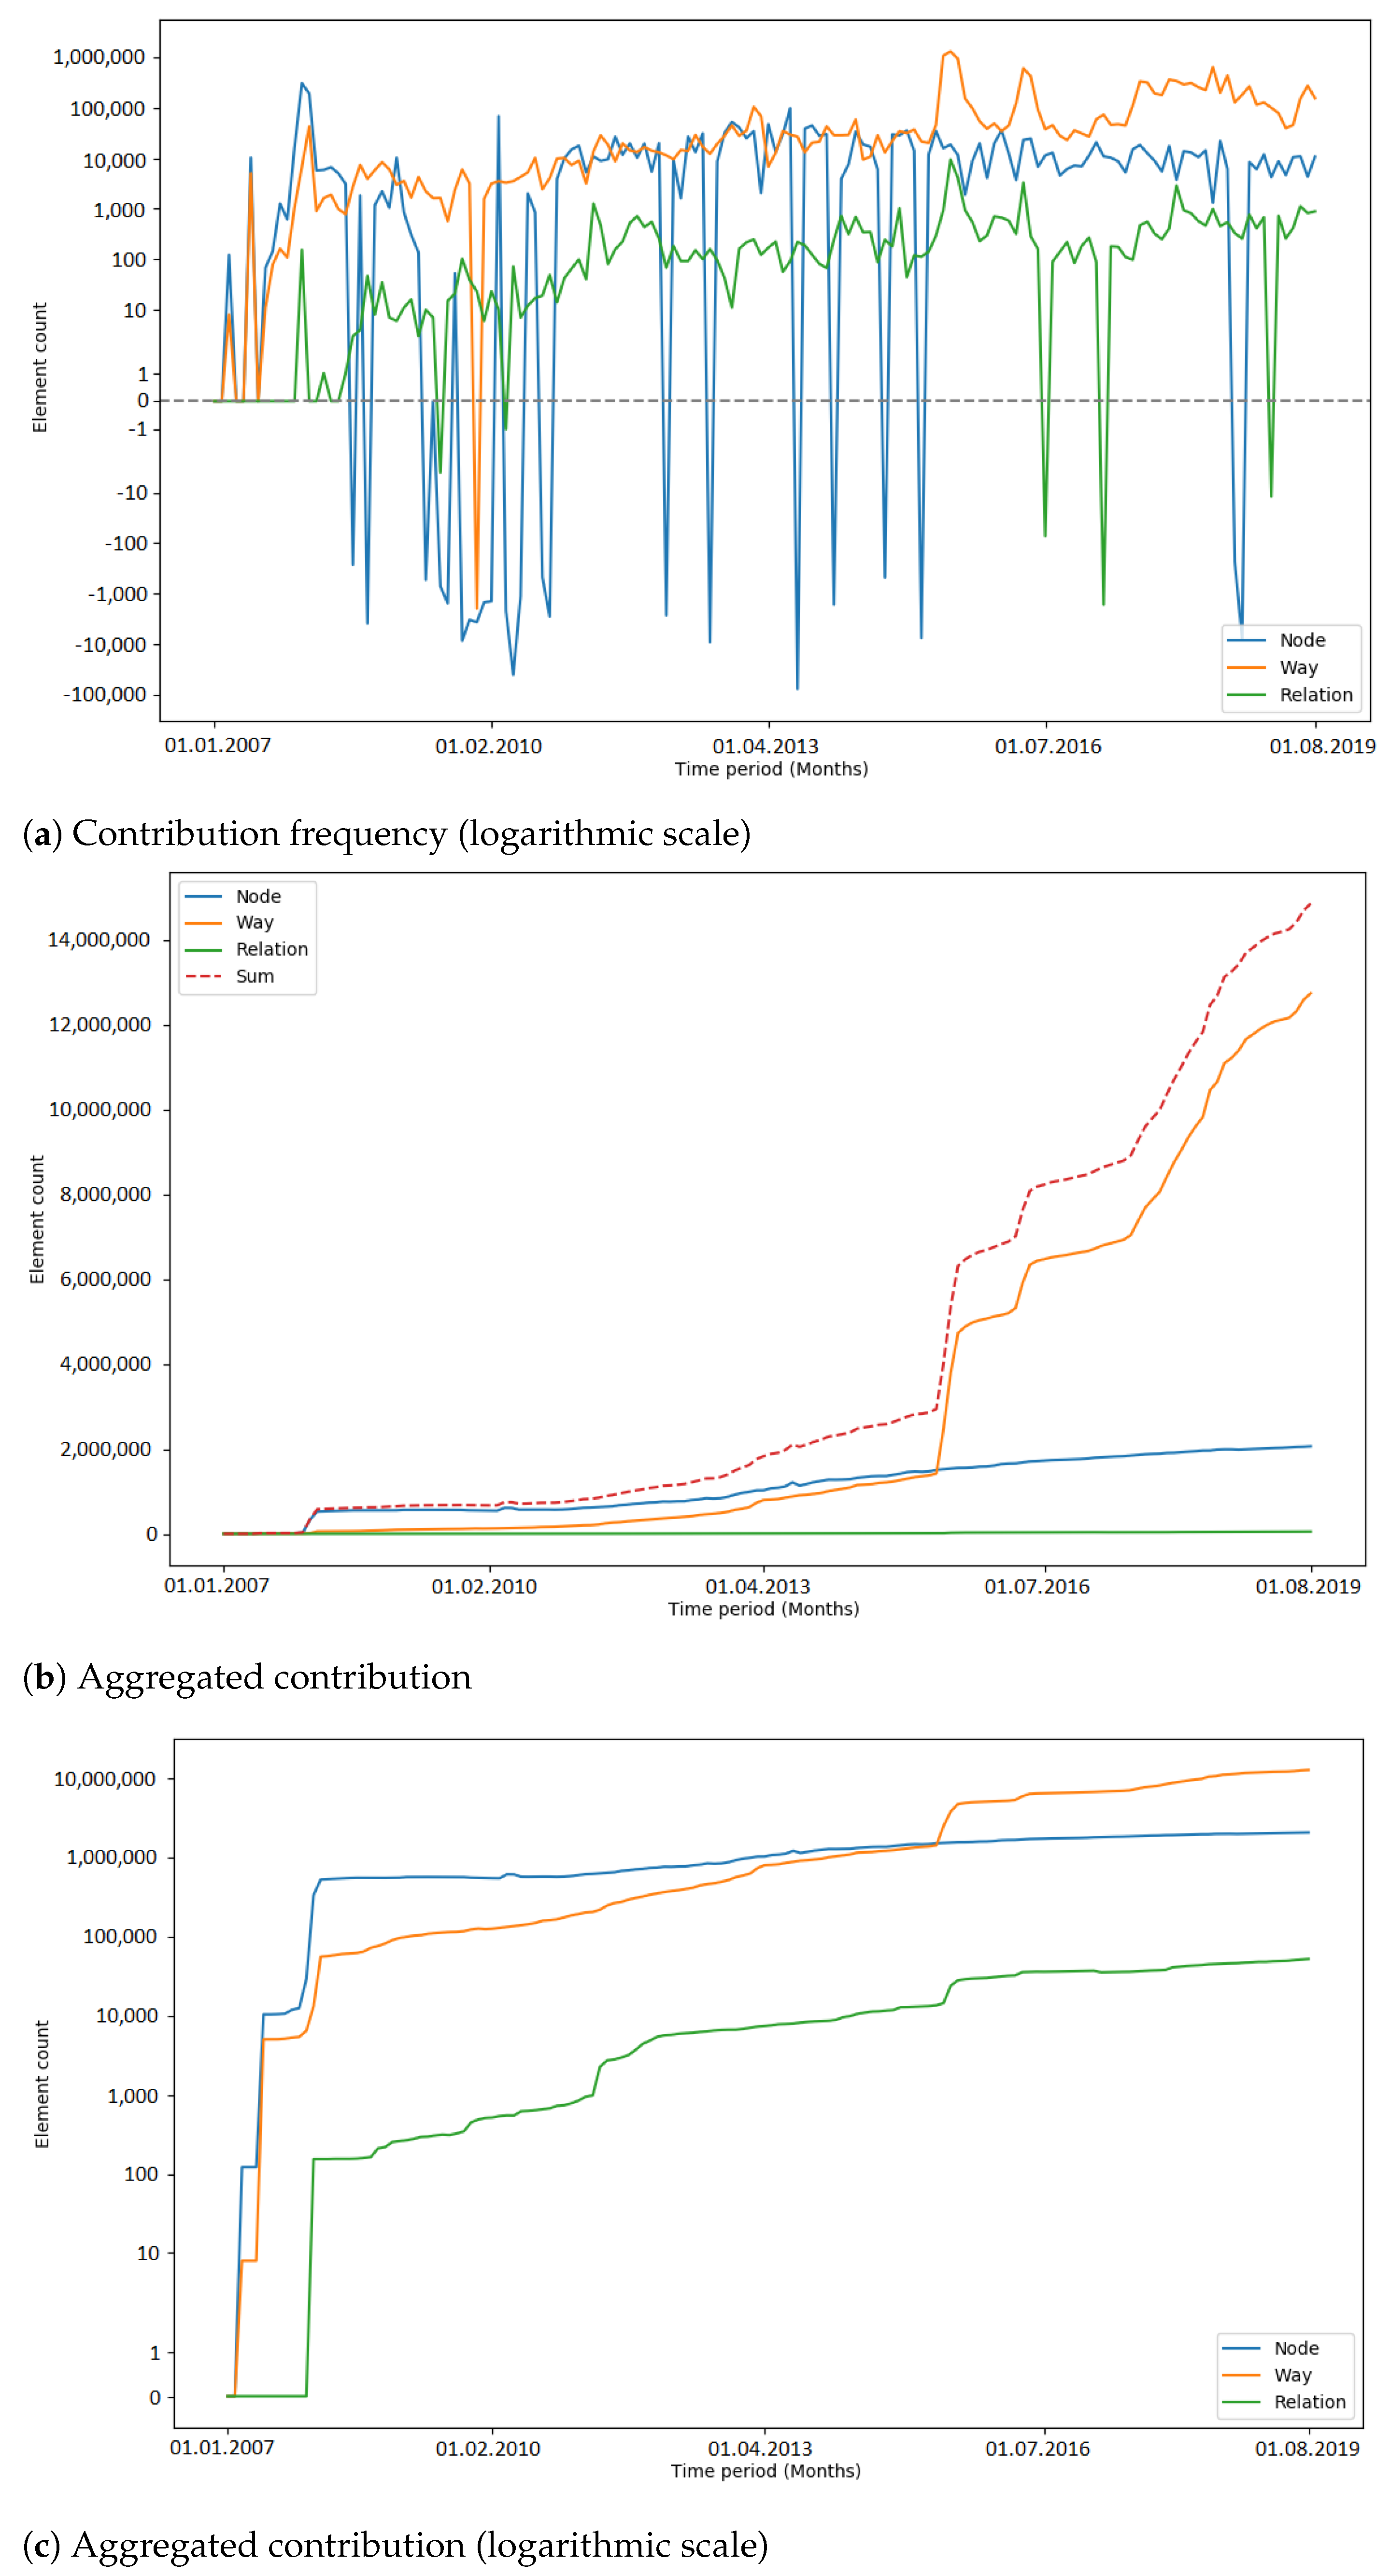
Peaks in the number of contribution types were used as an indicator for automated processes (i.e., bots or scripts) which update or change OSM data. Hence, the number of peaks that occurred during an import gives a metric about how OSM data were subsequently changed. In Figure 9, the number of detected peaks within the respective observation periods of the imports is displayed. The amount varied among the different imports. When comparing the time periods without an import, the number of peaks differs by a considerable margin (two peaks in the Netherlands, six peaks in India). The gap between the total numbers of peaks (11 in the Netherlands, 19 (18) in India) could be explained with the differences in the state of the map and the communities of both countries. Generally, it is more likely that mass changes via bots happen in India because of the lack of local communities which maintain and update the data.
It could be seen that peaks in the number of contribution types were not necessarily caused by the large data import. After a short investigation of the PGS import, it was found that the peaks were caused by four contributors (by specifying the contributor ID, the web link 
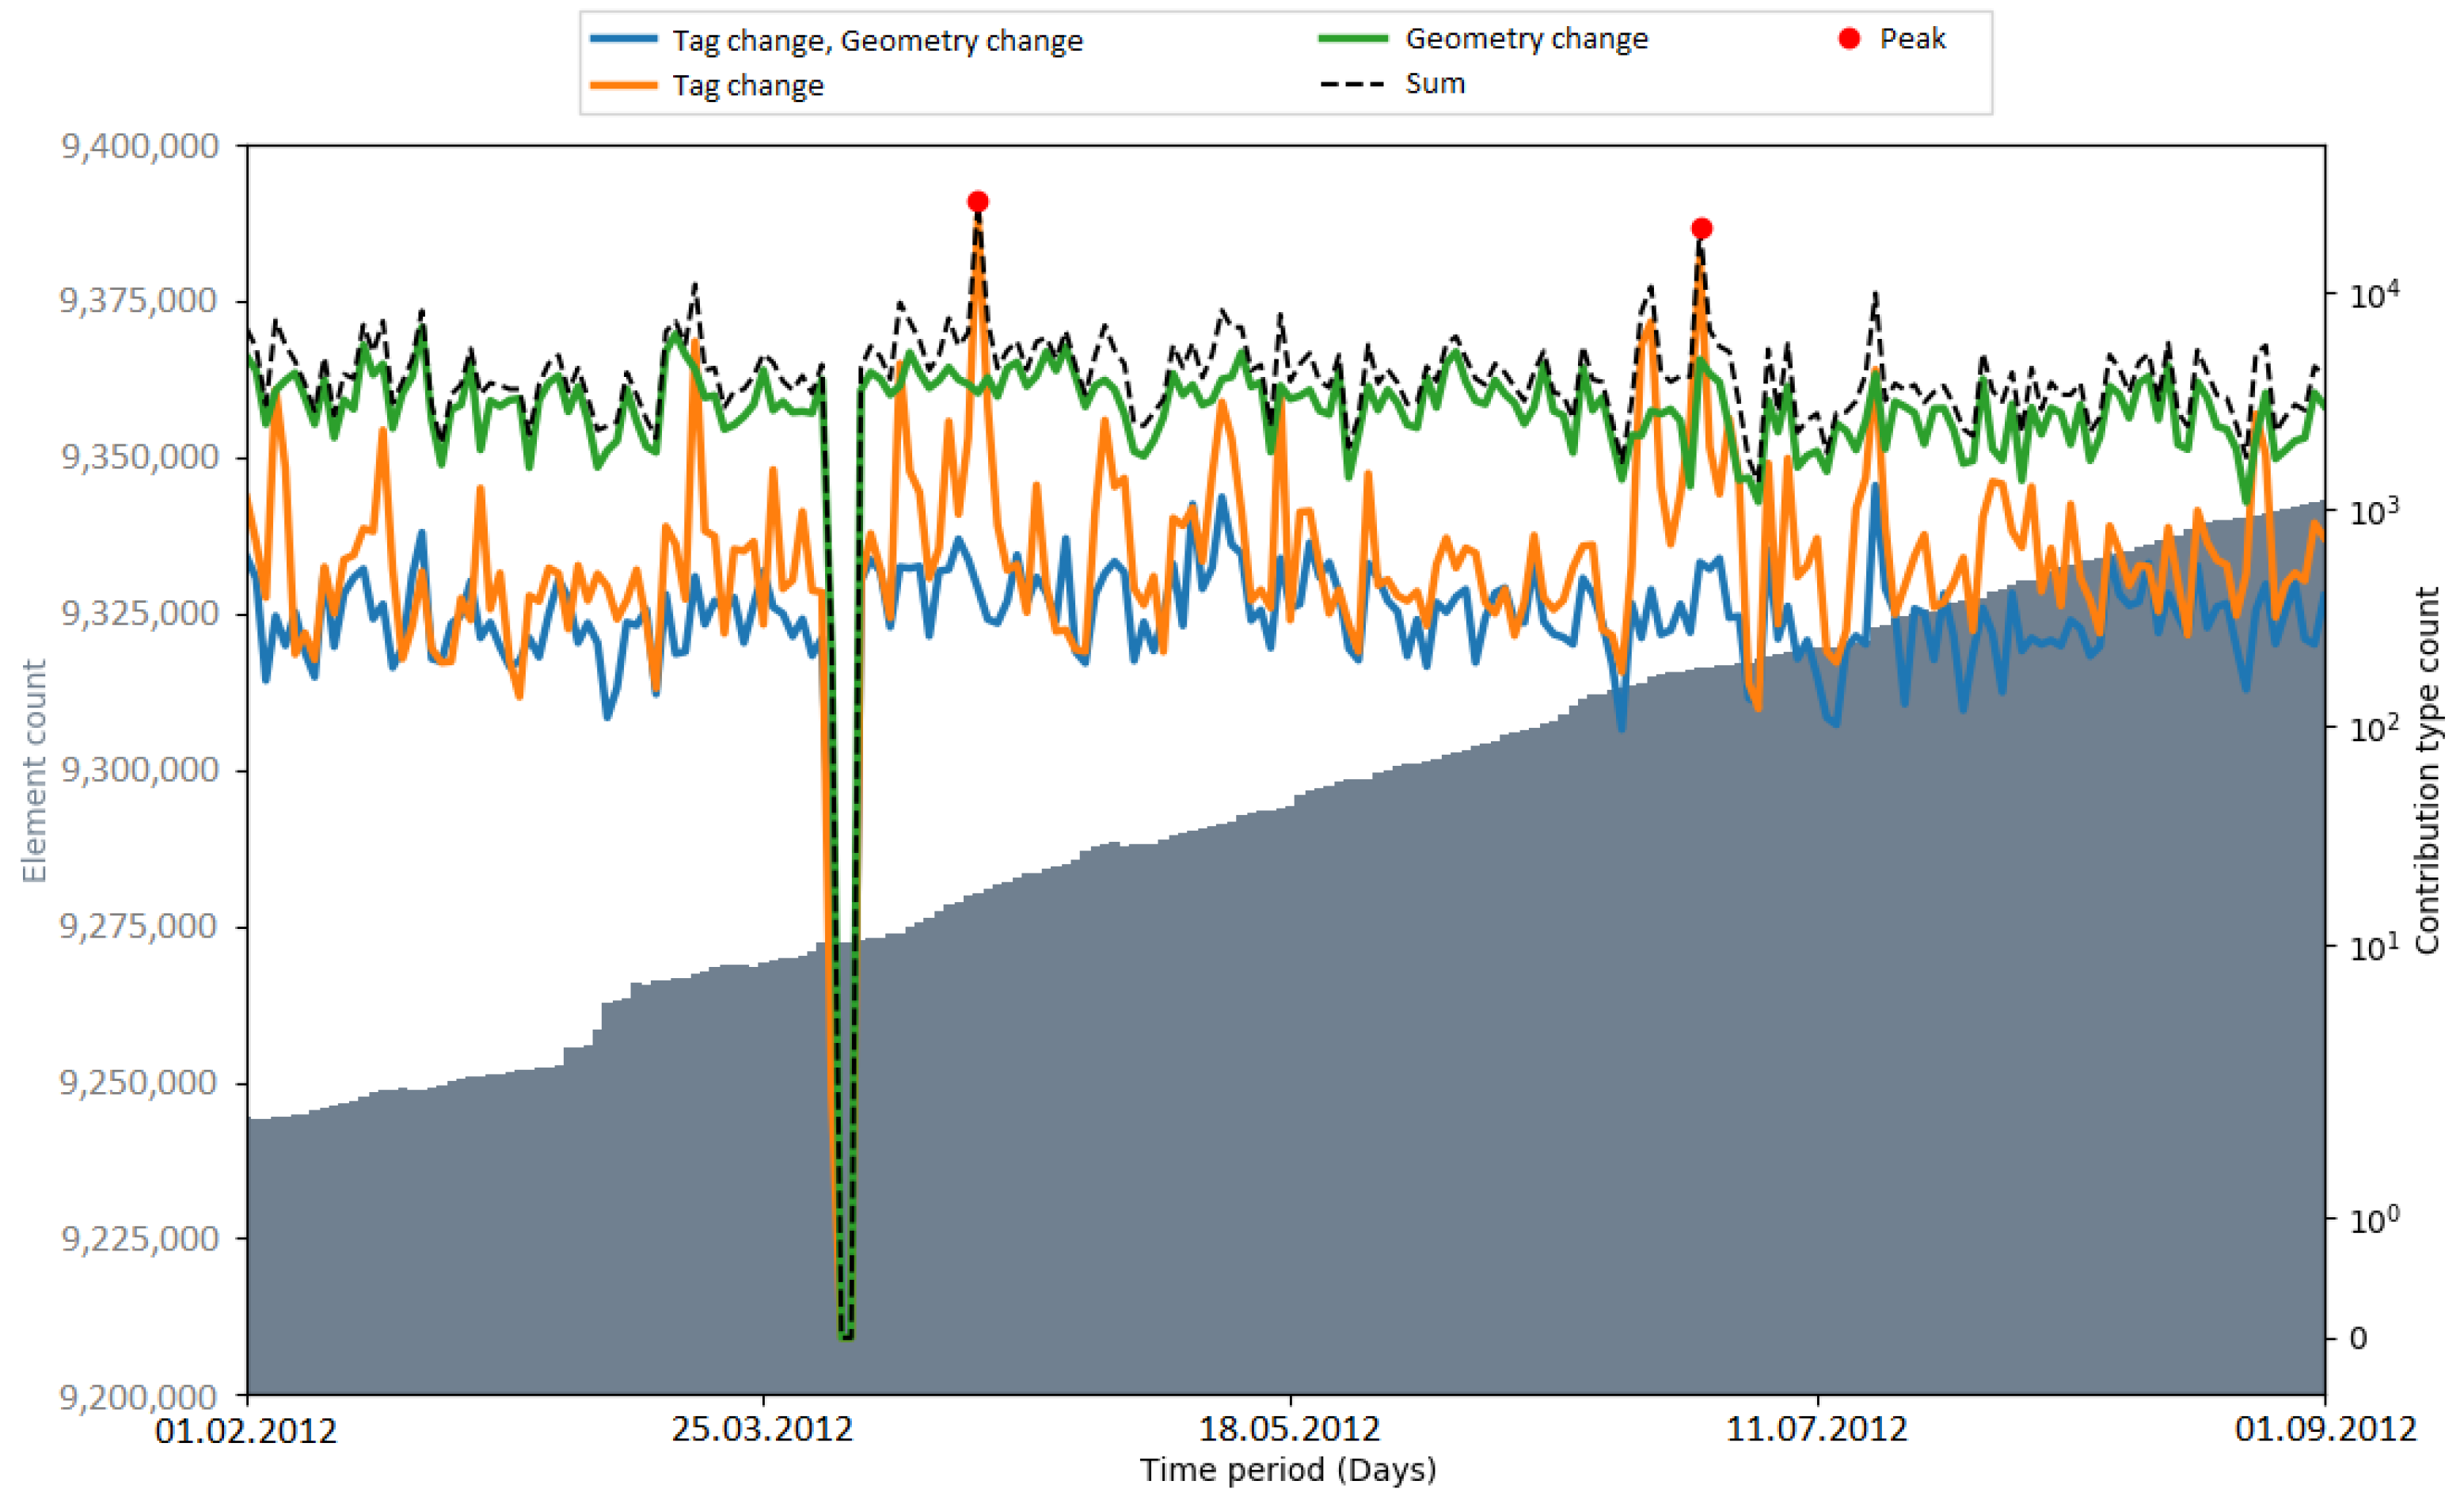
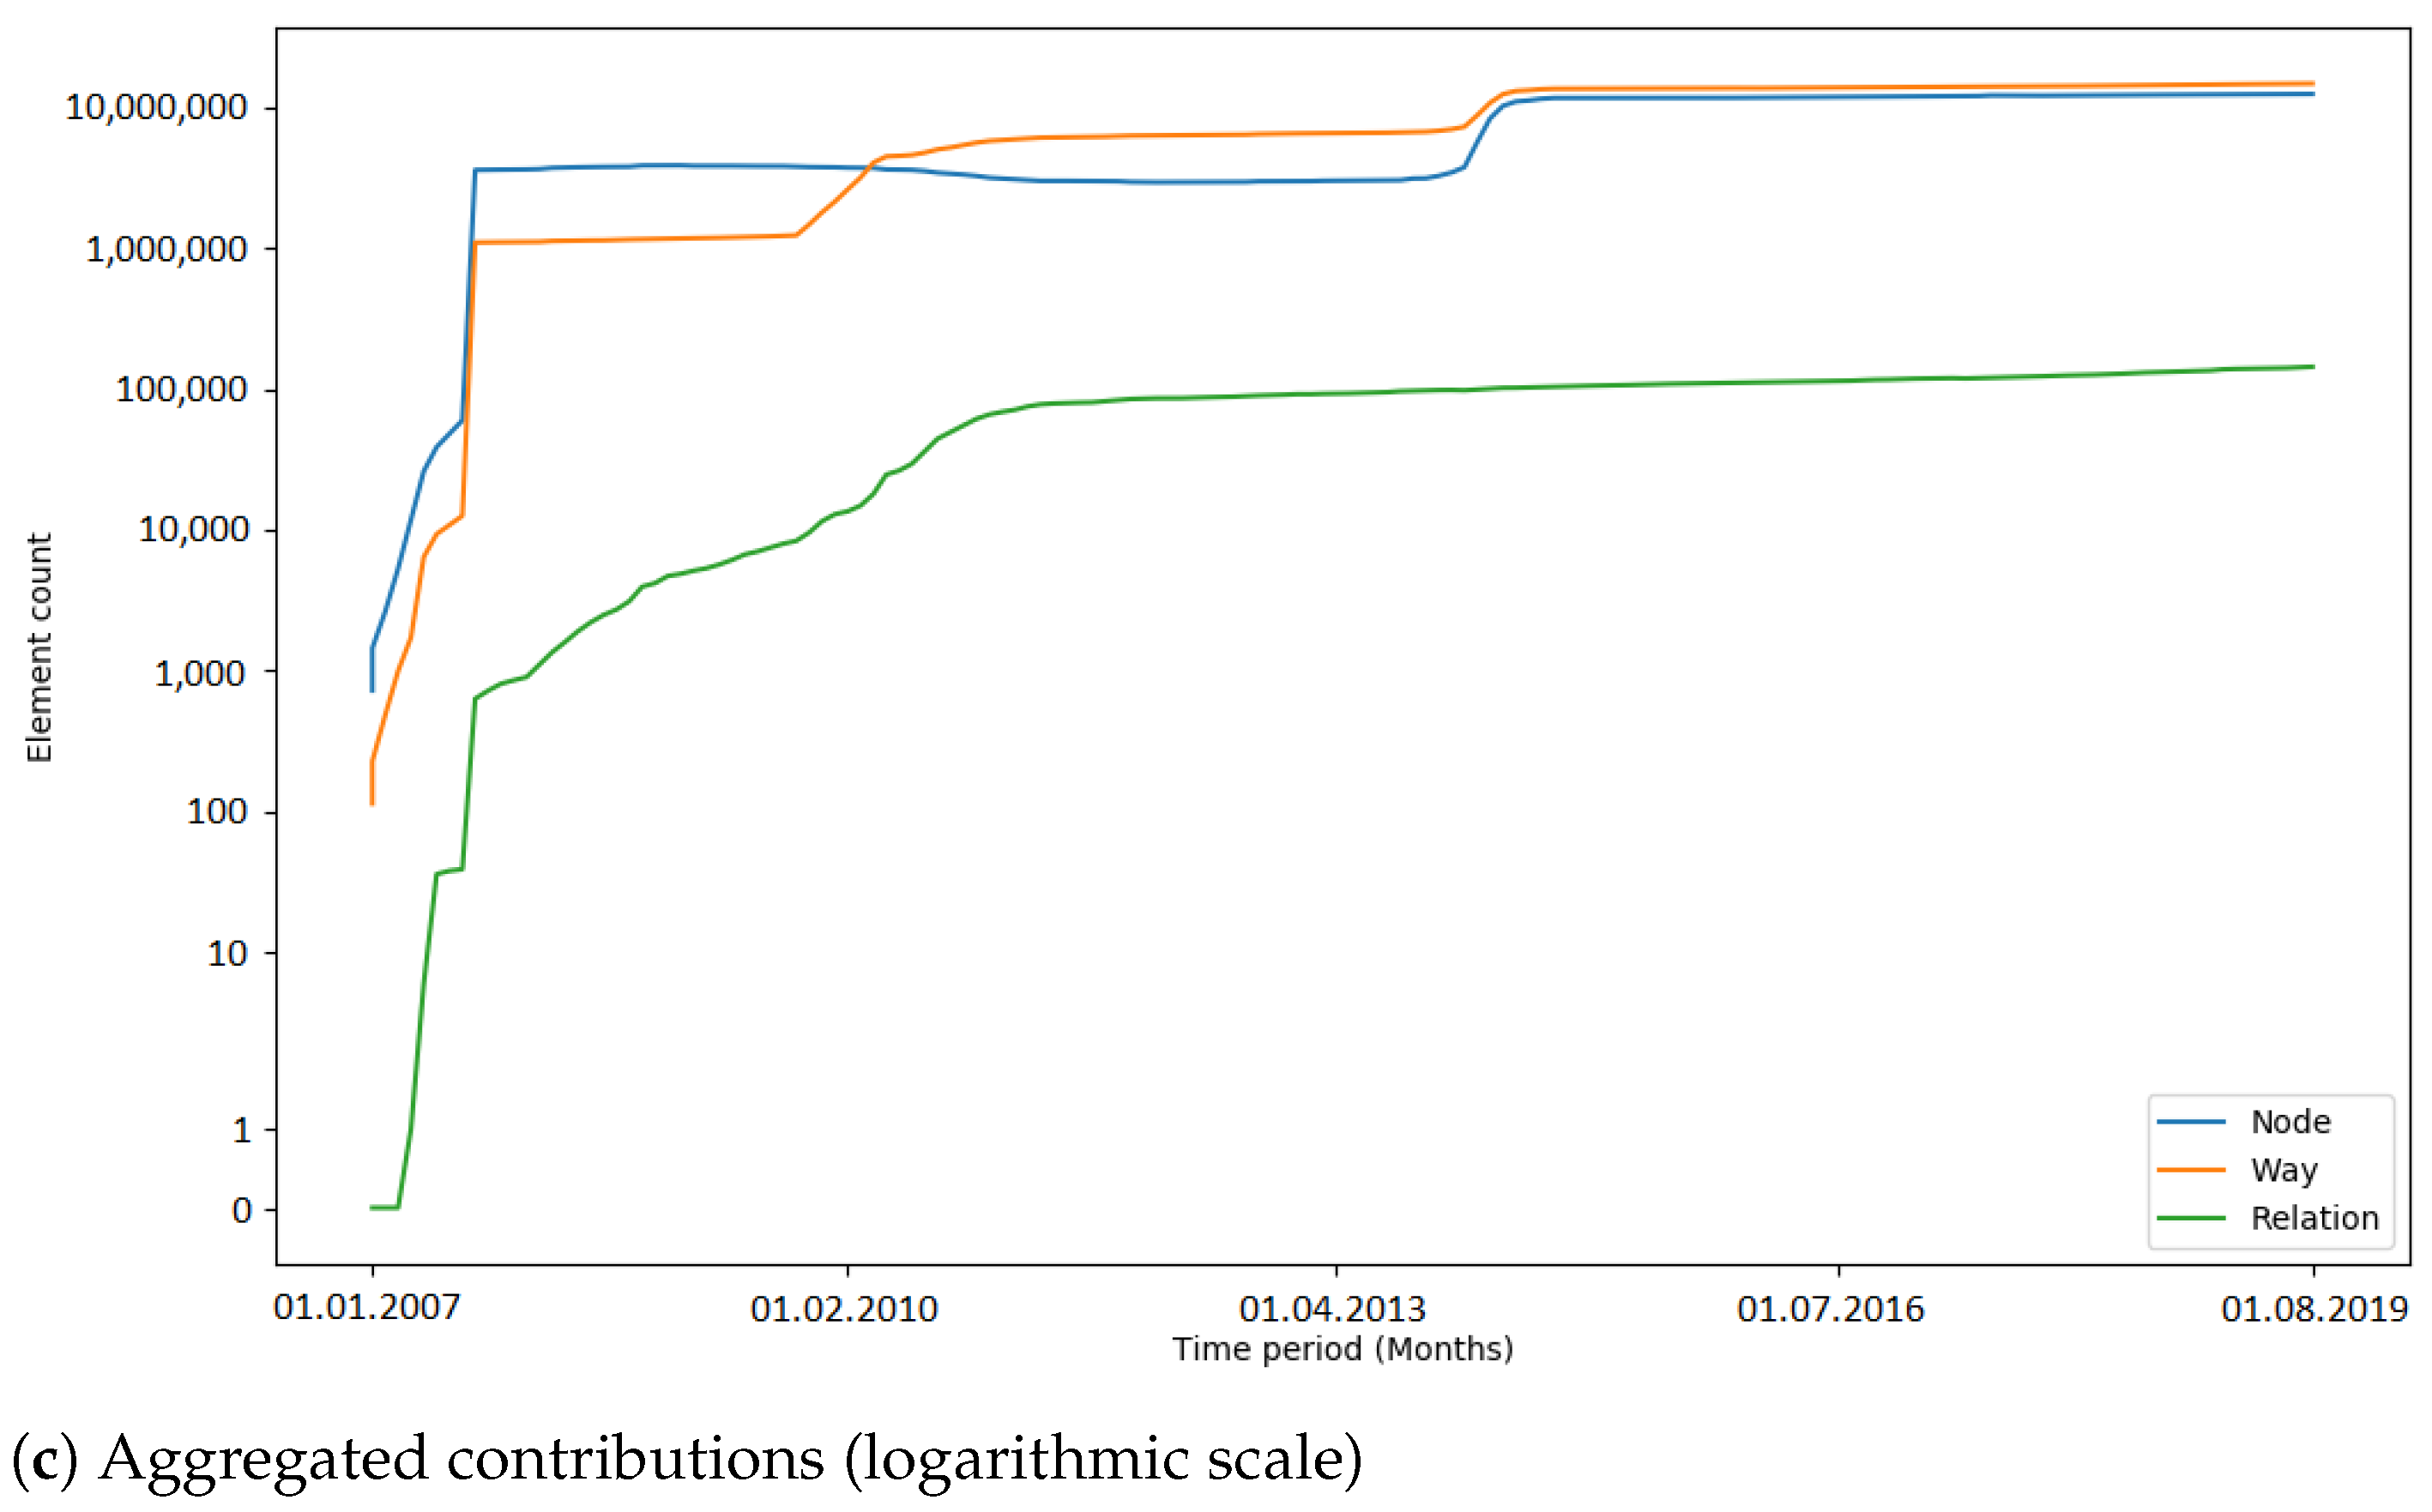
https://www.openstreetmap.org/api/0.6/user/contributorID (accessed on 15 February 2020) provides user details) who were correcting the geometries of the imported elements. However, later in the project, far more data were changed—for example, during the 3dShapes import in the Netherlands, there were over three million tag changes in one week (see Figure A9). After a brief investigation of the 3dShapes import, it was found that the large number of tag changes occurred to remove AND tags, and was not related to the 3dShapes import. Consequently, a more detailed analysis is necessary to find out out why exactly changes of many OSM elements are caused.

4.1.3. Tags

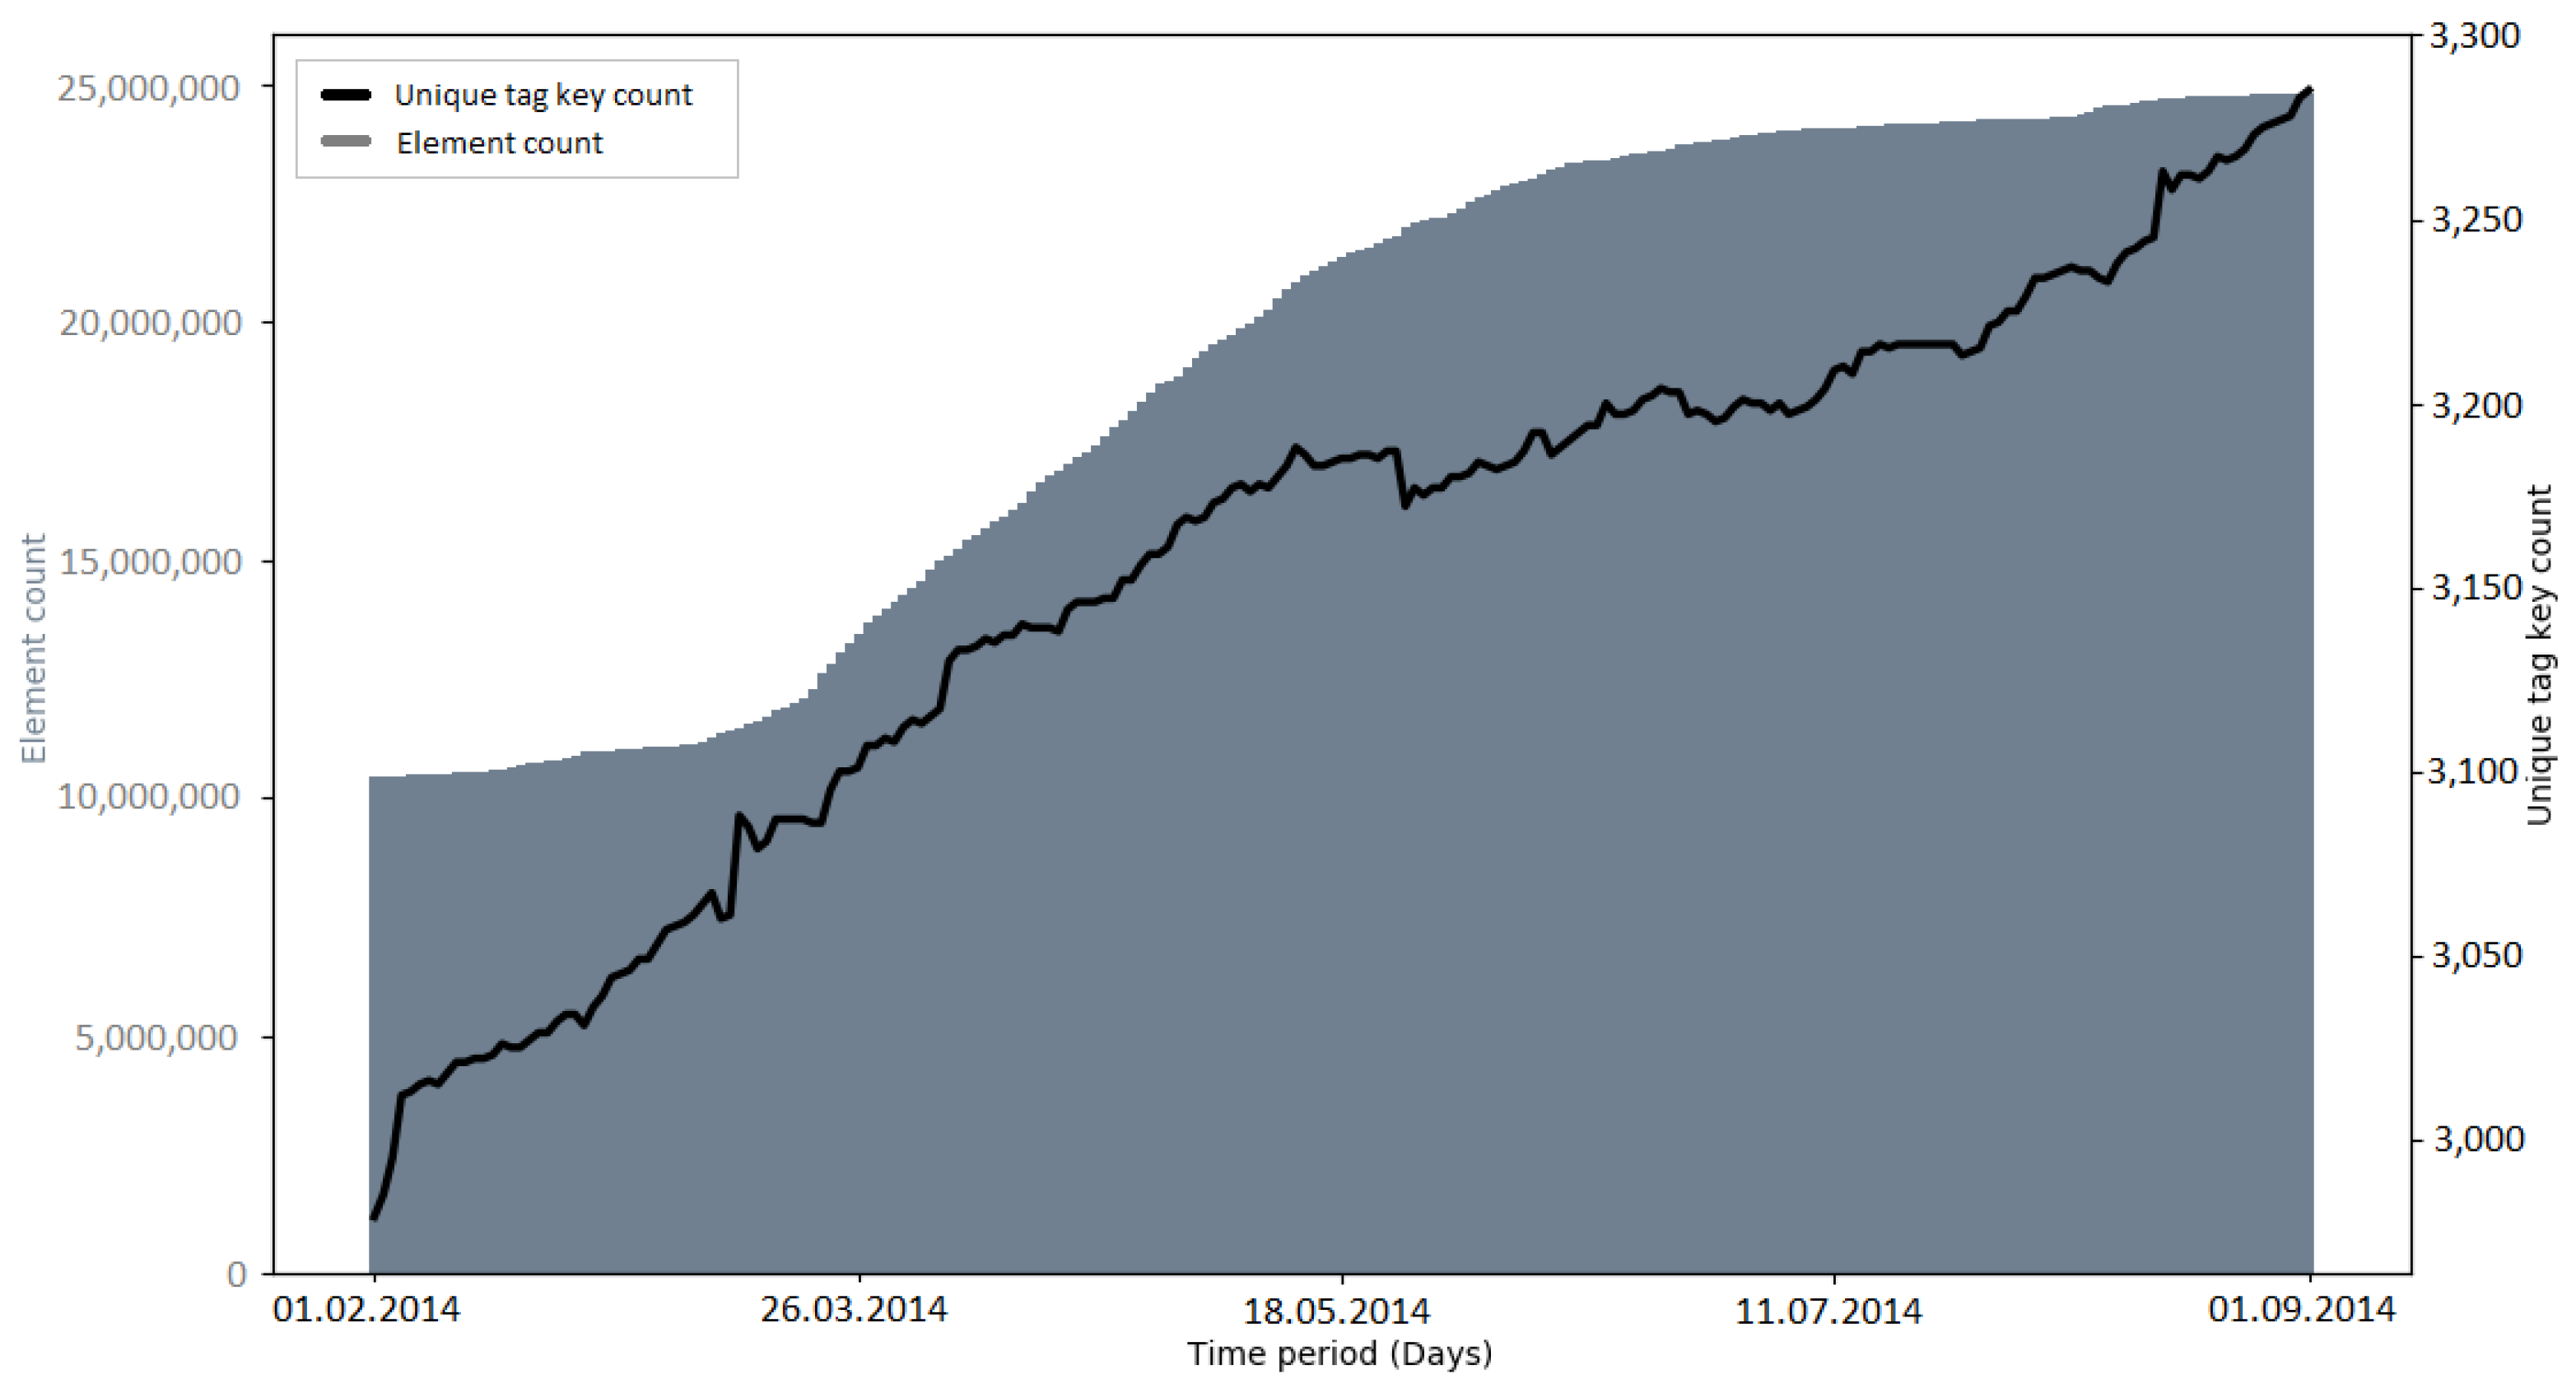
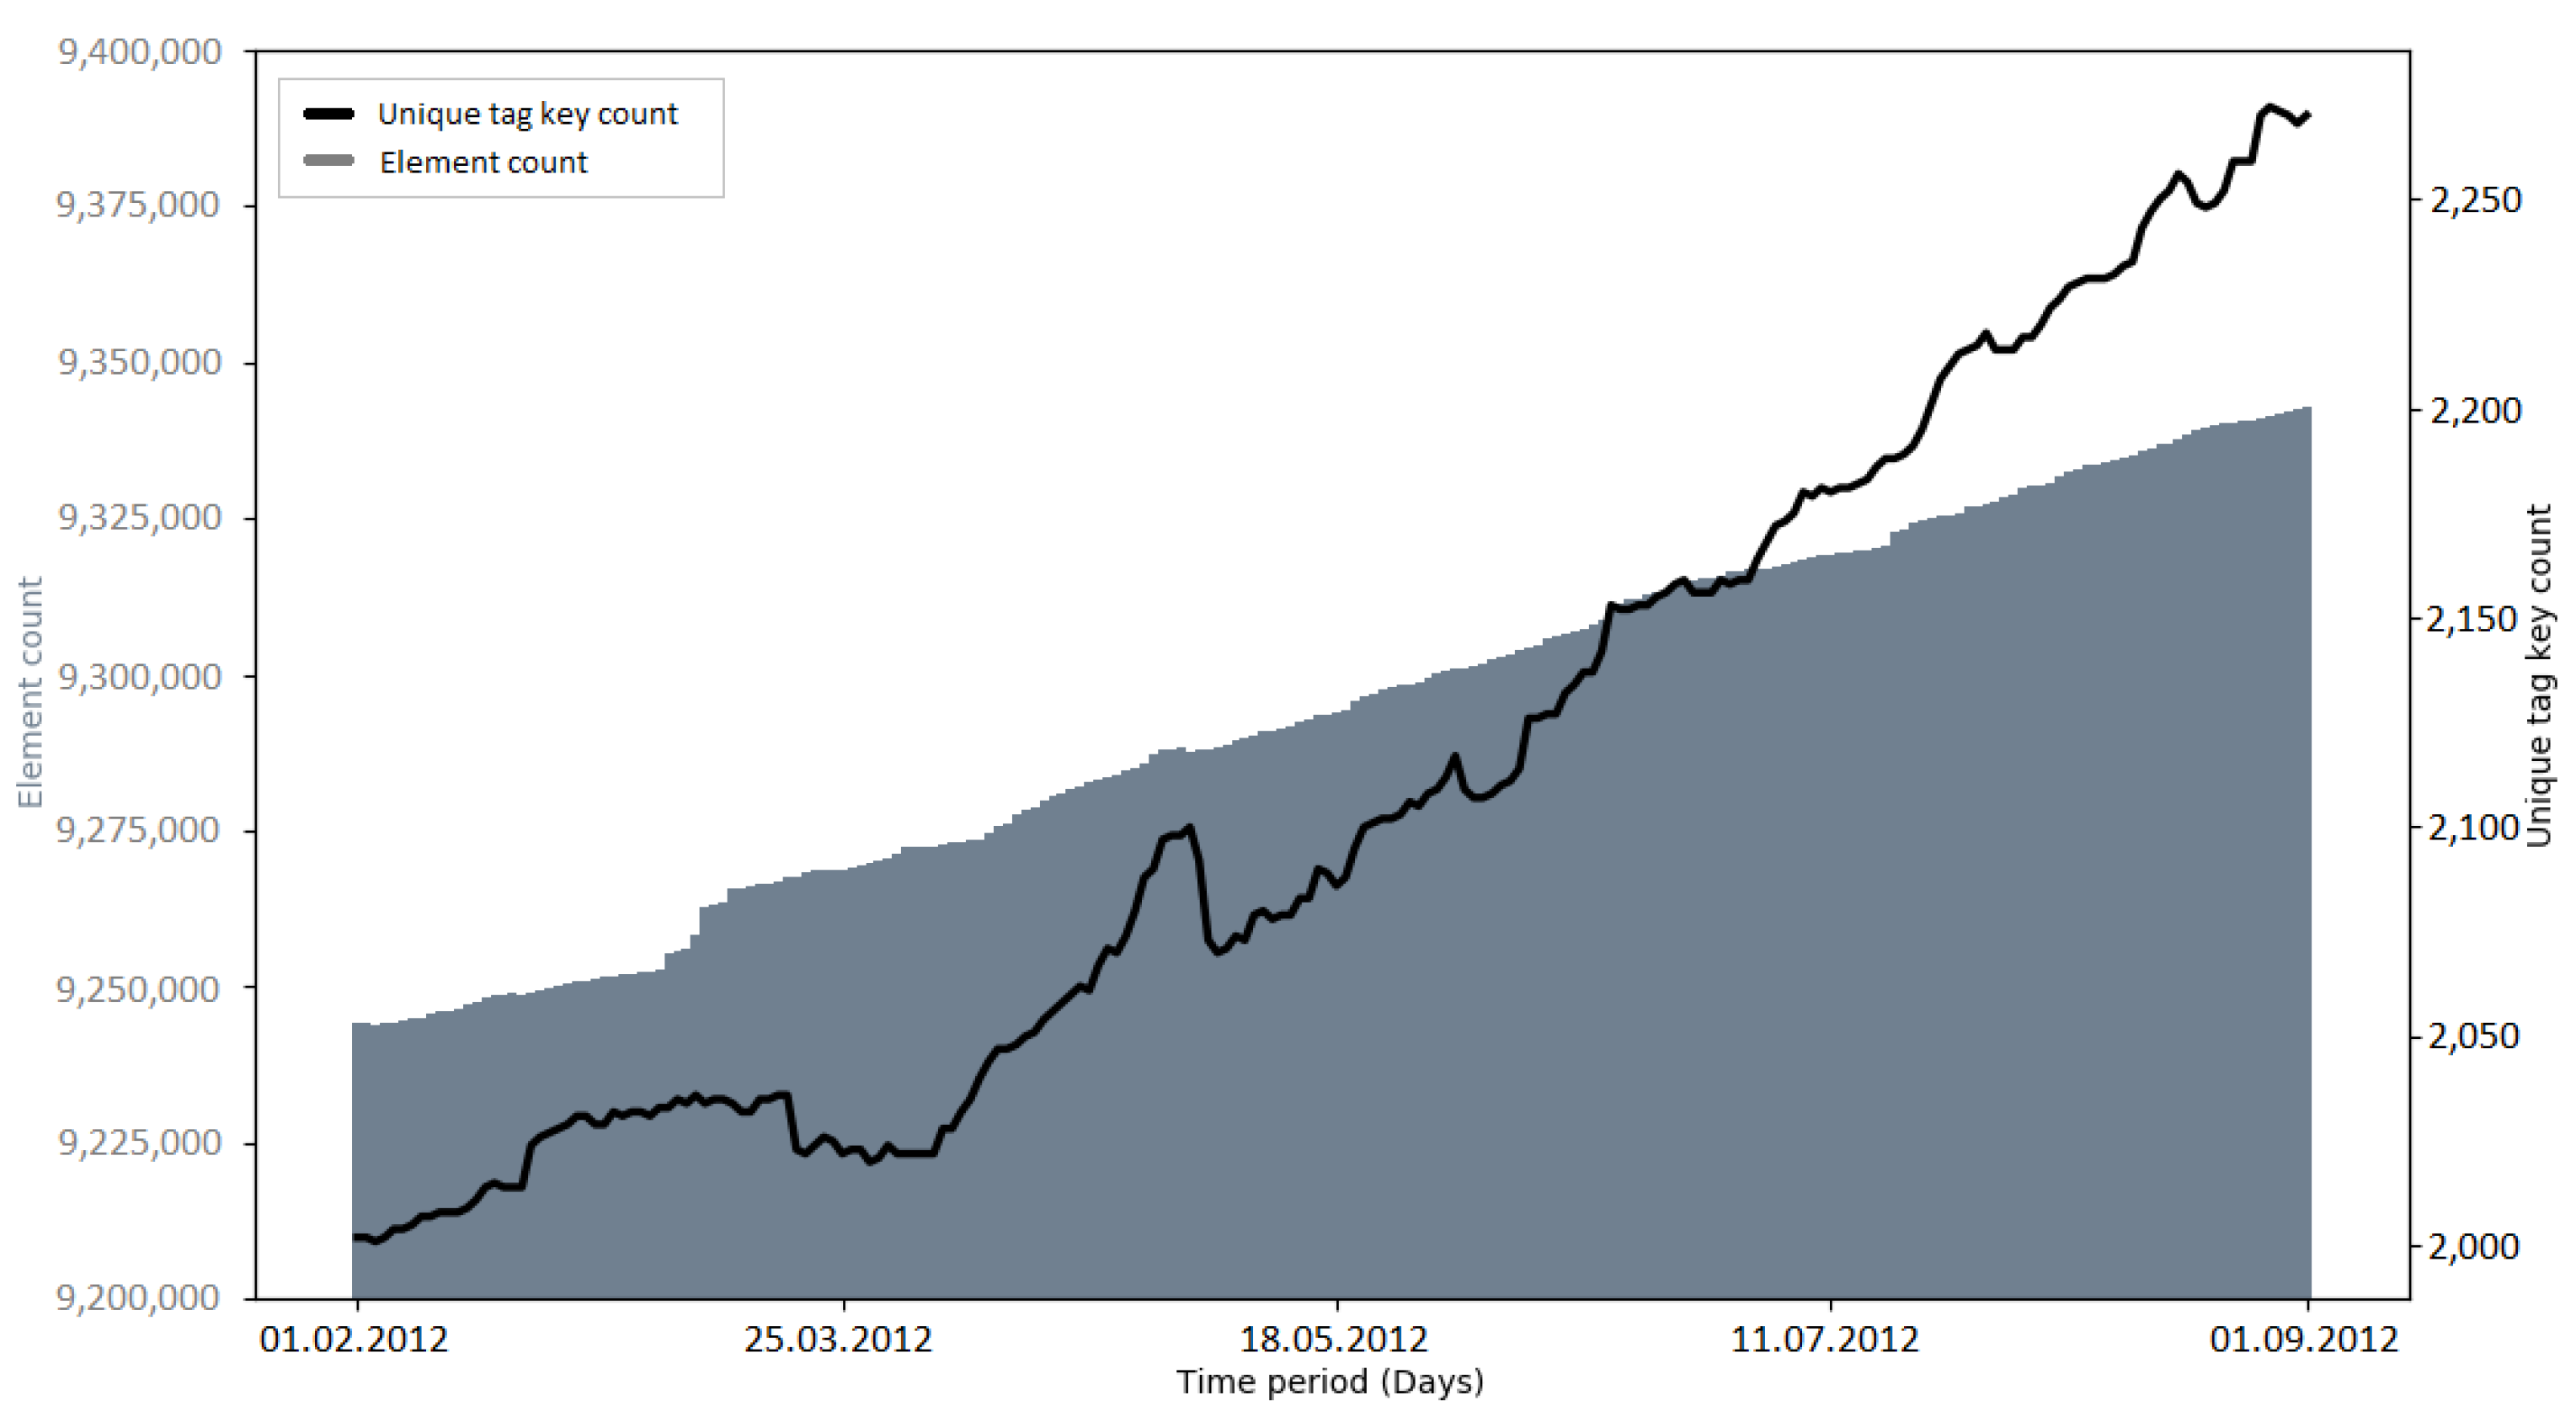
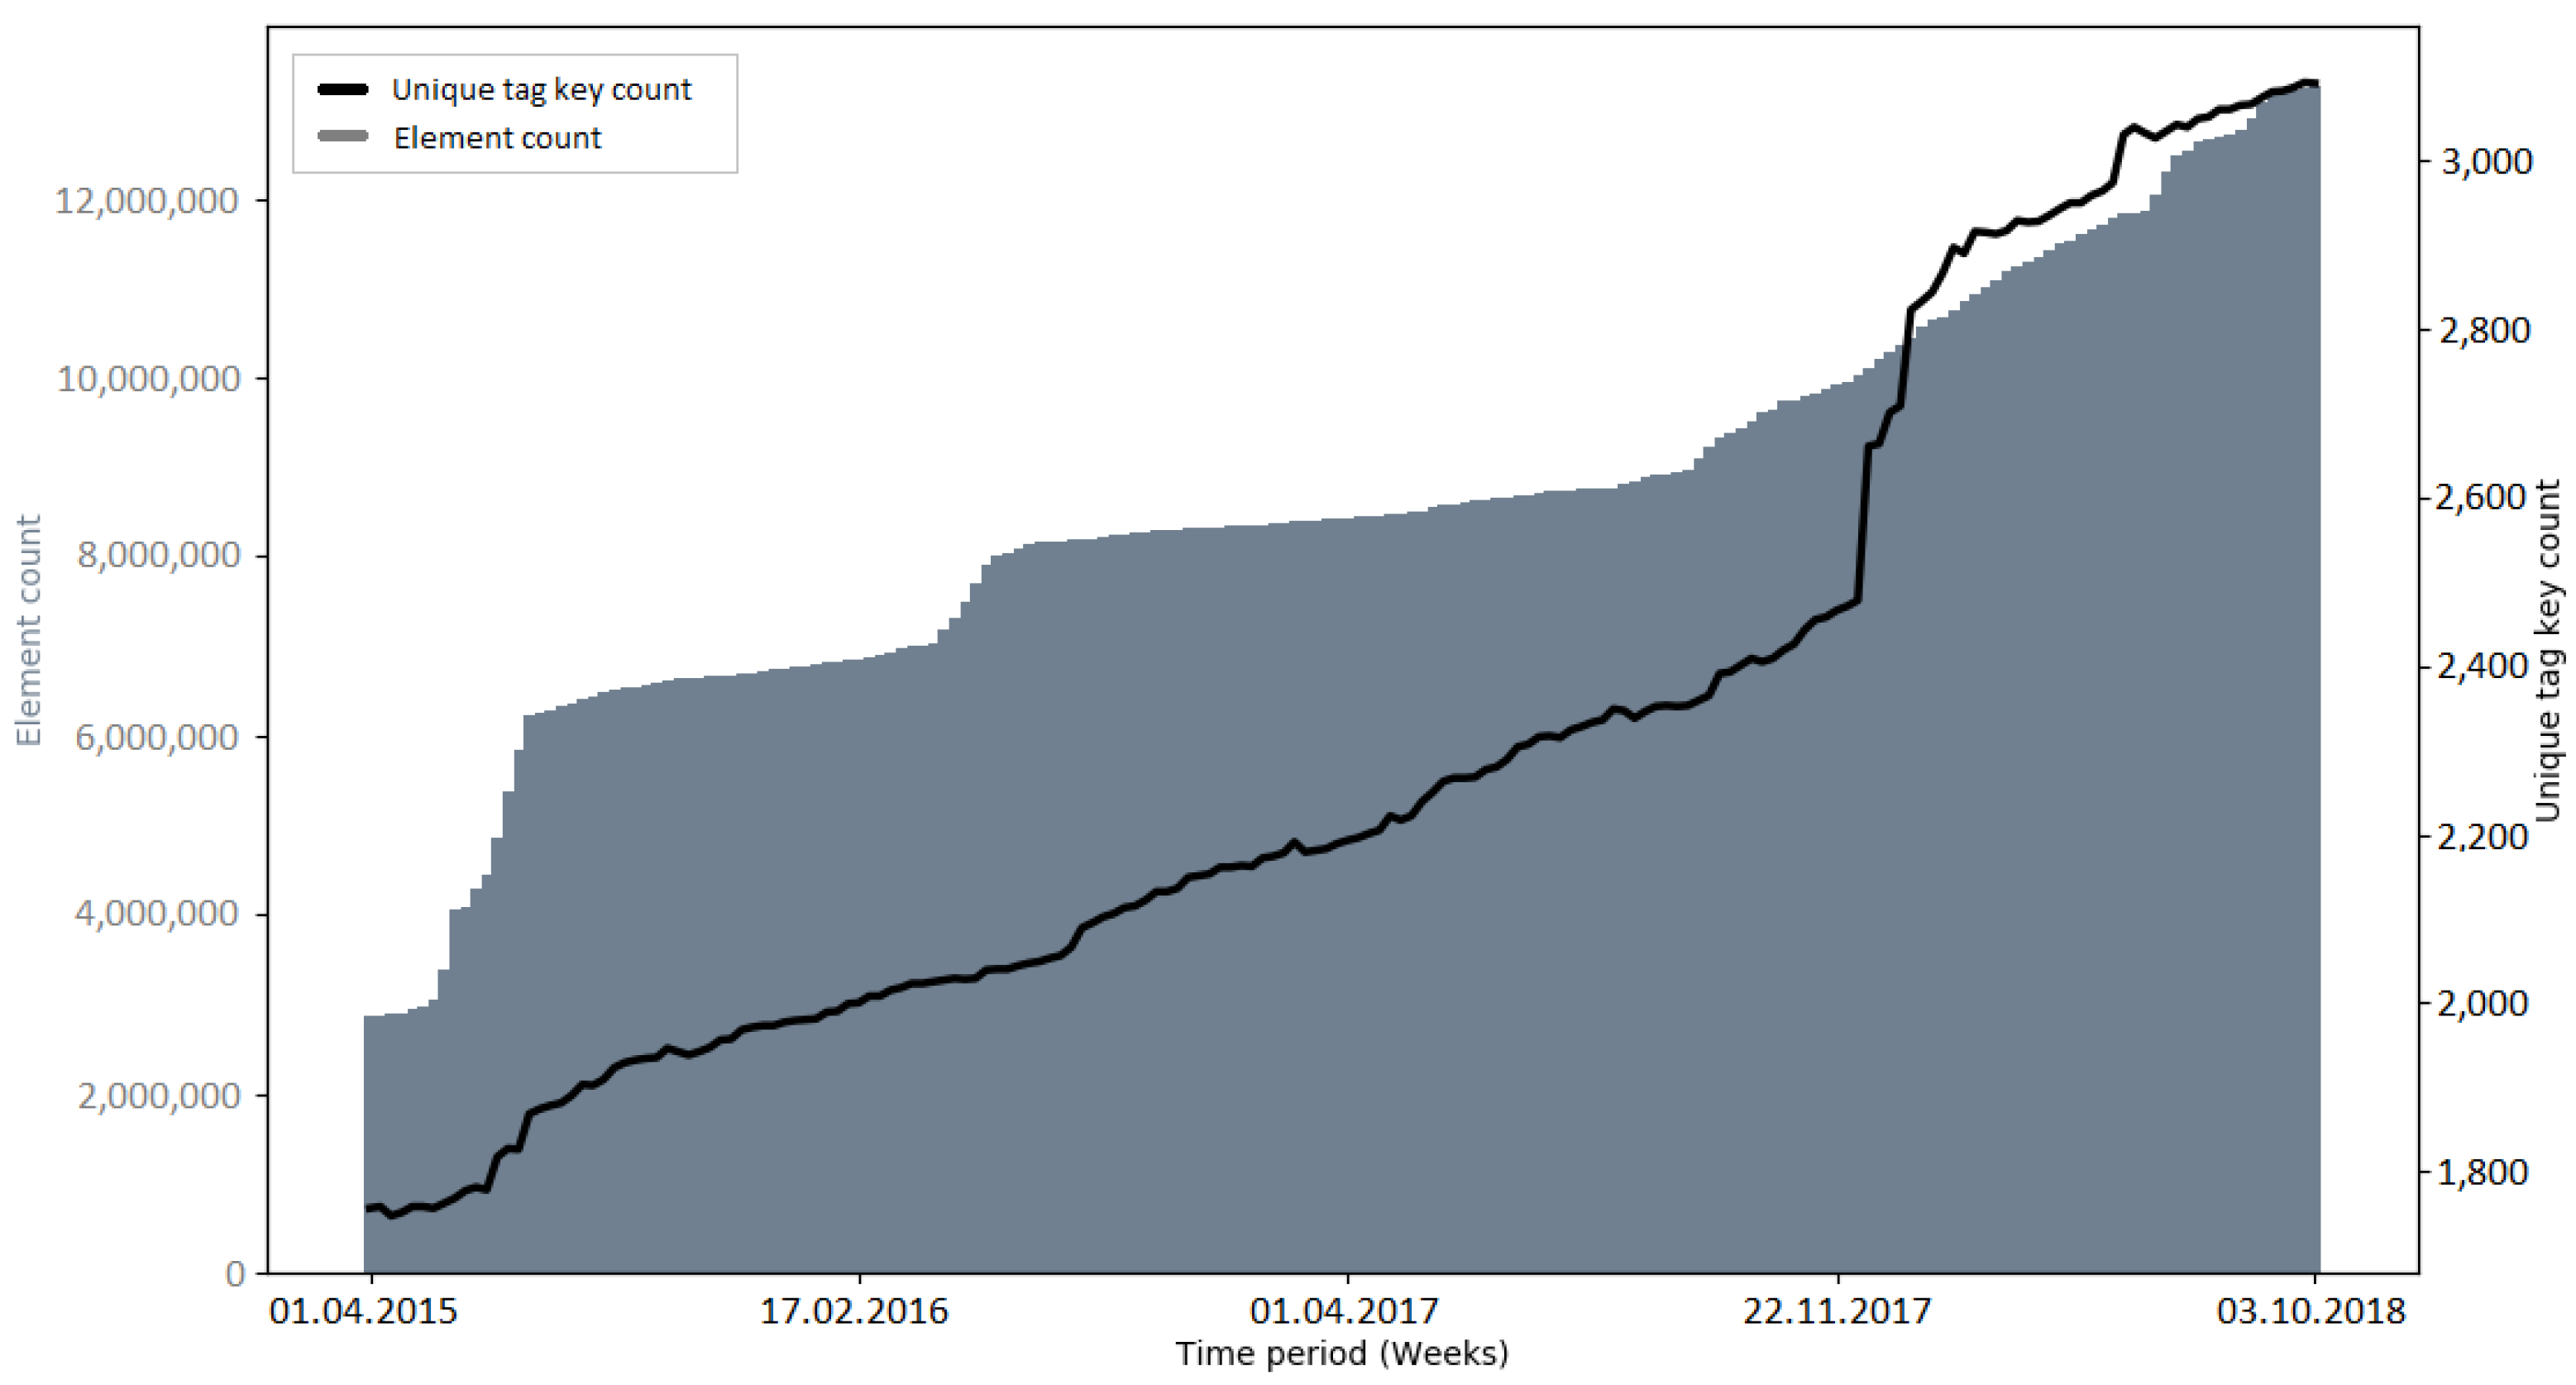
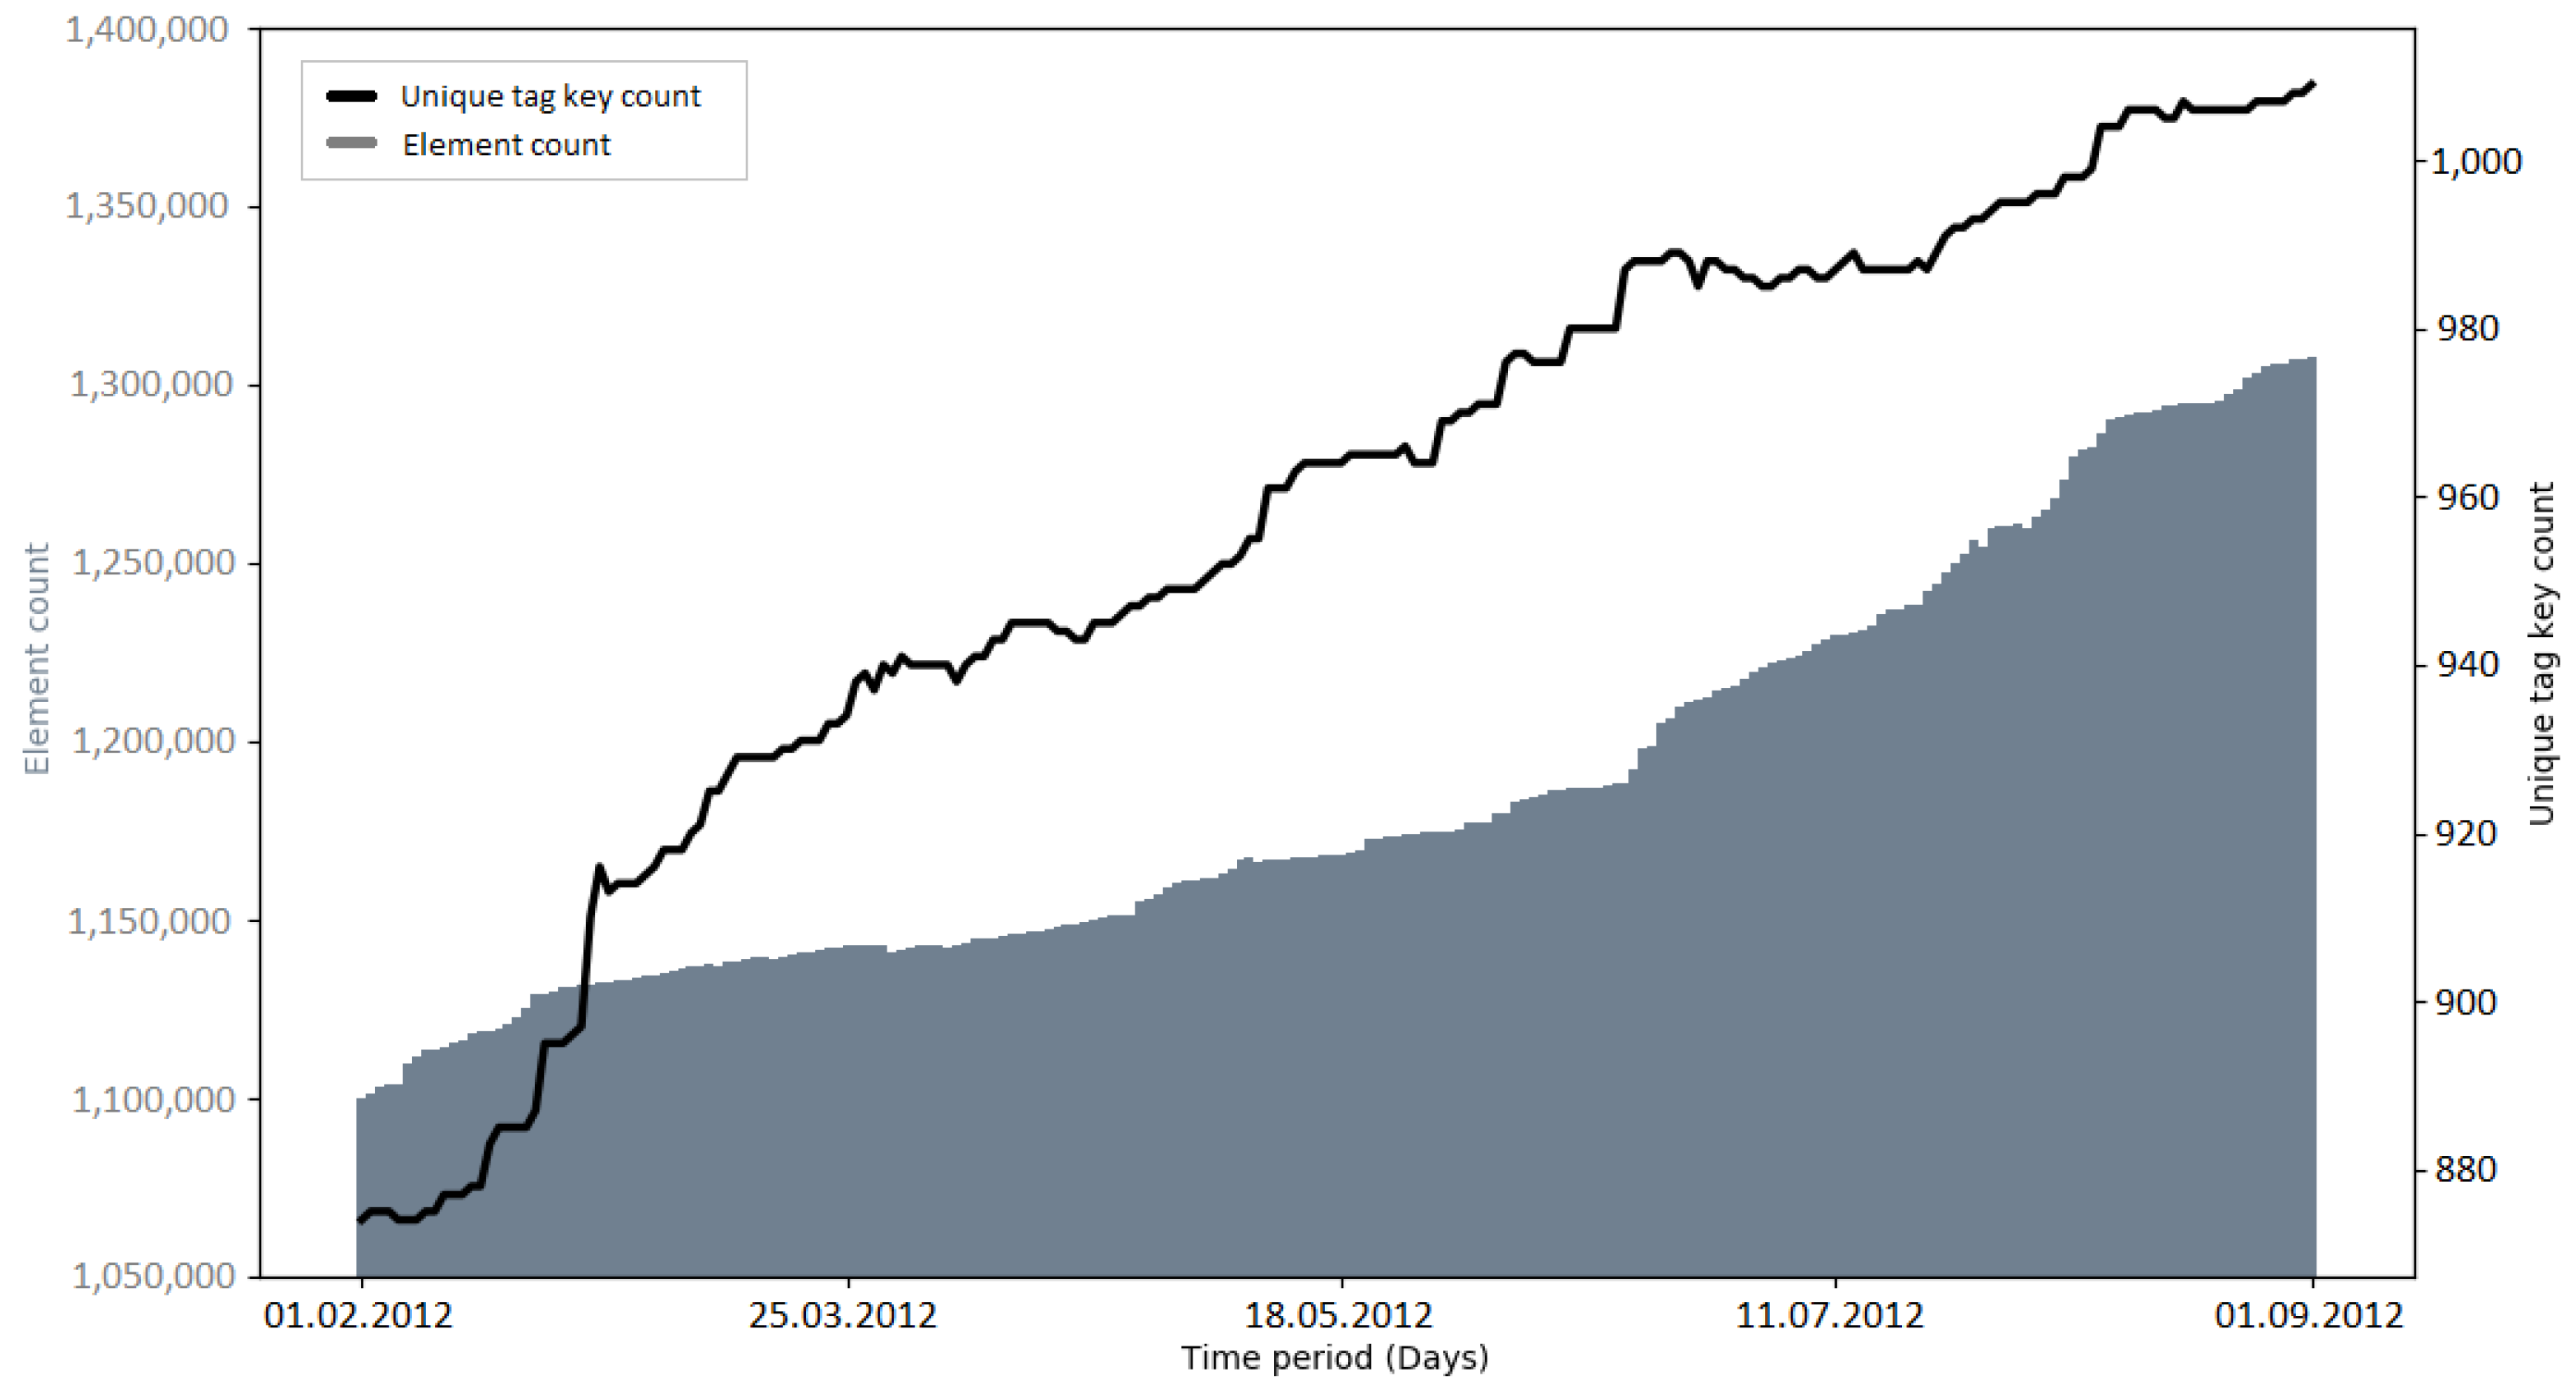
The development of the number of unique tag keys gives insights into the level of detail with which the OSM community is describing the attributes of elements. Since tagging schemes normally develop over time and as a community process, it was interesting to investigate if large data imports have an impact on the progress of these attributes [19].
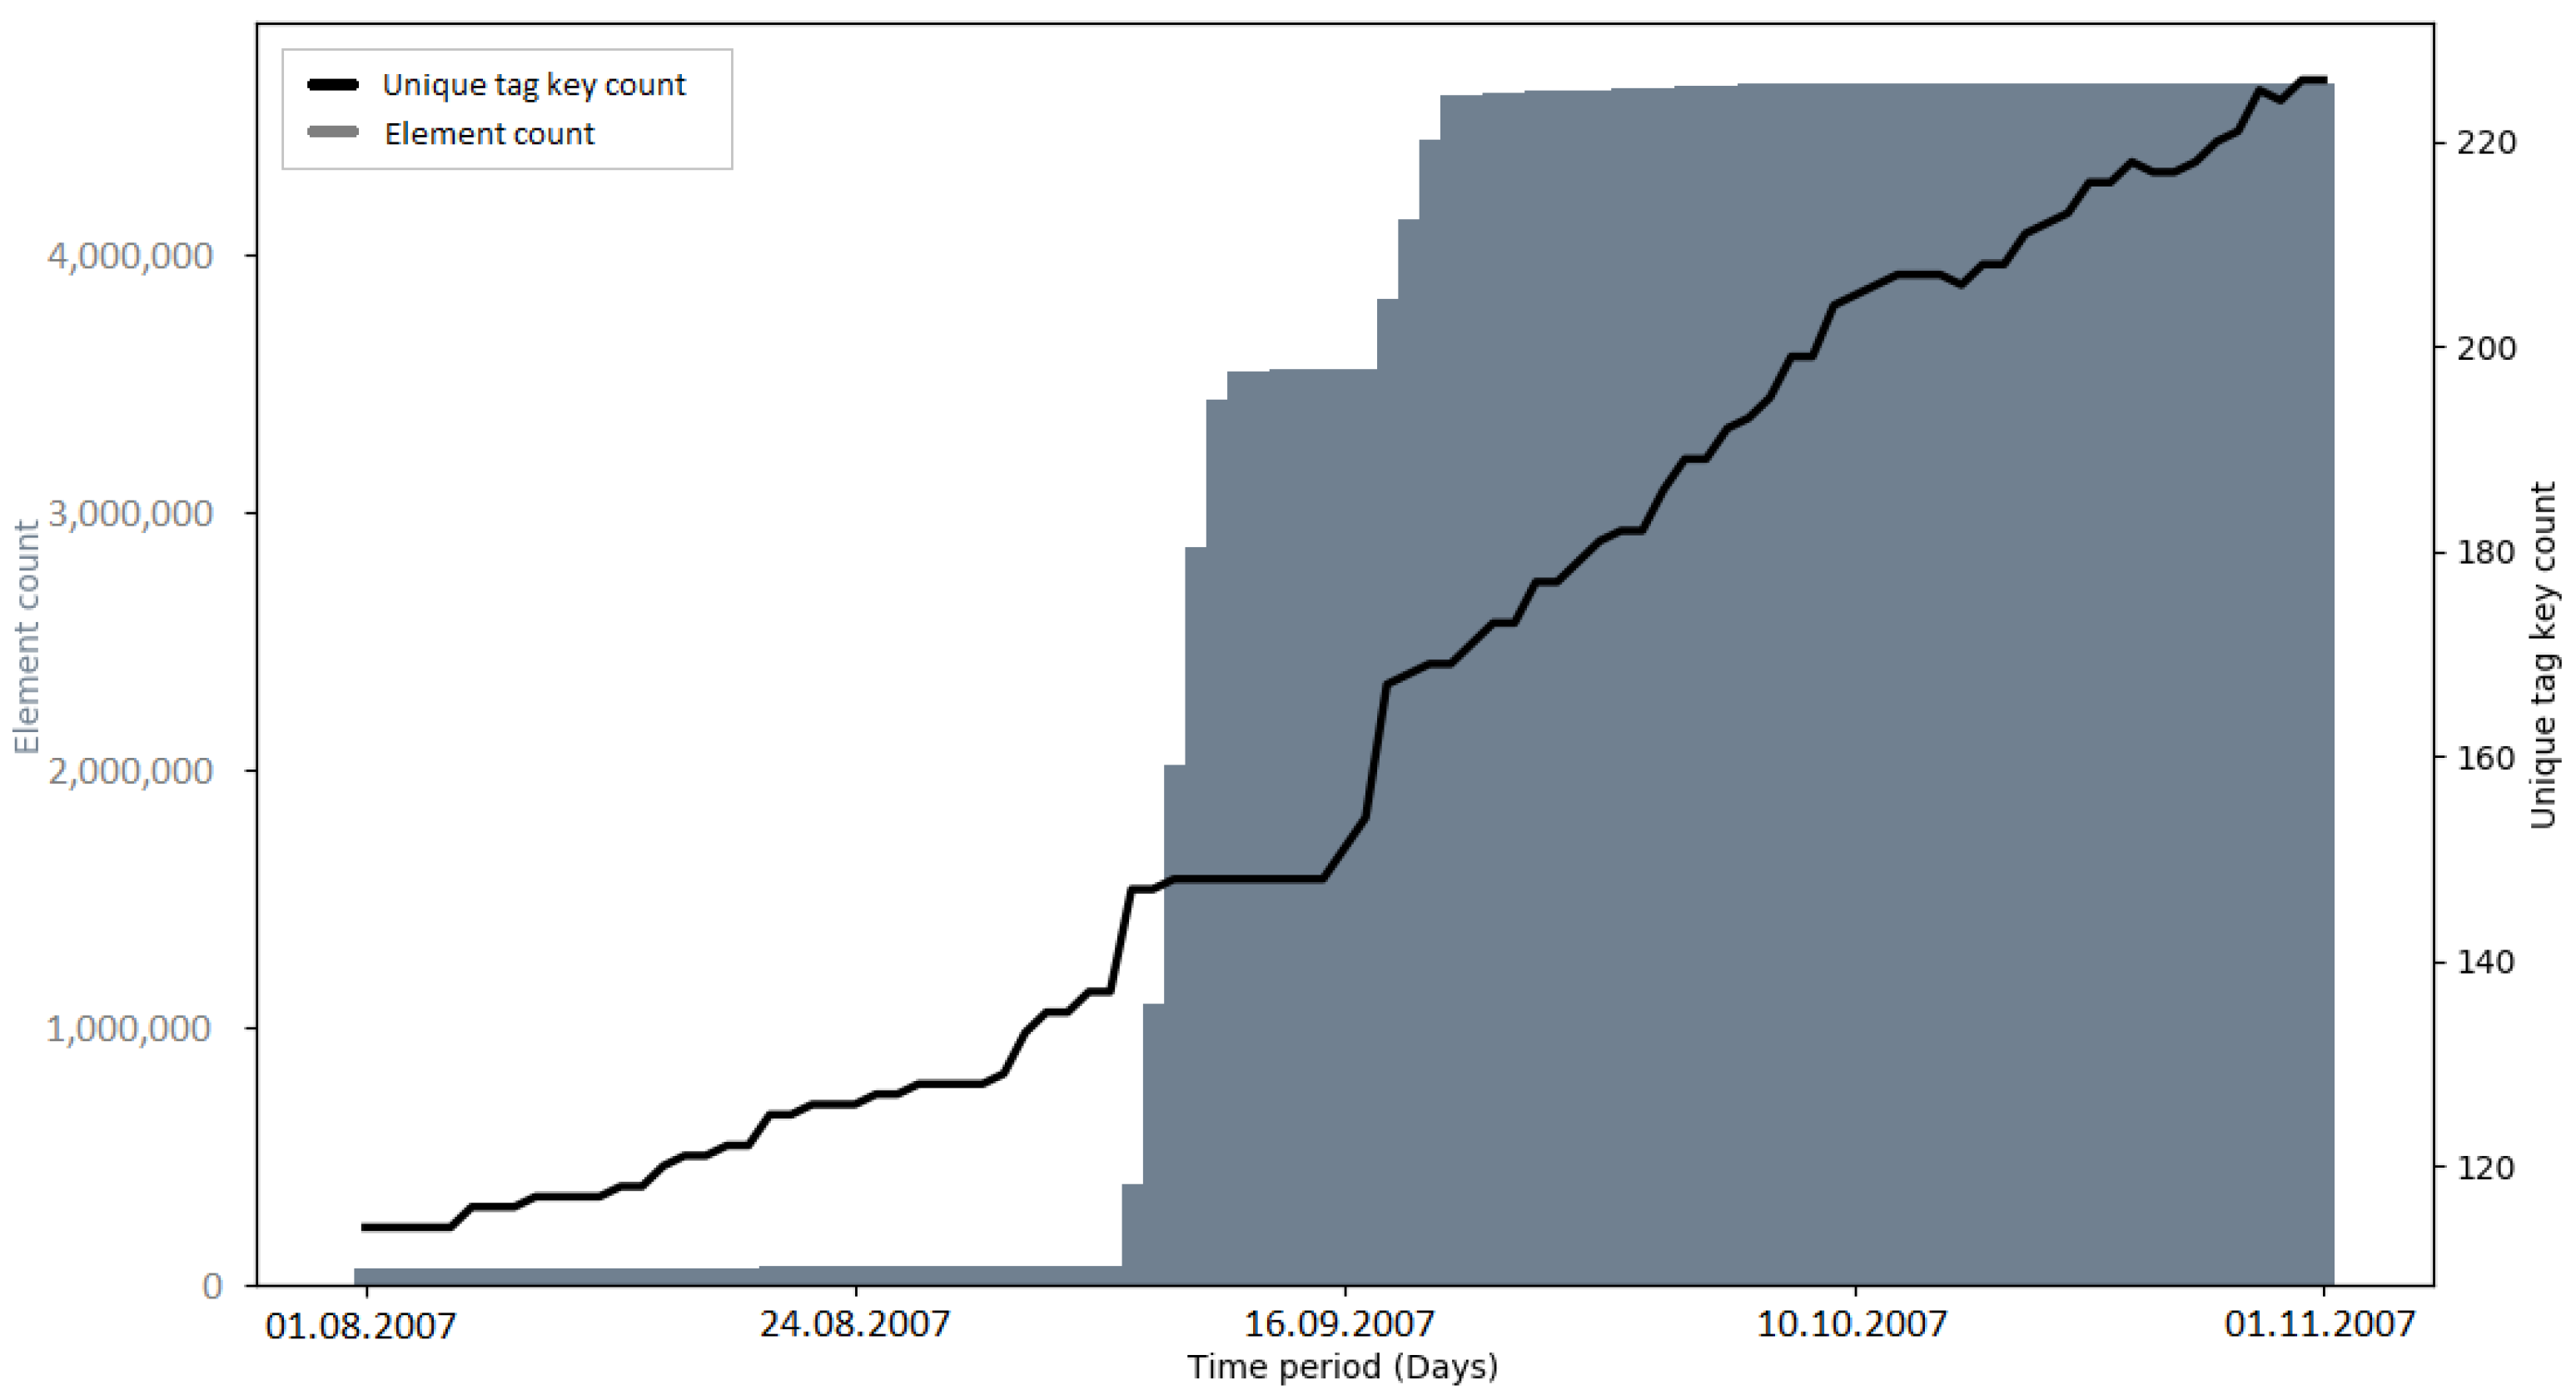
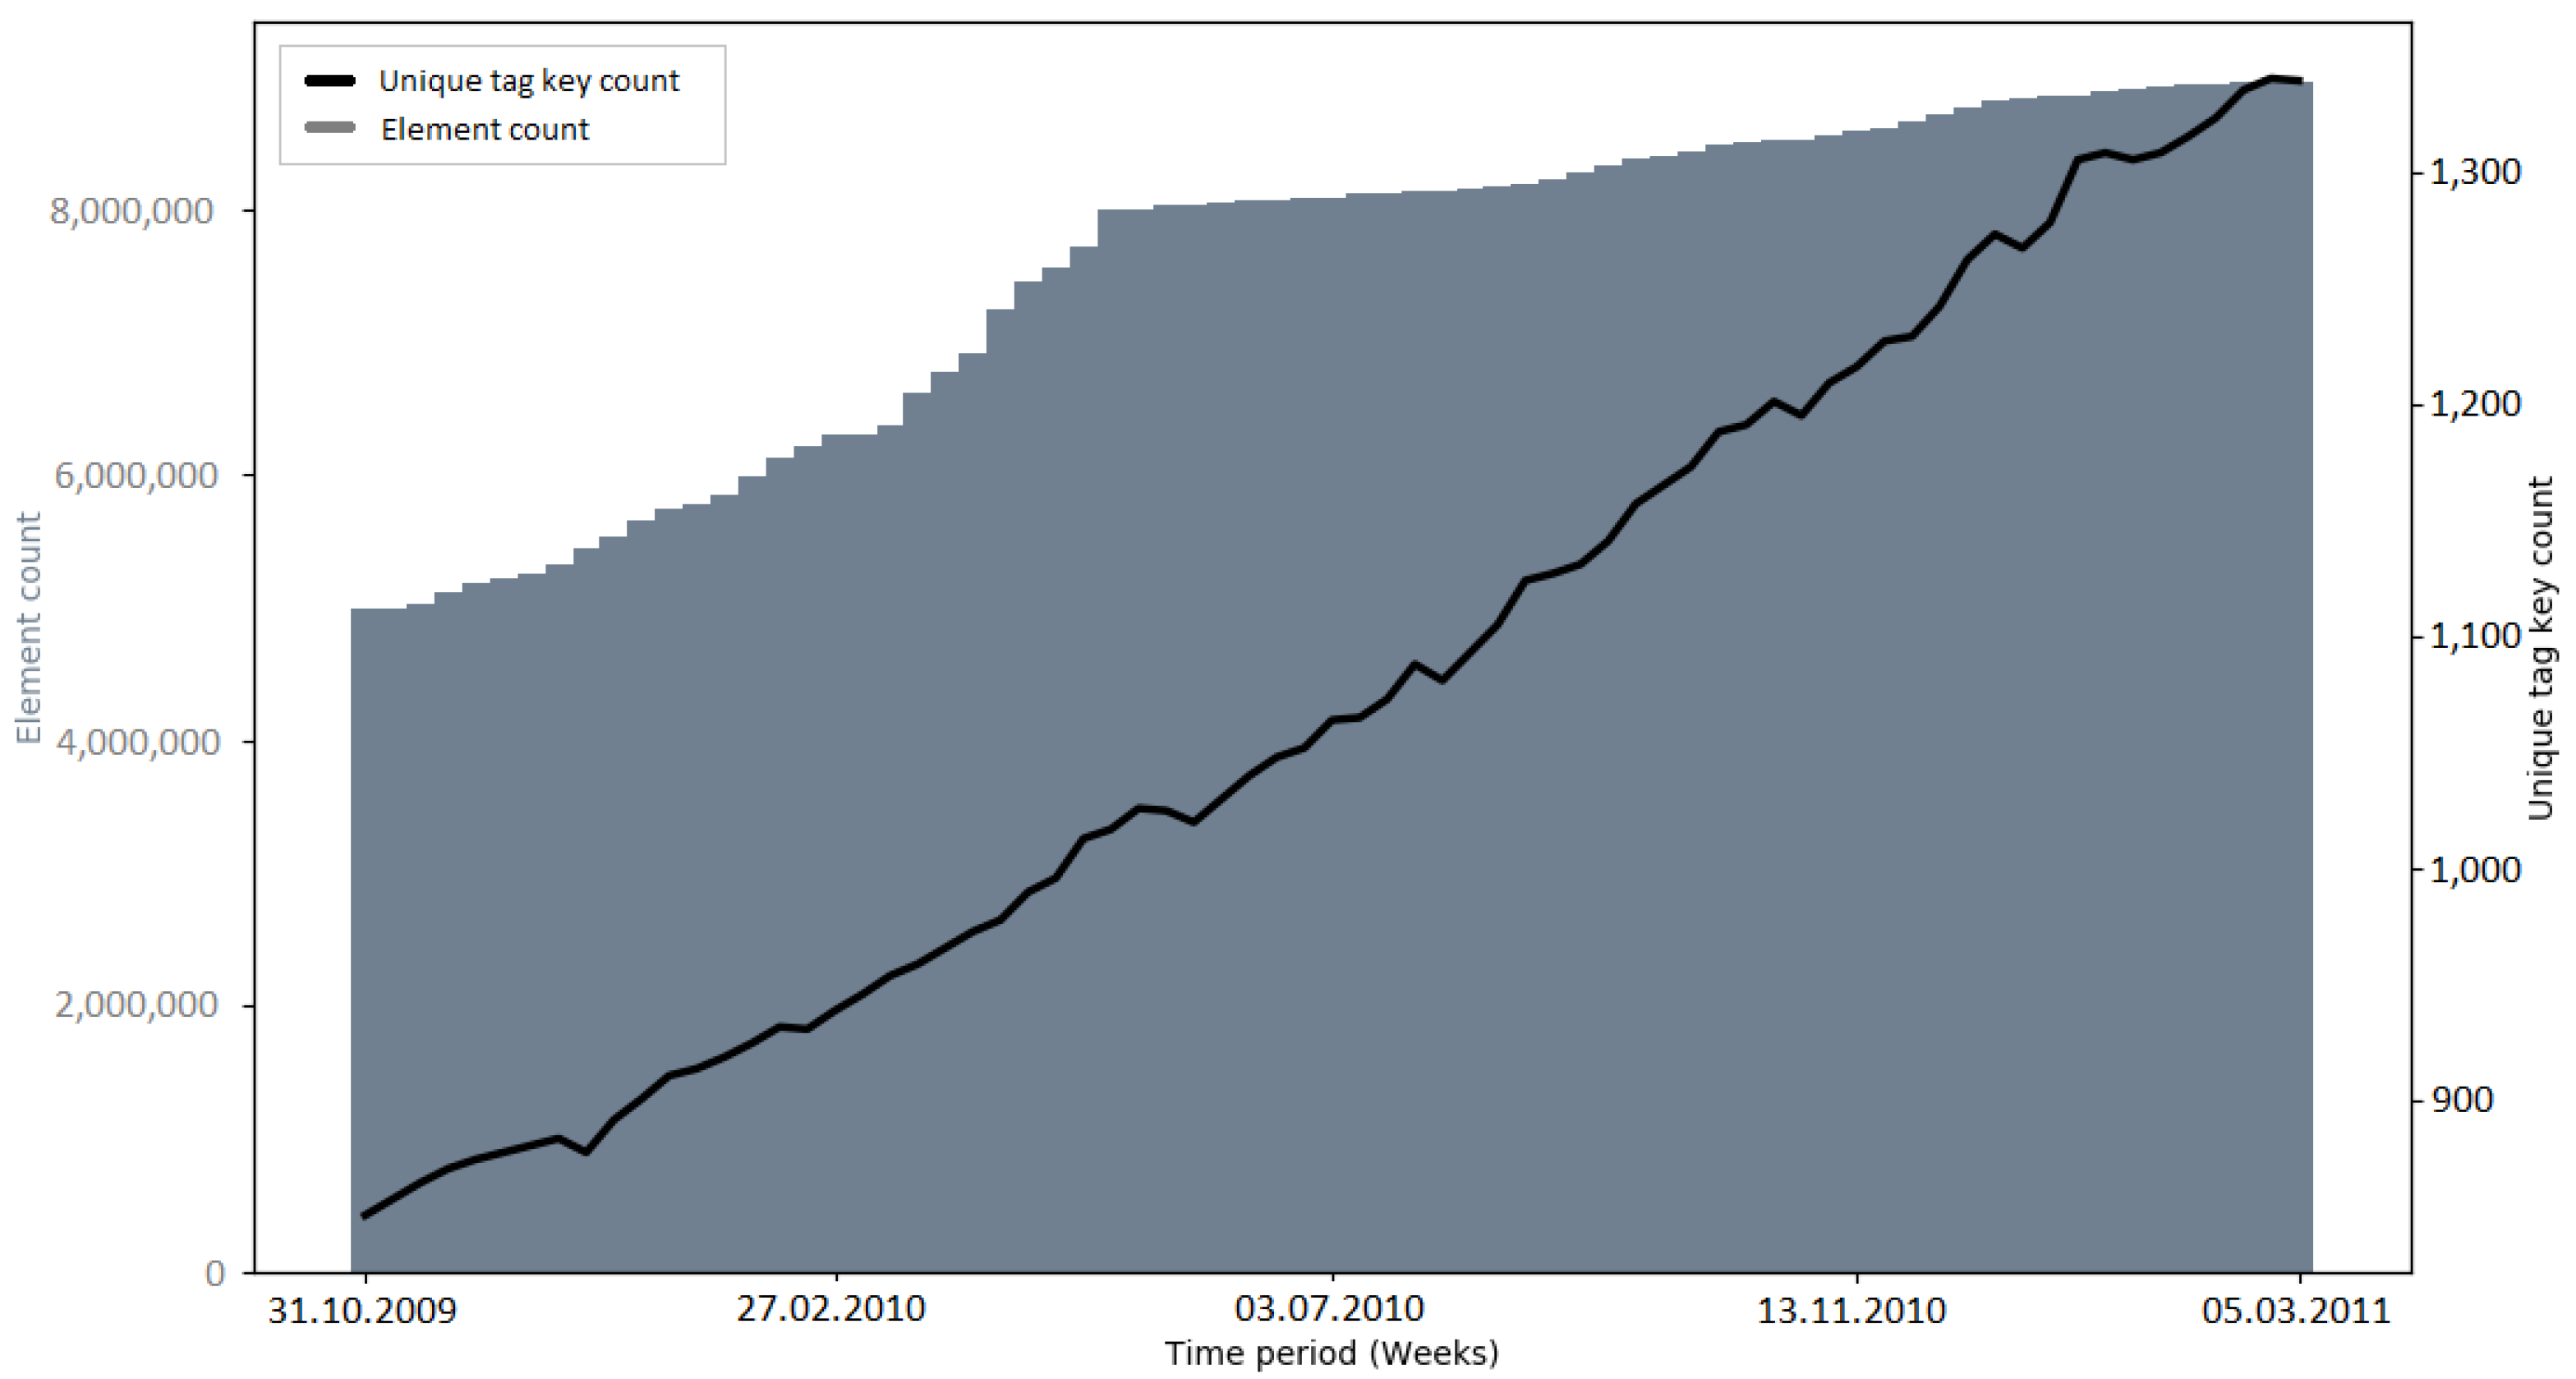
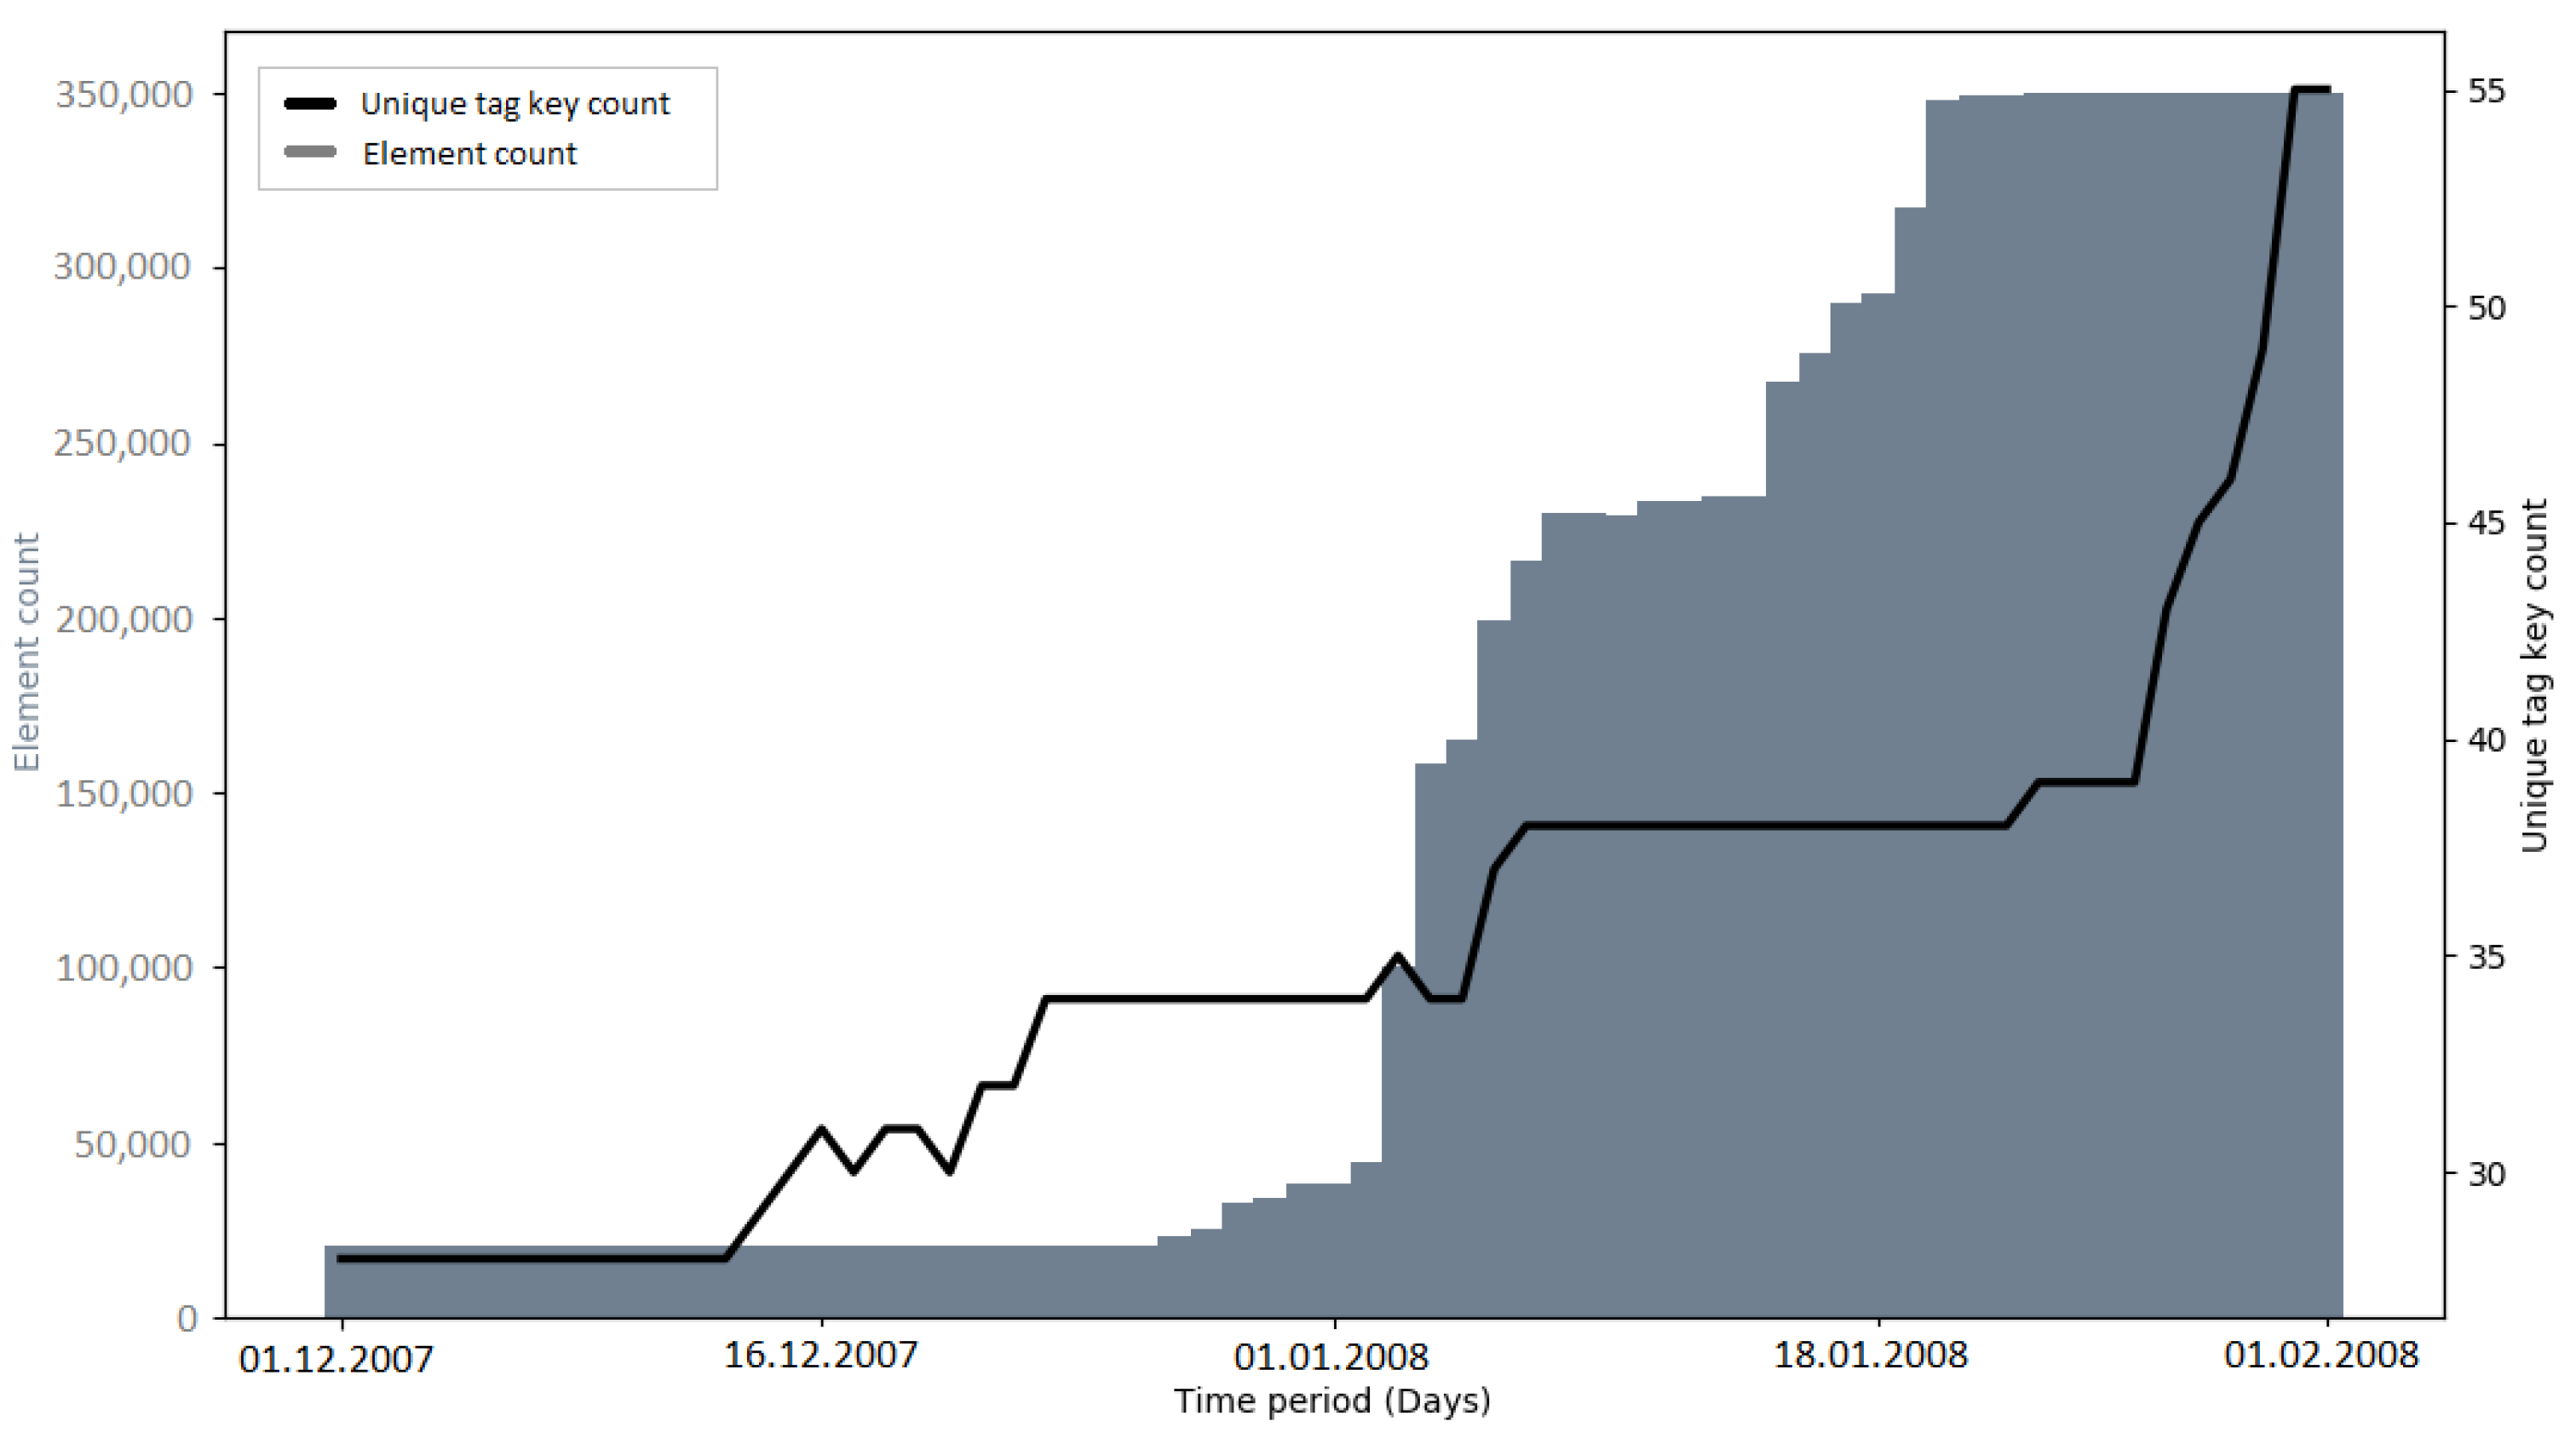
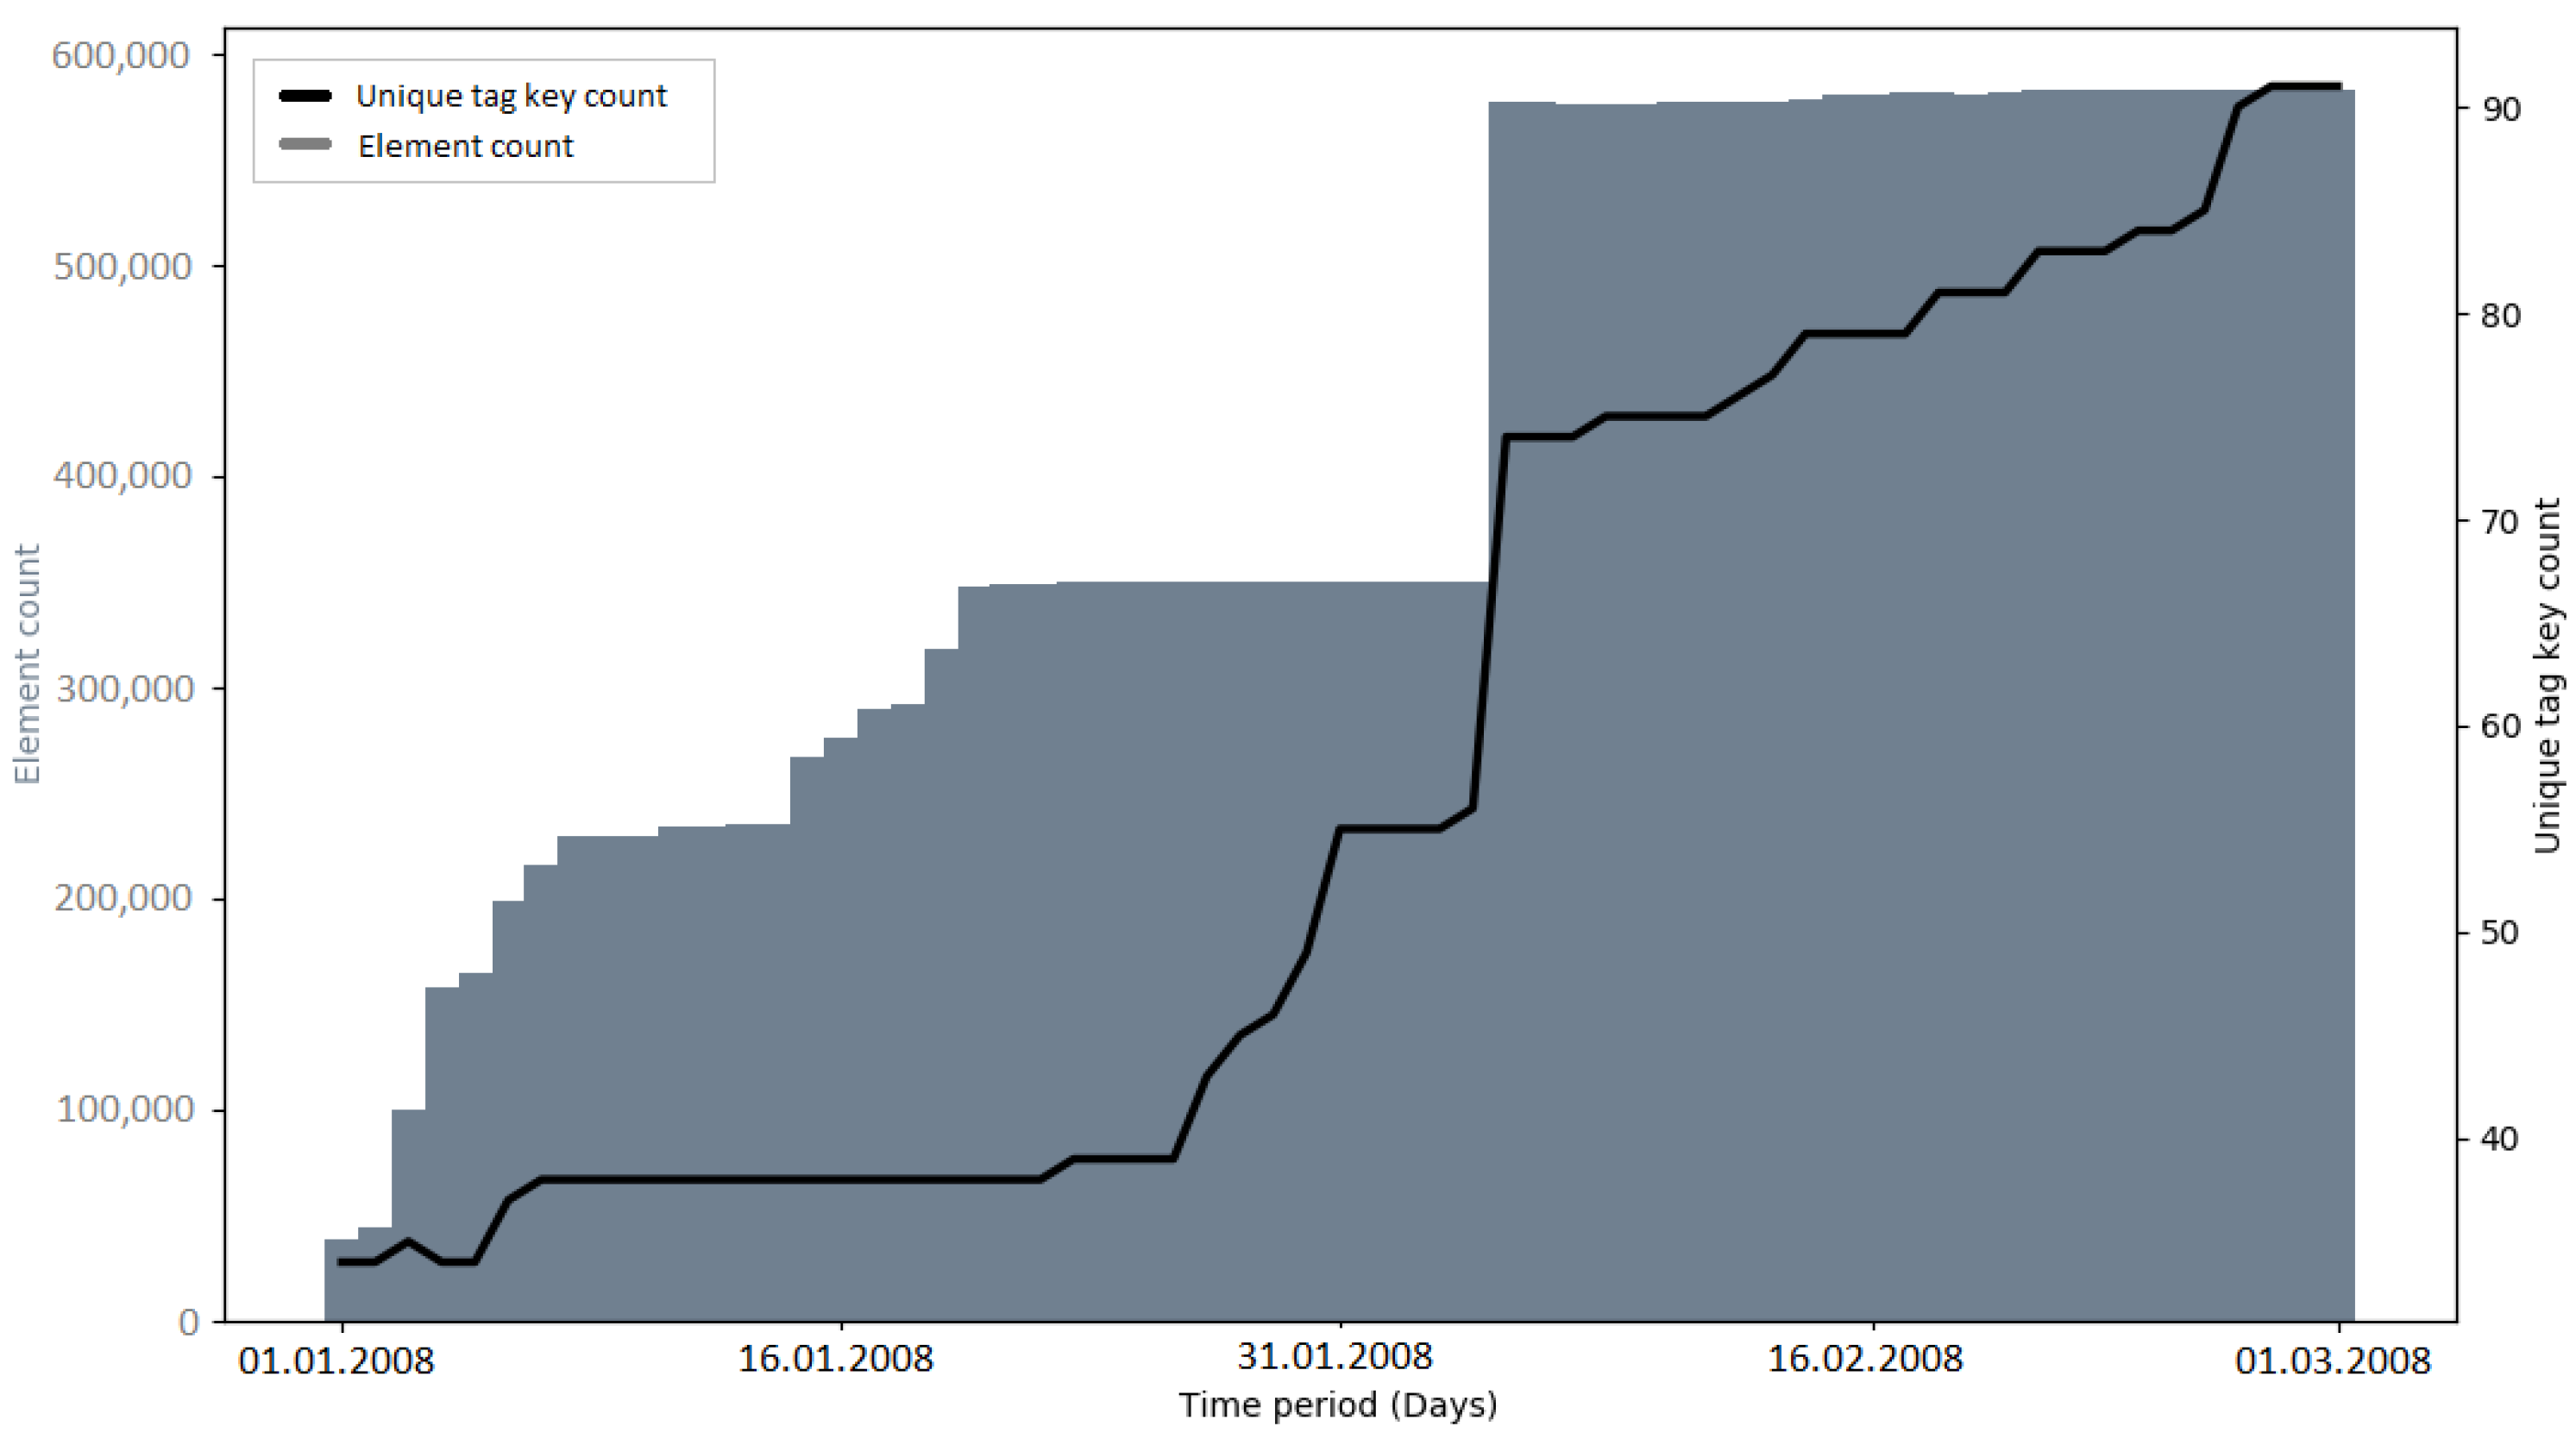
Early imports (e.g., PGS import and AND imports) brought many new tag keys to OSM, because of the external information which was mapped to OSM tags (e.g., “AND_nosr_r” which contains the original AND ID of road sections [50]). Subsequent imports (e.g., 3dShapes import, BAG import) did not have such a drastic increase of tag keys. This could be explained with the knowledge of the community and lessons learned from the execution of earlier imports (from an external data source, only information that is verifiable should be added as an OSM tag key [
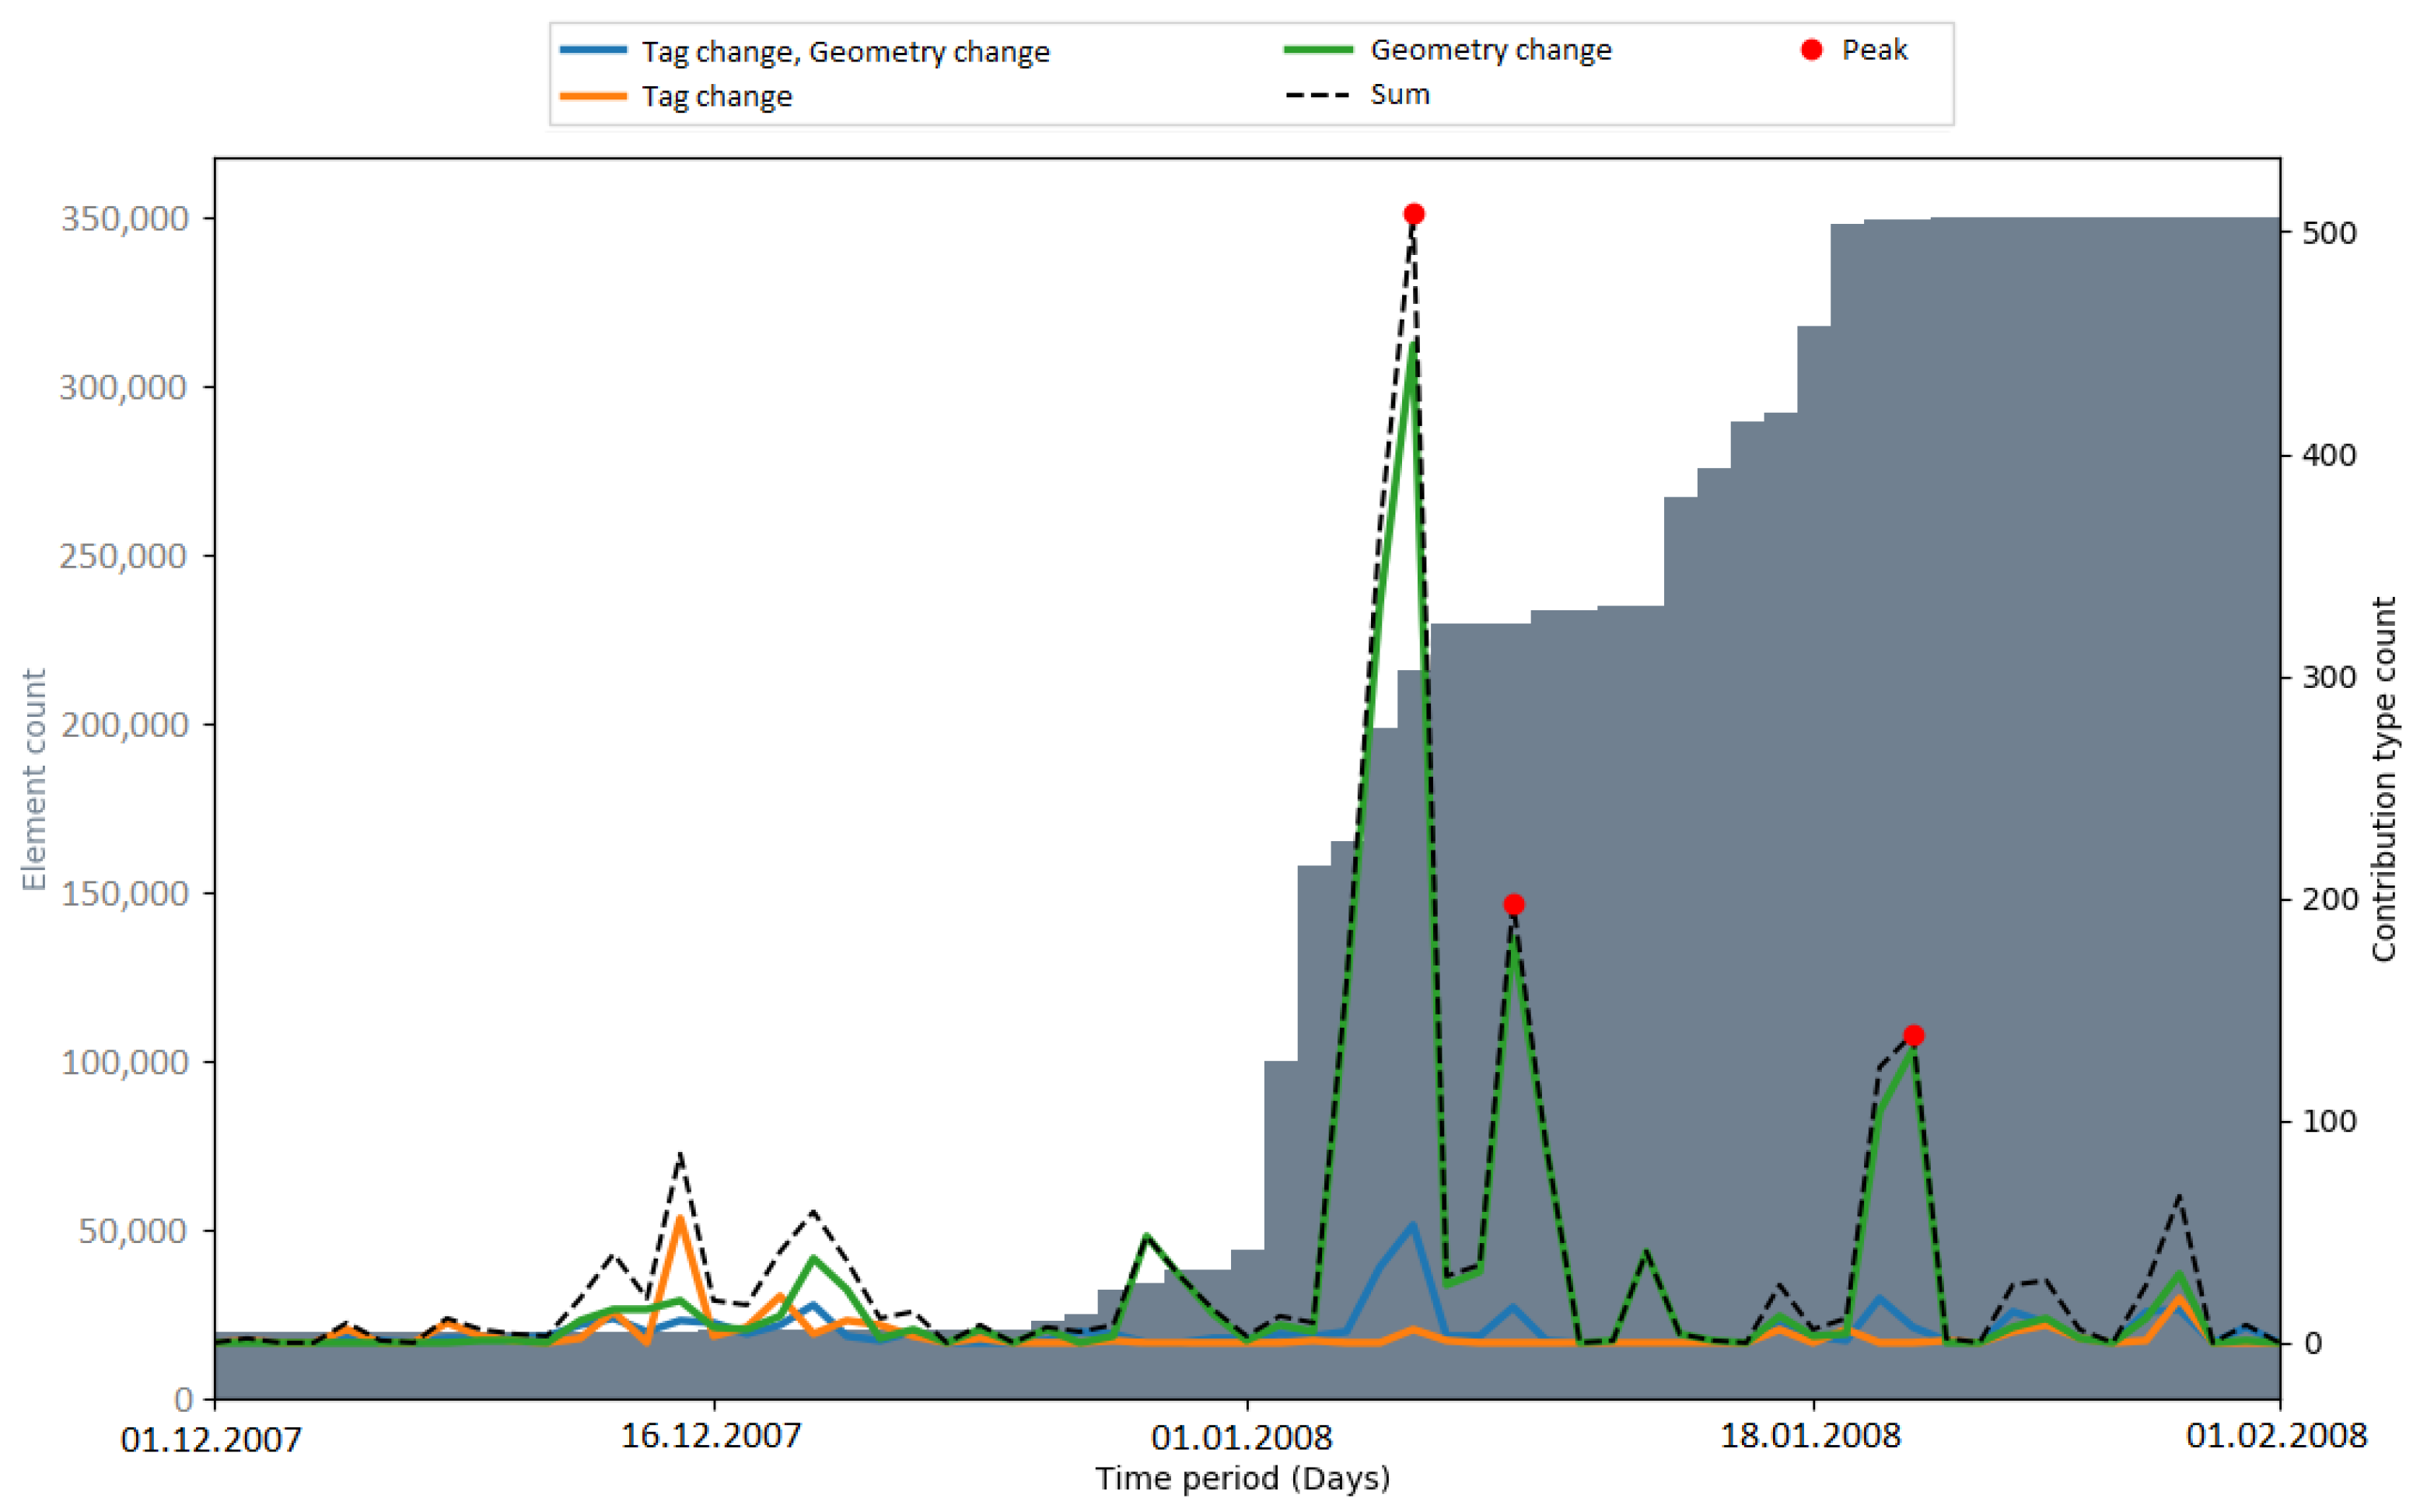
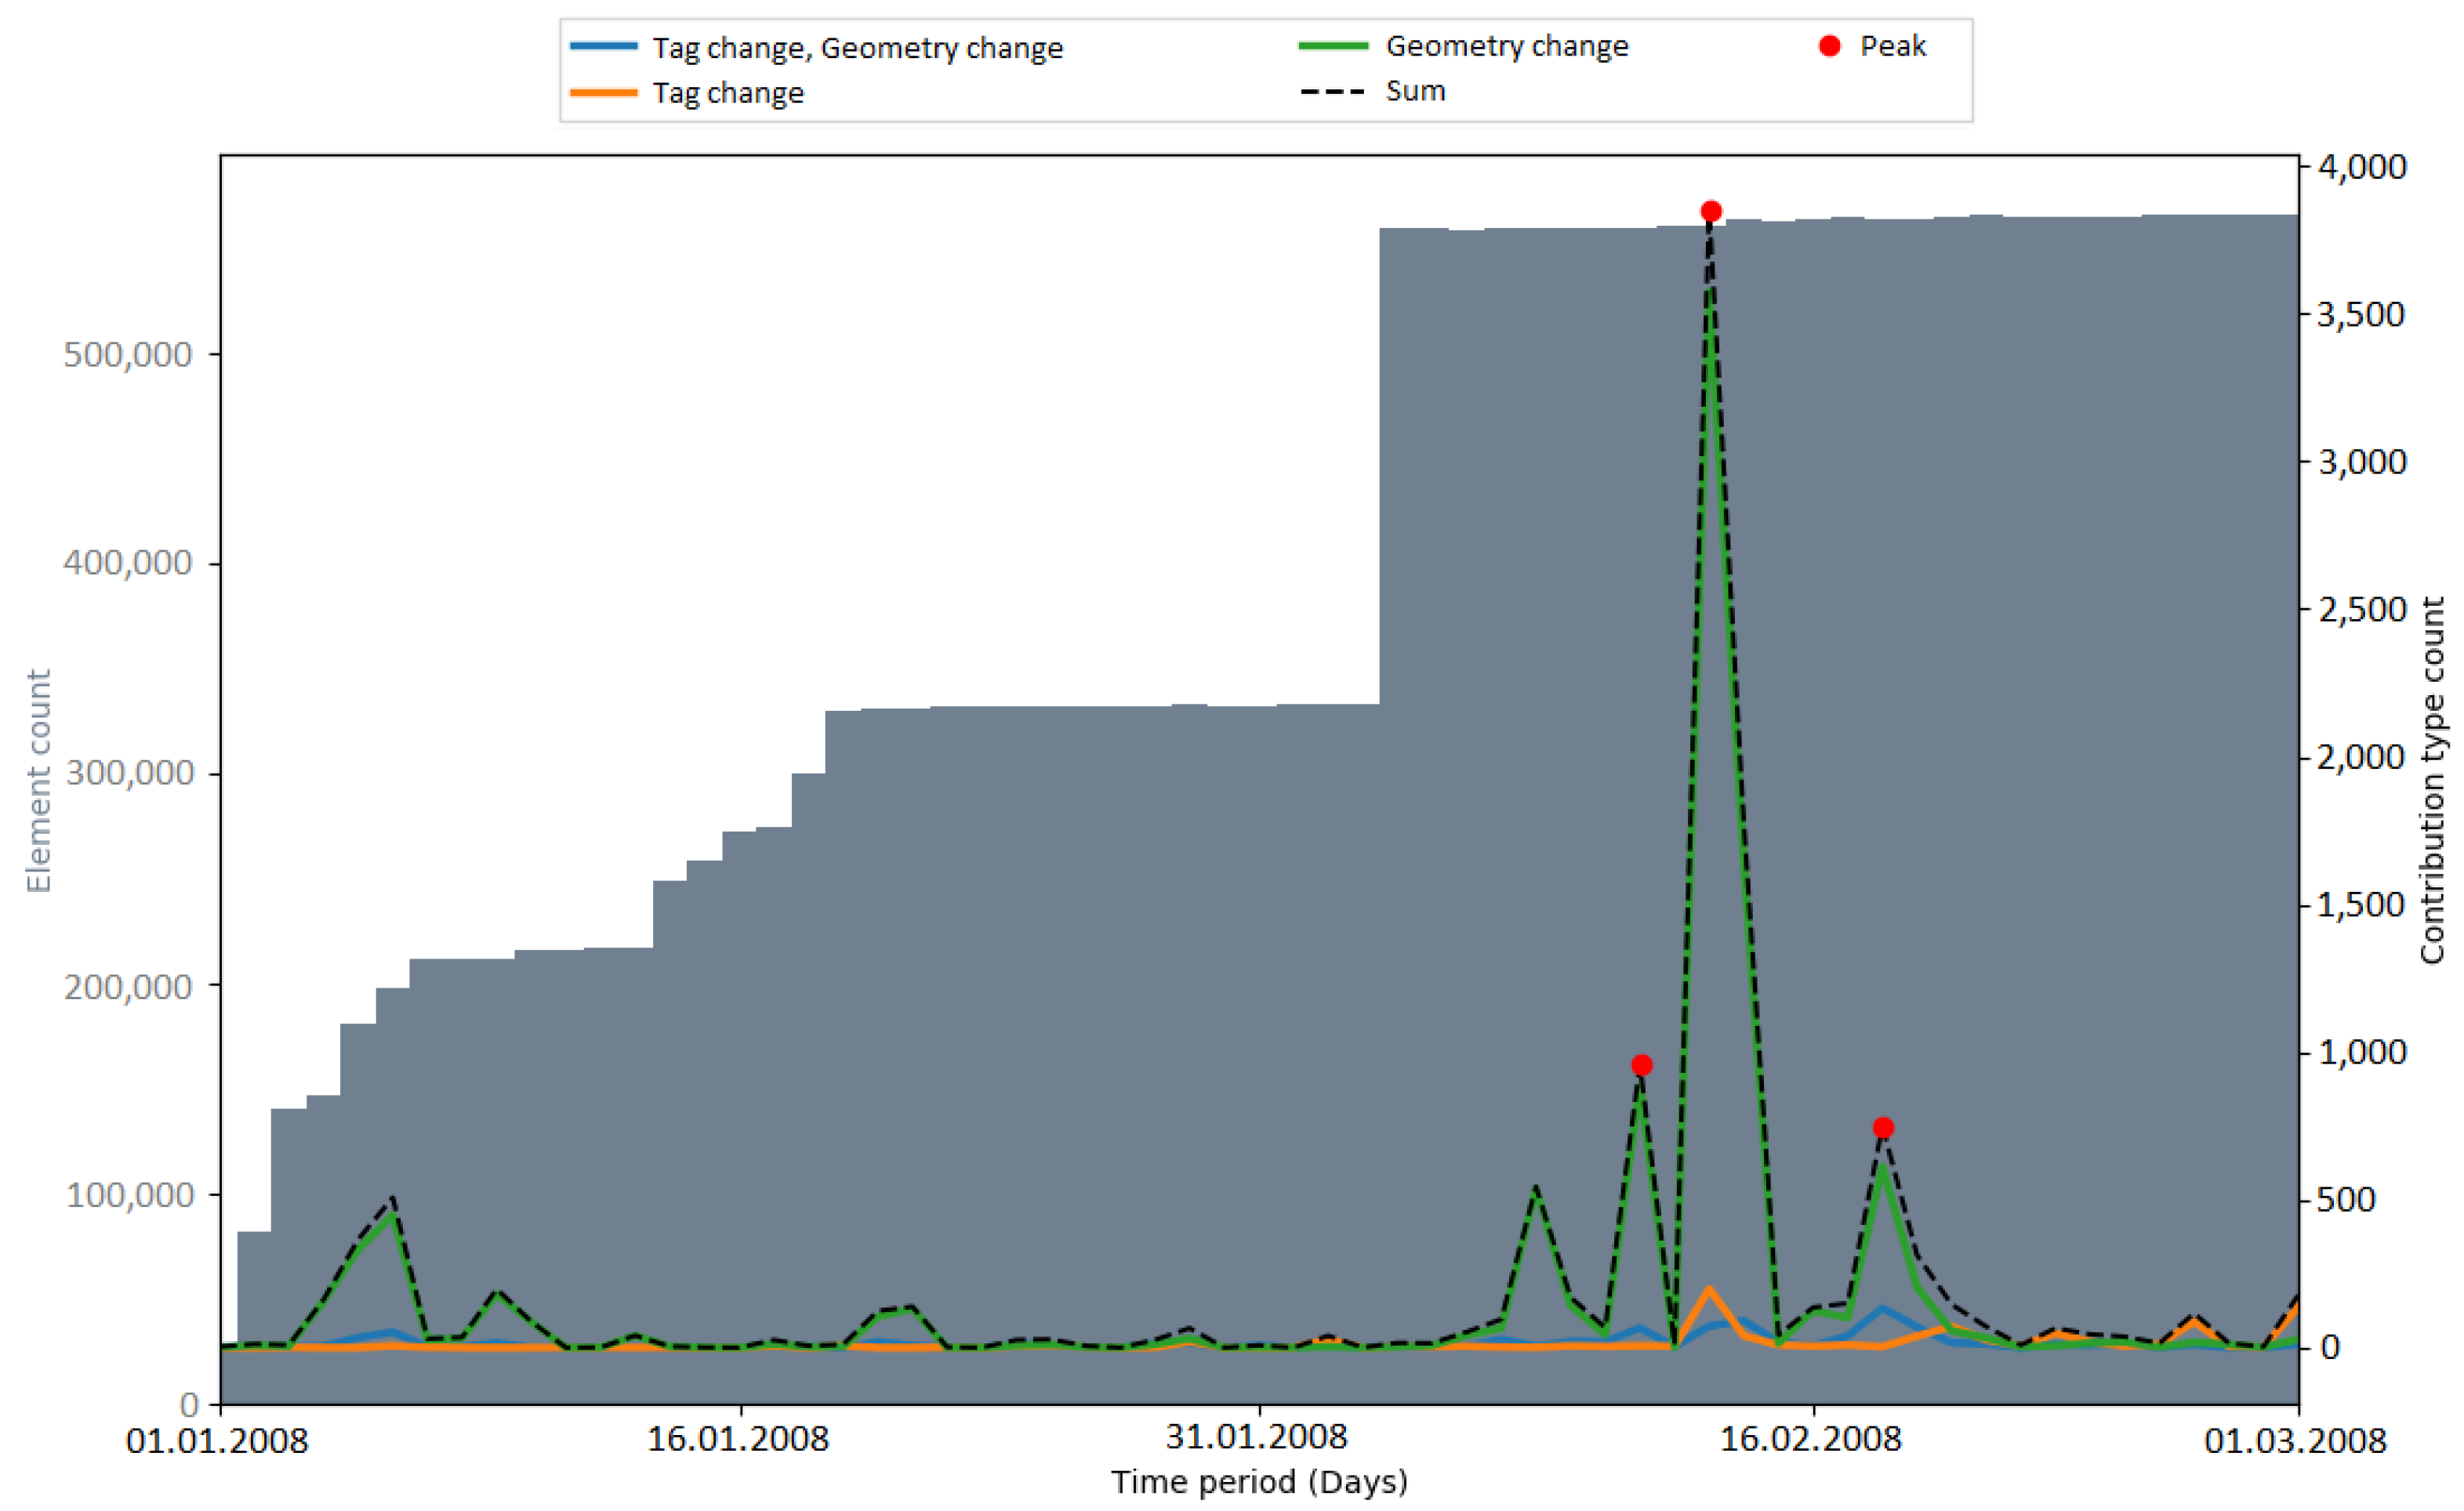
37]). However, there were also cases where the number of tag keys grew significantly without a large data import happening before—for example, towards the end of the observation period of the building import (see Figure A22) and during the observation period without a large data import in India (see Figure A23). More research is needed to determine the reasons for these sudden increases.
Recapitulating, it was found that the number of unique tag keys grew continuously during all of the observed time intervals. Some of the imports (e.g., PGS import, AND imports) introduced a large amount of new tag keys to OSM in a short amount of time. However, this was a logical consequence, given that the metadata of the external data source were mapped to OSM tag keys. Apart from this fact, no specific impact of large data imports on the development of tag keys was discovered. Since large data imports add a lot of information to OSM, it would make sense to look at the semantics of the tag keys in more detail, rather than the quantities. This could be addressed in a study focusing on the semantic changes of OSM tags during or after a large data import.

4.2. Challenges

The OSM community agreed on using conventions and best practices for creating, updating and deleting data [51]. However, no one has to use them. Anyone can take part in OSM, which results in a heterogeneous data set. Given this heterogeneity, tradeoffs have to be made, for example, if one wants to filter OSM data. Typos in tag keys or tag values could lead to their subsequent exclusion, thereby influencing the final result.
Another challenge was the identification and definition of metrics which were suitable for analysing the impact of large data import, without limiting the scope to a specific import.
The determination of the observation periods for the imports also proved to be challenging. The interval had to be limited, so the analysis would not be influenced by other imports or events. Moreover, the majority amount of data had to be imported within the interval for analysing the impact on OSM.
Due to the heterogeneity of OSM data and the complexity of OSM in general, the interpretation of the results was challenging. In OSM, many aspects happen or can happen independently of each other: for example, data imports and other community events such as mapping marathons. This fact has to be kept in mind during the evaluation of the results.

4.3. Limitations

In this study, only the time period was investigated where approximately 80% of the data were added. Therefore, potential influences and impacts outside the observation periods have not been considered.
For the computation of the contributor activity, all contribution types (i.e., creation, deletion, tag changes and geometry changes) were included to get a general understanding of the number of active users per timestamp. As a consequence, contributors who were deleting data were weighted as much as users who were creating or updating elements.
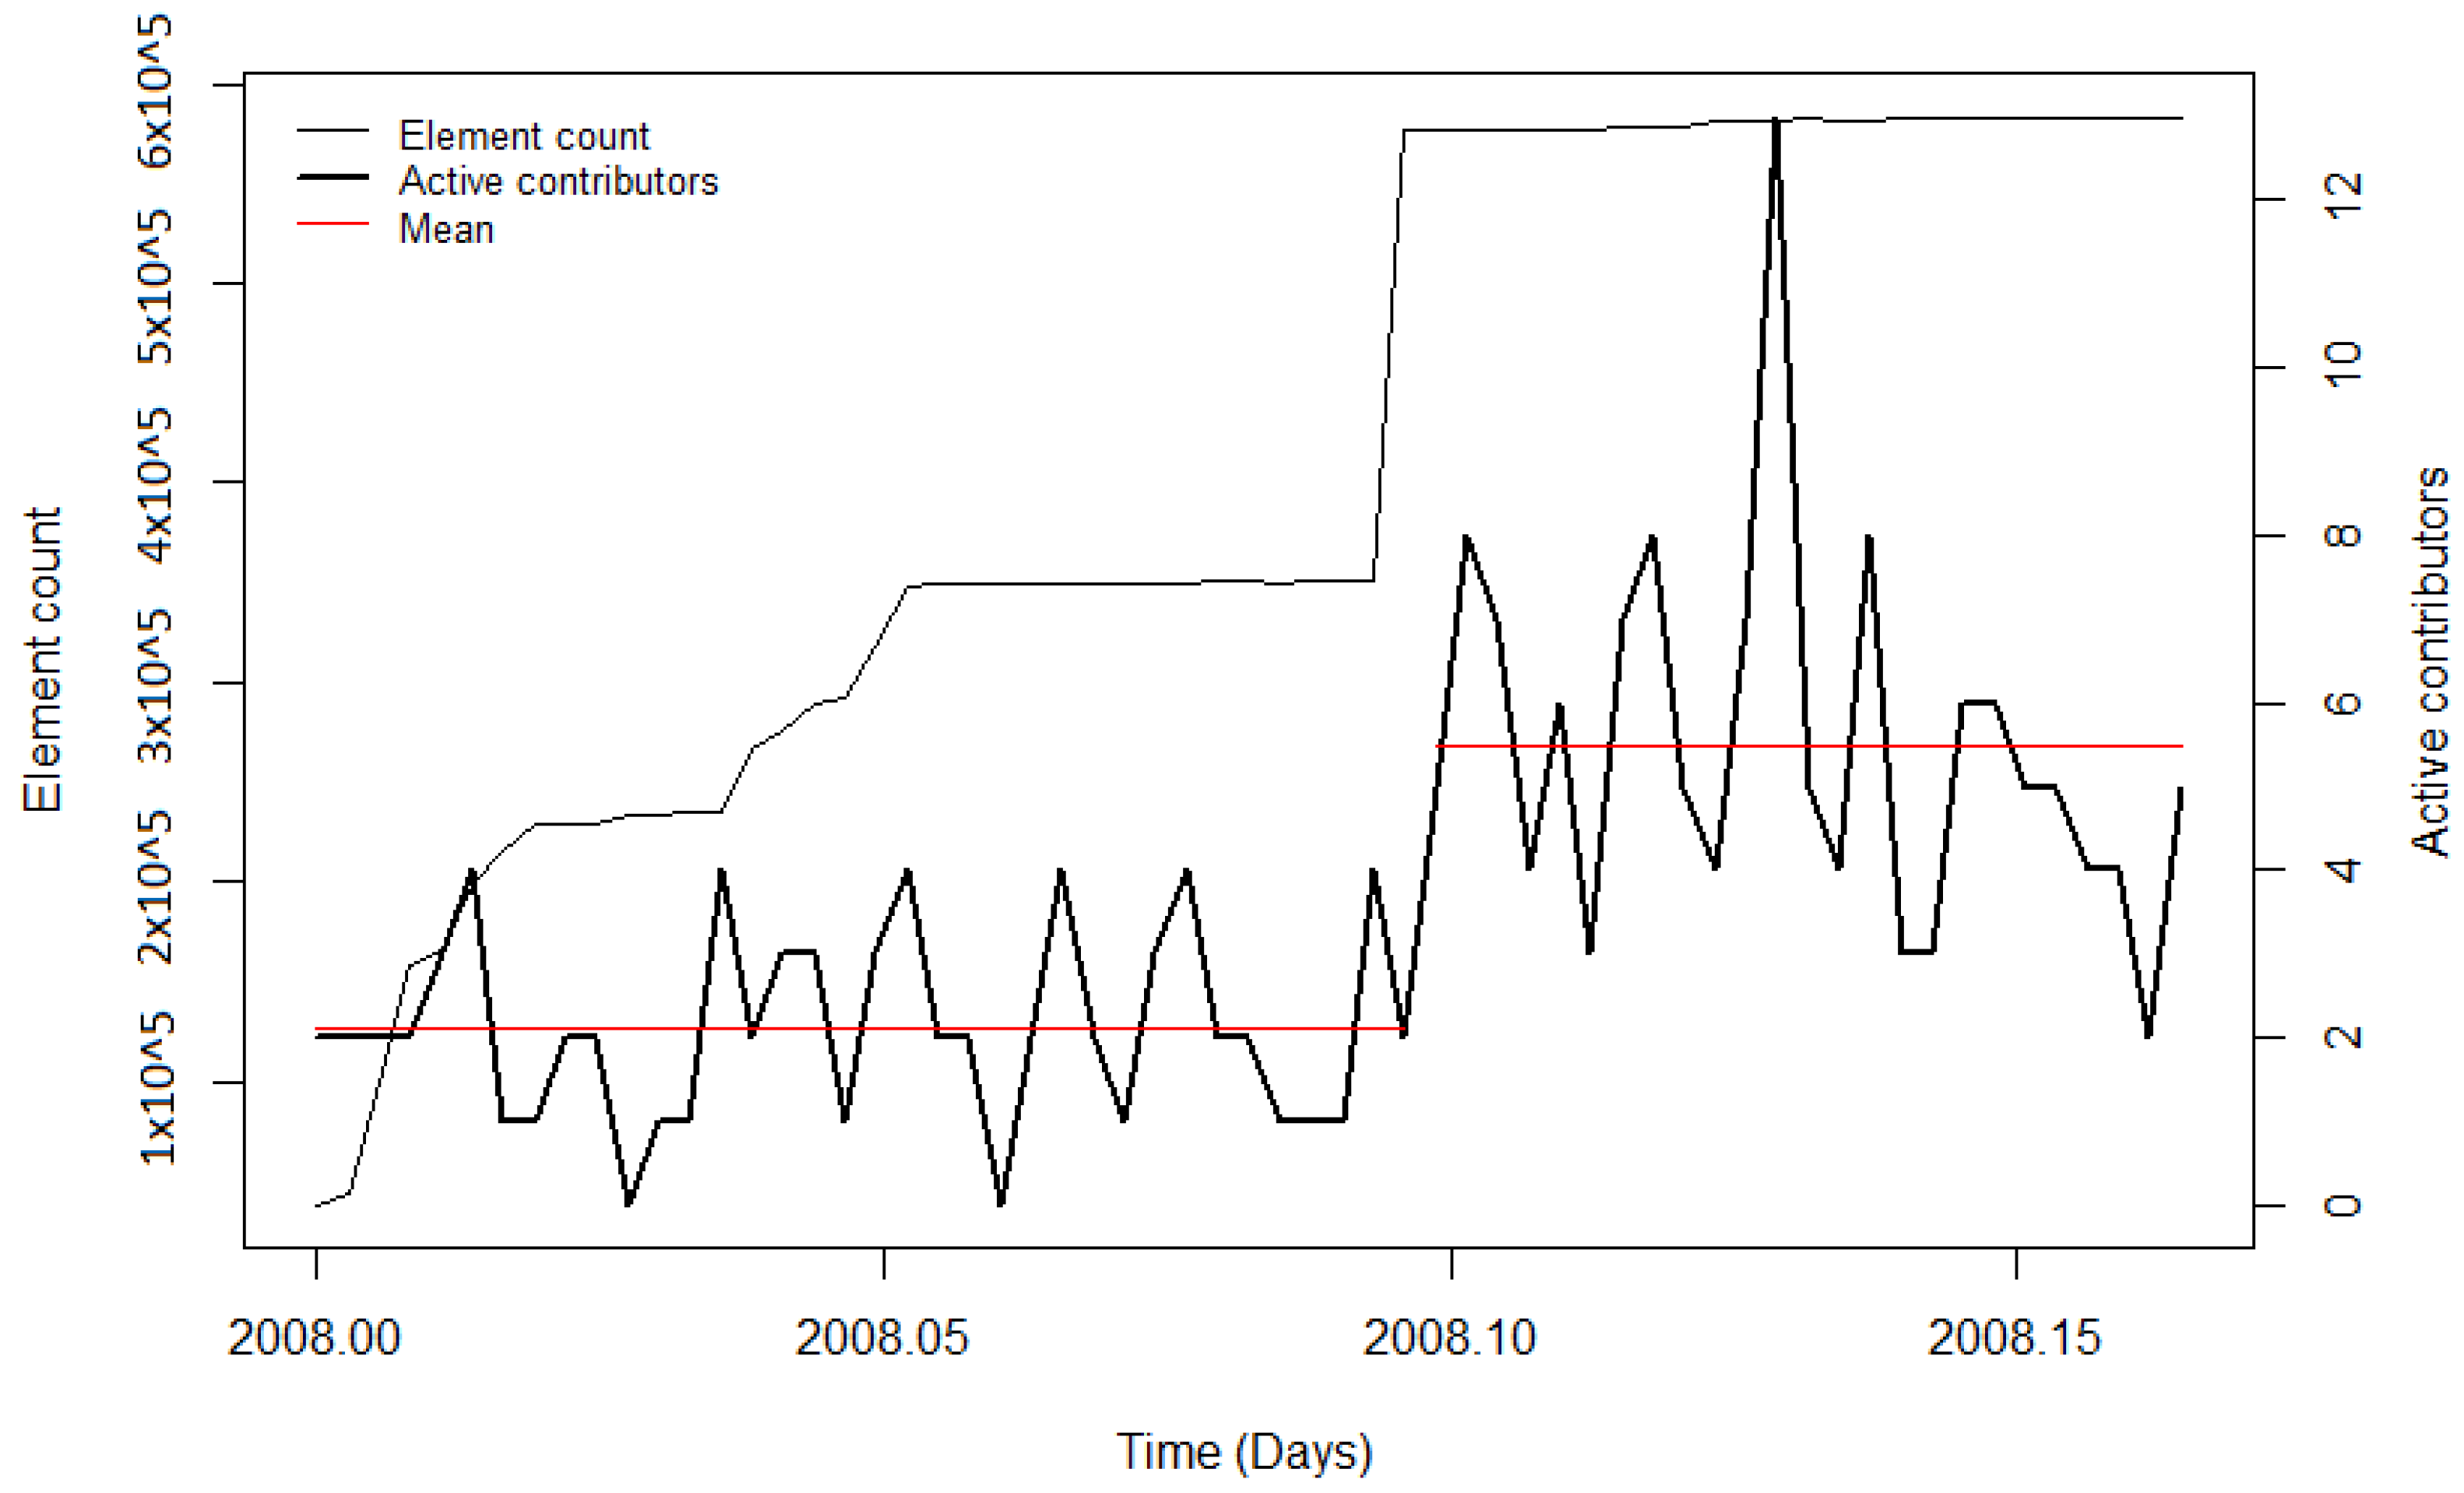
The changepoint detection was used to compute the most significant changepoint in the observation period. For most of the imports, this approach provided useful results which showed the distinct changes of the contributor activity during or after the import. However, for imports such as the 3dShapes import or the BAG import, the development of the user activity was more complex. During the 3dShapes import, the contributor activity was increasing with the start of the import, and dropped down after most of the data were imported. Then, the contributor activity increased again. A similar pattern could be seen during the BAG import, where the contributor activity increased throughout the conduction of the import but decreased afterwards. By computing only one changepoint, these processes were simplified. Additionally, other OSM events could have influenced the changepoint detection. However, this problem is omnipresent when working with OSM data.
The algorithm for finding peaks in the development of contribution types used a multiple of the mean as the detection criterion. Therefore, other OSM events which happened in the same time period might have been detected as a peak, even though they were maybe not related to the import. Moreover, also peaks that happened before an import but within the observation period were counted. Additionally, more analysis is needed to investigate the peaks in more detail to ensure that the peaks are directly related to the import.
For the import, dedicated user accounts have to be used for importing data into OSM. These accounts were included in the results. Moreover, the differences in the total number of contributors who were involved in the imports (e.g., AND import in India with 18 contributors; AND import in the Netherlands with 108 contributors) have to be considered when evaluating and comparing results.
Furthermore, this study did not distinguish between different types of large imports (e.g., automatically or manually conducted imports, or a combination of both). The quantity of imported data was the only criterion for the selection.

5. Conclusions

This study presented an approach for getting a deeper understanding about the impact of large data imports in OpenStreetMap by investigating large data imports in the Netherlands and India.
The results were manifold. It was found that for most of the large data imports which were analysed, the contributor activity increased during or after the conduction of the import. Looking at the imports in the early stage of OSM, especially the AND imports in 2007 and 2008, one can see that significantly more contributors were active than before. Imports which happened at a later stage did not show such a strong impact. During the BAG import in the Netherlands and the building import in India, the number of contributors increased. However, after most of the data were imported, the contributor activity slightly decreased again. Nonetheless, one can see that during a large data import the number of unique active contributors rose.
The analysis of the contributor engagement pointed out that the majority of users who were involved in an import were import-inspired; i.e., their first contributions happened during an import. Again, this finding supports the argument that with large data imports, more contributors were actively joining the project. However, mappers who were active beforehand were more likely to keep contributing in the time after the import was concluded. Therefore the study showed that already activate mappers were not driven away from the project. This study did not differentiate between dedicated user accounts which were created only for importing data and regular user accounts which need to be considered when reasoning about the findings.
Regarding the contribution patterns and the development of tag keys, no specific impact of large data imports was found in this study. The number of unique tag keys increased as the number of elements increased, given that external information was mapped to OSM tags. More research is needed to understand how the community is changing OSM data after a large data import.
It could not be confirmed that an import has exclusively negative impacts on OSM—not on the contributor activity, nor the contributor engagement nor the contribution patterns—which indicates that the OSM community and the project in general did not suffer from these imports. With more active contributors and a larger community, the actuality of the data is constituted, and therefore, the quality and the applications of the data improve. The worry of the OSM community that data imports drive active contributors away from the project could not be confirmed.
The study considered the impact of large data imports from a data perspective on a small subset of imports that were conducted. For future research, the analysis of different data imports might also incorporate other aspects of OSM—for example, community events or mapping events and how they are related to imports. The investigation of automated processes, e.g., scripts or bots, could lead to better understanding about how large chunks of imported data are changed. Moreover, the phase of OSM in which an import is conducted could be analysed more thoroughly. This might help to understand if an import could be performed to also support the establishment or growth of a community in a specific region. Additionally, in that regard, the effect of the media or the OSM community creating awareness about data donations and respective data imports needs to be investigated. Additionally, the analysis of OSM contributors could be extended, for example, by considering the locations of contributors who are involved in an import process. Emerging spatial patterns could help to understand how local communities are developing during an import. The attributes of imported elements and how they are evolving over time could be analysed with a focus on the semantics of the data.
The findings of this study might support researchers in the field of OSM or VGI or those in the OSM community. Future imports could be discussed more thoroughly to evaluate the possible potentials and benefits. Sustainable plans could be made to keep contributors motivated after a large data import, eventually leading to a more stable community which maintains one of the most prominent VGI projects in the world.

Supplementary Materials

The source code for the analyses can be obtained from the public git repository at https://github.com/RaphaelW1tt/osm-imports. The OpenStreetMap data extracted during the analyses potentially contain personal data. It is therefore available from the authors only. The presented study is based on the Master thesis by Raphael Witt titled “Analysing the Impact of large Data Imports in OpenStreetMap” available from the author.

Author Contributions

Conceptualisation, Raphael Witt and Lukas Loos; methodology, Raphael Witt; software, Raphael Witt; validation, Raphael Witt and Lukas Loos; formal analysis, Raphael Witt; investigation, Raphael Witt; resources, Raphael Witt and Lukas Loos; data curation, Raphael Witt; writing—original draft preparation, Raphael Witt and Lukas Loos; writing—review and editing, Raphael Witt, Lukas Loos and Alexander Zipf; visualisation, Raphael Witt; supervision, Lukas Loos and Alexander Zipf; project administration, Raphael Witt; funding acquisition, Alexander Zipf. All authors have read and agreed to the published version of the manuscript.

Funding

This research was partially funded by the Klaus Tschira Stiftung.

Data Availability Statement

For setting up the OSHDB, please refer to the following manual: https://github.com/GIScience/oshdb/tree/master/documentation/first-steps. The OSM history file of the Netherlands was downloaded from Geofabrik (https://osm-internal.download.geofabrik.de/europe/netherlands.html, accessed on 15 October 2019) (size: 2.05 Gigabyte (GB)). Only data from the European mainland were used for the analysis of the Netherlands in this study. The OSM history file of India was also downloaded from Geofabrik (https://osm-internal.download.geofabrik.de/asia/india.html, accessed on 15 October 2019)) (size: 964 Megabyte (MB)). To download OSM history files, an OSM user account is needed. For transforming the OSM history data files into OSH databases, please refer to the following steps: https://github.com/GIScience/oshdb/tree/master/oshdb-etl.

Conflicts of Interest

The authors declare no conflict of interest. The funders had no role in the design of the study.

Abbreviations

The following abbreviations are used in this manuscript:
ANDAutomotive Navigation Data.
BAGBasisregistratie Adressen en Gebouwen.
CPChangepoint.
GISGeoinformation Science.
GNSSGlobal Navigation Satellite System.
IDIdentifier.
ITInformation technology.
KPSSKwiatkowski-Phillips-Schmidt-Shin test.
OSHDBOpenStreetMap History Database.
OSMOpenStreetMap.
PGSPrototype Global Shoreline.
TIGERTopologically Integrated Geographic Encoding and Referencing system.
VGIVolunteered Geographical Information.

Appendix A. Data Imports

A dedicated page in the OSM wiki lists import guidelines and lessons learned to avoid badly-managed imports (https://wiki.openstreetmap.org/wiki/Import/Guidelines, accessed on 16 November 2019). Several steps have to be gone through before importing data: for example, getting permission by the local community, getting license approval (the external data source needs to be compliant to the OSM license) and writing documentation about the progress [10]. If a new data source is made available or published and a contributor thinks that OSM would benefit from importing the data set, the contributor has to follow these guidelines. Moreover, imports normally have a specific source tag—for example source=AND for the AND import (https://wiki.openstreetmap.org/wiki/AND_data, accessed on 16 November 2019) in the Netherlands—which indicates the origin of the data. However, this is not mandatory and some imported elements do not have this indicator (e.g., in the elements from the MassGIS buildings import in the United States, the source information was included in the changeset comments (https://wiki.openstreetmap.org/wiki/MassGIS_Buildings_Import, accessed on 16 November 2019)) [10].
Data imports can be executed in different ways—for example, automatically with the help of tools, scripts, and bots, or they are carried out manually. A combination of both techniques is also possible. This depends mostly on the size of the external data source [10]. An import of an external data set involves a merging process between the data set and OSM, because not only do the geographic data have to be added, but the semantic information associated with them do as well [10].
Concluded imports and planned imports or potential data sources are listed in the wiki for the community (https://wiki.openstreetmap.org/wiki/Import/Catalogue, accessed on 17 November 2019). Moreover, certain imports are the subjects of blog posts to inform the community about experiences and lessons learned—for example, the landcover import in Sweden (https://www.openstreetmap.org/user/Atakua/diary/368829, accessed on 17 November 2019).
Tagging schemes develop over time and are discussed and agreed upon within the community [19]. However, imported data can introduce new tag keys to OSM, which might not be of use for the project (e.g., IDs from the external data source). This adds unnecessary information to OSM which should be avoided, considering the memory which is consumed by these redundant tag keys [37]. In the wiki, it is stated that OSM is only interested in what is verifiable (meaning that information should be considered either true or false by other contributors).

Appendix B. Methodology

The cross-correlation between the number of elements and the number of active contributors was calculated to measure the strength of their relationship. A significant positive correlation would indicate that if a large number of elements is added to OSM, more contributors are consequently involved in the project (i.e., a significant impact on OpenStreetMap). The statistical programming language R was used for the calculation [52]. Before the cross-correlation was computed, the time series were checked for stationarity. Trends or seasonality could spuriously influence the correlation. Therefore, the KPSS (Kwiatkowski–Phillips–Schmidt–Shin) test was carried out to check for stationarity [53]. If the null hypothesis of the KPSS test was rejected, the time series was differenced and the test repeated. The procedure is displayed by Figure A1. If the null hypothesis of the KPSS test was rejected for the second-order difference of a time series, the calculation of the cross-correlation was stopped, given that differences of a higher order than two rarely make sense in practice [54]. If stationarity was given for both time series, the cross-correlation was calculated.
Figure A1. Approach for determining stationarity of the time series.
Ijgi 10 00528 g0a1
During the cross-correlation analysis, it was found that the time series of the count of elements during an import could not be stationarised by differencing the data, given the nonlinear growth of elements.

Appendix C. Diagrams

Figure A2. Contributor activity during the 3dShapes import.
Ijgi 10 00528 g0a2
Figure A3. Contributor activity during the BAG import.
Ijgi 10 00528 g0a3
Figure A4. Contributor activity during the observation period without a large data import in the Netherlands.
Ijgi 10 00528 g0a4
Figure A5. Contributor activity during the PGS import.
Ijgi 10 00528 g0a5
Figure A6. Contributor activity during the building import.
Ijgi 10 00528 g0a6
Figure A7. Contributor activity during the observation period without a large data import in India.
Ijgi 10 00528 g0a7
Figure A8. Contribution types during the AND import.
Ijgi 10 00528 g0a8
Figure A9. Contribution types during the 3dShapes import.
Ijgi 10 00528 g0a9
Figure A10. Contribution types during the BAG import.
Ijgi 10 00528 g0a10
Figure A11. Contribution types during the observation period without a large data import in the Netherlands.
Ijgi 10 00528 g0a11
Figure A12. Contribution types during the PGS import.
Ijgi 10 00528 g0a12
Figure A13. Contribution types during the AND import.
Ijgi 10 00528 g0a13
Figure A14. Contribution types during the building import.
Ijgi 10 00528 g0a14
Figure A15. Contribution types during the observation period without a large data import in India.
Ijgi 10 00528 g0a15
Figure A16. Number of tag keys during the AND import.
Ijgi 10 00528 g0a16
Figure A17. Number of tag keys during the 3dShapes import.
Ijgi 10 00528 g0a17
Figure A18. Number of tag keys during the BAG import.
Ijgi 10 00528 g0a18
Figure A19. Number of tag keys during the observation period without a large data import in the Netherlands.
Ijgi 10 00528 g0a19
Figure A20. Number of tag keys during the PGS import.
Ijgi 10 00528 g0a20
Figure A21. Number of tag keys during the AND import.
Ijgi 10 00528 g0a21
Figure A22. Number of tag keys during the building import.
Ijgi 10 00528 g0a22
Figure A23. Number of tag keys during the observation period without a large data import in India.
Ijgi 10 00528 g0a23

References

  1. OpenStreetMap. About OpenStreetMap. Available online: https://wiki.openstreetmap.org/wiki/About_OpenStreetMap (accessed on 6 December 2019).
  2. Goodchild, M.F. Citizens as sensors: The world of volunteered geography. GeoJournal 2007, 69, 211–221. [Google Scholar] [CrossRef] [Green Version]
  3. OpenStreetMap. Stats. Available online: https://wiki.openstreetmap.org/wiki/Stats (accessed on 28 November 2019).
  4. Coleman, D.J.; Georgiadou, Y.; Labonte, J. Volunteered Geographic Information: The Nature and Motivation of Produsers. Int. J. Spat. Data Infrastruct. Res. 2009, 4, 332–358. [Google Scholar] [CrossRef]
  5. Antoniou, V.; Skopeliti, A. Measures and indicators of vgi quality: An overview. ISPRS Ann. Photogramm. Remote Sens. Spat. Inf. Sci. 2015, 2, 345–351. [Google Scholar] [CrossRef] [Green Version]
  6. Mooney, P.; Corcoran, P.; Winstanley, A.C. Towards quality metrics for OpenStreetMap. In Proceedings of the 18th SIGSPATIAL International Conference on Advances in Geographic Information Systems, San Jose, CA, USA, 2–5 November 2010; pp. 514–517. [Google Scholar] [CrossRef] [Green Version]
  7. Neis, P.; Zielstra, D. Recent Developments and Future Trends in Volunteered Geographic Information Research: The Case of OpenStreetMap. Future Internet 2014, 6, 76–106. [Google Scholar] [CrossRef] [Green Version]
  8. Elwood, S. Geographic information science: Emerging research on the societal implications of the geospatial web. Prog. Hum. Geogr. 2010, 34, 349–357. [Google Scholar] [CrossRef]
  9. Grinberger, A.Y.; Schott, M.; Raifer, M.; Troilo, R.; Zipf, A. The Institutional Contexts of Volunteered Geographic Information Production: A Quantitative Exploration of OpenStreetMap Data. In Proceedings of the Geographical and Cultural Aspects of Geo-Information: Issues and Solutions (AGILE 2019 Workshop), Limassol, Cyprus, 17 June 2019. [Google Scholar] [CrossRef]
  10. OpenStreetMap. Import. Available online: https://wiki.openstreetmap.org/wiki/Import (accessed on 16 November 2019).
  11. Amos, M. Imports and the Community. Available online: https://web.archive.org/web/20140613144957/http://www.asklater.com/matt/wordpress/2009/09/imports-and-the-community/index.html (accessed on 12 January 2020).
  12. Amos, M. Imports and the Community II. Available online: https://web.archive.org/web/20140613144939/http://www.asklater.com/matt/wordpress/2009/09/imports-and-the-community-ii/index.html (accessed on 12 January 2020).
  13. Vekemans, S. [Imports] Imports vs. Converting Data. Available online: https://lists.openstreetmap.org/pipermail/imports/2010-May/000583.html (accessed on 16 January 2020).
  14. Juhász, L.; Hochmair, H.H. OSM data import as an outreach tool to trigger community growth? A case study in Miami. ISPRS Int. J. Geo-Inf. 2018, 7, 113. [Google Scholar] [CrossRef] [Green Version]
  15. Zielstra, D.; Hochmair, H.H.; Neis, P. Assessing the effect of data imports on the completeness of openstreetmap—A United States case study. Trans. GIS 2013, 17, 315–334. [Google Scholar] [CrossRef] [Green Version]
  16. OpenStreetMap. Applications of OpenStreetMap. Available online: https://wiki.openstreetmap.org/wiki/Applications_of_OpenStreetMaps (accessed on 15 November 2019).
  17. Zipf, A.; Zielstra, D. Quantitative Studies on the Data Quality of OpenStreetMap in Germany. Proc. Gisci. 2010, 3. [Google Scholar]
  18. Budhathoki, N.R.; Haythornthwaite, C. Motivation for Open Collaboration: Crowd and Community Models and the Case of OpenStreetMap. Am. Behav. Sci. 2013, 57, 548–575. [Google Scholar] [CrossRef]
  19. Haklay, M.; Weber, P. OpenStreetMap: User-generated street maps. IEEE Pervasive Comput. 2008, 7, 12–18. [Google Scholar] [CrossRef] [Green Version]
  20. Ma, D.; Sandberg, M.; Jiang, B. Characterizing the Heterogeneity of the OpenStreetMap Data and Community. ISPRS Int. J. Geo-Inf. 2015, 4, 535–550. [Google Scholar] [CrossRef]
  21. Keßler, C.; de Groot, T.R.A. Trust as a Proxy Measure for the Quality of Volunteered Geographic Information in the Case of OpenStreetMap. Lect. Notes Geoinf. Cartogr. 2013, 2013, 225–245. [Google Scholar] [CrossRef]
  22. Degrossi, L.C.; de Albuquerque, J.P.; dos Santos Rocha, R.; Zipf, A. A taxonomy of quality assessment methods for volunteered and crowdsourced geographic information. Trans. GIS 2018, 22, 542–560. [Google Scholar] [CrossRef]
  23. Yan, Y.; Feng, C.C.; Huang, W.; Fan, H.; Wang, Y.C.; Zipf, A. Volunteered geographic information research in the first decade: A narrative review of selected journal articles in GIScience. Int. J. Geogr. Inf. Sci. 2020, 34, 1765–1791. [Google Scholar] [CrossRef]
  24. Arsanjani, J.J.; Mooney, P.; Helbich, M.; Zipf, A. An Exploration of Future Patterns of the Contributions to OpenStreetMap and Development of a Contribution Index. Trans. GIS 2015, 19, 896–914. [Google Scholar] [CrossRef]
  25. Barron, C.; Neis, P.; Zipf, A. A Comprehensive Framework for Intrinsic OpenStreetMap Quality Analysis. Trans. GIS 2014, 18, 877–895. [Google Scholar] [CrossRef]
  26. Minghini, M.; Brovelli, M.A.; Frassinelli, F. An open source approach for the intrinsic assessment of the temporal accuracy, up-to-dateness and lineage of openstreetmap. Int. Arch. Photogramm. Remote Sens. Spat. Inf. Sci. ISPRS Arch. 2018, 42, 147–154. [Google Scholar] [CrossRef] [Green Version]
  27. Nasiri, A.; Ali Abbaspour, R.; Chehreghan, A.; Jokar Arsanjani, J. Improving the Quality of Citizen Contributed Geodata through Their Historical Contributions: The Case of the Road Network in OpenStreetMap. ISPRS Int. J. Geo-Inf. 2018, 7, 253. [Google Scholar] [CrossRef] [Green Version]
  28. Neis, P.; Goetz, M.; Zipf, A. Towards Automatic Vandalism Detection in OpenStreetMap. ISPRS Int. J. Geo-Inf. 2012, 1, 315–332. [Google Scholar] [CrossRef]
  29. Gröchenig, S.; Brunauer, R.; Rehrl, K. Digging into the history of VGI data-sets: Results from a worldwide study on OpenStreetMap mapping activity. J. Locat. Based Serv. 2014, 8, 198–210. [Google Scholar] [CrossRef]
  30. Yang, A.; Fan, H.; Jing, N.; Sun, Y.; Zipf, A. Temporal analysis on contribution inequality in openstreetmap: A comparative study for four countries. ISPRS Int. J. Geo-Inf. 2016, 5, 5. [Google Scholar] [CrossRef]
  31. Yang, A.; Fan, H.; Jing, N. Amateur or professional: Assessing the expertise of major contributors in openstreetmap based on contributing behaviors. ISPRS Int. J. Geo-Inf. 2016, 5, 21. [Google Scholar] [CrossRef]
  32. Neis, P.; Zielstra, D.; Zipf, A. Comparison of Volunteered Geographic Information Data Contributions and Community Development for Selected World Regions. Future Internet 2013, 5, 282–300. [Google Scholar] [CrossRef] [Green Version]
  33. Schott, M.; Grinberger, A.Y.; Lautenbach, S.; Zipf, A. The Impact of Community Happenings in OpenStreetMap—Establishing a Framework for Online Community Member Activity Analyses. ISPRS Int. J. Geo-Inf. 2021, 10, 164. [Google Scholar] [CrossRef]
  34. Grinberger, A.Y.; Schott, M.; Raifer, M.; Zipf, A. An analysis of the spatial and temporal distribution of large-scale data production events in OpenStreetMap. Trans. GIS 2021, 25, 622–641. [Google Scholar] [CrossRef]
  35. Mooney, P.; Corcoran, P. Has OpenStreetMap a role in Digital Earth applications? Int. J. Digit. Earth 2014, 7, 534–553. [Google Scholar] [CrossRef] [Green Version]
  36. OpenStreetMap. Import/Catalogue. Available online: https://wiki.openstreetmap.org/wiki/Import/Catalogue (accessed on 5 December 2019).
  37. OpenStreetMap. Import/Guidelines. Available online: https://wiki.openstreetmap.org/wiki/Import/Guidelines (accessed on 20 December 2019).
  38. Topf, J.; Topf, C. Taginfo. Available online: https://taginfo.openstreetmap.org/ (accessed on 3 January 2020).
  39. Raifer, M.; Troilo, R.; Kowatsch, F.; Auer, M.; Loos, L.; Marx, S.; Przybill, K.; Fendrich, S.; Mocnik, F.B.; Zipf, A. OSHDB: A framework for spatio-temporal analysis of OpenStreetMap history data. Open Geospat. Data Softw. Stand. 2019, 4, 1–12. [Google Scholar] [CrossRef]
  40. OpenStreetMap. OSM History Dump © OpenStreetMap Contributors. Available online: https://planet.openstreetmap.org/planet/full-history/ (accessed on 15 October 2019).
  41. OpenStreetMap. AND Data. Available online: https://wiki.openstreetmap.org/wiki/AND_data (accessed on 1 December 2019).
  42. OpenStreetMap. 3dShapes. Available online: https://wiki.openstreetmap.org/wiki/3dShapes (accessed on 1 December 2019).
  43. OpenStreetMap. BAGimport. Available online: https://wiki.openstreetmap.org/wiki/BAGimport (accessed on 1 December 2019).
  44. OpenStreetMap. Prototype Global Shoreline. Available online: https://wiki.openstreetmap.org/wiki/PGS (accessed on 5 December 2019).
  45. Davidovic, N.; Mooney, P.; Stoimenov, L.; Minghini, M. Tagging in volunteered geographic information: An analysis of tagging practices for cities and urban regions in OpenStreetMap. ISPRS Int. J. Geo-Inf. 2016, 5, 232. [Google Scholar] [CrossRef] [Green Version]
  46. Killick, R.; Eckley, I.A. changepoint: An R Package for Changepoint Analysis. J. Stat. Softw. 2014, 58, 1–19. [Google Scholar] [CrossRef] [Green Version]
  47. Virtanen, P.; Gommers, R.; Oliphant, T.E.; Haberland, M.; Reddy, T.; Cournapeau, D.; Burovski, E.; Peterson, P.; Weckesser, W.; Bright, J.; et al. SciPy 1.0 Contributors. SciPy 1.0: Fundamental Algorithms for Scientific Computing in Python. Nat. Methods 2020, 17, 261–272. [Google Scholar] [CrossRef] [PubMed] [Green Version]
  48. OpenStreetMap. OpenStreetMap Blog. Available online: https://blog.openstreetmap.org/2012/09/12/openstreetmap-data-license-is-odbl/ (accessed on 14 January 2020).
  49. Neis, P.; Zipf, A. Analyzing the contributor activity of a volunteered geographic information project—The case of OpenStreetMap. ISPRS Int. J. Geo-Inf. 2012, 1, 146–165. [Google Scholar] [CrossRef]
  50. OpenStreetMap. Key: AND. Available online: https://wiki.openstreetmap.org/wiki/Key:AND_nosr_r (accessed on 14 July 2021).
  51. OpenStreetMap. Editing Standards and Conventions. Available online: https://wiki.openstreetmap.org/wiki/Editing_Standards_and_Conventions (accessed on 15 July 2021).
  52. R Core Team. R: A Language and Environment for Statistical Computing; R Foundation for Statistical Computing: Vienna, Austria, 2019. [Google Scholar]
  53. Kwiatkowski, D.; Phillips, P.C.B.; Schmidt, P.; Shin, Y. Testing the null hypothesis of stationarity against the alternative of a unit root: How sure are we that economic time series have a unit root? J. Econom. 1992, 54, 159–178. [Google Scholar] [CrossRef]
  54. Hyndman, R.J.; Athanasopoulos, G. Forecasting: Principles and Practice, 2nd ed.; OTexts: Melbourne, Australia, 2018. [Google Scholar]
Figure 1. Contributions in the Netherlands.
Ijgi 10 00528 g001aIjgi 10 00528 g001b
Figure 2. Contributions in India.
Ijgi 10 00528 g002
Figure 3. Contributor activity during the AND import in the Netherlands.
Ijgi 10 00528 g003
Figure 4. Ratio of pre-existing mappers to import-inspired mappers during an import in the Netherlands.
Ijgi 10 00528 g004
Figure 5. Ratio of contributors who participated in an import to those who remained active in the Netherlands.
Ijgi 10 00528 g005
Figure 6. Contributor activity during the AND import in India.
Ijgi 10 00528 g006
Figure 7. Ratio of pre-existing mappers to import-inspired mappers during an import in India.
Ijgi 10 00528 g007
Figure 8. Ratio of contributors who participated in an import to those who remained active in India.
Ijgi 10 00528 g008
Figure 9. Numbers of detected peaks during the observation periods.
Ijgi 10 00528 g009
Table 1. Global count of the tag key sources (retrieved on 3 January 2020 ) [38].
ElementCountCount of Values
Node45,407,28689,949
Way154,529,614163,290
Relation1,082,79116,744
Table 2. Element count of the Netherlands and India (snapshot 15 October 2019) [40]. By  comparing the numbers of elements, it is clear that the data density of the Netherlands is much higher compared to that of India.
ElementCount
The NetherlandsIndia
Node161,826,787127,411,342
Way30,668,98817,173,561
Relation1,030,553176,847
Table 3. The ten commonest tag keys in September 2007 in the Netherlands.
Tag KeyCount
source3,491,884
highway1,043,941
AND_nosr_r1,025,760
name953,840
AND_nodes799,257
AND:importance_level481,967
maxspeed438,415
oneway161,836
surface117,721
bicycle95,683
Table 4. Observation period and temporal resolution for the imports. The temporal resolution depended on the duration of the observation period. Intervals longer than 12 months were carried out in weekly resolution, the remainder in daily resolution.
ImportStart TimeEnd TimeResolution
The NetherlandsAND01.08.200701.11.2007Days
3dShapes01.11.200901.03.2011Weeks
BAG01.02.201401.09.2014Days
no import01.02.201201.09.2012Days
IndiaPGS01.12.200701.02.2008Days
AND01.01.200801.03.2008Days
building01.04.201501.10.2018Weeks
no import01.02.201201.09.2012Days
Table 5. Tag keys and values used to filter out imported elements during the respective observation periods. The asterisks (*) is a placeholder for any value. If multiple tag keys were used for one import (e.g., AND imports), the filters were chained with an “OR” condition. For the periods without an import (control group), no filter was applied.
ImportTag Keys and Values for Filter
The NetherlandsANDsource=AND, AND_nosr_r=*, AND_nodes=*
3dShapessource=3dShapes, 3dshapes:ggmodelk=*
BAGsource=BAG
no import
IndiaPGSsource=PGS
ANDsource=AND, AND_a_nosr_r=*
AND_a_nosr_p=*, AND:importance_level=*
buildinghighway=*
no import
Table 6. Mean value, difference and growth rate for the contributor activity before and after each changepoint.
ImportMean ValueDifferenceGrowth Rate
Before CPAfter CP(Approx.)(Approx.)
The NetherlandsAND4.6715.8111.14238.69%
3dShapes152.22182.0929.8719.62%
BAG78.9569.85−9.1−11.52%
no import56.5462.265.7210.11%
IndiaPGS1.711.7100%
AND1.735.483.75216.52%
building220.68386.43165.7575.1%
building 1 236.63142.1−94.53−40%
building 2 138.57236.4897.9170.66%
building 3 243.16386.43143.2758.92%
no import12.5317.474.9439.44%
1 Phase 1; 2 Phase 2; 3 Phase 3.
Publisher’s Note: MDPI stays neutral with regard to jurisdictional claims in published maps and institutional affiliations.

