
Modeling Patterns in Map Use Contexts and Mobile Map Design Usability

 , ,
, , 
Abstract
:1. Introduction
- How does the evaluation of map design usability differ between users and their map use contexts?
- What are relevant map use context attributes that influence the evaluation of map design usability?
- What is the best methodology to model differences and similarities between users in their map use contexts and evaluate the map design usability?
2. Related Work
3. Experiment Methods
3.1. Participant Recruitment
3.2. Materials
3.3. Survey Structure and Procedure
3.4. Analysis
4. Results
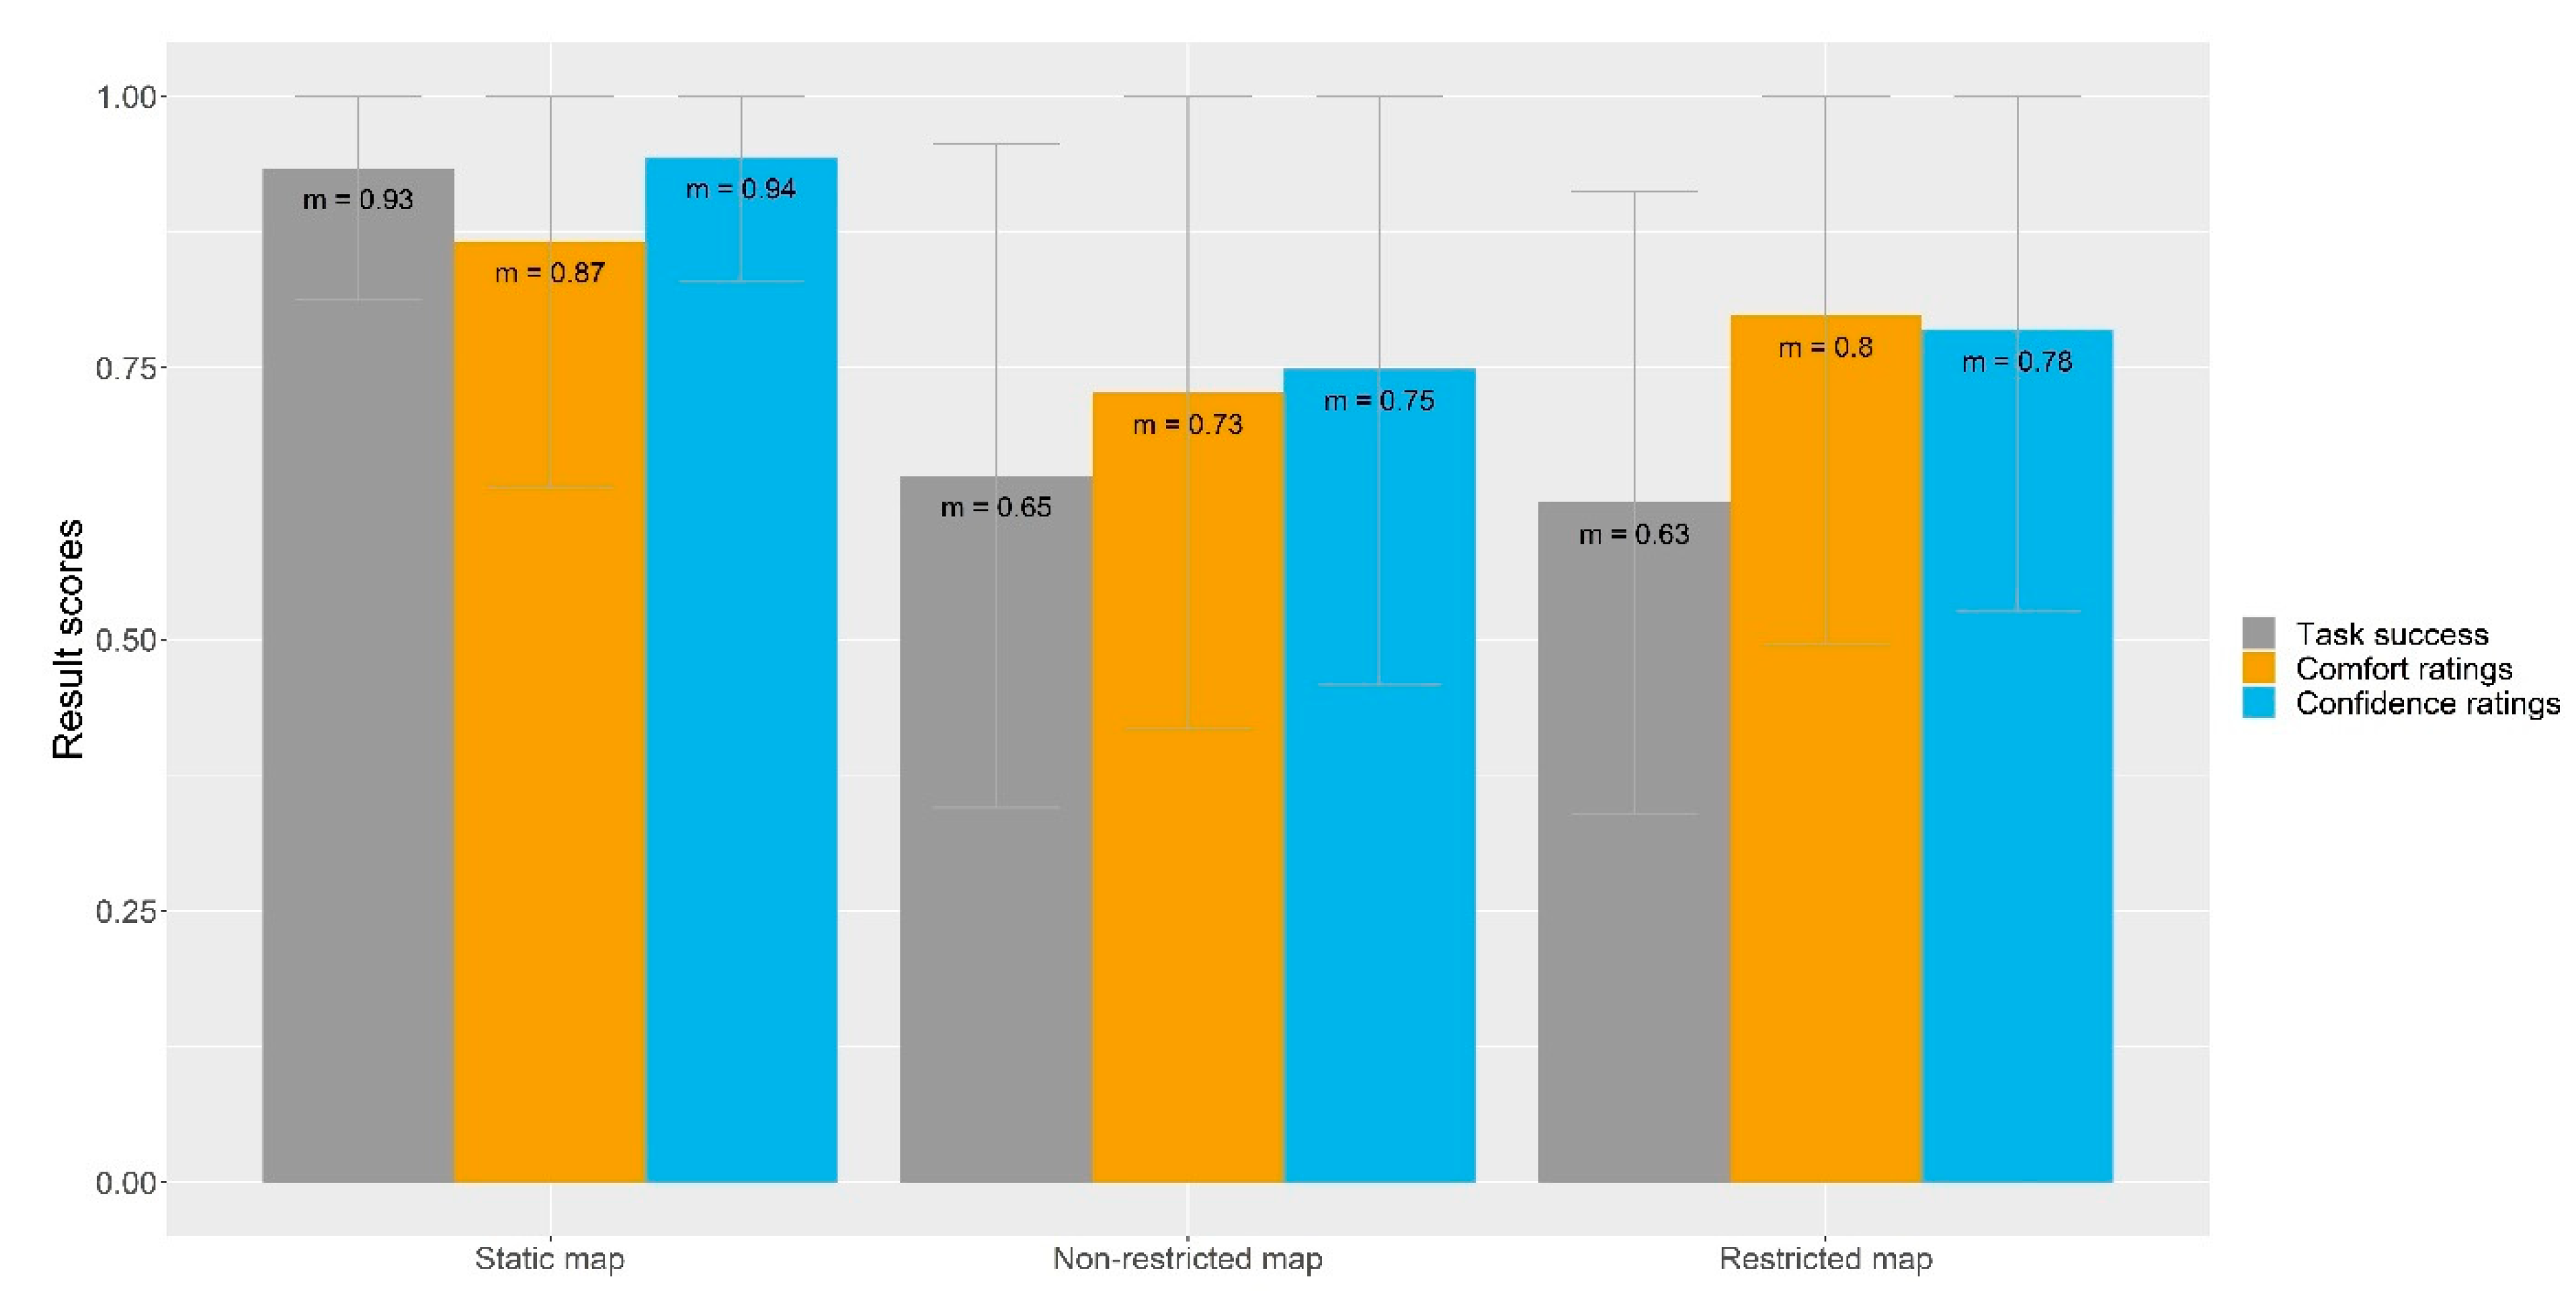
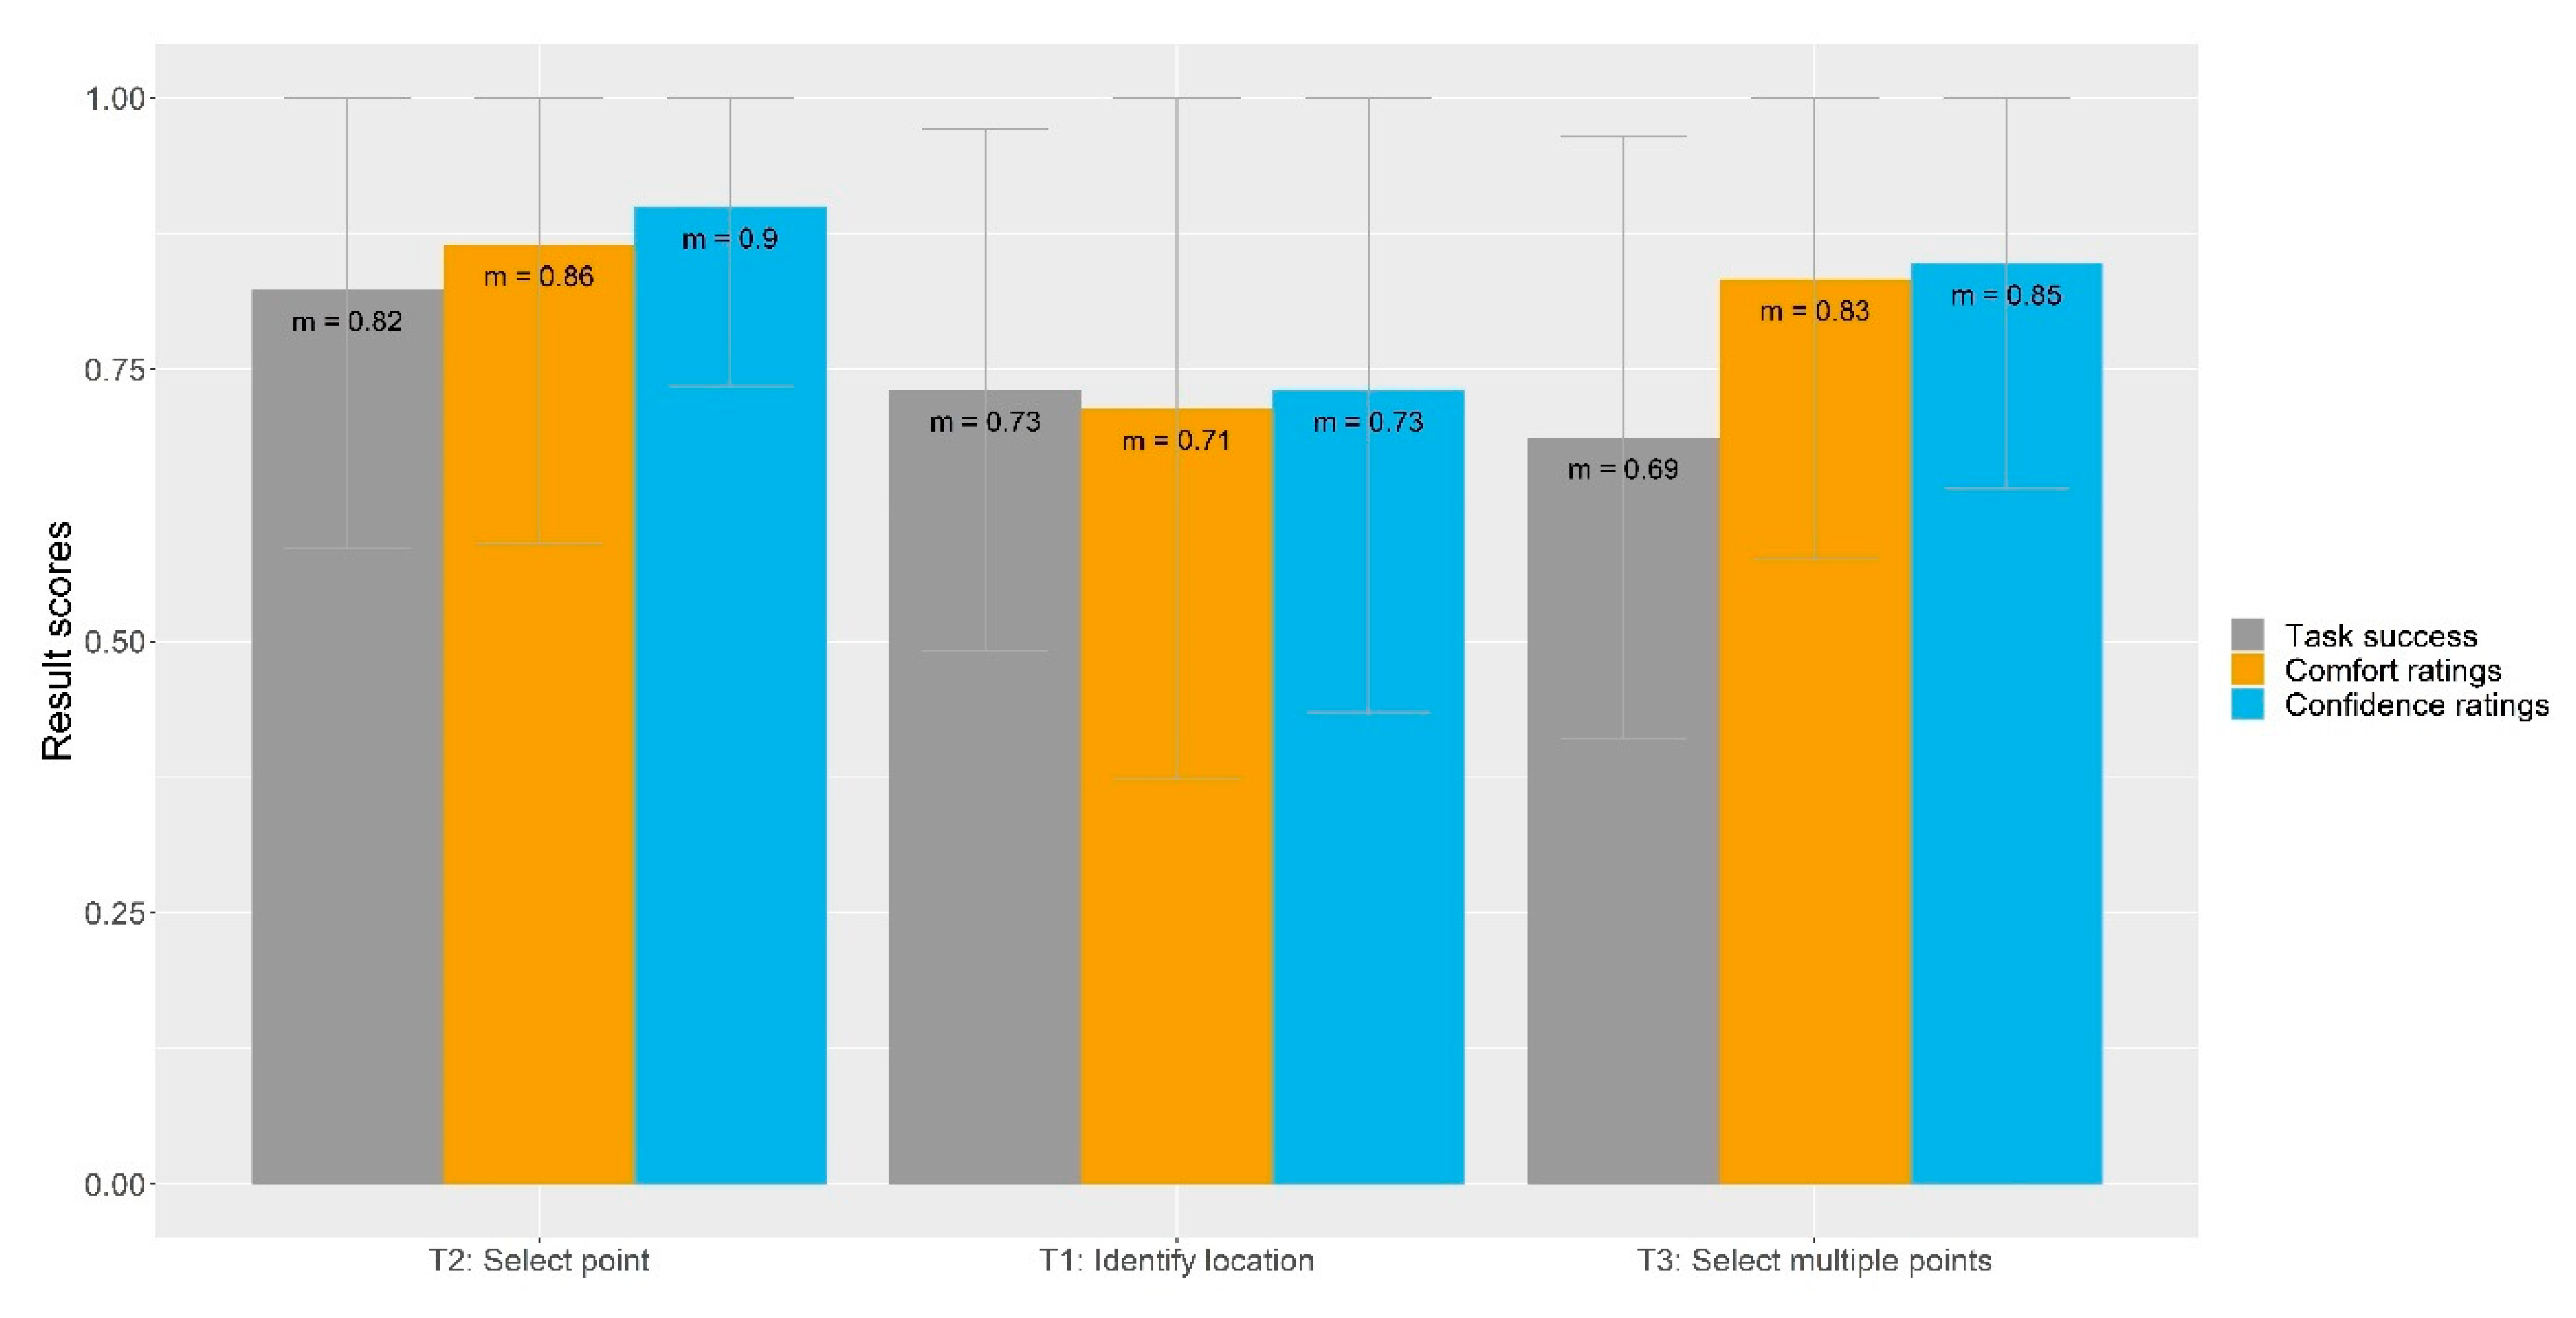
4.1. Overall Task Success, Comfort, and Confidence Ratings
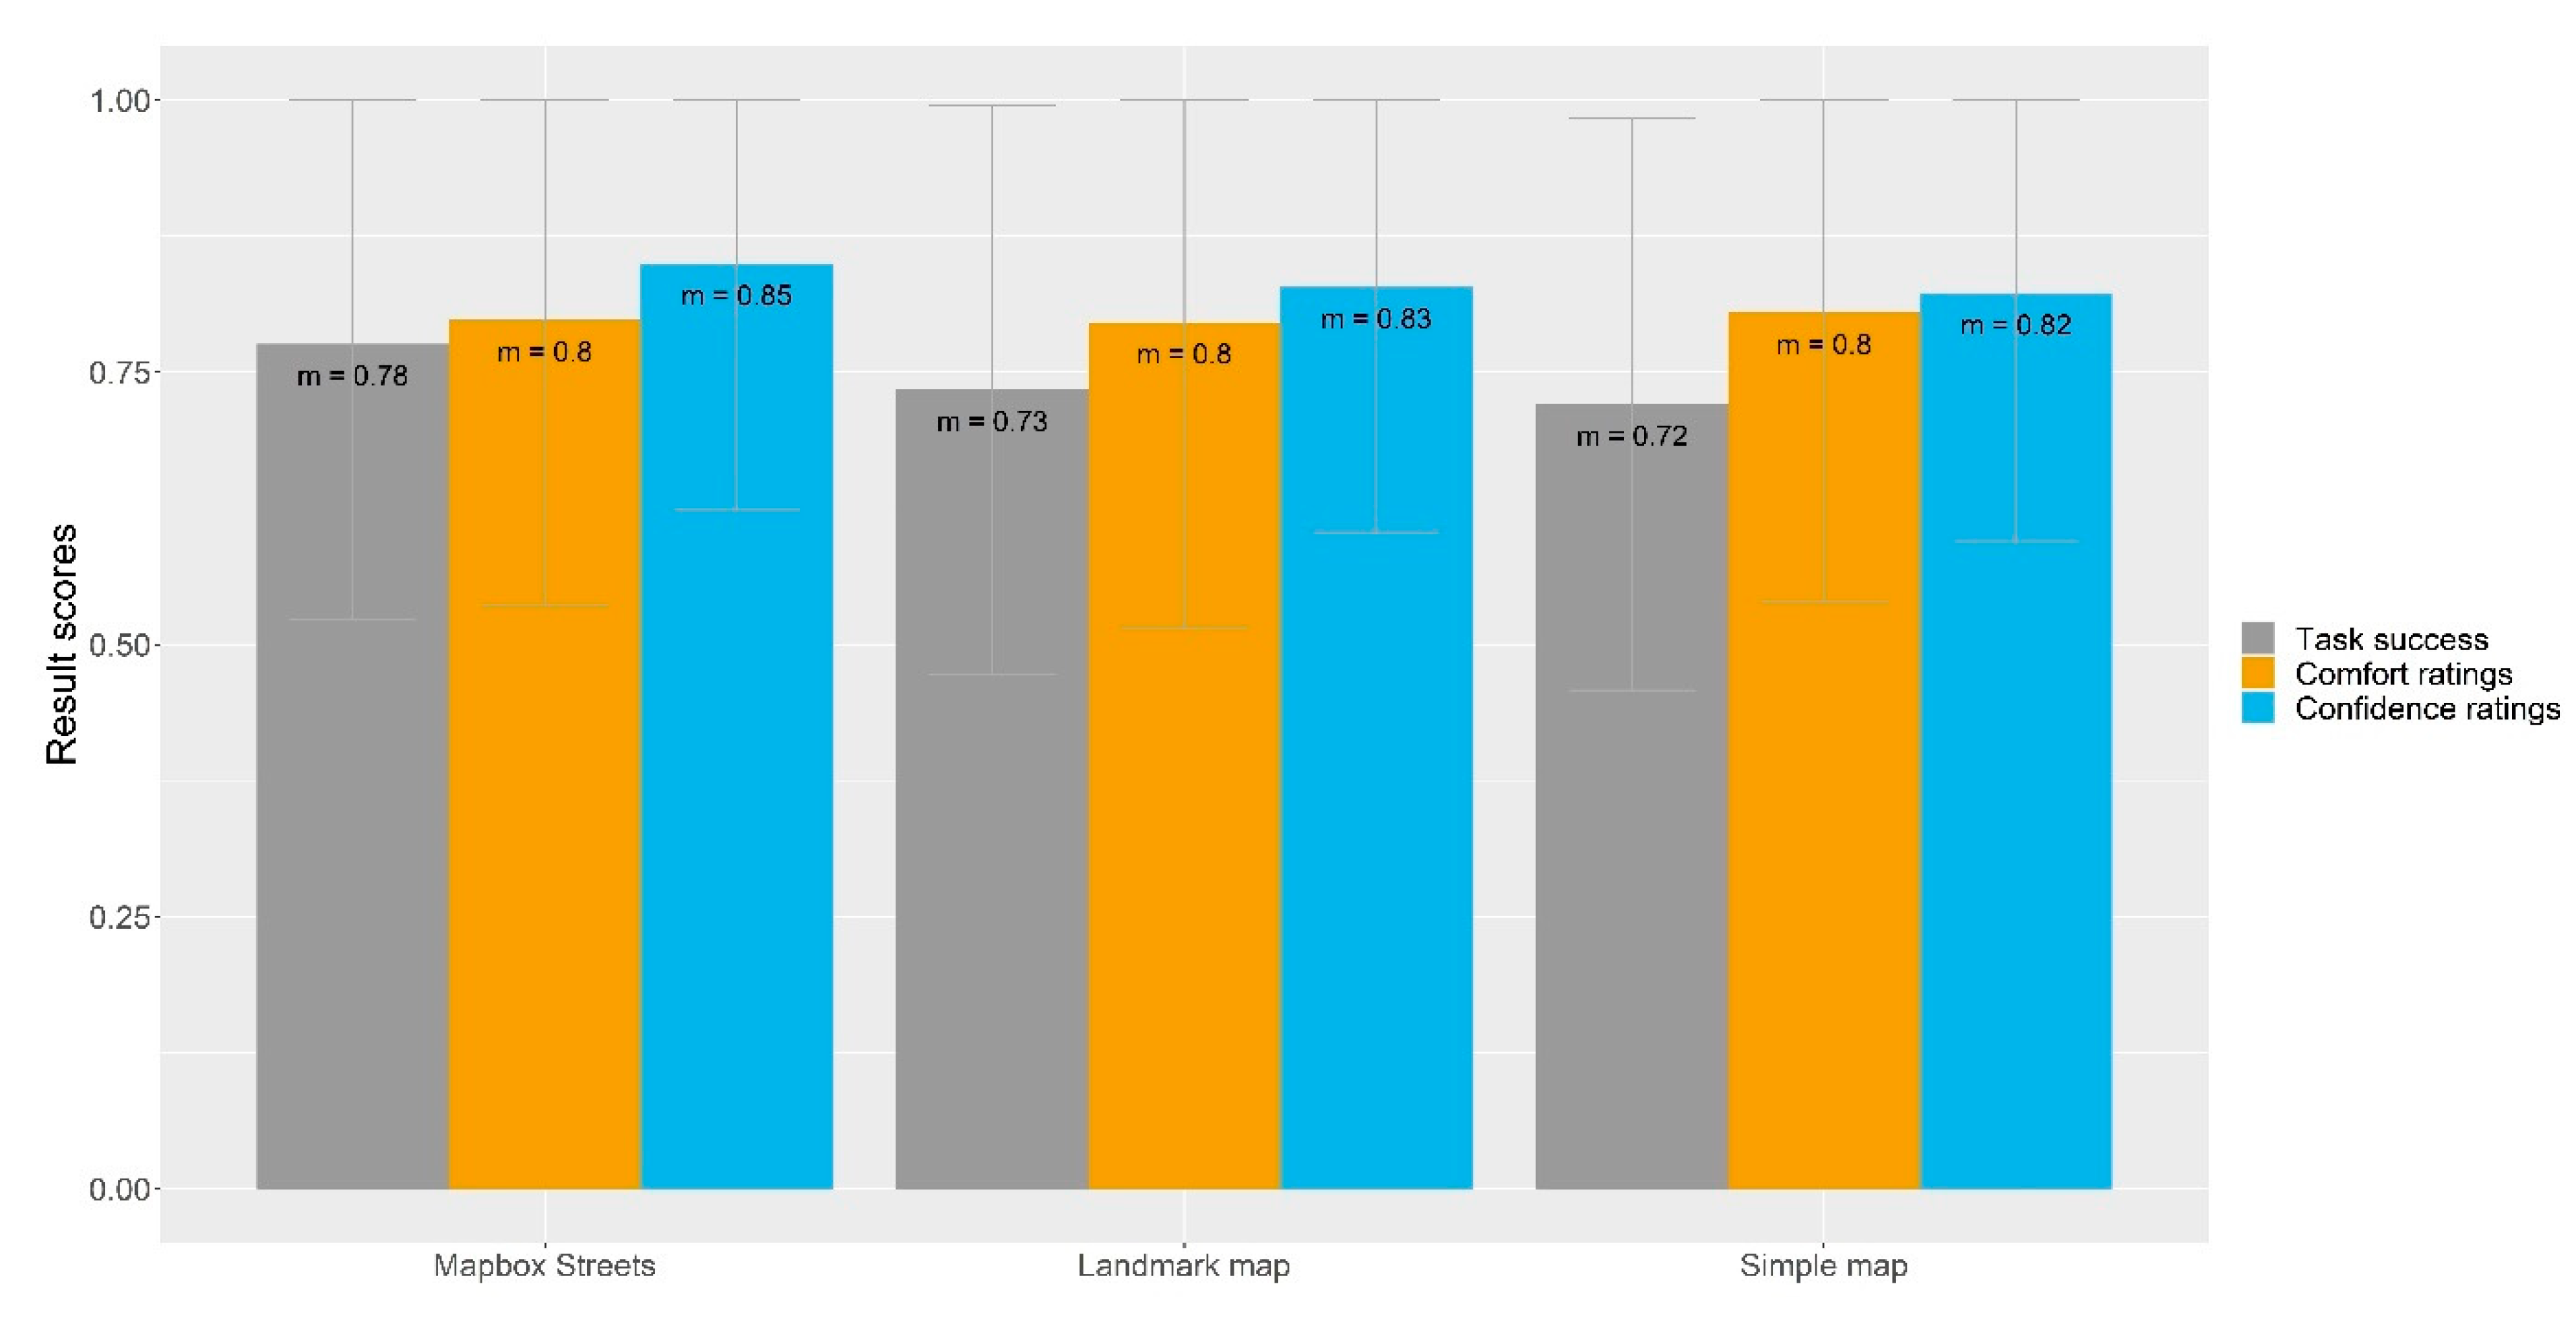
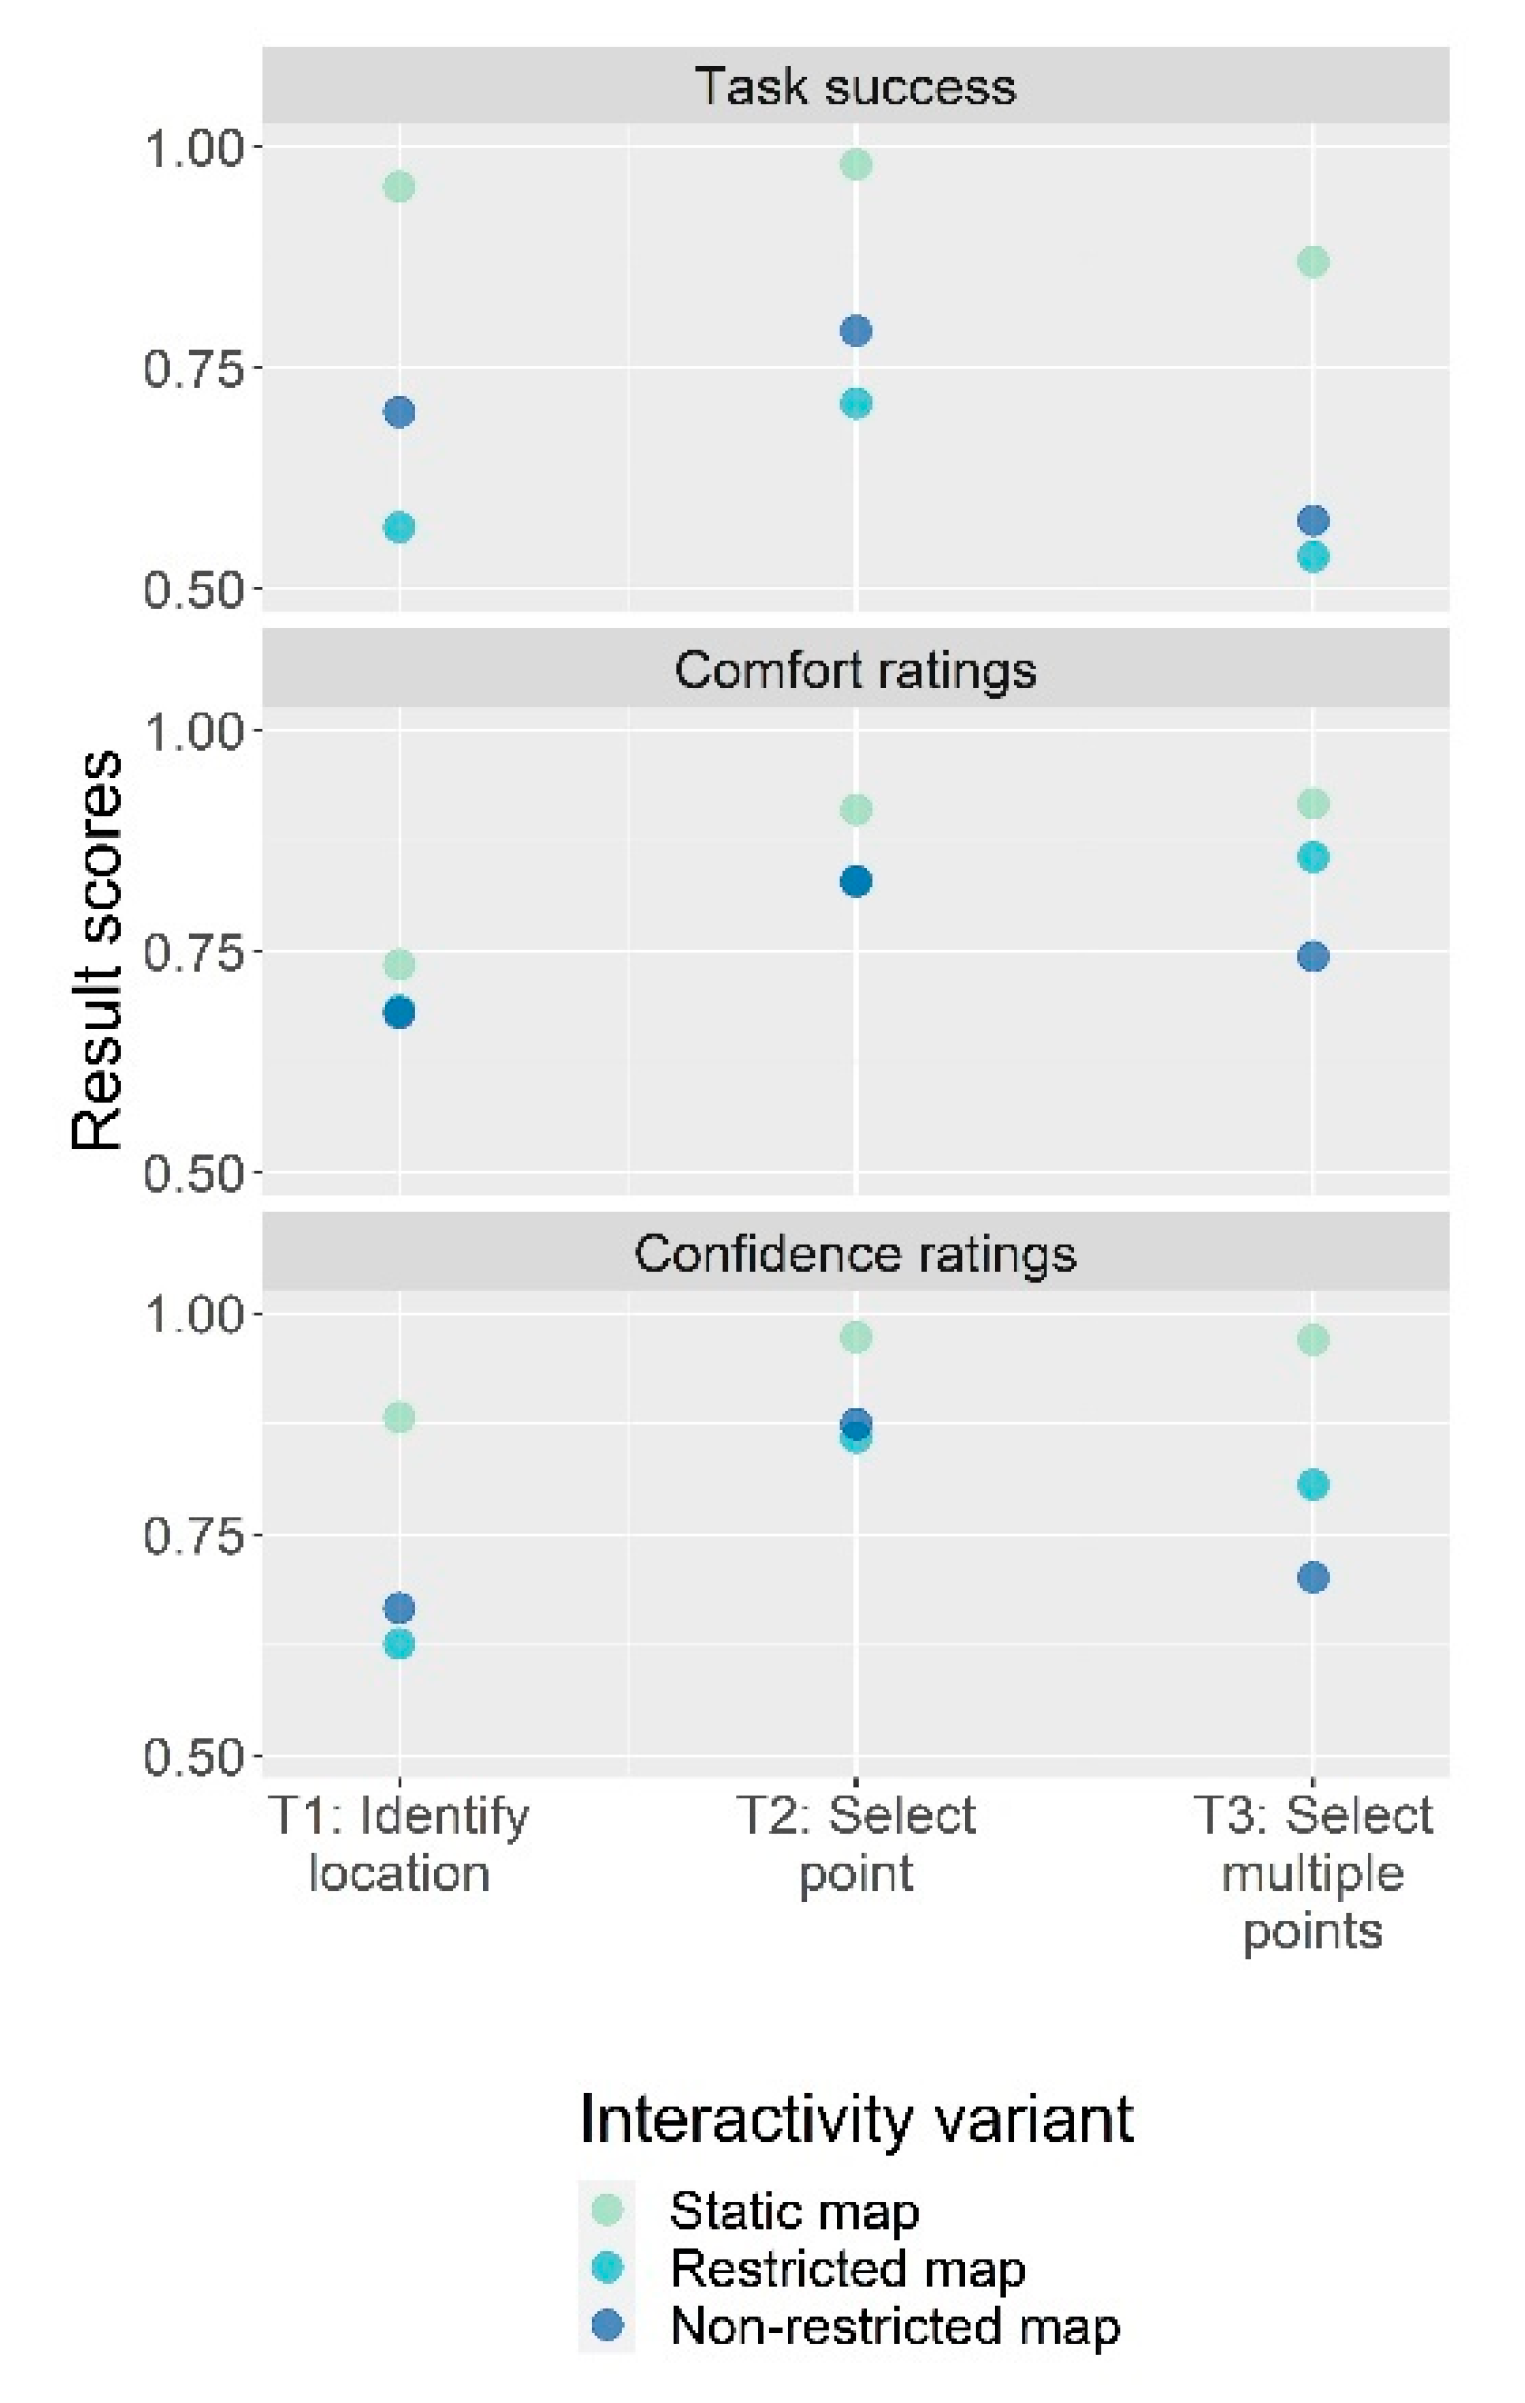
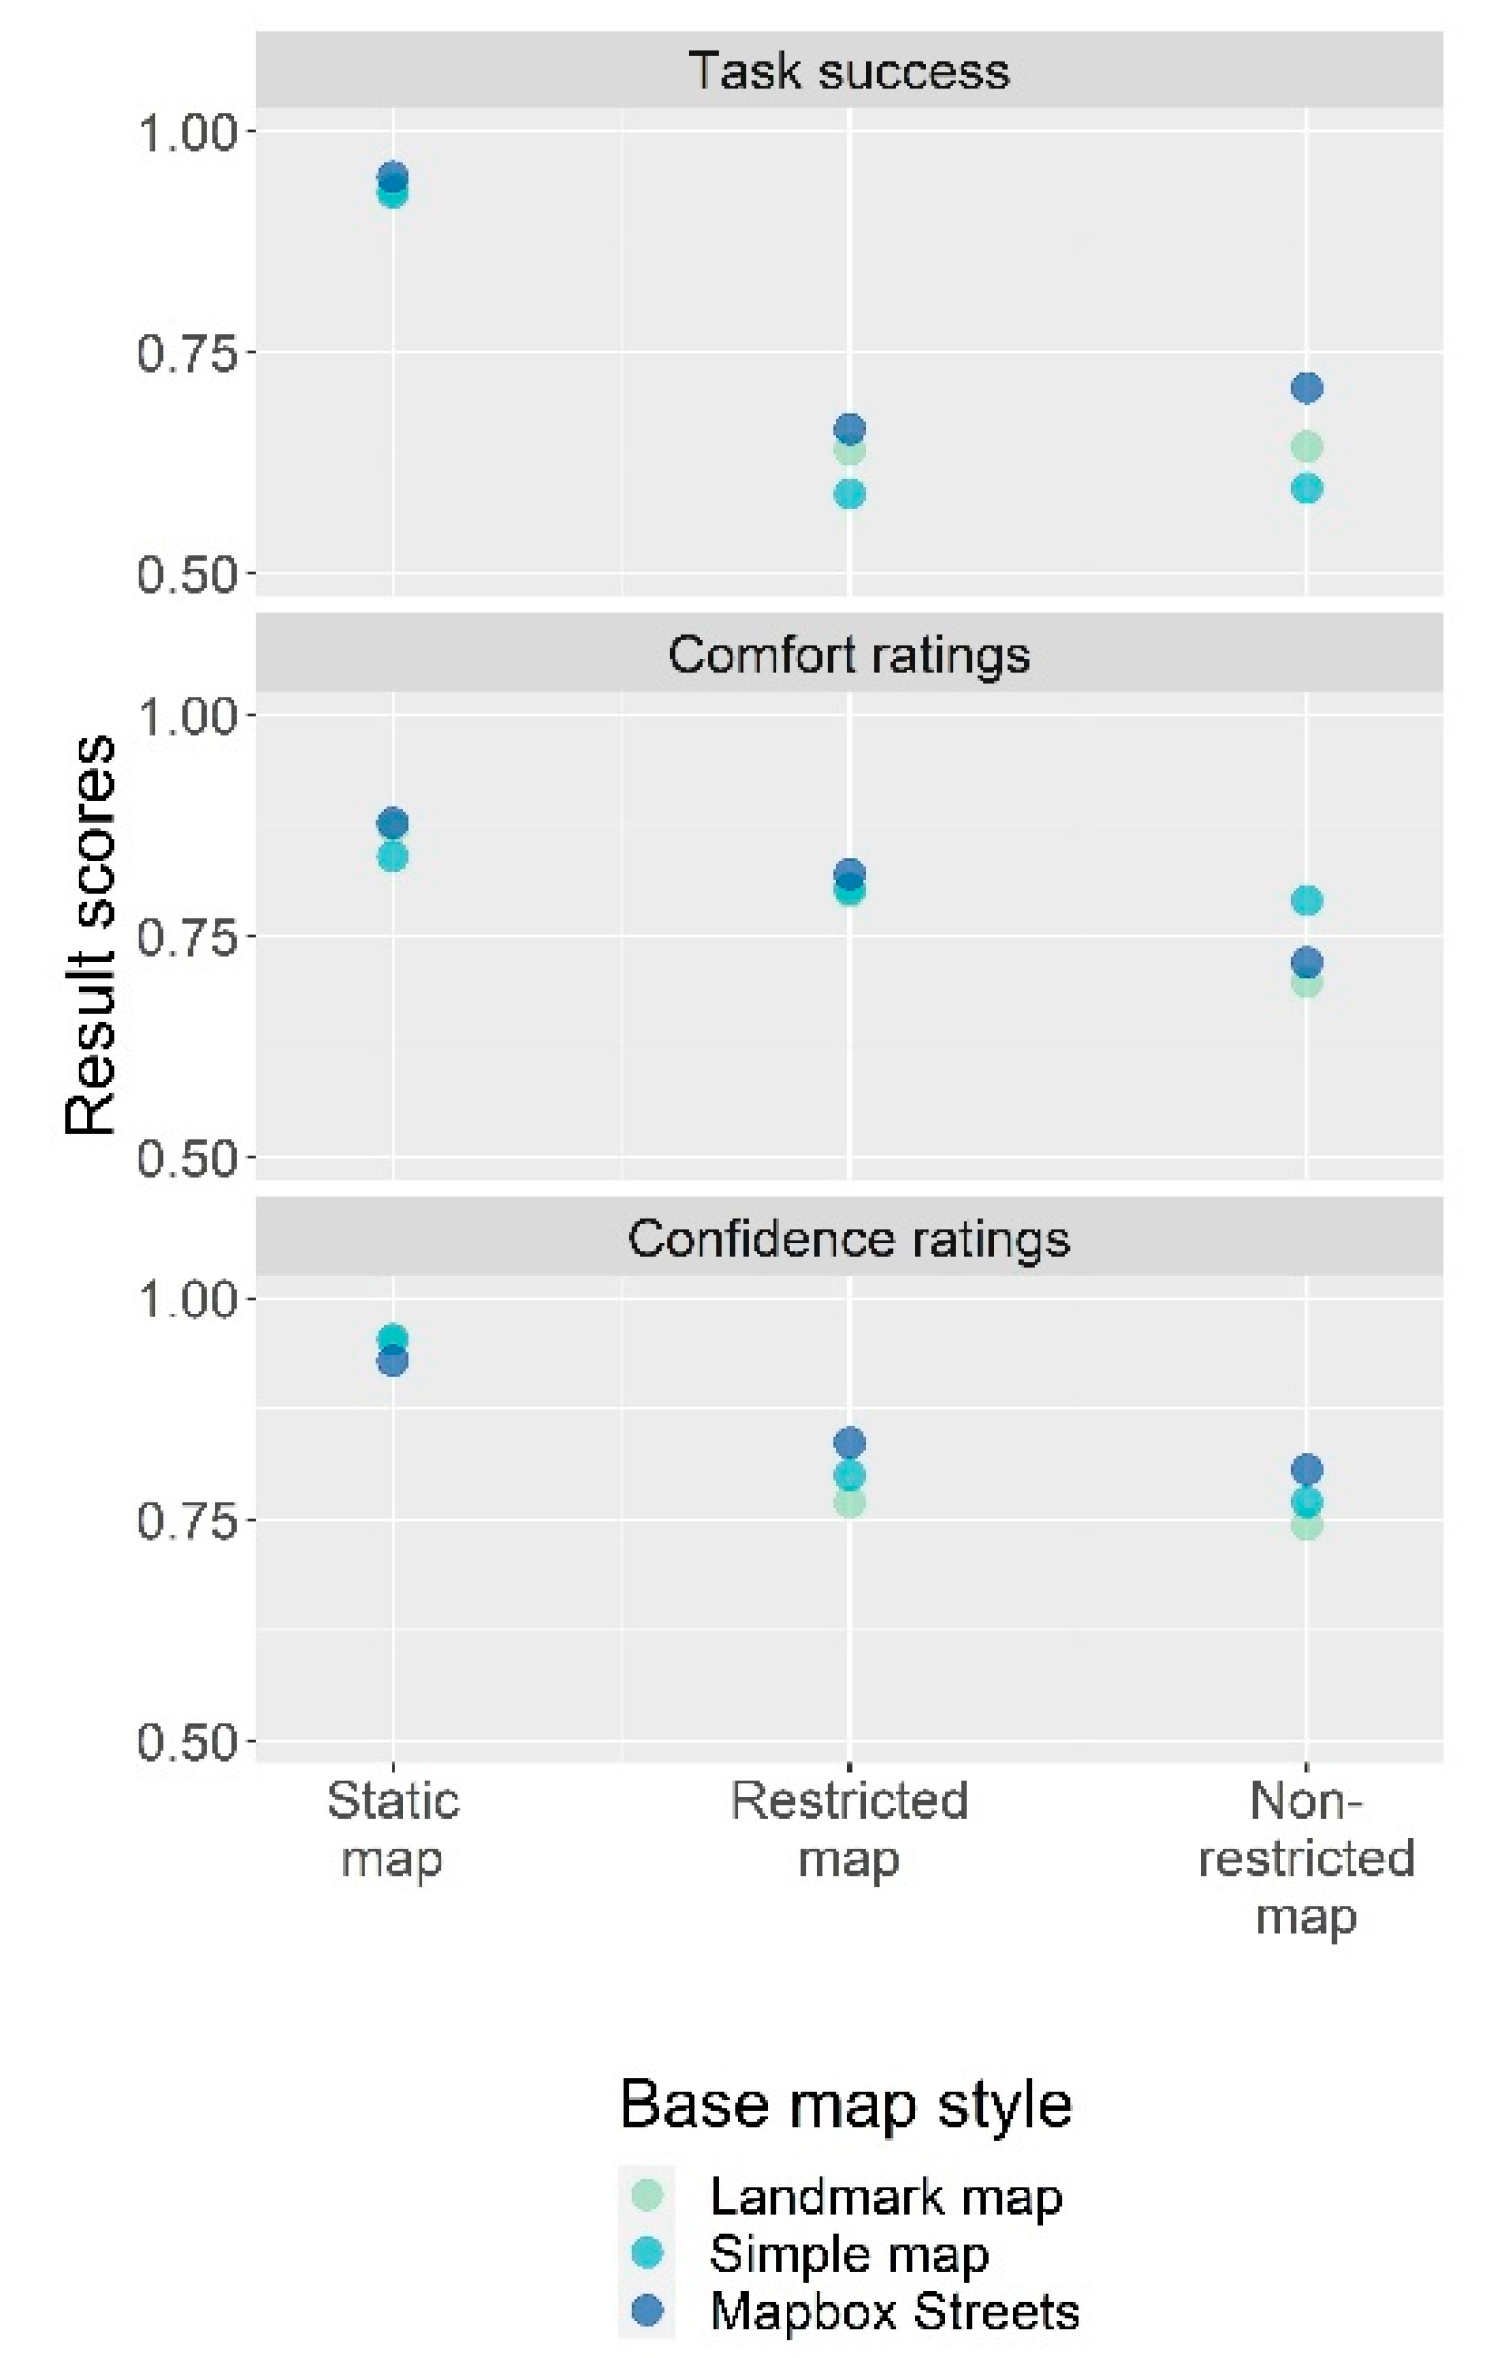
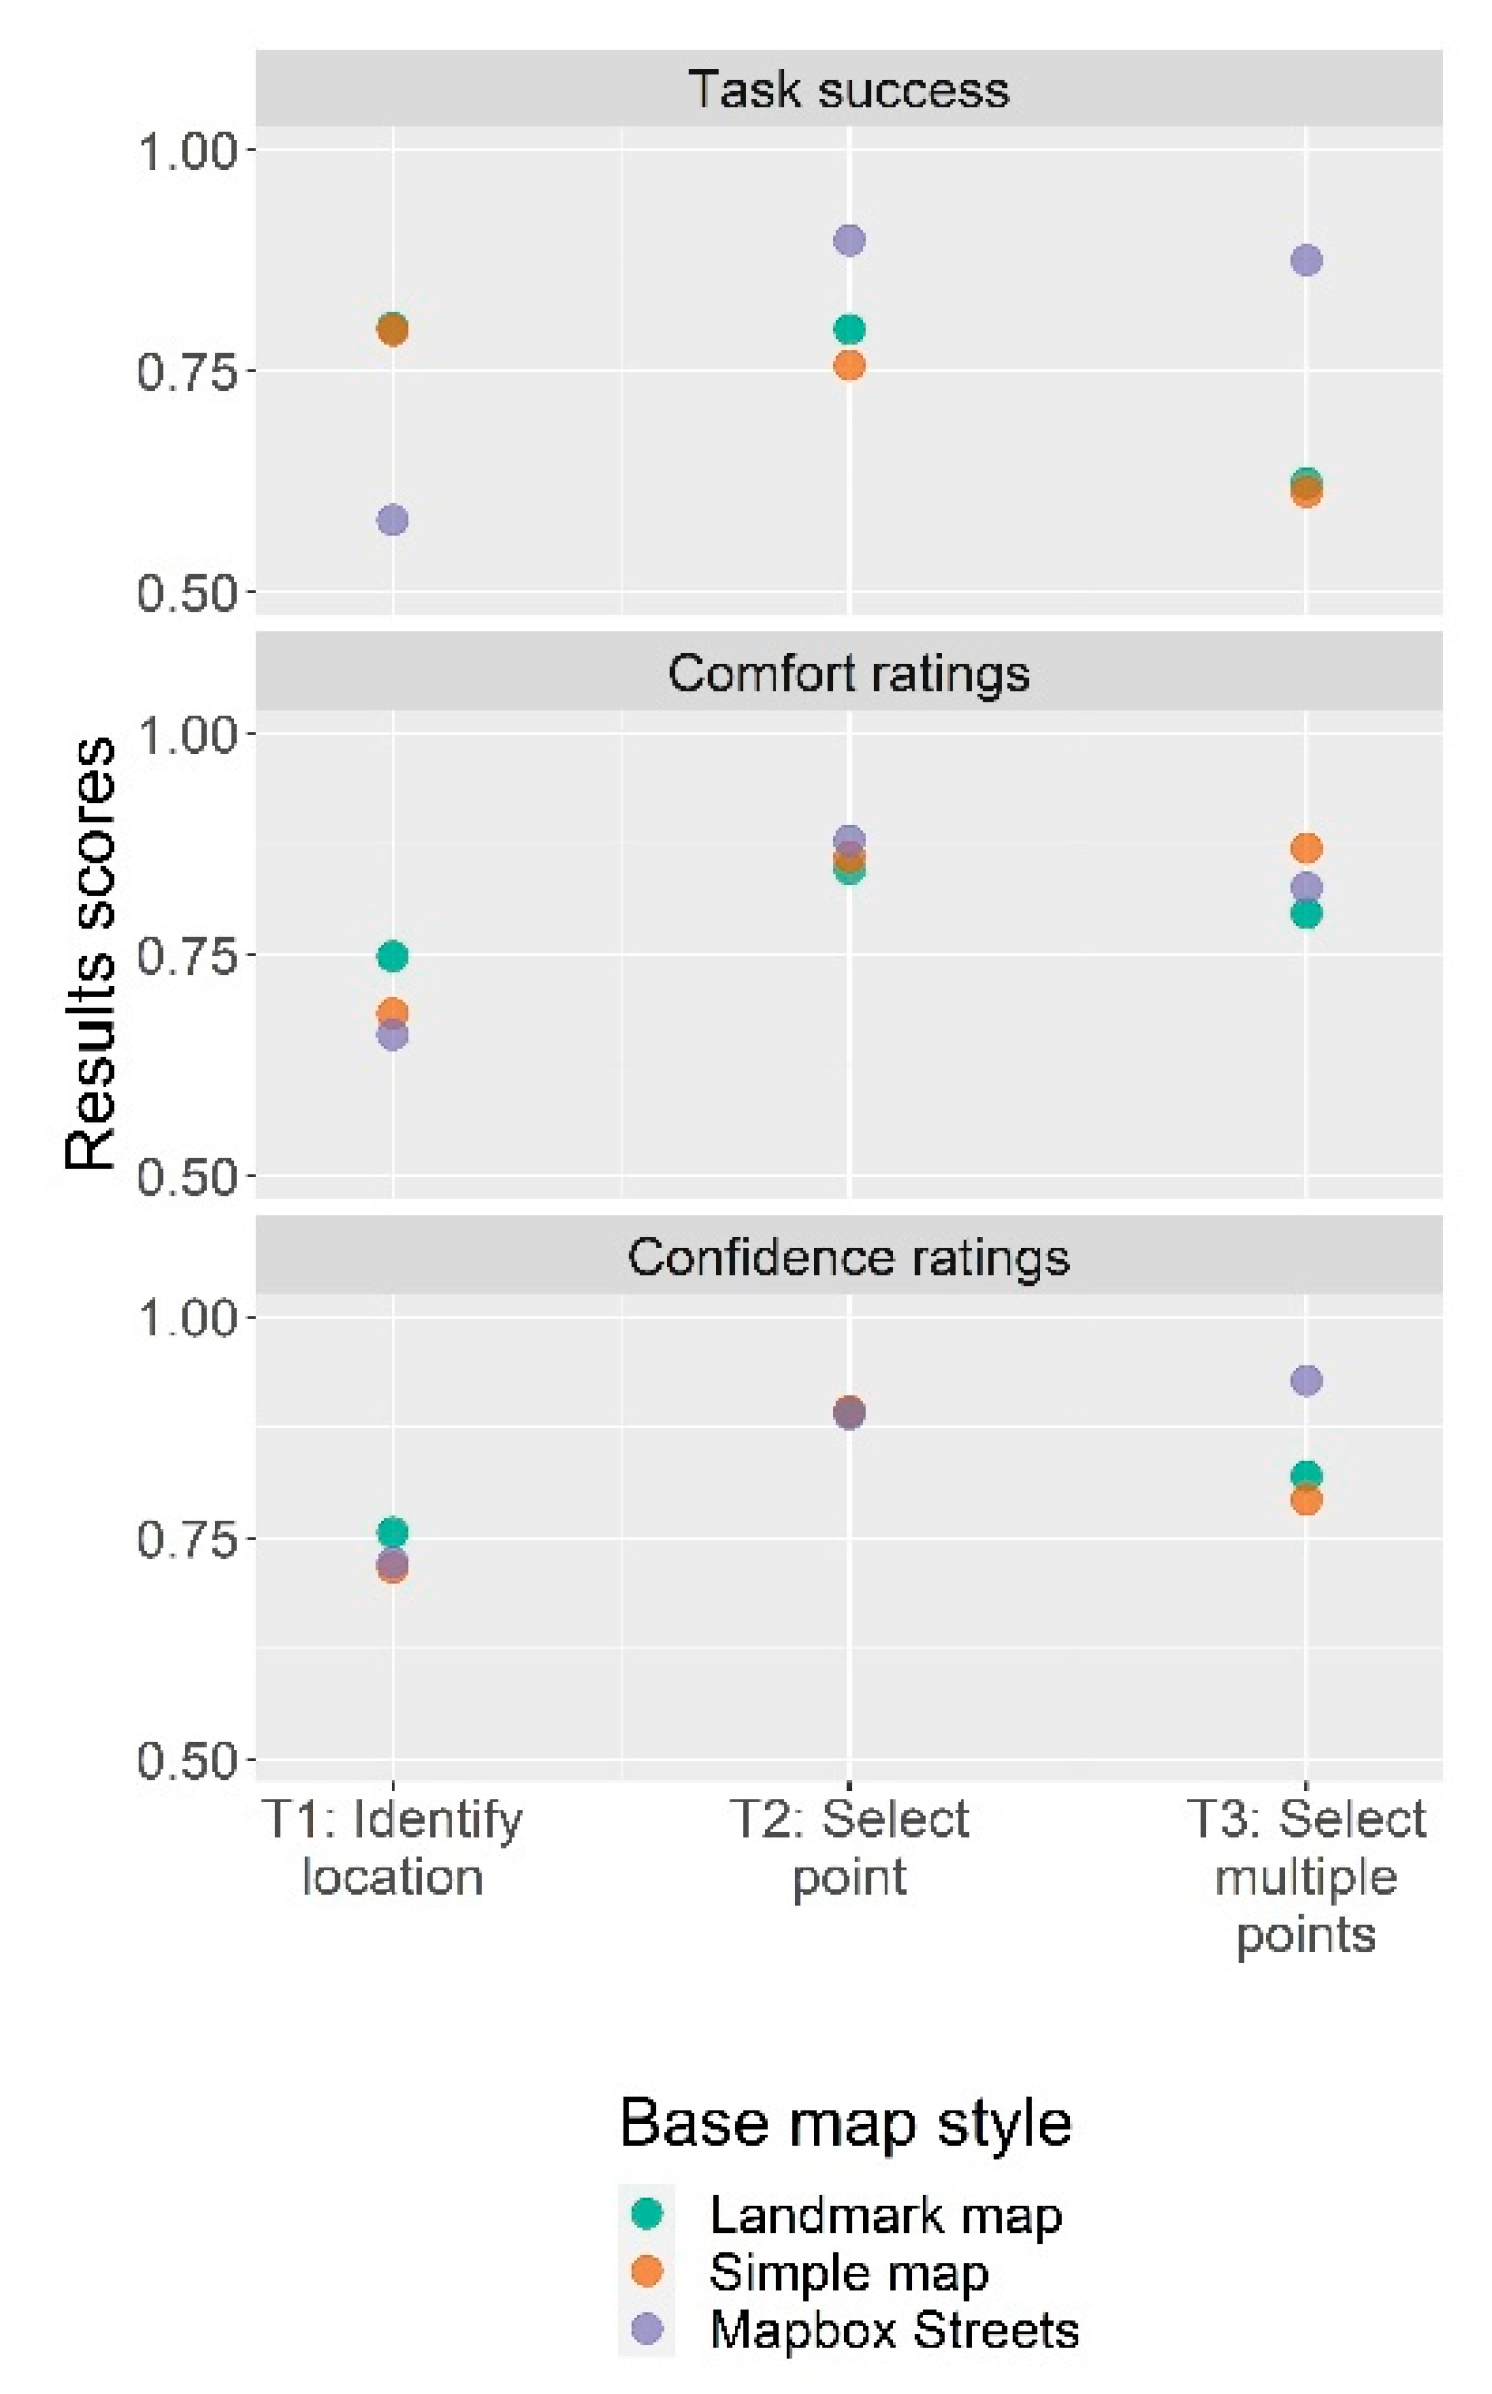
4.2. Task Success, Comfort, and Confidence Ratings by Map Design Variation
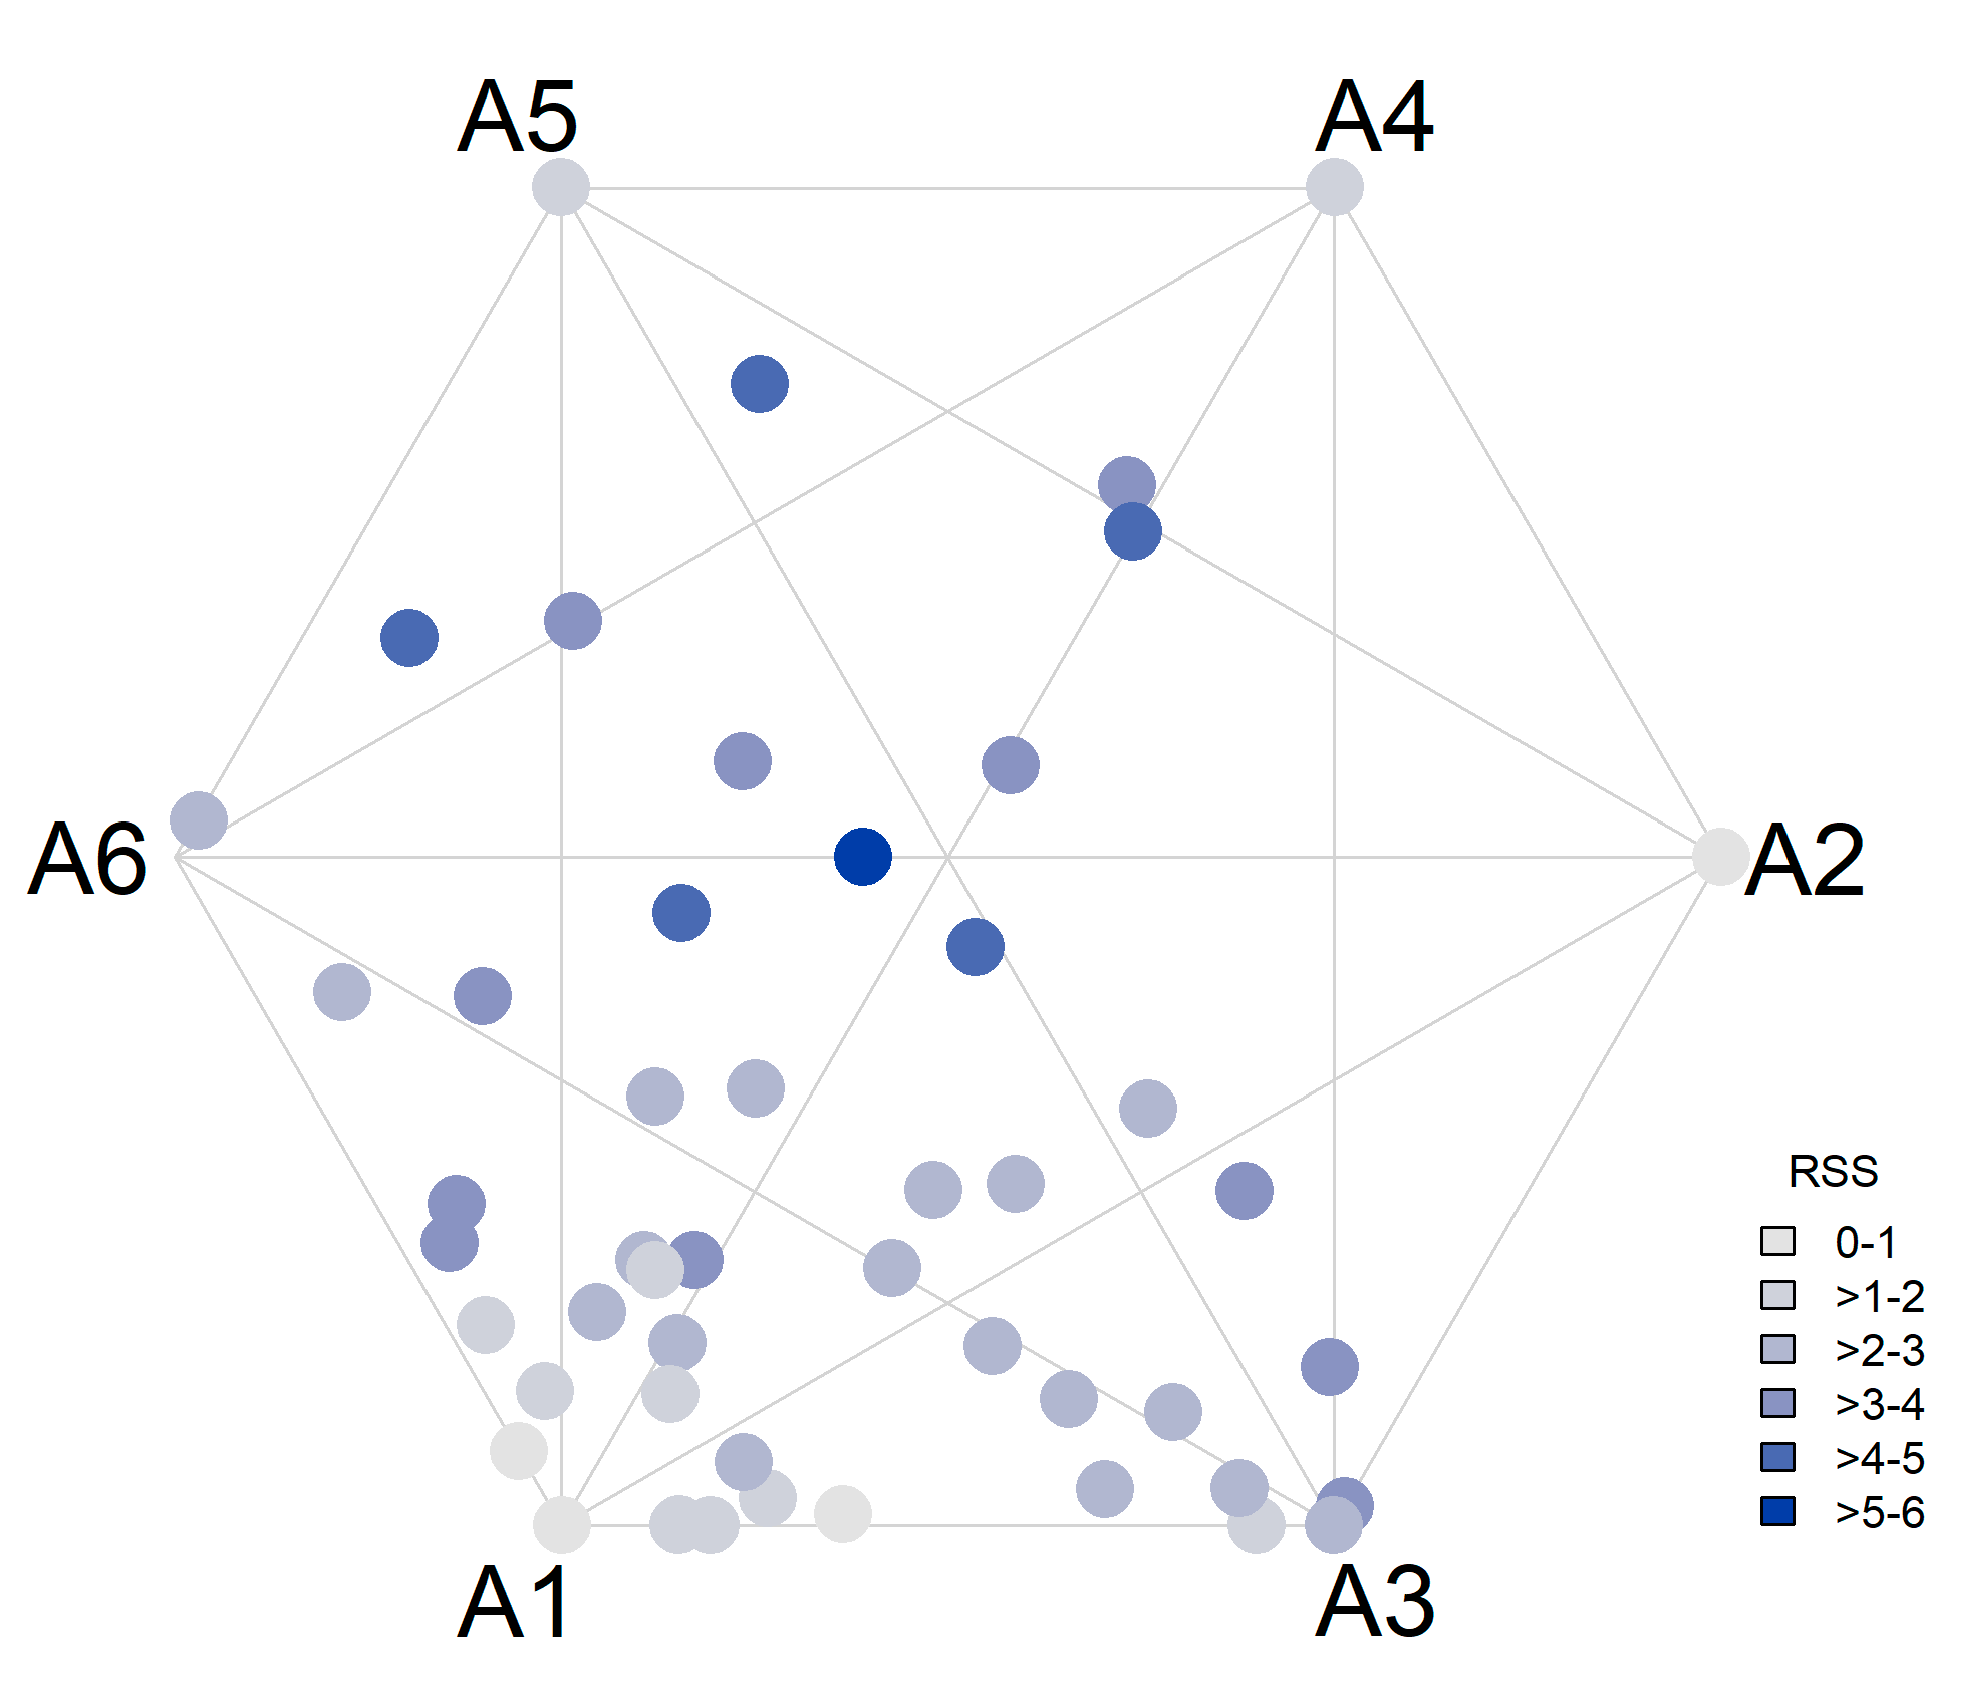
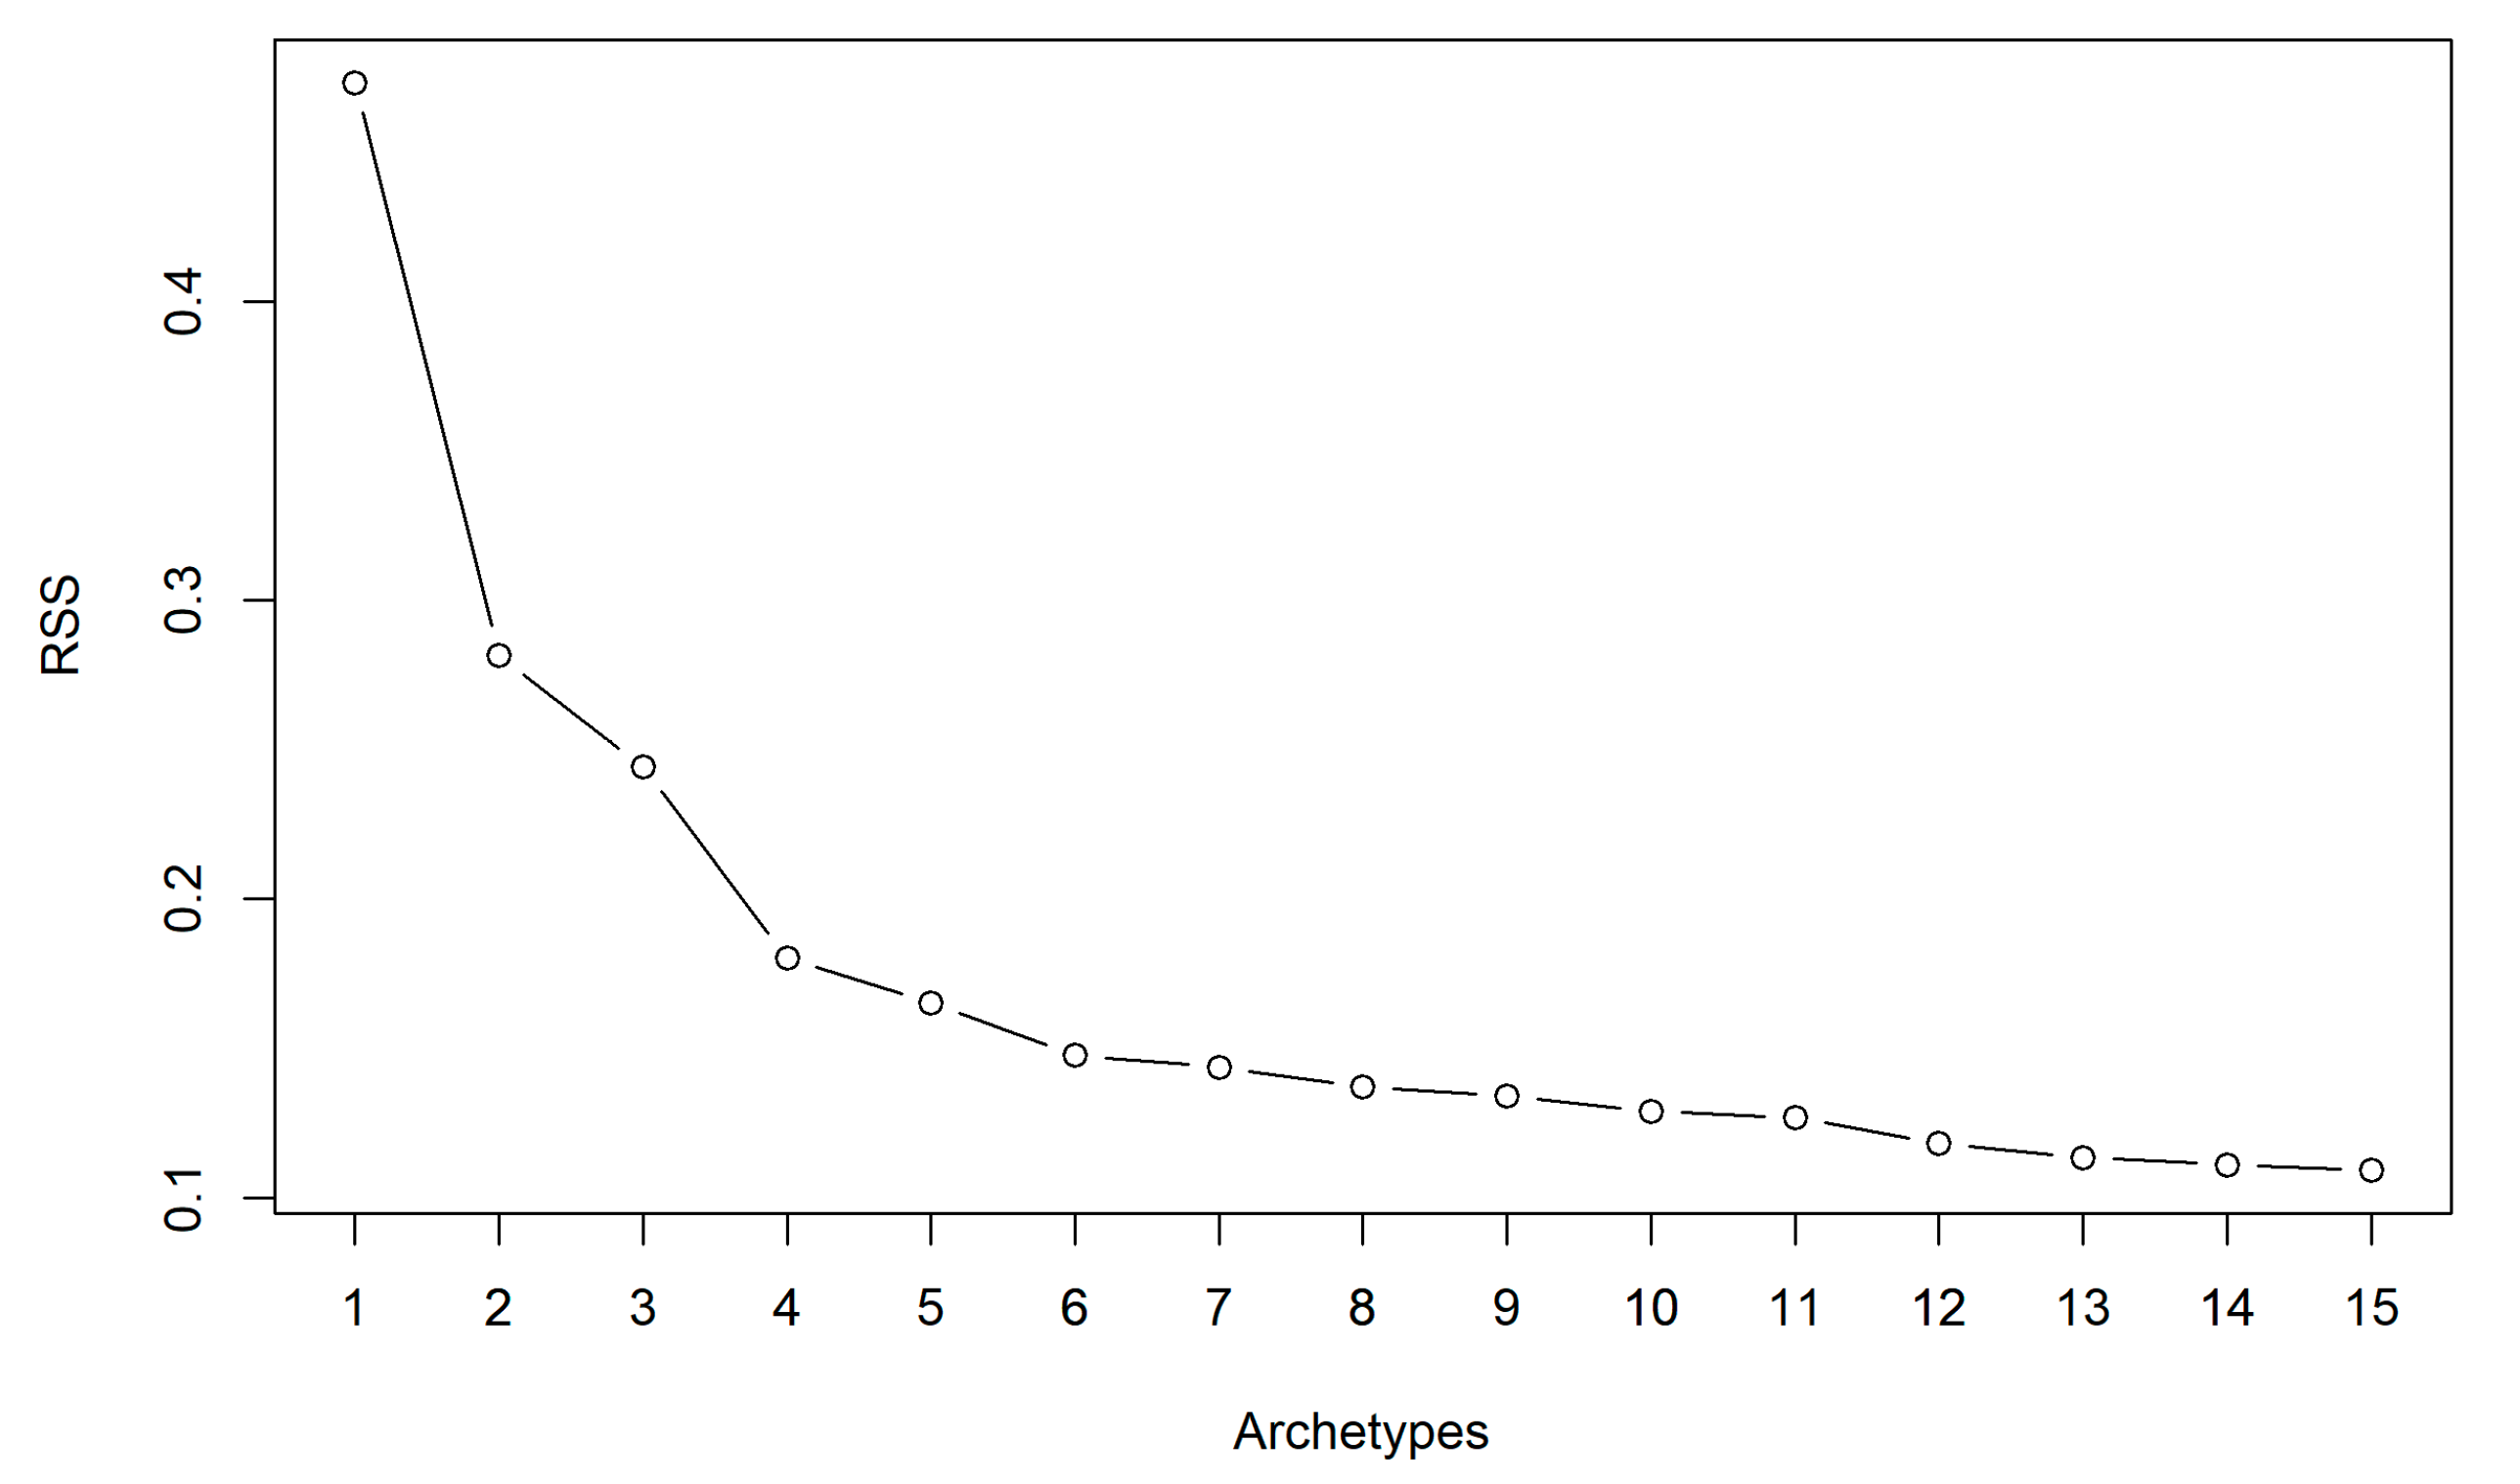
4.3. Archetypal Analysis
5. Discussion
5.1. Usability Evaluation
5.2. Archetypal Analysis
6. Conclusions
Supplementary Materials
Author Contributions
Funding
Data Availability Statement
Acknowledgments
Conflicts of Interest
References
- Roth, R. What is Mobile First Cartographic Design? In ICA Joint Workshop on User Experience Design for Mobile Cartography; International Cartographic Association: Bern, Switzerland, 2019. [Google Scholar]
- Horbiński, T.; Cybulski, P.; Medyńska-Gulij, B. Web Map Effectiveness in the Responsive Context of the Graphical User Interface. ISPRS Int. J. Geo-Inf. 2021, 10, 134. [Google Scholar] [CrossRef]
- Słomska-Przech, K.; Gołębiowska, I.M. Do Different Map Types Support Map Reading Equally? Comparing Choropleth, Graduated Symbols, and Isoline Maps for Map Use Tasks. IJGI 2021, 10, 69. [Google Scholar] [CrossRef]
- Reichenbacher, T. Mobile Cartography: Adaptive Visualisation of Geographic Information on Mobile Devices; Verl. Dr. Hut: München, Germany, 2004; ISBN 3899630483. [Google Scholar]
- Griffin, A.L.; White, T.; Fish, C.; Tomio, B.; Huang, H.; Sluter, C.R.; Bravo, J.V.M.; Fabrikant, S.I.; Bleisch, S.; Yamada, M.; et al. Designing across map use contexts: A research agenda. Int. J. Cartogr. 2017, 3, 90–114. [Google Scholar] [CrossRef] [Green Version]
- Reichenbacher, T. Adaptive Methods for Mobile Cartography. In Proceedings of the 21st International Cartographic Conference (ICC): Cartographic Renaissance, Durban, South Africa, 10–16 August 2003. [Google Scholar]
- Sarjakoski, L.T.; Nivala, A.-M. Adaptation to Context—A Way to Improve the Usability of Mobile Maps. In Map-Based Mobile Services: Theories, Methods and Implementations; Meng, L., Reichenbacher, T., Zipf, A., Eds.; Springer: Berlin/Heidelberg, Germany, 2005; pp. 107–123. ISBN 978-3-540-26982-3. [Google Scholar]
- Huang, H.; Gartner, G.; Krisp, J.M.; Raubal, M.; van de Weghe, N. Location based services: Ongoing evolution and research agenda. J. Locat. Based Serv. 2018, 12, 63–93. [Google Scholar] [CrossRef]
- Roth, R.E.; Çöltekin, A.; Delazari, L.; Filho, H.F.; Griffin, A.; Hall, A.; Korpi, J.; Lokka, I.; Mendonça, A.; Ooms, K.; et al. User studies in cartography: Opportunities for empirical research on interactive maps and visualizations. Int. J. Cartogr. 2017, 3, 61–89. [Google Scholar] [CrossRef]
- White, T. Let’s Build a CartoBase! Reproducibility in Cartography—ICA Joint Workshop. 2018. Available online: https://cogvis.icaci.org/pdf/reproducibility2018/White_CartoBase_ICA2018.pdf (accessed on 20 June 2021).
- Abowd, G.D.; Dey, A.K.; Brown, P.J.; Davies, N.; Smith, M.; Steggles, P. Towards a Better Understanding of Context and Context-Awareness. In Handheld and Ubiquitous Computing; Goos, G., Hartmanis, J., van Leeuwen, J., Gellersen, H.-W., Eds.; Springer: Berlin/Heidelberg, Germany, 1999; pp. 304–307. ISBN 978-3-540-66550-2. [Google Scholar]
- Roth, R. How do user-centered design studies contribute to cartography? Geografie 2019, 124, 133–161. [Google Scholar] [CrossRef]
- Nivala, A.-M.; Sarjakoski, T.L. User Aspects of Adaptive Visualization for Mobile Maps. Cartogr. Geogr. Inf. Sci. 2007, 34, 275–284. [Google Scholar] [CrossRef]
- Zhang, D.; Adipat, B.; Mowafi, Y. User-Centered Context-Aware Mobile Applications—The Next Generation of Personal Mobile Computing. CAIS 2009, 24. [Google Scholar] [CrossRef]
- Raubal, M.; Panov, I. A Formal Model for Mobile Map Adaptation. In Location Based Services and TeleCartography II: From Sensor Fusion to Context Models; Cartwright, W., Gartner, G., Meng, L., Peterson, M.P., Rehrl, K., Eds.; Springer: Berlin/Heidelberg, Germany, 2009; pp. 11–34. ISBN 978-3-540-87392-1. [Google Scholar]
- Atzmanstorfer, K.; Eitzinger, A.; Marin, B.E.; Parra Arteaga, A.; Gonzalez Quintero, B.; Resl, R. HCI-Evaluation of the GeoCitizen-reporting App for citizen participation in spatial planning and community management among members of marginalized communities in Cali, Colombia. Giforum 2016, 1, 117–132. [Google Scholar] [CrossRef]
- Gottwald, S.; Laatikainen, T.E.; Kyttä, M. Exploring the usability of PPGIS among older adults: Challenges and opportunities. Int. J. Geogr. Inf. Sci. 2016, 30, 2321–2338. [Google Scholar] [CrossRef]
- Dransch, D. Activity and Context—A Conceptual Framework for Mobile Geoservices. In Map-based Mobile Services: Theories, Methods and Implementations; Meng, L., Reichenbacher, T., Zipf, A., Eds.; Springer: Berlin/Heidelberg, Germany, 2005; pp. 31–42. ISBN 978-3-540-26982-3. [Google Scholar]
- Elias, B.; Hampe, M.; Sester, M. Adaptive Visualisation of Landmarks using an MRDB. In Map-based Mobile Services: Theories, Methods and Implementations; Meng, L., Reichenbacher, T., Zipf, A., Eds.; Springer: Berlin/Heidelberg, Germany, 2005; pp. 73–86. ISBN 978-3-540-26982-3. [Google Scholar]
- Liao, H.; Wang, X.; Dong, W.; Meng, L. Measuring the influence of map label density on perceived complexity: A user study using eye tracking. Cartogr. Geogr. Inf. Sci. 2019, 46, 210–227. [Google Scholar] [CrossRef]
- Lokka, I.E.; Çöltekin, A.; Wiener, J.; Fabrikant, S.I.; Röcke, C. Virtual environments as memory training devices in navigational tasks for older adults. Sci. Rep. 2018, 8, 10809. [Google Scholar] [CrossRef] [PubMed]
- Fallucchi, F.; Luccasen, R.A.; Turocy, T.L. Identifying discrete behavioural types: A re-analysis of public goods game contributions by hierarchical clustering. J. Econ. Sci. Assoc. 2019, 5, 238–254. [Google Scholar] [CrossRef] [Green Version]
- Liu, Y.; Li, W.; Li, Y.-C. Network Traffic Classification Using K-means Clustering. In Proceedings of the Second International Multi-Symposiums on Computer and Computational Sciences (IMSCCS 2007), Iowa City, IA, USA, 13–15 August 2007; Ni, J., Ed.; The University of Iowa: Iowa City, IA, USA; IEEE: Piscataway, NJ, USA, 2007; pp. 360–365, ISBN 0-7695-3039-7. [Google Scholar]
- Bi, M.; Xu, J.; Wang, M.; Zhou, F. Anomaly detection model of user behavior based on principal component analysis. J. Ambient. Intell. Hum. Comput. 2016, 7, 547–554. [Google Scholar] [CrossRef]
- Hu, J.; Wright, F.A.; Zou, F. Estimation of Expression Indexes for Oligonucleotide Arrays Using the Singular Value Decomposition. J. Am. Stat. Assoc. 2006, 101, 41–50. [Google Scholar] [CrossRef]
- Mørup, M.; Hansen, L.K. Archetypal analysis for machine learning and data mining. Neurocomputing 2012, 80, 54–63. [Google Scholar] [CrossRef]
- Cutler, A.; Breiman, L. Archetypal Analysis. Technometrics 1994, 36, 338–347. [Google Scholar] [CrossRef]
- Eugster, M.J.A.; Leisch, F. From Spider-Man to Hero—Archetypal Analysis in R. J. Stat. Soft. 2009, 30. [Google Scholar] [CrossRef] [Green Version]
- Board, C. Map Reading Tasks Appropriate in Experimental Studies in Cartographic Communication. Cartogr. Int. J. Geogr. Inf. Geovisualization 1978, 15, 1–12. [Google Scholar] [CrossRef]
- Lobben, A.K. Tasks, Strategies, and Cognitive Processes Associated With Navigational Map Reading: A Review Perspective. Prof. Geogr. 2004, 56, 270–281. [Google Scholar] [CrossRef]
- Roth, R.E. Cartographic Interaction Primitives: Framework and Synthesis. Cartogr. J. 2012, 49, 376–395. [Google Scholar] [CrossRef]
- Konečný, M.; Kubíček, P.; Stachoň, Z.; Šašinka, Č. The usability of selected base maps for crises management—users’ perspectives. Appl. Geomat. 2011, 3, 189–198. [Google Scholar] [CrossRef]
- Bestgen, A.-K.; Edler, D.; Müller, C.; Schulze, P.; Dickmann, F.; Kuchinke, L. Where Is It (in the Map)? Recall and Recognition of Spatial Information. Cartogr. Int. J. Geogr. Inf. Geovisualization 2017, 52, 80–97. [Google Scholar] [CrossRef]
- Edler, D.; Keil, J.; Bestgen, A.-K.; Kuchinke, L.; Dickmann, F. Hexagonal map grids—An experimental study on the performance in memory of object locations. Cartogr. Geogr. Inf. Sci. 2019, 46, 401–411. [Google Scholar] [CrossRef]
- Corbett, J. Good Practices in Participatory Mapping: A Review Prepared for the International Fund for Agricultural Development (IFAD). 2009. Available online: https://agris.fao.org/agris-search/search.do?recordID=GB2013201933 (accessed on 20 June 2021).
- Sletto, B.I. We Drew What We Imagined. Curr. Anthropol. 2009, 50, 443–476. [Google Scholar] [CrossRef] [Green Version]
- Vincent, K.; Roth, R.E.; Moore, S.A.; Huang, Q.; Lally, N.; Sack, C.M.; Nost, E.; Rosenfeld, H. Improving spatial decision making using interactive maps: An empirical study on interface complexity and decision complexity in the North American hazardous waste trade. Environ. Plan. B Urban Anal. City Sci. 2019, 46, 1706–1723. [Google Scholar] [CrossRef] [Green Version]
- Hedeker, D. A mixed-effects multinomial logistic regression model. Stat. Med. 2003, 22, 1433–1446. [Google Scholar] [CrossRef] [PubMed]
- Roth, R.; Ross, K.; MacEachren, A. User-Centered Design for Interactive Maps: A Case Study in Crime Analysis. ISPRS Int. J. Geo-Inf. 2015, 4, 262–301. [Google Scholar] [CrossRef]
- Seth, S.; Eugster, M.J.A. Probabilistic archetypal analysis. Mach Learn 2016, 102, 85–113. [Google Scholar] [CrossRef] [Green Version]
- Moore, D.A.; Healy, P.J. The trouble with overconfidence. Psychol. Rev. 2008, 115, 502–517. [Google Scholar] [CrossRef] [PubMed] [Green Version]
- Biland, J.; Çöltekin, A. An empirical assessment of the impact of the light direction on the relief inversion effect in shaded relief maps: NNW is better than NW. Cartogr. Geogr. Inf. Sci. 2017, 44, 358–372. [Google Scholar] [CrossRef]
- Korporaal, M.; Ruginski, I.T.; Fabrikant, S.I. Effects of Uncertainty Visualization on Map-Based Decision Making Under Time Pressure. Front. Comput. Sci. 2020, 2. [Google Scholar] [CrossRef]
- Golebiowska, I.; Çöltekin, A. Rainbow Dash: Intuitiveness, interpretability and memorability of the rainbow color scheme in visualization. IEEE Trans. Vis. Comput. Graph. 2020. [Google Scholar] [CrossRef] [PubMed]
- Brügger, A.; Richter, K.-F.; Fabrikant, S.I. How does navigation system behavior influence human behavior? Cogn. Res. Princ. Implic. 2019, 4, 5. [Google Scholar] [CrossRef] [Green Version]


| Age | Mean: 33.92 SD: 11.58 Min: 22 Max: 65 |
| Gender | Female: 30 Male: 20 |
| Education | Secondary school: 2 Undergraduate: 26 Postgraduate: 22 |
| How comfortable participants feel using smartphones (1 (min)—5 (max)) | Mean: 4.32 SD: 0.82 |
| Whether participants have been using maps previous to the study | Yes: 78% No: 22% |
| How comfortable participants feel using maps (1 (min)—5 (max)) | Mean: 3.84 SD: 0.98 |
| How frequently participants are using maps (1 (min)—3 (max)) | Mean: 1.8 SD: 0.67 |
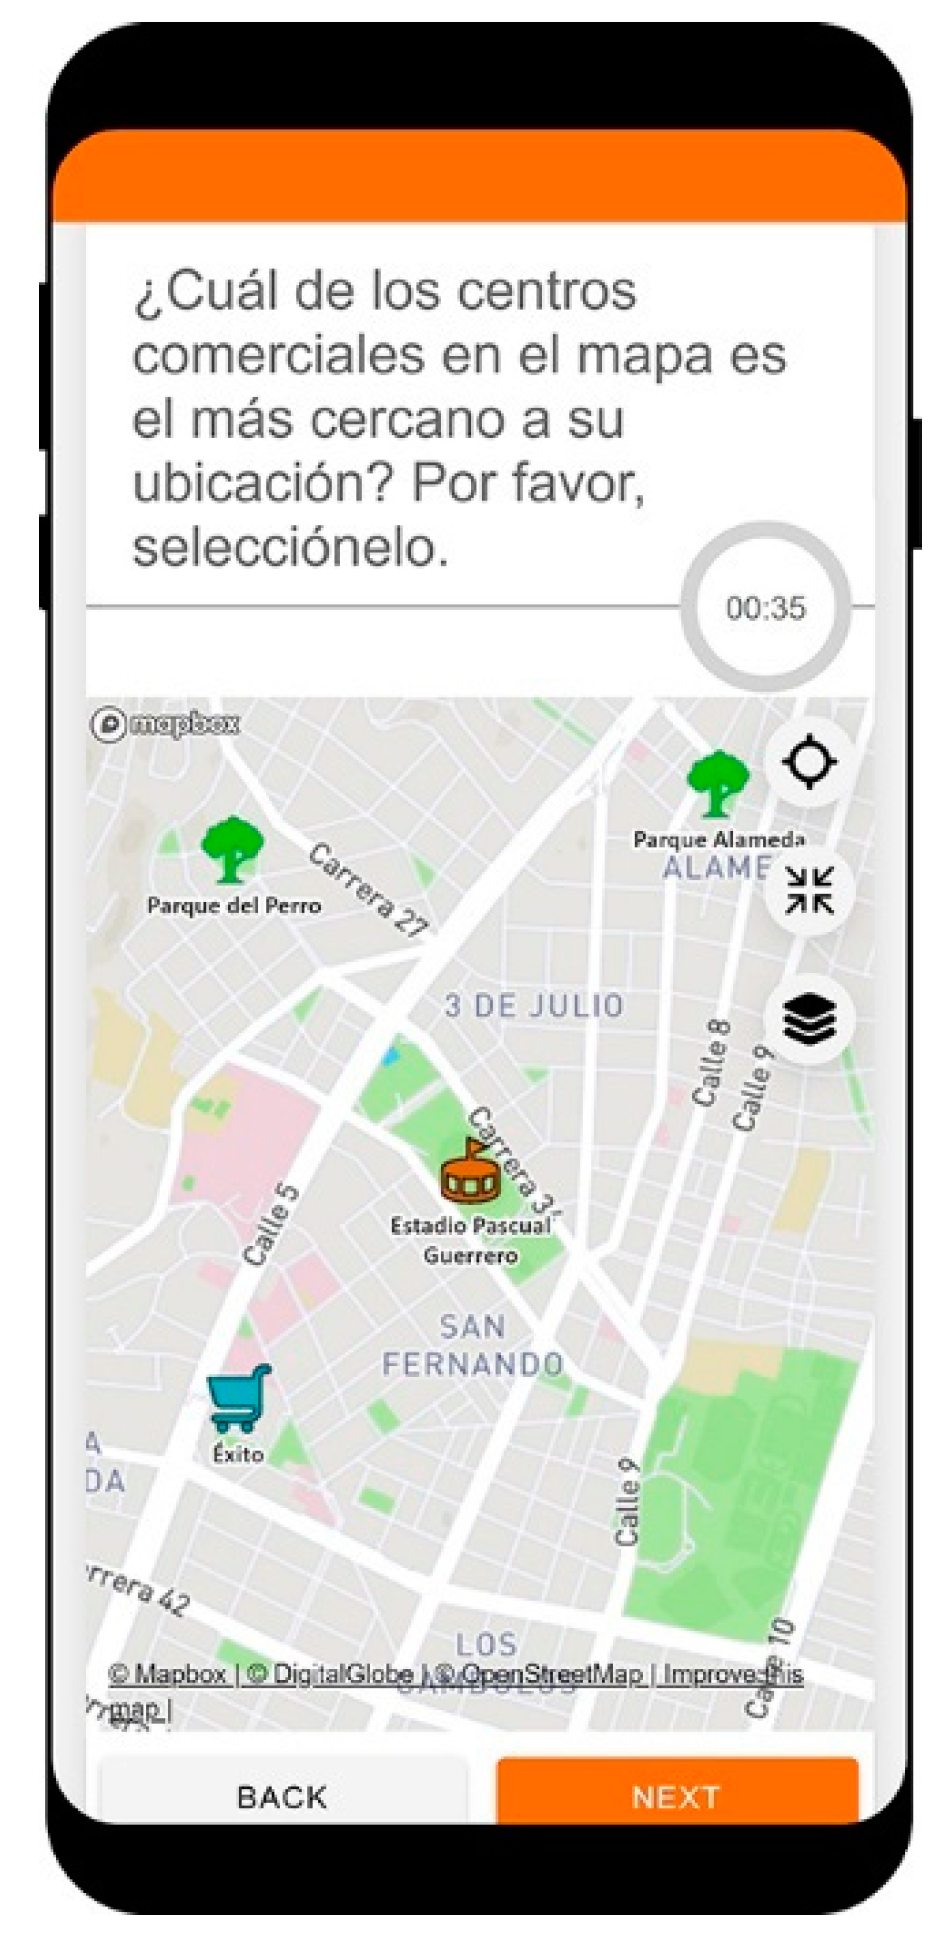
| Map-reading tasks: |
|
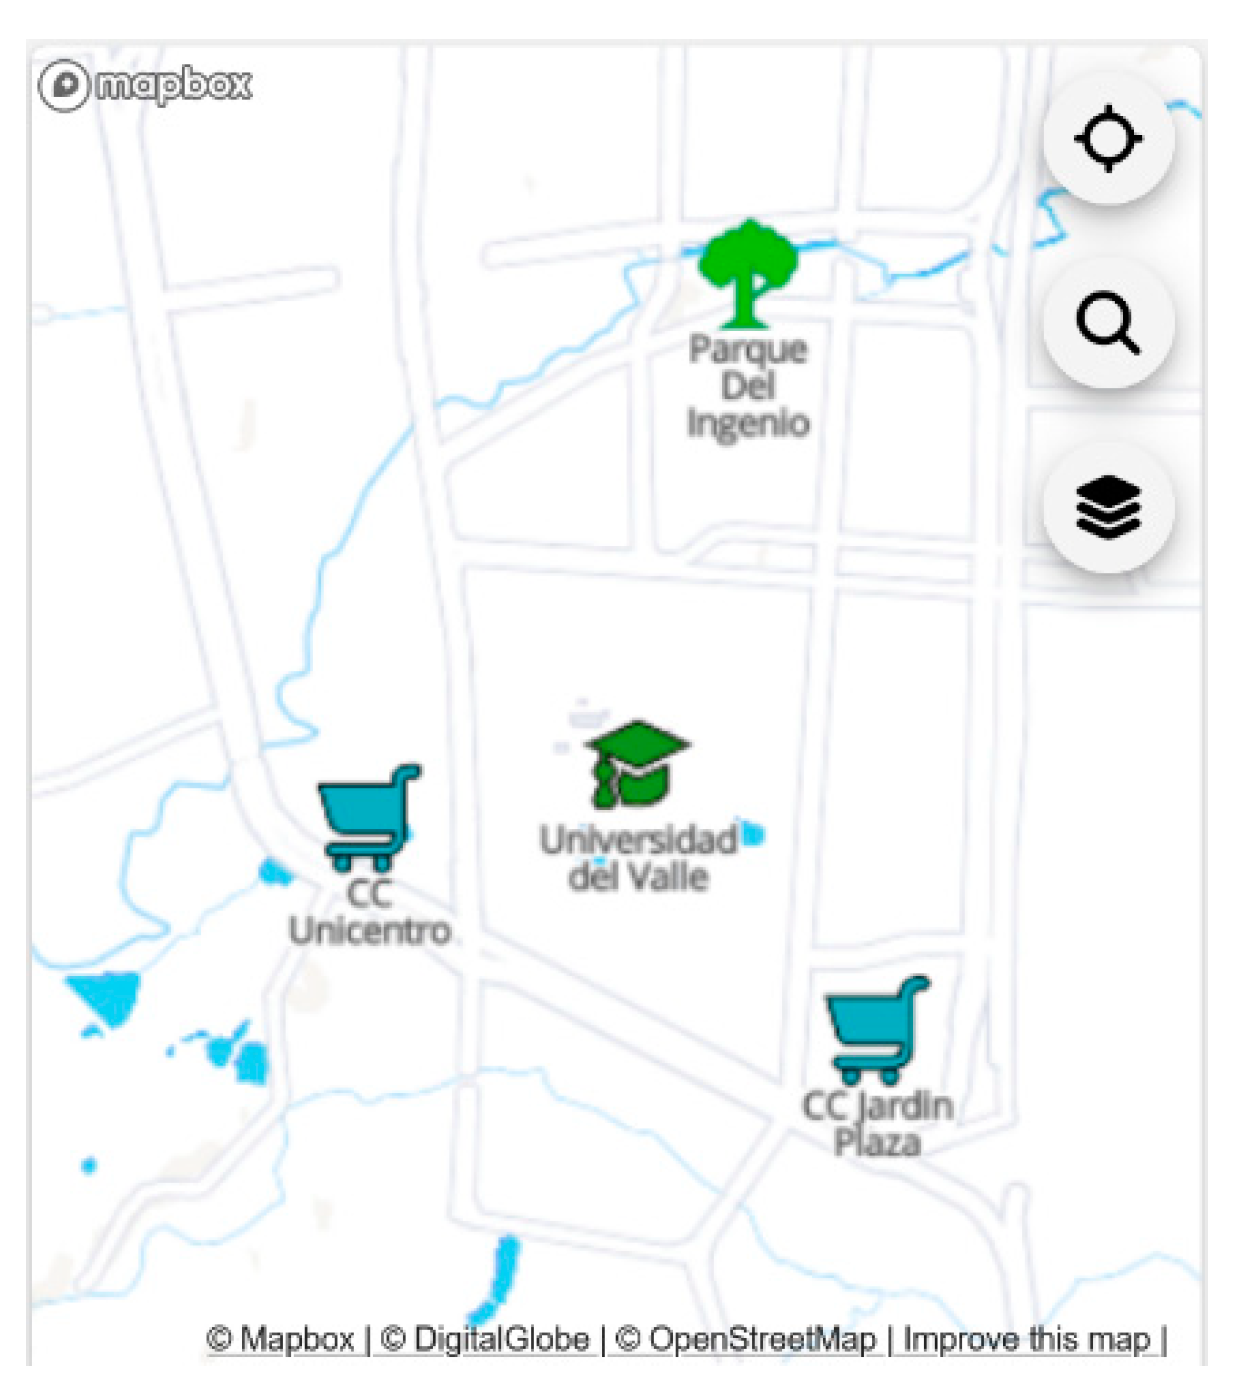
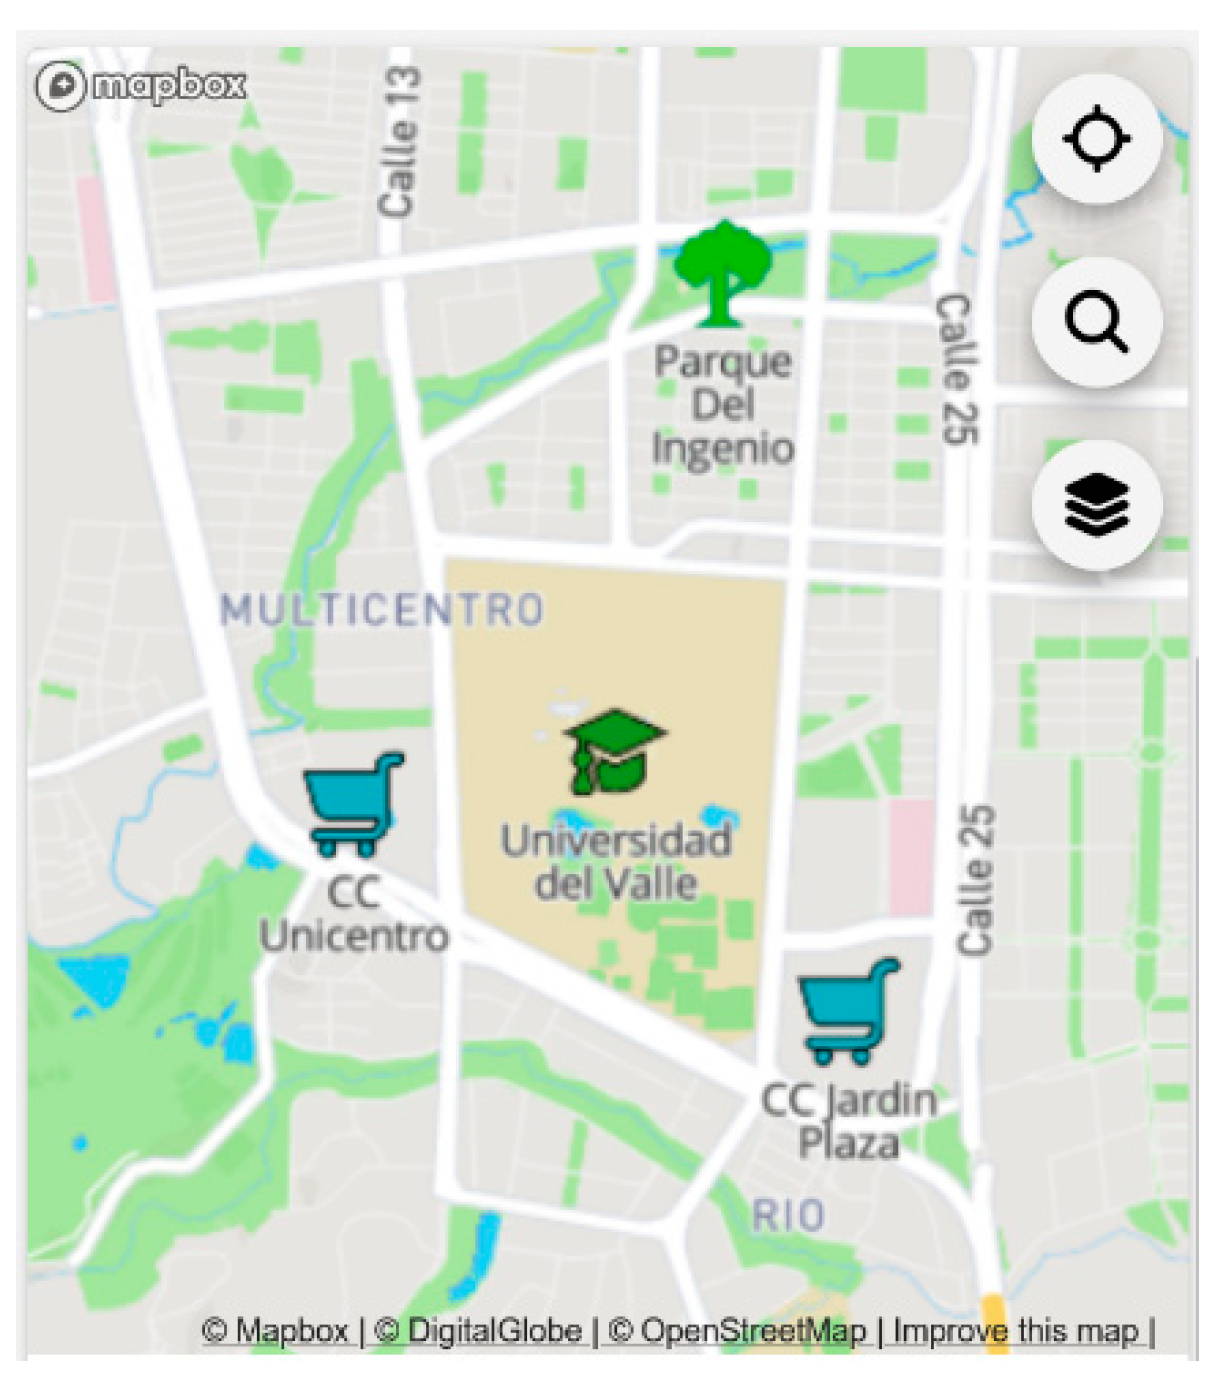
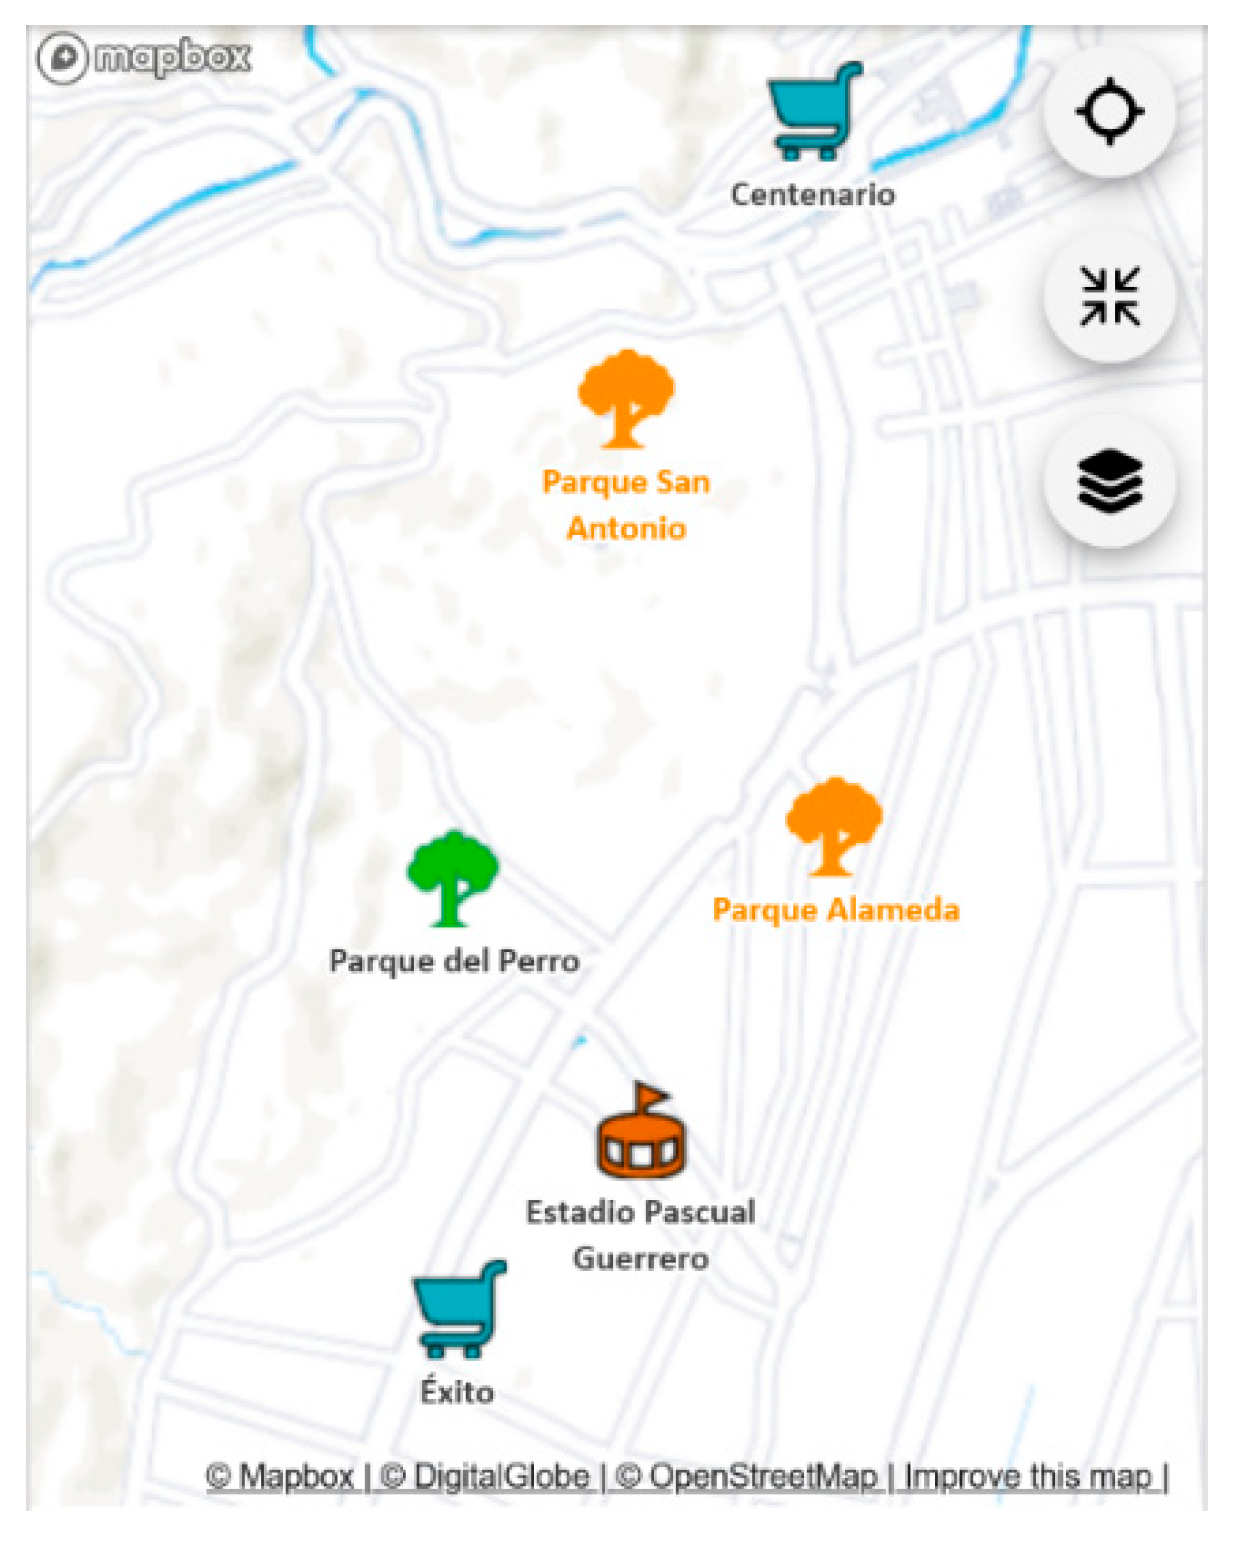
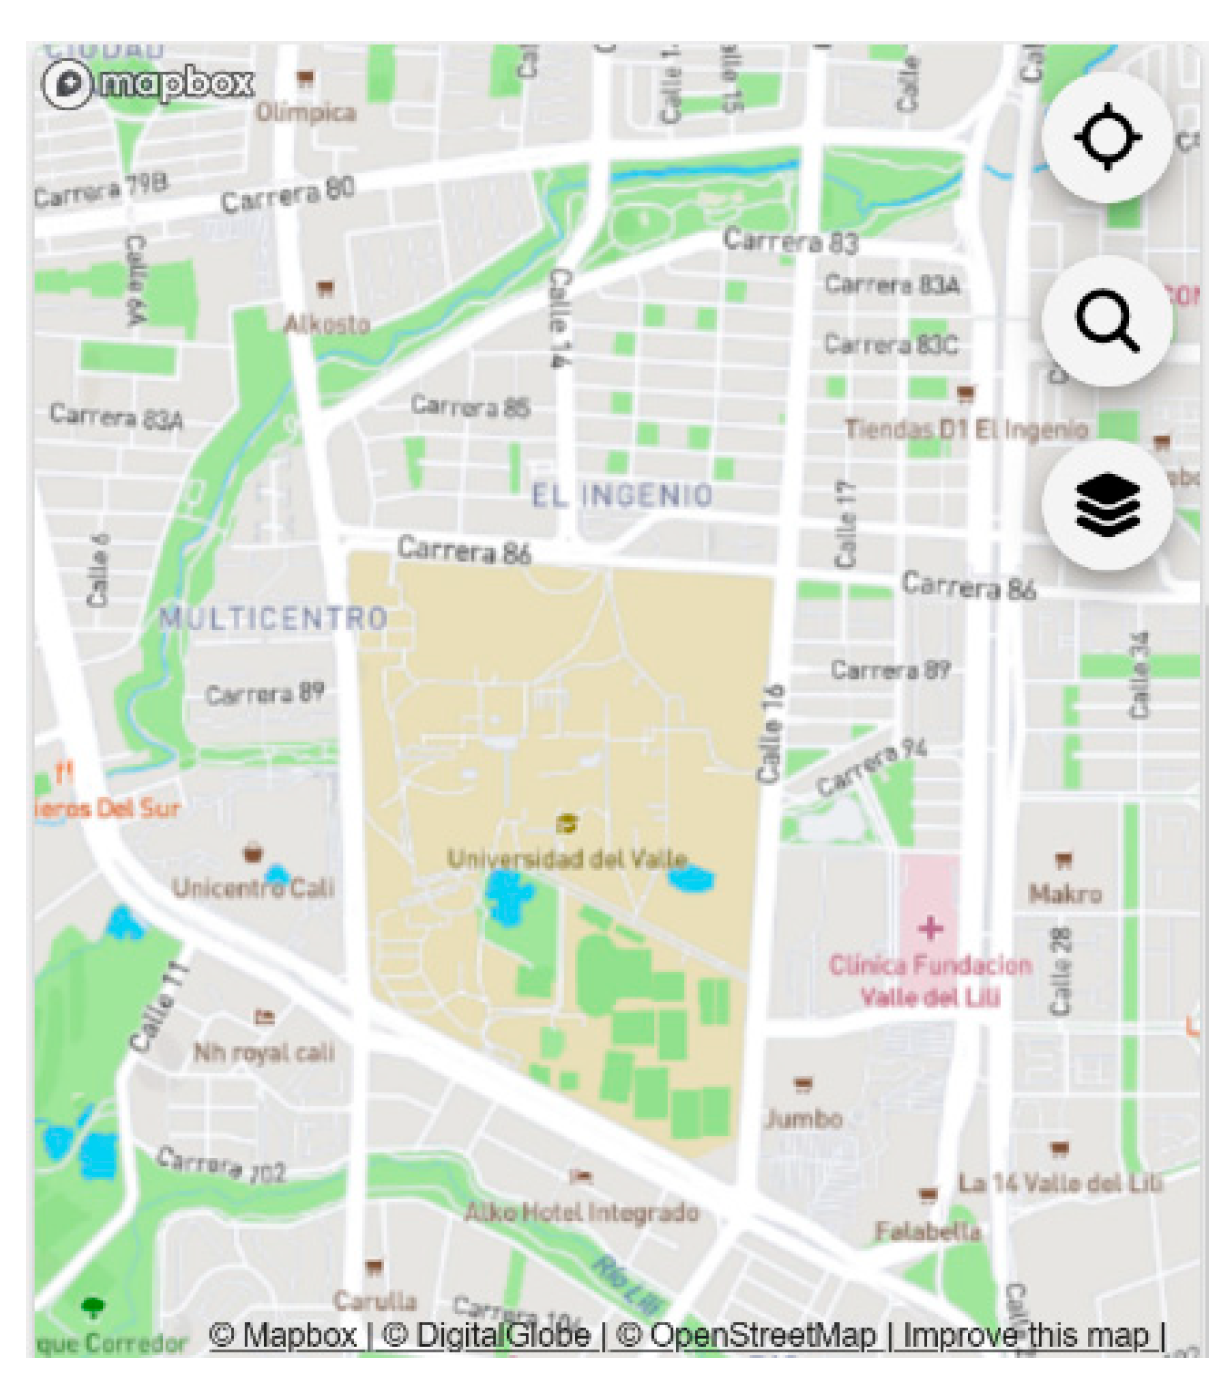
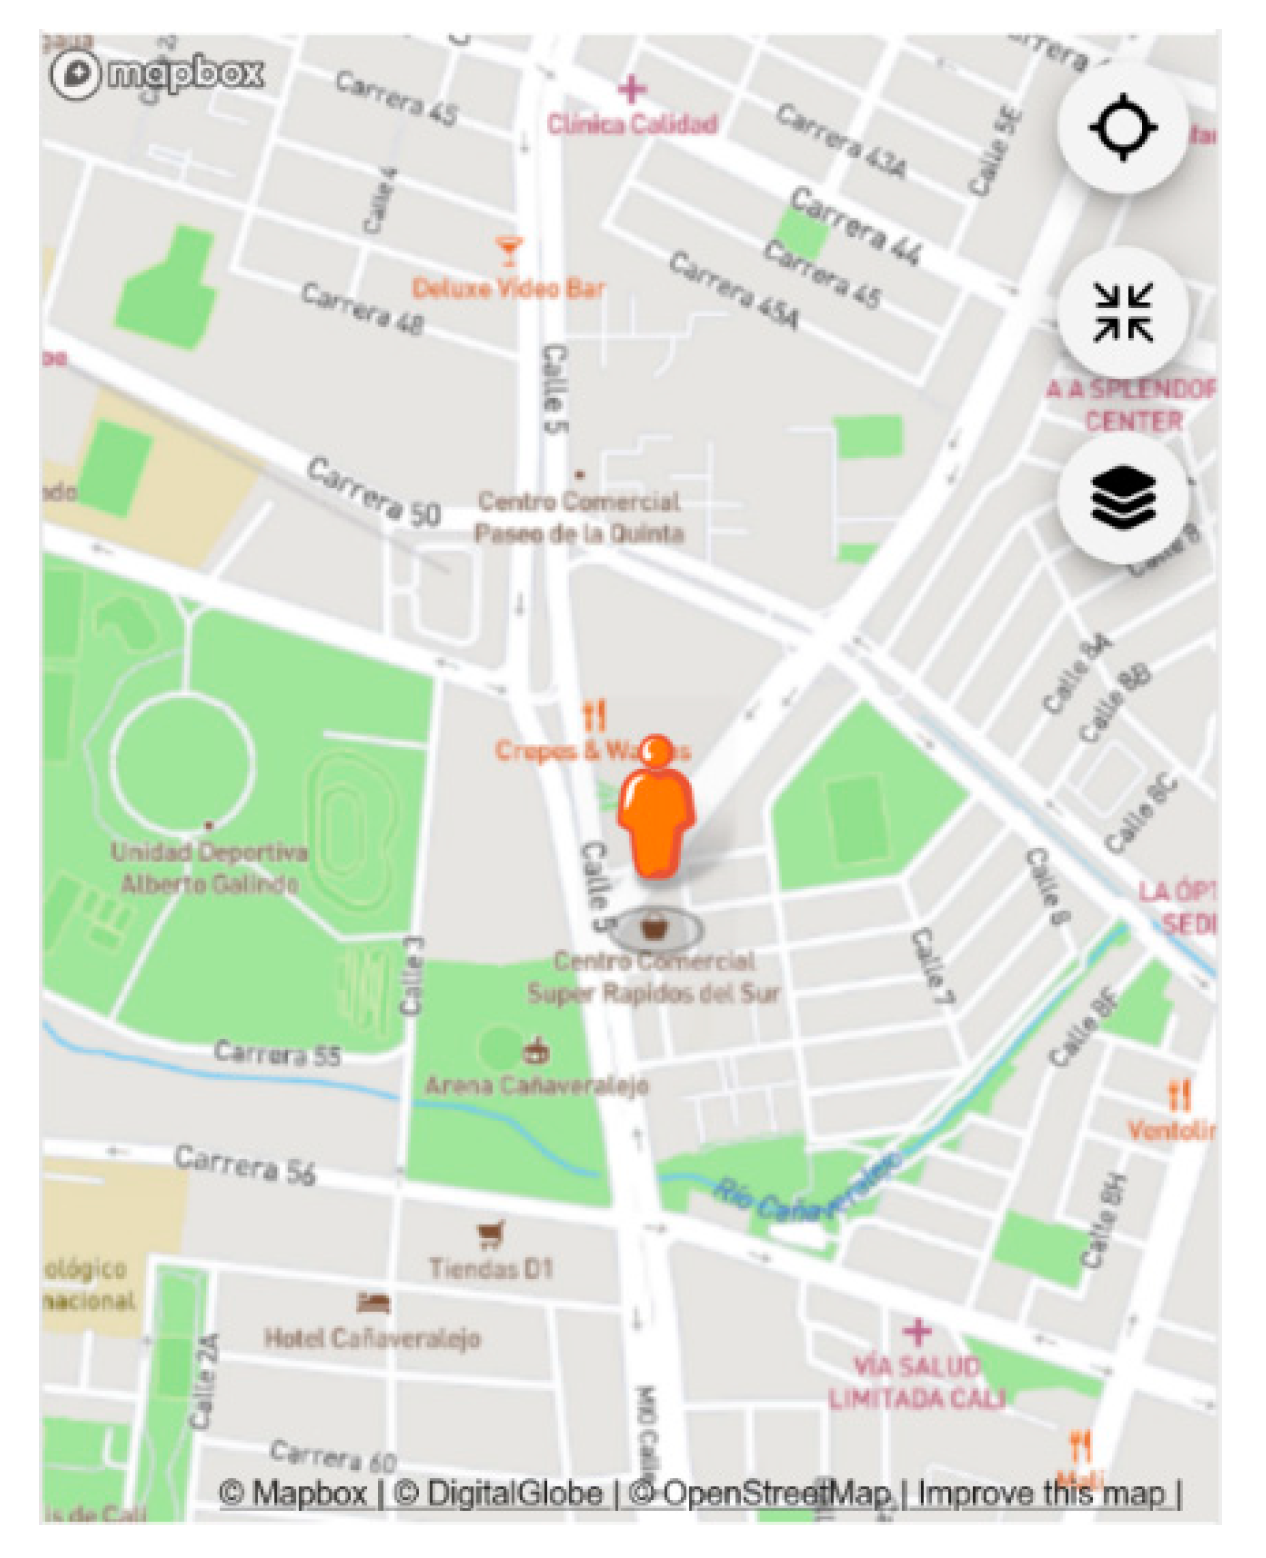
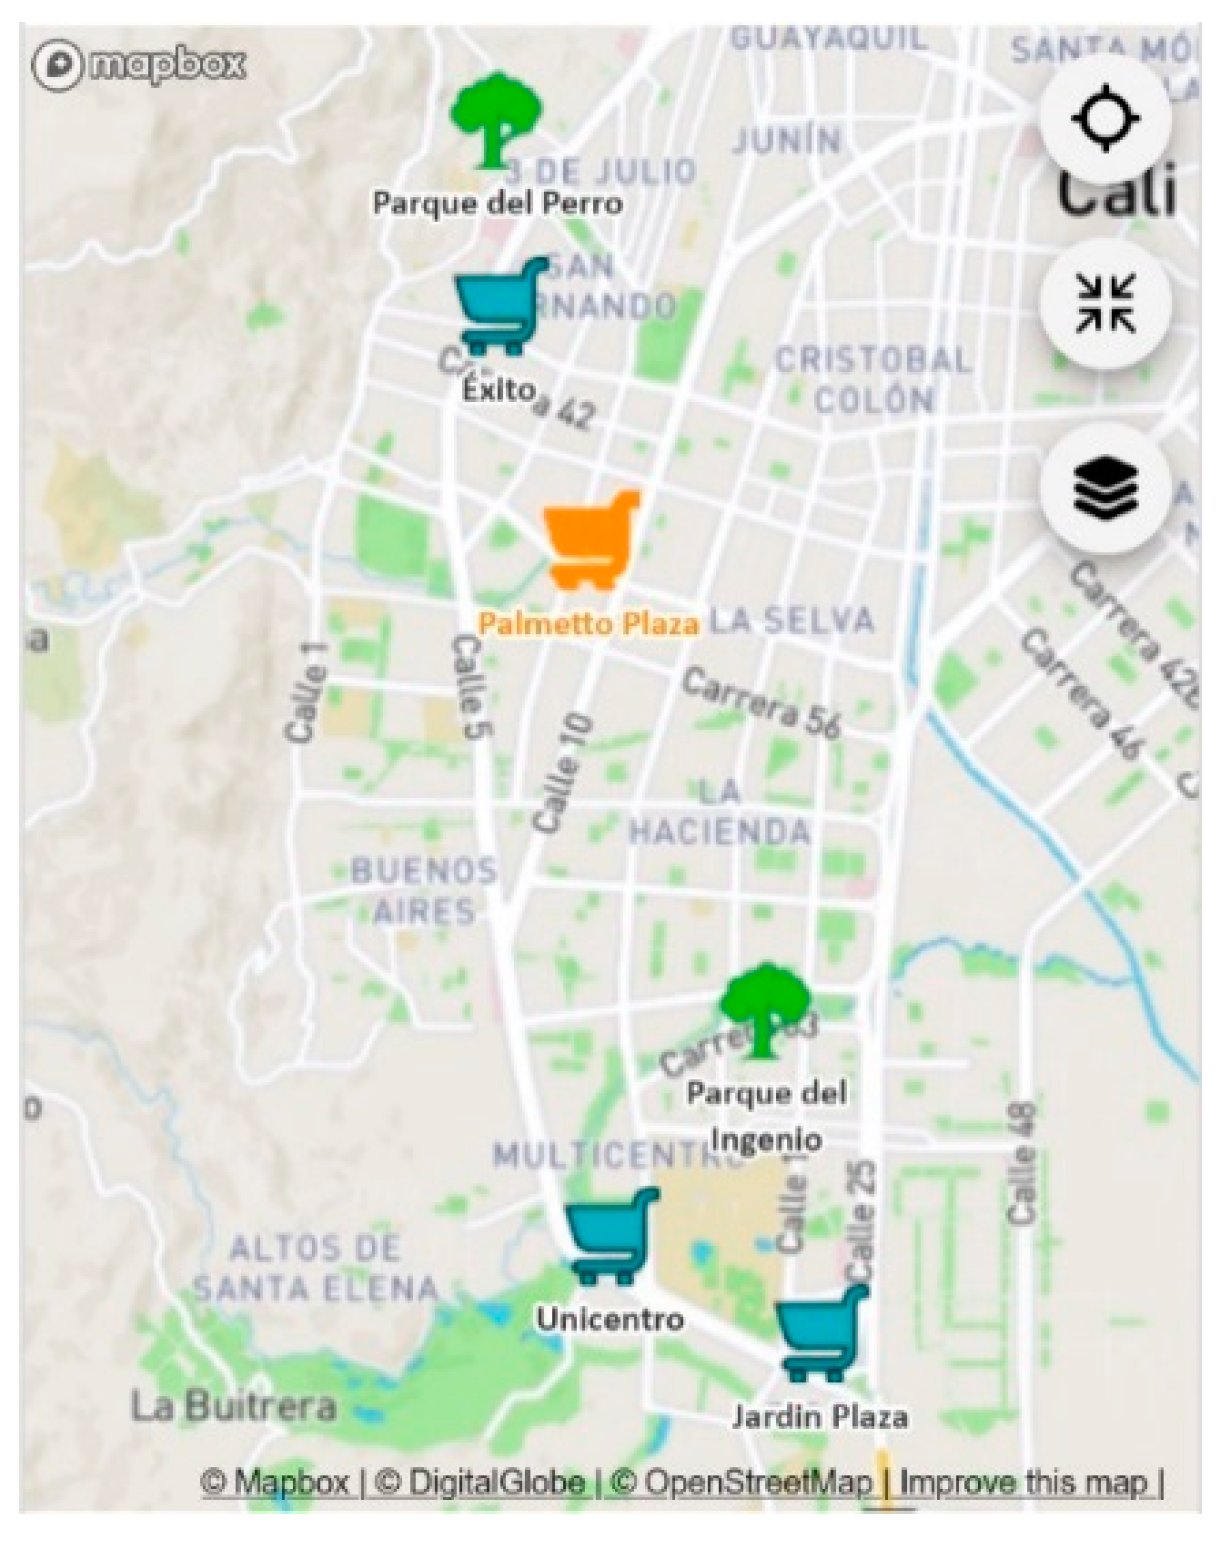
| Base map styles: |
|
| Interactivity variants: |
|
| # | Question: | Choice: |
|---|---|---|
| 1 | How did you feel when solving the map-reading task? |
|
| 2 | Do you think your solution to the map-reading task was… |
|
| A1 | A2 | A3 | A4 | A5 | A6 | ||
| T1: Identify location | Task success | 1.00 | 0.36 | 0.54 | 0.94 | 0.29 | 0.87 |
| Comfort | 1.00 | 0.85 | 0.98 | 0.36 | 0.13 | 0.82 | |
| Confidence | 1.00 | 0.89 | 0.95 | 0.97 | 0.07 | 0.68 | |
| T2: Select point feature | Task success | 1.00 | 0.28 | 0.69 | 0.63 | 0.87 | 0.75 |
| Comfort | 1.00 | 0.85 | 1.00 | 0.49 | 0.69 | 1.00 | |
| Confidence | 1.00 | 0.66 | 0.99 | 1.00 | 0.71 | 0.89 | |
| T3: Select multiple point features | Task success | 0.99 | 0.02 | 0.58 | 0.28 | 0.65 | 0.67 |
| Comfort | 1.00 | 0.62 | 1.00 | 0.52 | 0.73 | 0.90 | |
| Confidence | 1.00 | 0.78 | 0.99 | 1.00 | 0.70 | 0.70 | |
| A1 | A2 | A3 | A4 | A5 | A6 | ||
| Landmark map | Task success | 1.00 | 0.23 | 0.61 | 0.68 | 0.44 | 0.68 |
| Comfort | 1.00 | 0.81 | 1.00 | 0.47 | 0.49 | 0.92 | |
| Confidence | 1.00 | 0.87 | 0.99 | 0.98 | 0.52 | 0.67 | |
| Simple map | Task success | 0.99 | 0.04 | 0.41 | 0.59 | 0.87 | 0.71 |
| Comfort | 1.00 | 0.92 | 1.00 | 0.46 | 0.75 | 0.84 | |
| Confidence | 0.99 | 0.89 | 1.00 | 0.98 | 0.74 | 0.70 | |
| Mapbox Streets | Task success | 1.00 | 0.39 | 0.69 | 0.12 | 0.65 | 0.95 |
| Comfort | 1.00 | 0.59 | 0.99 | 0.39 | 0.49 | 1.00 | |
| Confidence | 1.00 | 0.62 | 0.95 | 1.00 | 0.44 | 1.00 | |
| A1 | A2 | A3 | A4 | A5 | A6 | ||
| Static map | Task success | 1.00 | 0.53 | 0.96 | 0.83 | 0.96 | 0.97 |
| Comfort | 1.00 | 0.92 | 1.00 | 0.63 | 0.86 | 0.92 | |
| Confidence | 1.00 | 0.87 | 1.00 | 1.00 | 0.79 | 0.97 | |
| Restricted map | Task success | 0.99 | 0.02 | 0.37 | 0.53 | 0.46 | 0.65 |
| Comfort | 1.00 | 0.64 | 1.00 | 0.38 | 0.34 | 0.94 | |
| Confidence | 1.00 | 0.79 | 0.95 | 0.98 | 0.44 | 0.68 | |
| Non-restricted map | Task success | 1.00 | 0.16 | 0.42 | 0.23 | 0.47 | 0.62 |
| Comfort | 0.99 | 0.79 | 0.99 | 0.35 | 0.47 | 0.90 | |
| Confidence | 0.99 | 0.75 | 0.99 | 0.97 | 0.39 | 0.67 |
Publisher’s Note: MDPI stays neutral with regard to jurisdictional claims in published maps and institutional affiliations. |
© 2021 by the authors. Licensee MDPI, Basel, Switzerland. This article is an open access article distributed under the terms and conditions of the Creative Commons Attribution (CC BY) license (https://creativecommons.org/licenses/by/4.0/).
Share and Cite
Bartling, M.; Havas, C.R.; Wegenkittl, S.; Reichenbacher, T.; Resch, B. Modeling Patterns in Map Use Contexts and Mobile Map Design Usability. ISPRS Int. J. Geo-Inf. 2021, 10, 527. https://doi.org/10.3390/ijgi10080527
Bartling M, Havas CR, Wegenkittl S, Reichenbacher T, Resch B. Modeling Patterns in Map Use Contexts and Mobile Map Design Usability. ISPRS International Journal of Geo-Information. 2021; 10(8):527. https://doi.org/10.3390/ijgi10080527
Chicago/Turabian StyleBartling, Mona, Clemens R. Havas, Stefan Wegenkittl, Tumasch Reichenbacher, and Bernd Resch. 2021. "Modeling Patterns in Map Use Contexts and Mobile Map Design Usability" ISPRS International Journal of Geo-Information 10, no. 8: 527. https://doi.org/10.3390/ijgi10080527
APA StyleBartling, M., Havas, C. R., Wegenkittl, S., Reichenbacher, T., & Resch, B. (2021). Modeling Patterns in Map Use Contexts and Mobile Map Design Usability. ISPRS International Journal of Geo-Information, 10(8), 527. https://doi.org/10.3390/ijgi10080527