Article

Quantifying the Contributions of Environmental Factors to Wind Characteristics over 2000–2019 in China

1
State Key Laboratory of Remote Sensing Science, Aerospace Information Research Institute, Chinese Academy of Sciences, Beijing 100101, China
2
College of Resources and Environment, University of Chinese Academy of Sciences, Beijing 100049, China
3
China Three Gorges Corporation, Beijing 100038, China
4
State Key Joint Laboratory of Environmental Simulation and Pollution Control, School of Environment, Beijing Normal University, Beijing 100875, China
5
Yellow River Estuary Wetland Ecosystem Observation and Research Station, Ministry of Education, Dongying 257500, China
*
Author to whom correspondence should be addressed.
ISPRS Int. J. Geo-Inf. 2021, 10(8), 515; https://doi.org/10.3390/ijgi10080515
Submission received: 15 June 2021 / Revised: 21 July 2021 / Accepted: 28 July 2021 / Published: 30 July 2021

Abstract

:
Global climate change and human activities have resulted in immense changes in the Earth’s ecosystem, and the interaction between the land surface and the atmosphere is one of the most important processes. Wind is a reference for studying atmospheric dynamics and climate change, analyzing the wind speed change characteristics in historical periods, and studying the influence of wind on the Earth-atmosphere interaction; additionally, studying the wind, contributes to analyzing and alleviating a series of problems, such as the energy crisis, environmental pollution, and ecological deterioration facing human beings. In this study, data from 697 meteorological stations in China from 2000 to 2019 were used to study the distribution and trend of wind speed over the past two decades. The relationships between wind speed and climate factors were explored using statistical methods; furthermore, combined with terrain, climate change, and human activities, we quantified the contribution of environmental factors to wind speed. The results show that a downward trend was recorded before 2011, but overall, there was an increasing trend that was not significant; moreover, the wind speed changes showed obvious seasonality and were more complicated on the monthly scale. The wind speed trend mainly increased in the western region, decreased in the eastern region, was higher in the northeastern, northwestern, and coastal areas, and was lower in the central area. Temperature, bright sunshine duration, evaporation, and precipitation had a strong influence, in which wind speed showed a significant negative correlation with temperature and precipitation and vice versa for sunshine and evapotranspiration. The influence of environmental factors is diverse, and these results could help to develop environmental management strategies across ecologically fragile areas and improve the design of wind power plants to make better use of wind energy.

1. Introduction

Against the background of global climate change and human overutilization of water resources, the Earth system on which we depend is undergoing immense changes, and a series of major global ecological and environmental problems have emerged, such as land desertification, global warming, increasing droughts, and water shortages [1,2,3]. More importantly, changes in storm energy are related to changes in wind and climate change, especially in coastal areas. For example, coastline retreat has significantly accelerated in the Atlantic, and unusual variation waves, wind approach directions, and erosion have increased during the 21st century [4,5,6,7]. These problems have affected the living environment of humankind and the sustainable development of society and the economy, which has attracted great attention from government agencies in various countries [8,9,10].
Studying the causes of these phenomena and their internal mechanisms and predicting their development and possible consequences as accurately as possible has become one of the major topics of contemporary scientific research [11,12]. The interactions between the land surface and the atmosphere are one of the most important processes [13], and wind plays a critical role in the study of Earth-atmosphere interactions [14,15]. Wind is a basic parameter describing the thermal and dynamic state of the atmosphere, and the occurrence of precipitation, haze, and strong convections are all closely related to changes in wind speed [16]. Real-time detection of changes in the wind field at different levels of the atmosphere is essential for numerical weather forecasting, climate change research, and various meteorological support tasks [17,18]. Changes in the wind field are closely related to the development and changes in turbulence, and changes in the wind speed can play an important role in the local area and even global atmospheric circulation and climate change. The near-surface wind speed has an important impact on transportation, urban and rural construction, and the planning of bridges, ponds, and dams [19,20].
Simultaneously, wind energy is a clean and renewable new form of energy with great application potential. Currently, under the influence of the rapid deterioration of the Earth’s ecological environment and the severe shortage of traditional fossil energy, countries around the world are paying increasing attention to the impact of wind speed, a meteorological element, on the Earth’s climate and ecology. At the same time, in the analysis and evaluation of wind energy resources, the intensity of wind development and use is increasing [21,22,23,24]. China has a vast territory and diverse climate changes. Generally, the wind energy of China reserves is quite strong, and in-depth research on wind energy is an inevitable demand [25,26,27]. Therefore, it is particularly important to study and analyze wind speed and wind energy near the ground surface.
It is important to analyze the change characteristics of wind speed in the historical period to use wind energy resources more rationally, which has a great impact on alleviating the current energy crisis, environmental pollution, ecological deterioration, and other problems faced by humankind [28,29,30]. Wind speed is a reference for studying atmospheric dynamics and climate change, and the data can be used to analyze the laws of atmospheric changes, thereby, enhancing the ability of humankind to analyze and predict meteorological and global climate changes.
Wind speed is an important driving force for hydrological processes, and surface wind is an important driving force for ocean and atmospheric circulation. A moderate wind will seriously affect the atmosphere and ocean dynamics, air-sea flux, and evapotranspiration flux [15,31,32]. Wind plays a vital role in the ecosystem and water cycle because it strongly affects the evapotranspiration rate [33,34,35]. Wind has a significant influence on the evaporation processes in bare soil, water, ice, snow and other unique underlying surfaces; it defines the interaction characteristics of the material and energy exchange between the near-surface airflow and the underlying surface and has been widely used to characterize the aerodynamic properties of various surfaces [36]. In the research of latent heat flux remote sensing mechanism models, it is necessary to consider the influence of wind speed. On the basis of remote sensing input data and ground observation data, such as wind speed and wind direction, the development of dynamics-related models can better meet the needs of Earth-atmosphere process simulation [37] and improve the estimation accuracy of evapotranspiration on unique underlying surfaces.
The change trend of the wind field is the most significant aspect of the changes in the Earth’s climate system [38]. Studies on wind fields can be roughly divided into two categories: studies on wind field changes in ocean and land areas and studies on wind field changes in coastal and inland areas. Several studies involving the calculation of wind speed changes on a local or global scale have suggested that there are significant differences in wind speed changes in different regions of the world [39,40,41,42]. Moreover, global warming will change the atmospheric circulation, which means related changes in wind that consequently lead to wave and surface flux changes. In other words, due to a decrease in the temperature difference between the poles and the equator, the global air circulation will slow down (especially in northern latitudes), but in certain areas, local wind speeds may increase due to local temperature gradients [43,44,45,46,47].
Several studies have reported that the trend of wind speed in China has changed significantly in the past several years [48,49,50,51,52,53,54,55]; however, since the beginning of the 21st century, the characteristics of wind speed in China in the past 20 years have rarely been studied directly, and studies on the impact of environmental factors is relatively limited. The major objective of this study is to explore the wind speed characteristics in the past 20 years in China and to further quantify and synthesize the contributions and impacts of environmental factors analyzed in the context of environmental changes. Thus, we studied the distribution and trend of wind speed based on data from 697 meteorological stations in China from 2000 to 2019; we discussed the relationships among climate variables using statistical methods and offered some important insights based on different terrain and landcover, climate changes, and human activities. The results could help to improve environmental management in average regions.

2. Data and Study Area

2.1. Study Area

China is located in eastern Asia along the western side of the Pacific Ocean. The area is from the heart of the Heilongjiang River near Mohe in the north to Zengmu Ansha in the Nansha Islands in the south and from the Pamirs in the west to the confluence of Heilongjiang and Ussuri in the east [56]. The land area is 9.6 million square kilometers, and the land boundaries comprise more than 20,000 km. The topography of China is high in the west and low in the east. The ratios of various terrain types across the country’s land area are 33.3% mountainous areas, 26% plateaus, 18.8% basins, 12% plains, and 9.9% hills [57].
The climate in China is complex and diverse, including a temperate monsoon climate, a subtropical monsoon climate, a tropical monsoon climate, a tropical rainforest climate, a temperate continental climate, a plateau mountain climate, and other climate types, which span tropical, subtropical, warm temperate, moderate temperate, and cold temperate climate, from south to north [58]. The precipitation in China is characterized by less rain in winter and more rain in summer. The time distribution of annual precipitation is a greater concentration of precipitation in summer and autumn, decreasing from the southeast coast to the northwest inland areas [59].
In this study, to ensure the consistency of data from 2000 to 2019 at each site, we selected 697 stations from China’s 699 benchmark and basic weather stations. The distribution of selected sites is shown in Figure 1. There are more sites in the eastern region than in the western region because the western region of China is vast and sparsely populated and the terrain structure is relatively complex and includes mainly plateaus and deserts. The resources and economy of the western region also lag behind those of the eastern region.

2.2. Data

2.2.1. Meteorological Data

The dataset (V3.0) of daily values of climate data from Chinese surface stations used in this study includes average temperature, atmospheric pressure, relative humidity, wind speed, precipitation, sunshine duration, and evaporation amount. All climate data were collected from 697 meteorological stations in China (see Figure 1) and downloaded from the China Meteorological Data Service Center (CMDC) (http://data.cma.cn/en, accessed on 30 May 2021). We interpolated temperature, sunshine duration, and evaporation climate data toward a 1 km resolution using the China Geodetic Coordinate System 2000 by means of the inverse distance weighted interpolation method [60,61].
After data quality control by CMDC, the quality and integrity of various elements were significantly improved as compared with previous similar ground data products. The availability of various weather elements is generally above 99%, and the correct data rate approaches nearly 100%.

2.2.2. Land Cover and Digital Elevation Model (DEM) Data

The land cover and land use products were from China land cover datasets (30 m spatial resolution) from 2000, 2005, 2010, and 2015. To more clearly distinguish among categories, this study adopted the majority sampling method to resample them at a 1 km spatial resolution. Previously, Landsat TM/ETM data and Chinese HJ-1 satellite data were used to map land cover and reclassify it into forestlands, grasslands, croplands, wetlands, built-up lands, and other lands. The overall accuracy of the China land cover’s first class was above 94% [62], and the overall accuracy of the second class was above 86% [63]. The relative accuracy of ChinaCover is high; therefore, it can be used to measure the influence of the underlying surface on wind speed.

2.2.3. Precipitation Data

The precipitation data of China over the period from 2000 to 2019 were obtained by fusion of the Climate Hazards Group InfraRed Precipitation with Station data (CHIRPS), which is a 30+ year quasi-global rainfall dataset. CHIRPS incorporate 0.05° resolution satellite imagery with in situ station data to create gridded rainfall time series for trend analysis and seasonal drought monitoring [64]. In this study, we calculated the average annual precipitation from 2000 to 2019, which was clipped and downloaded from GEE.

2.2.4. Climate Classification

In this study, we adopted the Köppen–Geiger climate classification to explore wind speed changes and their effects. The Köppen climate classification is one of the most widely used climate classification systems [65], which divides climates into five main climate groups, with each group being divided based on seasonal precipitation and temperature patterns. The five main groups are A (tropical), B (dry), C (temperate), D (continental), and E (polar). Each group and subgroup are represented by a letter. All climates are assigned one primary group (the first letter). All climates, with the exception of those in group E, are assigned a subgroup of seasonal precipitation (the second letter).

3. Methods

3.1. Weibull Distribution

In the evaluation and utilization of wind farms, an important factor is determining the wind speed distribution in the area. In this study, we used the Weibull distribution function to determine the wind speed distribution of China. The Weibull distribution is a continuous distribution established by W. Weibull in 1939 when he studied the failure strength of materials. Because of its flexible transform form, simple function form, and ability to simulate natural phenomena well, the Weibull distribution has received widespread attention.
The Weibull probability distribution function is desirable to represent the fluctuation in wind speed over any period of time using two parameters, and the probability density function is defined as follows [66,67]:
f v = k c v c k 1 e x p v c k
The Weibull cumulative distribution function is the integration of the Weibull probability distribution function, which is the cumulative relative frequency for each speed interval [68]. The distribution function is defined as follows:
f v = 0 v f v d v = 1 e x p v c k
where v is the wind speed; c > 0 is the scale parameter; the larger c is, the larger the value of the independent variable with the highest frequency; and k > 0 is the shape parameter, which represents the distribution shape. For example, when k = 1, it is an exponential distribution; when k = 2, it is a Rayleigh distribution.
The estimation methods of Weibull distribution parameters c and k include the card method [69], the first moment method [70], the graph method (regression method) [71], and the maximum likelihood method. The maximum likelihood method can directly estimate parameters c and k from the wind speed time series, which better adapts to the characteristics of computer programming [72]. The parameter estimation formula of the maximum likelihood method is defined as follows:
k = t = 1 n v t l n v t t = 1 n v t k t = 1 n l n v t n 1
c = 1 n t = 1 n v t k 1 / k
where v t represents the wind speed at step t and n is the number of nonzero wind speeds. Suppose k = 2, and iterate according to Formulas (3) and (4) until c is stable. Using the maximum likelihood method to estimate the two parameters of the Weibull distribution is more accurate than other methods [71] because it overcomes the error caused by the artificial division of wind speed frequency intervals. Hence, in this study, we adopted this method for parameter estimation.

3.2. Mann–Kendall Trend Test

For the trend analysis of time series natural events, such as wind speed, the Mann–Kendall (M-K) test method is not affected by sample values or distribution types, and is recommended and widely used by the World Meteorological Organization [73]. In this study, we used M-K to detect the trend of wind speed changes at 697 meteorological stations in the past two decades. For time series variables x 1 , x 2 , , x t , t is the length of the time series, and the M-K method defines the statistics as follows:
S = i = 1 n 1 j = i + 1 n s g n x j x i
where n is the length of the samples; i , j = 1, 2, …, n; x j and x i represent the data values at times j and i , respectively; the positive or negative value of S indicates that it is an increasing or decreasing trend; s g n is a sign function, and the rules are defined as follows:
s g n x j x i = 1 , x j x i > 0 0 , x j x i = 0 1 , x j x i < 0
When n > 10, the statistic S is normally distributed, the average is 0, and the variance is calculated as follows:
Var S = n n 1 2 n + 5 18
Then, the normal distribution statistics are calculated as follows:
Z = S 1 v a r S ,               S > 0                       0 ,               S = 0 S + 1 v a r S ,               S < 0
If Z > 0, it indicates that the wind speed is increasing in the time series; otherwise, it is decreasing; if Z = 0, it remains unchanged. The significance of the trend is determined by the absolute value of Z , if Z > Z α / 2 = 1.96 , (i.e., α = 5 % ), the trend is significant, if 1.96 > Z > Z α / 2 = 1.64 (i.e., α = 10 % ), the trend is marginally significant, and there is a lack of significance if 1.64 = Z α / 2 > Z > 0 .

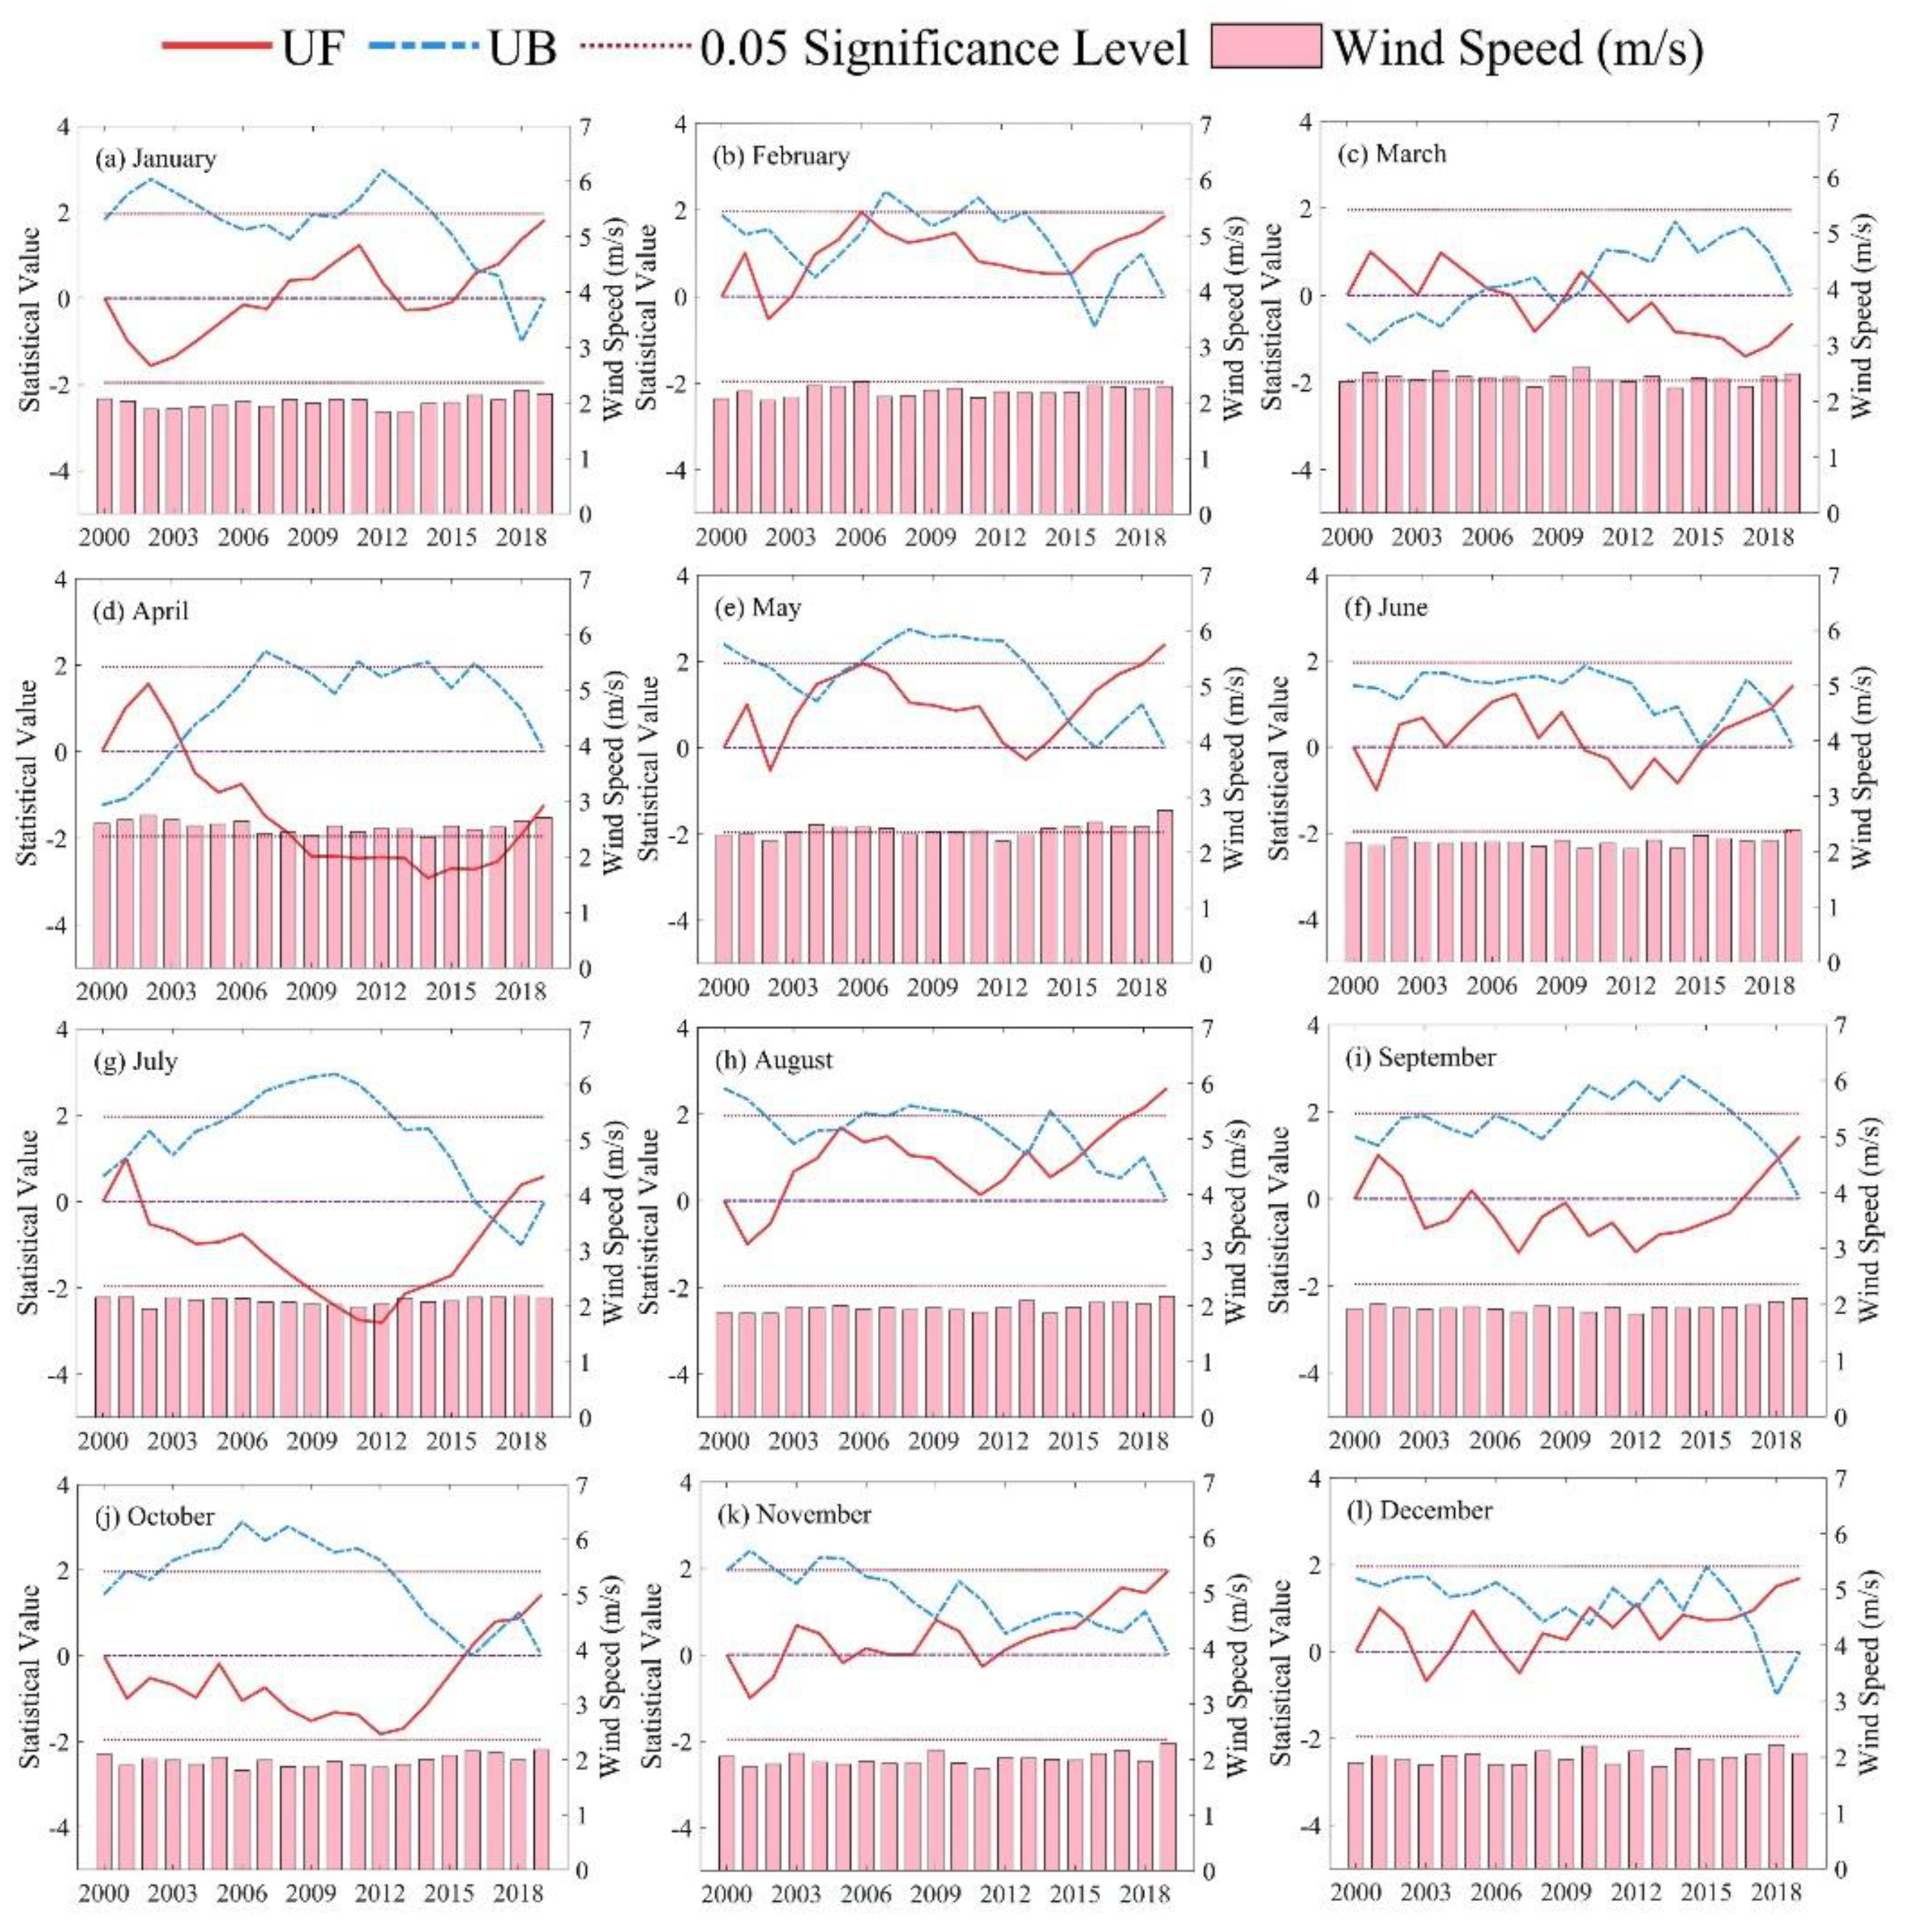
3.3. Mann–Kendall Abrupt Change Test

Climate system change is an unstable and discontinuous process, and one of the commonly used methods to test its changes is the M-K mutation test, which is very effective to test for changes in elements from one state to another. For time series X n (n is the length of the samples), an anecdotal series is constructed as follows:
S k = i = 1 k r i           k = 2 , 3 , , n
and
r i = 1 , x i > x j 0 , x i x j           j = 1 , 2 , , i
where the anecdote sequence S k is the cumulative number of times x i > x j . Under the assumption of random independence of the time series, the statistics are defined as follows:
U F k = s k E s k V a r s k           k = 1 , 2 , , n
where U F 1 = 0 , E s k and V a r s k are the average and variance in cumulative number S k , respectively. When x 1 , x 2 , , x n are independent of each other and have the same continuous distribution, they can be calculated by the following equations:
E s k = n n 1 4
V a r s k = n n 1 2 n + 5 72
According to the time series x in reverse order x n , x n 1 , , x 1 , repeat the above process to obtain U B k , and make U B k = U F k ,   k = n , n 1 , , 1 , and U B 1 = 0 . Then, given the significance level α , integrate the two statistical curves of U F k and U B k , and the significance level line on the same graph, when U F k > 0 or U B k > 0, which indicates that the sequence has an increased trend; otherwise, it has a decreased trend. When the sequence exceeds the critical straight line, it indicates a significant upward or downward trend. The range beyond the critical line is determined to be the time zone where the sudden change occurs. If the two curves of U F k and U B k have an intersection point, and the intersection point is between the critical lines, then, the time corresponding to the intersection point is the time when the mutation starts. In this study, the significance level α = 0.05 .

3.4. Spearman Correlation Analysis

The Spearman correlation coefficient is used to estimate the correlation between two variables X and Y, and the correlation between variables can be described by a monotonic function. If the same two elements do not exist in two sets of values for two variables, then, when one of the variables can be expressed as a monotonic function of the other variable (that is, the two variables have the same changing trend), the correlation coefficient of the two variables can reach +1 or −1. The equation of the correlation coefficient is defined as follows:
ρ = i x i x ¯ y i y ¯ i x i x ¯ 2 i y i y ¯ 2
The Spearman correlation coefficient has less strict requirements for data conditions than the Pearson correlation coefficient. As long as the observations of the two variables are paired or converted from continuous variable observations, regardless of the overall distribution of the two variables, the sample Spearman correlation coefficient can be used to study the size of the capacity. In this study, we used this method to evaluate the correlation between wind speed and other meteorological variables.

4. Results

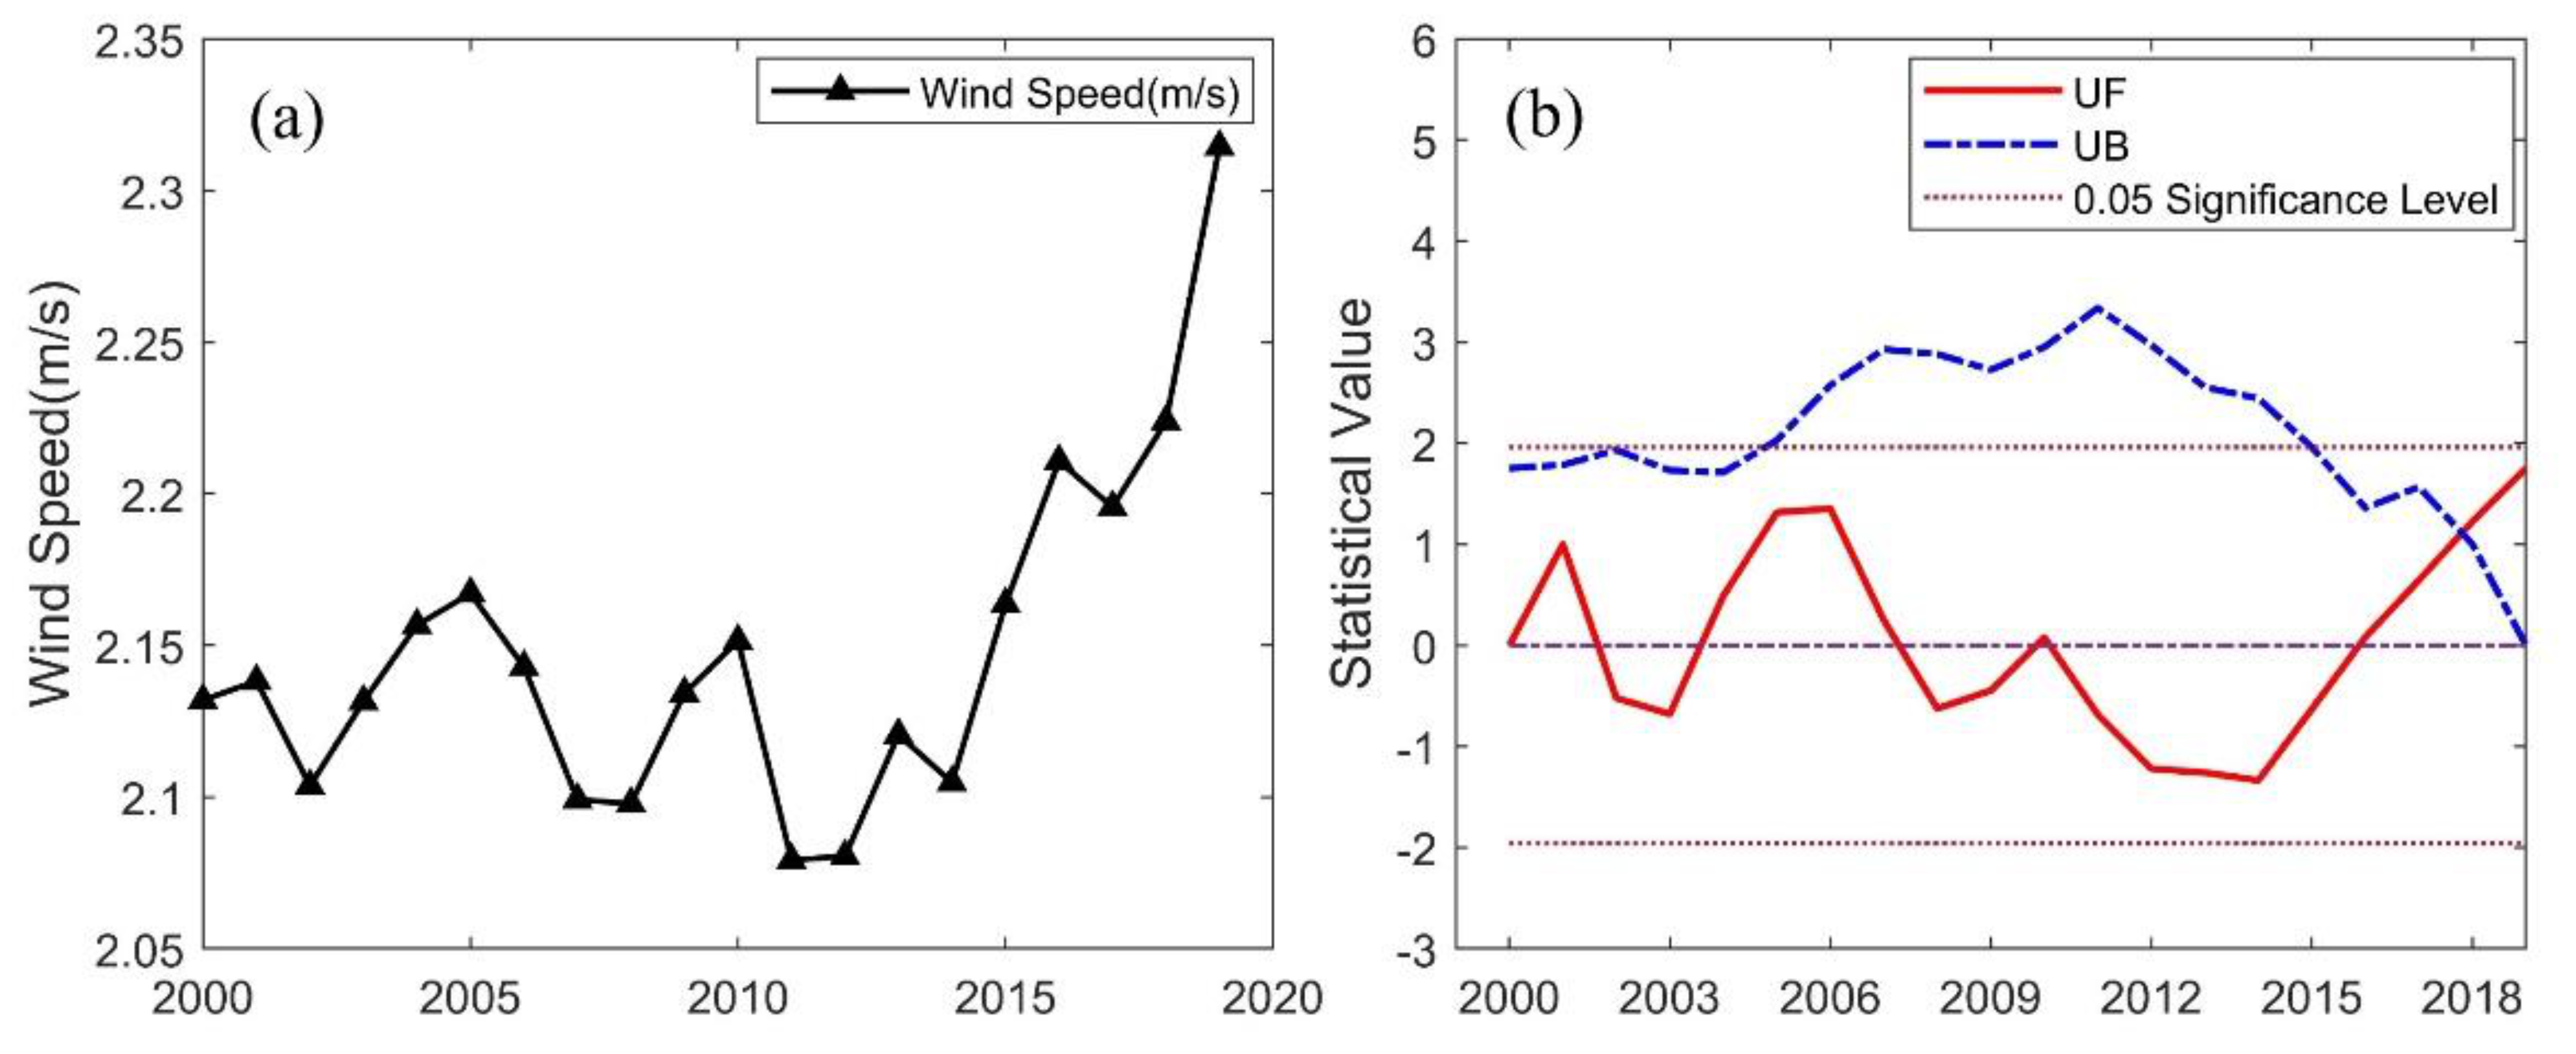
4.1. Wind Speed Changes in China from 2000 to 2019

The annual changes and trend characteristics of wind speed in China from 2000 to 2019 are shown in Figure 2. Figure 2a shows that the annual average wind speed fluctuates between 2.05 and 2.35 m/s, the mean wind speed in the past 20 years was 2.15 m/s with the maximum wind speed recorded in 2019 (2.31 m/s) and the minimum wind speed recorded in 2011 (2.07 m/s). Through statistical calculations, Figure 2b shows the trend in mean annual wind speed in China for the period of 2000–2019 detected by the M-K trend test. The significance level is 0.05, indicating that the critical value of statistics UB and UF is ±1.96. The UB-UF statistics of wind speed intersected in 2017 and are between the critical lines; hence, this year was when the sudden change began, which is consistent with Figure 2a. The value of UF is mostly greater than zero, but the change trend is basically between the critical lines, indicating that the wind speed experienced an increasing trend that was not significant. Moreover, before 2011, a downward trend was recorded in China, which is consistent with most research results [74].
Figure 3 shows the seasonal changes and M-K trend test curve of wind speed in China from 2000 to 2019. The highest wind speed occurred in spring over the past 20 years, while the lowest was recorded in autumn, and there was not a significant difference between summer and winter (Figure 3a). Notably, the seasonal wind speed change trend was obviously different in individual years, for example, the wind speed in spring, summer and autumn experienced the same upload trend from 2012–2013, and the reverse occurred in winter, which has certain value for the study of seasonal wind speed. Figure 3b–e illustrates the wind speed trends in the four seasons over the past 20 years. Compared with the other three seasons, there were three intersections between the UB-UF statistical values in spring during 2000, 2006, and 2019, indicating that the changing trend was more complicated. Considering that 2000 and 2019 were the beginning and end moments, the uncertainty was large, and the trend line of change was continuous; therefore, it was determined that the years were not mutation points; hence, 2006 was the mutation point. Since the value of UF was mostly less than zero and within the critical line, the trend was downward with no significance, as in autumn. In contrast, summer and winter had the same trend, and the UF value was mostly larger than zero, revealing an increasing trend in these two seasons.
We calculated the mean value of wind speed and its changing trend on a monthly basis from 2000 to 2019 (Figure 4). The mean wind speed in each month with the maximum wind speed recorded in April (2.55 m/s), and the minimum wind speed was recorded in September (1.95 m/s). Figure 4a–l shows the different trends in each month. The statistical value UB–UK had multiple intersections in February, March, May, August, and December, and the change trend was more complicated. Combined with the curve of the M–K abrupt change test and the M-K trend test, the results showed that in January, February, May, June, August, November, and December, the statistical value UF was mostly greater than zero; therefore, there was an increasing trend in these months. Notably, in May and August, the curves were above the critical line (0.05 significance level) and witnessed a significant upward trend. Conversely, in March, April, July, September, and October, the UF was mostly less than zero, which witnessed a downward trend, that was not significant.

4.2. Trend Test and Probability Distribution of Meteorological Sites

We calculated the annual mean wind speed of 697 meteorological stations, and divided it based on the wind speed scale level. Combined with the M–K trend test, we obtained the trend map of wind speed changes at meteorological sites in China from 2000 to 2019 (Figure 5). It can be seen from Figure 5 that the size of the circle represents the wind speed range, and the smallest circle represents the range between 0 and 1 m/s, in contrast, the largest circle represents the wind speed greater than 8 m/s. Moreover, different colors and shades represent different trends in wind speed changes; blue indicates upward and red indicates downward, and light indicates that the trend was not significant, conversely, dark indicates that the trend was significant. Notably, we set the lack of significance trend to colorless to ensure that the map information is not redundant. The wind speed trend mainly increased in the western region, decreased in the eastern region, was higher in the northeast, northwest, and coastal areas, and was lower in the central region of China from 2000 to 2019.
Table 1 shows the number of total meteorological sites and percentage in each trend type. The number of sites with an upward trend was 205, accounting for 29.4%, of which the significance of the trend accounted for 25.4%. Similarly, the number of sites with a downward trend was 199, accounting for 28.6%, of which the significance of the trend accounted for 24.7%. In addition, the trend with a lack of significance was 293. The numbers for the upward and downward trend sites were similar. Table 2 illustrates that the maximum number of meteorological sites recorded in the range of wind speed 1–3 m/s, accounting for 75.9%, the mean value was 2.01 m/s and wind scale was two. Wind speed in the range of 0–1) m/s has something in common with wind speed in the range of 5–8) m/s, and there were similar proportions. At the minimum number of sites recorded in the range of wind speed ≥8 m/s, there were four sites, accounting for only 0.5%, indicating that there were fewer strong winds in China from 2000 to 2019, and most areas were dominated by light breezes.
Figure 6 shows the Weibull probability density function and cumulative distribution function with the mean wind speed value calculated at 697 meteorological sites in China measured from 2000 to 2019. Figure 6a shows that the Weibull curve was estimated by using the maximum likelihood method to obtain c and k. The mean value was 2.39 m/s, and the standard deviation was 1.66 m/s. There was a large difference between the wind speed frequency and Weibull curve in the intervals of 0–2 m/s and 3–5 m/s, indicating that there was still a certain difference between the maximum likelihood method and the artificial division. In addition, it is clear that the wind speed falls within the range of 0–1 m/s at approximately 2%, 1–2 m/s at approximately 30%, 2–3 m/s at approximately 46%, and 3–4 m/s at approximately 28%. The Weibull cumulative distribution function in Figure 6b indicates the probability that a variable is inferior or similar to a separate value and displays that approximately 92% of the recorded wind speed values were less than 4 m/s.

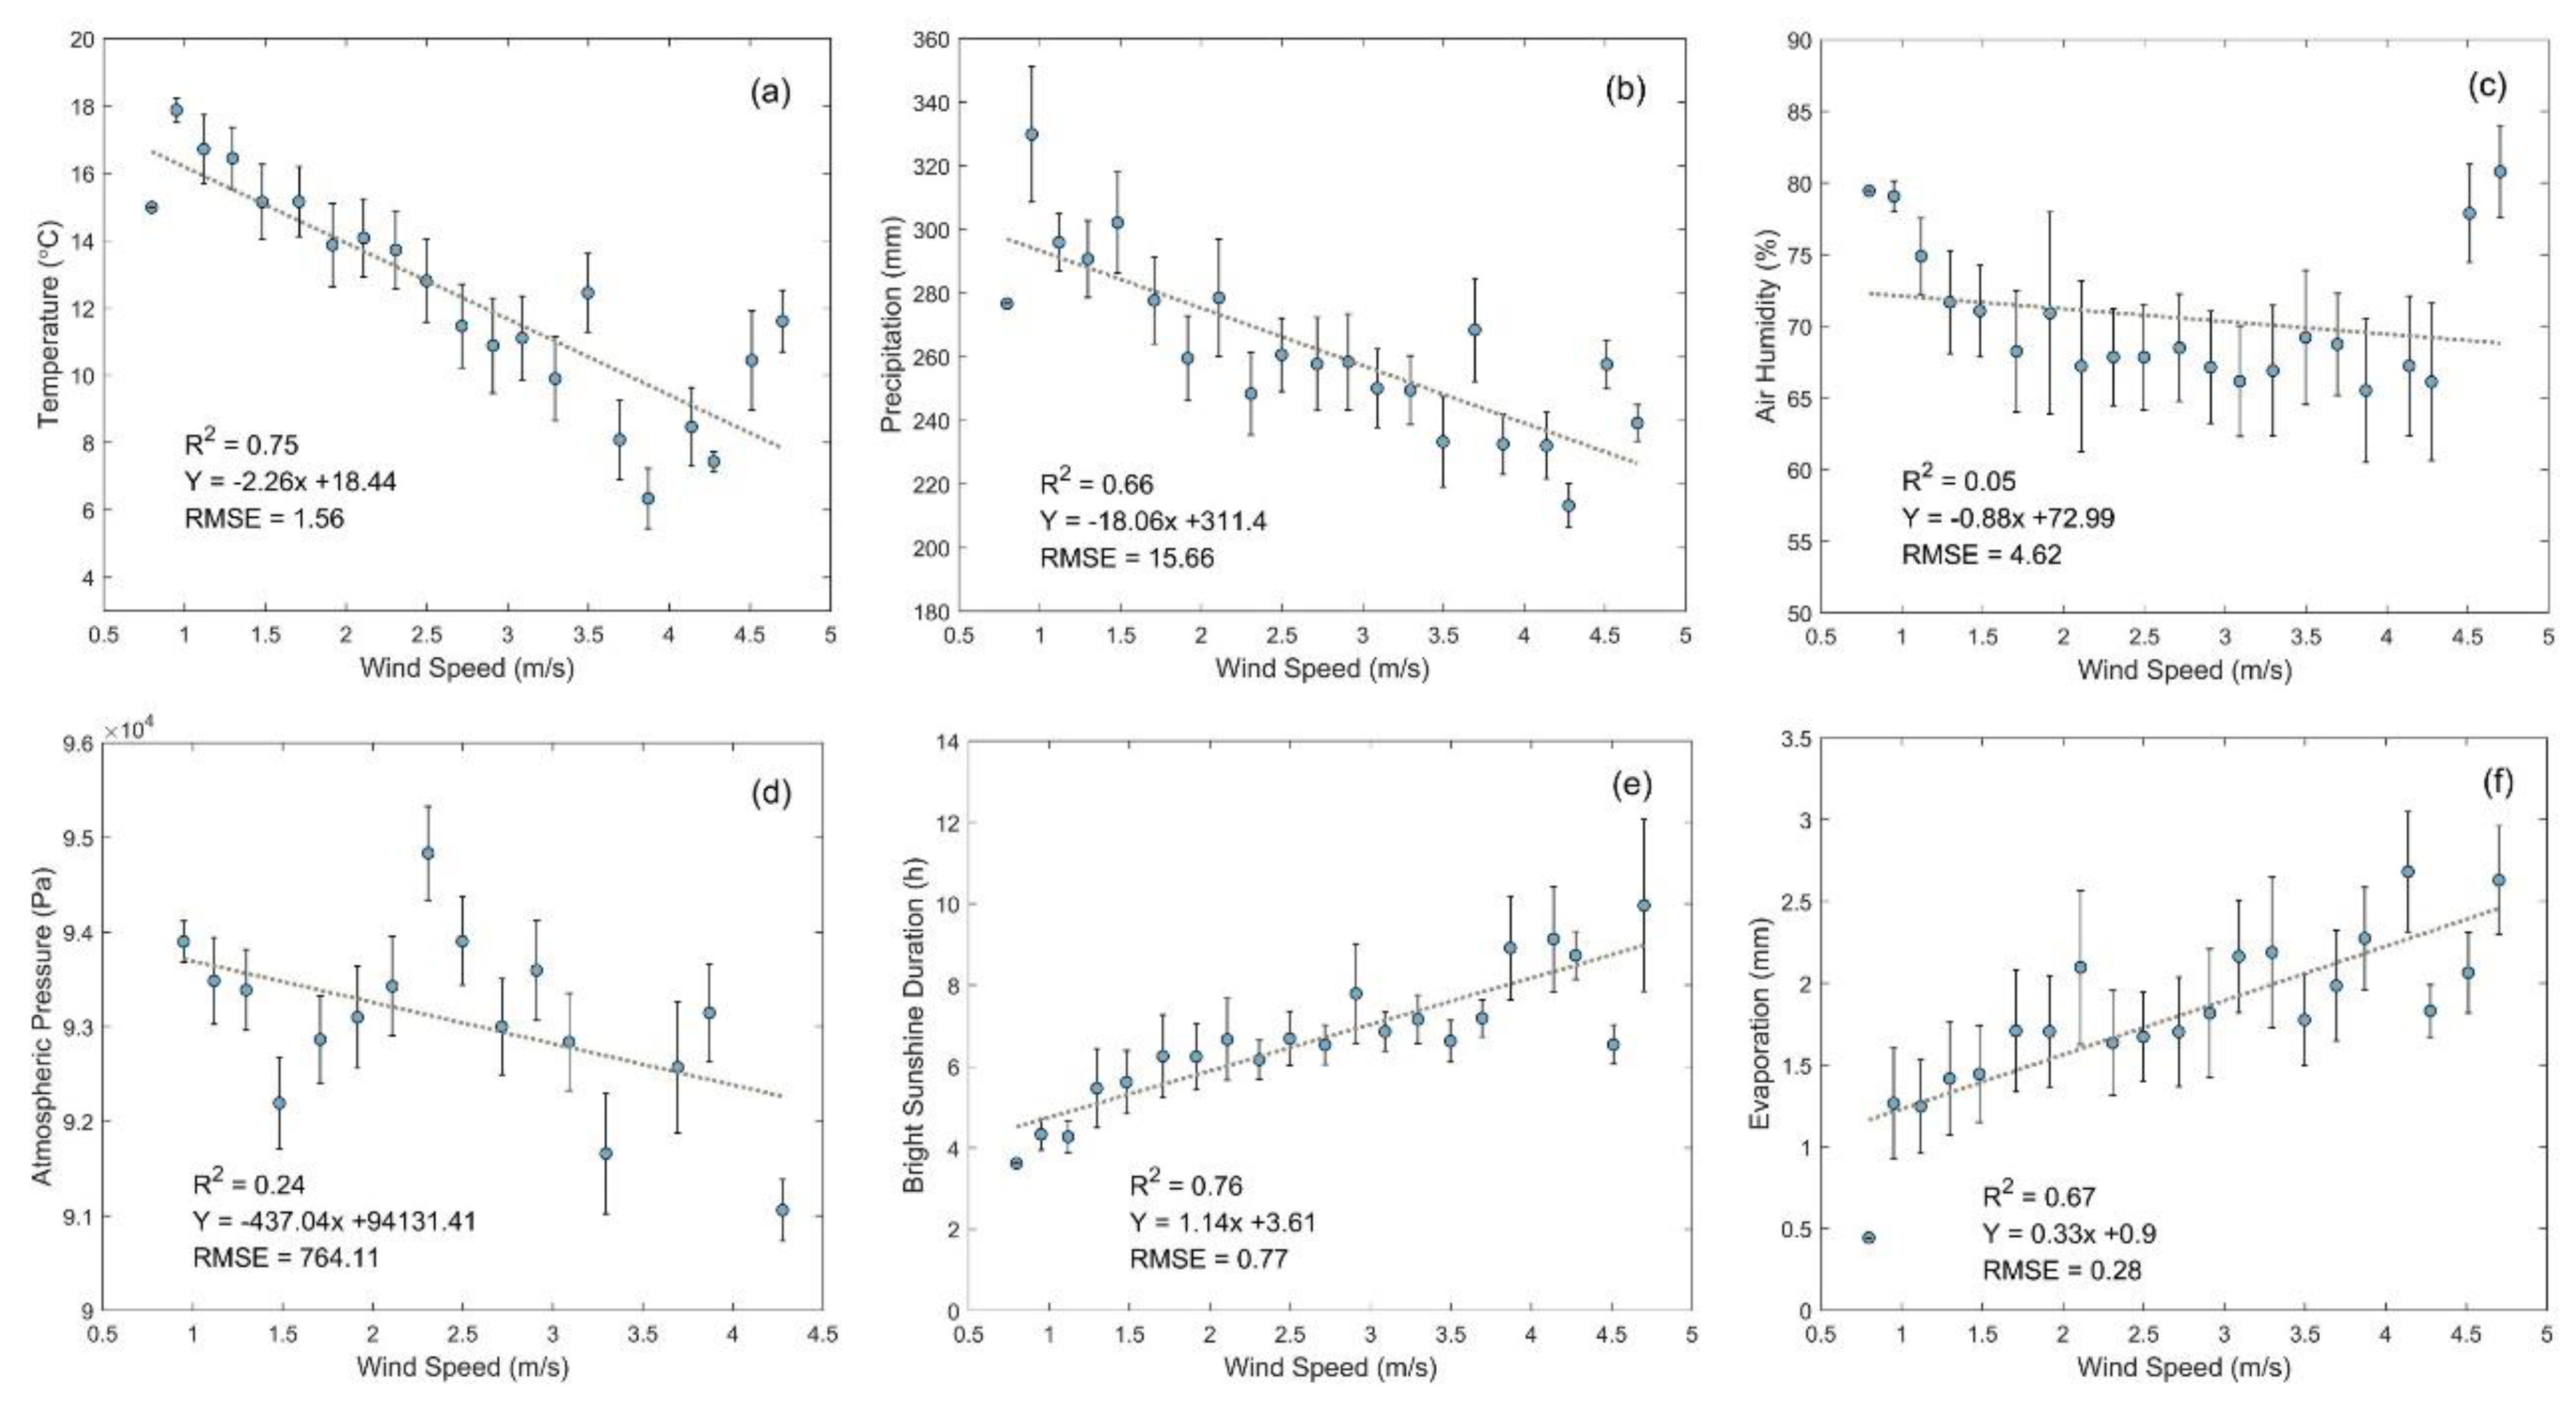
4.3. Correlation Analysis between Wind Speed Changes and Meteorological Factors

Since the original meteorological data were relatively scattered, we recalculated them at 0.2 intervals of the wind speed range based on Table 2. We calculated the mean and standard deviation of each meteorological variable (atmospheric pressure, air humidity, temperature, precipitation, bright sunshine duration, and evaporation) in each interval, and then obtained the error bar by calculating the correlation in Figure 7. Figure 7a–f shows that among the 697 meteorological sites, wind speed changes were highly correlated with temperature, bright sunshine duration, evaporation, and precipitation (R2 > 0.65); conversely, air humidity, and atmospheric pressure had low correlation coefficients (R2 < 0.2). In addition, the error bar shows that as compared with other meteorological factors the error changes in precipitation, humidity, and atmospheric pressure were unstable, and there was larger root mean square errors.
To illustrate the geographical distribution of the top three factors, we drew the RGB (red, green, and blue) triangular figure of bright sunshine duration (blue), temperature (red), and evaporation (green) based on the wind speed range in Table 2 (Figure 8). The temperature, bright sunshine duration, and evaporation in different wind speed ranges exhibited spatial divergence in China from 2000 to 2019 according to the statistical methods. Figure 8 shows that the range 0–1 m/s of wind speed was highly related to evaporation mainly in the southwest areas; the ranges 1–3 m/s and 5–8 m/s of wind speed were highly influenced by temperature in the central and southern regions; moreover, this area had the highest proportion, accounting for approximately 70%; the ranges 3–5) m/s and ≥8 m/s of wind speed were highly related to bright sunshine duration, mainly in the northeast and coastal areas.

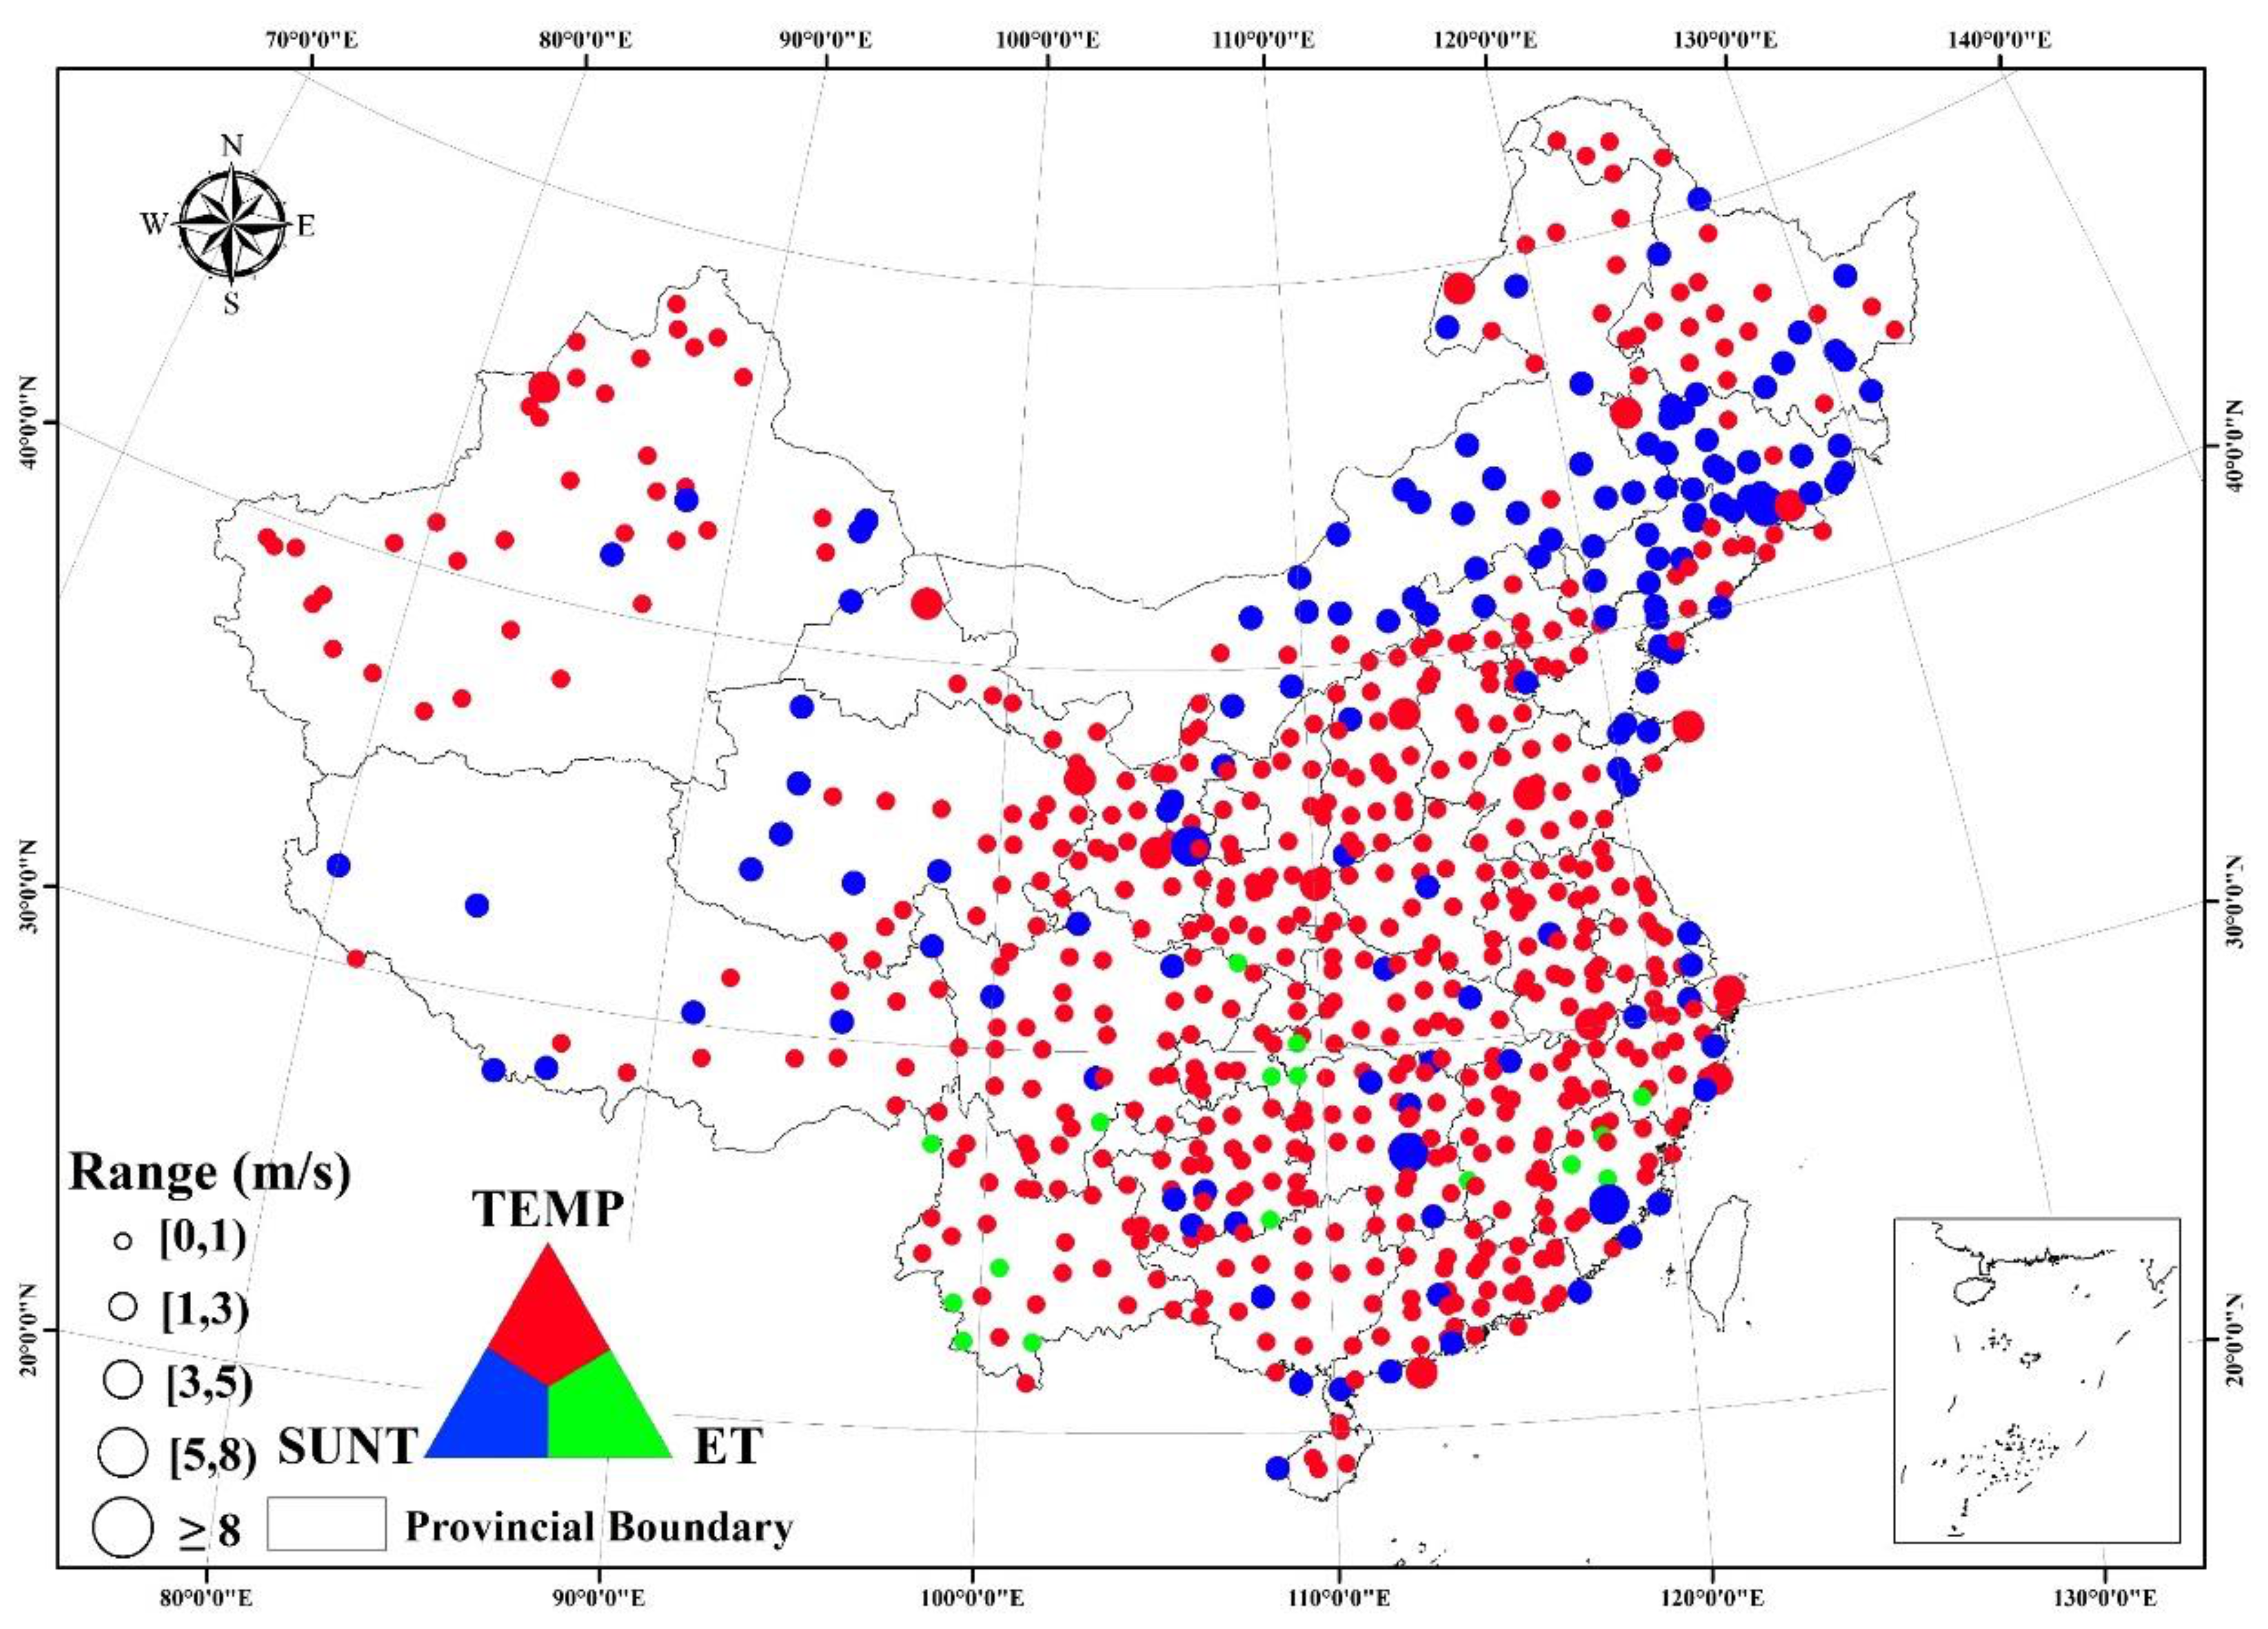
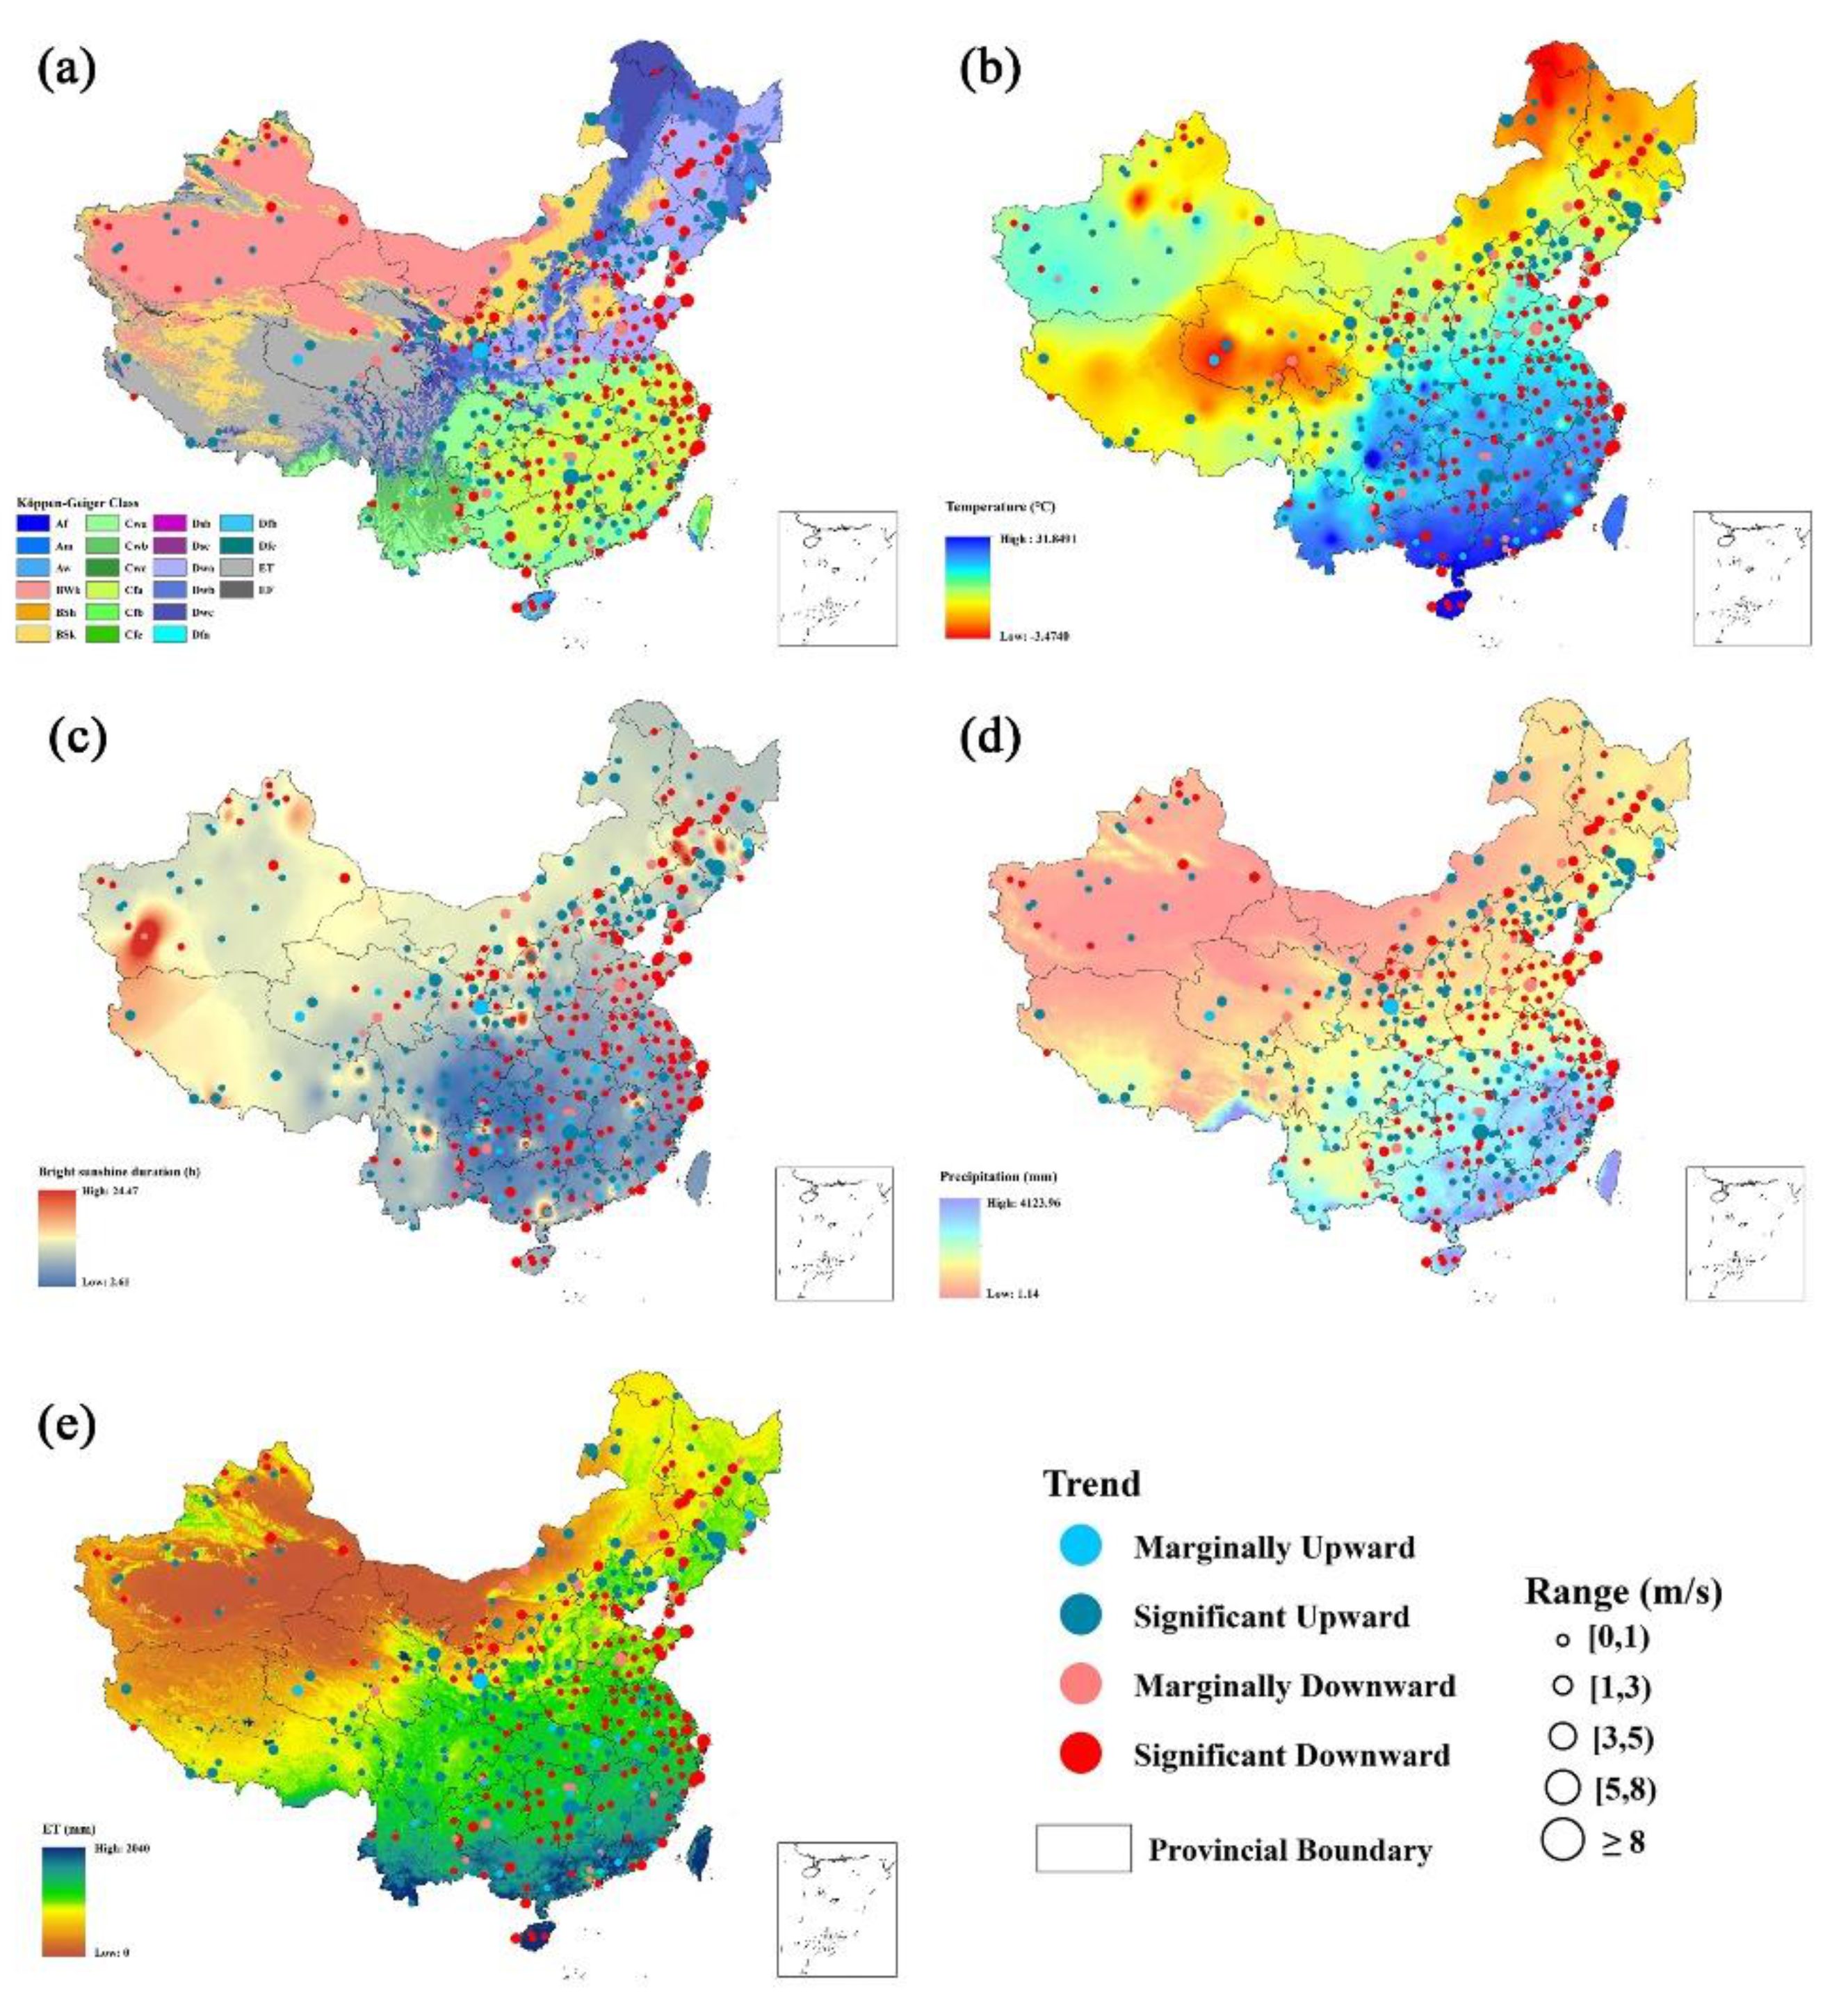
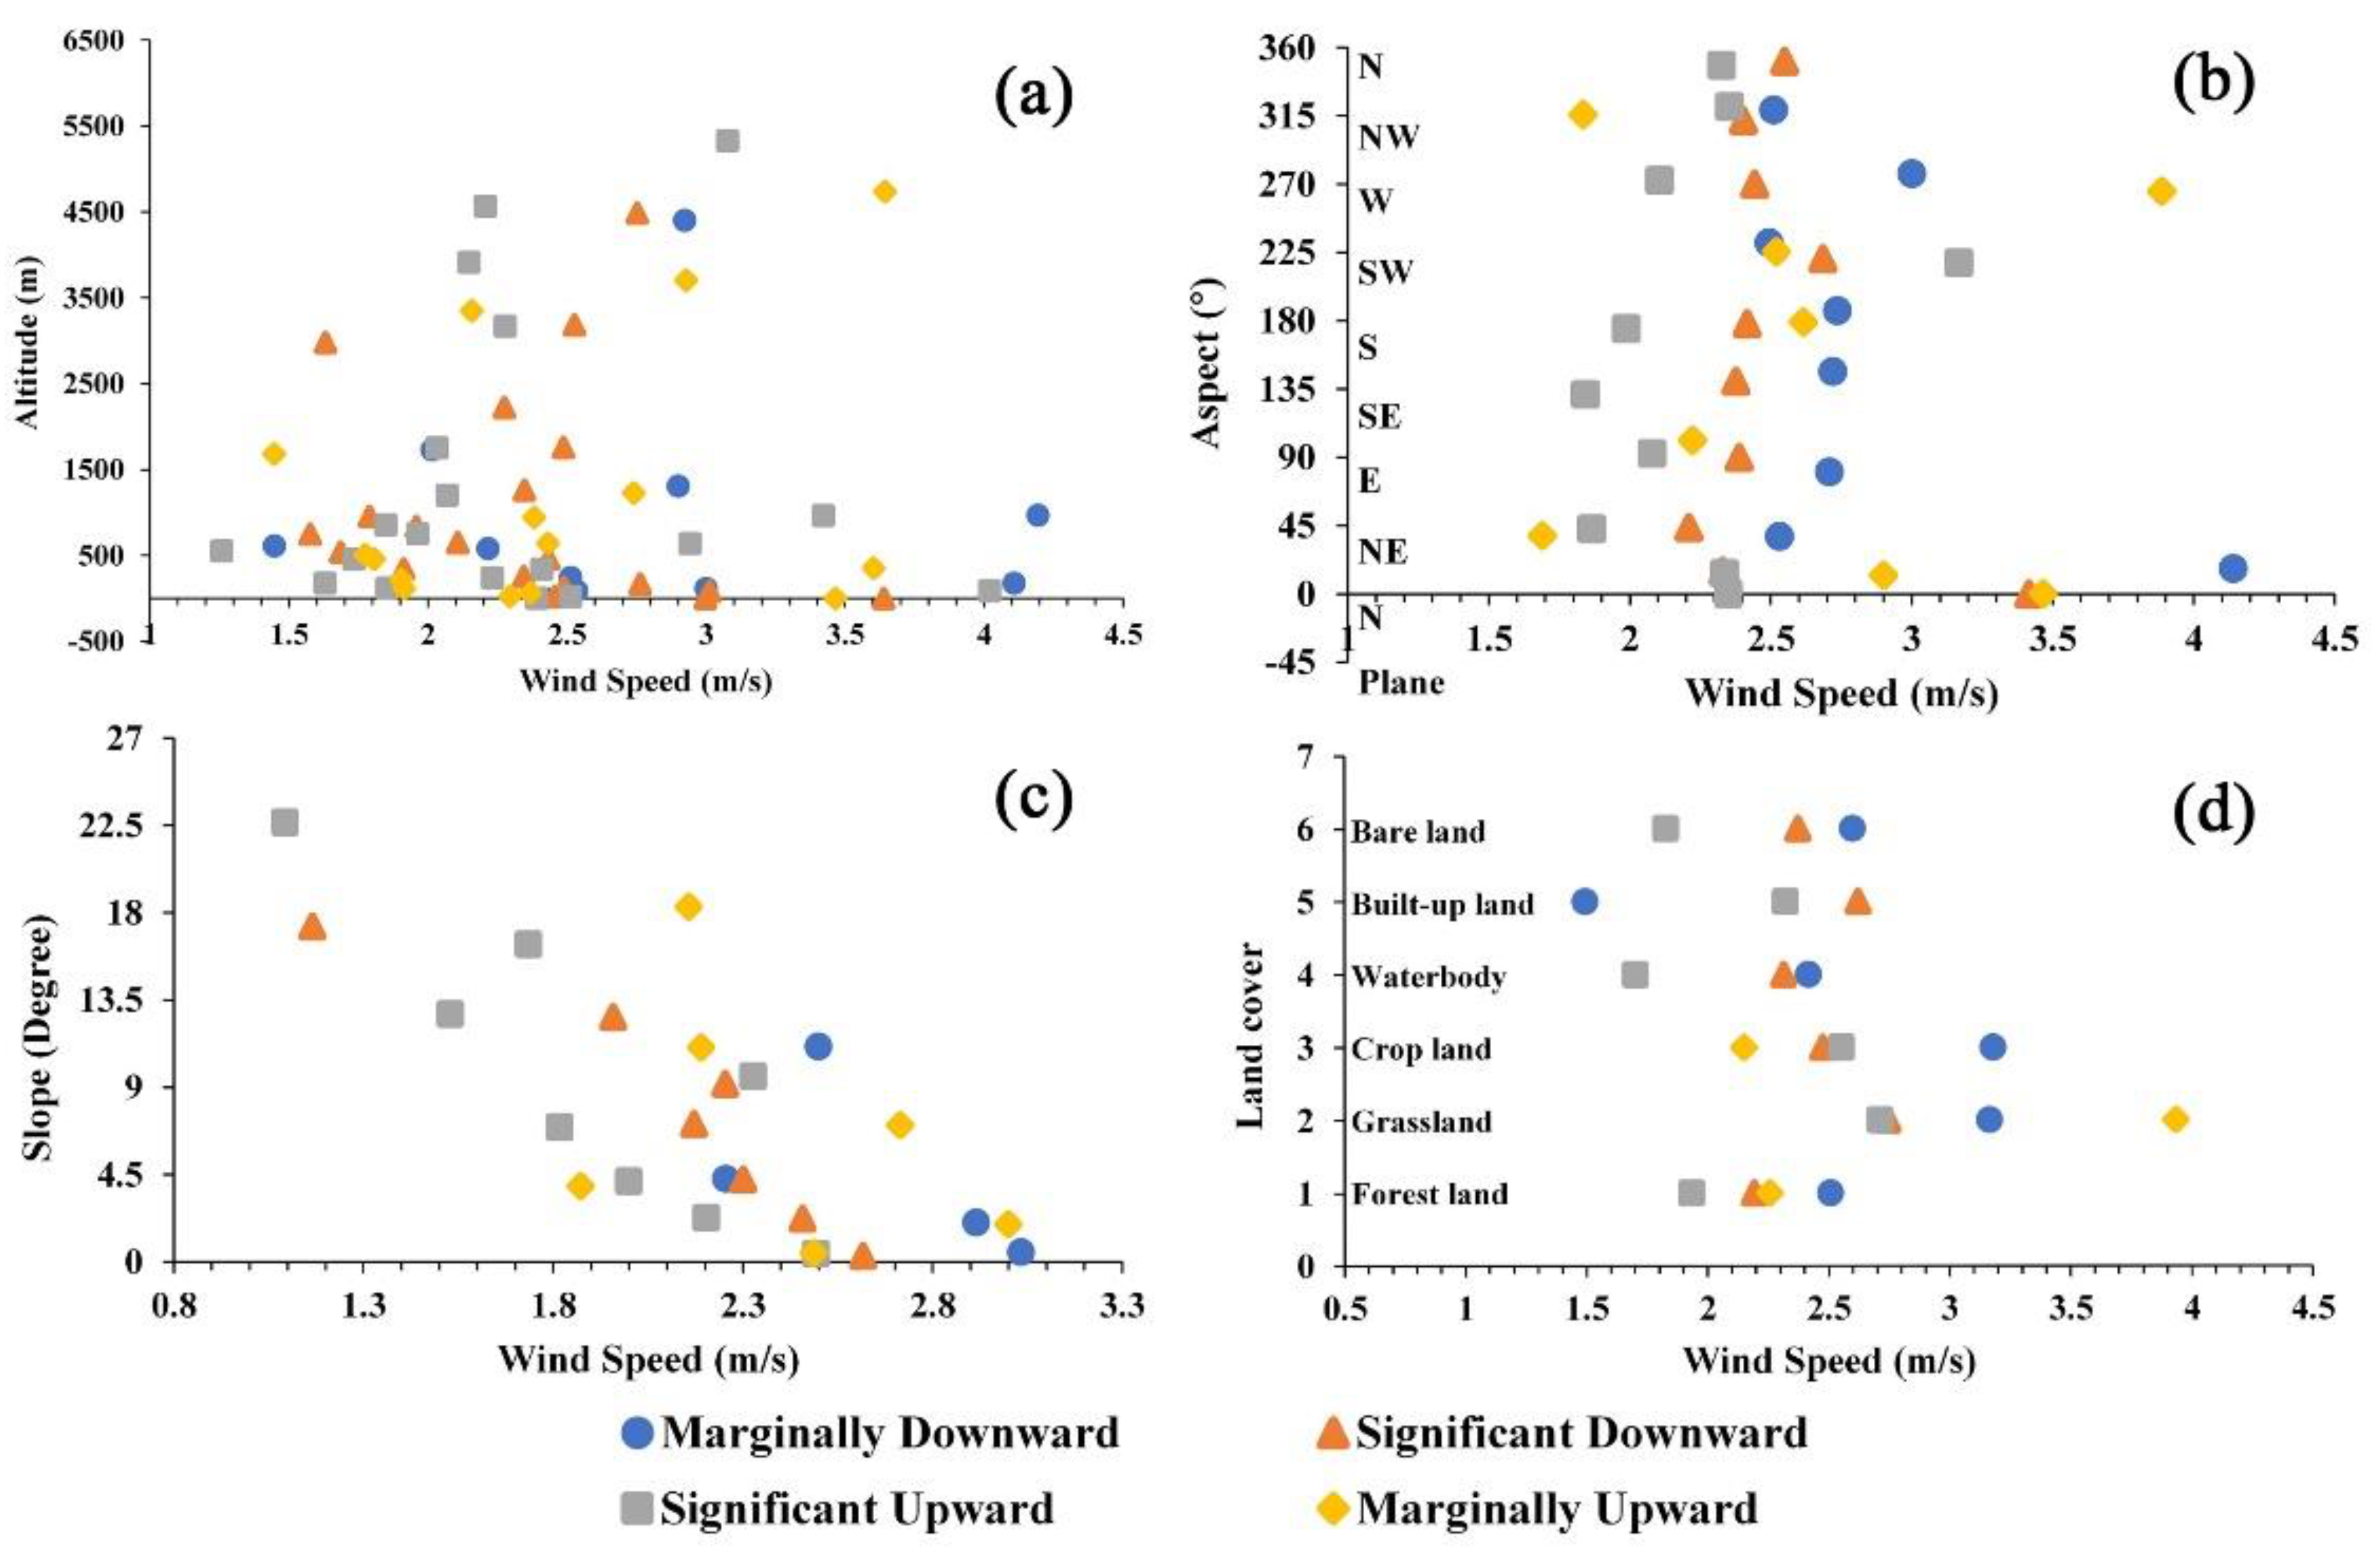
4.4. Synthesizing Wind Speed Changes under Environmental Factors

Using DEM data, we obtained elevation information and made a distribution map of the slope and aspect of China. Our study shows that through a comprehensive analysis with the DEM of China in areas with different terrains, the differences in wind speeds were more obvious (Figure 9a). In higher altitude western regions, such as Tibet, Qinghai, and western Sichuan, the wind speed changes mainly exhibited a significant upward trend from 2000 to 2019. The altitude of these areas is mostly 3000 m or even more than 4000 m, the terrain is high-pitched and open, and it is also affected by the downward transmission of strong westerly wind momentum at a high altitude, making it one of the high-value areas in the China wind speed distribution. In mountainous areas, the terrain is very complicated because it is vertical and horizontal, and the wind resources are also rich in special areas, such as valley vents. In contrast, in the eastern coastal area and the central area, the terrain is low, mainly consisting of plains and hills, and the wind speed mainly shows a downward trend but with a high value. In addition, Figure 9b,c shows that wind speed changes over slope and aspect, and the results show that in regions with steep slopes, there was a significant upward trend; conversely, in regions with gentle slopes, there was a downward trend. Similarly, regions with different aspects will also have differences in wind speed changes.
Changes in landcover and underlying surfaces are particularly essential to the environment. Figure 10 shows the spatial distribution map of China land cover. We found that in natural grassland and forest areas, the wind speed mainly shows an upward trend; conversely, in cropland areas, the wind speed changes with a particularly consistent trend, showing a downward trend from 2000 to 2019.
According to the spatial data distribution, we transferred the attributes to the points that represent the wind speed range and trend type. According to the different trend types, we extracted the mean value of the altitude, slope, and aspect according to the interval range, and the results are shown in Figure 11. It can be seen from Figure 11a that the wind speed range was mainly between 1 and 3 m/s, and the values below 1500 and above 4500 m were relatively large; the wind speed trends at low places were mainly marginally downward and significant upward, while at medium and high altitudes, they were mainly significant downward and marginally upward. For the aspect (Figure 11b), the wind speeds in the north, northeast and west had the high values and the trend changes were more even on each slope. Figure 11c shows that the wind speed was the highest when the slope was below 15 and showed a downward trend when the slope was low, and vice versa. We calculated the range and trend of the wind speed under different land cover types (Figure 11d). The results showed that the high values were observed in croplands and grasslands, and low values were observed in built-up lands, bare lands, and water bodies. However, these trend changes are more complex and need to be analyzed in combination with other environmental factors.
China is among the countries worldwide with the richest natural ecological environments; however, China also has relatively fragile ecological environments. Hence, in view of the current ecological environmental problems, it is necessary to comprehensively evaluate and divide China’s ecological environment and ecological assets through comprehensive multidisciplinary and interdisciplinary research, with the goal of sustainable development. In this study, we used the agricultural ecological monitoring zones proposed by Wu [75]. Figure 12 shows the upward trend and large wind speed value in the Qinghai-Tibet, Loess region, and Inner Mongolia AEZs; in contrast, there was a significant downward trend in the Huang Huaihai and Hainan AEZs. In the Gansu-Xinjiang, northeastern and southern China AEZs, the trend of wind speed changes was 50–50%, which was mainly related to the terrain elements. In the southwestern and Lower Yangtze AEZs, 39% and 55% of sites experienced a downward trend, and 61% and 45% experienced an upward trend, respectively.

5. Discussion

5.1. Temporal and Spatial Evolution Characteristics of Wind Speed and Trend Changes

Through calculations, we obtained the annual changes and trend characteristics of wind speed from 2000 to 2019. Interestingly, these trends coincided with the strong storm surges recorded in the Atlantic and Pacific Oceans in 2008–2009 and 2013–2014 [4]. It is noteworthy that the global surface temperature was significantly higher during these two periods. From 2008 to 2009, severe tropical storms swept through China, the Philippines, and other continents, producing cyclonic storms in the North Pacific. Rare heavy rains and floods were encountered in central and eastern Europe. Affected by abnormal atmospheric circulation, significant climate anomalies and extreme events occurred worldwide from 2013 to 2014. The global average sea surface temperature hits as record high, several countries were hit by heavy rains and floods, and the Philippines suffered strong storm surges that swept the Atlantic Ocean, Indian Ocean, and other regions. Interannual wind speed changes are closely related to climate change. In the past 20 years, the global average ground temperature has increased significantly, which has largely affected the wind speed. Urbanization has also greatly affected the changes in annual wind speed. The trend of wind speed changes in towns is more obvious than that in rural areas.
Wind speed changes in different months have obvious seasonality and are mainly caused by changes in the underlying surface and human activities. In rural areas, changes in the underlying surface changes are due to the sowing, growing, harvesting and crop rotation of different crops. For example, in some areas of the North China Plain, wheat and maize are rotated. In addition to differences in the underlying surface, the plant height, gap, and nutrients required for production are different. Additionally, for the same crop, the characteristics of growing season and non-growing season crops are also different, which directly or indirectly affects wind speed changes. In cities, the lushness of trees during different seasons and the construction of high-rise buildings could affect the wind speed changes. For seasonal characteristics changes, we emphasize combining them with changes in the underlying surface and crop growing season to explore the changes in evapotranspiration and better apply the variable wind speed to research on this subject.

5.2. Effects of Terrain and Human Activities on Wind Speed

Several studies have documented different terrains, topographical changes and many other circumstances, and the driving effect of wind speed is strongly significant in China [74]. The topography of China is high in the west and low in the east, with a stepped distribution. The topography is diverse and the mountain area is vast. The topography is conducive to warm and humid air currents in the Pacific Ocean going deep into the inland areas, and cold air from the north can move southward for a long time, which is conducive to the formation of precipitation. The proportions of areas at all altitudes in China are shown in Table 3.
Terrain changes can change the boundary layer airflow. In some cases, together with the day and night heating cycle, terrain changes can generate various circulations. In inland areas, due to seasonal differences, there are differences in radiation intensity, which will affect changes in turbulence; in coastal areas, differences in the temperature of sea and land areas and in air pressure will also affect the occurrence of turbulence; and in areas with special terrain such as the Gobi, plateaus, and mountainous areas, turbulence changes present special characteristics [76]. Terrain changes can generate local winds. Generally, local winds are named by its cradle, such as mountain wind and sea wind. In mountainous areas with high terrain, due to the distribution of valleys, ridges, and the airflow that circulates day and night, the air temperature alternates between cold and warm, so a mountain circulation forms, including valley breezes [77]. During the diurnal cycle, the large heat capacity of the lake and sea changes the water surface temperature by nearly zero. However, because the molecular conductivity of water and the heat capacity of the soil prevent the daily temperature signal from quickly leaving and spreading outward, the land heats and cools more significantly. Therefore, during the day, the land is warmer than the water body, and the opposite is true at night. This situation is suitable for the formation of sea breezes [78].
China is among the countries with the richest natural ecological environments worldwide. This richness is mainly due to China’s vast territory, which is located in the mid-latitudes and the east coast of the mainland, with diverse topography, complex natural history evolution, and long-term interaction and interpenetration of factors, such as the significant influence of human activities. In recent decades, climate change has mainly been caused by human activities. An increase in greenhouse gas emissions and the change in land use because of human activities have been the two most important factors that have affected climate change [79,80,81,82,83]. Changes in land use mainly include changes in the underlying surface caused by agricultural activities and the process of urbanization.
Our results show that the wind changes and the wind speed changes in different seasons in China were not consistent. For the former ten years, the wind speed showed a decreasing trend during the spring and winter in China. On the one hand, because the increase in greenhouse gas emissions has made winter warming more obvious, the spatial inconsistency of temperature changes was the reason for weakening in winter. On the other hand, air pollution has led to a decrease in the local temperature in the southern and central regions, while the increase in sea temperature in the South China Sea and the Northwest Pacific has led to weakening in summer; the results were consistent with some previous studies [50]. As people pay more attention to the environment and actively improve environmental problems, the wind speeds in winter and summer have shown an upward trend in the past ten years. The urbanization process in China has been rapid in recent decades. Some rural stations during the station construction period were transformed into urban (town) stations. Urbanization and its heat island effect have a significant impact on temperature, which also has a significant impact on wind speed [84].
A number of studies [85] have reported that the change in the underlying surface has a particularly significant impact on the wind speed. When air flows across different ground surfaces, each surface feature affects the airflow. For example, suppose there is a dry, unvegetated, smooth and flat semi-infinitely long plot. Downwind of the plot is another wet, vegetated, rough flat plot. The boundary layer is forced to balance with the ground when developed on a plot. When air passes through the boundary and flows through adjacent plots, the bottom of the boundary layer is affected by the new surface characteristics and changes. The thickness of the air in the boundary layer after the change increases with the distance from the boundary layer downwind. Above this changing boundary layer, the boundary layer does not “feel” the impact of the new surface and continues to play its normal role when flowing over the windward surface.

5.3. The Role of Meteorology and Climate Change in Influencing Wind Speed

Some previous studies have been conducted on the mechanism of climate factors influencing wind speed changes under different climate types, meteorological factors, and many other circumstances [74]. Through a correlation analysis with meteorological factors, we found that the top four factors highly correlated with wind speed were bright sunshine duration, temperature, evaporation, and precipitation, in China from 2000 to 2019.
We examined the spatial distribution of the wind speed changes and trends under high climate factors based on the correlation analysis (Figure 13b–e). Our study demonstrates that wind speed showed a significant negative correlation with temperature and precipitation, and vice versa for sunshine and evapotranspiration calculated by the mean values of China’s 697 meteorological sites in the past 20 years. The spatial trend of precipitation in China decreases seasonally from the southeast coast to the northwest inland area, with more seasons in summer and autumn, and less seasons in winter and spring. The temperature characteristics of China have significant seasonality; in winter, the south is warm, and the north is cold. The large difference in temperature between the north and the south is the main feature of the winter temperature distribution in China, which is inseparable from the influence of the winter monsoon; in summer, except for areas with high terrain such as the Qinghai-Tibet Plateau, high temperatures are common throughout the country, with little difference in temperature between the north and south. The bright sunshine duration distribution of China is less in the southeast and more in the northwest, increasing from southeast to northwest, showing strong regional differences. Wind strongly affects the evapotranspiration rate, the spatial distribution of land evapotranspiration in China has obvious step changes from southeast to northwest, and the internal spatial distribution of the eastern monsoon region also has obvious banding characteristics. In studies of latent heat flux mechanism models, it is necessary to consider the influence of wind speed and develop related dynamics models to better meet the requirements of Earth-atmosphere process simulations.
In the context of the rapid development of the world economy, energy demand is growing rapidly, and safe, clean, and abundant wind energy resources are widely used worldwide. Wind energy resources are closely related to climate change. With global and Chinese climate warming in the past 100 years, the global annual average surface temperature has risen, and the average annual temperature in China is slightly higher than the global average [86]. Therefore, the impact of climate change should be fully considered in the development and utilization of wind energy resources.
Figure 13a shows the spatial distribution of the wind speed changes and trends under different climate types in China from 2000 to 2019. The five main climate groups show that wind speed and trends have different characteristics. The tropical type (beginning with A) was mainly distributed on Hainan Island in the southernmost part of China every month of the year with an average temperature of 18 °C or higher and with significant precipitation [65], which was mainly light and gentle breezes with a significant downward trend, this finding was highly consistent with our results. The dry type (beginning with B) was mainly distributed in northwest China and defined by little precipitation, with a higher wind scale but complicated trend changes, which were highly related to terrain and the underlying surface analyzed in the remaining subsection. The temperate type (beginning with C) was mainly distributed in southeast China and was cold and dry in winter and hot and rainy in summer. Similarly, the changes in wind speed varied, and the value and trend were highly related to terrain and human activities. The continental type (beginning with D) was mainly distributed in northeast China and was cold in winter and hot in summer, with droughts and little rain. The wind speed scale was relatively high, with more significant seasonal changes, and the climate characteristics were obvious. Generally, there has been a downward trend in the past 20 years. The polar and alpine types (beginning with E) were characterized by obvious vertical climate changes, and the temperature decreased with increasing altitude, mainly in western China. There were fresh and strong winds, with a mostly significant upward trend. Therefore, in the context of global climate change, the changing trend of China’s wind energy resources and the differences in the characteristics of wind energy resources in different regions are issues that need to be further studied in the future.

5.4. The Impact of Wind Farms on Wind Speed Changes

In recent years, to slow global warming, many countries around the world have vigorously developed clean energy and renewable energy. Wind energy is an important aspect of clean energy. The utilization of wind energy resources has been extensively developed in many regions worldwide, and an increasing number of large-scale wind farms are being established and placed into operation. During the construction and operation of wind farms, there will be certain impacts on the surrounding meteorological elements [87].
Most of the current studies have focused on the local climate effects of wind farms, generally using two research methods: observation and numerical simulation. Several studies have documented that the operation of a wind farm absorbs the momentum of the airflow and the friction of the wind turbines so that the wind speed in the downstream area is significantly reduced by 20% to 40% [88]. The turbine disturbance of the fan changes the vertical mixing, and finally changes the local temperature, which can increase up to 1 °C or more; drying the air near the ground reduces the surface sensible heat flux, and indirectly changes other meteorological elements such as clouds and precipitation [89,90].
In addition to slowing the downstream wind speed, wind farms will also have a corresponding impact on the local climate. For example, wind farms can cause changes in downstream temperature. Wind farms strengthen vertical mixing during operation. The warm layer that stabilizes the atmosphere at night is above the cold layer, and the vertical mixing is strengthened, causing warm air to move down and cold air to move up, leading to warming near the ground; cold air in the unstable atmosphere during the day is in the warm air above, turbulence promotes mixing, and cold air moves down and warm air moves up, causing the near-ground area to become cold. The influence of wind farms on temperature depends on the stability of the near-surface atmosphere, and different degrees of stability result in a warming or cooling effect on the near-surface temperature from wind farms [88].
In addition to studying the impact of wind farms on the local climate, the impact of wind farms on the global climate is another focus of research and debate. Some numerical simulation studies have shown that the establishment and operation of large-scale wind farms around the world may have an impact on climate change [88]. Studies on the impact of wind farms on global climate change is still relatively limited, coupled with the uncertainty of climate models and the uncertainty of the design of wind farm simulation experiments. Therefore, there are still many differences and controversies in the industry regarding the global climate effects of large-scale wind farms, and more numerical experiments and research are needed.
Since wind farms have a certain impact on the local climate, it is necessary, in the construction of wind farms, to pay attention to the distance between wind farms to reduce unnecessary mutual interference and influence between wind farms; moreover, the meteorological observation field needs to be a certain distance from the wind farm to ensure the accuracy of the meteorological observation data and lack of disturbance by the wind farm. Our study obtained the wind speed characteristics of each region by analyzing the meteorological station data over 20 years, combining terrain, climate, and other environmental factors. Its spatial distribution could help the government during the site selection of wind farms. For example, combining terrain characteristics and wind speed resources, the eastern part of Inner Mongolia, with its open land, sparse population, low land prices, and abundant wind energy resources, is suitable for the construction of large-scale power farms. Moreover, in eastern coastal cities of China (such as Shandong Province), offshore wind energy reserves are larger than on land, with higher wind speeds, fewer quiet periods, and higher wind power efficiency. It is one of the biggest potential growth points for offshore wind power plants in China in the future. Simultaneously, it is possible to improve the efficiency of wind turbines by transforming wind turbines, and to reduce the impact of wind farms on the local climate, areas with abundant wind resources and suitable underlying surfaces can be selected to establish wind farms.

6. Conclusions

In this study, we obtained temporal and spatial scale wind speed changes, trend changes, correlations, and the spatial distribution characteristics of 697 meteorological stations in China from 2000 to 2019 and quantified the contribution of environmental factors to wind characteristics.
Over the past 20 years (2000–2019), the annual wind speed changes can be mainly divided into two stages, a downward trend was recorded before 2011, but overall, across the 20 years, there was an increasing trend that was not significant. Moreover, wind speed changes in different months showed obvious seasonality. Our analysis of wind speed using statistical methods showed that temperature, bright sunshine duration, evaporation, and precipitation have the strongest influences, with wind speed showing a significant negative correlation with temperature and precipitation and vice versa for sunshine and evapotranspiration. Spatially, different regions showed different wind speed changes and trend characteristics. Combined with environmental factors such as the terrain, land cover, climate factors, and human activities, we found that each attribute had its own characteristics.
Future studies should consider the influential mechanism of each environmental factor on wind speed changes and could further explore the three-dimensional wind field using remote sensing satellite image data.

Author Contributions

Conceptualization, Yuming Lu and Bingfang Wu; methodology, Yuming Lu; data curation, Yuming Lu; writing—original draft preparation, Yuming Lu; writing—review and editing, Bingfang Wu, Nana Yan, Weiwei Zhu, Hongwei Zeng, Zonghan Ma, Jiaming Xu, Xinghua Wu, and Bo Pang. All authors have read and agreed to the published version of the manuscript.

Funding

This research was funded by National Natural Scientific Foundations of China, grant number 41991232.

Data Availability Statement

Not applicable.

Acknowledgments

The authors would like to thank the China Meteorological Data Service Center (http://data.cma.cn/en, accessed on 30 May 2020) for providing the ground meteorological station data of China and thank the program from China Three Gorges Corporation for supporting.

Conflicts of Interest

The authors declare no conflict of interest.

References

  1. Vitousek, P.M. Beyond global warming: Ecology and global change. Ecology 1994, 75, 1861–1876. [Google Scholar] [CrossRef]
  2. Dai, A. Erratum: Drought under global warming: A review. Wiley Interdiscip. Rev. Clim. Chang. 2012, 3, 617. [Google Scholar] [CrossRef] [Green Version]
  3. Kummu, M.; Ward, P.J.; de Moel, H.; Varis, O. Is physical water scarcity a new phenomenon? Global assessment of water shortage over the last two millennia. Environ. Res. Lett. 2010, 5, 034006. [Google Scholar] [CrossRef] [Green Version]
  4. Flor-Blanco, G.; Alcántara-Carrió, J.; Jackson, D.; Flor, G.; Flores-Soriano, C. Coastal erosion in NW Spain: Recent patterns under extreme storm wave events. Geomorphology 2021, 387, 107767. [Google Scholar] [CrossRef]
  5. Castelle, B.; Dodet, G.; Masselink, G.; Scott, T.J.G.R.L. Increased winter-mean wave height, variability, and periodicity in the Northeast Atlantic over 1949–2017. Geophys. Res. Lett. 2018, 45, 3586–3596. [Google Scholar] [CrossRef] [Green Version]
  6. Guisado-Pintado, E.; Jackson, D.W. Coastal impact from high-energy events and the importance of concurrent forcing parameters: The cases of storm Ophelia (2017) and storm Hector (2018) in NW Ireland. Front. Earth Sci. 2019, 7, 190. [Google Scholar] [CrossRef] [Green Version]
  7. Lee, B.S.; Haran, M.; Keller, K. Multidecadal scale detection time for potentially increasing Atlantic storm surges in a warming climate. Geophys. Res. Lett. 2017, 44, 10617–10623. [Google Scholar] [CrossRef]
  8. Sarkodie, S.A. Environmental performance, biocapacity, carbon & ecological footprint of nations: Drivers, trends and mitigation options. Sci. Total Environ. 2021, 751, 141912. [Google Scholar]
  9. Keune, H. Environmental specimen banking (ESB): An essential part of integrated ecological monitoring on a global scale. Sci. Total Environ. 1993, 139, 537–544. [Google Scholar] [CrossRef]
  10. Yu, J.; Zhou, D.; Yu, M.; Yang, J.; Li, Y.; Guan, B.; Wang, X.; Zhan, C.; Wang, Z.; Qu, F. Environmental threats induced heavy ecological burdens on the coastal zone of the Bohai Sea, China. Sci. Total Environ. 2021, 765, 142694. [Google Scholar] [CrossRef]
  11. Rapley, C.; Morais, J.J.G. The international geosphere-biosphere programme IGBP. GeoJournal 1996, 40, 311–342. [Google Scholar] [CrossRef]
  12. Lü, Y.; Zhang, L.; Feng, X.; Zeng, Y.; Fu, B.; Yao, X.; Li, J.; Wu, B. Recent ecological transitions in China: Greening, browning and influential factors. Sci. Rep. 2015, 5, 1–8. [Google Scholar] [CrossRef]
  13. Suni, T.; Guenther, A.; Hansson, H.-C.; Kulmala, M.; Andreae, M.; Arneth, A.; Artaxo, P.; Blyth, E.; Brus, M.; Ganzeveld, L.J.A. The significance of land-atmosphere interactions in the Earth system—iLEAPS achievements and perspectives. Anthropocene 2015, 12, 69–84. [Google Scholar] [CrossRef] [Green Version]
  14. Stonestrom, D.A. Terrestrial Biosphere-Atmosphere Fluxes and Transport in the Atmosphere-Vegetation-Soil Continuum; State Water Control Board: Richmond, VA, USA, 2014. [Google Scholar]
  15. Zhang, R.; Wang, J.; Zhu, C.; Sun, X.; Zhu, Z. The retrieval of two-dimensional distribution of the earth’s surface aerodynamic roughness using SAR image and TM thermal infrared image. Sci. China Ser. D Earth Sci. 2004, 47, 1134–1146. [Google Scholar] [CrossRef]
  16. McVicar, T.R.; Van Niel, T.G.; Li, L.T.; Roderick, M.L.; Rayner, D.P.; Ricciardulli, L.; Donohue, R.J. Wind speed climatology and trends for Australia, 1975–2006: Capturing the stilling phenomenon and comparison with near-surface reanalysis output. Geophys. Res. Lett. 2008, 35, L20403. [Google Scholar] [CrossRef] [Green Version]
  17. Shi, Y.; Hu, F.; Xiao, Z.; Fan, G.; Zhang, Z. Comparison of four different types of planetary boundary layer heights during a haze episode in Beijing. Sci. Total Environ. 2020, 711, 134928. [Google Scholar] [CrossRef]
  18. Han, Y.; Westwater, E.R.; Technology, O. Remote sensing of tropospheric water vapor and cloud liquid water by integrated ground-based sensors. J. Atmos. Ocean. Technol. 1995, 12, 1050–1059. [Google Scholar] [CrossRef] [Green Version]
  19. Chen, S.R.; Cai, C.S. Equivalent Wheel Load Approach for Slender Cable-Stayed Bridge Fatigue Assessment under Traffic and Wind: Feasibility Study. J. Bridge Eng. 2007, 12, 755–764. [Google Scholar] [CrossRef]
  20. Zhou, Y.; Chen, S. Numerical investigation of cable breakage events on long-span cable-stayed bridges under stochastic traffic and wind—ScienceDirect. Eng. Struct. 2015, 105, 299–315. [Google Scholar] [CrossRef] [Green Version]
  21. Islam, M.R.; Mekhilef, S.; Saidur, R.J.R.; Reviews, S.E. Progress and recent trends of wind energy technology. Renew. Sustain. Energy Rev. 2013, 21, 456–468. [Google Scholar] [CrossRef]
  22. Saidur, R.; Islam, M.R.; Rahim, N.A.; Solangi, K.H. A review on global wind energy policy. Renew. Sustain. Energy Rev. 2010, 14, 1744–1762. [Google Scholar] [CrossRef]
  23. Saidur, R.; Rahim, N.; Islam, M.; Solangi, K.H. Environmental impact of wind energy. Renew. Sustain. Energy Rev. 2011, 15, 2423–2430. [Google Scholar] [CrossRef]
  24. Dai, K.; Bergot, A.; Liang, C.; Xiang, W.-N.; Huang, Z. Environmental issues associated with wind energy–A review. Renew. Energy 2015, 75, 911–921. [Google Scholar] [CrossRef]
  25. Jiang, L.; Chi, Y.; Qin, H.; Pei, Z.; Li, Q.; Liu, M.; Bai, J.; Wang, W.; Feng, S.; Kong, W.; et al. Wind energy in China. IEEE Power Energy Mag. 2011, 9, 36–46. [Google Scholar] [CrossRef]
  26. Sahu, B.K. Wind energy developments and policies in China: A short review. Renew. Sustain. Energy Rev. 2018, 81, 1393–1405. [Google Scholar] [CrossRef]
  27. Li, Y.; Wu, X.-P.; Li, Q.-S.; Tee, K. Assessment of onshore wind energy potential under different geographical climate conditions in China. Energy 2018, 152, 498–511. [Google Scholar] [CrossRef]
  28. Bakker, A.; Van den Hurk, B.; Coelingh, J.P. Decomposition of the windiness index in the Netherlands for the assessment of future long-term wind supply. Wind Energy 2013, 16, 927–938. [Google Scholar] [CrossRef]
  29. Dale, L.; Milborrow, D.; Slark, R.; Strbac, G. Total cost estimates for large-scale wind scenarios in UK. Energy Policy 2004, 32, 1949–1956. [Google Scholar] [CrossRef]
  30. Holt, E.; Wang, J.; Climatology. Trends in wind speed at wind turbine height of 80 m over the contiguous United States using the North American Regional Reanalysis (NARR). J. Appl. Meteorol. Climatol. 2012, 51, 2188–2202. [Google Scholar] [CrossRef] [Green Version]
  31. Pryor, S.; Barthelmie, R.; Kjellström, E. Potential climate change impact on wind energy resources in northern Europe: Analyses using a regional climate model. Clim. Dyn. 2005, 25, 815–835. [Google Scholar] [CrossRef]
  32. Sailor, D.J.; Smith, M.; Hart, M. Climate change implications for wind power resources in the Northwest United States. Renew. Energy 2008, 33, 2393–2406. [Google Scholar] [CrossRef]
  33. Wu, B.; Xiong, J.; Yan, N. ETWatch: Models and methods. Remote Sens. 2010, 15, 224–230. [Google Scholar]
  34. Wu, B.; Yan, N.; Xiong, J.; Bastiaanssen, W.; Zhu, W.; Stein, A. Validation of ETWatch using field measurements at diverse landscapes: A case study in Hai Basin of China. J. Hydrol. 2012, 436, 67–80. [Google Scholar] [CrossRef]
  35. Vinukollu, R.; Sheffield, J.; Ferguson, C.; Pan, M.; Wood, E. Developing Evapotranspiration Data Records for the Global Terrestrial Water Cycle. In Proceedings of the AGU Fall Meeting Abstracts, San Francisco, CA, USA, 13–18 December 2009. IN43C–1159. [Google Scholar]
  36. Trenberth, K.E.; Fasullo, J.T.; Kiehl, J. Earth’s global energy budget. Bull. Am. Meteorol. Soc. 2009, 90, 311–324. [Google Scholar] [CrossRef]
  37. Yu, M.; Wu, B.; Yan, N.; Xing, Q.; Zhu, W. A method for estimating the aerodynamic roughness length with NDVI and BRDF signatures using multi-temporal Proba-V data. Remote Sens. 2017, 9, 6. [Google Scholar] [CrossRef] [Green Version]
  38. Stocker, T. Climate Change 2013: The Physical Science Basis: Working Group I Contribution to the Fifth Assessment Report of the Intergovernmental Panel on Climate Change; Cambridge University Press: Cambridge, UK, 2014. [Google Scholar]
  39. Ward, M.N.; Hoskins, B.J. Near-surface wind over the global ocean 1949–1988. J. Clim. 1996, 9, 1877–1895. [Google Scholar] [CrossRef] [Green Version]
  40. Young, I.; Zieger, S.; Babanin, A. Global trends in wind speed and wave height. Science 2011, 332, 451–455. [Google Scholar] [CrossRef]
  41. Tokinaga, H.; Xie, S. Weakening of the equatorial Atlantic cold tongue over the past six decades. Nat. Geosci. 2011, 4, 222–226. [Google Scholar] [CrossRef]
  42. Pryor, S.; Ledolter, J. Addendum to “Wind speed trends over the contiguous United States”. J. Geophys. Res. Atmos. 2010, 115, D10103. [Google Scholar] [CrossRef]
  43. Morillas, L.; Villagarcía, L.; Domingo, F.; Nieto, H.; Uclés, O.; García, M.J.A.; Meteorology, F. Environmental factors affecting the accuracy of surface fluxes from a two-source model in Mediterranean drylands: Upscaling instantaneous to daytime estimates. Agric. For. Meteorol. 2014, 189, 140–158. [Google Scholar] [CrossRef]
  44. Hazlett, M. Climate change could have major impacts on wind resources. North Am. Windpower. Zackin Publ. Inc 2011, 3. [Google Scholar]
  45. Atkinson, N.; Harman, K.; Lynn, M.; Schwarz, A.; Tindal, A. Long-term wind speed trends in northwestern Europe. In Proceedings of the BWEA28 Conference, Glasgow, Scotland, 17 October 2006. [Google Scholar]
  46. Schiesser, H.-H.; Pfister, C.; Bader, J.; Climatology, A. Winter storms in Switzerland north of the Alps 1864/1865–1993/1994. Theor. Appl. Climatol. 1997, 58, 1–19. [Google Scholar] [CrossRef]
  47. Pirazzoli, P.A.; Tomasin, A. Recent near-surface wind changes in the central Mediterranean and Adriatic areas. Int. J. Climatol. J. R. Meteorol. Soc. 2003, 23, 963–973. [Google Scholar] [CrossRef]
  48. Jiang, Y.; Luo, Y.; Zhao, Z.; Tao, S.; Climatology, A. Changes in wind speed over China during 1956–2004. Theor. Appl. Climatol. 2010, 99, 421–430. [Google Scholar] [CrossRef]
  49. Lin, C.; Yang, K.; Qin, J.; Fu, R. Observed coherent trends of surface and upper-air wind speed over China since 1960. J. Clim. 2013, 26, 2891–2903. [Google Scholar] [CrossRef] [Green Version]
  50. Xu, M.; Chang, C.P.; Fu, C.; Qi, Y.; Robock, A.; Robinson, D.; Zhang, H. Steady decline of east Asian monsoon winds, 1969–2000: Evidence from direct ground measurements of wind speed. J. Geophys. Res. Atmos. 2006, 111, D24111. [Google Scholar] [CrossRef] [Green Version]
  51. Zhai, P.; Pan, X. Trends in temperature extremes during 1951–1999 in China. Geophys. Res. Lett. 2003, 30, 1913. [Google Scholar] [CrossRef]
  52. Zunya, W.; Yihui, D.; Jinhai, H.; Jun, Y. An updating analysis of the climate change in China in recent 50 years. Acta Meteorol. Sin. 2004, 62, 228–236. [Google Scholar]
  53. Guoyu, R.; Jun, G.; Mingzhi, X.; Ziying, C.; Li, Z.; Xukai, Z.; Qingxiang, L.; Xiaoning, L. Climate changes of China’s mainland over the past half century. Acta Meteorol. Sin. 2005, 63, 942–956. [Google Scholar]
  54. Ge, J.; Feng, D.; You, Q.; Zhang, W.; Zhang, Y. Characteristics and causes of surface wind speed variations in Northwest China from 1979 to 2019. Atmos. Res. 2021, 254, 105527. [Google Scholar] [CrossRef]
  55. Gusatu, L.F.; Yamu, C.; Zuidema, C.; Faaij, A. A Spatial Analysis of the Potentials for Offshore Wind Farm Locations in the North Sea Region: Challenges and Opportunities. ISPRS Int. J. Geo-Inf. 2020, 9, 96. [Google Scholar] [CrossRef] [Green Version]
  56. Zhang, Z.; Li, Y. Coupling coordination and spatiotemporal dynamic evolution between urbanization and geological hazards–A case study from China. Sci. Total Environ. 2020, 728, 138825. [Google Scholar] [CrossRef]
  57. Li, X.; Wang, L.; Chen, D.; Yang, K.; Xue, B.; Sun, L. Near-surface air temperature lapse rates in the mainland China during 1962–2011. J. Geophys. Res. Atmos. 2013, 118, 7505–7515. [Google Scholar] [CrossRef]
  58. Zhang, B.; Fan, Y.Z.; Dyks, J.; Kobayashi, S.; Mészáros, P.; Burrows, D.N.; Nousek, J.A.; Gehrels, N. Climate of China; Wiley: Hoboken, NJ, USA, 1992. [Google Scholar]
  59. Ren, G.; Ding, Y.; Zhao, Z.; Zheng, J.; Wu, T.; Tang, G.; Xu, Y. Recent progress in studies of climate change in China. Adv. Atmos. Sci. 2012, 29, 958–977. [Google Scholar] [CrossRef]
  60. Lloyd, C. Assessing the effect of integrating elevation data into the estimation of monthly precipitation in Great Britain. J. Hydrol. 2005, 308, 128–150. [Google Scholar] [CrossRef]
  61. Fotheringham, A.S.; O’Kelly, M.E. Spatial Interaction Models: Formulations and Applications; Kluwer Academic Publishers: Dordrecht, The Netherlands, 1989; Volume 1. [Google Scholar]
  62. Wu, B.; Qian, J.; Zeng, Y.; Zhang, L.; Yan, C.; Wang, Z.; Li, A.; Ma, R.; Yu, X.; Huang, J. Beijing. Land Cover Atlas of the People’s Republic of China (1:1,000,000); China Map Publishing House: Beijing, China, 2017. [Google Scholar]
  63. Ouyang, Z.; Zheng, H.; Xiao, Y.; Polasky, S.; Liu, J.; Xu, W.; Wang, Q.; Zhang, L.; Xiao, Y.; Rao, E. Improvements in ecosystem services from investments in natural capital. Science 2016, 352, 1455–1459. [Google Scholar] [CrossRef]
  64. Funk, C.; Peterson, P.; Landsfeld, M.; Pedreros, D.; Verdin, J.; Shukla, S.; Husak, G.; Rowland, J.; Harrison, L.; Hoell, A. The climate hazards infrared precipitation with stations—A new environmental record for monitoring extremes. Sci. Data 2015, 2, 1–21. [Google Scholar] [CrossRef] [Green Version]
  65. Beck, H.E.; Zimmermann, N.E.; McVicar, T.R.; Vergopolan, N.; Berg, A.; Wood, E.F. Present and future Köppen-Geiger climate classification maps at 1 km resolution. Sci. Data 2018, 5, 1–12. [Google Scholar] [CrossRef] [Green Version]
  66. Justus, C.; Hargraves, W.; Yalcin, A. Nationwide assessment of potential output from wind-powered generators. J. Appl. Meteorol. 1976, 15, 673–678. [Google Scholar] [CrossRef] [Green Version]
  67. Chang, T. Estimation of wind energy potential using different probability density functions. Appl. Energy 2011, 88, 1848–1856. [Google Scholar] [CrossRef]
  68. Mert, I.; Karakuş, C.; Sciences, C. A statistical analysis of wind speed data using Burr, generalized gamma, and Weibull distributions in Antakya, Turkey. Turk. J. Electr. Eng. Comput. Sci. 2015, 23, 1571–1586. [Google Scholar] [CrossRef]
  69. Dorvlo, A.S. Estimating wind speed distribution. Energy Convers. Manag. 2002, 43, 2311–2318. [Google Scholar] [CrossRef]
  70. Celik, A.N.; Aerodynamics, I. Energy output estimation for small-scale wind power generators using Weibull-representative wind data. J. Wind Eng. Ind. Aerodyn. 2003, 91, 693–707. [Google Scholar] [CrossRef]
  71. Baoqing, X.; De, T.; Hua, W.; Huiwen, L. Methods for solving two-parameter wind velocity weibull distribution. Trans. Chin. Soc. Agric. Eng. 2007, 10. [Google Scholar]
  72. Stevens, M.; Smulders, P. The estimation of the parameters of the Weibull wind speed distribution for wind energy utilization purposes. Wind Eng. 1979, 3, 132–145. [Google Scholar]
  73. Hamed, K.H. Trend detection in hydrologic data: The Mann–Kendall trend test under the scaling hypothesis. J. Hydrol. 2008, 349, 350–363. [Google Scholar] [CrossRef]
  74. McVicar, T.R.; Roderick, M.L.; Donohue, R.J.; Li, L.T.; Van Niel, T.G.; Thomas, A.; Grieser, J.; Jhajharia, D.; Himri, Y.; Mahowald, N.M. Global review and synthesis of trends in observed terrestrial near-surface wind speeds: Implications for evaporation. J. Hydrol. 2012, 416, 182–205. [Google Scholar] [CrossRef]
  75. Wu, B.; Gommes, R.; Zhang, M.; Zeng, H.; Yan, N.; Zou, W.; Zheng, Y.; Zhang, N.; Chang, S.; Xing, Q. Global crop monitoring: A satellite-based hierarchical approach. Remote. Sens. 2015, 7, 3907–3933. [Google Scholar] [CrossRef] [Green Version]
  76. Wang, Z.-Z.; Li, J.; Zhong, Z.-Q.; Liu, D.; Zhou, J. Lidar exploration of atmospheric boundary layer over downtown of Beijing in summer. Appl. Opt. 2008, 29, 96–100. [Google Scholar]
  77. Erasmus, D.A. A comparison of simulated and observed boundary-layer winds in an area of complex terrain. J. Appl. Meteorol. Climatol. 1986, 25, 1842–1852. [Google Scholar] [CrossRef] [Green Version]
  78. Helmis, C.; Asimakopoulos, D.; Deligiorgi, D.; Lalas, D.P. Observations of sea-breeze fronts near the shoreline. Bound. -Layer Meteorol. 1987, 38, 395–410. [Google Scholar] [CrossRef]
  79. Pielke, R.A. Land use and climate change. Science 2005, 310, 1625–1626. [Google Scholar] [CrossRef] [Green Version]
  80. Cendrero, A.; Forte, L.M.; Remondo, J.; Cuesta-Albertos, J.A. Anthropocene geomorphic change. Climate or human activities? Earth’s Future 2020, 8, e2019EF001305. [Google Scholar] [CrossRef] [Green Version]
  81. Abdollahbeigi, M.J. Non-Climatic Factors Causing Climate Change. J. Chem. Rev. 2020, 2, 292–308. [Google Scholar]
  82. Bruschi, V.; Bonachea, J.; Remondo, J.; Gómez-Arozamena, J.; Rivas, V.; Méndez, G.; Naredo, J.; Cendrero, A. Analysis of geomorphic systems’ response to natural and human drivers in northern Spain: Implications for global geomorphic change. Geomorphology 2013, 196, 267–279. [Google Scholar] [CrossRef]
  83. Zhang, D.D.; Lee, H.F.; Wang, C.; Li, B.; Pei, Q.; Zhang, J.; An, Y. The causality analysis of climate change and large-scale human crisis. Proc. Natl. Acad. Sci. 2011, 108, 17296–17301. [Google Scholar] [CrossRef] [Green Version]
  84. Liu, J.; Gao, Z.; Wang, L.; Li, Y.; Gao, C.Y.; Physics, A. The impact of urbanization on wind speed and surface aerodynamic characteristics in Beijing during 1991–2011. Meteorol. Atmos. Phys. 2018, 130, 311–324. [Google Scholar] [CrossRef]
  85. Vautard, R.; Cattiaux, J.; Yiou, P.; Thépaut, J.-N.; Ciais, P. Northern Hemisphere atmospheric stilling partly attributed to an increase in surface roughness. Nat. Geosci. 2010, 3, 756–761. [Google Scholar] [CrossRef]
  86. Solomon, S.; Qin, D.; Manning, M.; Chen, Z.; Marquis, M.; Averyt, K.B.; Tignor, M.; Miller, H.L. Contribution of Working Group I to the Fourth Assessment Report of the Intergovernmental Panel on Climate Change; Cambridge University Press: Cambridge, UK; New York, NY, USA, 2007. [Google Scholar]
  87. Zhao, Z.; Luo, Y.; Jiang, Y.; Huang, J. Possible reasons of wind speed decline in China for the last 50years. Adv. Meteorol. Sci. Technol. 2016, 6, 106–109. [Google Scholar]
  88. Yong, Z.Z.L. Advances in assessment on impacts of wind farms upon climate change. Adv. Clim. Chang. Res. 2011, 7, 400. [Google Scholar]
  89. Roy, S.B.; Traiteur, J.J. Impacts of wind farms on surface air temperatures. Proc. Natl. Acad. Sci. USA 2010, 107, 17899–17904. [Google Scholar]
  90. Keith, D.W.; DeCarolis, J.F.; Denkenberger, D.C.; Lenschow, D.H.; Malyshev, S.L.; Pacala, S.; Rasch, P.J. The influence of large-scale wind power on global climate. Proc. Natl. Acad. Sci. USA 2004, 101, 16115–16120. [Google Scholar] [CrossRef] [PubMed] [Green Version]
Figure 1. Administrative division map of China and the distribution of meteorological stations.
Ijgi 10 00515 g001
Figure 2. (a) Changes in China’s annual mean wind speed from 2000 to 2019; (b) statistical curve of the M-K trend and abrupt test of annual mean wind speed in China from 2000 to 2019.
Ijgi 10 00515 g002
Figure 3. (a) Seasonal changes in wind speed from 2000 to 2019 in China. Statistical curve of the M–K trend and abrupt test for four seasons: wind speeds in (b) spring, (c) summer, (d) autumn, and (e) winter from 2000 to 2019 in China.
Ijgi 10 00515 g003
Figure 4. Mean value and statistical curve of the M-K trend and abrupt test for 12 months: Wind speeds in (a) January; (b) February; (c) March; (d) April; (e) May; (f) June; (g) July; (h) August; (i) September; (j) October; (k) November; (l) December from 2000 to 2019 in China.
Ijgi 10 00515 g004
Figure 5. Wind speed range and trend distribution map of 697 meteorological stations in China from 2000 to 2019.
Ijgi 10 00515 g005
Figure 6. (a) The wind speed range of meteorological sites and Weibull probability density function; (b) the cumulative distribution function.
Ijgi 10 00515 g006
Figure 7. Correlation analysis results and error bars between wind speed and (a) temperature; (b) precipitation; (c) air humidity; (d) atmospheric pressure; (e) bright sunshine duration; (f) evaporation.
Ijgi 10 00515 g007
Figure 8. Triangular plot of the spatial distribution of different wind speed range correlation analysis results between wind speed and bright sunshine duration (SUNT, blue), temperature (TEMP, red), and evaporation (ET, green) in China from 2000 to 2019.
Ijgi 10 00515 g008
Figure 9. Spatial distribution of different wind speed changes from 2000 to 2019 over the (a) DEM; (b) slope; (c) aspect of China.
Ijgi 10 00515 g009
Figure 10. Spatial distribution of different wind speed ranges for the land covers of China from 2000 to 2019.
Ijgi 10 00515 g010
Figure 11. The relationship between the wind speed and different environmental factors: (a) altitude; (b) aspect; (c) slope; (d) land cover.
Ijgi 10 00515 g011
Figure 12. The spatial distribution of different wind speed ranges from 2000 to 2019 over the different agricultural ecology zones of China.
Ijgi 10 00515 g012
Figure 13. Spatial distribution of different wind speed ranges of China, from 2000 to 2019, for: (a) Köppen–Geiger climate classification [65]; (b) temperature; (c) bright sunshine duration; (d) precipitation; (e) evaporation.
Ijgi 10 00515 g013
Table 1. The number of meteorological sites and percentage in each trend type.
TrendNumber of SitesPercentage (%)
Significant Upward17725.4
Marginally Upward284.0
Significant Downward17224.7
Marginally Downward273.9
Notes: An upward trend occurs if Z > 0; a downward trend occurs if Z < 0; Z = 0 represents unchanged; significance in the trend occurs if Z > Z α / 2 = 1.96 , (i.e., α = 5%); if 1.96 > Z > Z α / 2 = 1.64 (i.e., α = 10 % ), the trend is marginally significant, and there is a lack of significance if 1.64 = Z α / 2 > Z > 0 .
Table 2. The number of meteorological sites, percentage, mean value, and wind scale in each wind speed range.
Wind Speed Range (m/s)Mean Value (m/s)Wind ScaleNumber of SitesPercentage (%)
[0,1)0.940–1162.3
[1,3)2.01252975.9
[3,5)3.59313319.1
[5,8)5.664152.2
≥810.29≥540.5
Table 3. Proportions of areas at all altitude levels in China.
Altitude (m)>30002000–30001000–2000500–1000<500
Percentage (%)25.97.025.016.925.2
Publisher’s Note: MDPI stays neutral with regard to jurisdictional claims in published maps and institutional affiliations.

