1. Introduction
Providing adequate essential services is an increasingly important issue in livelihoods, sustainability, and public policy [
1]. Equality of access to these services must be achieved between different population groups regardless of social, economic, demographic, or geographical differences that in many cases lead to inequalities in the provision of these services [
2,
3,
4]. Mainly it must be achieved in those services that are vital, such as the health service [
5,
6].
Nevertheless, in many cases, the provision of health services is not distributed equally in one region and among different population groups due to a variety of spatial and non-spatial factors [
7,
8]. As for non-spatial factors, these mainly significantly affect the quality of the health service offered [
7,
9]. However, spatial aspects can become a physical barrier that hinders adequate access to health services, depending on the separation distance where the patient needs medical assistance to the nearest hospital where he or she can be assisted [
10,
11]. For this reason, health service planning must make it accessible and effective for the whole of the served population [
12,
13,
14]. For this reason, the location of health infrastructures has a social impact among residents of cities and towns [
15,
16]. In fact, a country’s health care capacity affects others due to the interconnection between economic, social, technological, and political systems [
17].
In this regard, considering the different political systems of Spain and Portugal, each country depends on its criterion of self-sufficiency to provide health infra-structures, producing unequal technological development. These differences are more prominent in high-tech sanitary technology equipment, mainly because it is more expensive and requires more skilled human resources. In fact, the non-existence of prior collaboration agreements or previously established protocols causes the patient to be treated primarily in the same country where he or she requires healthcare. Likewise, if the population’s access to health services may in some cases be inadequate and unequal [
18], this is aggravated concerning high-tech health care [
19], like hemodynamic rooms that are considered representative precisely of high health care technology for three fundamental reasons. Firstly, access time to these rooms is a vital factor for the patient. Secondly, they offer urgent health benefits by treating myocardial infarction through percutaneous coronary angioplasty (PCA) which is a treatment potentially usable in the vast majority of patients with acute myocardial infarction, achieves the recanalization of the coronary artery in more than 90% of cases, with better perfusion of the infarcted area and a lower incidence of re-inclusion when compared with thrombolytic treatment [
20]. Thirdly, these rooms must be integrated into a hospital [
10].
The assessment and optimization of cardiovascular and hemodynamic variables is a mainstay of patient management in critically ill patients in the intensive care unit (ICU) or the operating room (OR). Therefore, it is of outstanding importance to meticulously validate technologies for hemodynamic monitoring and to study their applicability in clinical practice and, finally, their impact on treatment decisions and patient outcome [
21]. Indeed, hemodynamic monitoring provides the basis for optimizing cardiovascular dynamics in intensive care medicine and anaesthesiology [
22]. The hemodynamic room has the most advanced technology for the diagnosis and treatment of coronary diseases. On the one hand, the virtual histology offers differentiated and percentage information of the four components of the atheroma plaque: the fibrotic, lipid, calcium, and chorionic content. On the other hand, intracoronary ultrasound consists of a 1 mm catheter incorporating a small ultrasound emission system (transducer) at the distal end connected to a console that generates images in real-time.
The use of indicators makes it possible to assess the geographical distribution of the applicant population of these services, the transport infrastructures that allow access to them, and the provision of services offered by health infrastructures. In this sense, the proliferation of spatially disaggregated data and the increasing use of Geographic Information Systems (GIS) has led to a plethora of spatial accessibility analysis to health services, combined with criteria for quality and efficiency of the service provided [
10]. In the bibliography on accessibility, a great variety of indicators that evaluate them is observed (see, for example, [
23,
24,
25,
26,
27]). Moreover, all of them offer a measure to close the existing separation between human settlements and activities depending on the transport network made available to defining a single indicator of accessibility that includes all the approaches is nearly impossible to realize since each indicator measures this variable from a concrete point of view, to evaluate the quality of the access to the transport infrastructures and to determine strategic locations or as tools for the planning in the decision-making process [
26]. However, these indicators can complement each other to provide a clearer picture about the benefits that the analyzed infrastructure will facilitate the territories affected by it [
28]. Therefore, it makes it possible to analyze whether societies are inclusive [
29], that all their members have access to high-tech healthcare services and impartial, and whether they have the same healthcare opportunities [
30,
31,
32]. This kind of analysis has produced different approximations [
18,
33], including the regional availability model [
34,
35,
36,
37], kernel density models [
29,
30,
31], and gravity models [
38,
39,
40,
41,
42,
43]. Among the latter models the two-step floating catchment area method (2FSCA) stands out [
44,
45]. However, the adoption of an equal catchment size was criticized for the lack of nuances in interpreting the effect of decreasing distance [
43] and to adapt to the different travel environments where health search behaviors take place, the enhanced two-step floating capture model (ESFCA) was proposed [
46]. Nonetheless, in these latter two methods, there is the oversight of regional competition [
7]. In fact, it is also known as “intervention opportunities” in the language of spatial interaction models [
47], as they limit search behaviors, as in many cases, the patient can be treated outside a particular administrative unit [
48,
49], to minimize this defect the three-step floating catchment area method (3SFCA) was developed [
50,
51,
52]. Regarding the choice of 2FSCA versus 3FSCA, it is a necessary combination of both a distance-decay function and variable catchment size function for the 2SFCA to appropriately measure healthcare access across all geographical regions [
53,
54]. The 3SFCA method is based on a more reasonable assumption of healthcare demand for medical services [
51]. Suppose it is considered the chance that a patient could be treated in two neighboring countries. In this scenario, the boundary line would be considered non-existent to serve the population regardless of the country in which it resided. To seek collaboration between both countries to seek a better health service to the population. 3FSCA assumes that a population’s healthcare demand for a medical site is influenced by the availability of other nearby medical sites. Indeed, it assigns a travel-time-based competition weight for each pair of population-medical sites in addition to the E2SFCA methodology.
In fact, when we aggregate the population within the overlapping catchment areas of multiple facilities, the original 2SFCA framework leads to double-counting of the population that tends to increase the level of demand in the healthcare system [
55]. Various solutions to the demand and level of service increase have been proposed, including selecting weights based on a travel impedance function in the 3SFCA method [
55].
The current work intends to elaborate a viable framework to measure spatial accessibility for the resident population in Spain and Portugal regarding hemodynamics rooms. Through the present study, the municipalities have been classified according to their accessibility degree. Therefore, it was allowed to determine which are the ones that show inadequate accessibility levels.
As for the spatial heterogeneity of border areas, by using an adjusted spatial access index, the 3SFCA method indicates strong potential for identifying health professional shortage areas [
51]. In this regard, in the borderline region between Spain and Portugal, there is a shortage of hospitals, and as a consequence, there is a shortage in the sanitary services offered. Another point to consider is that the opening hours are 24 h a day. Therefore, for every hemodynamic room, the perception of quality care was taken into account by the doctors who finally decide where the patients will be treated.
In order to carry out such a study, two scenarios will be put forward: (1) the patients could be treated only in hospitals with hemodynamics rooms in their own country; (2) the patients also be treated in hospitals located outside their country. In this regard, the difference between these scenarios will identify the municipalities that improve their accessibility patterns and quantify how people’s living standards continue to increase regarding health services.
2. Materials and Methods
Based on official information and the application of the spatial interaction model 3SFCA, the proposed objective could be met. In this regard, the data used comes from publications made by official institutions. Although, they must be differentiated according to the sources used for each of the countries. In the case of Spain, these sources are the Official Road Map of 2021 of the Ministry of Development, the National Cartographic Base at a scale of 1:200,000 (BCN200) of the National Geographic Institute (IGN), the revision of the Municipal Population Register of 2020 of the National Institute of Statistics (INE) and the Minimum Basic Set of Hospital data (CMBD) of 2014, the National Catalog of Hospitals (CNH) of 2020 prepared by the Ministry of Health, the Ministry of Social Rights and Agenda 2030 and the Ministry of Consumer Affairs.
In the case of Portugal, the data comes from the web portal relating to the Portuguese infrastructure network, the National Geographic Information System (SNIG) and the National Territorial Information System, the PORDATA web portal, and the set of Health Centers in 2012 from the National Institute of Statistics (INE). Likewise, to obtain the hemodynamic room number of each hospital, it was necessary to have Computer-assisted telephone interviewing (CATI) and computer-assisted web interview (CAWI), based on electronic surveys sent to respondents before.
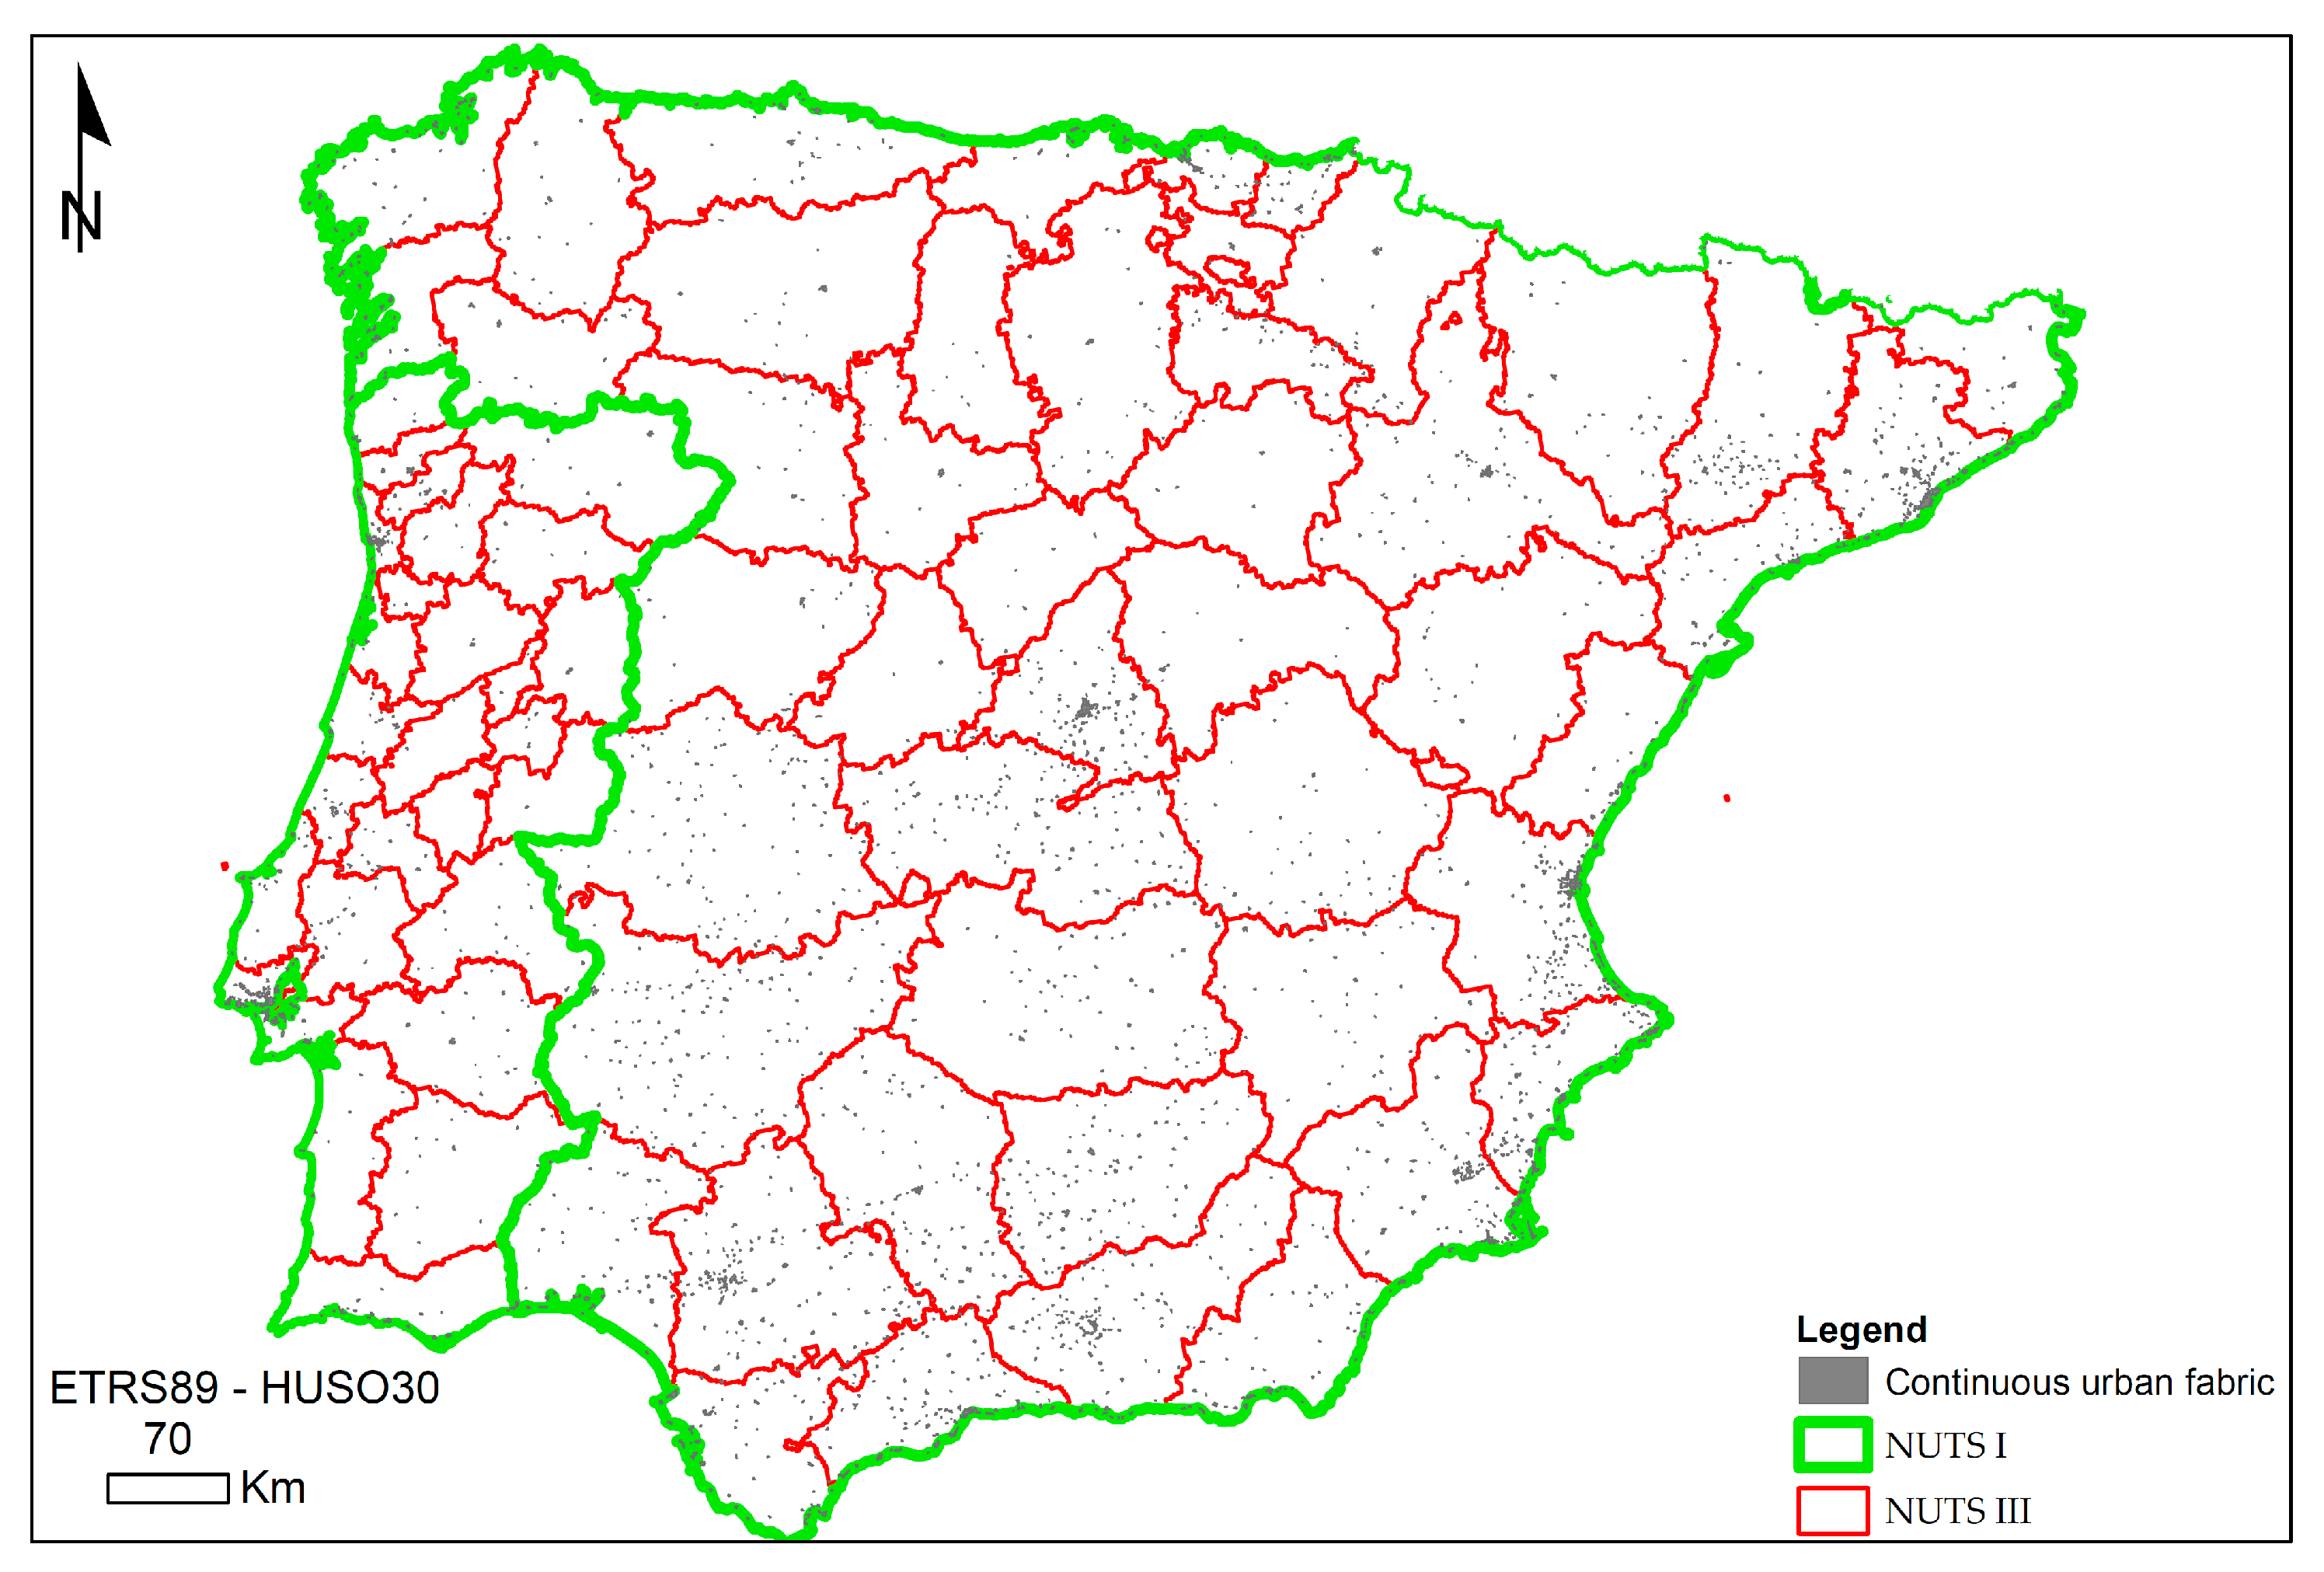
However, there is a common source of information for the two countries, the land use registered by the Corine Land Cover program for the year 2018, to determine the uses of the continuous urban fabric land designated with code 111 serve to determine urban areas.
Likewise, the development of all the tasks and calculations performed was carried out using the R statistical package (created by Ross Ihaka and Robert Gentleman, in Auckland, New Zealand) and the ArcGIS 10.8.1 application (ESRI, Redlands, CA, USA) and its network analysis tool, Network Analyst.
In fact, the tasks carried out are differentiated by five essential phases. Initially, the design of the base cartography, continuing with the determination of the floating catchment areas of the hospitals equipped with some hemodynamic room and continues with the obtaining of the thematic cartography that shows the degree of health coverage for each municipality in two differentiated scenarios and ends with the comparative analysis of the alphanumeric information. In one scenario, the patient can only be treated in hospitals located in the same country where he suffered a myocardial infarction—in the second scenario, taking into account that the patient can also be treated in hospitals in the neighboring country (
Figure 1).
2.1. Developing Cartography
The cartography used is vector and is composed of four layers in Shapefile (shp.) format. Likewise, it has been used in the European Terrestrial Reference System 1989 (ETRS89) in spindle 30.
Firstly, the road network is modeled using graphic entities linear to the entire road network of peninsular highways (
Figure 2). The topology generated for this layer is of the arc-node type, on which the impedance is determined in minutes as the time it takes a vehicle to travel each of the network sections. This happens once each section of the road had associated the maximum speed allowed and the distance to travel.
The second layer of information corresponds to the urban area of cities and towns (
Figure 3). Polygonal graphic entities represent these, and the resident population in each one of them composes the associated alphanumeric information.
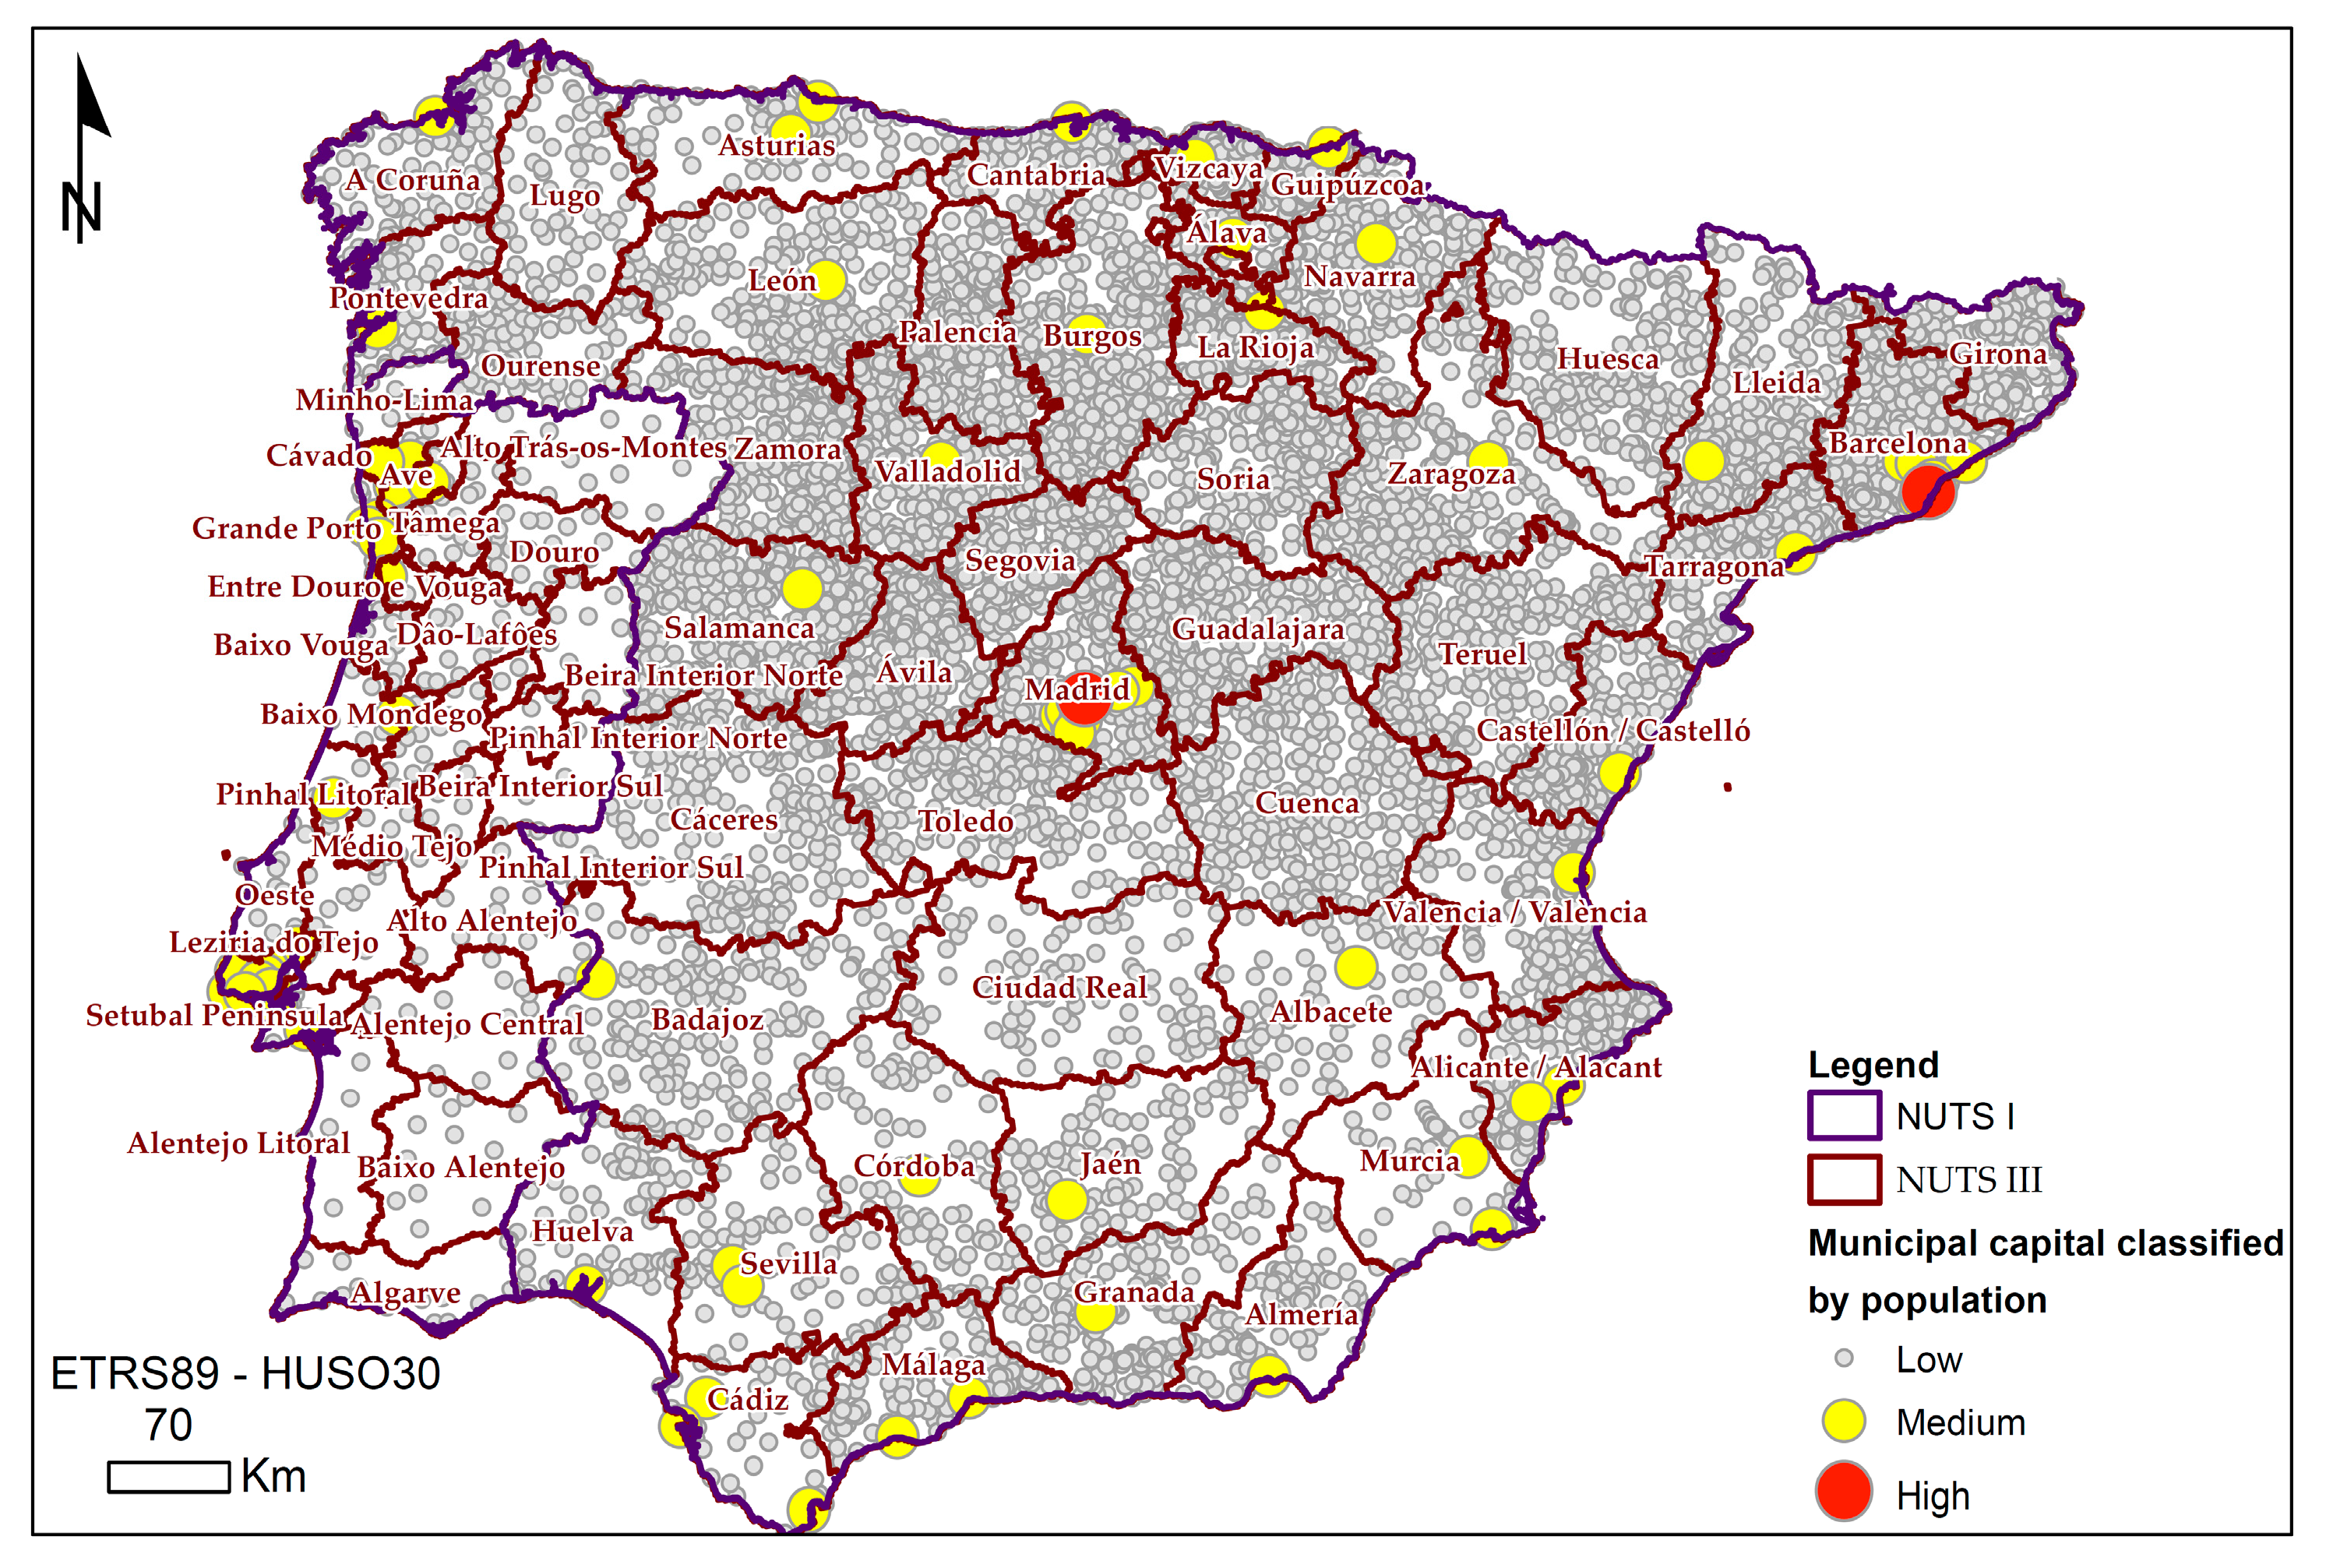
The third layer of information evokes the municipal capitals represented by dots with the resident population as associated alphanumeric information (
Figure 4).
The last layer represents the cities with hospitals that contain some hemodynamic rooms (
Figure 5). Precisely the number of hemodynamic rooms is the alphanumeric information associated with them. The graphic entity that represents them is the centroids of the municipal capitals that contain some hemodynamic room. These were determined by selecting those municipal capitals with a public or subsidized hospital equipped with a hemodynamic room. In this regard,
Figure 5 shows a symbol in the cities with hospitals where there are hemodynamics rooms. However, this symbol is also proportional according to the number of hemodynamics rooms in the hospitals.
2.2. Origin-Destination Time Matrix
The time from the emergency notification to the balloon implantation in the PCA should not exceed 90 min according to the medical standards [
56,
57,
58,
59,
60]. Therefore, since the patient suffers acute myocardial infarction, a hemodynamic room is crucial to the treatment in a hospital. In fact, this determines physicians’ behavior when selecting the hospital where the patient is to be transferred. As a consequence, a threshold time of 90 min was established in the analysis.
In this regard, the transfer time of the patient to the hospital was determined as the travel time between the municipal capitals that require a PCA and the cities that have a hospital with at least one hemodynamic room. Besides, by calculating the inter-urban travel time between cities or towns, the intra-urban times it takes to traverse the different urban environments are estimated, from the municipality of origin where the patient suffers the myocardial infarction to different hospitals that have a hemodynamic room. Precisely, the population and the urban area are used to estimate these intra-urban times, since in this methodology they are estimated based on the population density of urban areas, through a linear adjustment that gives a maximum of 80 km/h to the areas with the lowest population density and a minimum of 20 km/ha in the most densely populated areas [
59]. In this way, the sum of the inter-urban time plus the intra-urban time determines the total time of the journey between the municipal capitals with some patients due to myocardial infarction and the urban centers with a hospital hemodynamic room.
2.3. Defining Hospital Catchment Areas
The relationship between supply and demand for healthcare resources is analyzed by applying the spatial interaction model called 3-step floating catchment area (3SFCA). This model is based on a logical conjecture of the demand for health care [
10]. Because it assumes that the population that demands health care from a particular place is influenced by the availability of different nearby sites where medical care is offered, specifically by the time of separation and the services offered. Conceptually, the model assigns a travel-time-based competition weight for each population-medical site pair in addition to the methodology outlined in an enhanced two-step floating catchment area (E2SFCA). This weight is then used to calculate the demand of service sites, thereby minimizing the overestimation [
58]. The method is implemented in three steps:
Step 1: Determine the catchment of a population location
i based on a 90-min driving zone. A person can suffer a myocardial infarction and where all the services available within the catchment are sought. In this case, all those hospitals have at least one hemodynamic room. Subsequently, a Gaussian weight is assigned to each service site according to the sub-zone in which the site lies (i.e., if a service site is located within the second sub-zone, the Gaussian weight (i.e., W 2) of the sub-zone is assigned to the service site), and calculate a selection weight between each service site and
i by:
where
Gij is the weight of the selection between the location
i corresponding to the capital of the municipality where a patient could suffer a myocardial infarction, and the place
j where there is a hospital with at least one hemodynamic room,
Dist (
i,
j) is the cost of the trip (minutes) from
i to any service location
k within the catchment. Likewise,
d0 is the size of the basin, which in this case is 90 min, taking into account that the maximum time by medical standards [
56,
57,
58,
59,
60]. The Gaussian weights for
j and
k were assigned using
Tij and
Tik, respectively.
Step 2: Determine the 90-min catchment area of each service site
j and divide the catchment into five sub-zones using the same procedure of step 1. All locations within the catchment are sought and computed the physician-to-population ratio (
R) of
j by:
Sj is the medical capacity of j, in this case, it corresponds to the number of hemodynamic rooms available in each hospital. Likewise, Wr is the impedance of the r-th sub-zone Dr, was determined through the road network that served to move the patient from each capital of each municipality to a hospital with at least one hemodynamic room. Furthermore, this impedance considers inter-urban time and intra-urban time, and Gkj is the selection weight between j and population site k, and Pk is the population size of k.
Step 3: Compute the spatial access of population site
i by:
where
Rj is the physician-to-population ratio of
j within the catchment,
Gij is the selection weight between
i and
j, and
Wr is the Gaussian weight of the
r-th sub-zone
Dr.
In the case analyzed, the 3SFCA assumes that the demand of a municipality’s population is affected by the cost of traveling to the nearest health service that offers the treatment of primary percutaneous coronary angioplasty as by its travel costs to adjacent sites offering the same service. This is a logical assumption because the demand of the people for a medical site will decrease when the adjacent sites are also available since the demand of the population in some cases could exceed the supply of hemodynamic rooms that are offered. In fact, the selection weight, Gij, reflects this change. Gij equals 1 when only one medical site is available for a population site but decreases with an increasing number of available alternatives. The multiplication of Gij, Pi, and Wij represents the adjusted population demand of location i on medical site j.
2.4. Developing of the Thematic Cartography
All the previous methodological steps were applied, taking into account two scenarios. In the first one, patients suffering from a myocardial infarction can only be transferred to hospitals located in their country to receive a PCA. Second, patients suffering from a myocardial infarction can be transferred to hospitals in their country or to a neighboring country. For this reason, two thematic maps were obtained.
From the results obtained in analyzing the accessibility to the PCA service, five classes were established through equal intervals, considering the maximum value obtained in both scenarios. In this way, they remained constant in both scenarios, allowing the same classification of the values corresponding to the capacity map to be made at the PCA service. Thus, it is possible to compare both thematic maps and, consequently, both scenarios, identifying and locating those municipalities that suffer the greatest and least variation if the patient could have access to health services in the neighboring country.
2.5. Comparative Analysis of Alphanumeric Information
Comparing the alphanumeric information associated with each of the municipalities in the two analyzed scenarios and the results obtained after applying the 3SFCA allows quantitatively determining the municipalities and the population residing in them according to their access coverage they offer hospitals that have a hemodynamic room.
In this regard, the execution of Structured Query Language (SQL) selected the data corresponding to the municipalities classified according to the established levels of health coverage. From this selection, the relative distribution of health coverage concerning the resident population in the analyzed municipalities and the accumulated percentage of the population could be captured, according to the capacity of PCA health services, by the municipality for inhabitants to access to any country or capacity of PCA health services, by the municipality for inhabitants that could only access they own country. Without ambiguity, it is possible to determine which of the scenarios show greater inequality in access to health services.
3. Results
The thematic maps represent the health coverage for each municipality’s inhabitants in the two scenarios proposed. For this reason, the first map represents the health coverage of each municipality if the patient can only be transferred to hospitals located in the same country where he suffered a heart attack (
Figure 6). The second map shows the health coverage of each municipality if the patient can also be transferred to hospitals in the neighboring country; that is, if the patient suffers a heart attack in Spain, they could also be transferred to Portugal and vice versa (
Figure 7).
The thematic map in
Figure 6 shows the situation of each of the hospitals in the Iberian Peninsula that have at least one hemodynamic room to perform a PCA and the health coverage in the municipalities if the patient can only be transferred to hospitals that are in the same country where he suffers the myocardial infarction. Regarding the distribution of hospitals, it can be seen that the distribution in the border area between the two countries is scarce. In fact, there is only one hospital in a cross-border city. This hospital is located in the NUTS III of Badajoz, located in the southwestern part of Spain (
Figure 5 and
Figure 6). Likewise, also in Spain, in the northwest region, there are three hospitals in areas close to the border located in the NUTS III of Ourense and Pontevedra (
Figure 5 and
Figure 6).
On the contrary, in Portugal, there is no hospital in a cross-border city. However, there are areas close to the border, in the north in the NUTS III of Cávado, in the southern half in the NUTS III of Alentejo Central, and in the south at NUTS III in Algarve (
Figure 2 and
Figure 6). This spatial distribution of hospitals reveals that both countries have developed health policies without coordination to achieve greater coverage in the cross-border area.
Regarding the health coverage observed in each of the countries, in Spain, no pattern is observed (
Figure 6). Although, there is a predominance of municipalities with medium, high, or very high health coverage. Even in the cross-border area with Portugal. However, it is true that in Peninsular Spain, there are also some areas with some isolation from access to hospitals. The largest area located between the NUTS III of Soria, Guadalajara, Teruel, and Cuenca stands out. However, the cross-border area with France in the north of the NUTS III of Huesca and Lleida, between the NUTS III of Cáceres, Toledo, Badajoz, and Ciudad Real (
Figure 2 and
Figure 6) are also noteworthy. In Portugal, a pattern is observed, since in the eastern part and bordering with Spain; there seems to be a low health coverage in the vast majority of municipalities (
Figure 6). However, at the western end, coverage is greater, highlighting a center-periphery model around Lisbon. Therefore, Portugal seems to have developed a distribution of health resources in the coastal areas in the northern half and the southern half centered on the NUTS III of Grande Lisboa, south of the NUTS III West and in the NUTS III of Algarve, existing a great contrast between areas with optimal health coverage and those that practically suffer from inadequate coverage (
Figure 2 and
Figure 6). Precisely, the comparison of this health coverage in the cross-border area indicates that Portugal would benefit more if there were a common policy between both countries, since it has a greater extension of territory with little health coverage, and Spain has adequate health coverage in this cross-border area.
The thematic map in
Figure 7 shows, as in
Figure 5, the same distribution of hospitals. However, in this case (
Figure 7), the patient who suffers a myocardial infarction can also be transferred to hospitals in the neighboring country. As might be expected, the variation in health coverage occurs in the border area and not in the rest of the territory of both countries. However, the comparison of the two scenarios proposed (
Figure 6 and
Figure 7) in the cross-border area shows that the effects of the variation in health coverage are different in both countries.
In this regard, in Spain, the NUTS III of Ourense (
Figure 2 and
Figure 7) improves the health coverage of most of the municipalities located in the south of this NUTS III. In Portugal, in the NUTS III of Minho-Lima, some municipalities have low or medium health coverage (
Figure 6) to have very high coverage (
Figure 7). Possibly, because the accessibility to the hospitals located in the NUTS III of Pontevedra and Ourense is adequate, possibly made possible by an optimal network of roads.
Likewise, in the northern part of the country and in the eastern direction, several municipalities within Tras-os-Montes NUTS III improve their health coverage, going from very low (
Figure 2 and
Figure 6) to low (
Figure 2 and
Figure 7). In the case of Spain, some municipalities located to the south within the NUTS III of Ourense improve. Therefore, it is shown that those patients in the Portuguese municipalities located in the northwestern part of the hospital located in the NUTS III of Alto Trás-os-Montes, if they could be transferred to Spanish hospitals, they would have the same health coverage as the Portuguese municipalities closest to the hospital located in Alto Trás-os-Montes. The road network to access Spanish hospitals could be more adequate than the road network to access the hospital located in the NUTS III Alto Trás-os-Montes located in the same country (
Figure 2 and
Figure 7).
Furthermore, in the NUTS III of Alentejo Central and Alto Alentejo, the health coverage of some municipalities in Portugal improves. Possibly, due to the proximity in access time to the Badajoz hospital, since the road network allows an access time consistently below 90 min in the municipalities indicated above and, also, because this Spanish hospital has a greater number of hemodynamics rooms. On the contrary, in Spain, the variation in health coverage is inexistent. Therefore, there is no improvement in this coverage, even with the possibility of transferring the patient to Portuguese hospitals—possibly, because the access time to the hospital located in Central Alentejo does not compensate for treating the patient when in the hospital located in the NUTS III of Badajoz (Spain) there is a greater number of hemodynamic rooms.
Finally, in the southern border area, the effect produced by the improvement of health coverage in both countries is non-existent. Possibly, each country has adequately endowed that part of the territory and transferring the patient to the neighboring country is not appropriate. Due to the location of the hospitals and the resources available in them, and because of the road network to reach them. In other words, in this case, contrary to what happened in the cross-border northern half, the attractiveness produced by the healthcare resources offered in the neighboring country does not overcome the inconvenience of having to transfer the patient and travel more kilometers to reach them to the hospital.
Also, from the thematic maps, the number of municipalities and the resident population were represented in percentages grouped according to the five levels of health coverage (very low, low, medium, high, and very high) previously used in the thematic maps (
Figure 8 and
Figure 9).
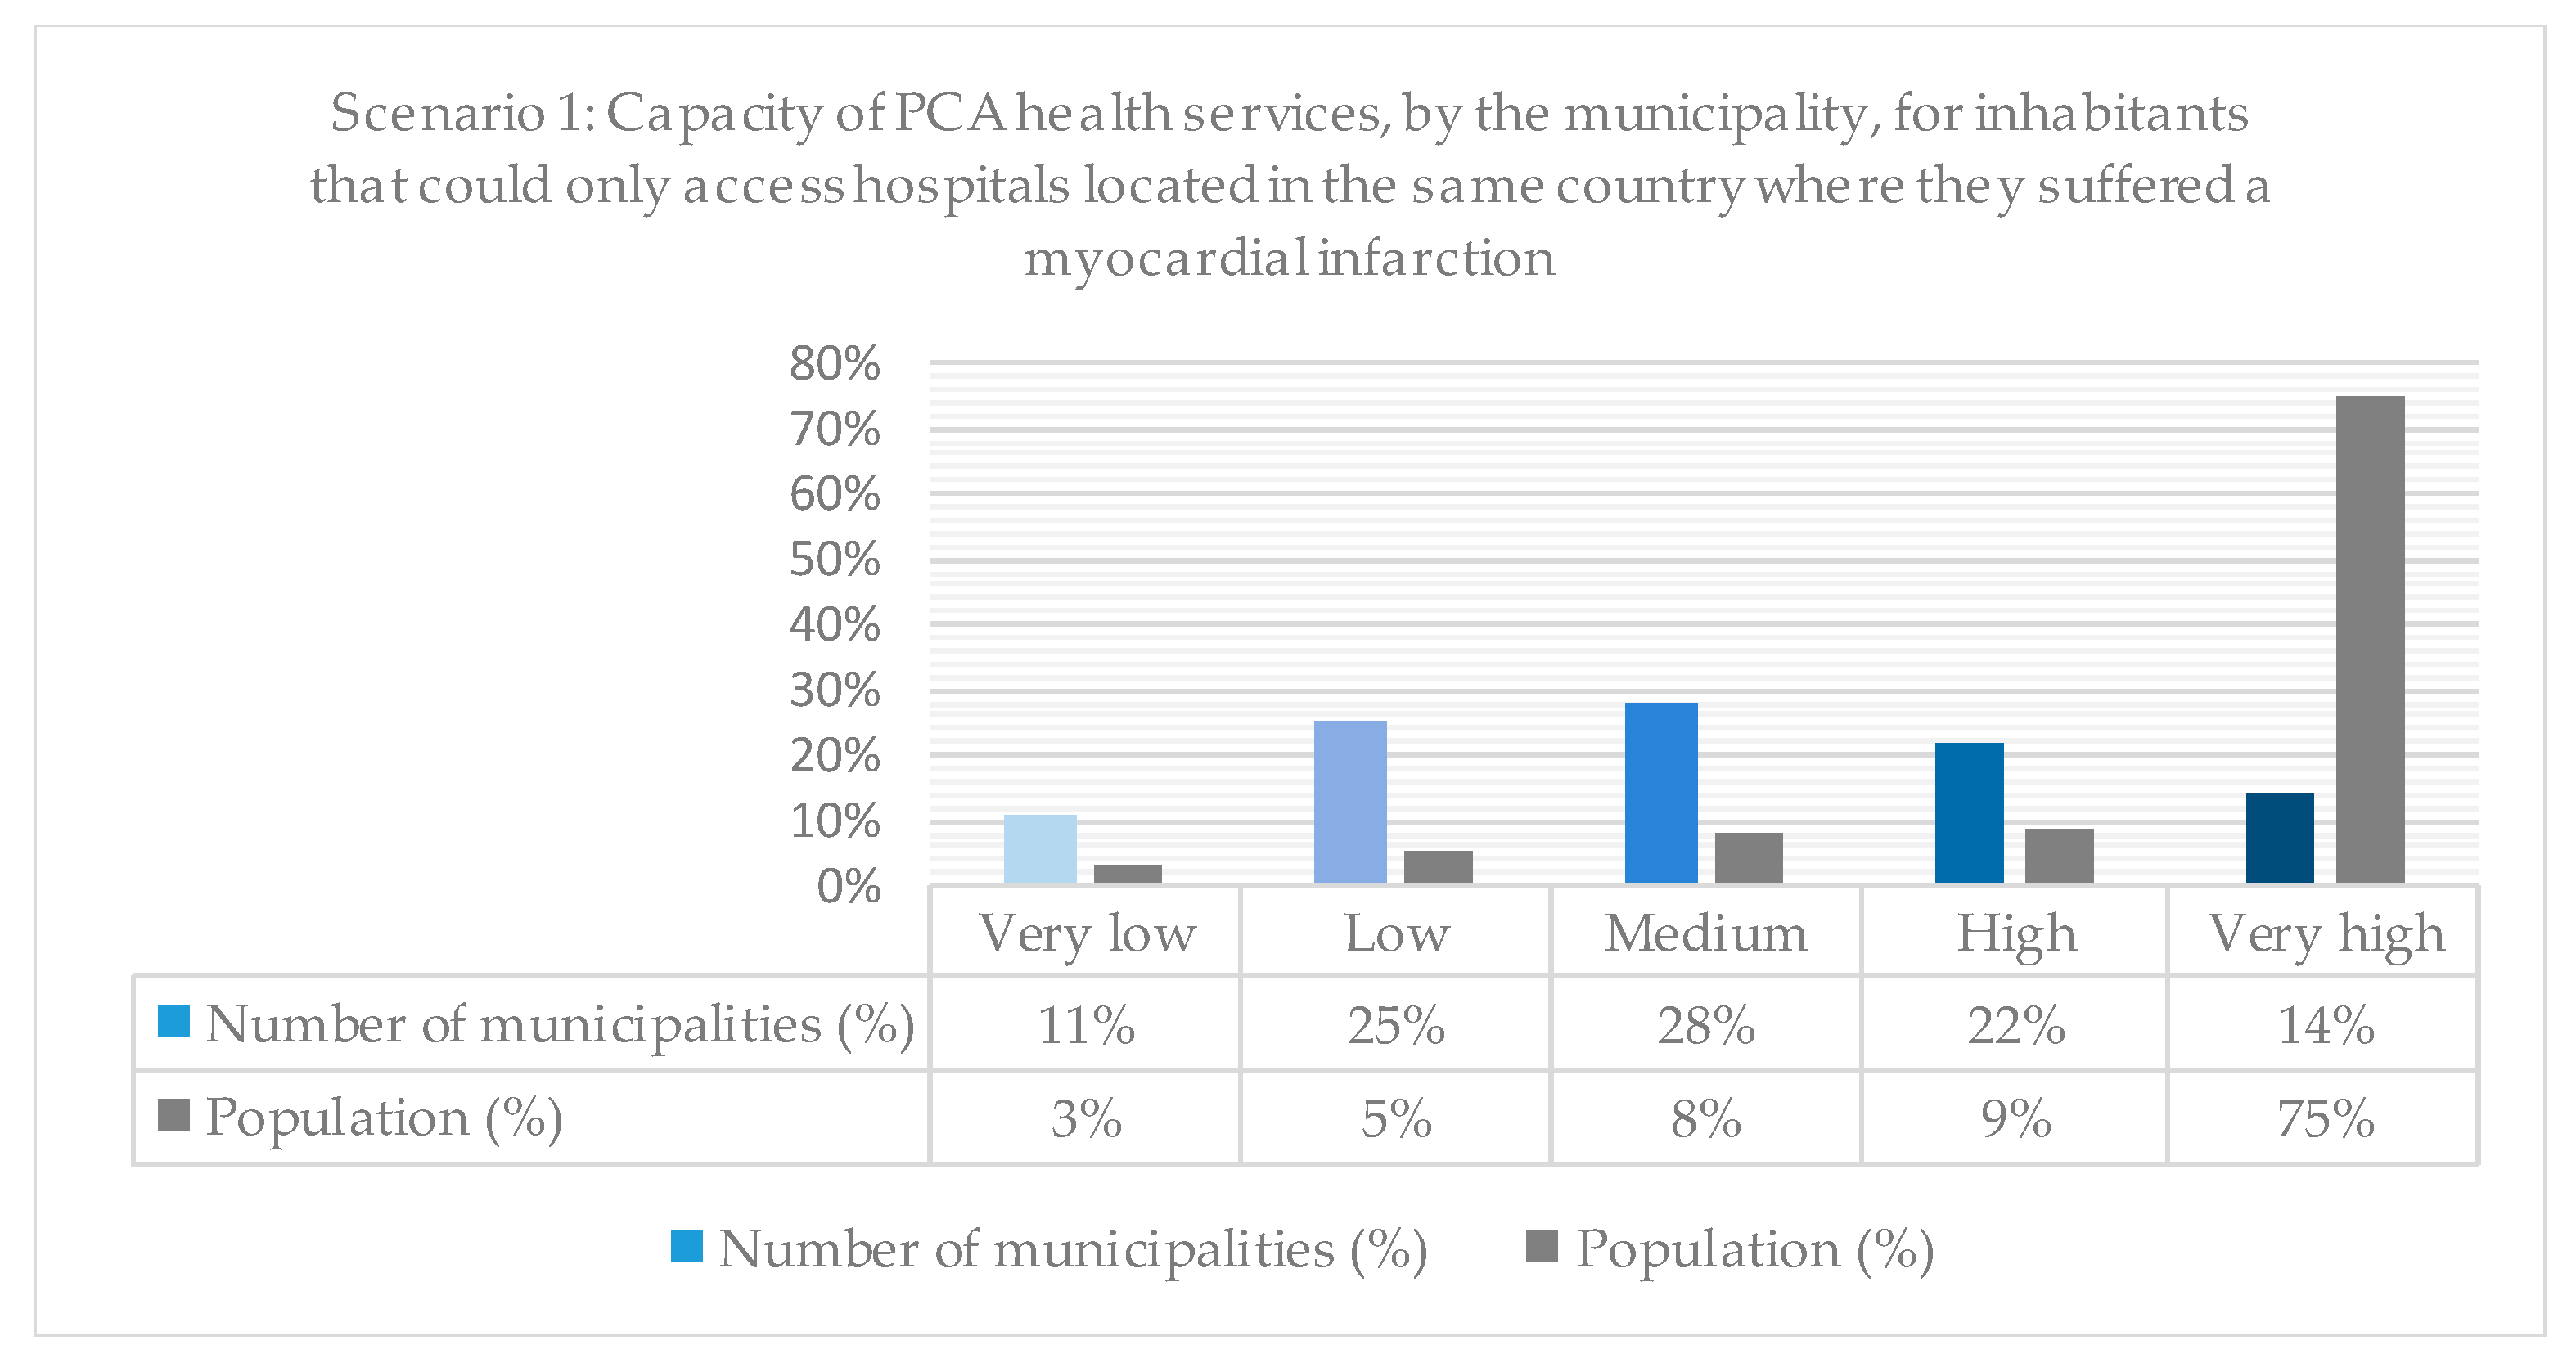
Figure 8 shows these percentages if the patient who suffers a myocardial infarction can only be transferred to a hospital in the same country where he suffered said infarction. Thus, it stands out that, although only 14% of the municipalities have very high health coverage, they host three-quarters of the population. Therefore, it can be stated that a scarce 14% of the municipalities host 75% of the population and have excellent health coverage in the Iberian Peninsula. However, there are also municipalities where there are health coverage problems. On the contrary, 11% of the municipalities with a low population of 3% have health coverage problems.
Consequently, it can be established that the most unpopulated municipalities are those with the greatest health coverage problems. In this sense, it stands out that the population increases progressively from the levels with the worst health coverage to those with the highest health coverage, from 3% to 75%. Therefore, the planning of health services has obeyed, among other criteria, the fundamental criterion of the existing population in each country’s regions.
In order to be able to compare health coverage in the two scenarios,
Figure 9 was made using the same criteria as in
Figure 8. However, in this case, assuming that the patient could be transferred well to hospitals located in the same country where he suffered the heart attack of the myocardium or to a hospital located in the neighboring country. Nevertheless, the comparison of both figures (
Figure 8 and
Figure 9) allows us to affirm that the pattern is maintained in terms of the health coverage offered. Most of the population, 76%, would continue to have better health coverage and a small population with poor health coverage. Even the same trend is observed in terms of population increase as the level of accessibility increases.
Nonetheless, the comparison of both scenarios (
Figure 8 and
Figure 9) allows us to observe some patterns. In the first place, at the lowest levels of health coverage (very low and low), the number of municipalities and the population decreased slightly. On the contrary, the number of municipalities and the population with the best levels of health coverage increase (medium, high, and very high). Therefore, it seems that municipalities and their population are being removed from specific sanitary isolation. However, there are still municipalities and populations with little health coverage.
Figure 10 represents the percentage of the accumulated population in percentage values according to the percentage of accumulated health coverage. For this reason, the blue line evokes an equitable ideal distribution of health coverage for the realization of PCA for the entire population of the Iberian Peninsula. Likewise, the red line represents health coverage for the population, considering that the patient can also be transferred to a hospital located in the neighboring country where they have suffered the myocardial infarction. Furthermore, the green line represents the capacity of the health service if the patient can only be treated in a hospital located in the same country where he suffered this myocardial infarction. Thereby, the curve representing the possibility that the patient can be transferred to hospitals located in both countries is closer to the curve that represents the ideal equitable distribution. As a consequence, it can be affirmed that health coverage for PCA would be more equitably distributed if a patient suffering from myocardial infarction can be treated in a hospital independent of the country where they came from, simply taking into account the access time and the number of hemodynamic rooms at the different hospitals.
4. Discussion
Policies on health infrastructure between two countries that are part of the European Union should be coordinated. However, this study shows that, to some extent, this is not the case between Spain and Portugal.
The border region is made up of mostly sparsely inhabited municipalities. When it comes to health matters as a primary right of citizens, in both countries, the location of hospitals has been prioritized in those more inhabited places, or at least the establishment of those hospitals better equipped with high-tech sanitary equipment, such as hemodynamic rooms to apply a PCA.
However, greater health cooperation between the two would achieve a more equitable distribution of health coverage for all the inhabitants of the Iberian Peninsula. Although Portugal could benefit more, there would also be inhabitants of Spanish border municipalities that would benefit. Likewise, it must be taken into account that both in the border area and the interior of both countries, considering the two scenarios analyzed, there are areas with little health coverage. One would expect to apply specific mitigating measures to alleviate this possible sanitary isolation of high-tech sanitary resources on these territories.
Additionally, even if current health collaborative environments are now populated mainly of a great diversity of cooperation alternatives, the fact is that we still miss the use of specific tools providing essential and effective strategies regarding the use of medical facilities located along the border. However, as Morales et al. [
48] mentioned, communication links enable information collection that can be accessed and/or used by shared infrastructures and services in these territories. Mainly, in medical and clinical environments, resource and service sharing can promote countless potential benefits, supporting very often territories in which medical specialists and infrastructures are very often reduced or limited, enhancing collaboratively gathering vital health opportunities for patients living in these cross-border territories—which are the territories inserted near the borderland, in this case, along the Spanish-Portuguese border.
This fact is increasingly vital in a scenario in which most of the renew equipment and/or construction processes of health infrastructures are supported and financed by European Community funds, that should benefit all the European populations regardless of existing frontiers, bearing in mind the objective to grant better health care for every citizen.
5. Conclusions
Through the present investigation, a series of conclusions were reached, taking into account the access time and the number of hemodynamic rooms to the different hospitals.
Firstly, Spain and Portugal have developed health policies without consideration of the status in the other neighboring country—as shown by the poor distribution of hospitals in the cross-border area—the territories located near the Portuguese-Spanish borderland. However, it is also true that it has been shown that in Portugal, there is a greater concentration of population in the coastal area; this country may require a greater concentration of hospitals here.
Secondly, Portugal would benefit more from developing greater coordination and cooperation in health policy between the two countries—once this country has a more extensive territory where health coverage is low or very low. On the contrary, Spain has a higher level of adequate health coverage in most cross-border areas.
Thirdly, the variation in health coverage that would occur if the patient could also be treated at a hospital in the neighboring country where he suffered the myocardial infarction shows a different effect in both countries. In Portugal, in most of the affected municipalities, they could achieve better health coverage, in some cases equating them to the municipalities closest to hospitals in Portugal. However, in Spain, which already has adequate health coverage, the number of municipalities where better health coverage would be produced is scarce.
Both countries show excellent health coverage for most of the population, as 75% of the population has more than optimal health coverage. Therefore, both have followed a health policy in favor of those most populated municipalities. However, we must not forget that there is still a significant part of the population that has health coverage problems, and for these, it would be necessary to try to apply mitigating measures.
In this regard, the collected data enable us to put forward unique ideas considering that health departments and facilities located along the Portuguese-Spanish border can meet public health needs within their common jurisdictions as long as we enable border regions and their complex environment to be considered as a single European region, regardless of national boundaries. In fact, resource sharing across jurisdictions is a critical opportunity to cross-border regions enabling these territories, sometimes in disadvantaged positions to improve competitiveness, gain effectiveness and increase efficiency.
Additionally, the collected data enabled us to conclude that cross-border health resource sharing constitutes a viable and desirable process to overcome fundamental challenges within scenarios of increasing constraints posed by restricted budgets. Indeed, even if this is not the only reason for cross-border cooperation, limited health resources and budgets associated with low-density territories as the ones characteristic from the majority of the Portuguese-Spanish border, should consider, augmenting resource sharing not only to address emerging challenges but to grant better health services to local populations.
Lastly, although the pattern of health coverage is not broken in the two compared scenarios, it can be established that it is more favorable for the whole of the Iberian Peninsula in the second scenario. In this sense, the municipalities and the population fall for the most precarious levels of health coverage, increasing these in better levels of health coverage. Likewise, health coverage would be distributed more equitably regardless of the country where the patient suffers the myocardial infarction.
The originality and relevance of this study should be emphasized on its findings—once it is possible to find an issue for such a relevant issue as is the case of the emergency health problems of the Portuguese-Spanish borderland populations. Nevertheless, if this study outcome gives us a significant contribution to this thematic field of cross-border cooperation, some improvements and future research lines persist. Among the various research lines that persist, we can use different testing tools—i.e., use a Gini coefficient instead of a Lorenz curve. Therefore, the results from the analysis would be more informative; consequently, more insights could be obtained.


 ,
, 


