
Forest Fire Hazards Vulnerability and Risk Assessment in Sirmaur District Forest of Himachal Pradesh (India): A Geospatial Approach


Abstract
:1. Introduction
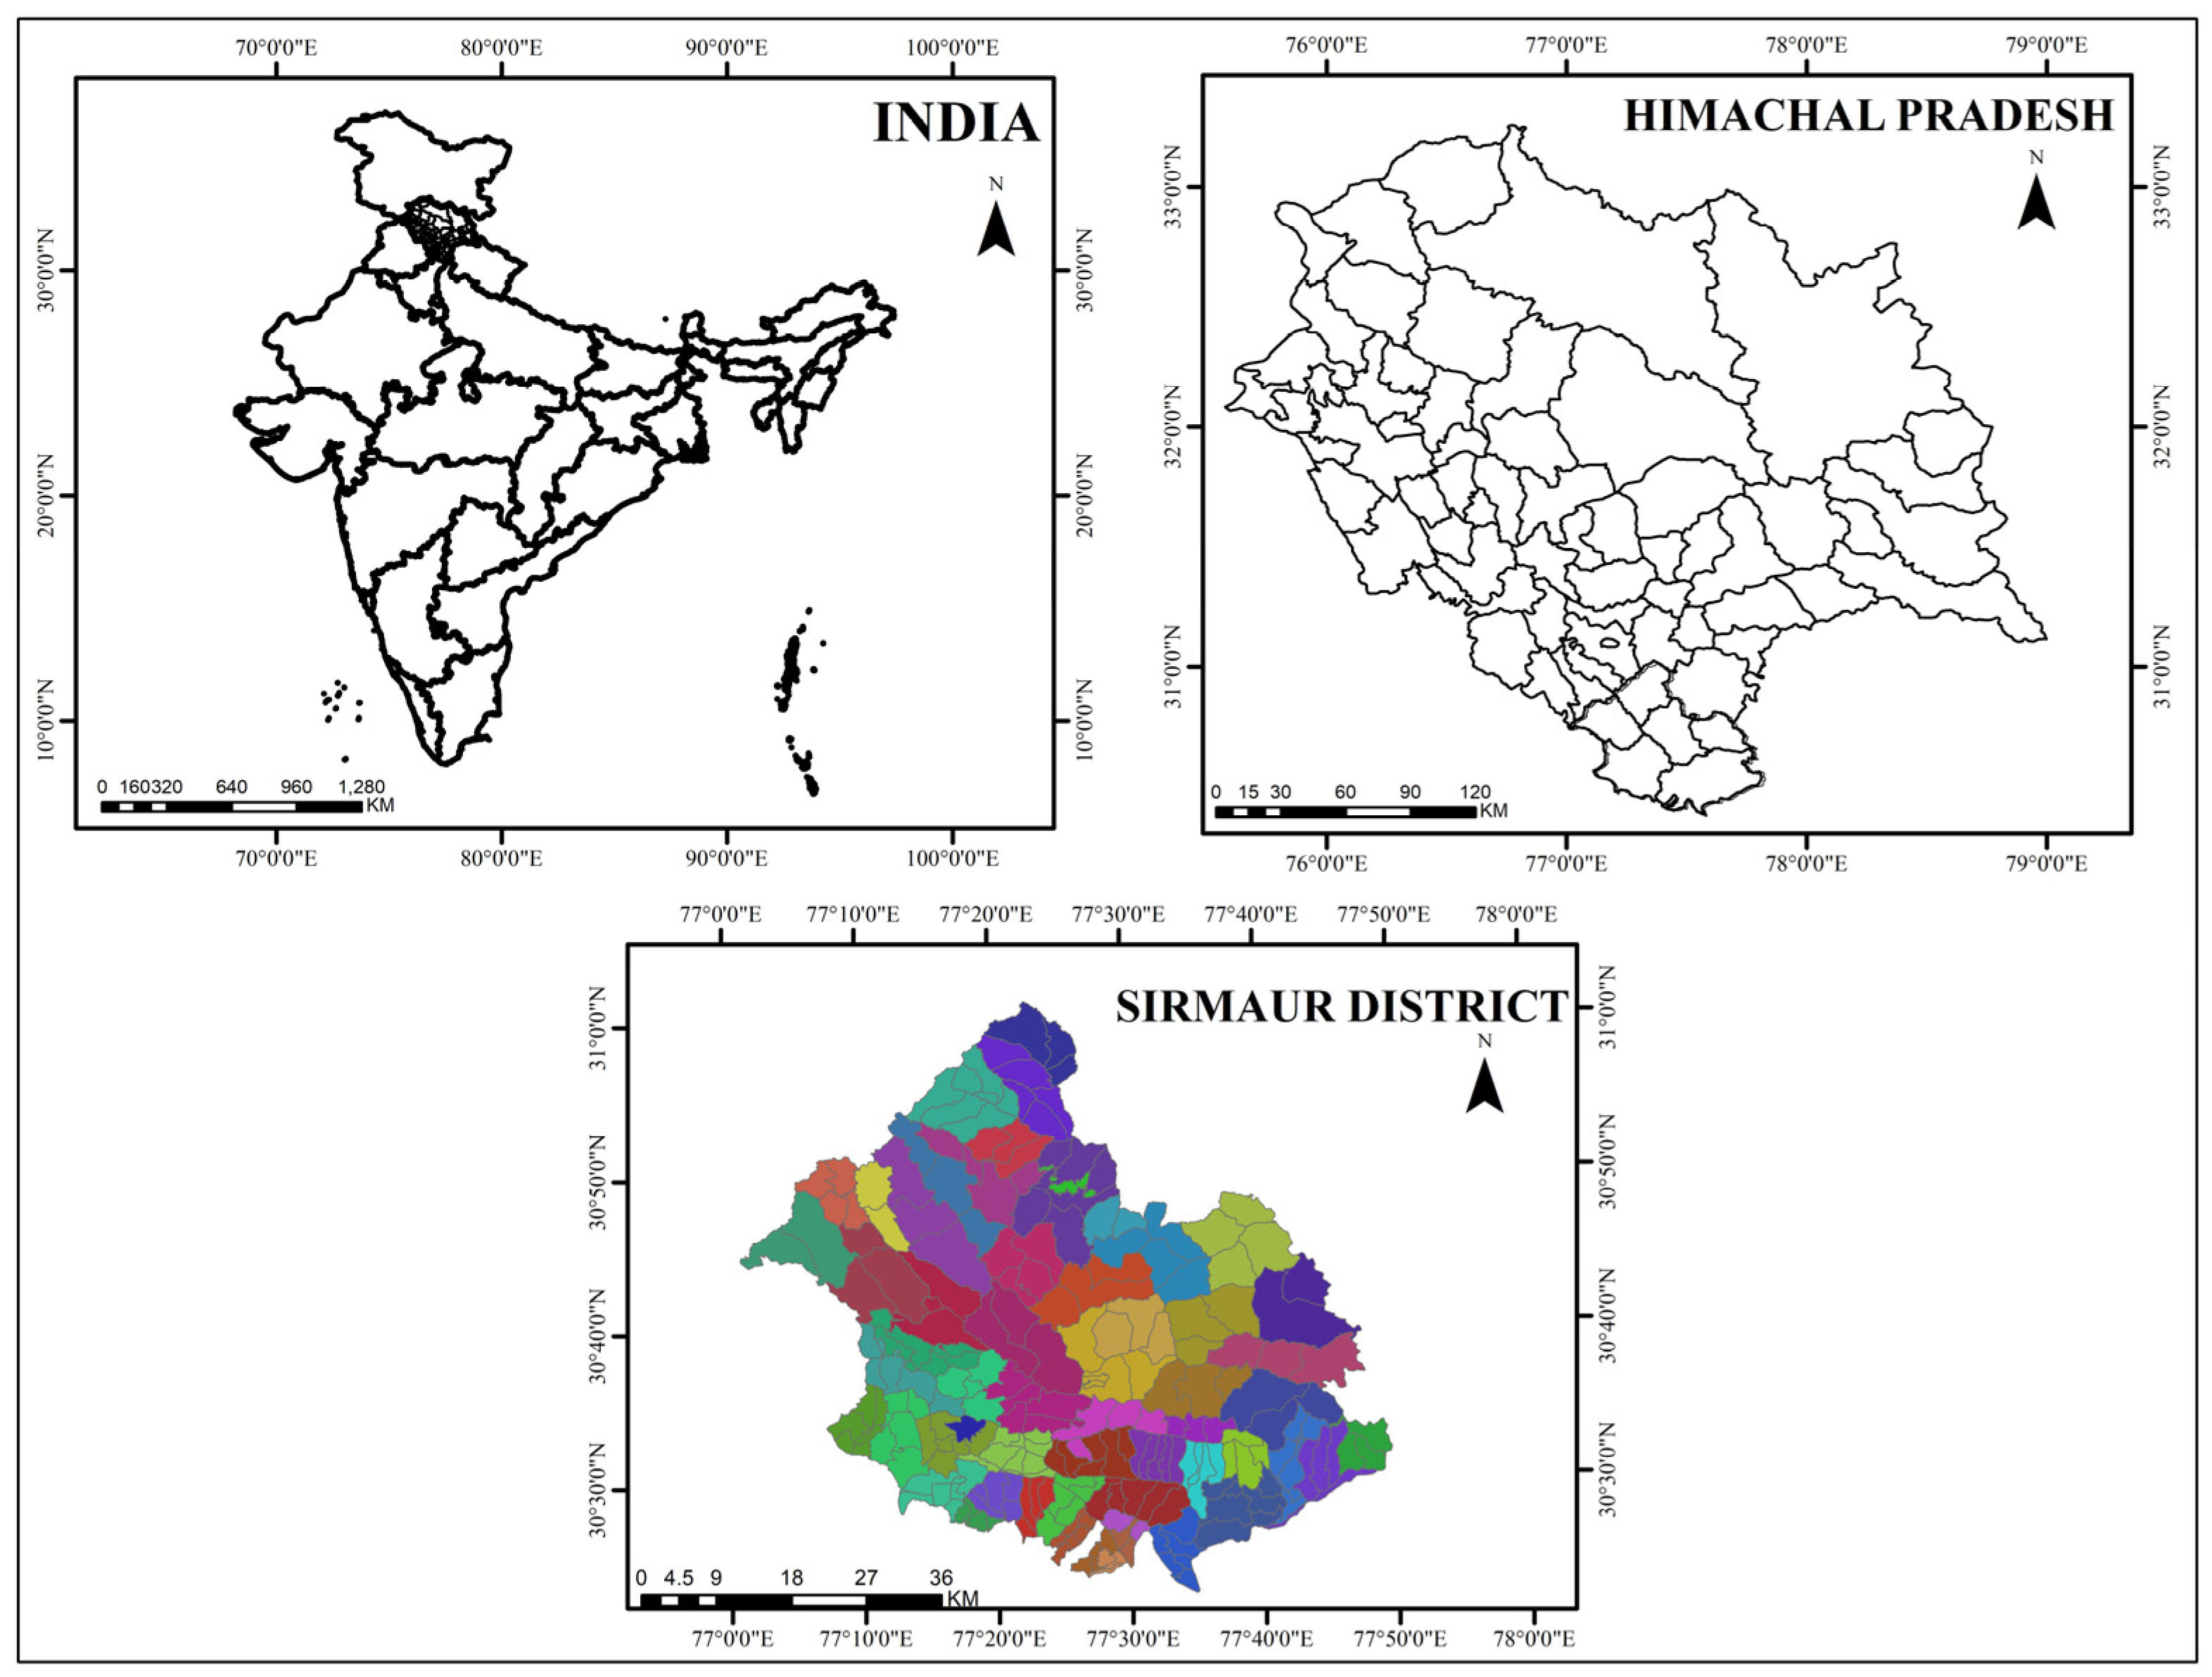
2. Study Area
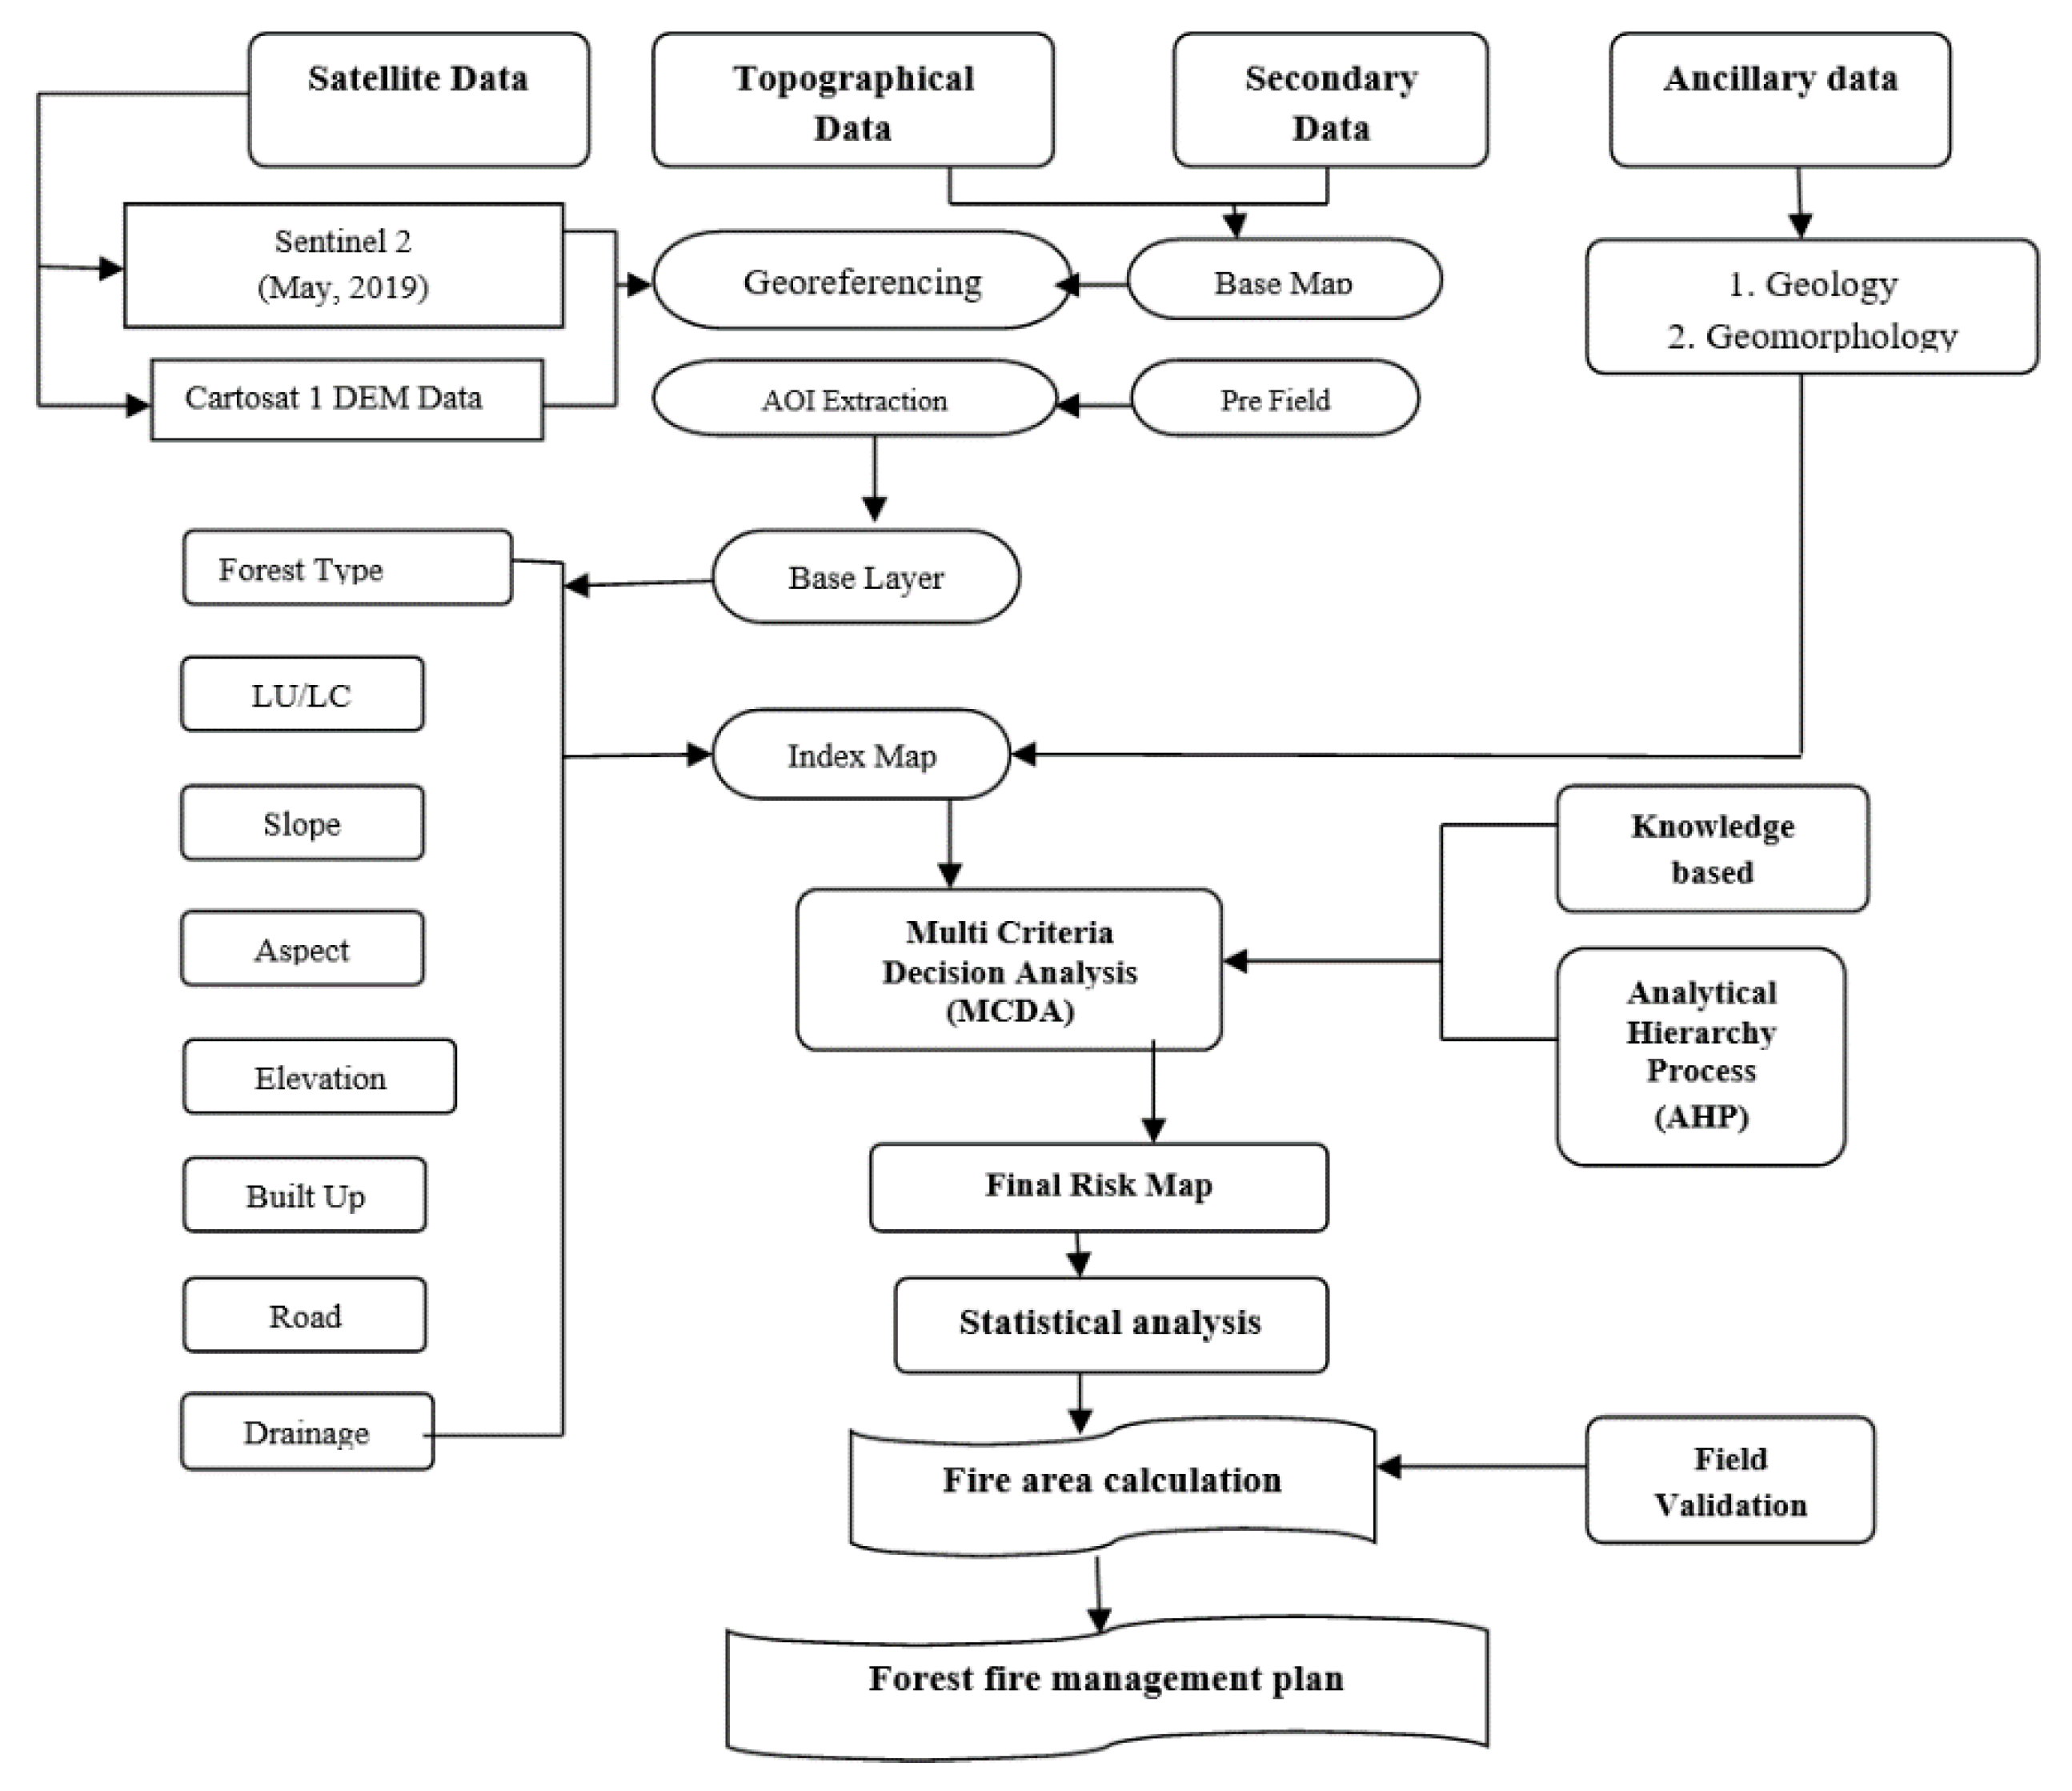
3. Data and Methodology
3.1. Analytical Hierarchy Process (AHP)
3.2. Deriving the Weights Using AHP/ANP
- Construction of a model: many models have been found for the forest reserve map ability, based on a literature review. It is imperative that the problem is identified at both an abstract and thematic level before putting it into model layers.
- Generation of pairwise comparison matrices: with this handy table—aside from arbitrary designations of importance as found in arbitrary scales—the relative values are assigned as follows: 1 means the same importance of the two themes, while a score of 9 represents an extreme priority of one of the themes [30]. In Table 3, the order of the classes indicates the way we want to implement the priority. Saaty’s nine-scale levels for the delineation of groundwater capacity were used in a grid. It aims to capture what is unknown in opinions with AHP views [29]. Referring to the previous entry, the consistency index (CI) is a measure of the consistency by using Equation (1):
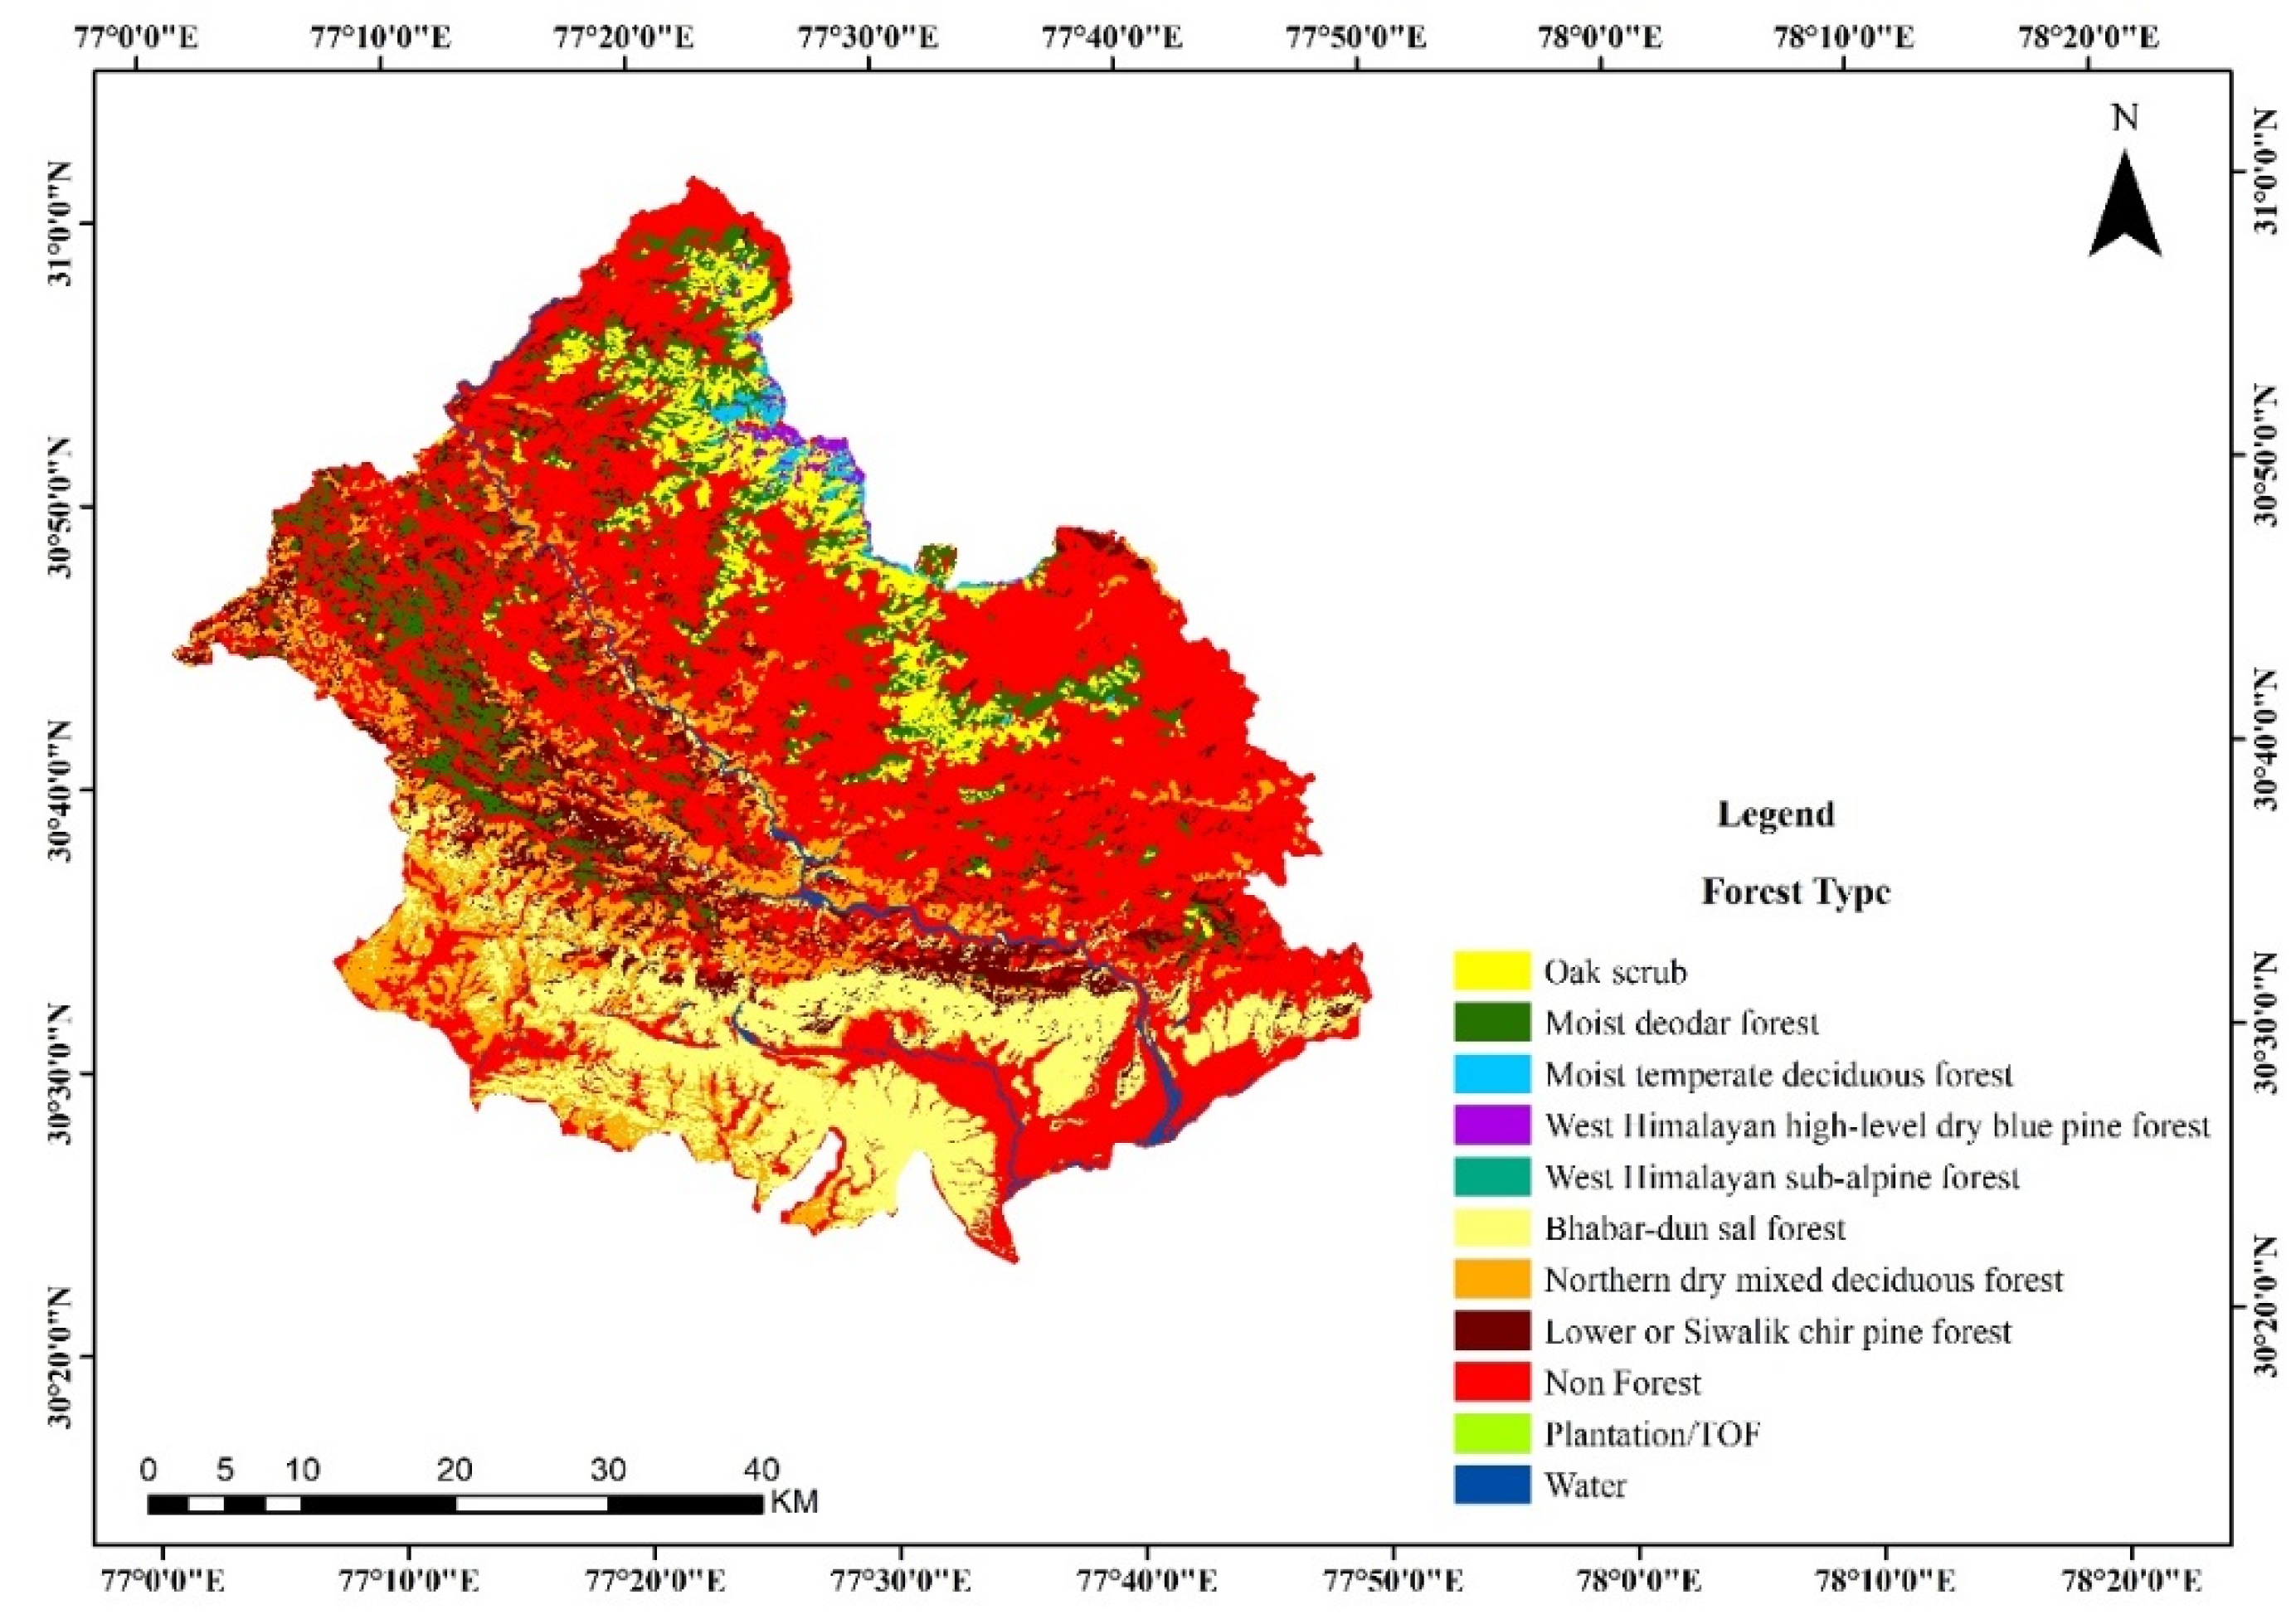
3.2.1. Forest Type
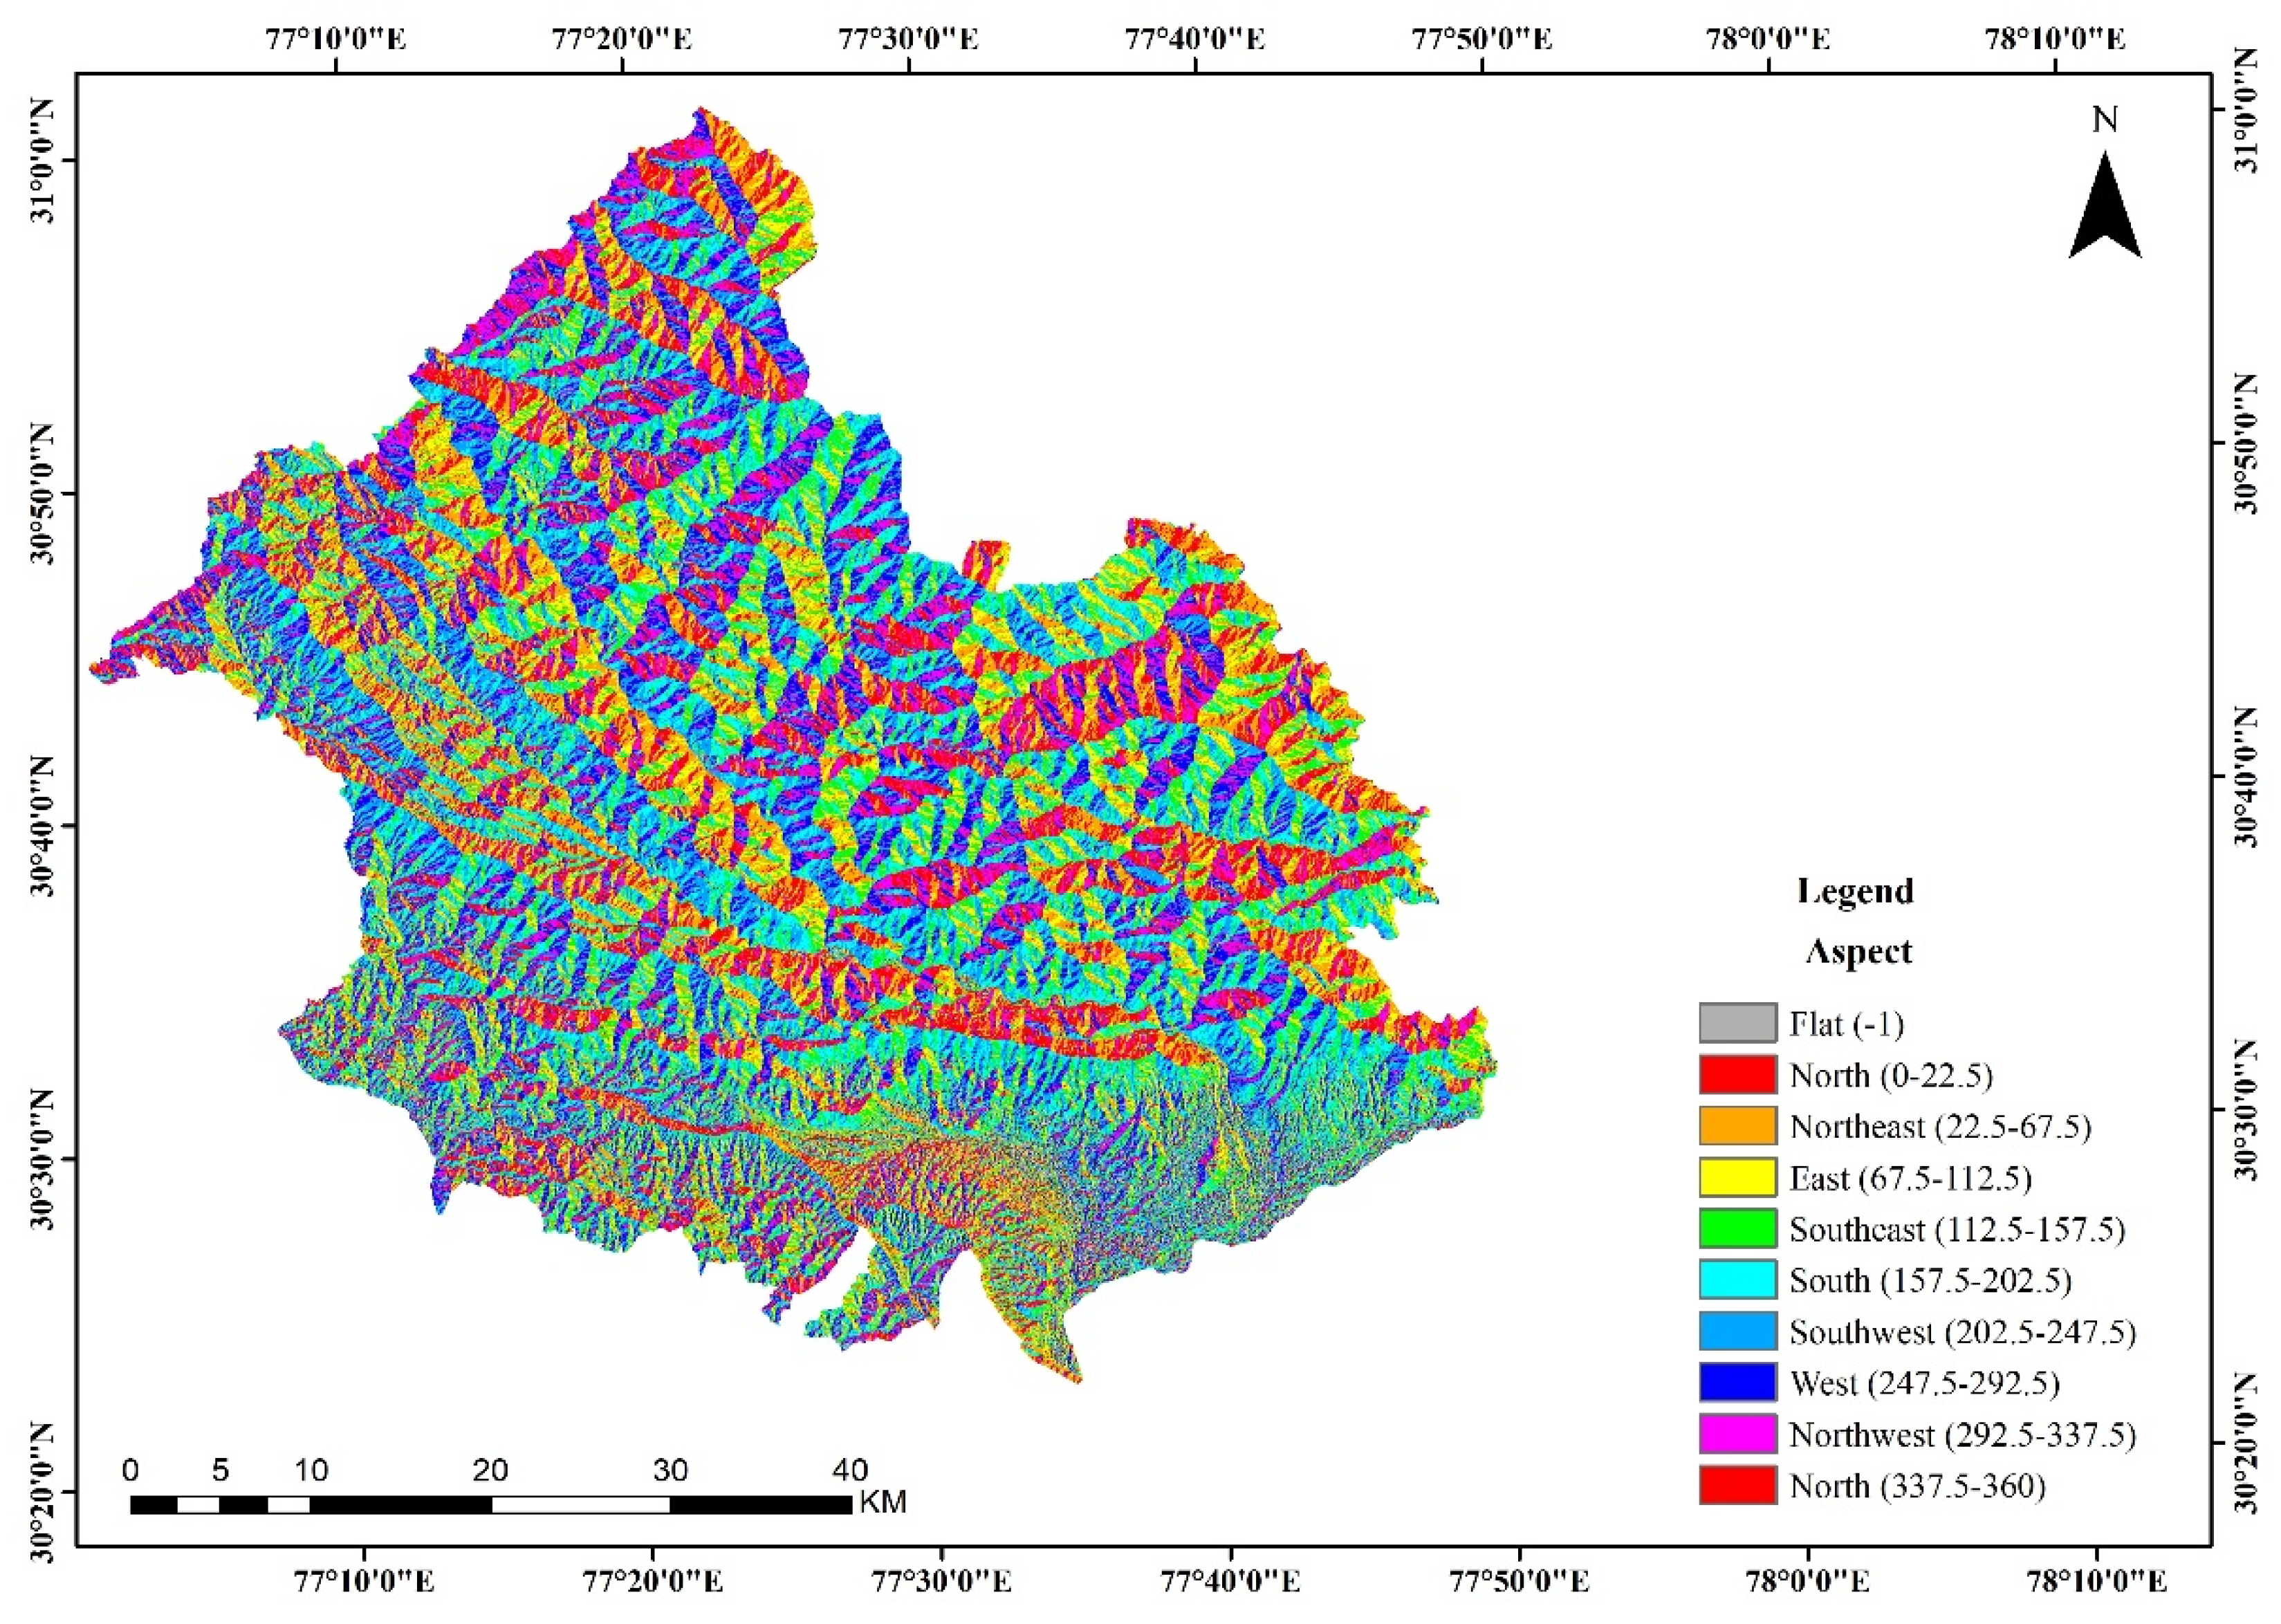
3.2.2. Aspect Index Map
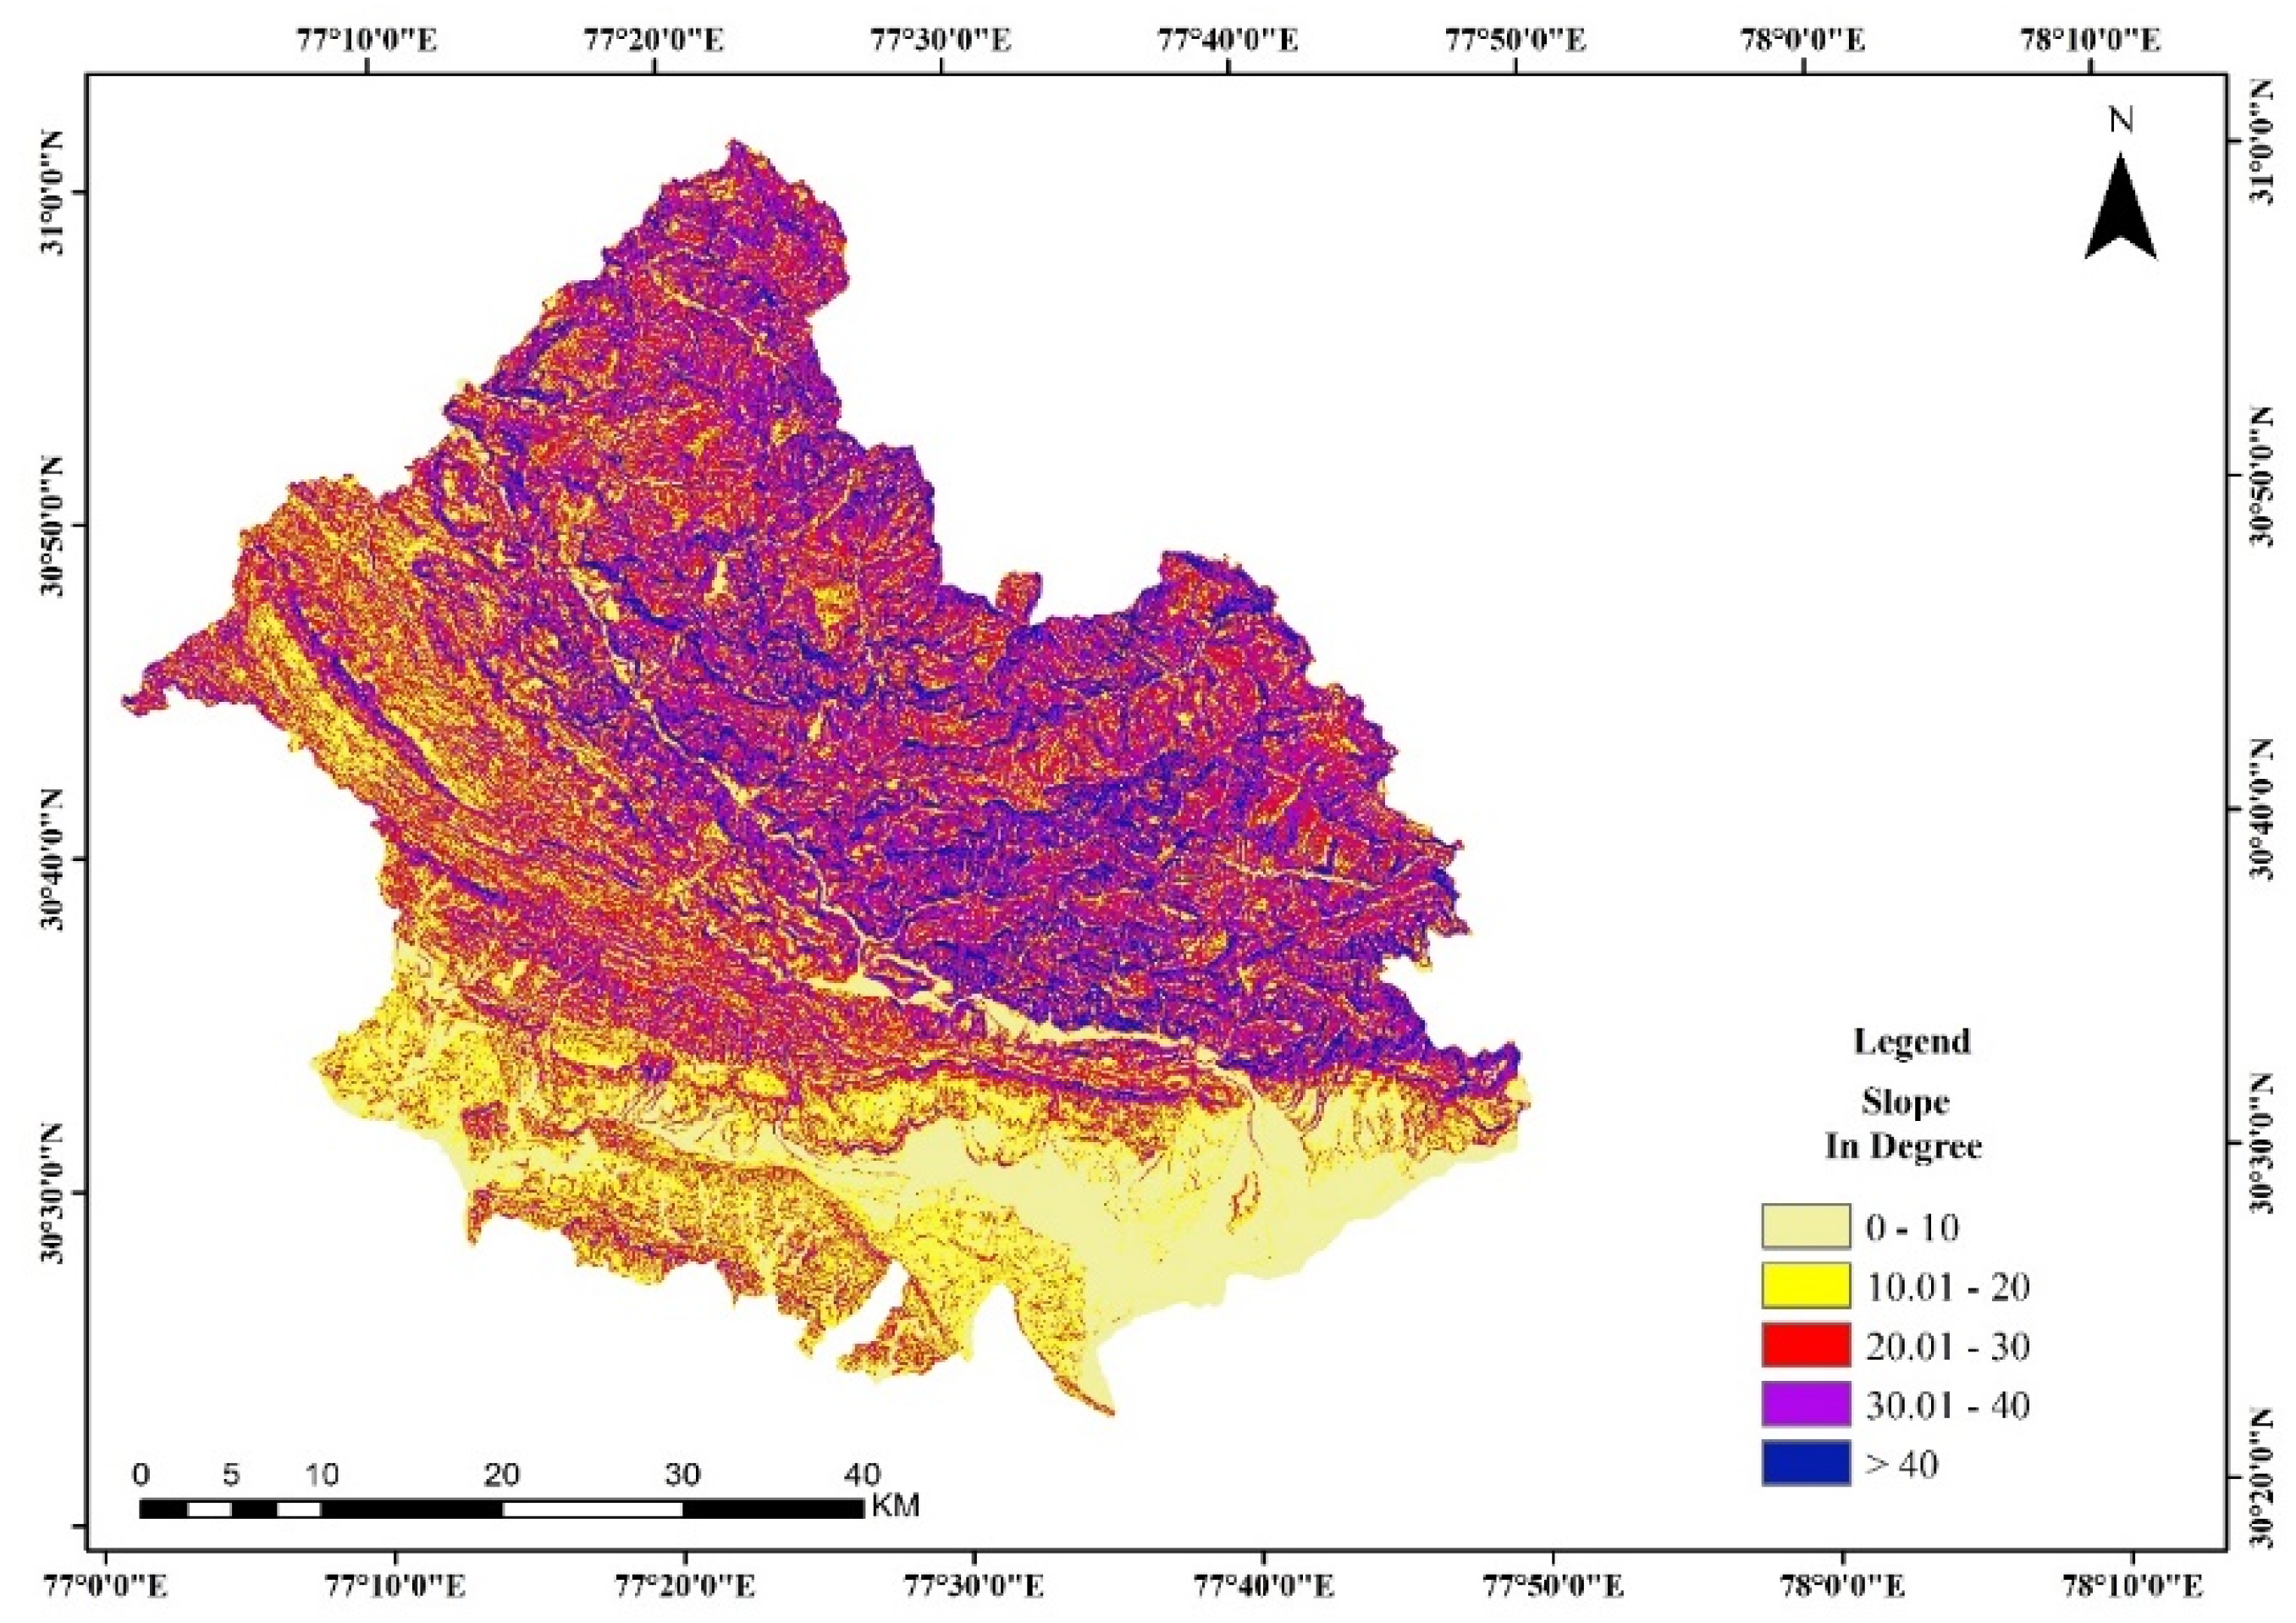
3.2.3. Slope Index Map
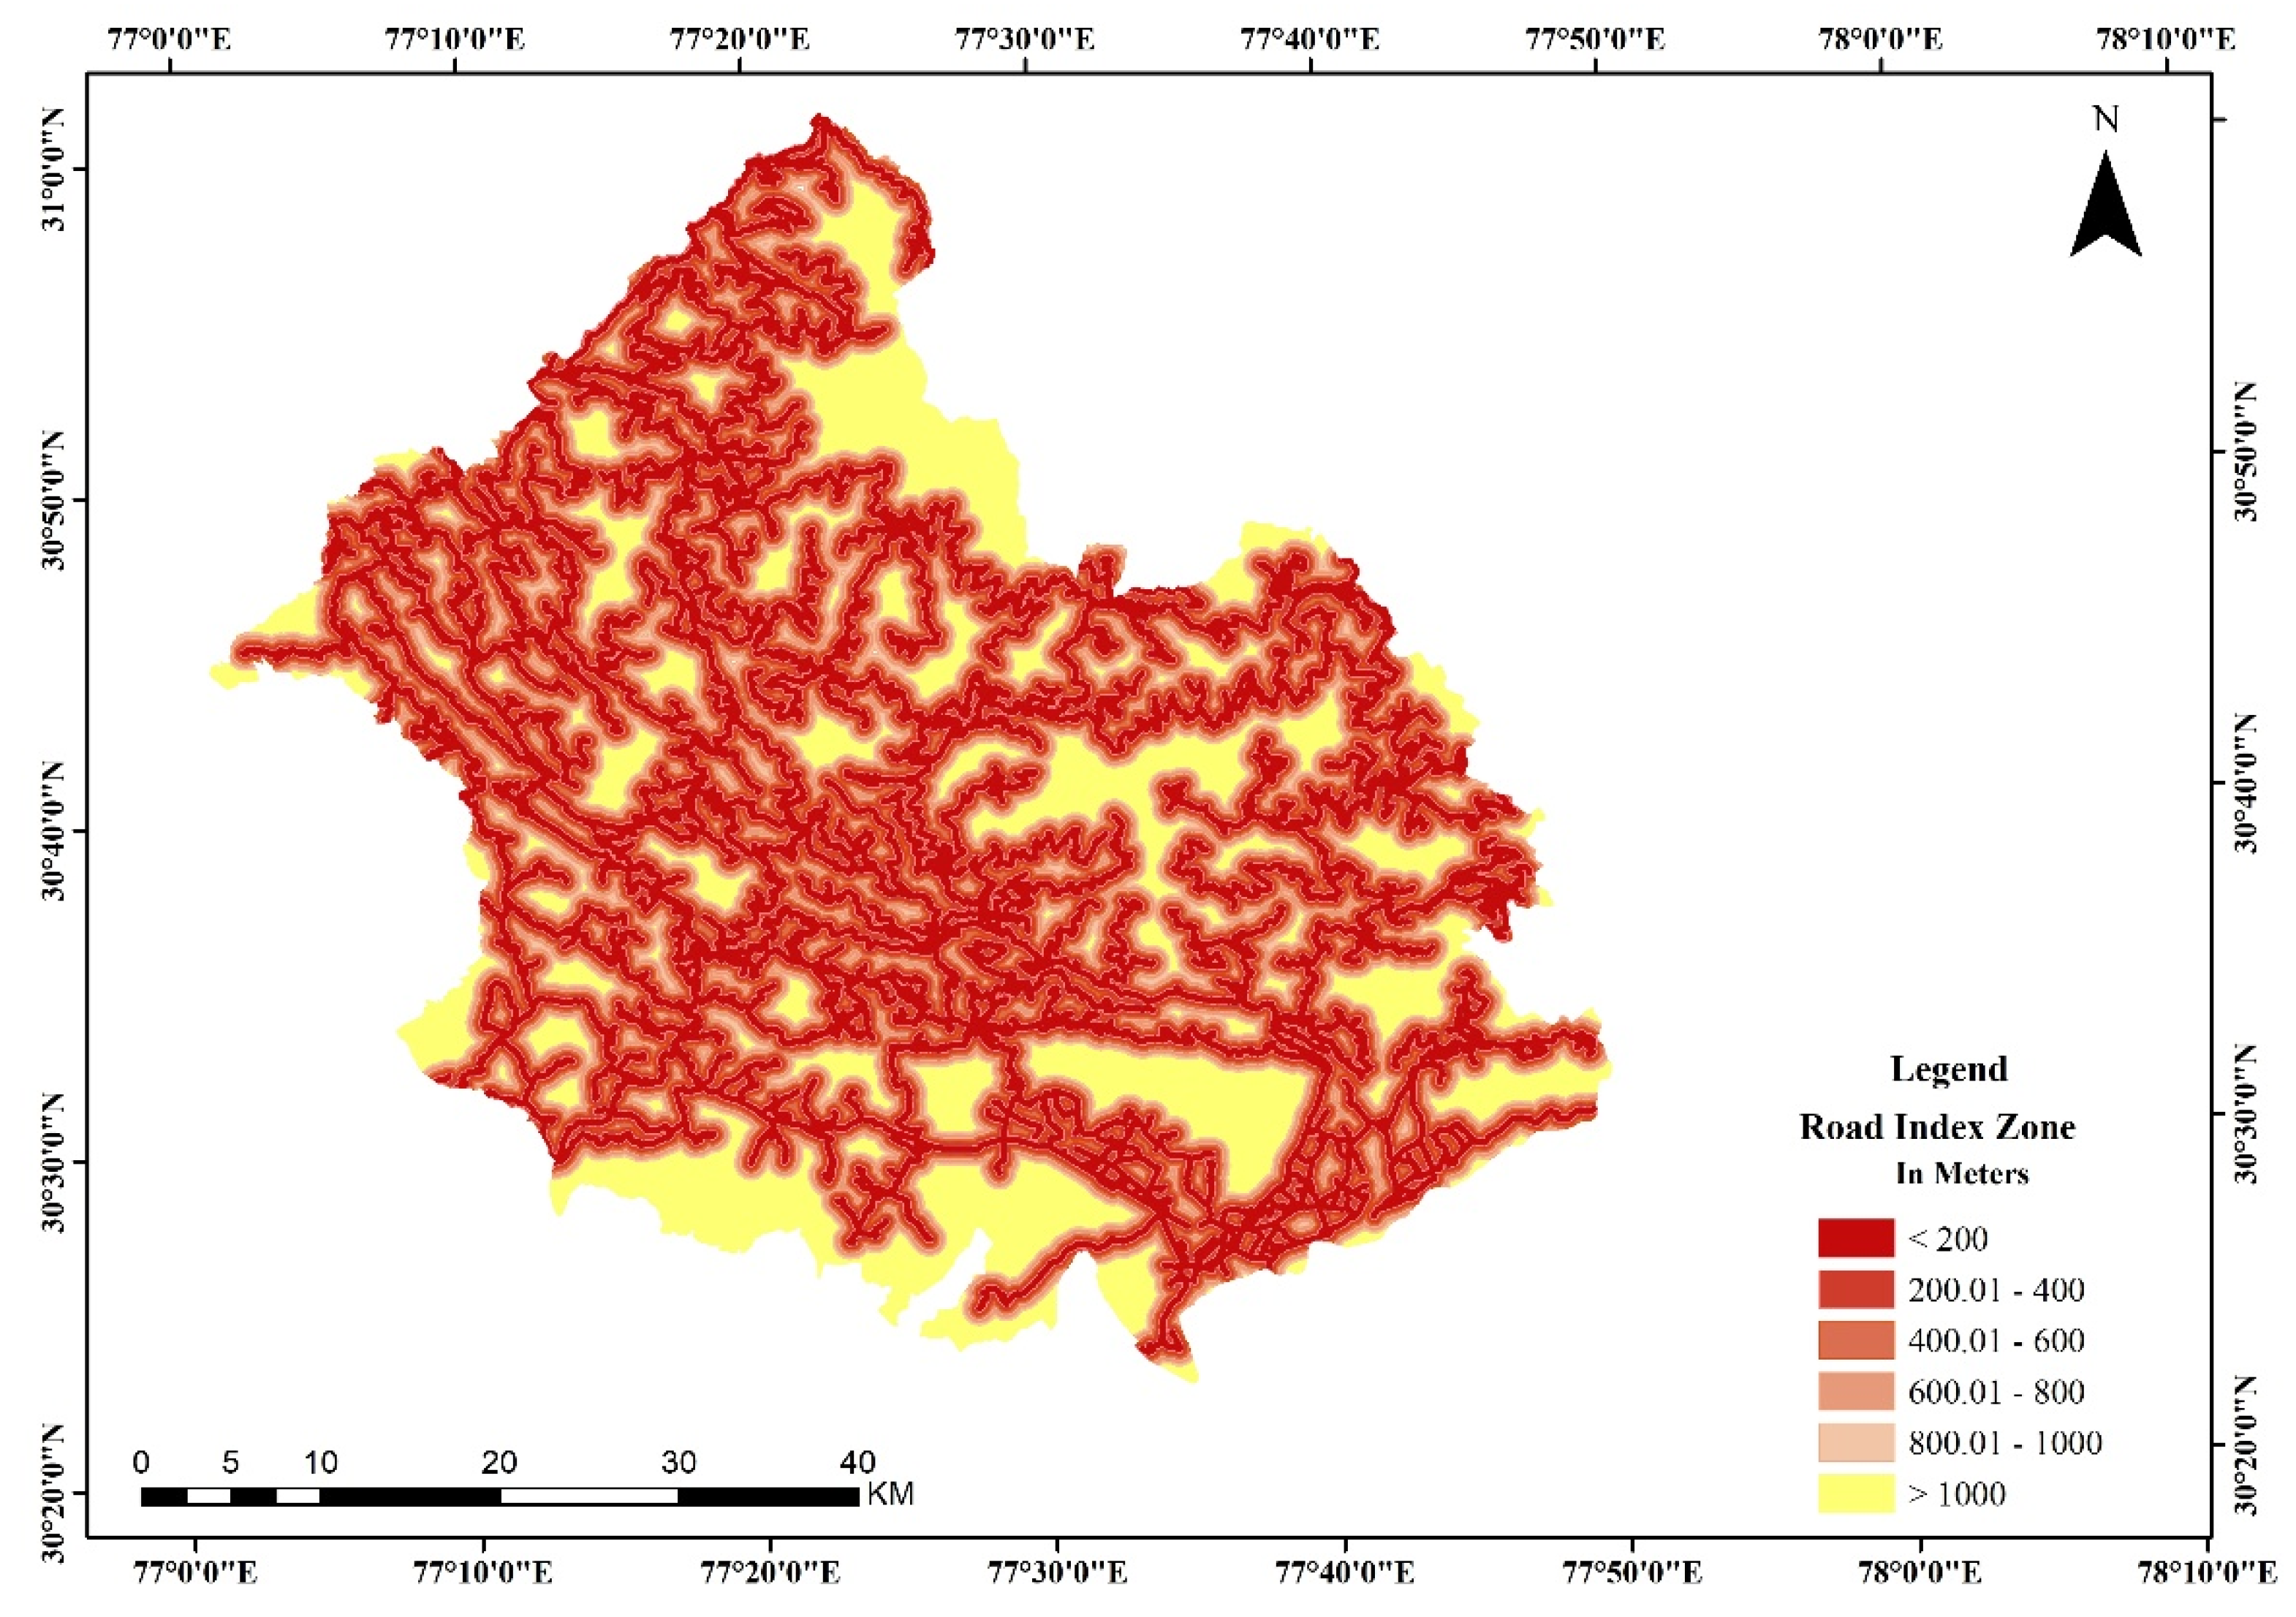
3.2.4. Road Buffer Index Map
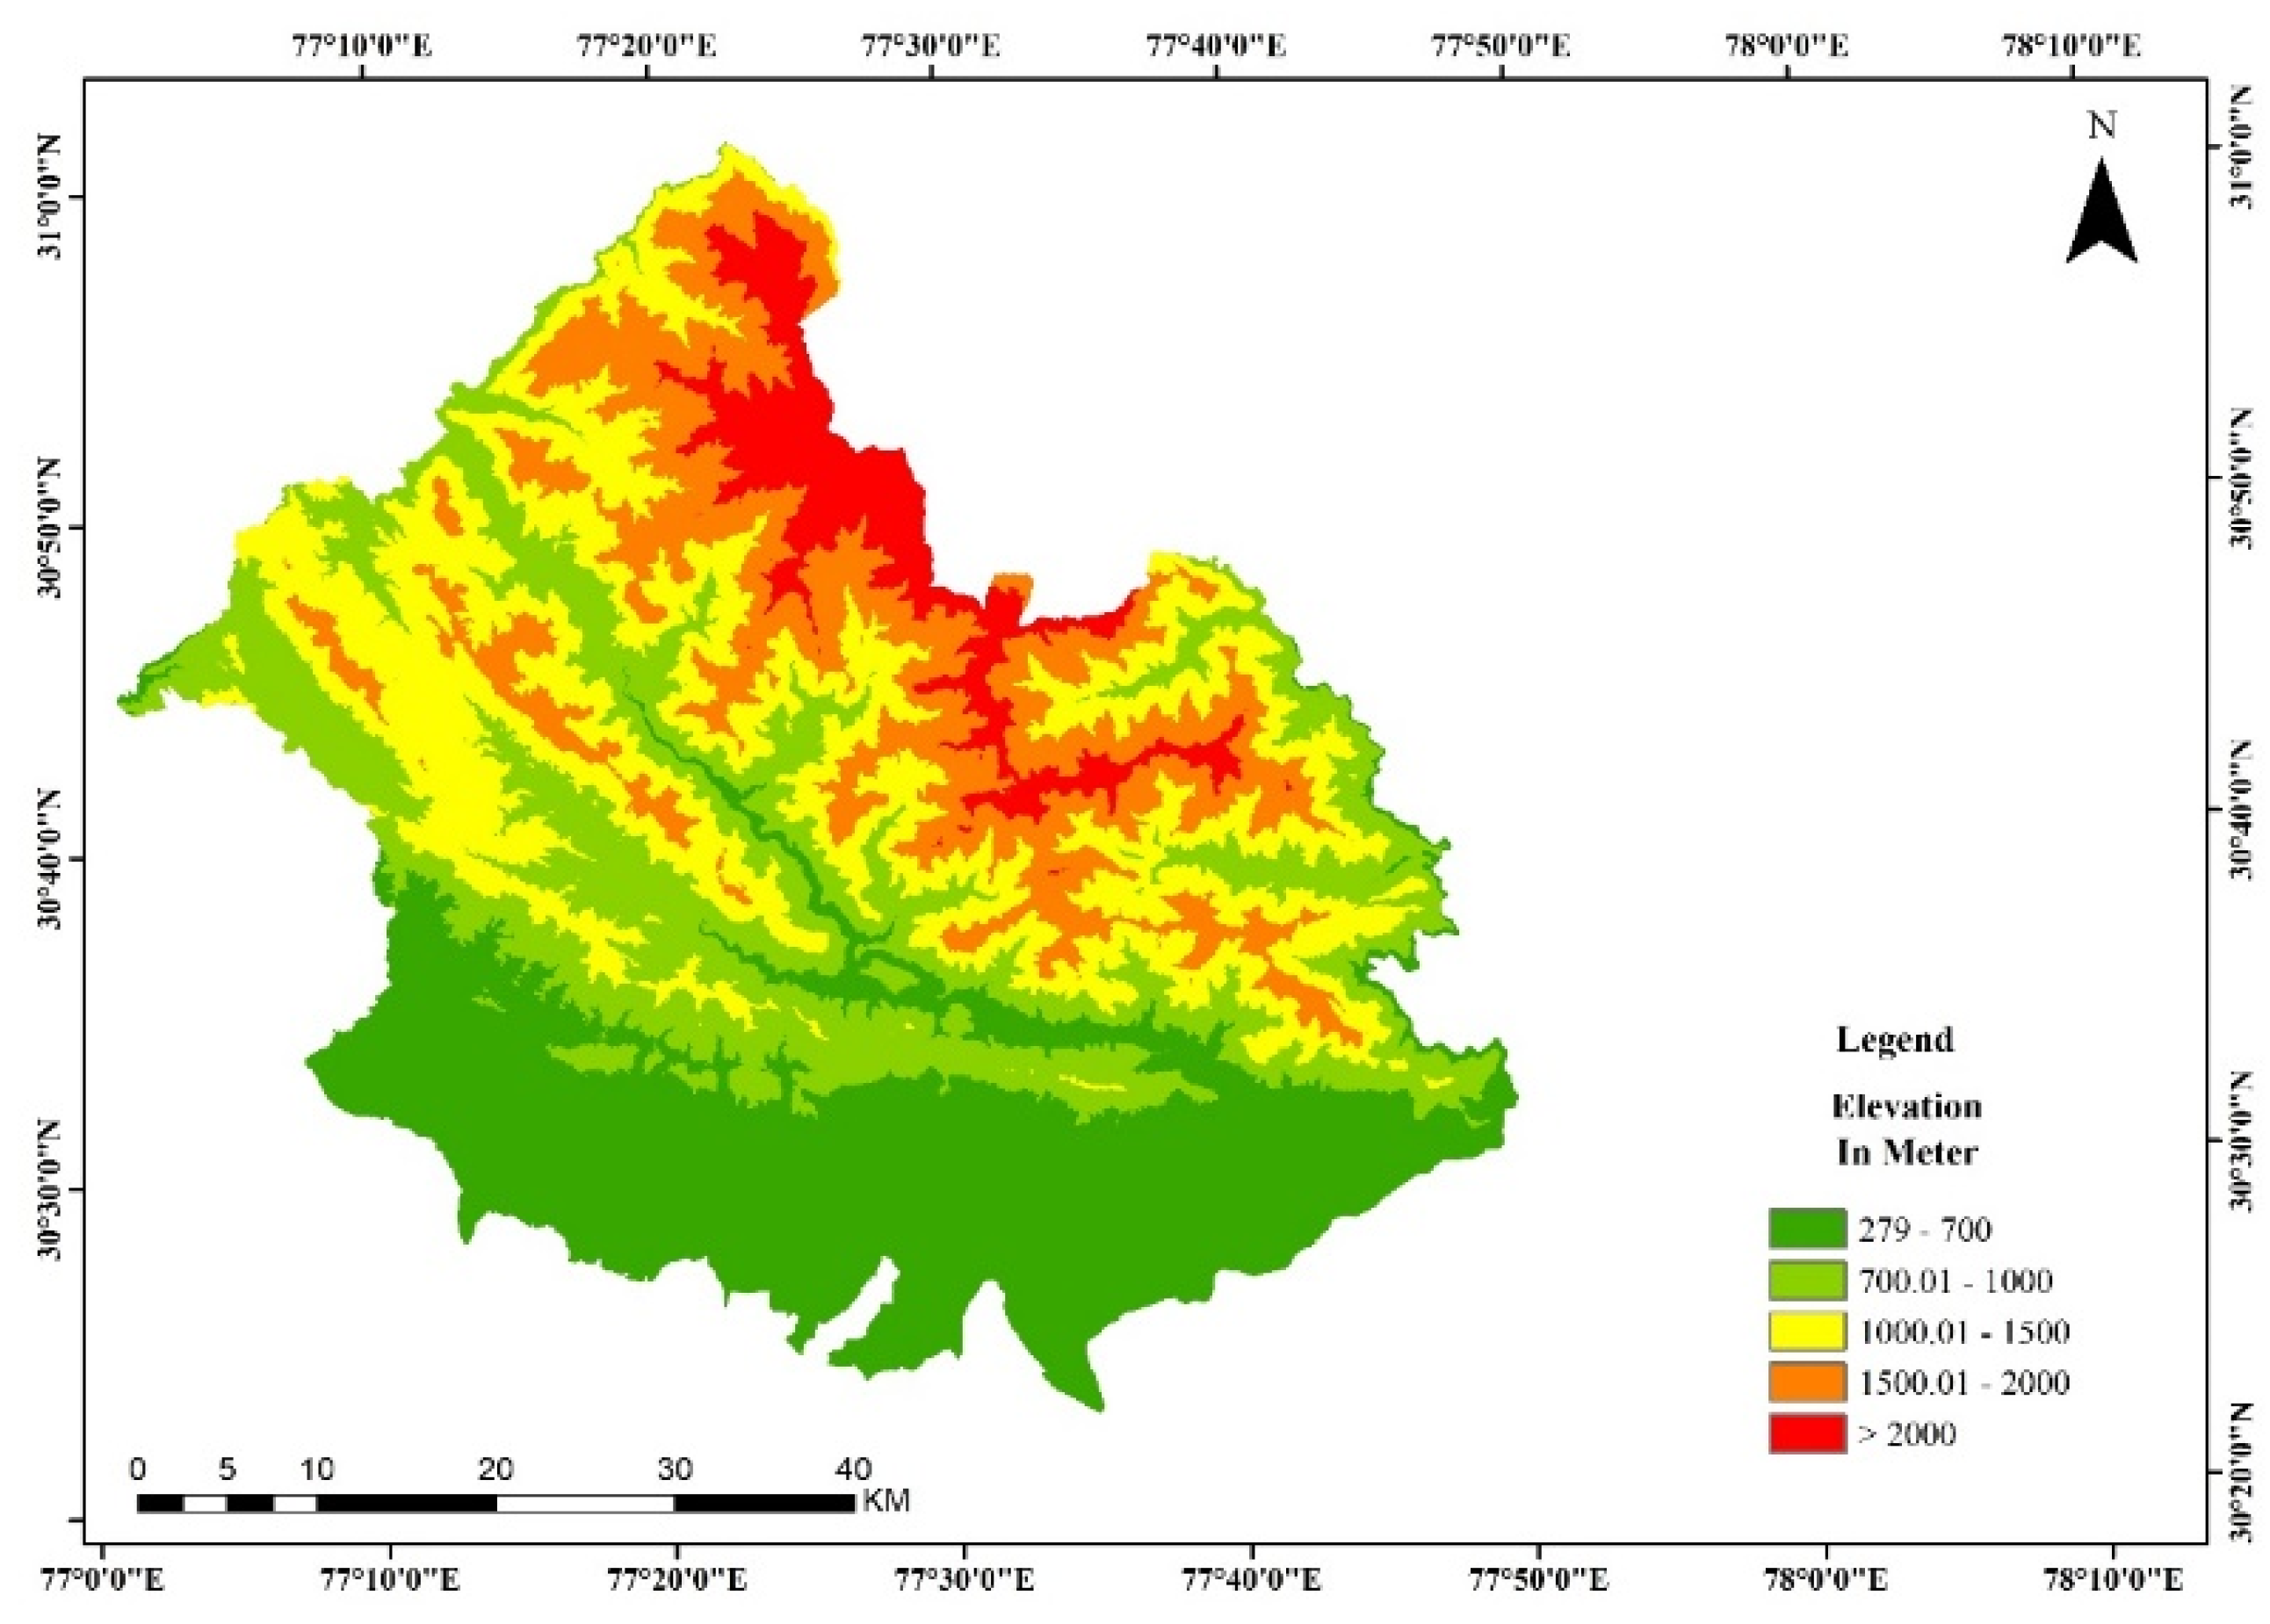
3.2.5. Elevation Index Map
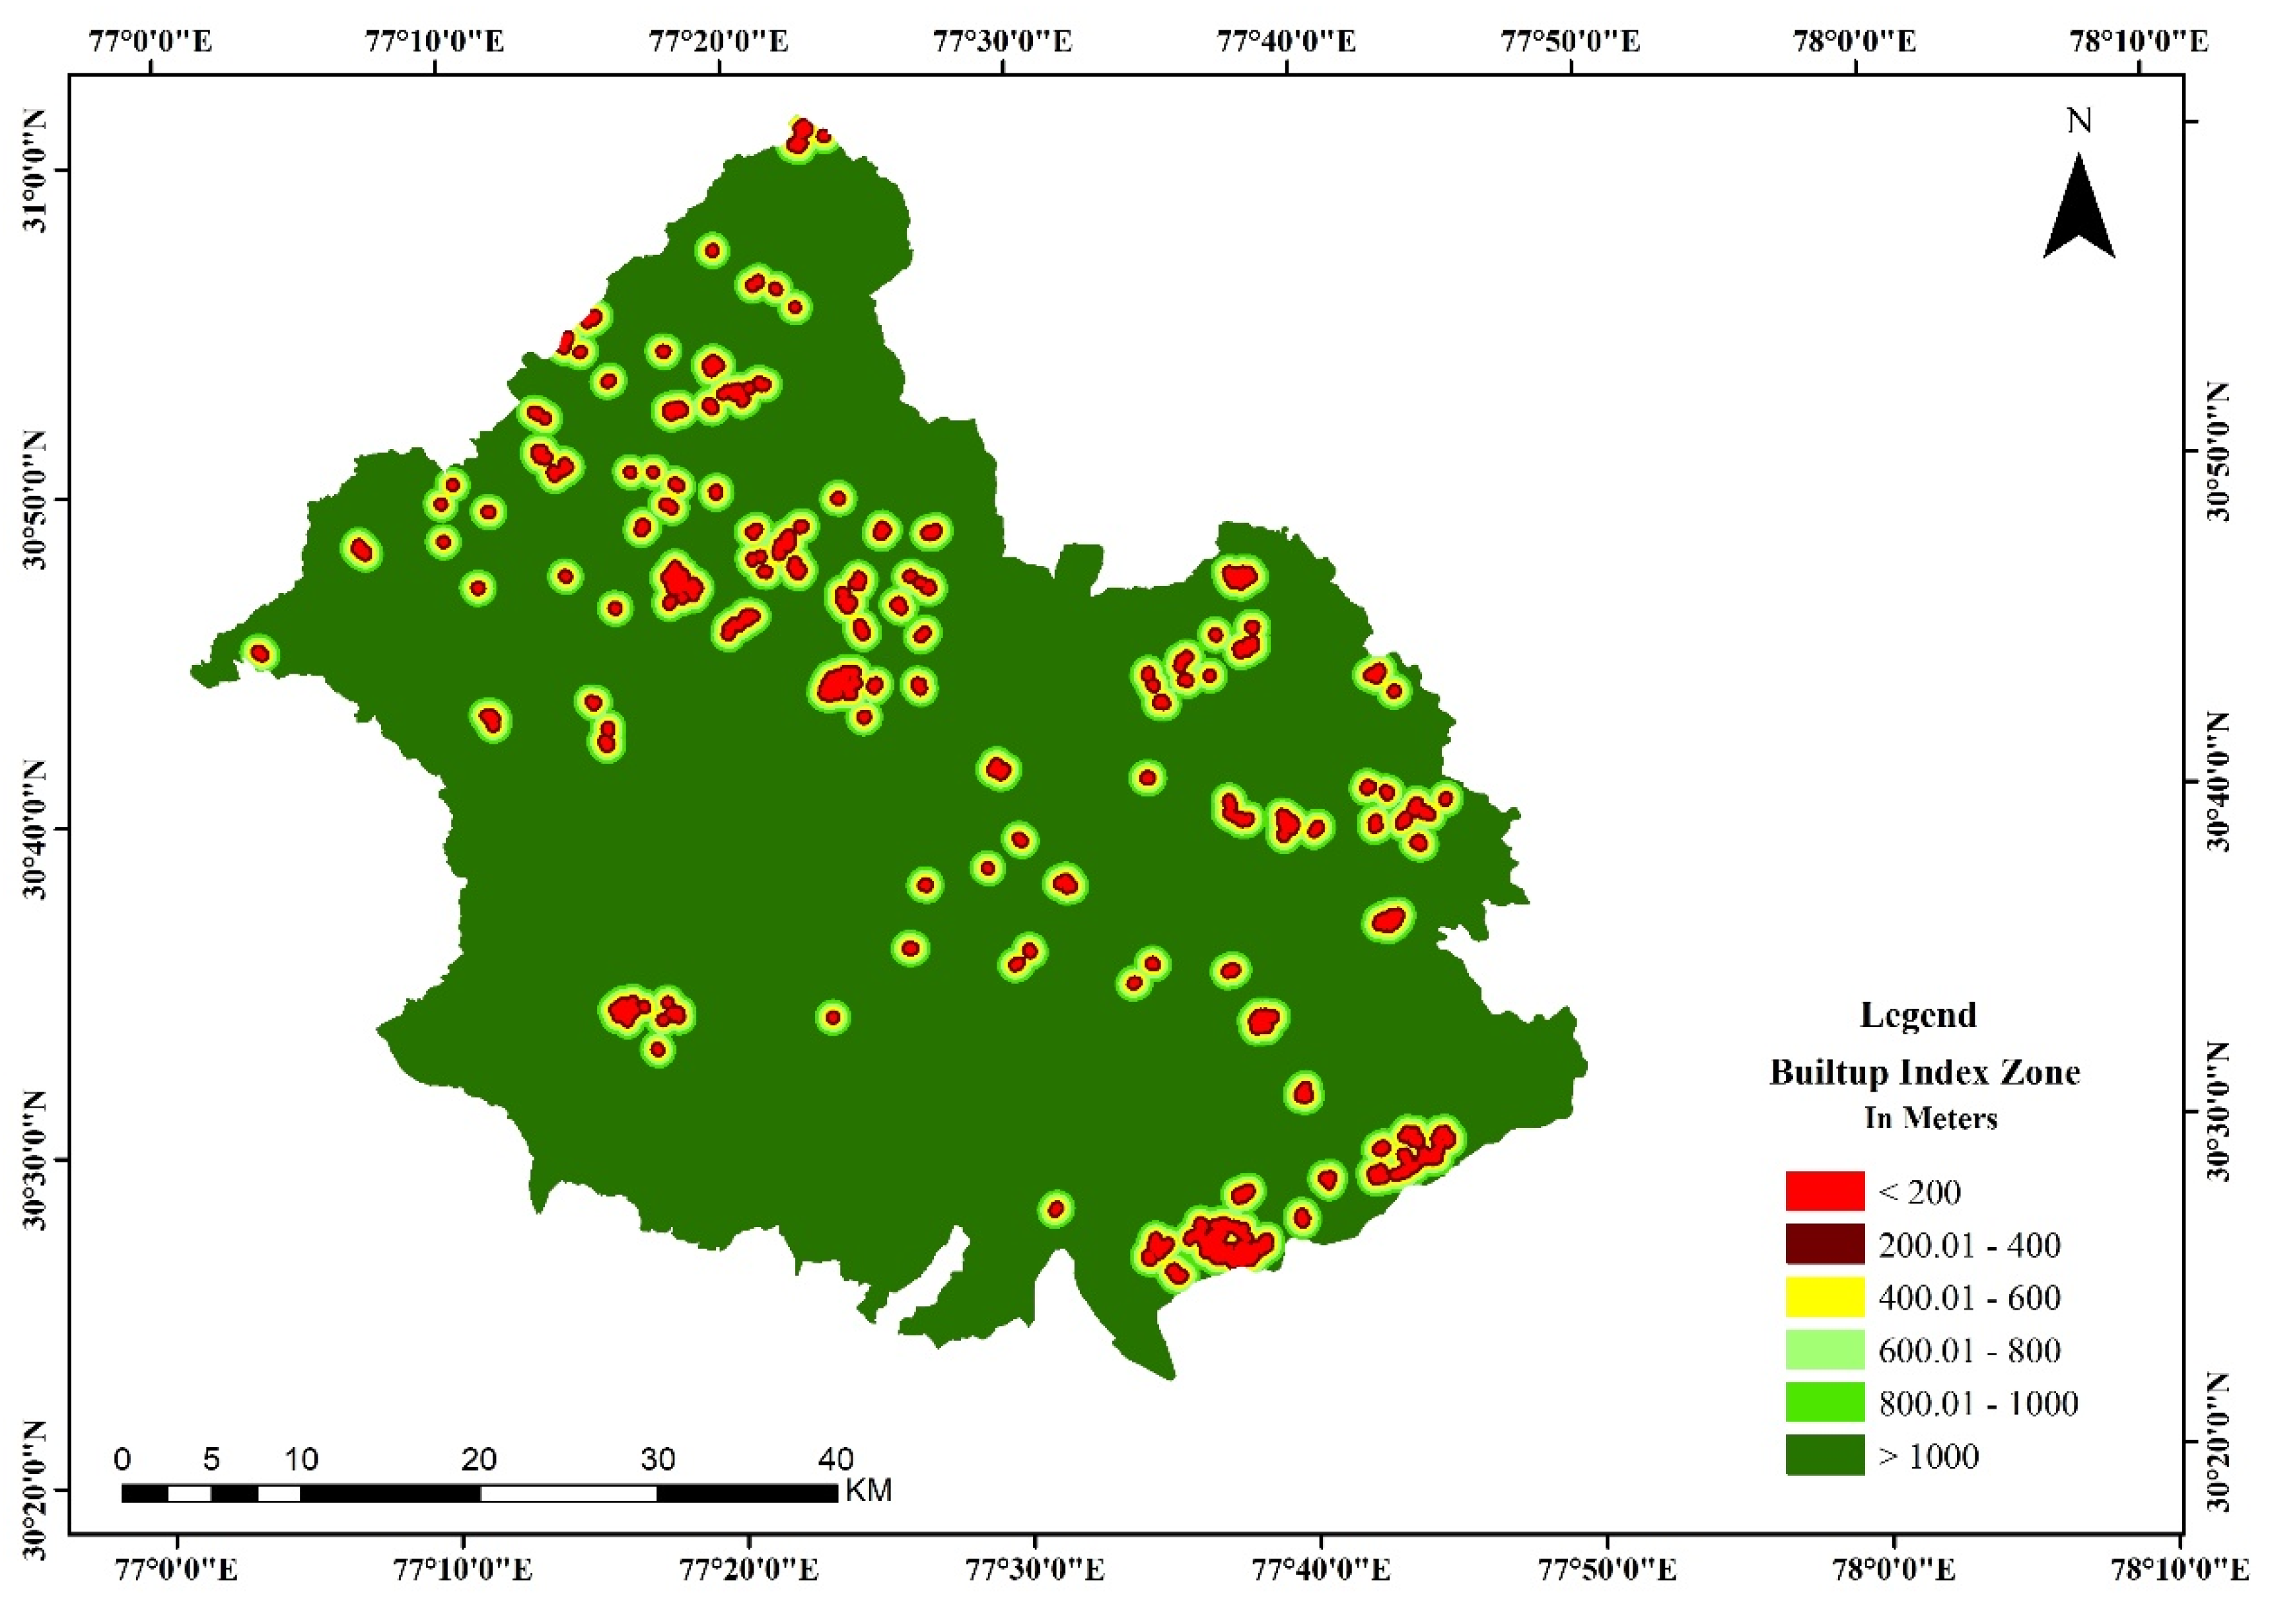
3.2.6. Built Up Buffer Index Map
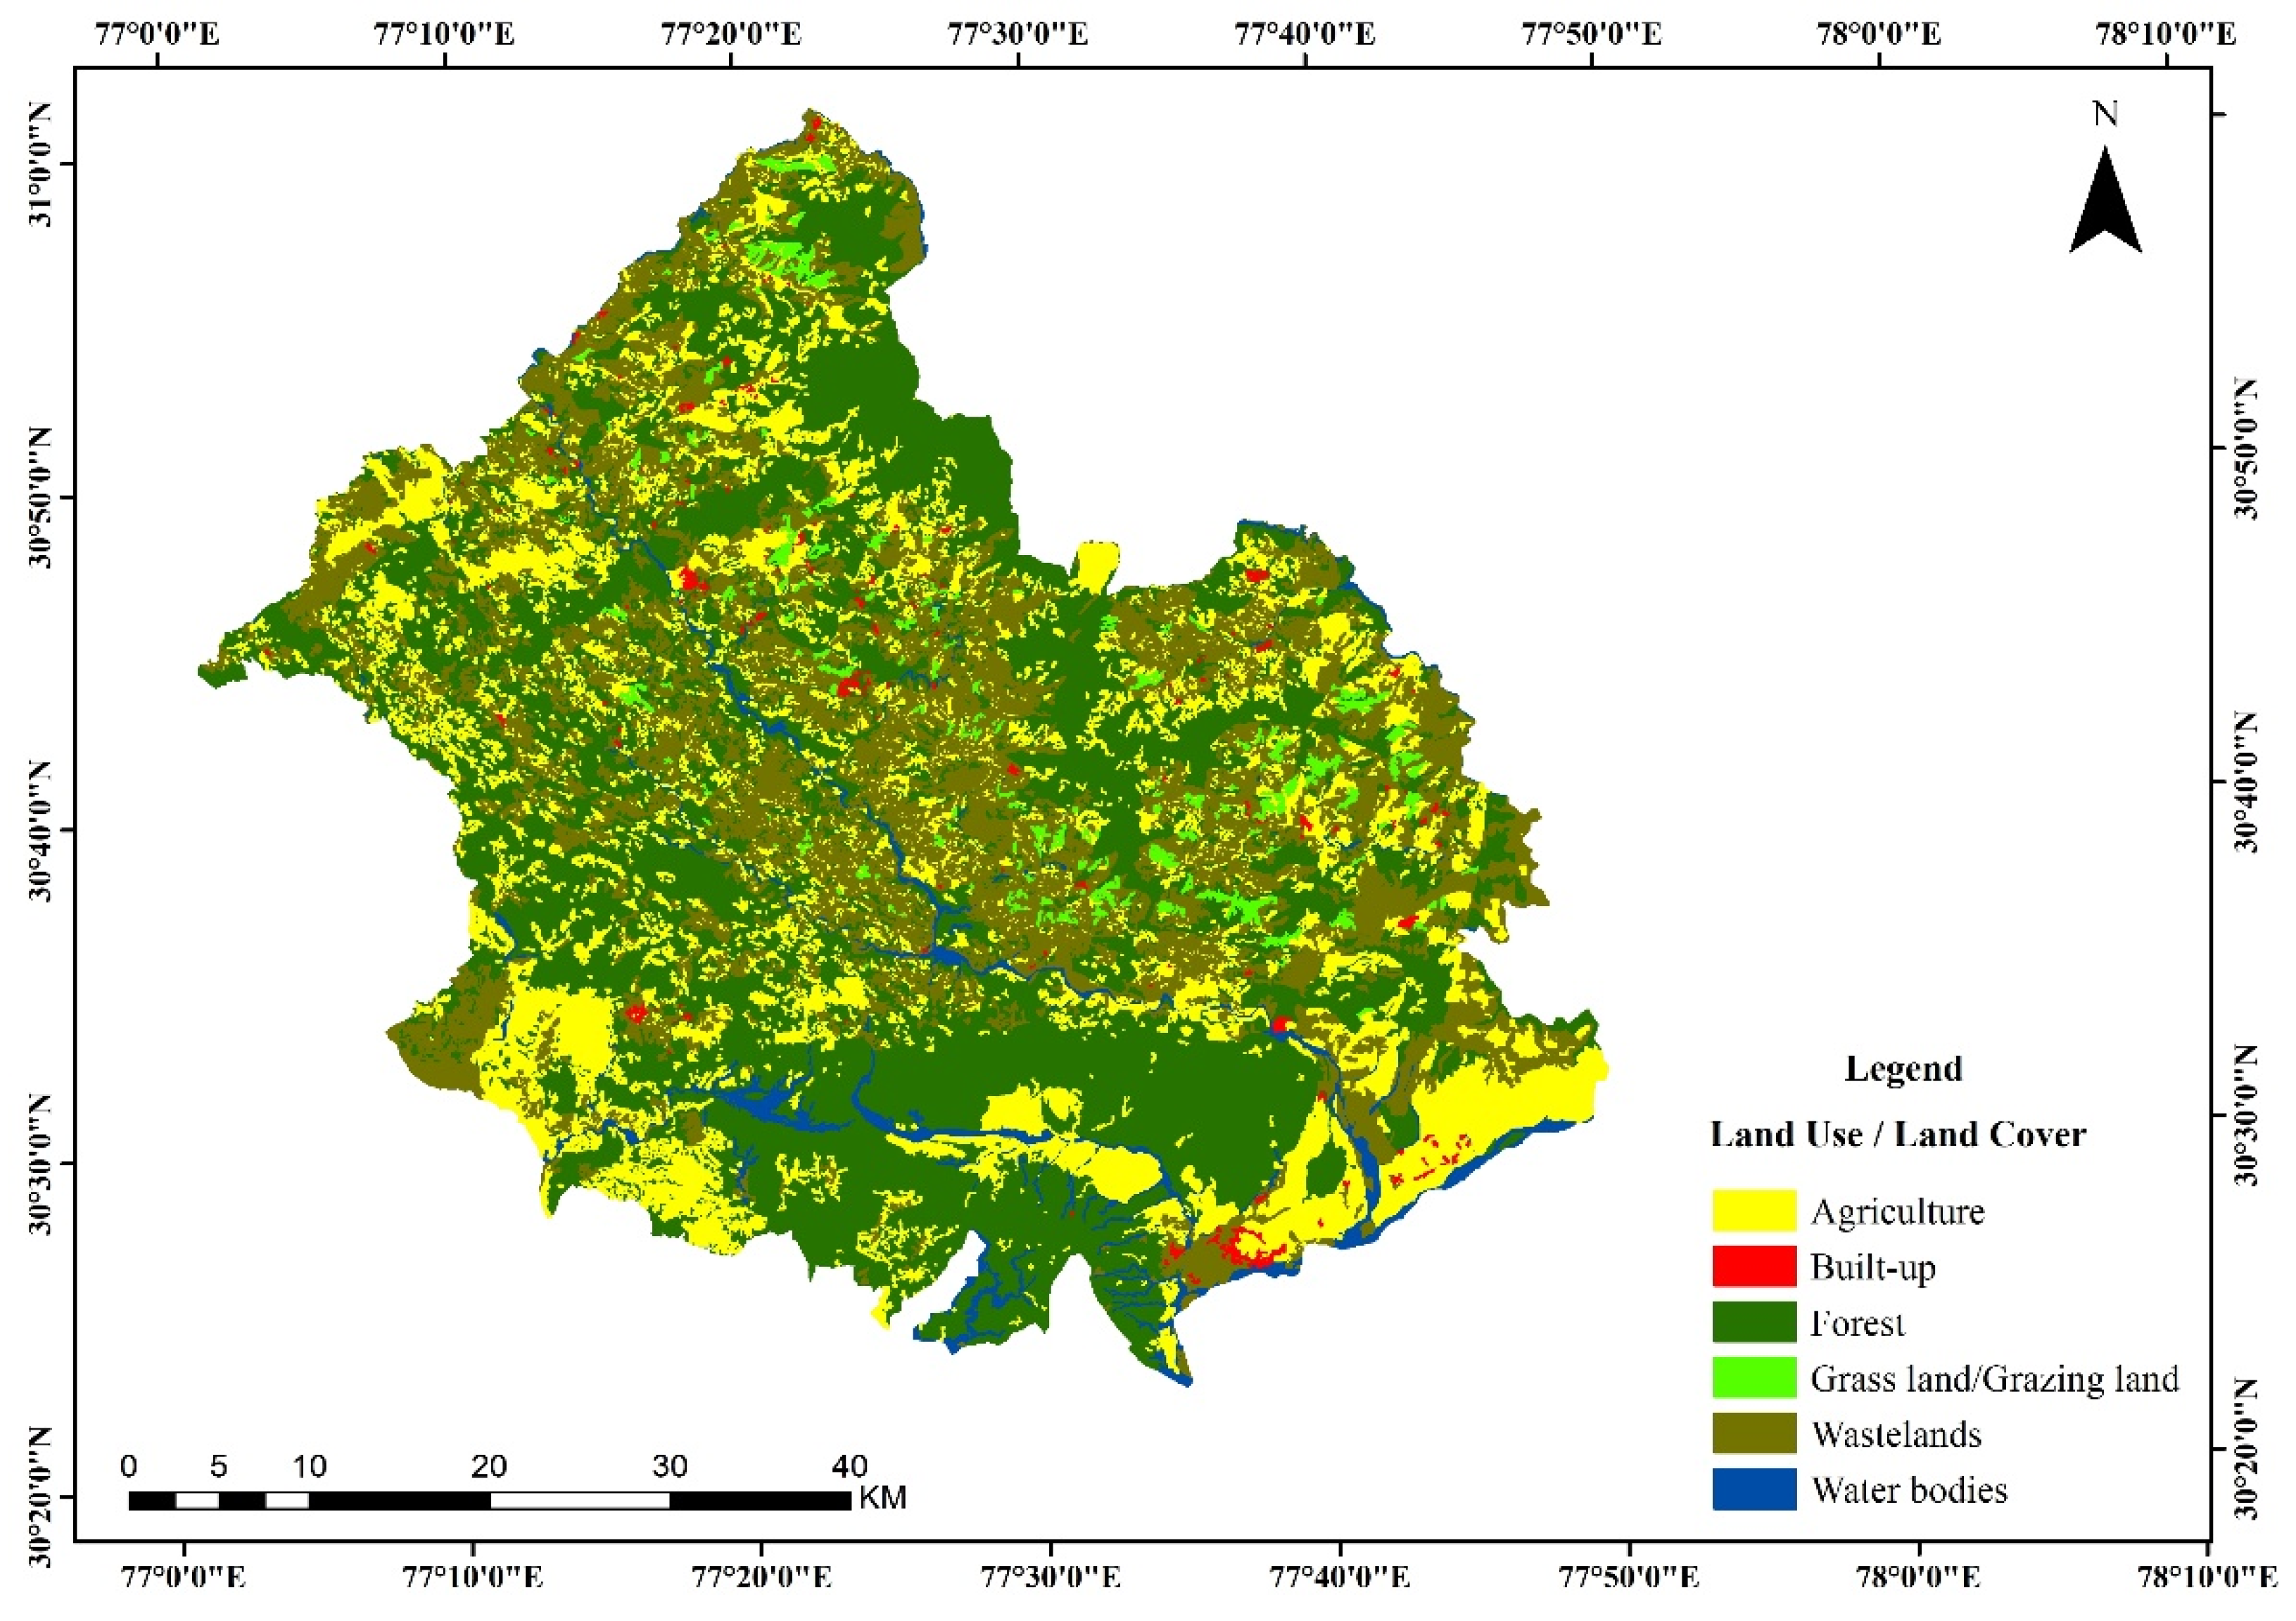
3.2.7. Land Use and Land Cover
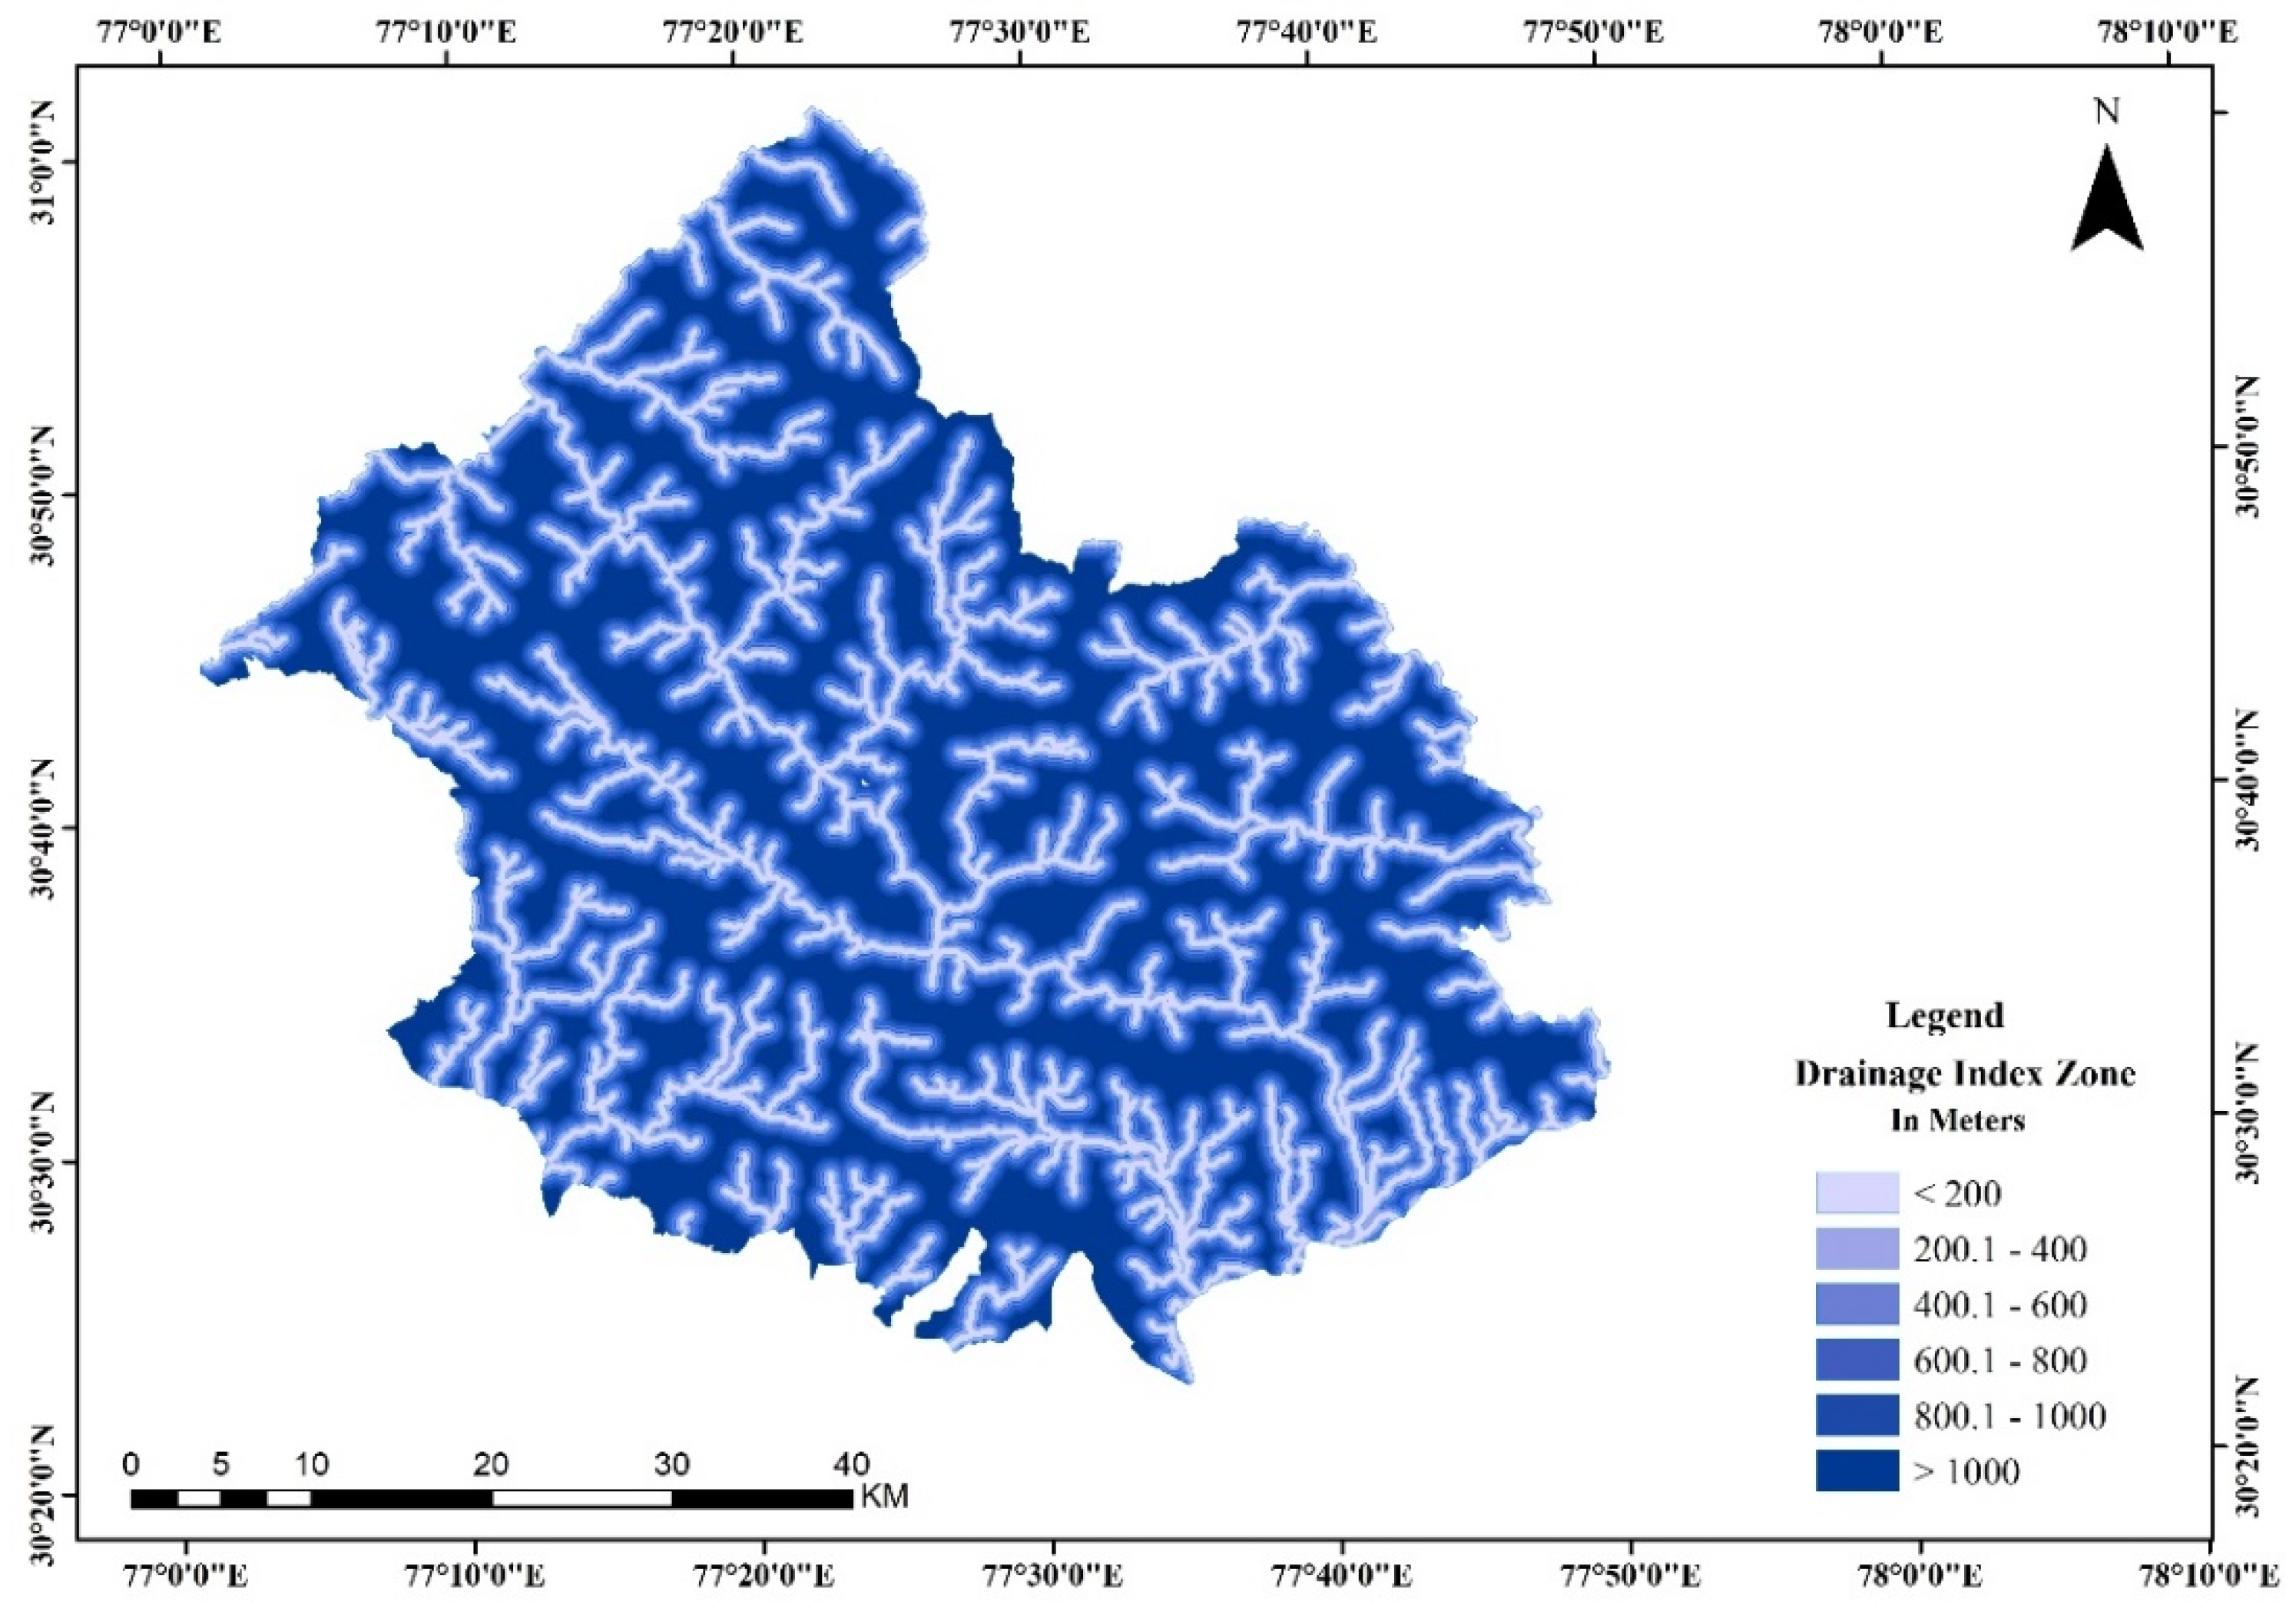
3.2.8. Drainage Buffer Index Map
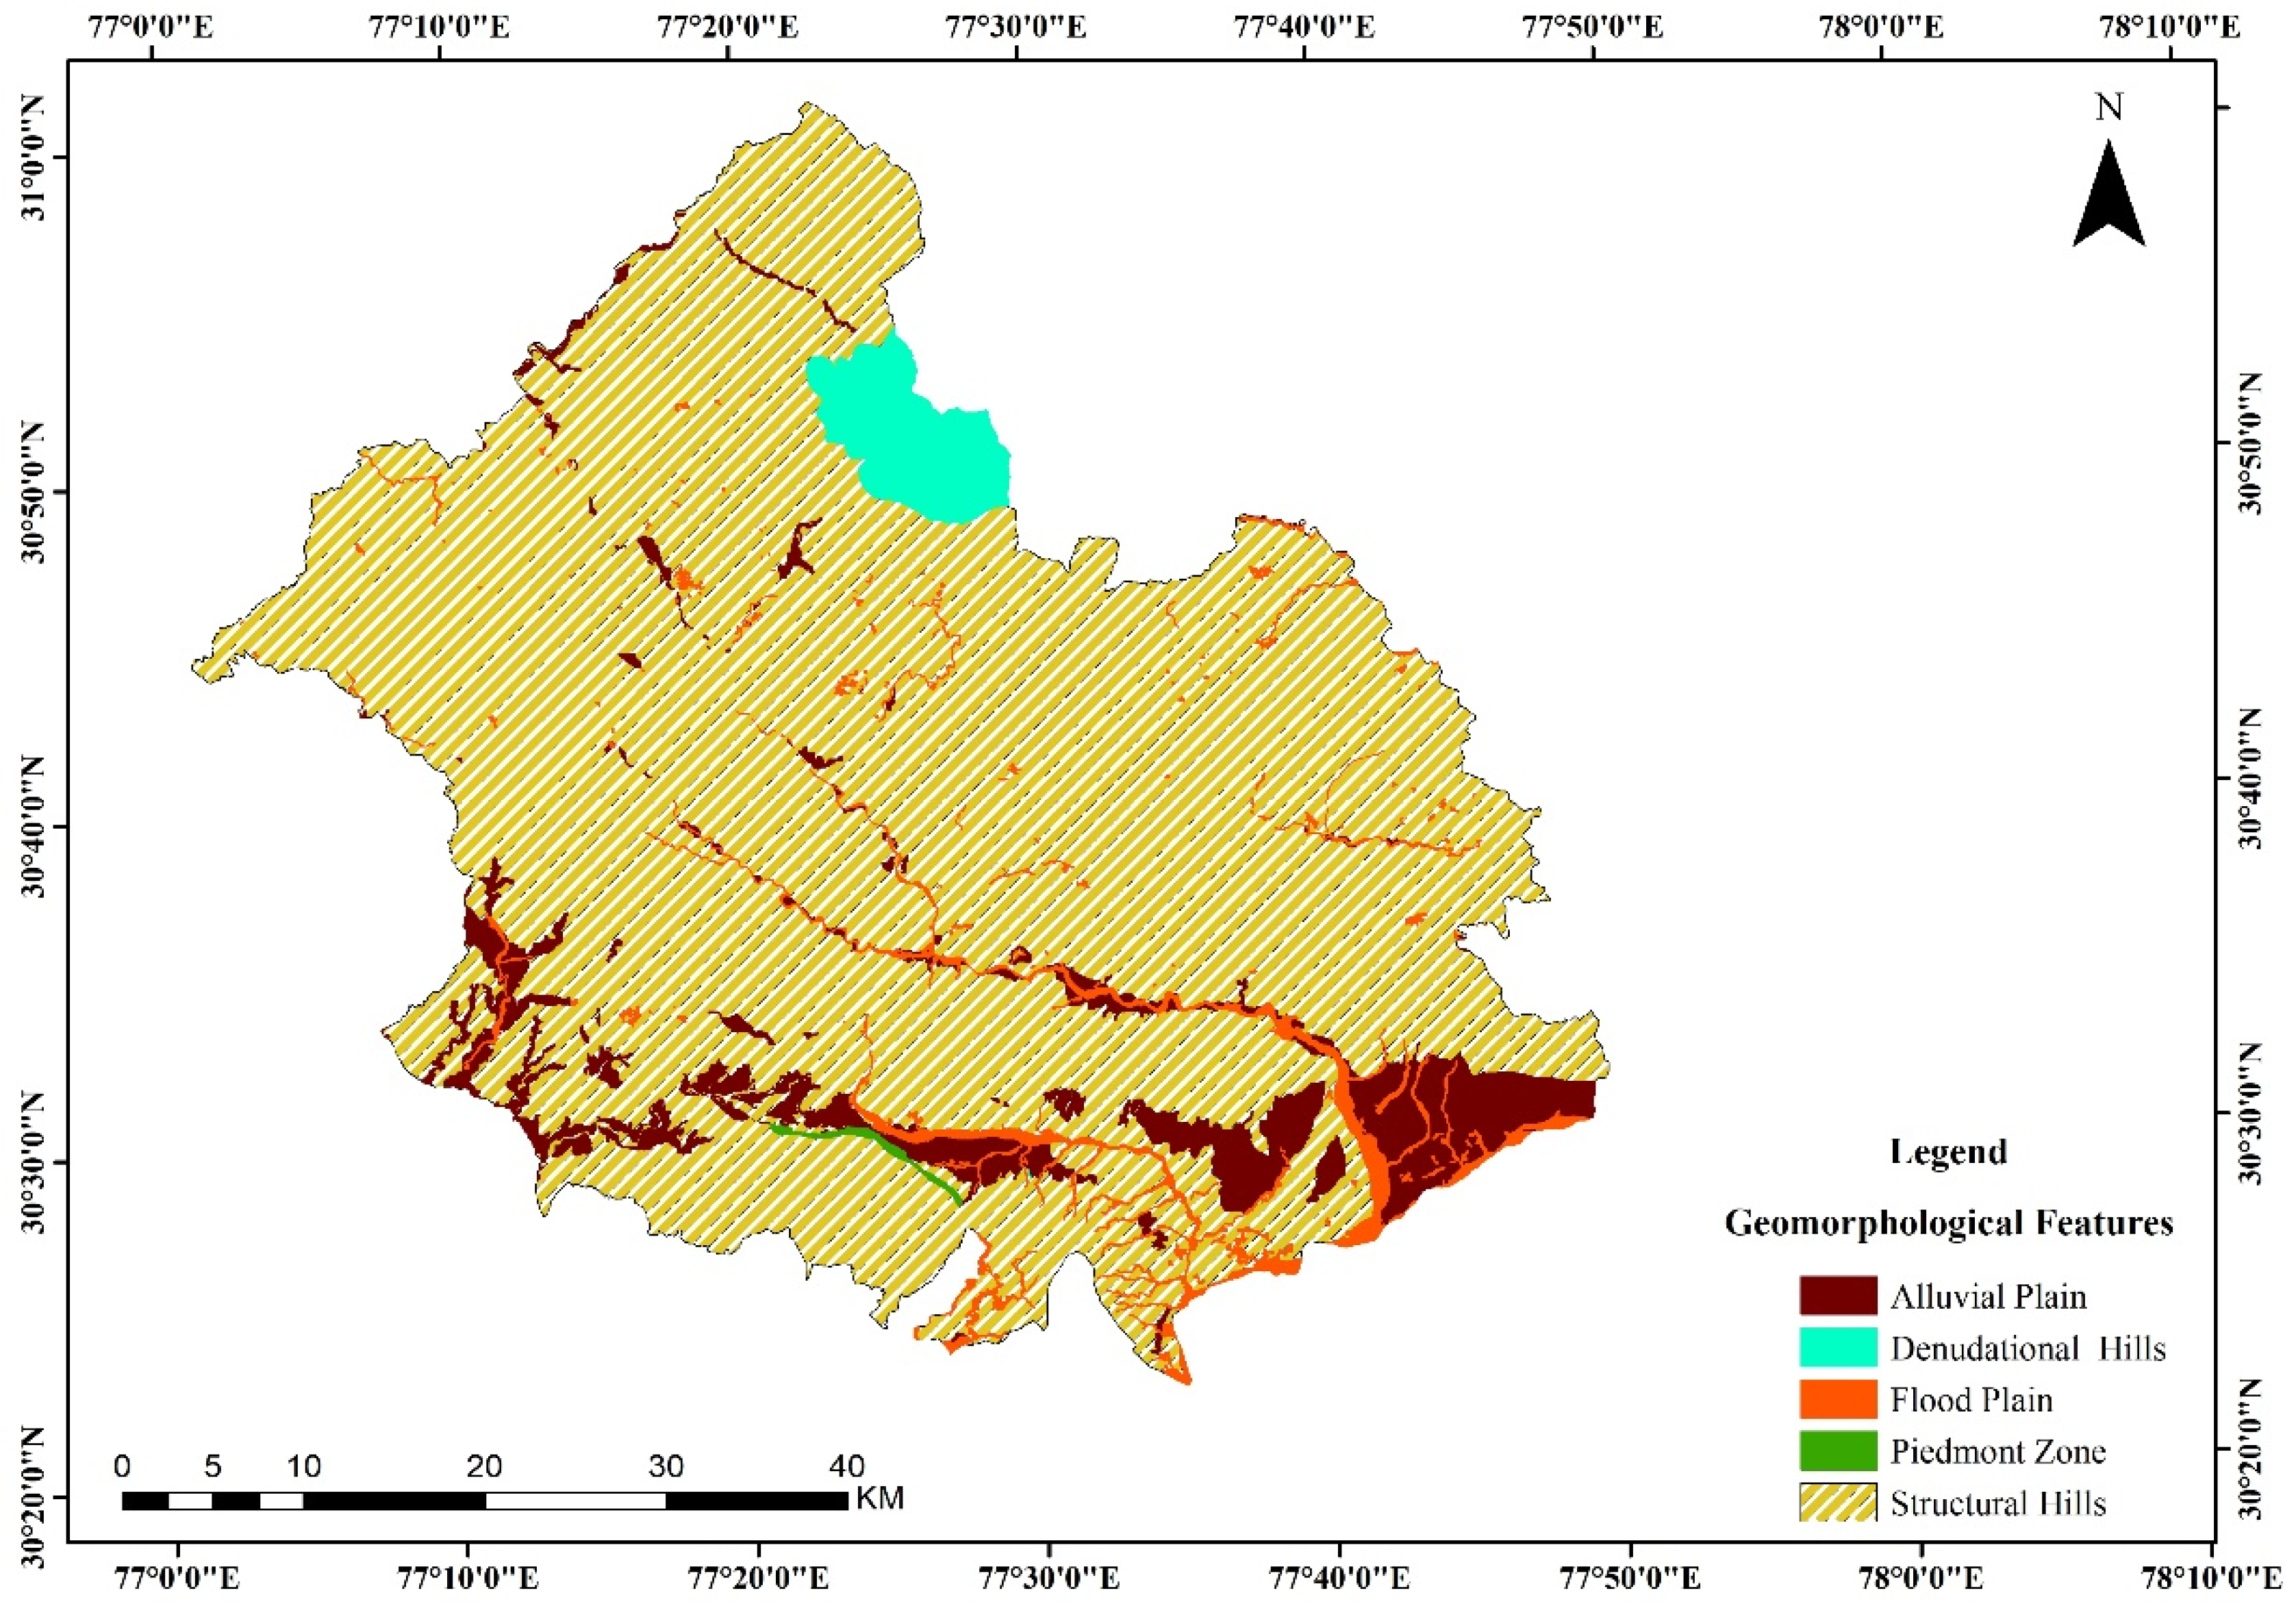
3.2.9. Geomorphology
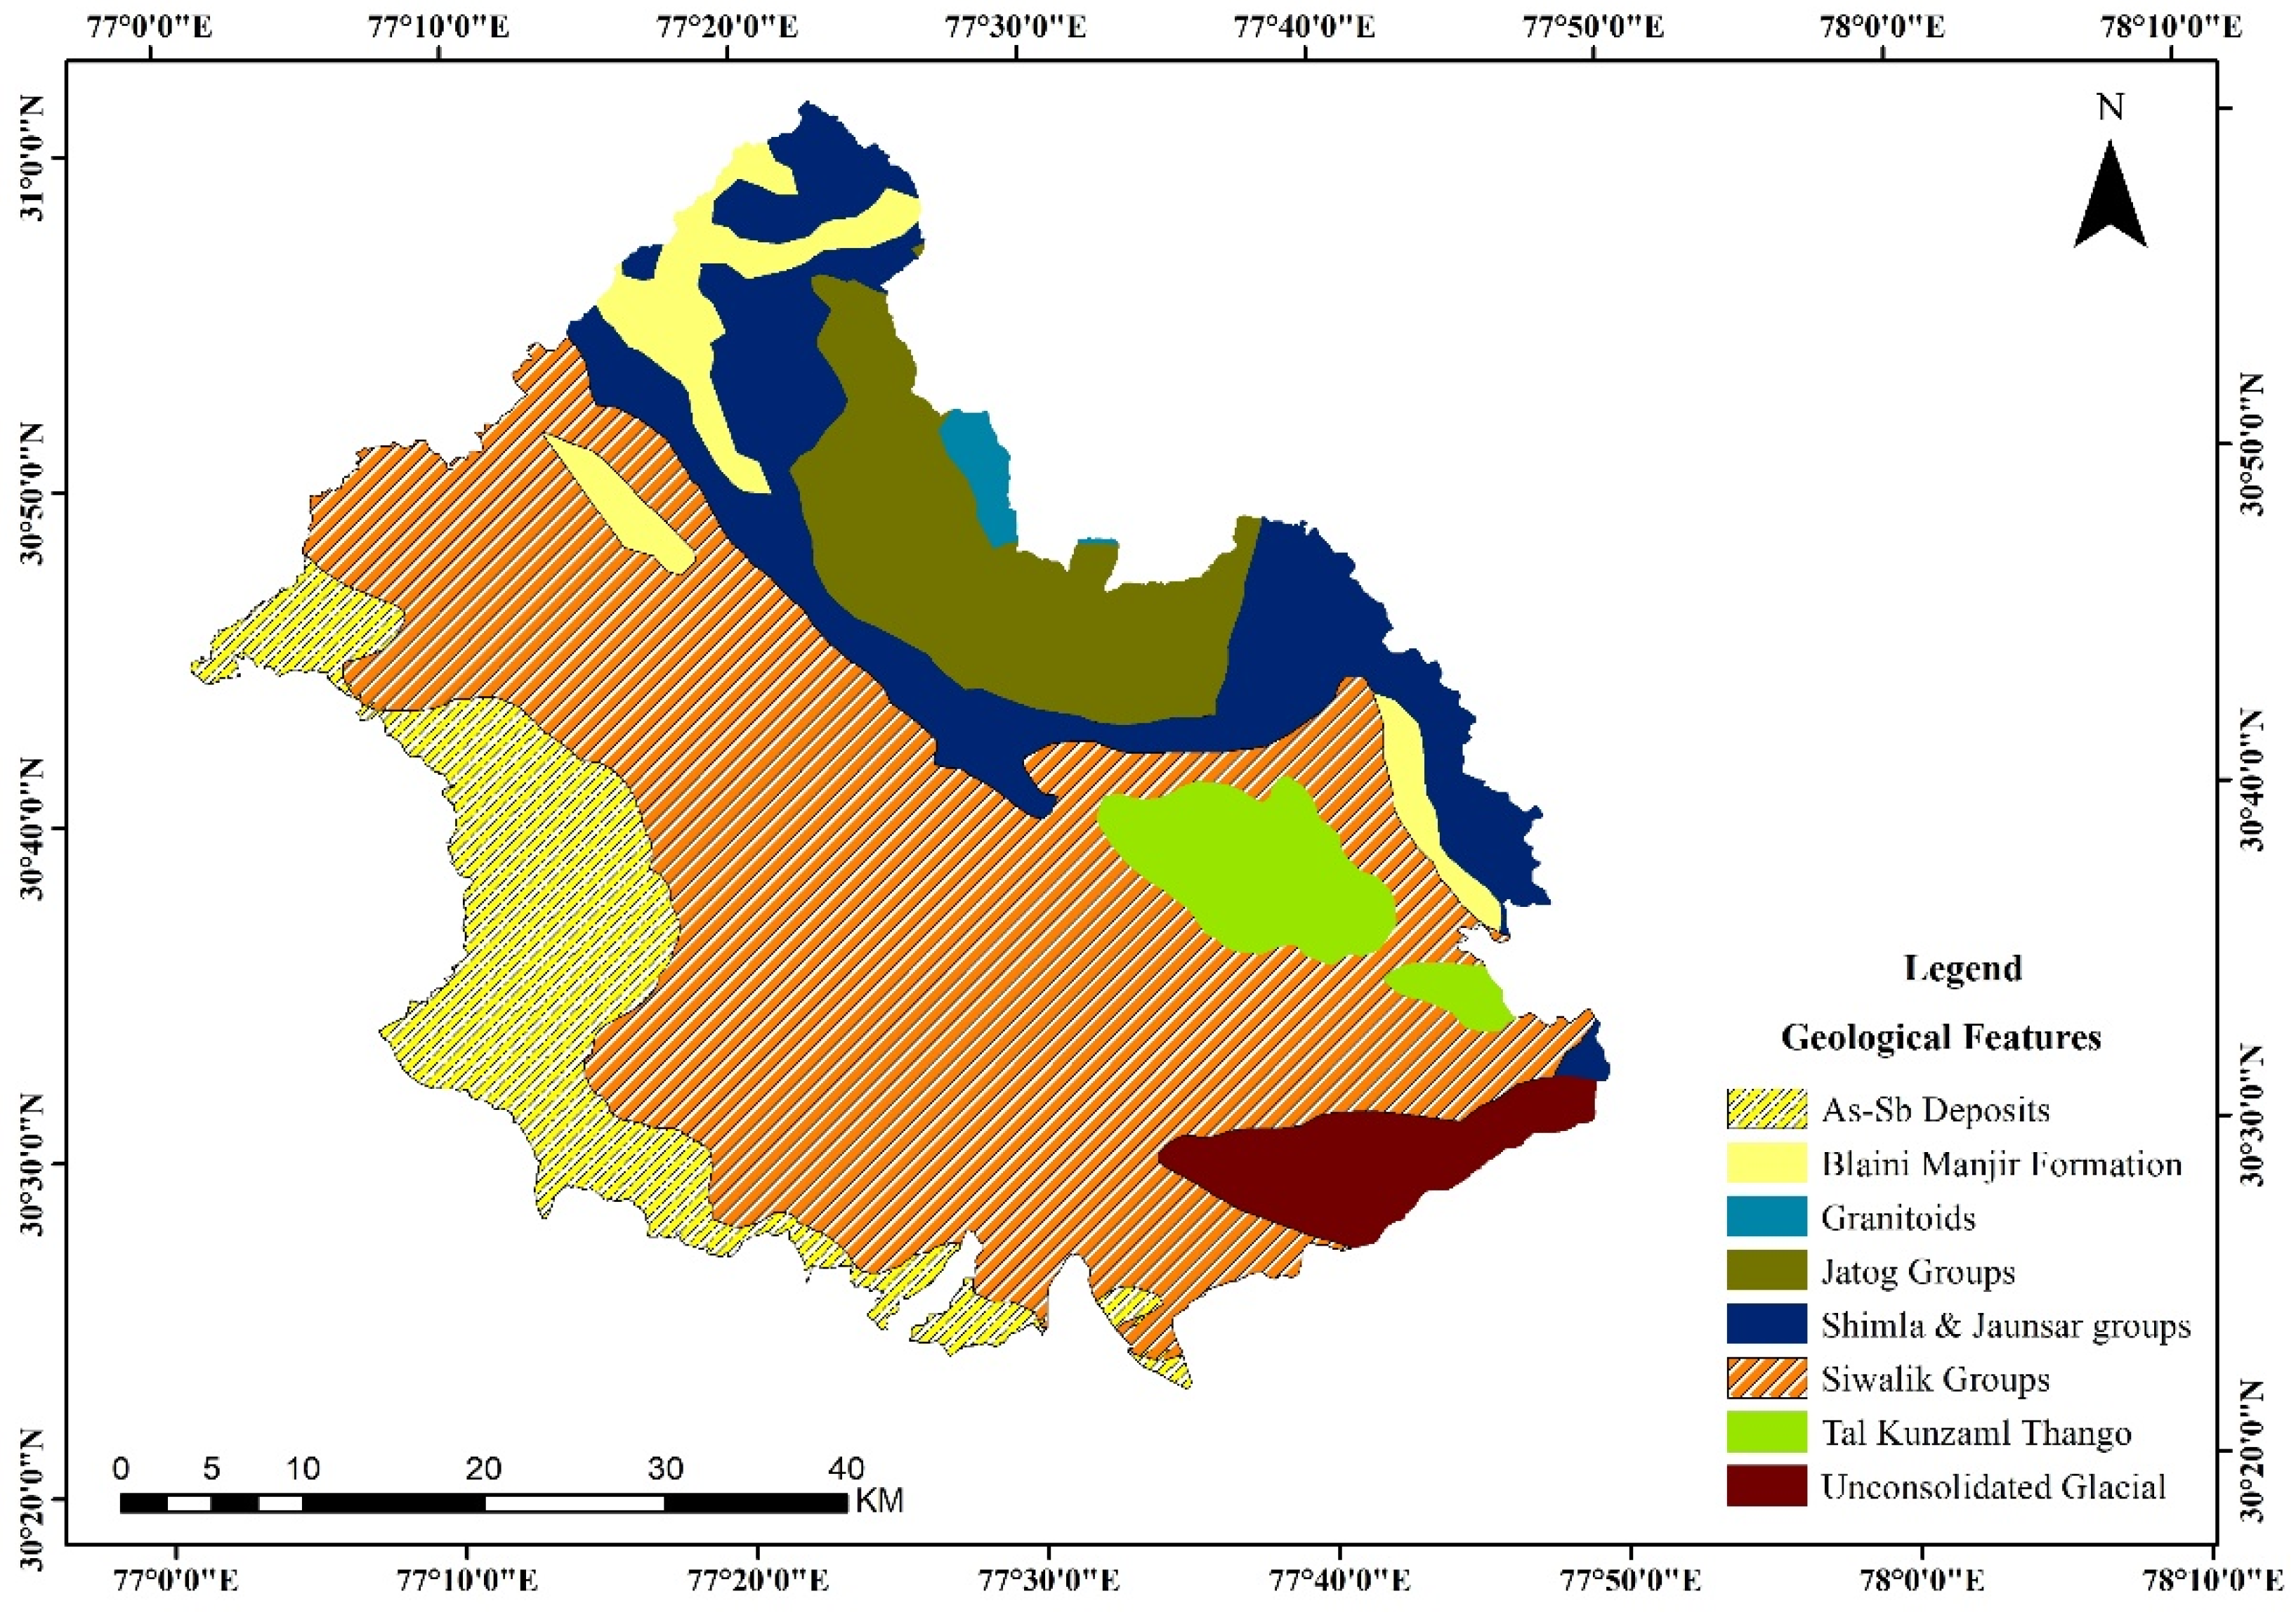
3.2.10. Geology
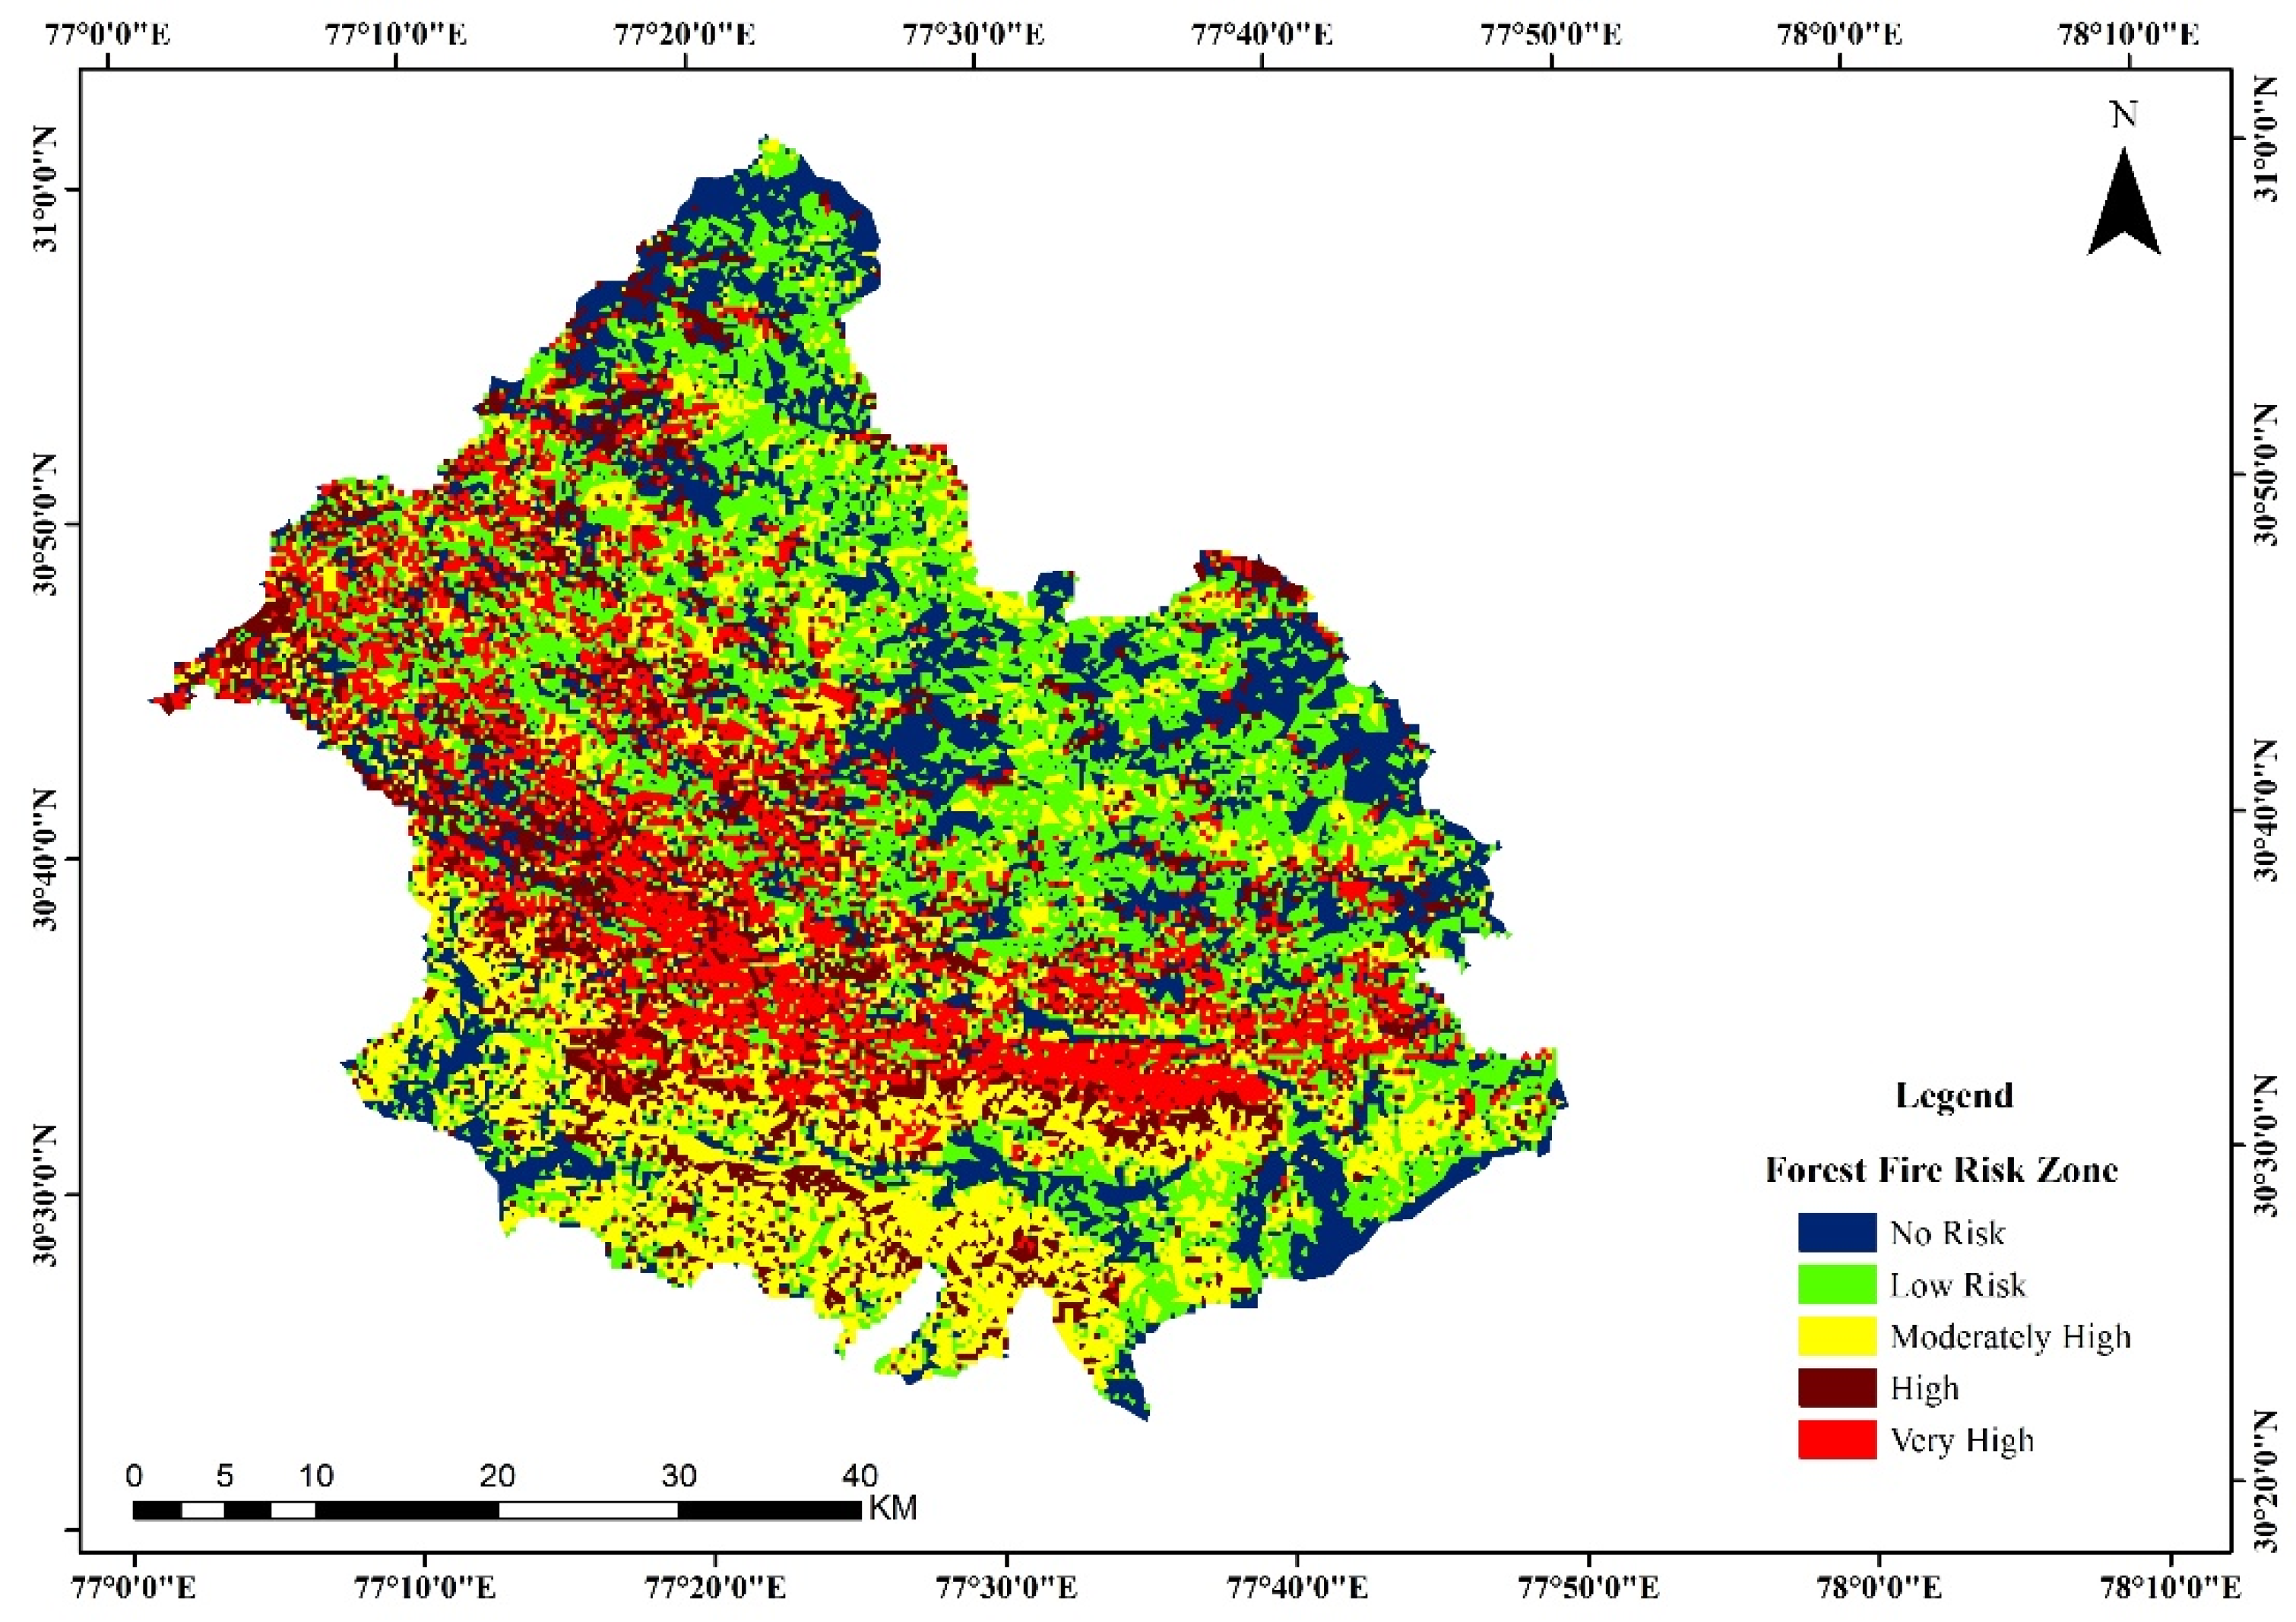
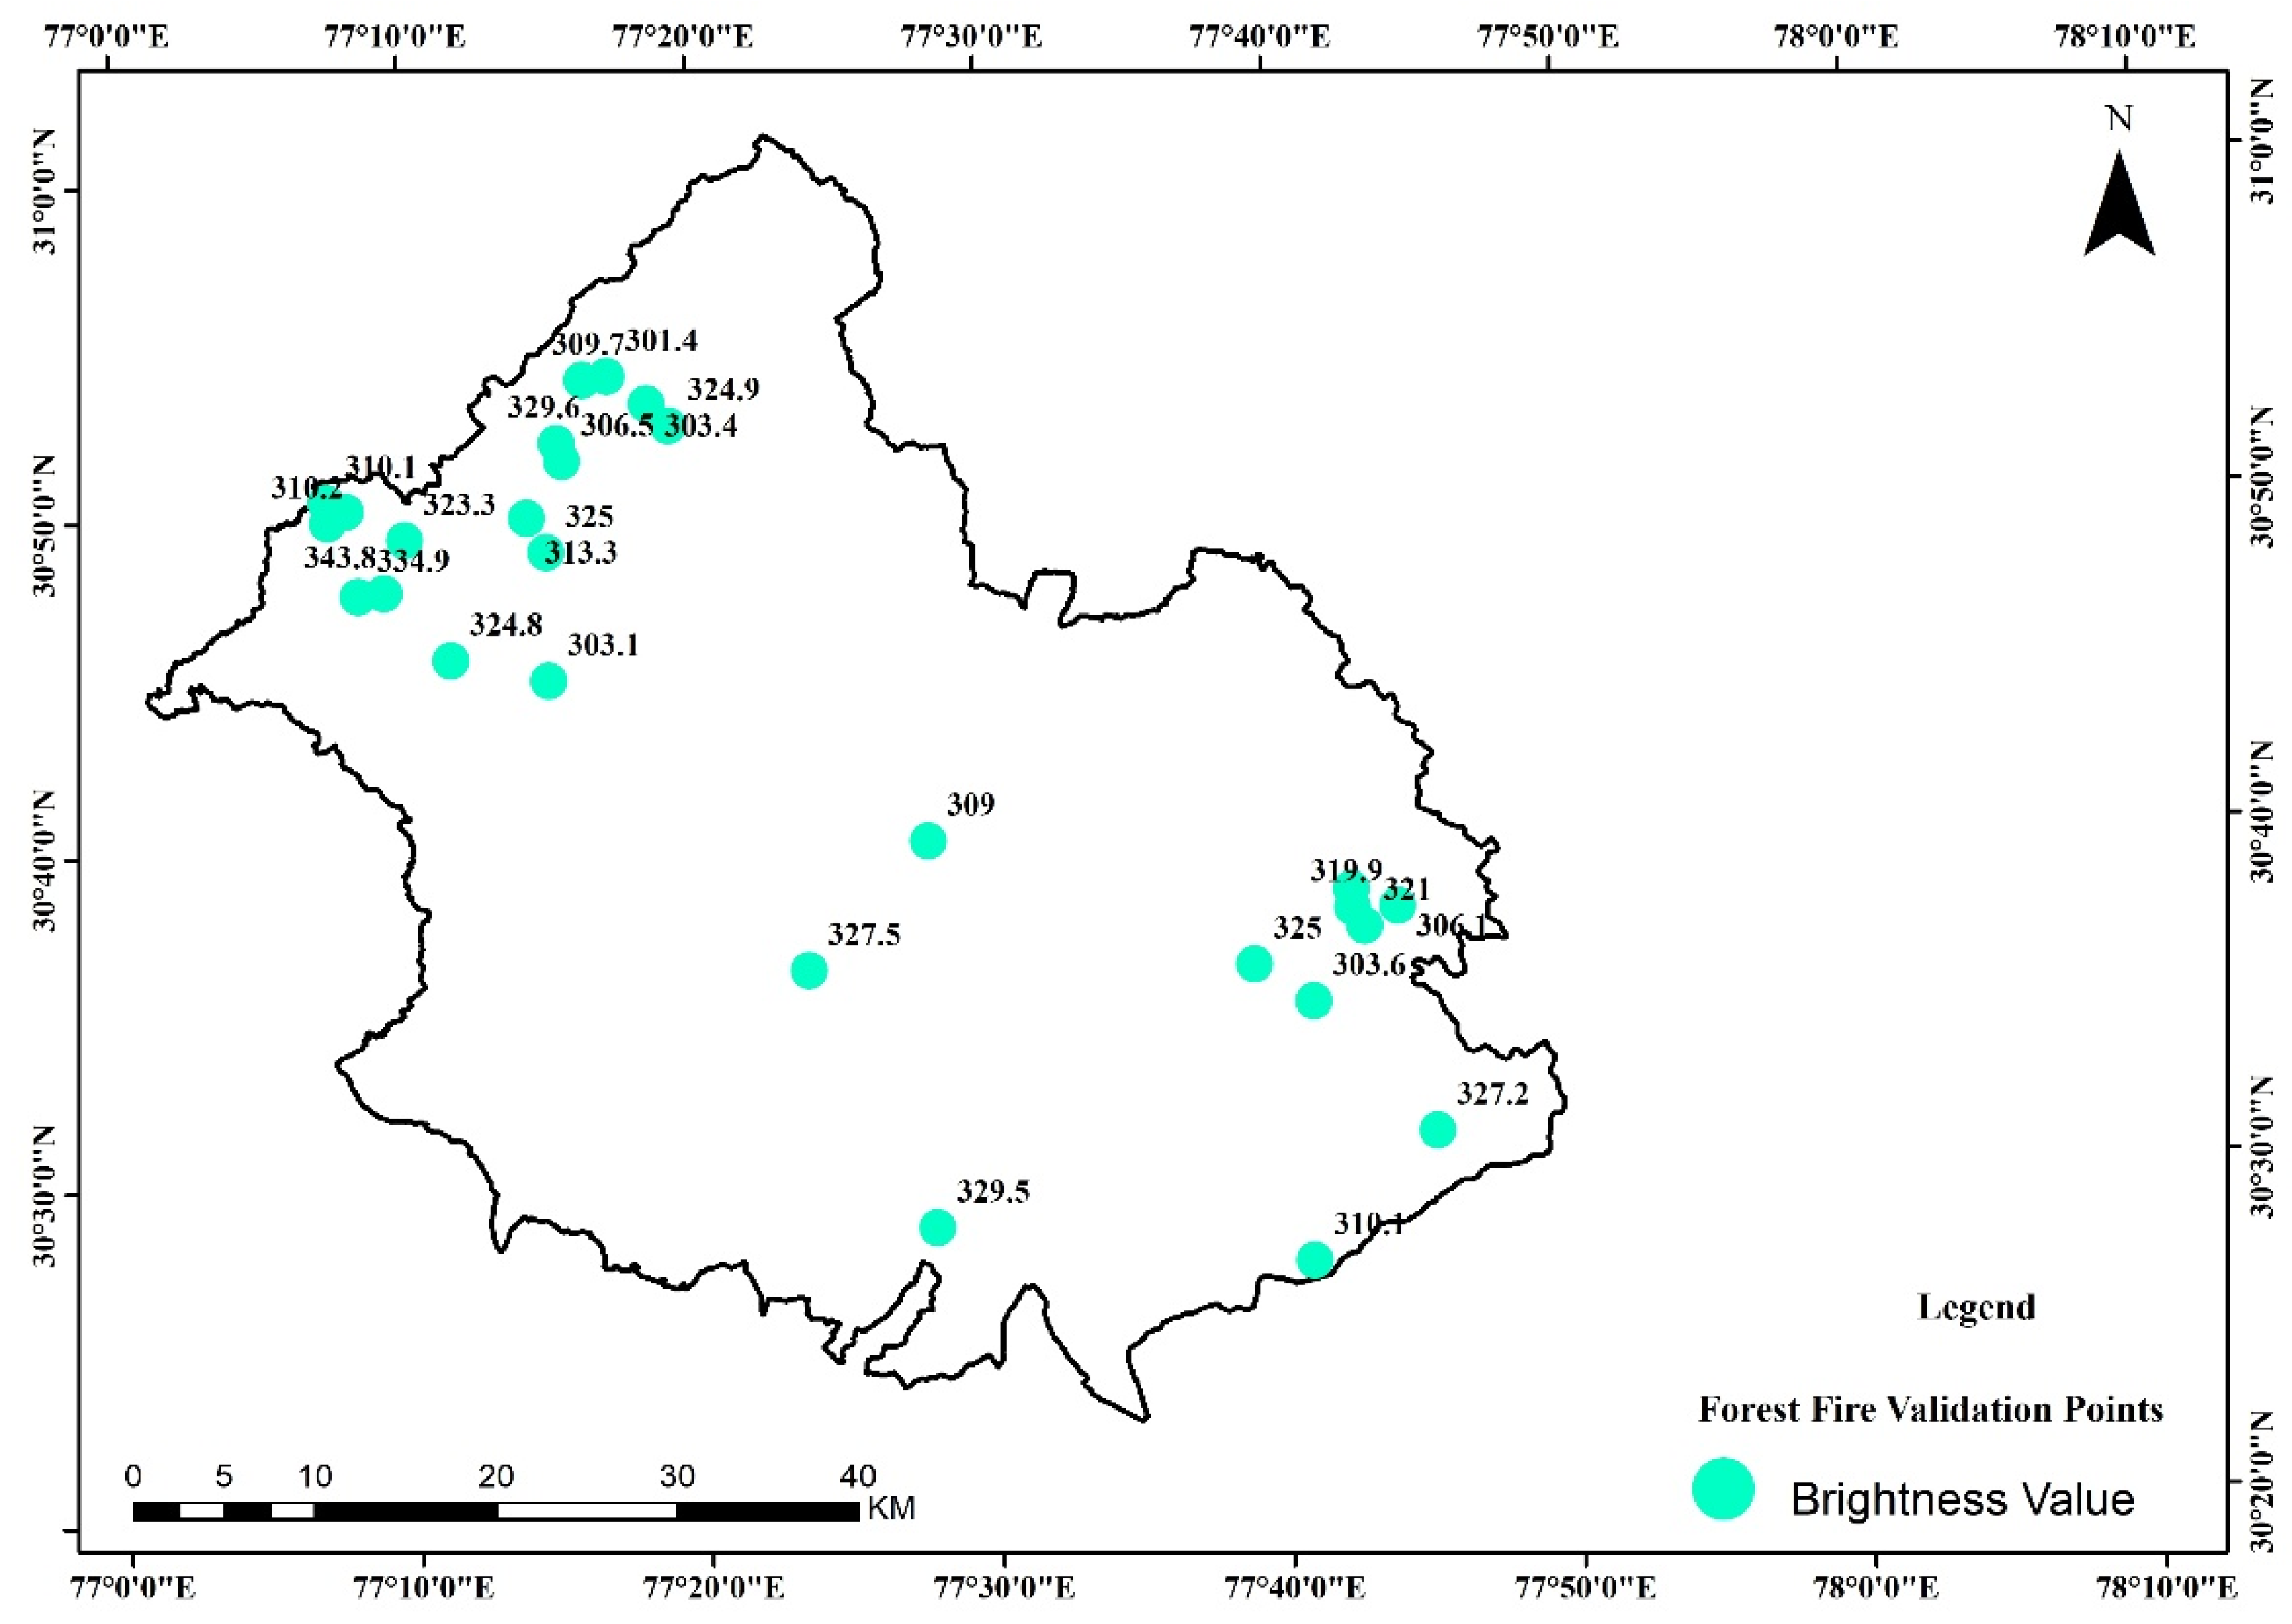
4. Results and Discussion
5. Conclusions
Author Contributions
Funding
Institutional Review Board Statement
Informed Consent Statement
Data Availability Statement
Acknowledgments
Conflicts of Interest
Appendix A

| Variable | Classes | Intensity of Importance | Fire Hazards Classes | Area in km2 | Area in % |
|---|---|---|---|---|---|
| Land Use/Land cover | Agriculture | 5 | High | 605.85 | 21.42 |
| Built-up Land | 2 | Low Risk | 12.11 | 0.43 | |
| Forest | 7 | Very High | 1466.94 | 51.86 | |
| Grass Land/Grazing Land | 4 | Moderately High | 39.33 | 1.39 | |
| Waste Land | 3 | Low Risk | 624.68 | 22.09 | |
| Water Bodies | 1 | No Risk | 79.49 | 2.81 | |
| Geology | As–Sb Deposits | 2 | Low Risk | 372.961 | 13.17 |
| BlainiManjir formation | 1 | No Risk | 123.61 | 4.37 | |
| Granitoids | 7 | Very High | 17.6021 | 0.62 | |
| Jatog Groups | 4 | Moderately High | 257.035 | 9.08 | |
| Shimla and Jaunsar groups | 3 | Moderately High | 375.189 | 13.25 | |
| Siwalik Groups | 6 | High | 1461 | 51.60 | |
| Tal Kunzaml Thango | 5 | High | 120.419 | 4.25 | |
| Unconsolidated Glacial | 1 | No Risk | 103.671 | 3.66 | |
| Geomorphology | Alluvial Plain | 2 | Low Risk | 187.052 | 6.63 |
| Denudational Hills | 3 | Low Risk | 67.0437 | 2.38 | |
| Flood Plain | 1 | No Risk | 72.0214 | 2.55 | |
| Piedment Zone | 7 | Very High | 3.73777 | 0.13 | |
| Structural Hills | 5 | Moderately High | 2492.39 | 88.31 | |
| Forest Type | Plantation/TOF | 4 | Moderately High | 2.71 | 0.10 |
| Lower or Siwalik chir pine forest | 9 | Very High | 518.39 | 18.38 | |
| Non-Forest | 1 | No Risk | 1386.66 | 49.16 | |
| Moist deodar forest | 2 | Low Risk | 178.89 | 6.34 | |
| Oak scrub | 3 | Low Risk | 103.48 | 3.67 | |
| Northern dry mixed deciduous forest | 5 | High | 203.46 | 7.21 | |
| Water | 1 | No Risk | 11.06 | 0.39 | |
| Moist temperate deciduous forest | 2 | Low Risk | 11.89 | 0.42 | |
| West Himalayan sub-alpine forest | 3 | Low Risk | 0.39 | 0.01 | |
| West Himalayan high-level dry blue pine forest | 7 | Very High | 6.73 | 0.24 | |
| Bhabar-dun sal forest | 4 | Moderately High | 397.12 | 14.08 | |
| Drainage Buffer | <200 m | 1 | No Risk | 483.243 | 17.09 |
| 400 m | 2 | Low Risk | 444.229 | 15.71 | |
| 600 m | 3 | Moderately High | 400.589 | 14.16 | |
| 800 m | 4 | Moderately High | 354.951 | 12.55 | |
| 1000 m | 5 | High | 311.513 | 11.01 | |
| >1000 m | 7 | Very High | 833.783 | 29.48 | |
| Road Buffer | <200 m | 7 | Very High | 907.499 | 32.09 |
| 400 m | 5 | High | 582.693 | 20.60 | |
| 600 m | 3 | Moderate | 405.018 | 147.61 | |
| 800 m | 3 | Moderately High | 274.392 | 9.70 | |
| 1000 m | 1 | Low Risk | 185.152 | 6.55 | |
| >1000 m | 1 | No Risk | 473.344 | 16.74 | |
| Built-Up Buffer | <200 m | 7 | Very High | 70.3744 | 2.49 |
| 400 m | 5 | High | 78.2607 | 2.77 | |
| 600 m | 4 | Moderately High | 96.1169 | 3.40 | |
| 800 m | 3 | Moderately High | 107.646 | 3.81 | |
| 1000 m | 2 | Low Risk | 113.995 | 4.03 | |
| >1000 m | 1 | No Risk | 2362.05 | 83.51 | |
| Slope | <10 | 2 | Low Risk | 506.46 | 17.02 |
| 10.1–20 | 3 | Moderately High | 702.186 | 23.60 | |
| 20.1–30 | 4 | Moderately High | 960.044 | 32.27 | |
| 30.1–40 | 5 | High | 646.021 | 21.71 | |
| 40> | 7 | Very High | 160.628 | 5.40 | |
| Aspects | North (0–22.5); North (337.5–360); Northeast (22.5–67.5) | 1 | No Risk | 727.494 | 24.47 |
| East (67.5–112.5) | 3 | Moderately High | 342.679 | 11.53 | |
| Southeast (112.5–157.5) | 4 | Moderately High | 355.775 | 11.97 | |
| South (157.5–202.5) | 7 | Very High | 416.389 | 14.00 | |
| Southwest (202.5–247.5) | 5 | High | 420.902 | 14.16 | |
| West (247.5–292.5); Northwest (292.5–337.5) | 2 | Low Risk | 710.092 | 23.88 | |
| Elevation | 0–700 | 6 | Very High | 844.955 | 28.40 |
| 700.1–1000 | 4 | High | 398.448 | 13.39 | |
| 1000.1–1500 | 3 | Moderately High | 927.634 | 31.18 | |
| 1500.1–2000 | 2 | Low Risk | 570.535 | 19.18 | |
| 2000.1–3536 | 1 | No Risk | 233.768 | 7.86 |
References
- Bahuguna, V.K. India: Forest Fire Prevention and Control Strategies (IFFN No. 20). Available online: https://gfmc.online/iffn/country/in/in_1.html#:~:text=Forest Fire prevention is looked after by the,provided financial assistance for fire prevention and control (accessed on 27 May 2021).
- United Nations. Sendai Framework for Disaster Risk Reduction 2015–2030; General Assembly, United Nations: Geneve, Switzerland, 2015. [Google Scholar]
- Dimopoulou, M.; Giannikos, I. Towards an integrated framework for forest fire control. Eur. J. Oper. Res. 2004, 152, 476–486. [Google Scholar] [CrossRef]
- Semwal, R.L. Forest Fires in India: Lessons from Case Studies; New Delhi World Wildlife Fund for Nature-India: New Delhi, India, 2003. [Google Scholar]
- Srivastava, P.; Garg, A. Forest Fires in India: Regional and Temporal Analyses. J. Trop. For. Sci. 2013, 25, 228–239. [Google Scholar]
- Jain, A.; Ravan, S.A.; Singh, R.K.; Das, K.K.; Roy, P.S. Forest fire risk modelling using remote sensing and geographic information system. Curr. Sci. 1996, 70, 928–933. [Google Scholar]
- Jaiswal, R.K.; Mukherjee, S.; Raju, K.D.; Saxena, R. Forest fire risk zone mapping from satellite imagery and GIS. Int. J. Appl. Earth Obs. Geoinf. 2002, 4, 1–10. [Google Scholar] [CrossRef]
- Alonso-Betanzos, A.; Fontenla-Romero, O.; Guijarro-Berdiñas, B.; Hernández-Pereira, E.; Inmaculada Paz Andrade, M.; Jiménez, E.; Luis Legido Soto, J.; Carballas, T. An intelligent system for forest fire risk prediction and fire fighting management in Galicia. Expert Syst. Appl. 2003, 25, 545–554. [Google Scholar] [CrossRef]
- Iliadis, L.S. A decision support system applying an integrated fuzzy model for long-term forest fire risk estimation. Environ. Model. Softw. 2005, 20, 613–621. [Google Scholar] [CrossRef]
- Bonazountas, M.; Kallidromitou, D.; Kassomenos, P.A.; Passas, N. Forest Fire Risk Analysis. Hum. Ecol. Risk Assess. Int. J. 2005, 11, 617–626. [Google Scholar] [CrossRef]
- Adab, H.; Devi, K.; Karim, K. Modeling forest fire risk in the northeast of Iran using remote sensing and GIS techniques. Nat. Hazards 2013, 65, 1723–1743. [Google Scholar] [CrossRef]
- Malik, T.; Rabbani, G.; Farooq, M. Forest Fire Risk Zonation Using Remote Sensing and GIS Technology in Kansrao Forest Range of Rajaji National Park, Uttarakhand, India. Int. J. Adv. Remote Sens. GIS 2013, 2, 86–95. [Google Scholar]
- Jung, J.; Kim, C.; Jayakumar, S.; Kim, S.; Han, S.; Kim, D.H.; Heo, J. Forest fire risk mapping of Kolli Hills, India, considering subjectivity and inconsistency issues. Nat. Hazards 2013, 65, 2129–2146. [Google Scholar] [CrossRef]
- Sowmya, S.V.; Somashekar, R.K. Application of remote sensing and geographical information system in mapping forest fire risk zone at Bhadra wildlife sanctuary, India. J. Environ. Biol. 2010, 31, 969–974. [Google Scholar]
- Ajin, R.; Loghin, A.-M.; Vinod, P.; Jacob, M. Forest Fire Risk Zone Mapping Using RS and GIS Techniques: A Study in Achankovil Forest Division, Kerala, India. J. Earth Environ. Health Sci. 2016, 2, 109–115. [Google Scholar] [CrossRef]
- Kanga, S.; Tripathi, G.; Singh, S.K. Forest Fire Hazards Vulnerability and Risk Assessment in Bhajji Forest Range of Himachal Pradesh (India): A Geospatial Approach. J. Remote Sens. GIS 2017, 8, 25–40. [Google Scholar]
- Government of Himachal Pradesh District Sirmaur-Demography. Available online: https://hpsirmaur.nic.in/demography/ (accessed on 24 May 2021).
- European Space Agency Web Page. Available online: http://www.esa.int/ (accessed on 27 May 2021).
- Government of India of CARTOSAT-1. Available online: https://www.isro.gov.in/Spacecraft/cartosat-1 (accessed on 24 May 2021).
- Rogeau, M.-P.; Armstrong, G.W. Quantifying the effect of elevation and aspect on fire return intervals in the Canadian Rocky Mountains. For. Ecol. Manag. 2017, 384, 248–261. [Google Scholar] [CrossRef]
- Agency, E.S. Sentinel-2. Available online: https://sentinels.copernicus.eu/web/sentinel/missions/sentinel-2 (accessed on 24 May 2021).
- Geological Survey of India Geological Survey of Geological Map of India. Available online: https://www.gsi.gov.in/webcenter/portal/OCBIS/pageMAPS/pageMapsSeries?_adf.ctrl-state=eldqgtyzy_9&_afrLoop=22186242333769660#! (accessed on 27 May 2021).
- Shakesby, R.A.; Doerr, S.H. Wildfire as a hydrological and geomorphological agent. Earth Sci. Rev. 2006, 74, 269–307. [Google Scholar] [CrossRef]
- Meyer, G.A.; Pierce, J.L. Climatic controls on fire-induced sediment pulses in Yellowstone National Park and central Idaho: A long-term perspective. For. Ecol. Manag. 2003, 178, 89–104. [Google Scholar] [CrossRef]
- Armenteras, D.; Barreto, J.S.; Tabor, K.; Molowny-Horas, R.; Retana, J. Changing patterns of fire occurrence in proximity to forest edges, roads and rivers between NW Amazonian countries. Biogeosciences 2017, 14, 2755–2765. [Google Scholar] [CrossRef] [Green Version]
- Tian, X.; Zhao, F.; Shu, L.; Wang, M. Distribution characteristics and the influence factors of forest fires in China. For. Ecol. Manag. 2013, 310, 460–467. [Google Scholar] [CrossRef]
- Fazlollahtabar, H.; Eslami, H.; Salmani, H. Designing a Fuzzy Expert System to Evaluate Alternatives in Fuzzy Analytic Hierarchy Process. J. Softw. Eng. Appl. 2010, 3, 409–418. [Google Scholar] [CrossRef] [Green Version]
- Saaty, T.L. How to make a decision: The analytic hierarchy process. Eur. J. Oper. Res. 1990, 48, 9–26. [Google Scholar] [CrossRef]
- Saaty, T.L. Analytic Heirarchy Process. In Wiley Stats Ref: Statistics Reference Online; Wiley Online Library, John Wiley & Sons: Hoboken, NJ, USA, 2014; ISBN 9781118445112. [Google Scholar]
- Saaty, T.L. Rank from comparisons and from ratings in the analytic hierarchy/network processes. Eur. J. Oper. Res. 2006, 168, 557–570. [Google Scholar] [CrossRef]
- Marinoni, O. Implementation of the analytical hierarchy process with VBA in ArcGIS. Comput. Geosci. 2004, 30, 637–646. [Google Scholar] [CrossRef]
- Copernicus Open Access Hub. Available online: https://scihub.copernicus.eu/ (accessed on 27 May 2021).
- National Remote Sensing Centre Bhuvan-3D. Available online: https://bhuvan.nrsc.gov.in/home/index.php (accessed on 27 May 2021).


| Importance | Definition | Explanation |
|---|---|---|
| 1 | Equally Important | Equally vital to the target |
| 3 | Moderately Important | Compared to the overall profit or damage |
| 5 | Strong Importance | A strong preference for one factor over another |
| 7 | Very Strong Importance | The one thing that has gained preeminence, considered to be above all the others and vastly superior in the real world, is the theory world of practice. |
| 9 | Extreme Importance | If it is strongly proven with evidence and facts, then one element is favored in comparison to the other |
| 2, 4, 6, 8 | Inter values |
| n | 1 | 2 | 3 | 4 | 5 | 6 | 7 | 8 | 9 | 10 | 11 | 12 | 13 | 14 | 15 |
|---|---|---|---|---|---|---|---|---|---|---|---|---|---|---|---|
| RI | 0 | 0 | 0.58 | 0.9 | 1.12 | 1.24 | 1.32 | 1.41 | 1.45 | 1.49 | 1.51 | 1.53 | 1.56 | 1.57 | 1.59 |
| Item Number | 1 | 2 | 3 | 4 | 5 | 6 | 7 | 8 | 9 | 10 | |
|---|---|---|---|---|---|---|---|---|---|---|---|
| Item Number | Item Description | Forest Type | Aspect | Slope | Road Buffer | Elevation | Built up Land | Land Use/Land Cover | Drainage Buffer | Geomorphology | Geology |
| 1 | Forest Type | 1.00 | 5.00 | 3.00 | 5.00 | 4.00 | 3.00 | 4.00 | 5.00 | 3.00 | 1.00 |
| 2 | Aspect | 0.20 | 1.00 | 2.00 | 1.00 | 0.50 | 4.00 | 1.00 | 5.00 | 1.00 | 2.00 |
| 3 | Slope | 0.33 | 0.50 | 1.00 | 1.00 | 1.00 | 3.00 | 1.00 | 6.00 | 3.00 | 1.00 |
| 4 | Road Buffer | 0.20 | 1.00 | 1.00 | 1.00 | 1.00 | 2.00 | 1.00 | 2.00 | 4.00 | 2.00 |
| 5 | Elevation | 0.25 | 2.00 | 1.00 | 1.00 | 1.00 | 1.00 | 1.00 | 2.00 | 2.00 | 2.00 |
| 6 | Built up land | 0.33 | 0.25 | 0.33 | 0.55 | 1.00 | 1.00 | 0.50 | 4.00 | 0.33 | 2.00 |
| 7 | Land use/land cover | 0.25 | 1.00 | 1.00 | 1.00 | 1.00 | 2.00 | 1.00 | 2.00 | 1.00 | 1.00 |
| 8 | Drainage Buffer | 0.20 | 0.20 | 0.17 | 0.50 | 0.50 | 0.25 | 0.50 | 1.00 | 3.00 | 0.33 |
| 9 | Geomorphology | 0.33 | 1.00 | 0.33 | 0.25 | 0.50 | 3.00 | 1.00 | 3.00 | 1.00 | 1.00 |
| 10 | Geology | 1.00 | 0.50 | 1.00 | 0.50 | 0.50 | 0.50 | 1.00 | 3.00 | 1.00 | 1.00 |
| Sum | 4.10 | 12.45 | 10.83 | 11.75 | 11.00 | 19.75 | 12.00 | 30.33 | 19.33 | 13.33 |
| Item Number | Variable | Forest Type | Aspect | Slope | Road Buffer | Elevation | Built up Land | Land Use/Land Cover | Drainage Buffer | Geomorphology | Geology | Weight |
|---|---|---|---|---|---|---|---|---|---|---|---|---|
| 1 | Forest Type | 0.24 | 0.40 | 0.28 | 0.43 | 0.36 | 0.15 | 0.33 | 0.16 | 0.16 | 0.08 | 25.9% |
| 2 | Aspect | 0.05 | 0.08 | 0.18 | 0.09 | 0.05 | 0.20 | 0.08 | 0.16 | 0.05 | 0.15 | 11.0% |
| 3 | Slope | 0.08 | 0.04 | 0.09 | 0.09 | 0.09 | 0.15 | 0.08 | 0.20 | 0.16 | 0.08 | 10.5% |
| 4 | Road Buffer | 0.05 | 0.08 | 0.09 | 0.09 | 0.09 | 0.10 | 0.08 | 0.07 | 0.21 | 0.15 | 10.0% |
| 5 | Elevation | 0.06 | 0.16 | 0.09 | 0.09 | 0.09 | 0.05 | 0.08 | 0.07 | 0.10 | 0.15 | 9.4% |
| 6 | Built up land | 0.08 | 0.02 | 0.03 | 0.04 | 0.09 | 0.05 | 0.04 | 0.13 | 0.02 | 0.15 | 6.6% |
| 7 | Land use/land cover | 0.06 | 0.08 | 0.09 | 0.09 | 0.09 | 0.10 | 0.08 | 0.07 | 0.05 | 0.08 | 7.9% |
| 8 | Drainage Buffer | 0.05 | 0.02 | 0.02 | 0.04 | 0.05 | 0.01 | 0.04 | 0.03 | 0.16 | 0.03 | 4.4% |
| 9 | Geomorphology | 0.08 | 0.08 | 0.03 | 0.02 | 0.05 | 0.15 | 0.08 | 0.01 | 0.05 | 0.08 | 6.3% |
| 10 | Geology | 0.24 | 0.04 | 0.09 | 0.04 | 0.05 | 0.03 | 0.08 | 0.10 | 0.05 | 0.08 | 8.0% |
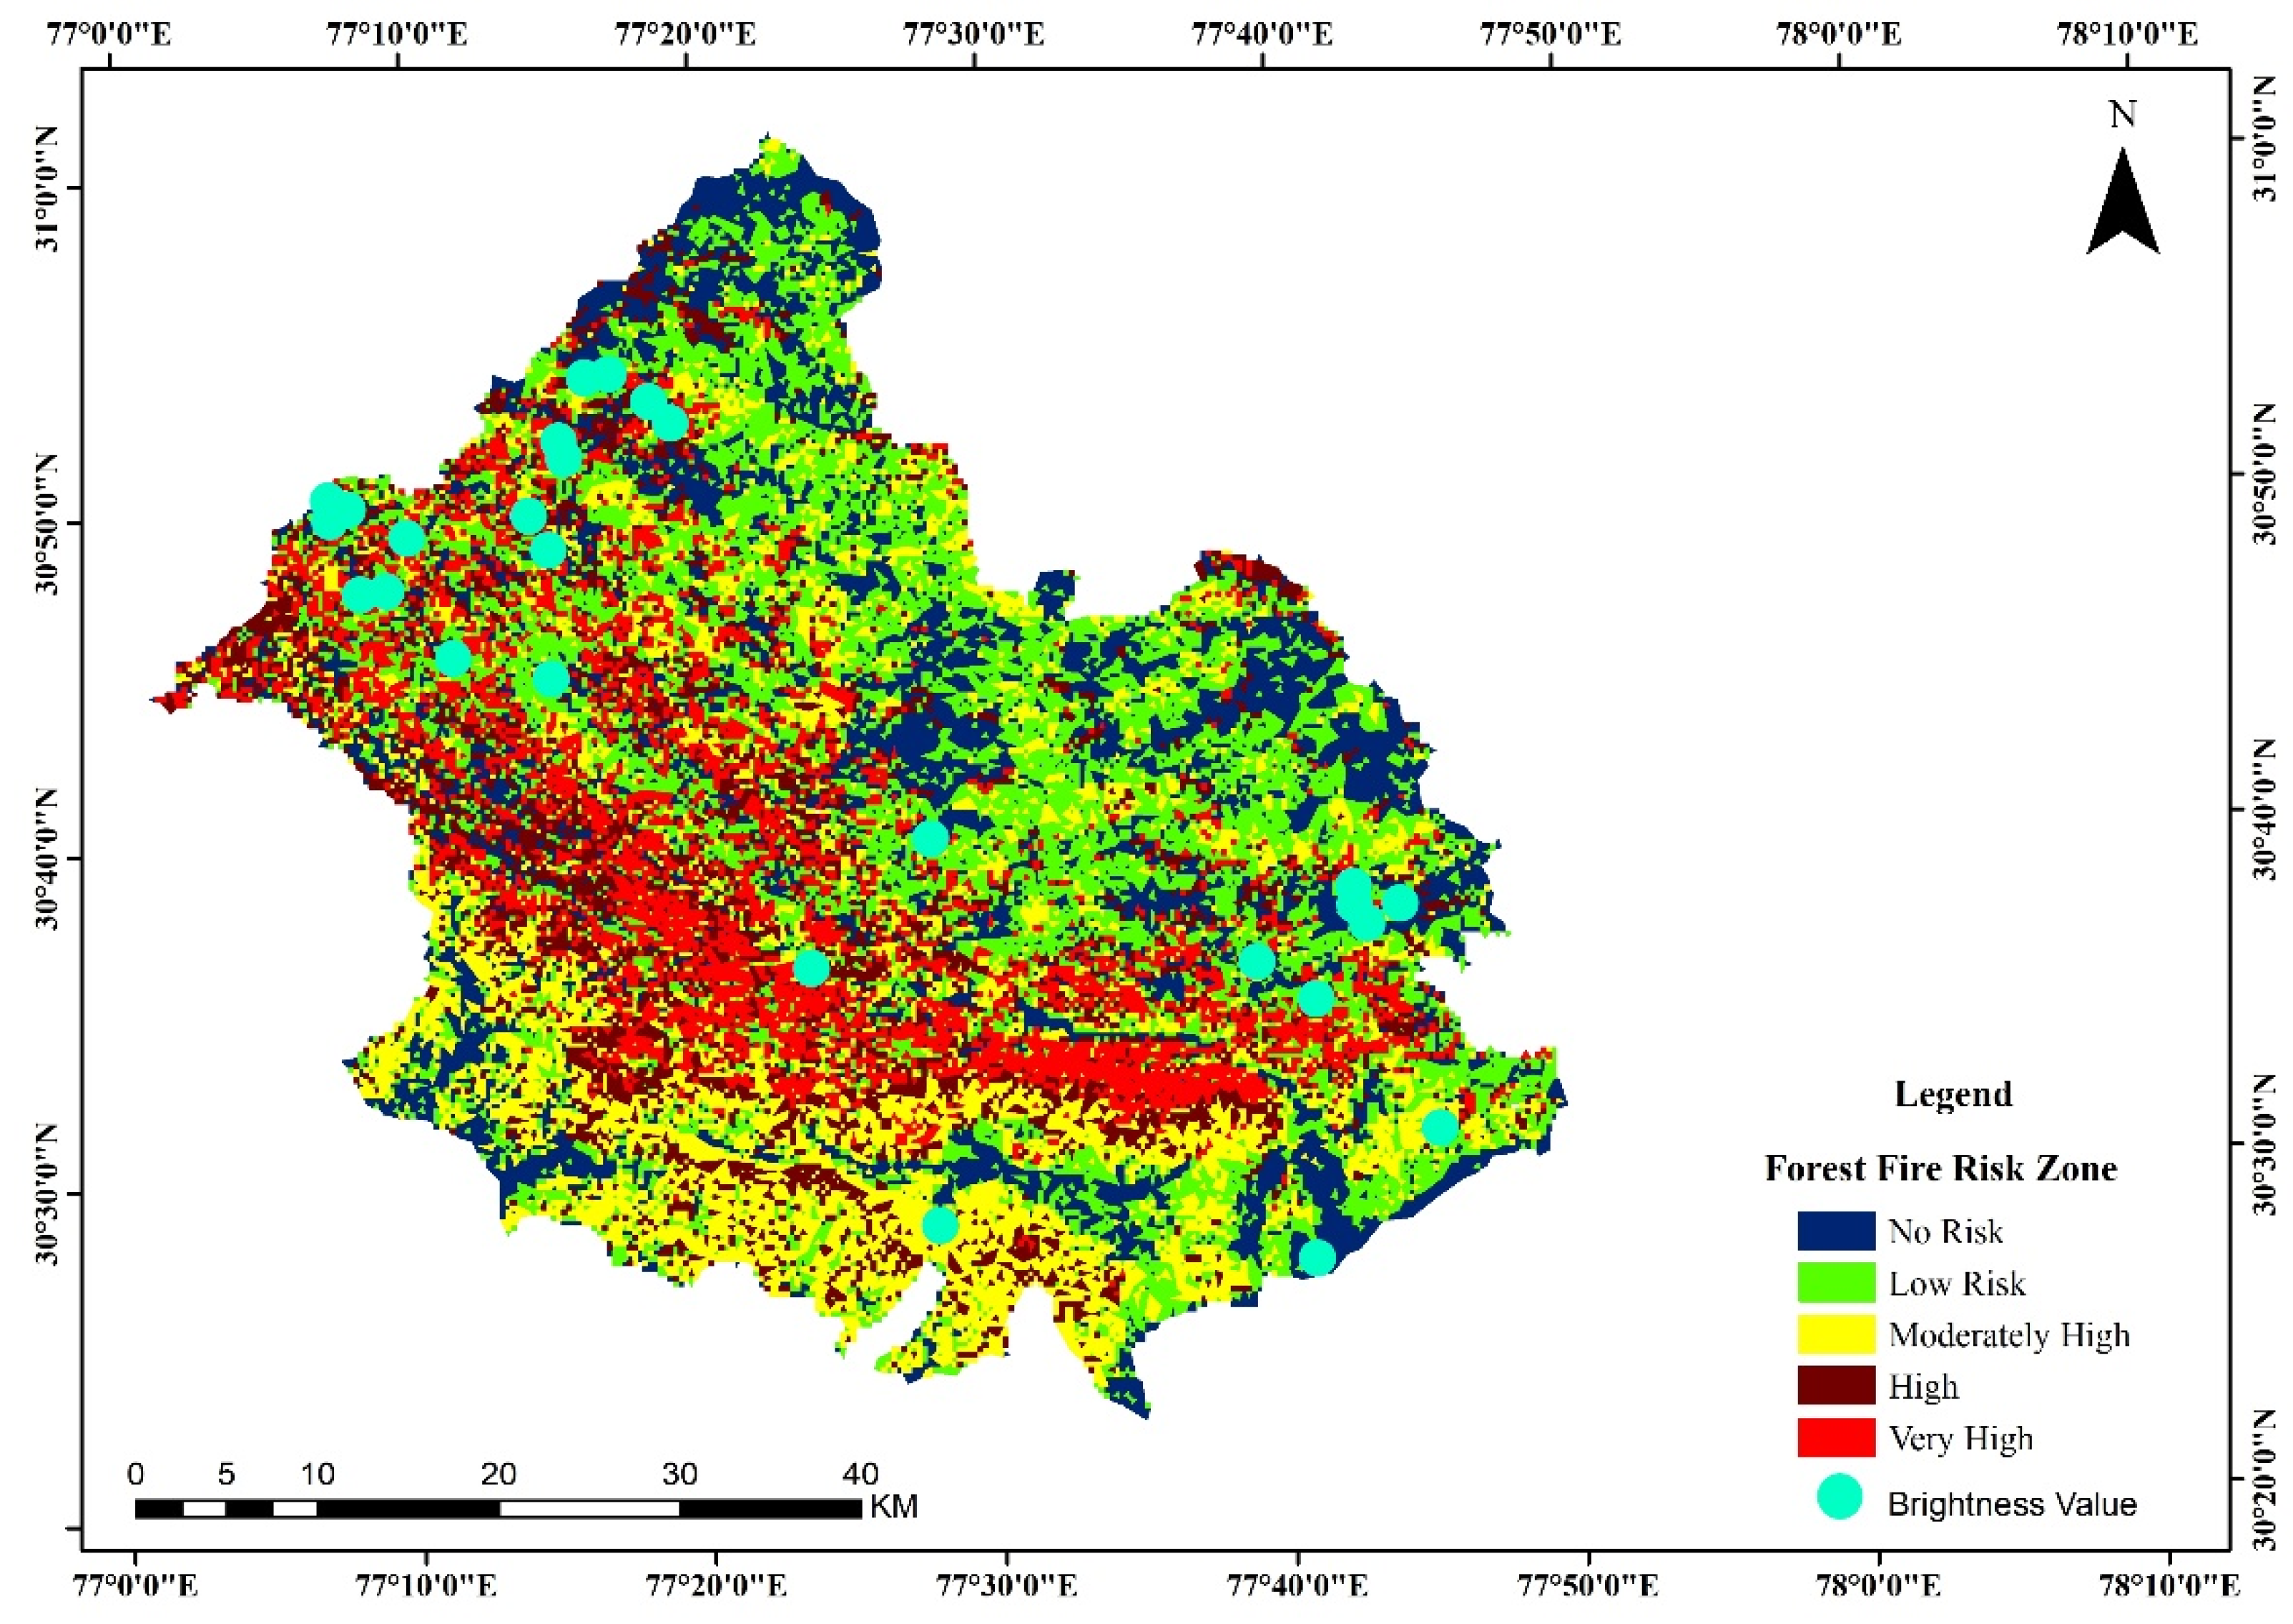
| Forest Fire Risk | Area (in km2) | Area (in %) | Index Value | Validation Points | Brightness Range Value |
|---|---|---|---|---|---|
| Very high | 339.152 | 12.13 | 5 | 5 | 343.8–327.5 |
| High | 350.442 | 12.53 | 4 | 7 | 327.4–323.9 |
| Moderately high | 599.352 | 21.43 | 3 | 11 | 323.4–306.1 |
| Low risk | 924.910 | 33.07 | 2 | 3 | 303.1–303.6 |
| No risk | 583.095 | 20.85 | 1 | 1 | 301–303 |
Publisher’s Note: MDPI stays neutral with regard to jurisdictional claims in published maps and institutional affiliations. |
© 2021 by the authors. Licensee MDPI, Basel, Switzerland. This article is an open access article distributed under the terms and conditions of the Creative Commons Attribution (CC BY) license (https://creativecommons.org/licenses/by/4.0/).
Share and Cite
Tomar, J.S.; Kranjčić, N.; Đurin, B.; Kanga, S.; Singh, S.K. Forest Fire Hazards Vulnerability and Risk Assessment in Sirmaur District Forest of Himachal Pradesh (India): A Geospatial Approach. ISPRS Int. J. Geo-Inf. 2021, 10, 447. https://doi.org/10.3390/ijgi10070447
Tomar JS, Kranjčić N, Đurin B, Kanga S, Singh SK. Forest Fire Hazards Vulnerability and Risk Assessment in Sirmaur District Forest of Himachal Pradesh (India): A Geospatial Approach. ISPRS International Journal of Geo-Information. 2021; 10(7):447. https://doi.org/10.3390/ijgi10070447
Chicago/Turabian StyleTomar, Jagpal Singh, Nikola Kranjčić, Bojan Đurin, Shruti Kanga, and Suraj Kumar Singh. 2021. "Forest Fire Hazards Vulnerability and Risk Assessment in Sirmaur District Forest of Himachal Pradesh (India): A Geospatial Approach" ISPRS International Journal of Geo-Information 10, no. 7: 447. https://doi.org/10.3390/ijgi10070447
APA StyleTomar, J. S., Kranjčić, N., Đurin, B., Kanga, S., & Singh, S. K. (2021). Forest Fire Hazards Vulnerability and Risk Assessment in Sirmaur District Forest of Himachal Pradesh (India): A Geospatial Approach. ISPRS International Journal of Geo-Information, 10(7), 447. https://doi.org/10.3390/ijgi10070447