Article

The Impact of COVID-19 on Crime: A Spatial Temporal Analysis in Chicago

1
College of Resources and Environmental Science, Hunan Normal University, Changsha 410081, China
2
Key Laboratory of Geospatial Big Data Mining and Applications, Changsha 410081, China
3
School of Resources and Environmental Science, Wuhan University, 129 Luoyu Road, Wuhan 430079, China
*
Author to whom correspondence should be addressed.
ISPRS Int. J. Geo-Inf. 2021, 10(3), 152; https://doi.org/10.3390/ijgi10030152
Submission received: 29 January 2021 / Revised: 27 February 2021 / Accepted: 7 March 2021 / Published: 10 March 2021

Abstract

:
The coronavirus disease 2019 (COVID-19) pandemic has had tremendous and extensive impacts on the people’s daily activities. In Chicago, the numbers of crime fell considerably. This work aims to investigate the impacts that COVID-19 has had on the spatial and temporal patterns of crime in Chicago through spatial and temporal crime analyses approaches. The Seasonal-Trend decomposition procedure based on Loess (STL) was used to identify the temporal trends of different crimes, detect the outliers of crime events, and examine the periodic variations of crime distributions. The results showed a certain phase pattern in the trend components of assault, battery, fraud, and theft. The largest outlier occurred on 31 May 2020 in the remainder components of burglary, criminal damage, and robbery. The spatial point pattern test (SPPT) was used to detect the similarity between the spatial distribution patterns of crime in 2020 and those in 2019, 2018, 2017, and 2016, and to analyze the local changes in crime on a micro scale. It was found that the distributions of crime significantly changed in 2020 and local changes in theft, battery, burglary, and fraud displayed an aggregative cluster downtown. The results all claim that spatial and temporal patterns of crime changed significantly affected by COVID-19 in Chicago, and they offer constructive suggestions for local police departments or authorities to allocate their available resources in response to crime.

1. Introduction

The recent coronavirus disease 2019 (COVID-19) has had widespread and unprecedented impacts on people’s daily lives, economic development, politics, and social harmony [1]. To reduce the transmission of the virus among people, stay-at-home orders and social distancing guidelines have been issued in many countries, changing the social environment of criminal activity. Thus, the COVID-19 pandemic had an impact on crimes [2]. Overall crimes have dropped sharply during the COVID-19 pandemic [3,4]. The relationship between the COVID-19 pandemic and crimes has varied in terms of types of crimes [5]. It was found that the social distancing guidelines have a statistically significant impact on certain types of crimes: some crimes may decrease (e.g., burglary and robbery), and some crimes may increase (e.g., domestic violence) [6]. It has been shown that robbery, shoplifting, theft, and battery have dropped during the COVID-19 pandemic in Los Angeles, while stolen vehicles, burglaries, assault with deadly weapons, intimate partner violence, and homicide have not been significantly affected [7]. One study also showed that most types of fraud have shown a significant increase, and the impact on older people has been more significant than that on younger people [4]. Although people have altered their routine activities during the COVID-19 pandemic, their cyber routines were not radically altered; thus, cyber victimization rates have not changed [2]. Recent studies have analyzed the impact of the COVID-19 pandemic on different types of crimes. However, the impact of the COVID-19 pandemic on the spatial and temporal distributions of crimes in a city is not well understood. Additionally, existing studies have mainly studied the impacts of the COVID-19 pandemic on crimes at the whole-city scale, and analysis of its impact on crimes at a relatively micro scale is rare. To our knowledge, only Campedelli et al. analyzed the impact of public interventions on several crimes at a relatively micro scale (community-wise) by the Structural Bayesian Time-Series during the COVID-19 [3].
This work is a case study to investigate the impacts that COVID-19 has had on the spatial and temporal patterns of crime in Chicago through spatial and temporal crime analyses approaches. Specifically, we analyzed the temporal pattern changes of different crimes at three temporal dimensions through the Seasonal-Trend decomposition procedure based on Loess (STL). Then, we explored the spatial pattern changes of different crimes in 2020 compared with 2019 by using the spatial point pattern test (SPPT) and utilized the local Moran’s I to identify local clusters and local spatial outliers.

2. Related Work

2.1. Crime and COVID-19

To investigate impacts of the COVID-19 pandemic on crime patterns, some works adopted various quantitative methodologies to analyze the changes in crime trends. In the early stages of COVID-19, Mohler et al. used the average statistics of different period trends to show that social distancing policies have had a statistically significant impact on a few specific crime types [6]. The interrupted time series analysis (ITSA) was applied to assess the impact of COVID-19 lockdown on trends of some crimes [8]. Ashby, Payne, and Morgan used seasonal auto-regressive integrated moving average (SARIMA) models to forecast the expected crime trends in 2020 in the absence of the pandemic, and then gained changes of crime trends by comparing with the actual frequency of crimes [5,9]. Similar to SARIMA models, Bayesian structural time-series (BSTS) models were used to estimate the crime trends affected by social distancing and shelter-in-place policies, as well as to detect the direction, magnitude, and significance of the trend changes [3,7]. After identifying differences between forecast trends and actual trends of crimes, some studies used Firth’s Logistic Regression or Binary Logistic Regression to investigate the factors associated with the crime trends changes [3,10]. Whereas, Abrams used a series of difference-in-difference regressions to quantify the variations of crime rate with crime types and locations [11].
In addition, some works have analyzed the effects of COVID-19 on some specific crimes based on criminal theories, such as activity theory [12], crime pattern theory [13], and general strain theory [14]. The COVID-19 containment policies and social distancing have impacts on people’s activities, crime patterns, and people’s emotions. It was found that routine activity theory and crime pattern theory are associated with the reduction in some types of crime, such as thefts, robberies, homicides, and some group-based offenses [3,15], whereas, the strain and negative emotions caused by the pandemic possibly boosting violent crimes [7,10]. It can be seen that intimate partner violence is increasing in many families, because of the economic impact of the COVID-19 pandemic and responses of social distancing measures added stressors in the home [3,7,15,16].

2.2. Spatial and Temporal Crime Analysis

To the best of our knowledge, the impact that pandemics have on the spatial and temporal distributions of crimes has not been studied before. However, other potential related studies have analyzed the impact of natural disasters (e.g., hurricanes and tornados) on the spatial and temporal distributions of crimes [17,18]. Leitner and Helbich investigated the spatial temporal impact of hurricanes on crimes in Houston, TX, through spatial and temporal crime analysis approaches, including kernel density estimation, spatial scan statistic [19], and geographically weighted regression [20], and determined spatial and temporal burglary clusters and the potential factors leading to the clusters. Moreover, some studies analyzed the impact of pandemics on other events. Campedelli and D’Orsogna used k-means to identify spatial clusters of disorder events, and then found their temporal dependence and self-excitability by Hawkes processes [21].
Spatial and temporal crime analysis approaches are effective for crime research. Many techniques have been developed to detect crime hotspots, measure crime displacement, estimate crime exposure risks, and identify the spatial stability of crime patterns. The hot spot matrix describes three types of temporal hotspots and three types of spatial hotspots, and a policing strategy can be made according to different combinations of temporal hotspots and spatial hotspots [22]. Spatial-temporal kernel density estimation [23,24], spatial scan statistic [19], and spatial and temporal analysis of crime (STAC) techniques [25] are commonly used to detect crime hotspots in spatial and temporal dimensions. Additionally, spatial-temporal kernel density estimation can be used to measure crime displacement [26]. The spatial point pattern test that measures the degree of similarity between two spatial point patterns can be applied to identify spatial stability of crime patterns [27,28,29]. Recently, colocation mining methods have been applied to investigate the spatial association between crime occurrences and city facilities [30,31,32].
In sum, existing studies have mainly studied the impact of the COVID-19 pandemic on crime temporal patterns, and the impact of policies to control the pandemic on crimes based on crime theories. To explore more comprehensive impacts of COVID-19 on crimes in Chicago, this work used the spatial and temporal crime analyses to examine spatiotemporal variations of crime during the pandemic.

3. Materials and Methods

3.1. Workflow

This work aims to explore the spatial and temporal variations of crimes in Chicago during the COVID-19 through spatial and temporal analysis, and the workflow is shown in Figure 1. After gathering and preprocessing crime data, the first step is to determine whether the temporal distribution of crime in Chicago changed significantly during the pandemic, by the Watson U2 test. Then, STL decomposition was used to identify temporal variations of crimes in Chicago during the COVID-19 in three aspects. Finally, SPPT was applied to identify the spatial variations of crimes in Chicago during the COVID-19, and local Moran’s I identified the spatial correlation of local changes in Chicago.

3.2. Study Area and Data

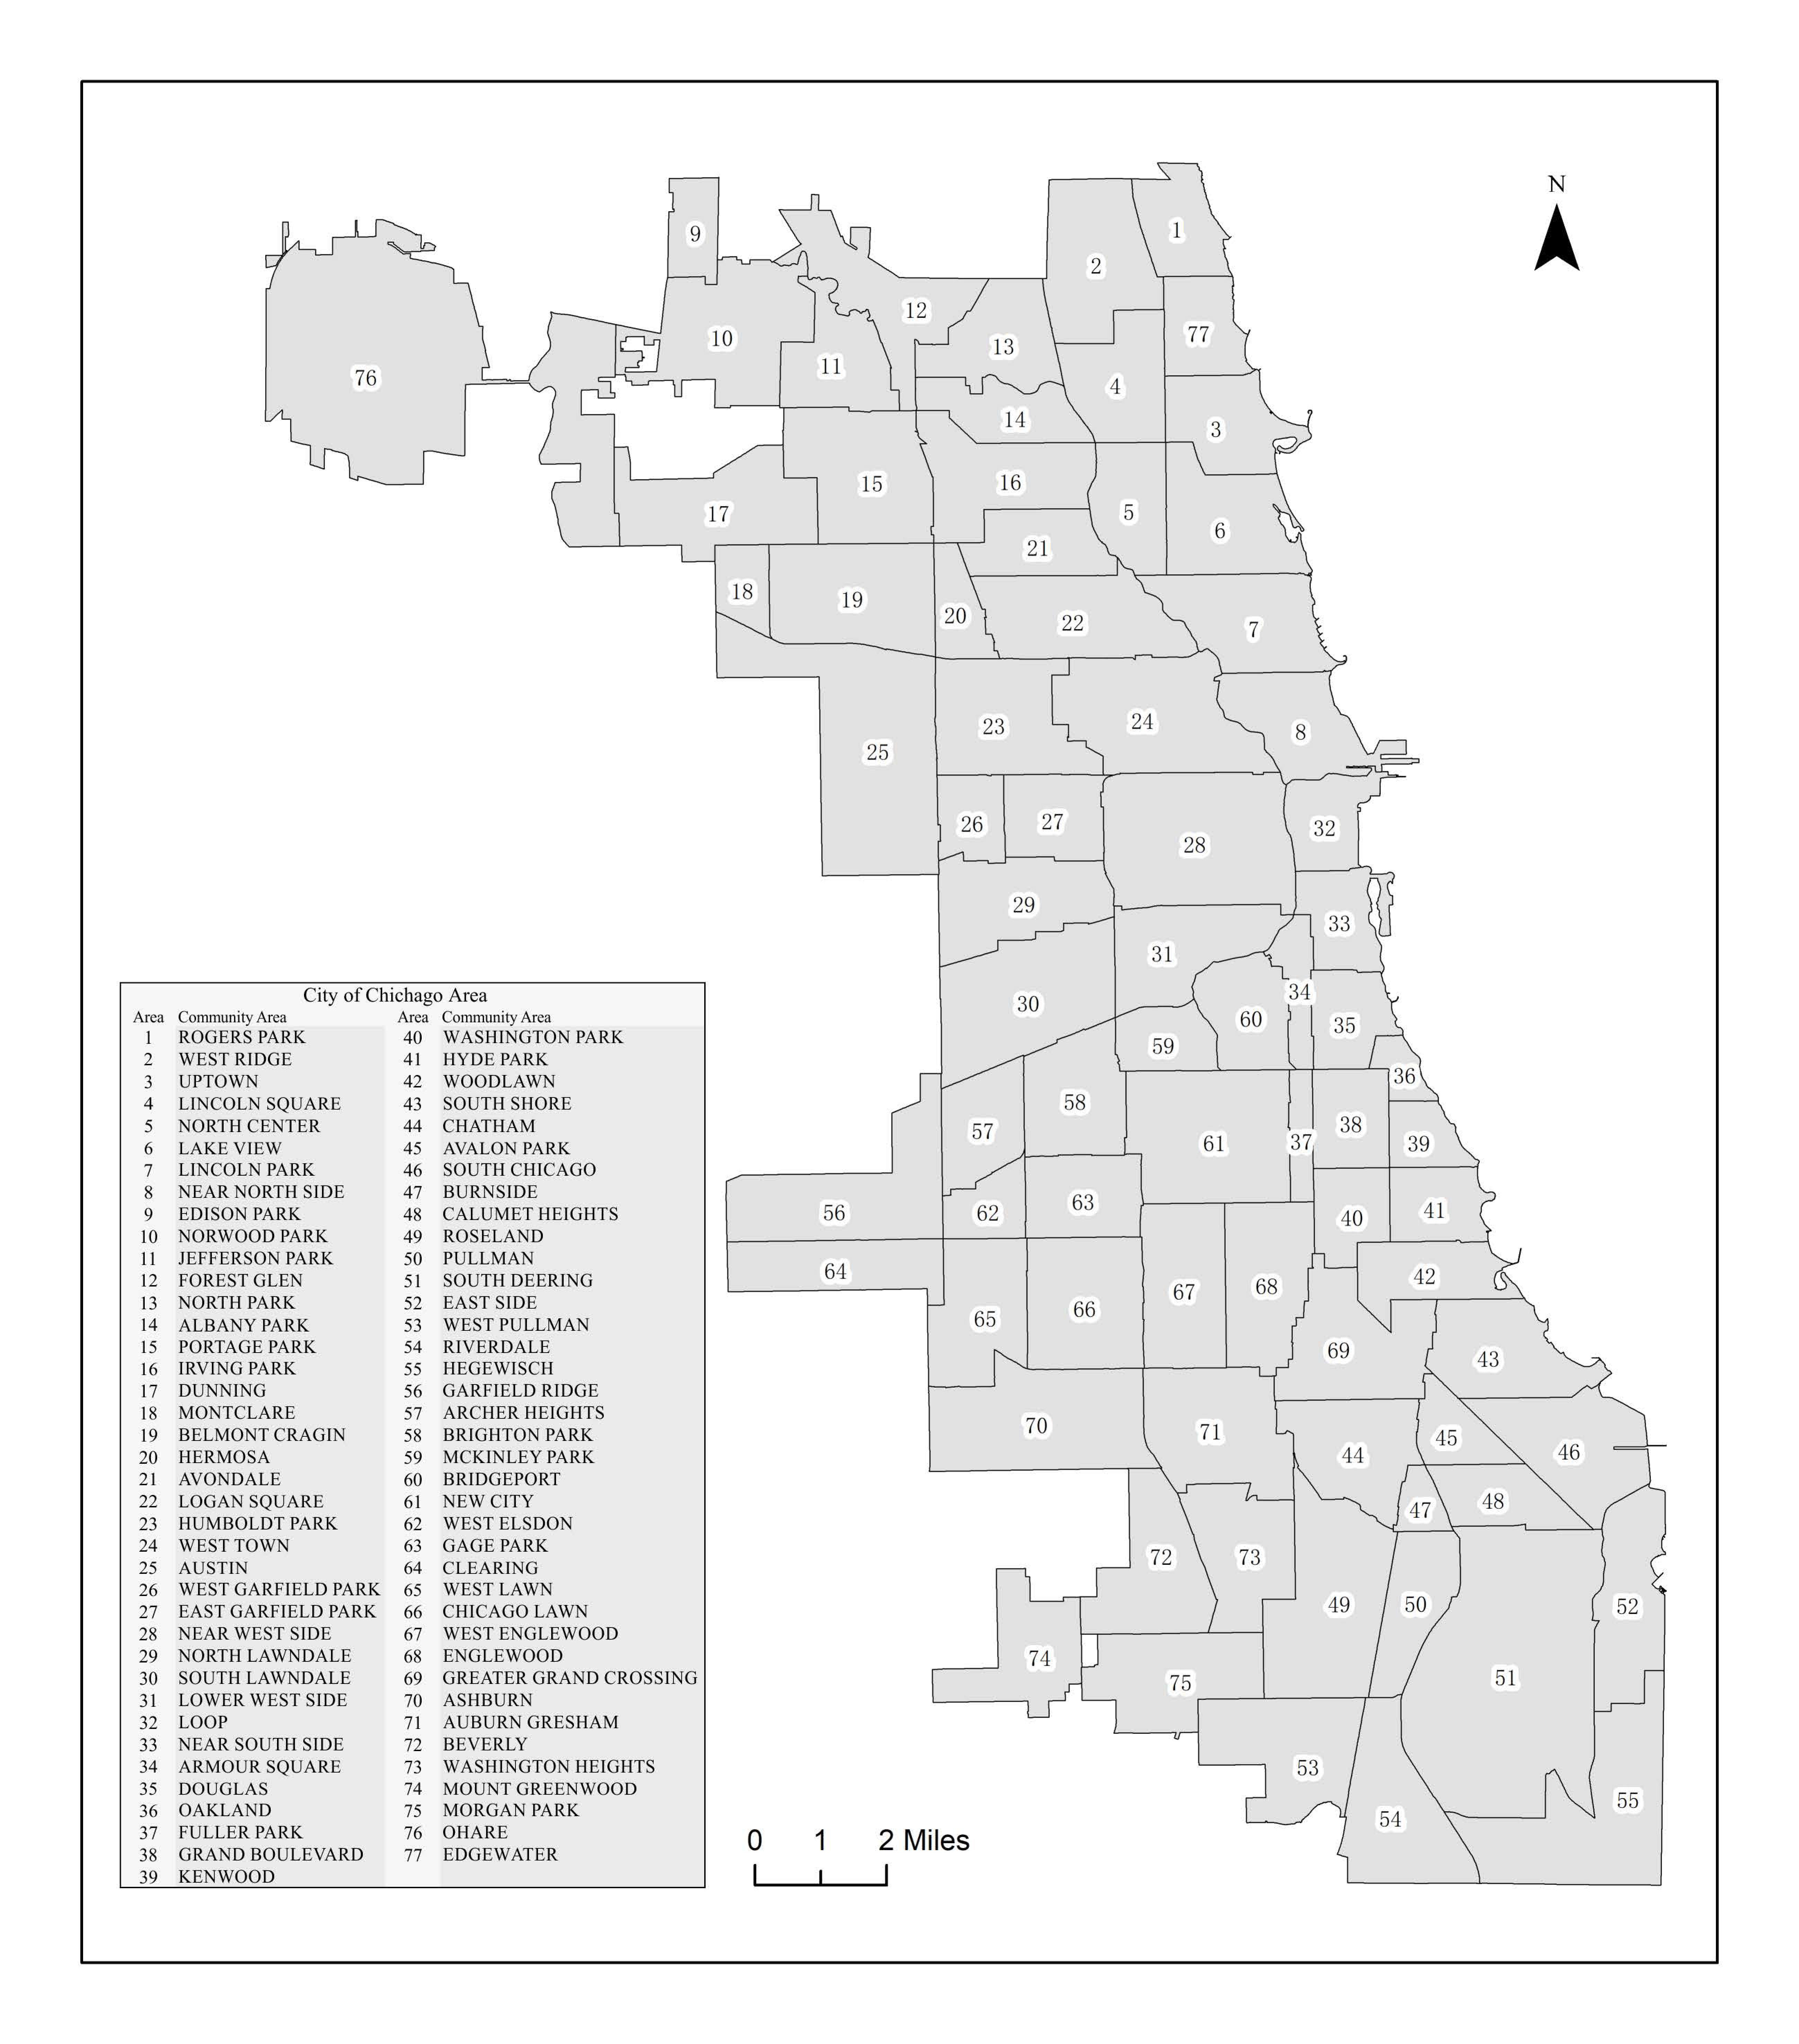
Chicago is the third-largest city in the United States, with a population of nearly 3 million. Chicago was divided into 77 community areas in Figure 2 by sociologists at the University of Chicago in the late 1920s. In Chicago, the first case of COVID-19 was reported on 24 January 2020. The total number of confirmed cases continued to increase and reached 53,956, of whom 2664 had died as of 30 June 2020. During this outbreak time, the government proposed the “Protecting Chicago” framework, which consisted of five phases: Strict Stay-at-Home, Stay-at-Home, Cautiously Reopen, Gradually Resume, and Protect. Among them, the Stay-at-Home order was issued on March 21 in 2020, and the Cautiously Reopen phase was instituted on May 31 in 2020 (as reported on the Chicago government homepage, https://www.chicago.gov/city/en/sites/covid-19/home.html, accessed on 9 March 2021). When the temporal distribution of crime changed drastically, we used those two time points to subdivide the trend of crimes in the analysis below.
There were 81,542 criminal cases in Chicago from February to June in 2020. Compared to the prepandemic year of 2019, total crime fell by 23.7%. Mohler et al. proposed that COVID-19 has different effects on various types of crime [6]. Campedelli et al. also found that there are interactions between different type crimes during the pandemic [3]. Therefore, we explored the spatial and temporal patterns of seven types of crime in Chicago, including theft, battery, criminal damage, assault, burglary, fraud, and robbery. Four of them were markedly reduced, per Table 1. Criminal damage and robbery did not change as much, just showing a slight decrease. However, burglary increased by 3.14% compared to 2019. In addition, crime data, community area data and census tract data in Chicago all came from the Chicago data portal (https://data.cityofchicago.org/, accessed on 9 March 2021). In the crime data, the location of the crime event is shifted from the actual location for partial redaction but falls on the same block. In this work, we aggregated the daily and hourly data for each type of crime in Chicago from February to June in 2020, 2019, 2018, 2017, and 2016, to offer the initial data for the Watson U2 test and STL decomposition. Moreover, we have transformed the crime data (.csv file) in Chicago to spatial point data, to offer the initial data for SPPT.

3.3. Methods

3.3.1. Time Series Decomposition

Some common temporal analysis approaches can be used for crime analysis, such as ITSA, Autoregressive integrated moving average (ARIMA) models, BSTS models, X11 decomposition, and Seasonal extraction in ARIMA time series (SEATS) decomposition. ITSA could be applied to access the effect of the policy on crime, based on the trends of crime before and after the point of the policy [8]. ARIMA models and BSTS models are often used for predicting the trend of crime in 2020 in the absence of the pandemic or some policies [3,7,33]. ITSA, ARIMA models, and BSTS models cannot identify the periodic variations or outliers of temporal distribution in crime. X11 decomposition and SEATS decomposition work only with quarterly and monthly data [34].
STL decomposition is a common algorithm in time series decomposition that uses locally weighted scatterplot smoothing (Loess) as a smoothing method [35]. It can identify different temporal trends, detect the outliers of crime events, and map the dynamics of events over time with high accuracy and resolution [36]. Moreover, STL decomposition can handle any type of seasonality. We can also control the smoothness of the trend-cycle in STL decomposition [34]. Therefore, we used STL decomposition to investigate temporal changes in crime from three dimensions.
To investigate the trend and periodic variations of different types of crimes from February to June 2020, we used STL decomposition to decompose the distribution of crimes ( Y v ) at each moment into the seasonal component ( S v ), trend component ( T v ), and remainder component ( R v ). Since the periodic fluctuation of crimes is relatively stable, the model used by STL is an additive model whose formula as follows:
Y v = S v + T v + R v   v = 1 , , N
The seasonal component represents the periodic variation of crimes in weeks from February to June 2020. After trend smoothing, the overall trend of crimes within five months is shown in the trend component. The number of crimes fluctuates around this trend. The remainder component is the random noise in the time series obtained by eliminating the seasonal component and trend component. It can reflect the robust outliers of crime events. In this work, STL decomposition was implemented by the “stl” function in R.

3.3.2. Spatial Point Pattern Test

SPPT was used to identify changes or differences in two different spatial point patterns based on the unit area [27], and SPPT GUI is an open source in the GitHub (https://github.com/nickmalleson/spatialtest, accessed on 6 March 2021). In this paper, we used SPPT to compare the similarity of spatial distribution patterns of crime in 2020 and 2019, 2018, 2017, and 2016 and investigated the local changes in crime on a micro scale, to explore whether the pandemic had affected the spatial distribution of crime. In addition, we took a small sample of crime date to compare tests results of SPPT based on three kinds spatial unit (community area, census tract, and block). The global S-index value of census tracts is larger than community areas. The global S-index value of blocks is the largest, yet it needs too much computing time. Therefore, we took the Chicago census tract as the unit area of SPPT.
There are three parameters of SPPT, which are number of iterations, sample size, and confidence interval. Number of iterations is the number of repeatedly sampling of test dataset. Sample size is the percent size of test dataset randomly sampling, and confidence interval based on test dataset is used to determine the similarity significance of the two samples. In this work, the number of iterations was 200, simple size was 85 percent, and the confidence interval was 95 percent. These values of three parameters have been used in some spatial analysis [27,37,38,39]. SPPT identifies the spatial point patterns that diverge in which areas and aggregates the similarities at the local level into a global index [39,40]. Taking the calculation of the global S-index of crimes in 2020 compared with 2019 as an example, the test can be described briefly as follows:
  • Adopt crimes in 2020 as the base dataset and crimes in 2019 as the test dataset (the test detects spatial pattern variations of base dataset relative to test dataset).
  • Randomly sample 85% of the test dataset 200 times, and then calculate the percentage of crimes in census tracts to generate a 95% confidence interval; and
  • Determine whether the percentage of the basic data in the census tracts falls into the confidence interval, obtain the value of the local S-index, and calculate the global S-index.
There are two important values. One of them is the global S-index (the index of similarity), which is often used to confirm the similar degree of two spatial point patterns. Another is the local index, which is applied to identify statistically significant changes on the micro scale (local changes). The local S-index has three values (−1, 0, 1), which means the base dataset is lower than, similar, or higher than the test dataset in a spatial unit respectively. The global S-index value is the count of the local S-index which equal zero, and then divide the number of all spatial units. The value of the global S-index ranges from 0 (no similarity) to 1 (perfect similarity), and 0.80 is used as the threshold to indicate that two spatial point patterns are similar [23]. Furthermore, we used Moran’s I to explore the spatial autocorrelation of local changes to observe the impact of the epidemic on local areas.

4. Results and Analysis

4.1. Results

4.1.1. Criminal Temporal Patterns under the Effect of COVID-19

After aggregating the daily and hourly crimes from February to June in 2019 and 2020, this work used Watson’s U2 test [41] to detect whether the temporal distributions (taking the day or hour as a unit) of different crimes are similar in these two years. The test is often used to assess the similarity between each pair of samples and specifically suited to circular distributions [42]. The results of Watson’s U2 test included two parameters: one was the statistical value and the other was the p-value (statistical significance). When the p-value is smaller than 0.001 and statistical values are greater than 0.5, two distributions were significantly different; when the p-value is greater than 0.01 and statistical values are less than 0.2, two distributions were likely similar [43].
In the temporal distribution (day), the p-values of five crime types, excluding battery and fraud, were all less than 0.001, and the statistical values are greater than 0.5, indicating that their temporal distributions in 2020 are significantly different from those in 2019 in Table 2. We also tested the similarity degree of temporal distributions (day) of crime between 2019 and 2018, and found that the p-values for theft, assault, criminal damage, battery, and fraud were all greater than 0.001. This result proved that the temporal distributions (day) of crime had major changes during the COVID-19. Meantime, the p-values of seven type crimes are far greater than 0.01, and the statistical values are far less than 0.2 in the temporal distribution (h). Therefore, it reveals that the impacts of the COVID-19 on some crimes were significant at the scale of days, while the impacts of the COVID-19 for crimes were slight at the scale of hours.
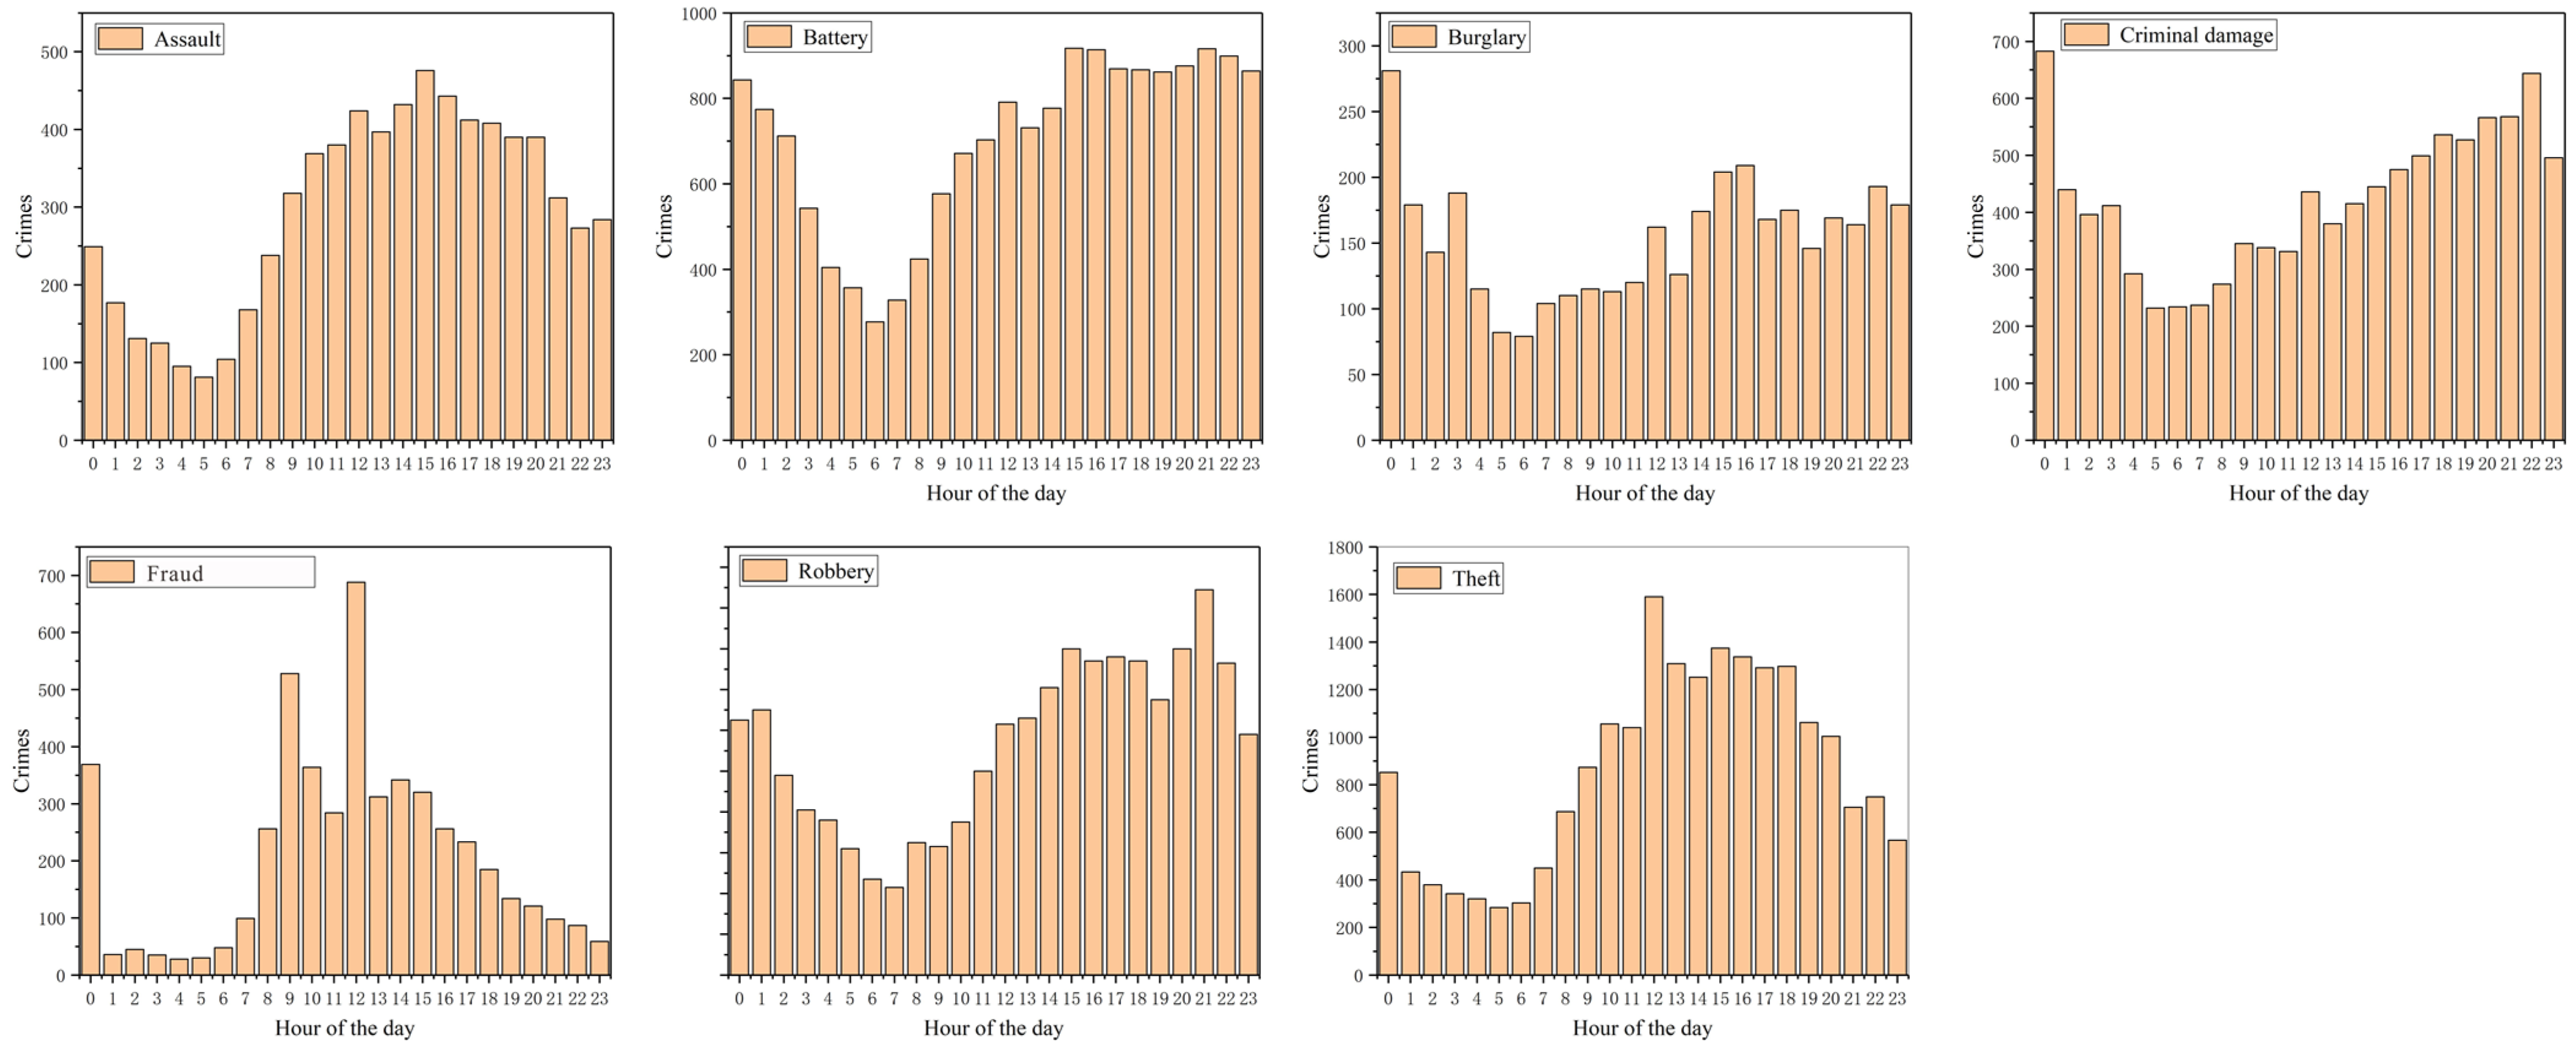
The results of Watson’s U2 test in Table 2 suggest that the temporal distribution (h) of crime changed slightly compared with previous years. We examined daily distributions of different crimes in 2020 to explore the characteristics of temporal patterns in a day. The numbers of different crimes significantly decreased in the period from 5 am to 6 am (Figure 3). The distributions of theft and assault showed a similar pattern in which the number of incidents was sustained at high levels from 12 pm to 8 pm. The number of batteries and robberies was high from approximately 3 pm until midnight, whereas the number of frauds was low at night, high at noon. The number of criminal damages and burglaries were mainly aggregated in the middle of the night. Most of crime incidents occurred at noon and night to coincide with the distribution of crime before the pandemic.
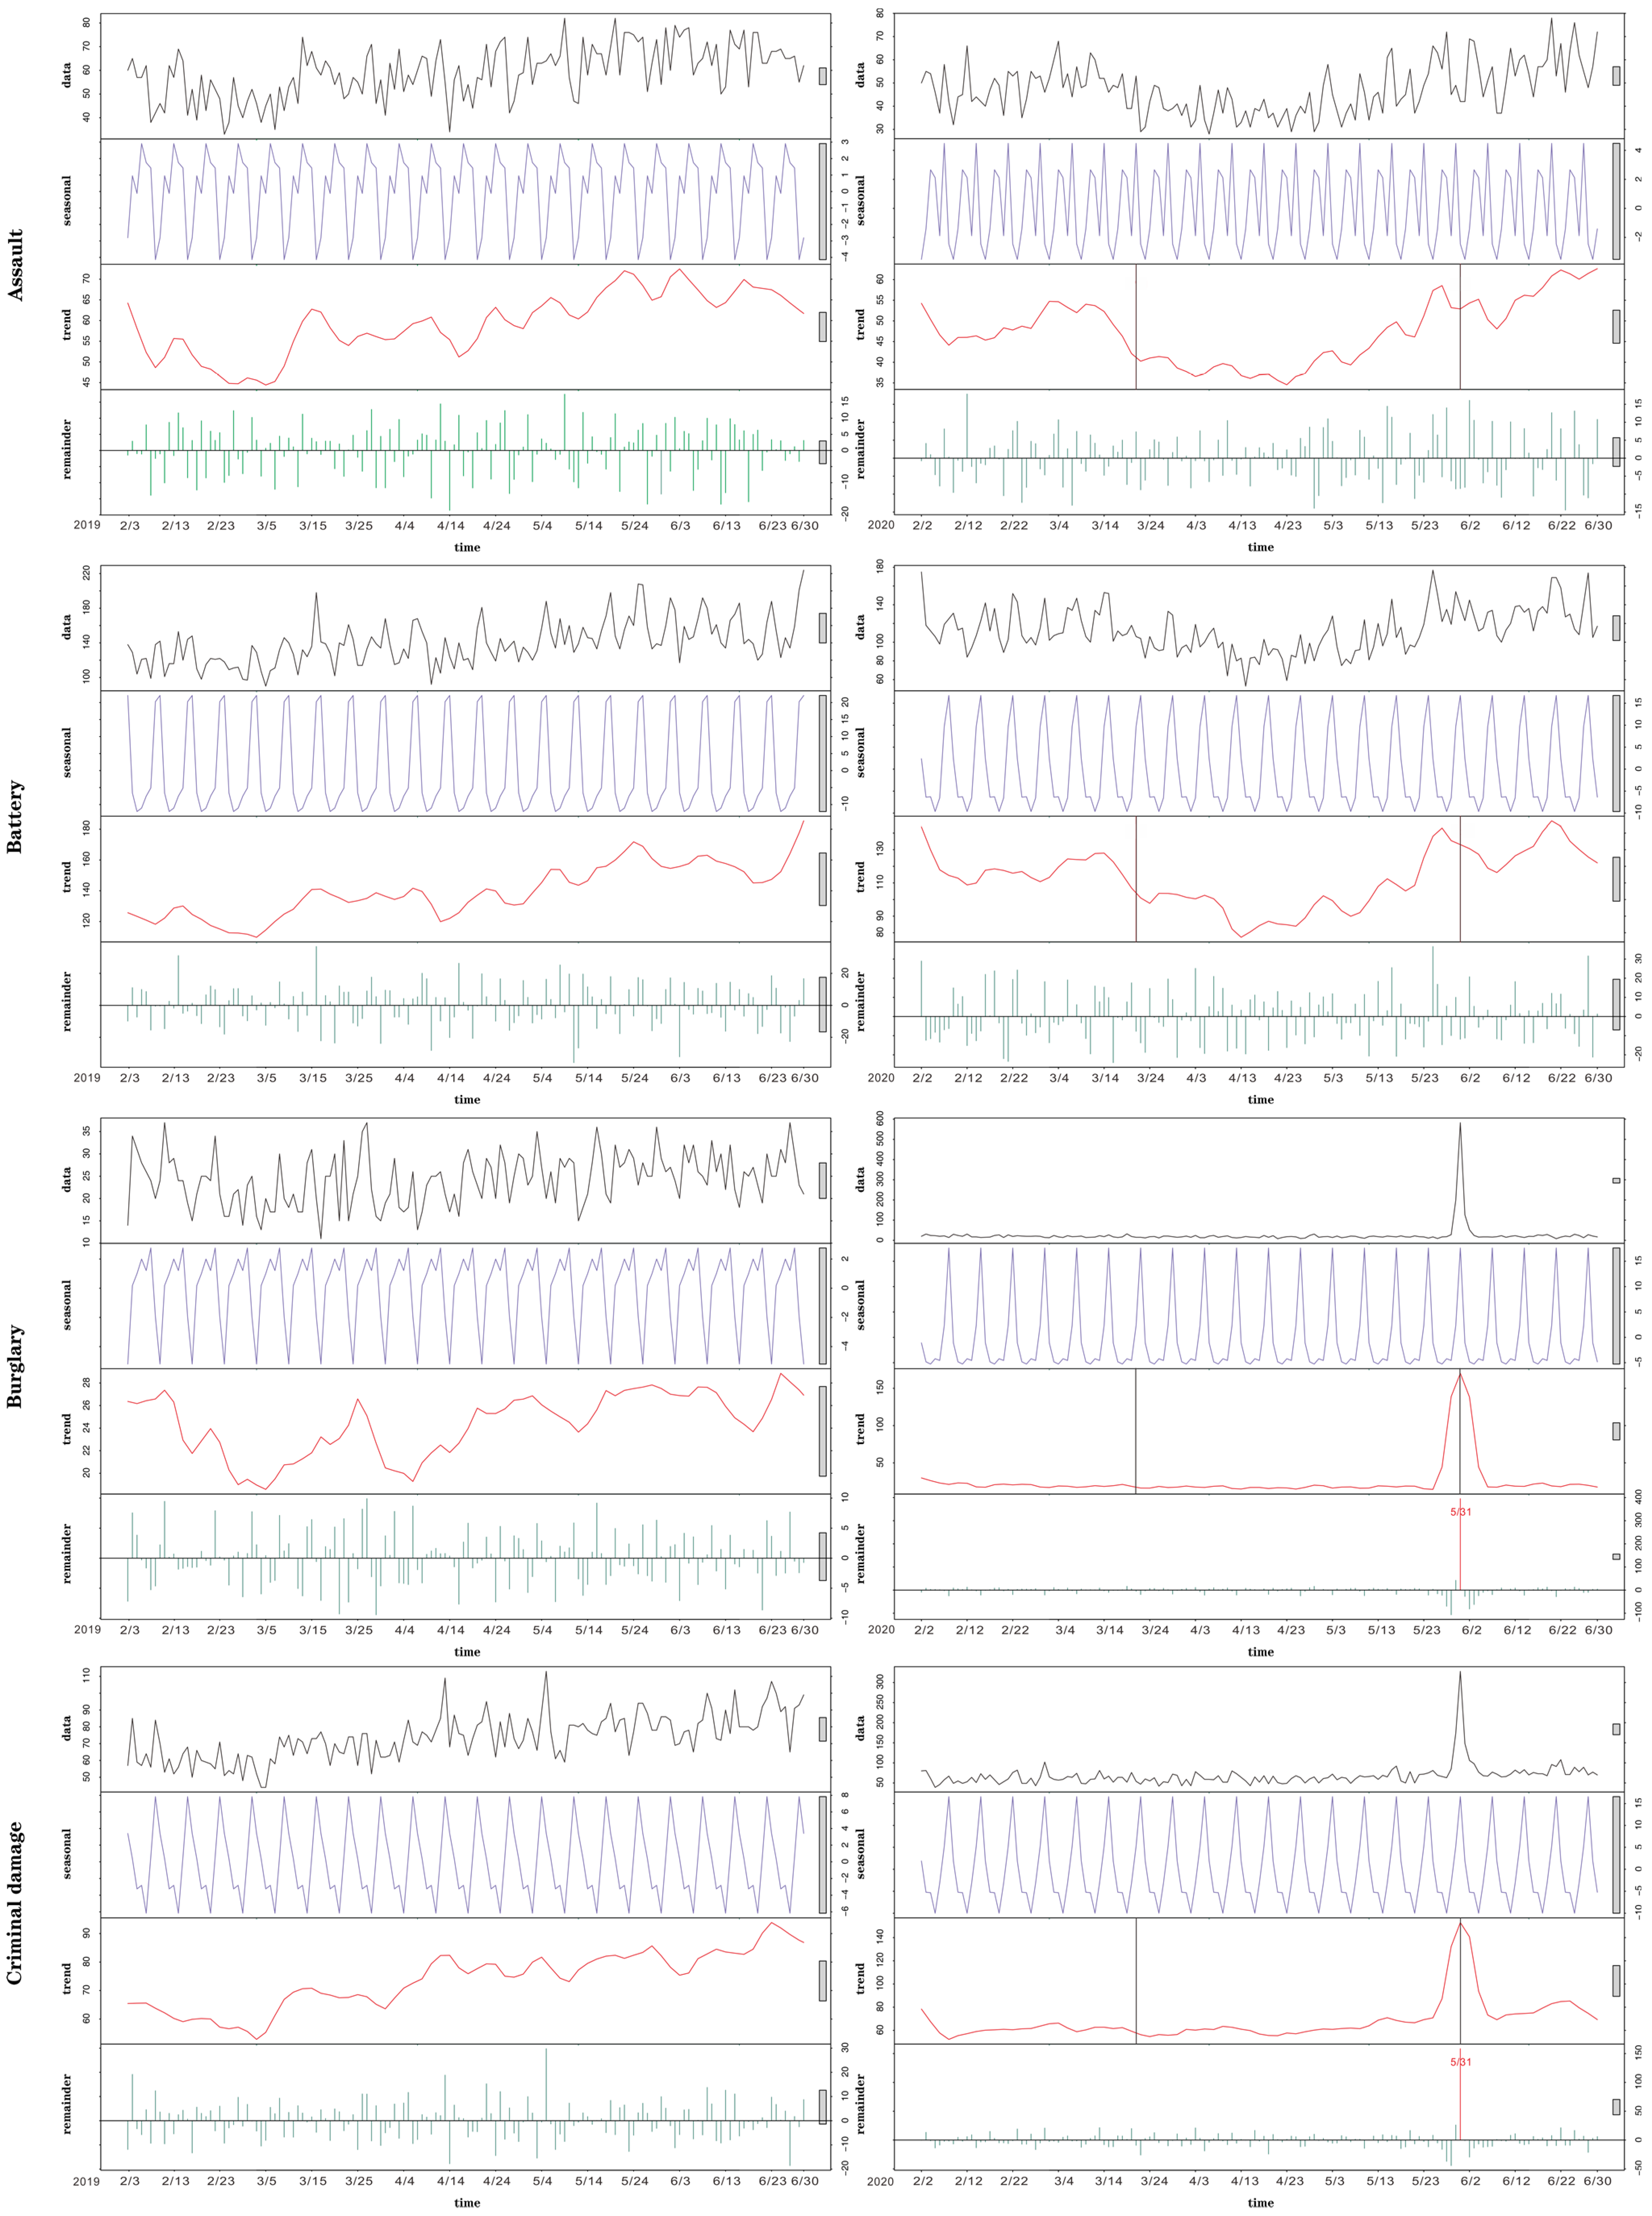
To analyze the changes in the temporal patterns of crimes, this work used STL to decompose temporal crime data from February to June in both 2019 and 2020. We set the number of a seasonal cycle to seven observations to capture the weekly periodicity. Then, we made a comparison of the temporal patterns between 2019 and 2020 in three dimensions: the trend, the seasonal, and the remainder components.
According to the results of STL in Figure 4, the trend components showed the overall trends of crime in 2019 (left figure) and 2020 (right figure) were different. Compared to trends of growth of the main criminal types in 2019, crimes of theft, battery, assault, and robbery in 2020 decreased first and then increased. The trend of fraud reduced in stages, and trends of burglary and criminal damage were smooth, except a dramatically increased crest in early June 2020. We used black vertical lines to subdivide the trend component in Figure 4 into three stages, based on the time of two policies issued in the “Protecting Chicago” framework. The first black vertical line is on 21 March (when the Stay-at-Home issued), and the second vertical line is on 31 May (when the Cautiously Reopen issued). It showed a high-low-high phase pattern in assault, battery, robbery, and theft, and a high-low-low phase pattern in fraud. In the remainder components, we found that most types of crime had the largest outliers on 31 May 2020, such as theft, criminal damage, burglary, and robbery. Outliers of assault and battery were also large around 31 May 2020, while there were no similar characteristics of seven-types crime’s outliers in 2019. The occurrence of this phenomenon was closely related to the breaking of the George Floyd protests. For the seasonal component, Figure 4 shows the periodic variations of most crime types in 2020 were different from those in 2019, except for assault and criminal damage.
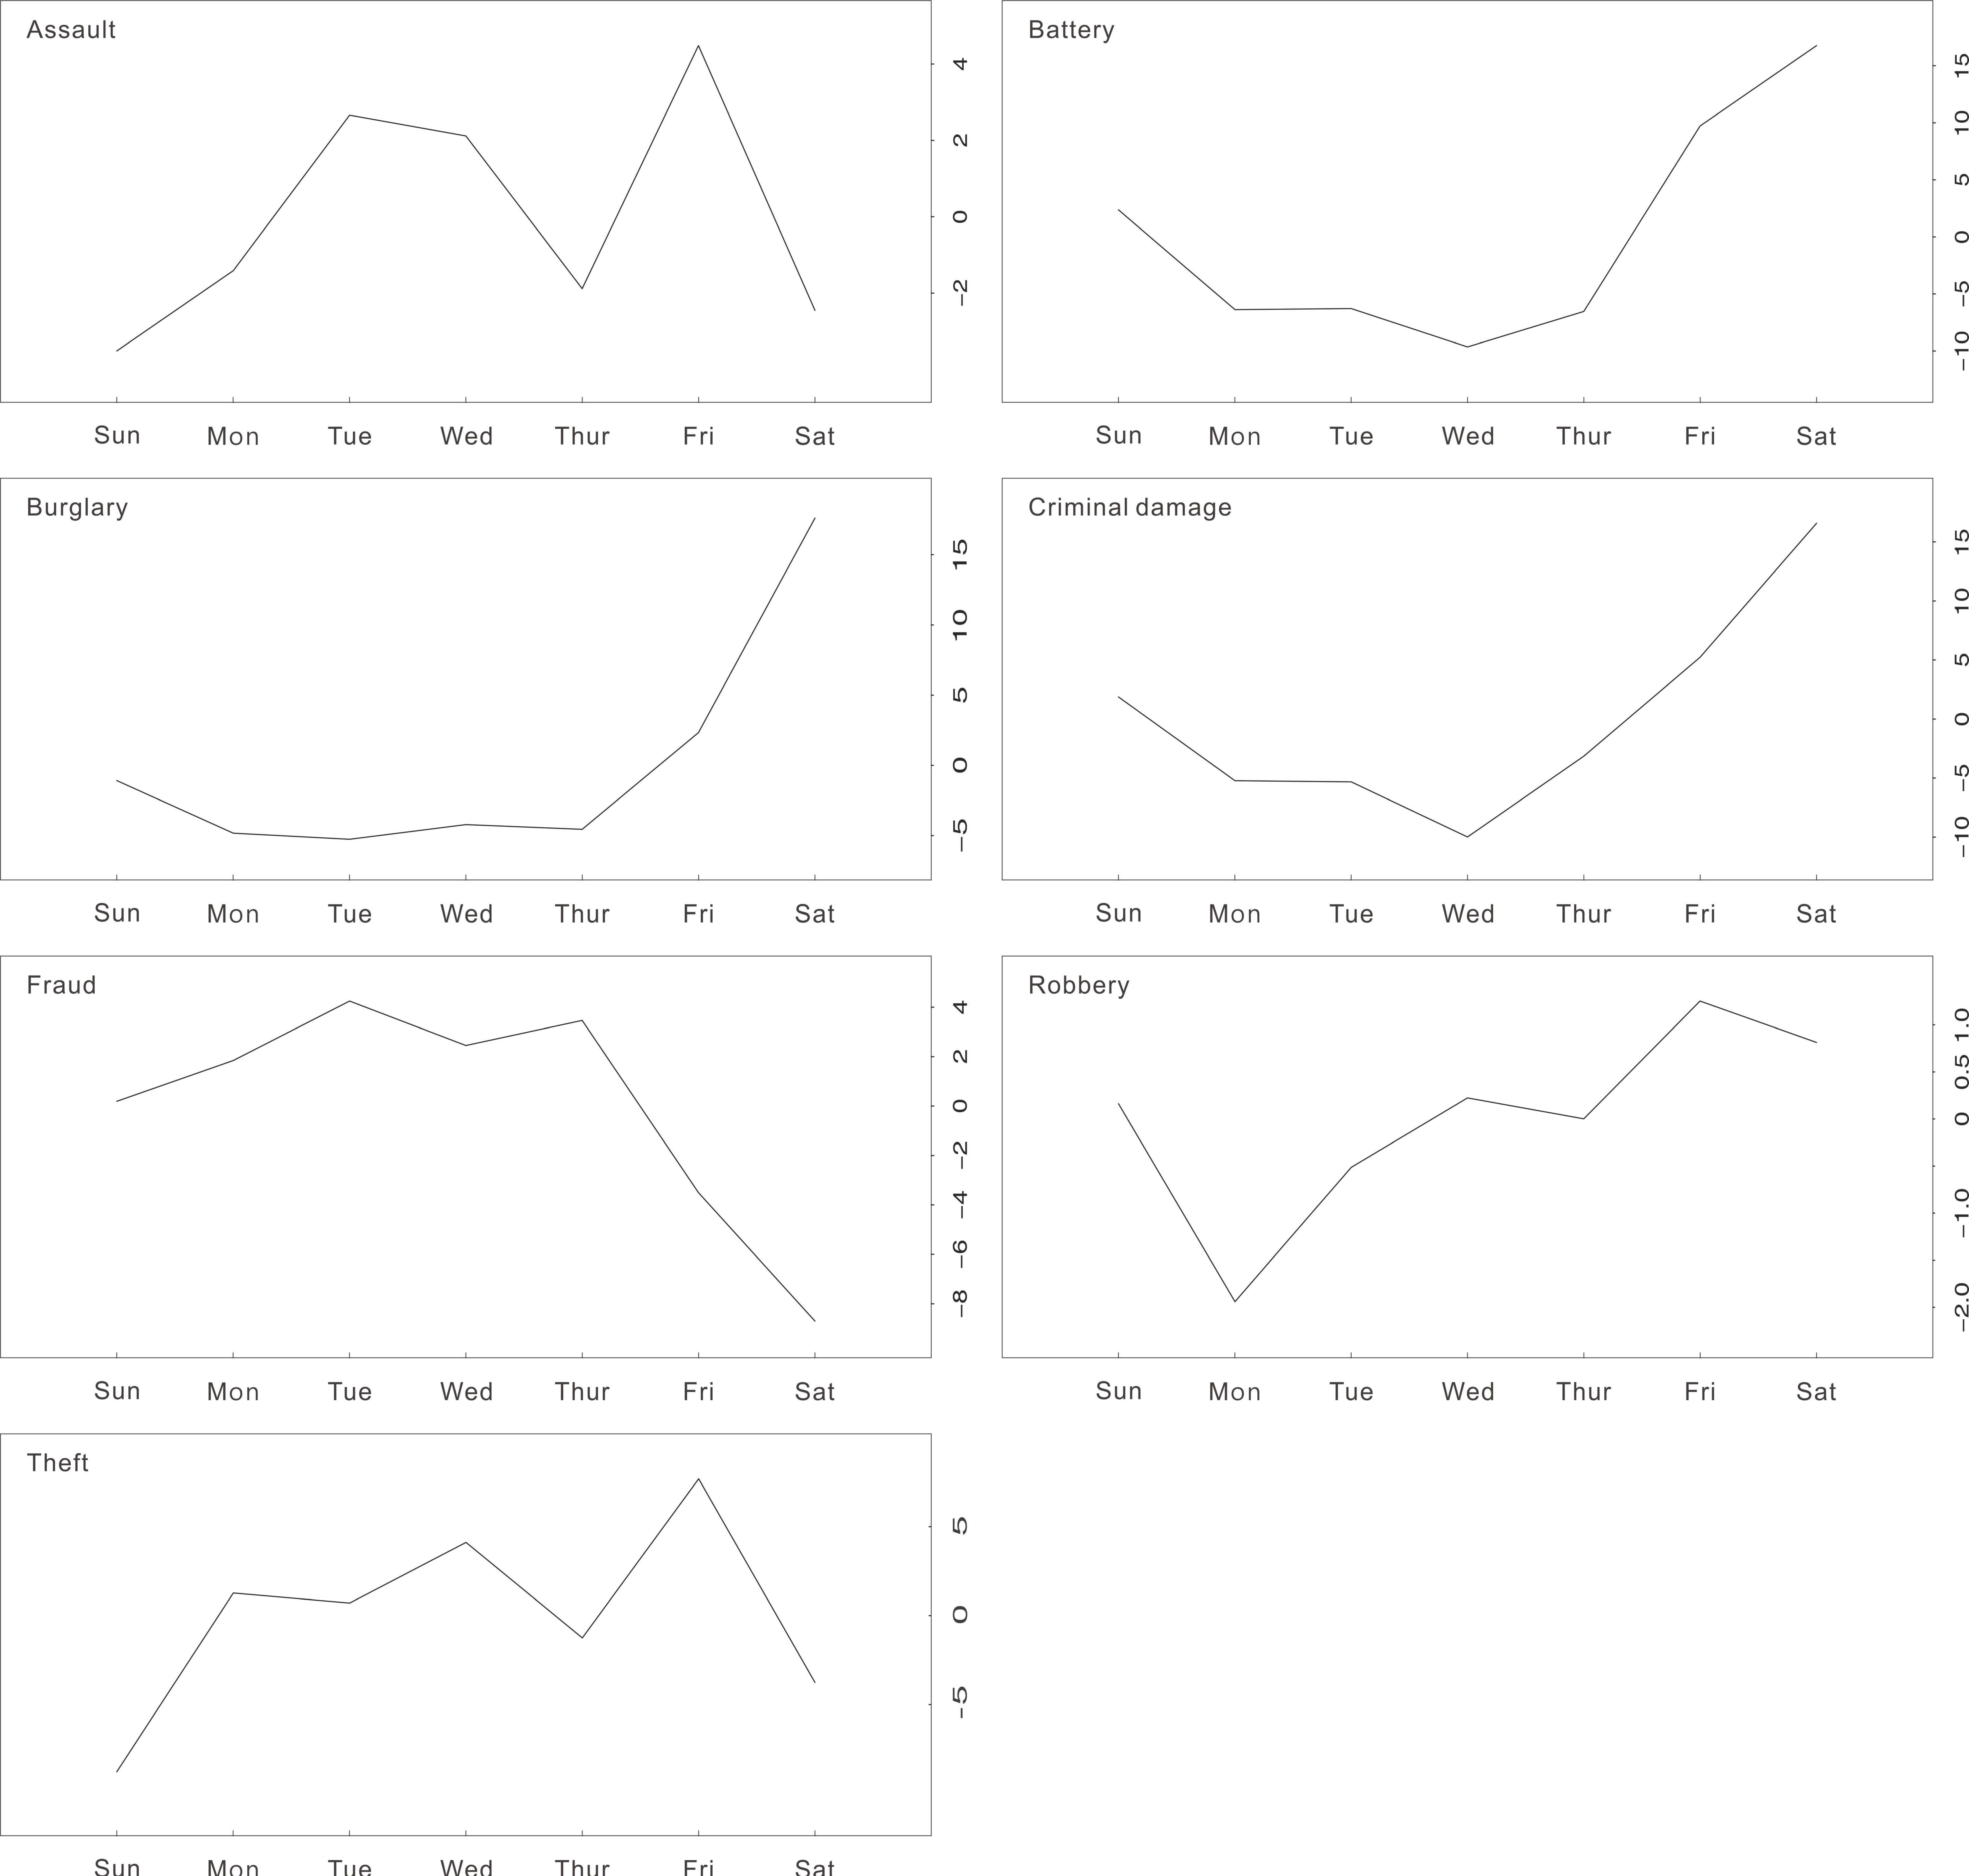
To carefully identify the periodic variations of crimes, we captured the seasonal distribution of seven types of crime during a week in Figure 4 (right). It showed that battery, criminal damage, and burglary types tend to reach a peak on Saturday, while other days are relatively stable (Figure 5). Assault has two peaks on Tuesday and Friday, theft has two peaks on Wednesday and Friday, and fraud has a minimum on Saturday. Robbery tends to peak on Friday and fall to a trough on Monday. According to the characteristics of weekly distributions and daily distribution (Figure 3) in crimes, the police department should pay more attention to several specific types of crime in different period units.

4.1.2. Criminal Spatial Patterns under the Effect of COVID-19

After the SPPT test, we found that the global S-index values were all less than 0.8 in Table A1 (shown in Appendix A). These values are low between 2019 (base dataset) and 2018 (test dataset), similar to the values between 2020 (base dataset) and 2019 (test dataset). The global S-index values described that the trend of the spatial distribution of crimes is not stable and usually changes greatly every year. We cannot determine whether the COVID-19 pandemic has impacted the spatial distributions of crimes with the global S-index values. However, results of the local S-index showed that changes in some local areas are relatively stable. Andresen et al. observed the spatial characteristics of crimes based on local changes and proved the importance of smaller spatial units of analysis prior to our research [39,40]. Thus, we investigated the variation of crimes in local spatial units in the follow part.
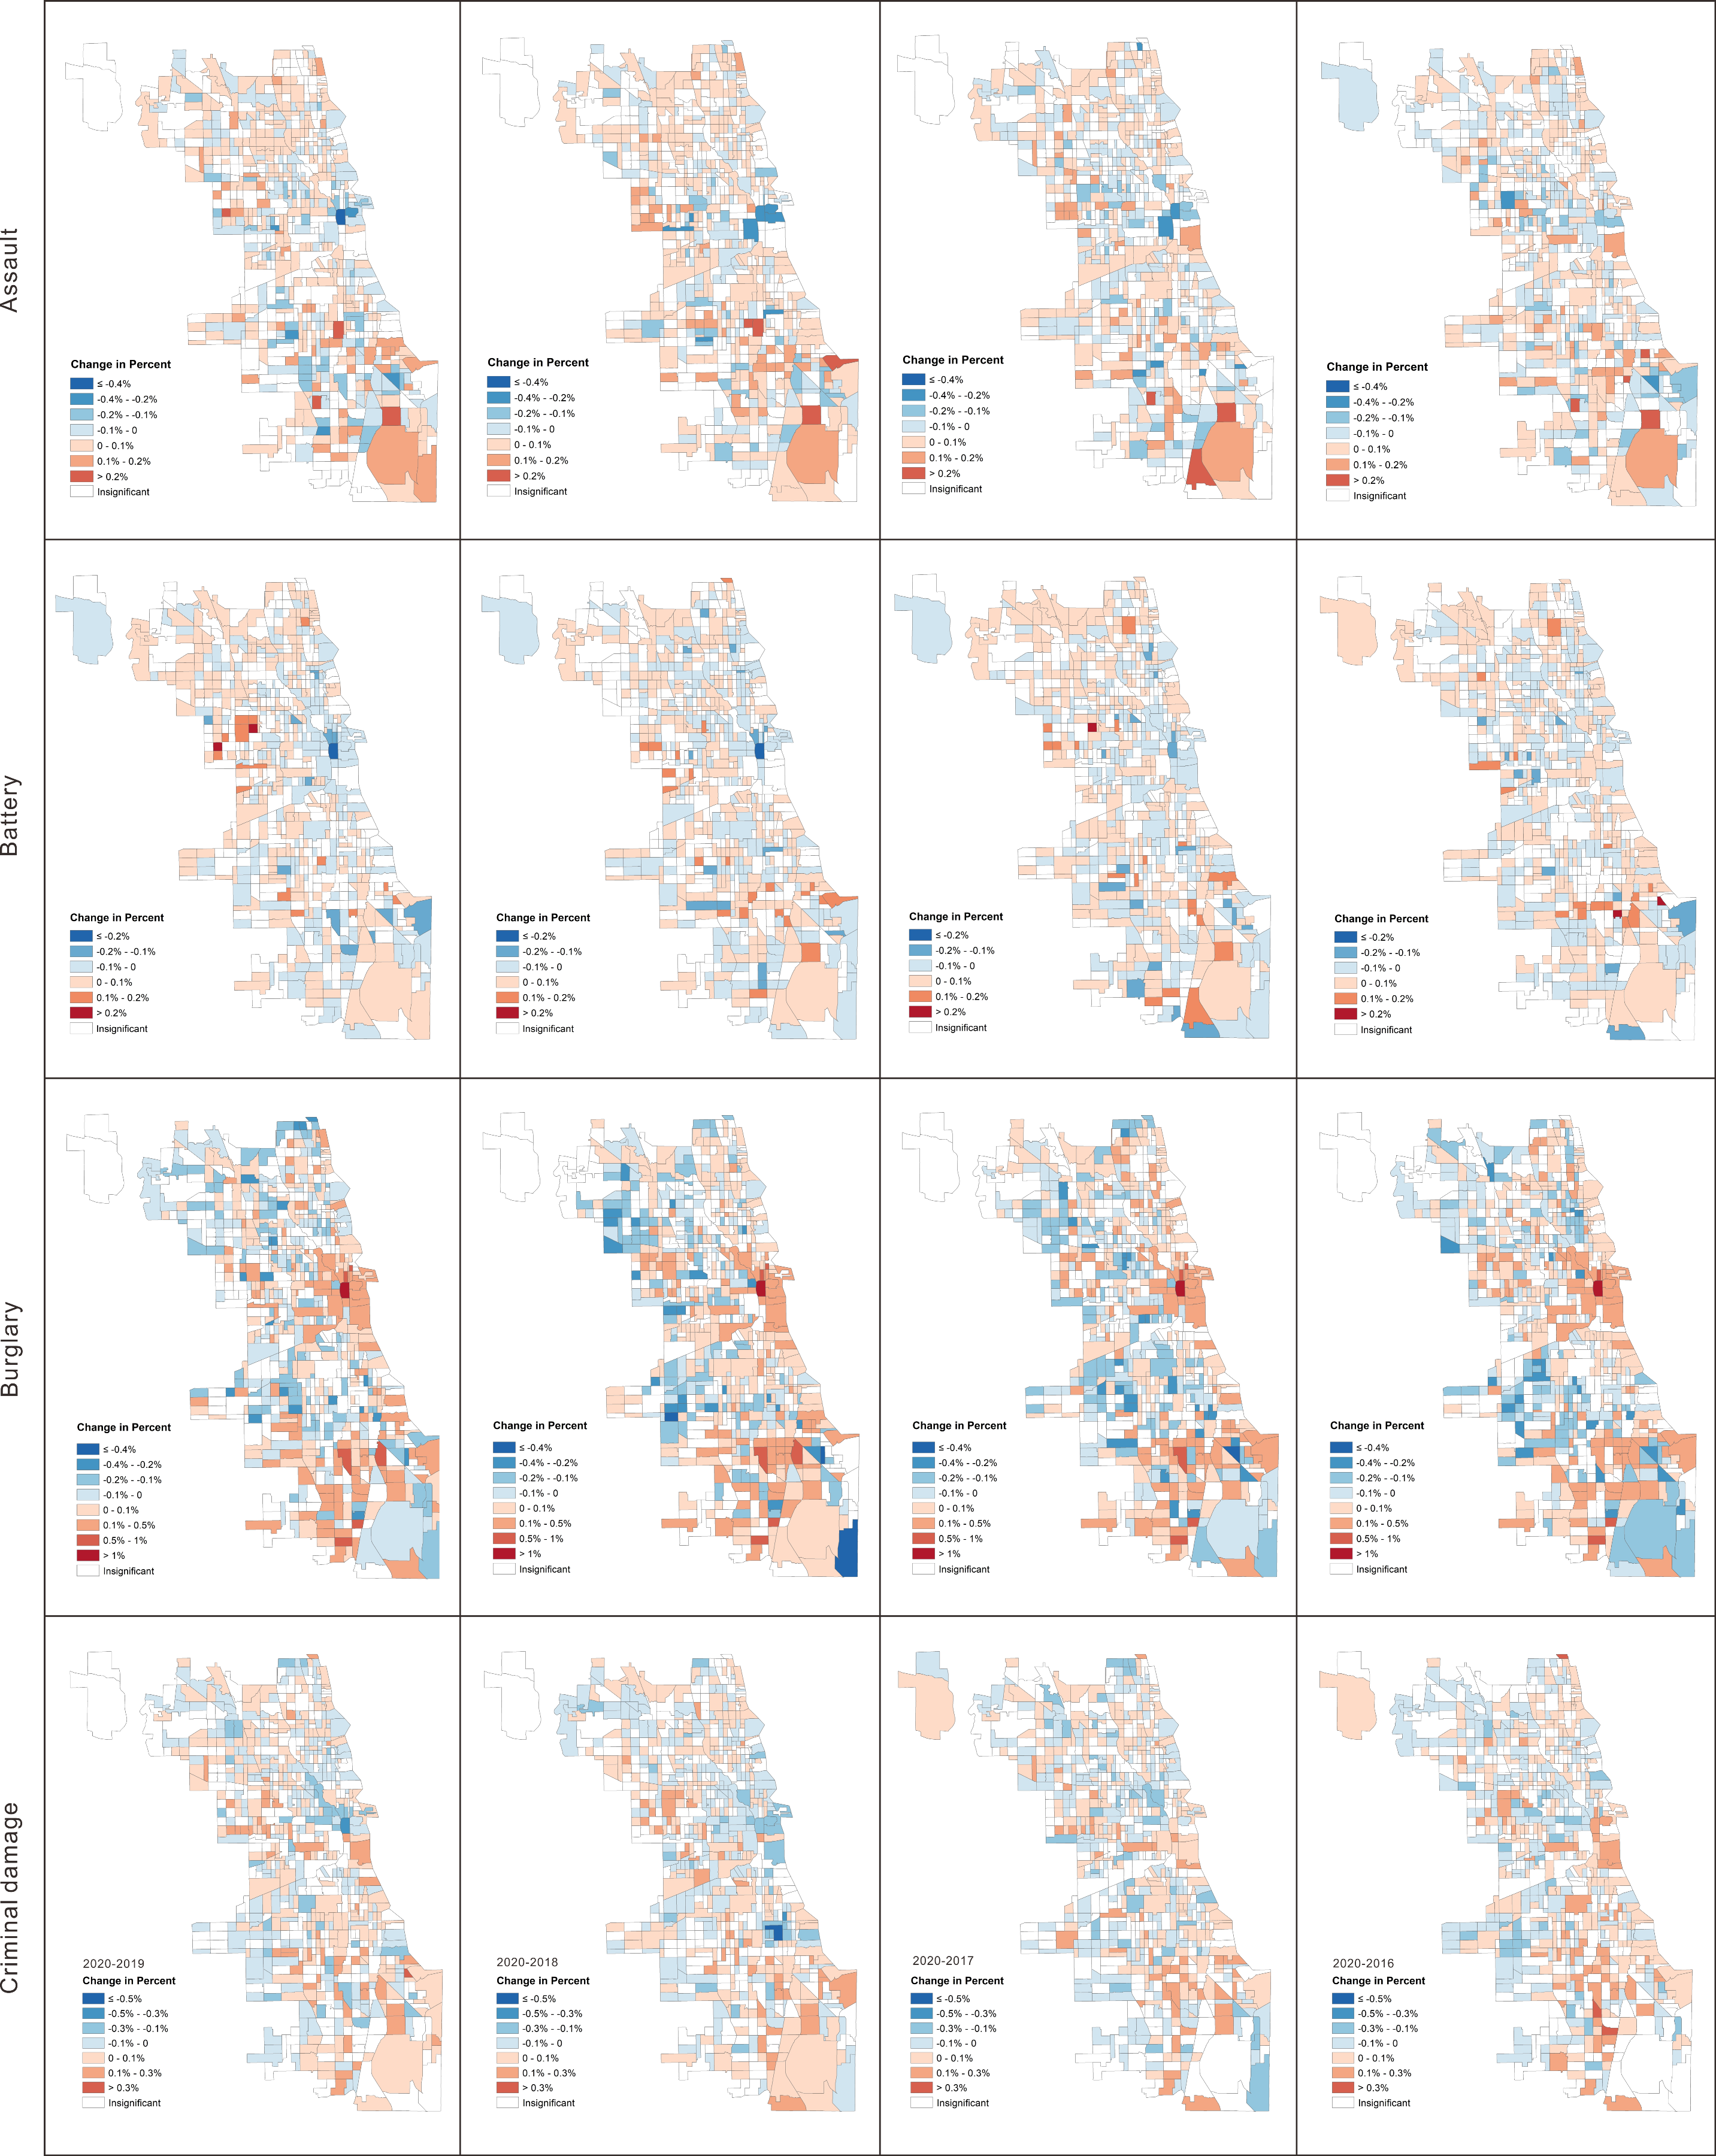
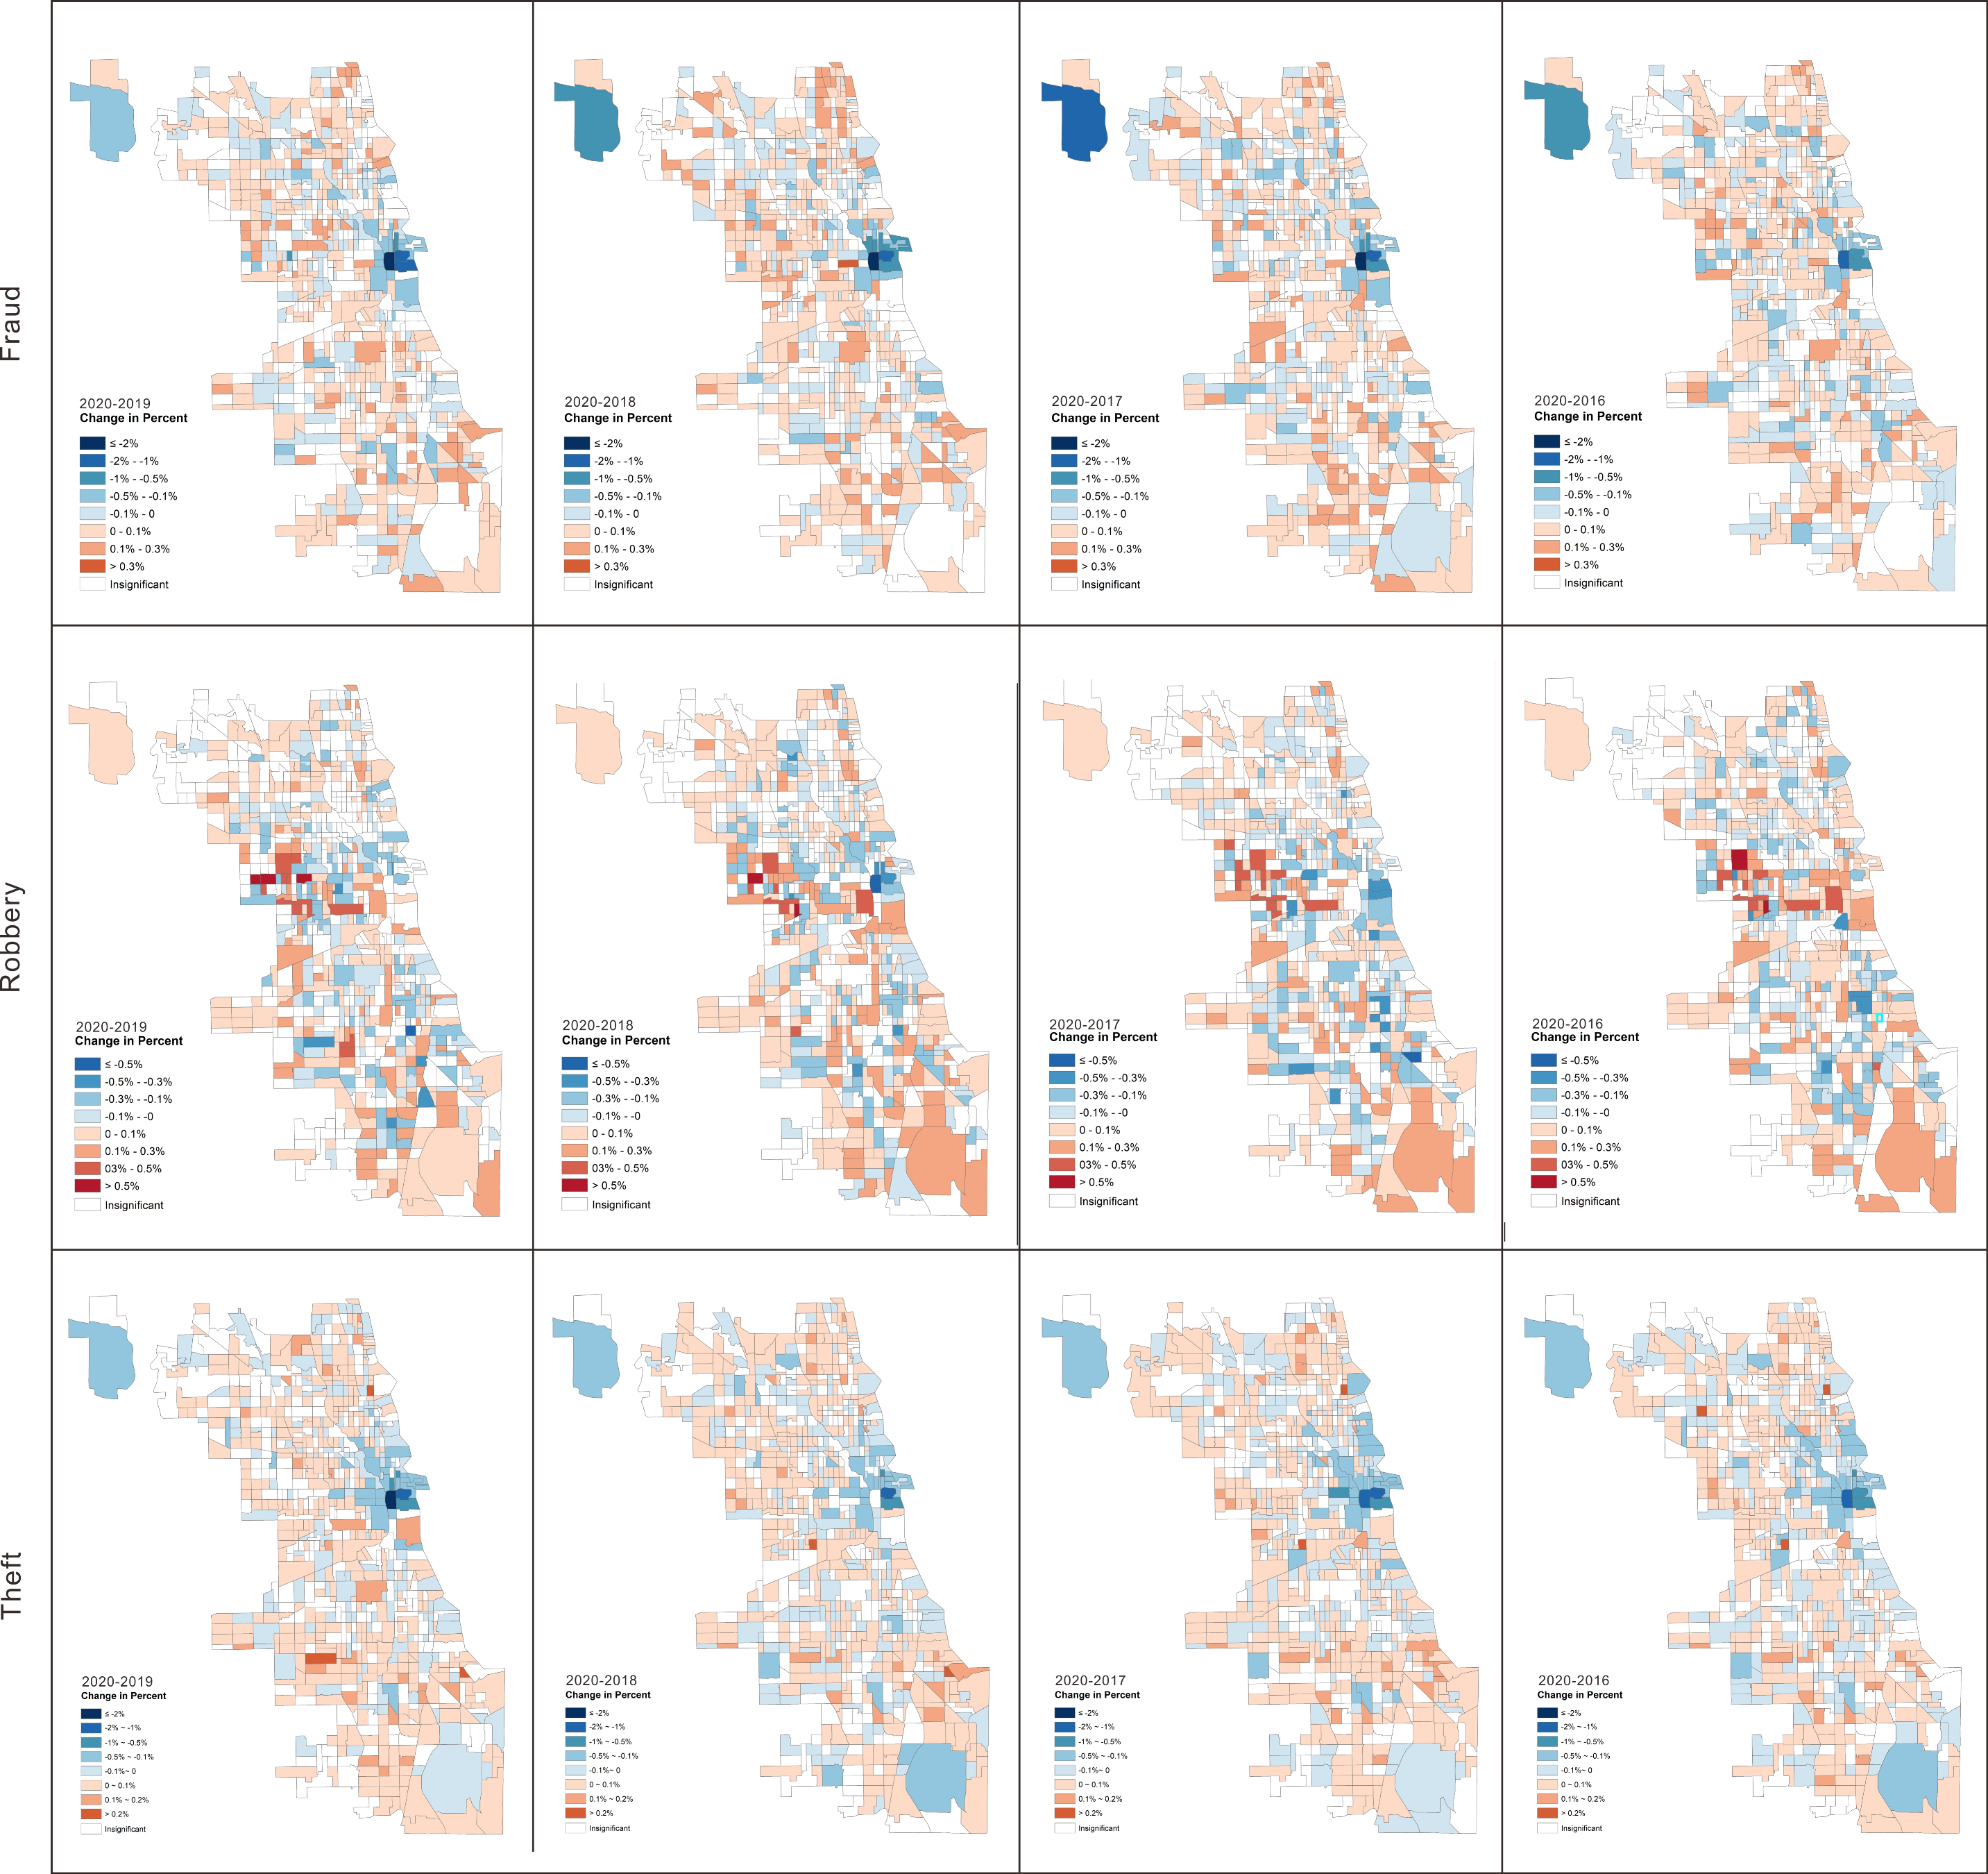
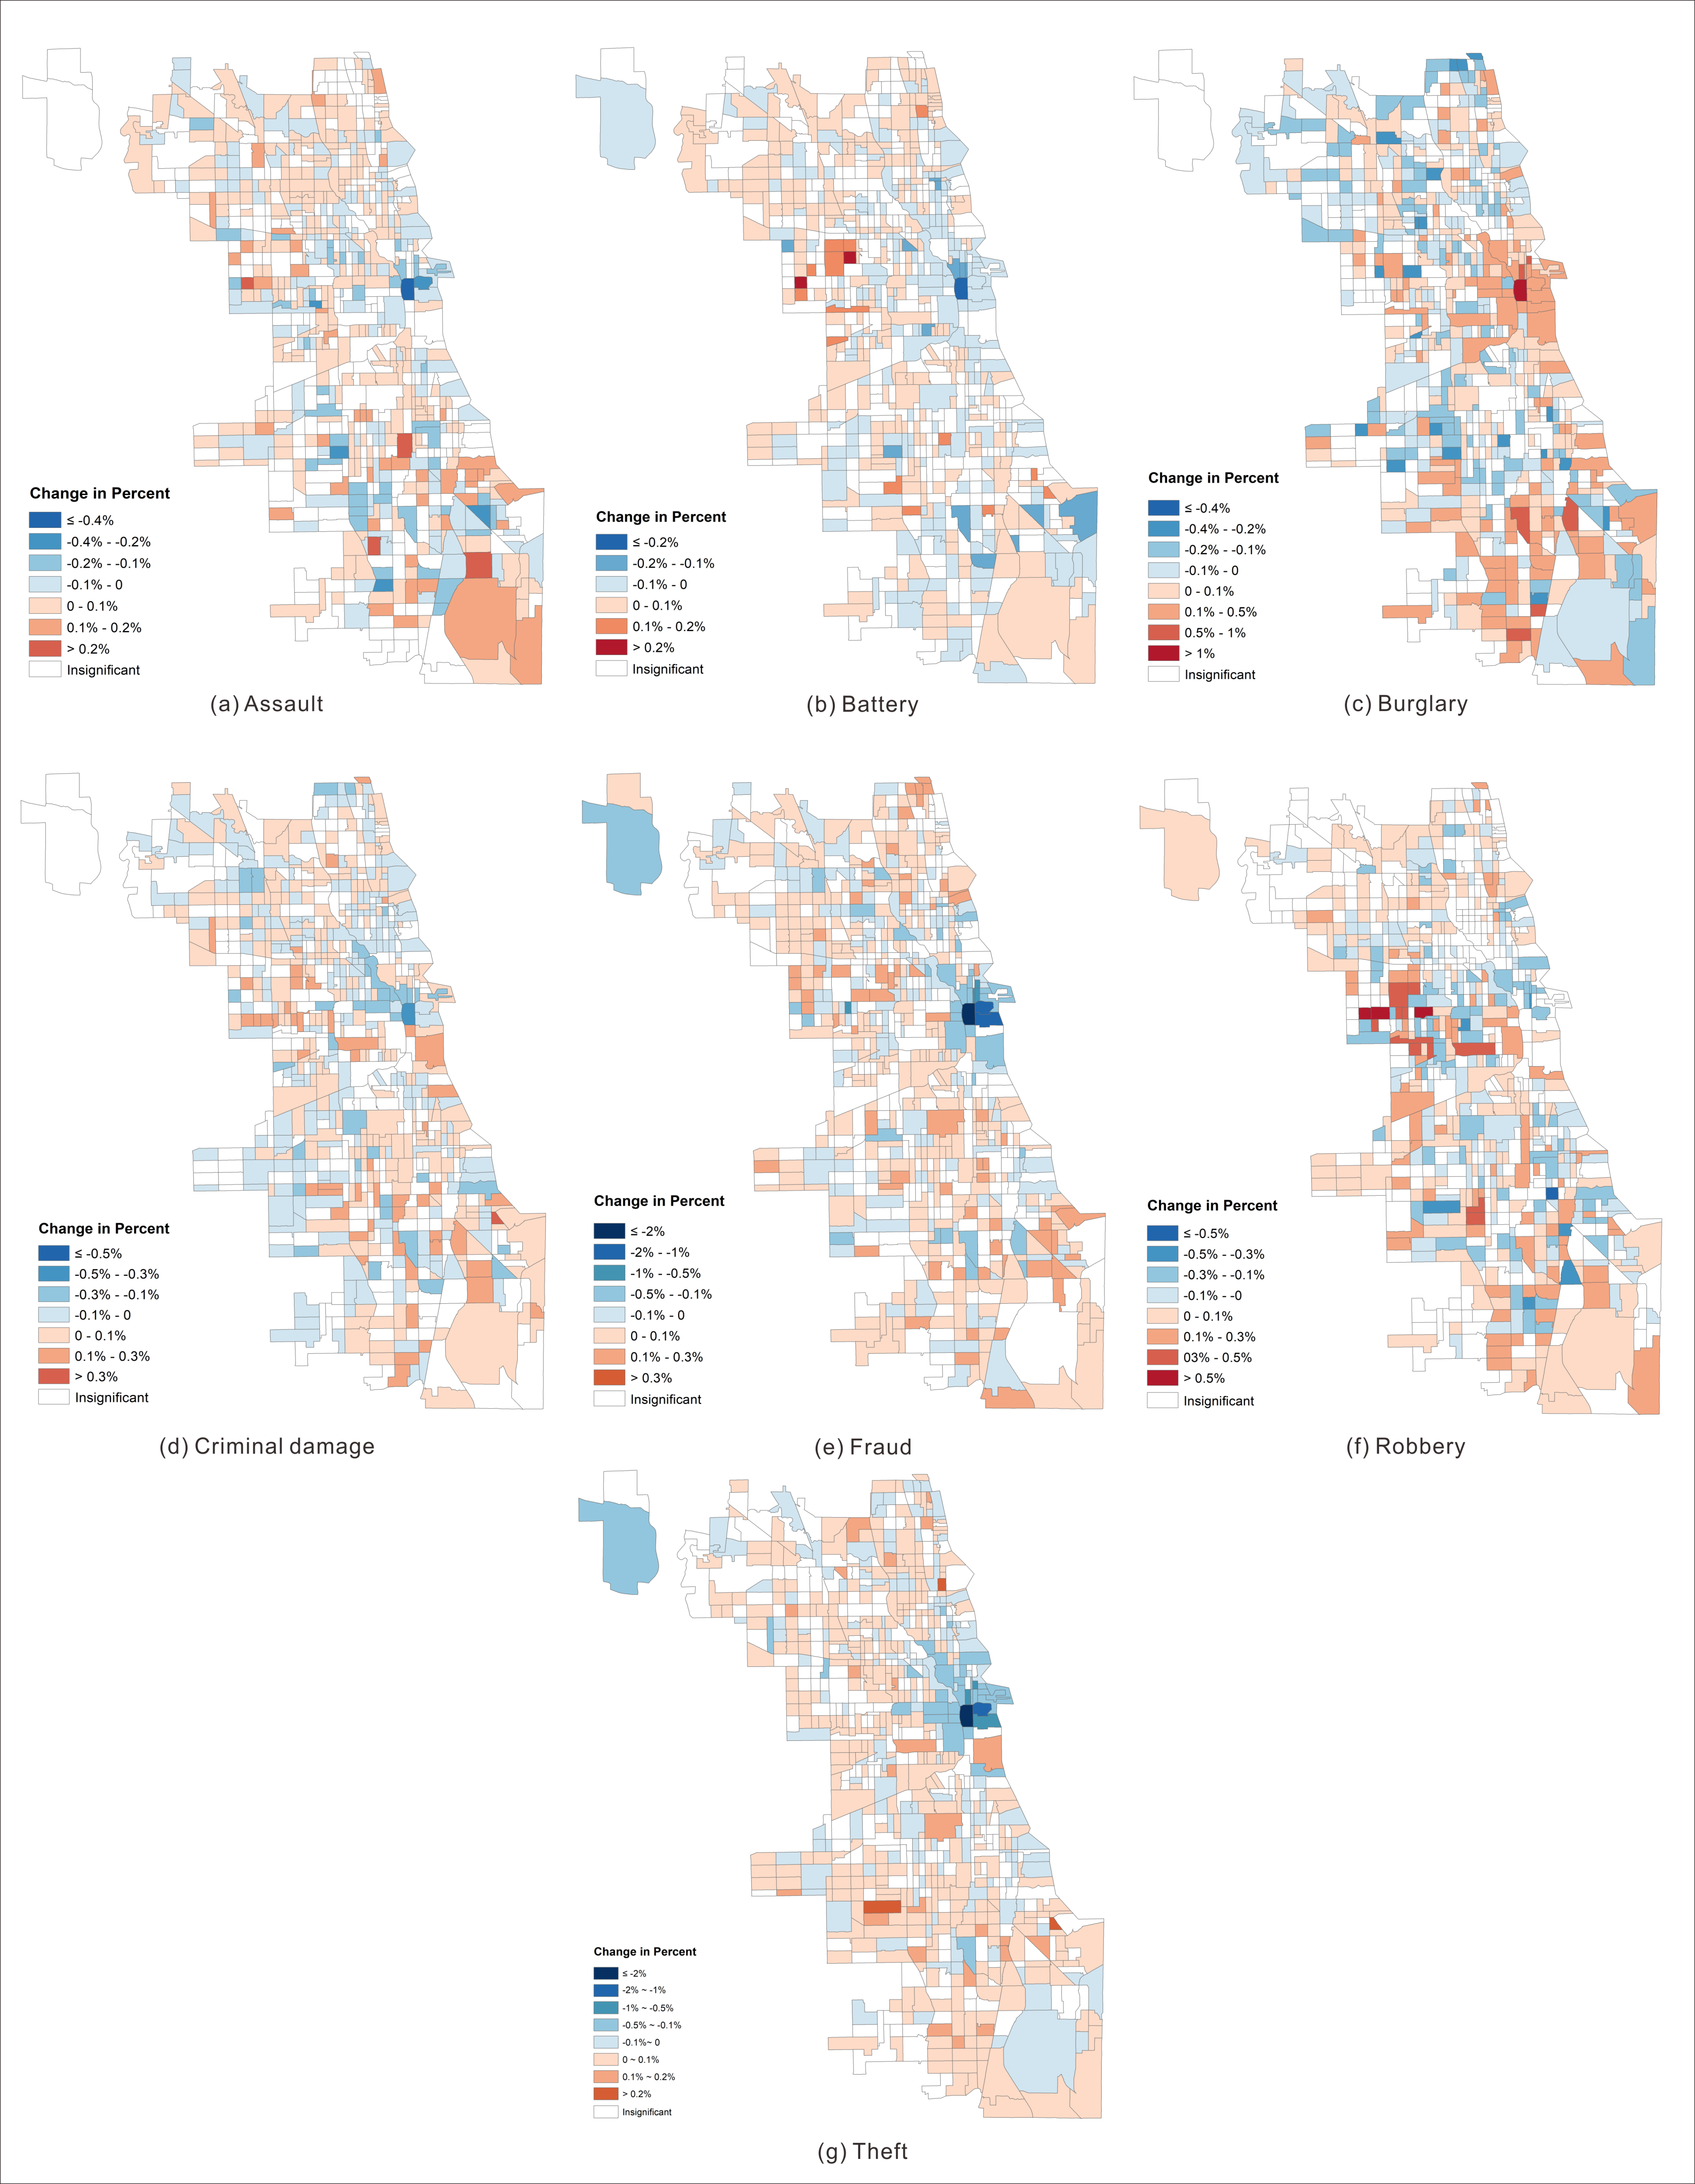
We subdivided the percentage difference of spatial units between 2020 and 2019 into several classes, when local S-index values are not equal to zero. Then, we used gradation color symbols to display the percentage differences (Figure 6). The results of local changes between 2020 and other years are displayed in the Appendix A Figure A1. It showed that local changes in some types of crimes have a similar pattern. There is an aggregation region of theft, battery, burglary, and fraud in the eastern business district. The aggregation region of burglary displays significant growth in crimes in 2020 compared with 2019, and other types show a significant decline in crimes in 2020 compared with 2019. These results indicated that there is a significant difference in the spatial pattern of crimes during the pandemic, and the differences of space mainly reflected on the microscopic scale.
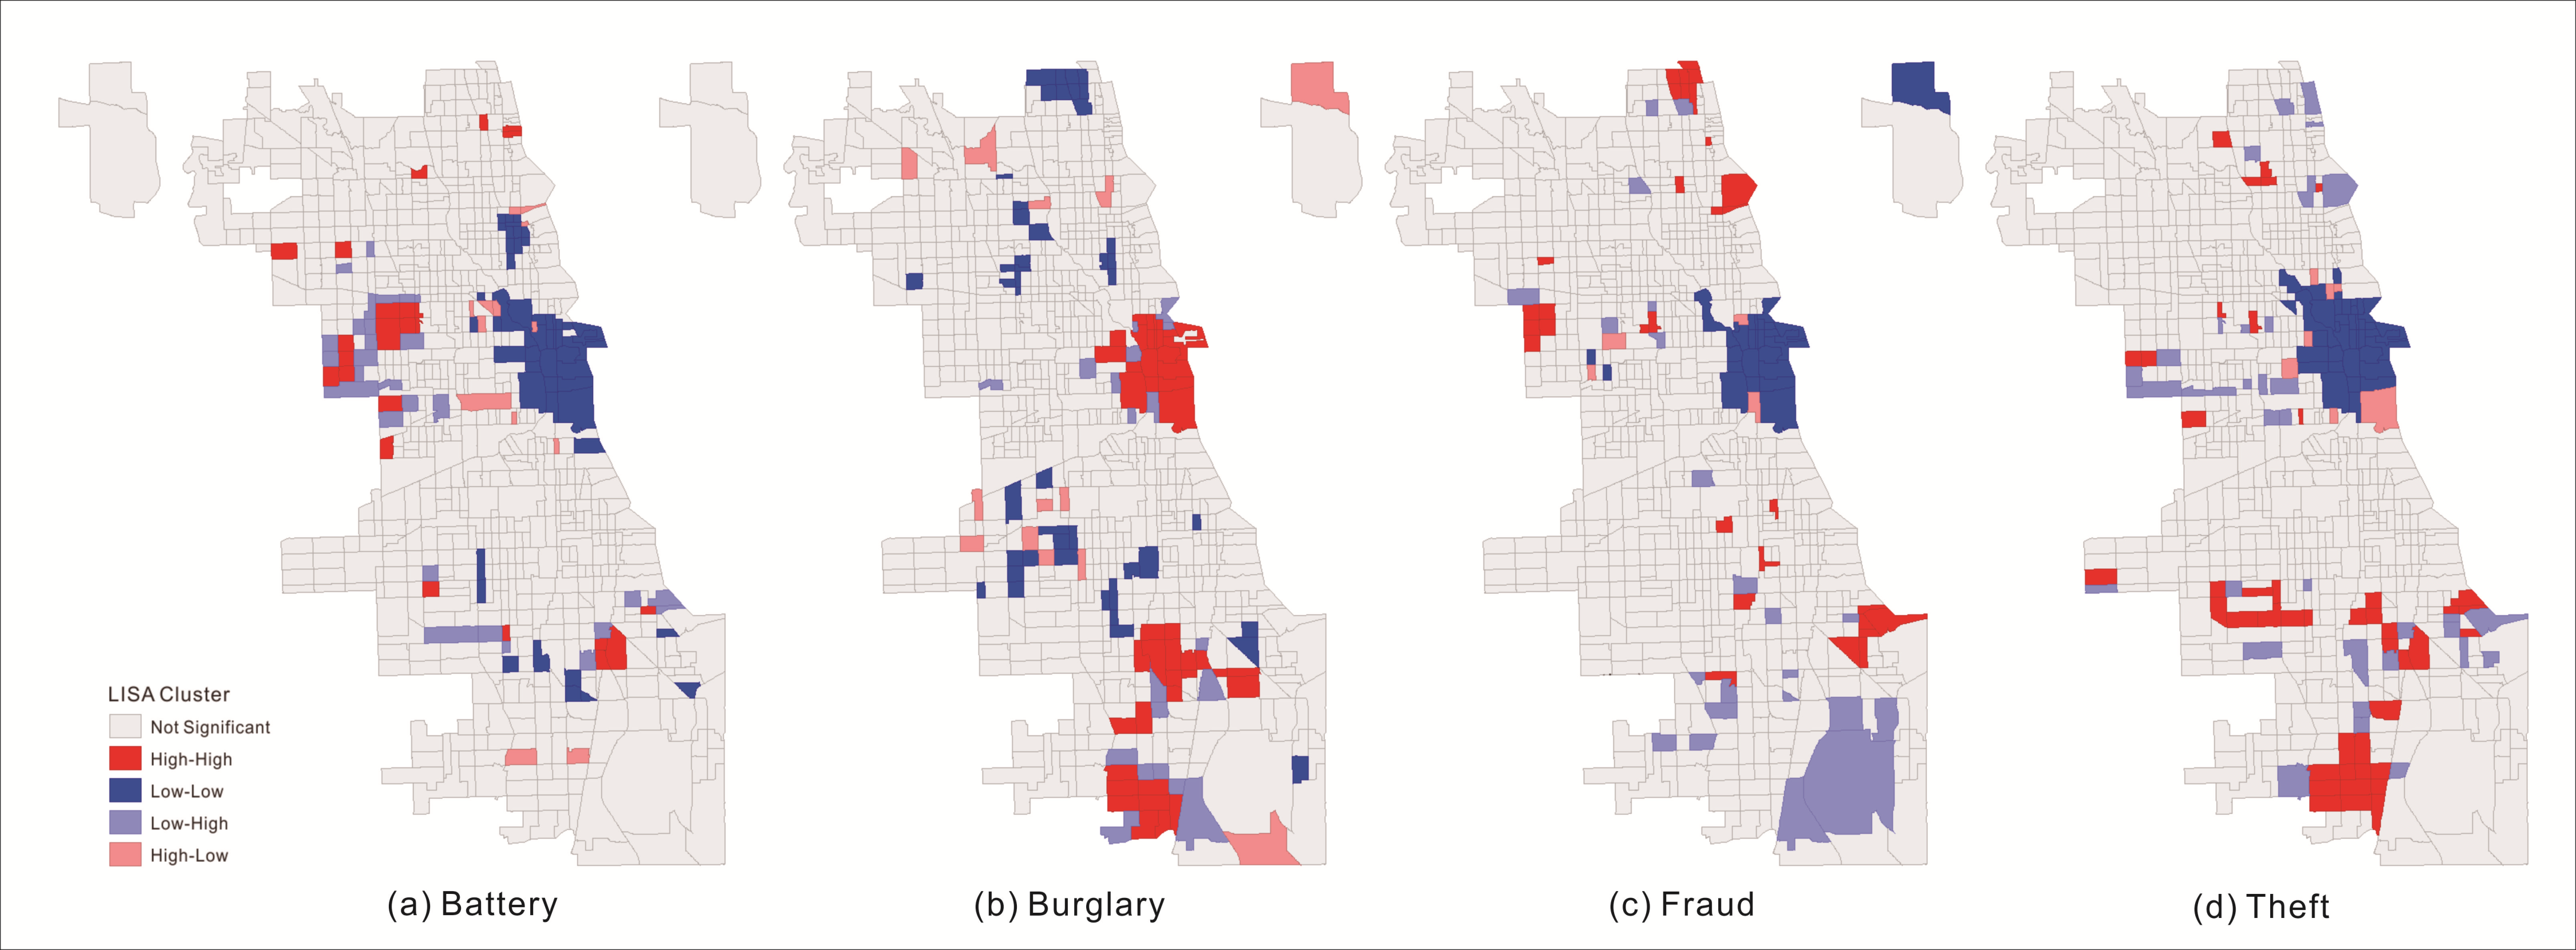
To verify whether there are agglomerations of theft, battery, fraud, and burglary, we used the Moran’s I to analyze the autocorrelation of local changes. In this work, the Moran’s I was implemented by the functions of GeoDa (a space analysis software). The weighting of the Moran’s I is calculated by queen contiguity, which is considered to define the neighbor relation by common vertices and common sides of the polygons [44]. The Moran’s I includes two kind forms: the global Moran’s I [45] and the local Moran’s I [46]. The global Moran’s I is generally used to indicate the global spatial autocorrelation, while the local Moran’s I is utilized to discover hot spots and cold spots in data, as well as spatial outliers. Values of the global Moran’s I range from −1 to +1. Values above zero indicate positive spatial autocorrelation, and values below zero indicate negative spatial autocorrelation. Moreover, the significance of the global Moran’s I values can be transformed to p-value and Z-score. Table 3 shows that the p-values of all types of crime were less than 0.05 and that the Z-scores are larger than 1.96, which indicates that the spatial distributions of crimes were significantly autocorrelated [47]. The global Moran’s I values were all larger than 0, which proves that local changes in crime display a positive spatial autocorrelation. The significant autocorrelations of theft, battery, burglary, and fraud verified that the spatial distributions of some types of crimes are associated with the COVID-19 pandemic. Then, we used local Moran’s I to identify local clusters and local spatial outliers to observe specific regions that changed significantly.
The results of local Moran’s I display different clusters (including high-high clusters, low-low clusters, low-high spatial outliers, and high-low spatial outliers). In Figure 7, there are low-low clusters of theft, battery, fraud, and high-high clusters of burglary in east-central Chicago, which supported our previous proposal. We also found that both theft and burglary contain high-high clusters in southern Chicago. The high-low spatial outliers that represent the higher level of this region than surrounding areas should be noted as well. This work suggests that the police resources in east-central Chicago should be shifted to burglaries, and the crime incidents of theft and burglary on the south side of Chicago should be controlled together. These local clusters of different crimes in Chicago also provided useful information for police practices to prevent and tackle crimes.

4.2. Spatial and Temporal Analysis

4.2.1. Temporal Analysis

After the Stay-at-Home order was issued, many public places closed. People were forced to quarantine at home, and they have to maintain a distance of at least 6 feet when going outside. Based on routine activity theory and crime pattern theory, the Stay-at-Home order reduced suitable targets for crimes, and changed crime patterns in Chicago, so most crimes had a significant reduction after 21 March. Till May, the number of confirmed cases each day in Chicago was maintained in a stable range. The mayor cautiously gradually reopened some public places in the city at the end of May. The routine activities of people gradually returned to the same level that existed before the pandemic, which offered opportunity for more crimes. Therefore, theft, battery, assault, and robbery all significantly decreased after announcing the Stay-at-Home order and increased after announcing the framework of Cautiously Reopen. By contrast, the high-low-low phase pattern of fraud indicated that the impact of the COVID-19 was likely different on fraud. Moreover, the annual trends of criminal damage and burglary remained almost stable, but included a significant peak on 31 May. This could be associated with the event that occurred on this day, which led to the occurrence of crimes causing damage and loss of property [48].
In fact, the special event on 31 May is the George Floyd protests. During the protest event (May 29 to June 1), 25 people were killed and 85 were injured in Chicago. Moreover, there were large-scale increases in the crimes of robbery and burglary, especially on May 31, 2020. Because of the policies (such as the stay-at-home order and so on) taken by the government, many owners and customers of business locations moved away [10]. After the George Floyd protests breaking out, a large number of people gathered in the streets to protest. The gathered people, closed stores, and the absence of guardians likely created opportunities for crimes. Moreover, the George Floyd protests aroused the anger and rage emotions of people [48]. These feelings of anger and the strain caused by the pandemic have boosted violent crimes [7]. Therefore, the numbers of assaults, batteries, burglaries, robberies, and criminal damages increased rapidly. It is necessary for Chicago police departments undertake innovative measures to respond to a changing crime environment and pattern.
In addition, during the pandemic, most people were quarantined at home and the proportion of people who work normally was very small. The number of crimes should appear a relatively stable per week. However, this study found that the crime frequencies still saw peak values, which indicated that the COVID-19 pandemic had significant, but not total, impact on the periodic variations of a week. The routines of daily life help to retain some original characteristics of crimes [6], despite the dramatic shift in periodic variations compared to the prepandemic period.

4.2.2. Spatial Analysis

As Campedelli et al. indicated, crimes usually cluster in some areas, rather than being randomly distributed across the whole city [3]. The result of Moran’s I showed that the spatial distributions of theft, battery, fraud, and burglary are not random. There is an aggregation region of theft, battery, fraud, and burglary in the eastern business district of Chicago, which includes the Near North Side district and the Loop district and surrounding areas (see Figure 2 and Figure 7). This location coincides with the downtown Chicago and includes many famous attractions, museums, and parks. It is the most crowded area in Chicago and is usually a hot spot for crimes. As the wave of the COVID-19 pandemic poured in, senior centers, libraries, parks, and other city services were forced to close. Moreover, this region contains many commercial buildings with many employees who began to work at home during this period. The stay-at-home orders urged most people to quarantine at home, resulting in an insufficient flow of visitors here. Previous works have shown that the contextual characteristics of different areas would have an impact on some crimes [3], such as the fact that the busy streets of the city center can attract more cases of robbery and theft [49], and the commercial land can attract more violent crime [50]. The number of fraud incidents is deeply influenced by population density and the volume of traffic. Therefore, the number of theft incidents, battery incidents, and fraud incidents decreased considerably during this time when the city center became a deserted area. Unlike these crime types, the aggregation region of burglaries shows significant growth, which could result from many closed business districts and the lack of regulators. Furthermore, the breaking of the George Floyd protests in the city center at the end of May 2020 even prompted burglaries to peak. The aggregation region of burglaries suggested that the police department should take steps to prevent these crimes from increasing in this region again in the future.

5. Discussion and Conclusion

The recent COVID-19 pandemic has had unprecedented impacts on the security of society, economic development, people’s daily lives, criminal distribution, and so on, in Chicago. We investigated the changes of seven types of crime in Chicago over a complete period of the first wave pandemic (from 1 February to 31 June) based on spatial and temporal crime analyses. Our results show significant spatial and temporal changes of crimes during the pandemic.
The temporal pattern showed that the temporal distributions on the scale of days of some crimes in Chicago changed significantly during the pandemic, while the temporal distributions on the scale of hours changed slightly. Moreover, in STL decomposition, we found that changes in crime trends were related to government policies in response to the COVID-19 in Chicago, which was consistent with the results of Campedelli et al. that social distancing and shelter-in-place policies have impacts on crime [3]. The remainder components of some types of crimes have the largest outliers on 31 May, which proved that the George Floyd protests that occurred on this day greatly promoted the occurrence of crimes. In the spatial pattern, the results of local S-index showed that theft, battery, burglary, and fraud all displayed aggregative clusters downtown in Chicago, only burglary was a high-high cluster, while others were low-low clusters. Spatial clusters of different crimes indicated that the occurrence of crime does not randomly distribute in space, but aggregate in some spatial units of Chicago [3].
There are some limitations in this work. First, the long-term impact of the COVID-19 pandemic on crimes is unknown. Judging from the recovery of the number of crimes in the mid-late period, the impact of the pandemic on crime gradually began to shrink. People have begun to adapt to the existence of the COVID pandemic. Even if social distancing and stay-at-home orders still exist, the pandemic will not have a dramatic effect on people’s daily routine activities as before. It is necessary to explore the long-term impacts on crime with more data in future work. Second, we only considered the changes in crimes in the COVID-19 pandemic. This work does not identify some other specific factors that directly influence crimes. During the pandemic, the rate of people living in crowded houses, the vacant housing rate, and other factors all appear to have various effects on different crimes [3]. We will use some additional data (like population data, housing data, etc.) to address this gap in the future work. Third, the types of crimes in this study are aggregate crime categories in Chicago. We did not distinguish the different subcategories of a crime category, such as burglary consisting of residential and non-residential, which could be considered in future. Further, we will attempt some new approaches to explore the relationship between the pandemic and crimes in the future work.
In sum, we obtained following conclusions: (1) the spatial and temporal distribution of crimes in Chicago is not random under the COVID-19 pandemic; (2) there is a certain phase pattern in the trend components of assault, battery, fraud, and theft; (3) some crimes in Chicago were very sensitive to some policies or events during the pandemic, like the number of burglaries, criminal damages, and robberies boosting rapidly on 31 May 2020 (the time of the George Floyd protests breaking out); and (4) spatial distributions of battery, burglary, fraud, and theft had clusters in Chicago downtown. These conclusions are significance for the prevention and control of crimes when the second wave of the COVID-19 outbreak in Chicago, such as which types of crimes should be focused on, and which regions should be concerned with crime.

Author Contributions

Conceptualization, Mengjie Zhou, Mengjie Yang; Data curation, Mengjie Yang, Zhe Chen, Xiaojin Liang and Ziyue Bai; Formal analysis, Mengjie Yang, Zhe Chen and Ziyue Bai; Funding acquisition, Mengjie Zhou; Investigation, Mengjie Yang; Methodology, Mengjie Zhou; Project administration, Mengjie Zhou; Resources, Mengjie Zhou; Visualization, Zhe Chen and Mengjie Yang; Writing-original draft, Mengjie Yang, Mengjie Zhou and Xiaojin Liang; Writing-review & editing, Mengjie Zhou, Mengjie Yang. All authors have read and agreed to the published version of the manuscript.

Funding

This research was funded by National Natural Science Foundation of China (41901314), Open Research Fund Program of Key Laboratory of Digital Mapping and Land Information, Application Engineering, MNR (ZRZYBWD201902), Scientific Research Program of Hunan Education Department (18C0049), and Hunan province college students research learning and innovative experiment project (S202010542072).

Conflicts of Interest

The authors declare no conflict of interest.

Appendix A

Figure A1. Results of local changes in 2020 compared with 2019, 2018, 2017, and 2016. “2020-2019” in the figures means that the crime data of 2020 are the base dataset, and the crime data of 2019 are the test dataset.
Ijgi 10 00152 g0a1aIjgi 10 00152 g0a1b
Table A1. The global S-index values of different crimes between base dataset and test dataset. The spatial unit of SPPT is the census tract of Chicago. “2020-2019” in the table means that the crime data of 2020 are the base dataset, and the crime data of 2019 are the test dataset.
Base-Test (Dataset)TheftRobberyAssaultBatteryBurglaryCriminal DamageFraud
2020-20190.2820.4020.3570.3670.3160.310.317
2020-20180.2420.3410.3510.3430.2970.3060.297
2020-20170.2220.3720.3670.3370.2910.3110.311
2020-20160.2380.3560.3530.31002860.3160.301
2019-20180.3370.3830.3720.3550.3250.1970.352
2019-20170.3210.3860.3660.3700.3010.2880.367
2019-20160.3010.3580.3300.3420.3250.3200.343

References

  1. Yang, C.; Sha, D.; Liu, Q.; Li, Y.; Lan, H.; Guan, W.W.; Hu, T.; Li, Z.; Zhang, Z.; Thompson, J.H.; et al. Taking the pulse of COVID-19: A spatiotemporal perspective. Int. J. Digit. Earth 2020, 13, 1186–1211. [Google Scholar] [CrossRef]
  2. Hawdon, J.; Parti, K.; Dearden, T.E. Cybercrime in America Amid COVID-19: The Initial Results from a Natural Experiment. Am. J. Crim. Justice 2020, 45, 546–562. [Google Scholar] [CrossRef]
  3. Campedelli, G.M.; Favarin, S.; Aziani, A.; Piquero, A.R. Disentangling community-level changes in crime trends during the COVID-19 pandemic in Chicago. Crime Sci. 2020, 9, 21. [Google Scholar] [CrossRef] [PubMed]
  4. Payne, B.K. Criminals Work from Home during Pandemics Too: A Public Health Approach to Respond to Fraud and Crimes against Those 50 and Above. Am. J. Crim. Justice 2020, 45, 563–577. [Google Scholar] [CrossRef] [PubMed]
  5. Ashby, M.P.J. Initial evidence on the relationship between the coronavirus pandemic and crime in the United States. Crime Sci. 2020, 9, 6. [Google Scholar] [CrossRef] [PubMed]
  6. Mohler, G.; Bertozzi, A.L.; Carter, J.; Short, M.B.; Sledge, D.; Tita, G.E.; Uchida, C.D.; Brantingham, P.J. Impact of social distancing during COVID-19 pandemic on crime in Los Angeles and Indianapolis. J. Crim. Justice 2020, 68, 101692. [Google Scholar] [CrossRef]
  7. Campedelli, G.M.; Aziani, A.; Favarin, S. Exploring the Immediate Effects of COVID-19 Containment Policies on Crime: An Empirical Analysis of the Short-Term Aftermath in Los Angeles. Am. J. Crim. Justice 2020, 1–24. [Google Scholar] [CrossRef] [PubMed]
  8. Calderon-Anyosa, R.J.C.; Kaufman, J.S. Impact of COVID-19 Lockdown Policy on Homicide, Suicide, and Motor Vehicle Deaths in Peru. medRxiv Public Glob. Health 2020. [Google Scholar] [CrossRef]
  9. Payne, J.; Morgan, A. Property Crime during the COVID-19 Pandemic: A Comparison of Recorded Offence Rates and Dynamic Forecasts (ARIMA) for March 2020 in Queensland, Australia. SocArXiv 2020. [Google Scholar] [CrossRef]
  10. Zhang, Z.; Sha, D.; Dong, B.; Ruan, S.; Qiu, A.; Li, Y.; Liu, J.; Yang, C. Spatiotemporal Patterns and Driving Factors on Crime Changing During Black Lives Matter Protests. ISPRS Int. J. Geo-Inf. 2020, 9, 640. [Google Scholar] [CrossRef]
  11. Abrams, D.S. COVID and crime: An early empirical look. J. Public Econ. 2021, 194, 104344. [Google Scholar] [CrossRef] [PubMed]
  12. Cohen, L.E.; Felson, M. Social Change and Crime Rate Trends: A Routine Activity Approach. Am. Sociol. Rev. 1979, 44, 588. [Google Scholar] [CrossRef]
  13. Brantingham, P.J.; Brantingham, P.L. Patterns in Crime; Macmillan: New York, NY, USA, 1984. [Google Scholar]
  14. Agnew, R. Foundation for a general strain theory of crime and delinquency. Criminology 1992, 30, 47–88. [Google Scholar] [CrossRef]
  15. Boman, J.H.T.; Gallupe, O. Has COVID-19 Changed Crime? Crime Rates in the United States during the Pandemic. Am. J. Crim. Justice 2020, 1–9. [Google Scholar] [CrossRef] [PubMed]
  16. Kaukinen, C. When Stay-at-Home Orders Leave Victims Unsafe at Home: Exploring the Risk and Consequences of Intimate Partner Violence during the COVID-19 Pandemic. Am. J. Crim. Justice 2020, 45, 668–679. [Google Scholar] [CrossRef] [PubMed]
  17. Frailing, K.; Zawisza, T.; Harper, D.W. Whirlwinds and Break-Ins: Evidence Linking a New Orleans Tornado to Residential Burglary. J. Crime Justice 2020, 44, 119–130. [Google Scholar] [CrossRef]
  18. Leitner, M.; Helbich, M. The Impact of Hurricanes on Crime: A Spatio-Temporal Analysis in the City of Houston, Texas. Cartogr. Geogr. Inf. Sci. 2011, 38, 213–221. [Google Scholar] [CrossRef]
  19. Kulldorff, M. A spatial scan statistic. Commun. Stat. Theory Methods 1997, 26, 1481–1496. [Google Scholar] [CrossRef]
  20. Fotheringham, A.S.; Oshan, T.M. Geographically weighted regression and multicollinearity: Dispelling the myth. J. Geogr. Syst. 2016, 18, 303–329. [Google Scholar] [CrossRef]
  21. Campedelli, G.M.; D’Orsogna, M.R. Temporal Clustering of Disorder Events during the COVID-19 Pandemic. arXiv 2021, arXiv:2101.06458. [Google Scholar]
  22. Ratcliffe, J.H. The Hotspot Matrix: A Framework for the Spatio-Temporal Targeting of Crime Reduction. Police Pract. Res. 2007, 5, 5–23. [Google Scholar] [CrossRef]
  23. Hu, Y.; Wang, F.; Guin, C.; Zhu, H. A spatio-temporal kernel density estimation framework for predictive crime hotspot mapping and evaluation. Appl. Geogr. 2018, 99, 89–97. [Google Scholar] [CrossRef]
  24. Nakaya, T.; Yano, K. Visualising Crime Clusters in a Space-time Cube: An Exploratory Data-analysis Approach Using Space-time Kernel Density Estimation and Scan Statistics. Trans. GIS 2010, 14, 223–239. [Google Scholar] [CrossRef]
  25. Shiode, S.; Shiode, N. Network-based space-time search-window technique for hotspot detection of street-level crime incidents. Int. J. Geogr. Inf. Sci. 2013, 27, 866–882. [Google Scholar] [CrossRef]
  26. Xiao, J.; Zhou, X. Crime Exposure along My Way Home: Estimating Crime Risk along Personal Trajectory by Visual Analytics. Geogr. Anal. 2019, 52, 49–68. [Google Scholar] [CrossRef]
  27. Andresen, M.A. Testing for similarity in area-based spatial patterns: A nonparametric Monte Carlo approach. Appl. Geogr. 2009, 29, 333–345. [Google Scholar] [CrossRef]
  28. De Melo, S.N.; Matias, L.F.; Andresen, M.A. Crime concentrations and similarities in spatial crime patterns in a Brazilian context. Appl. Geogr. 2015, 62, 314–324. [Google Scholar] [CrossRef]
  29. Valente, R. Spatial and temporal patterns of violent crime in a Brazilian state capital: A quantitative analysis focusing on micro places and small units of time. Appl. Geogr. 2019, 103, 90–97. [Google Scholar] [CrossRef]
  30. He, Z.; Deng, M.; Xie, Z.; Wu, L.; Chen, Z.; Pei, T. Discovering the joint influence of urban facilities on crime occurrence using spatial co-location pattern mining. Cities 2020, 99, 102612. [Google Scholar] [CrossRef]
  31. Zhou, M.; Ai, T.; Zhou, G.; Hu, W. A Visualization Method for Mining Colocation Patterns Constrained by a Road Network. IEEE Access 2020, 8, 51933–51944. [Google Scholar] [CrossRef]
  32. He, Z.; Deng, M.; Cai, J.; Xie, Z.; Guan, Q.; Yang, C. Mining spatiotemporal association patterns from complex geographic phenomena. Int. J. Geogr. Inf. Sci. 2020, 34, 1162–1187. [Google Scholar] [CrossRef]
  33. Feroze, N. Forecasting the patterns of COVID-19 and causal impacts of lockdown in top five affected countries using Bayesian Structural Time Series Models. Chaos Solitons Fractals 2020, 140, 110196. [Google Scholar] [CrossRef] [PubMed]
  34. Dagum, E.B.; Bianconcini, S. Seasonal Adjustment Methods and Real Time Trend-Cycle Estimation; Springer: Berlin/Heidelberg, Germany, 2016. [Google Scholar]
  35. Cleveland, R.B.; Cleveland, W.S.; McRae, J.E.; Terpenning, I. STL: A seasonal-trend decomposition. J. Off. Stat. 1990, 6, 3–73. [Google Scholar]
  36. Zhu, X.; Guo, D. Urban event detection with big data of taxi OD trips: A time series decomposition approach. Trans. GIS 2017, 21, 560–574. [Google Scholar] [CrossRef]
  37. Andresen, M.A. An area-based nonparametric spatial point pattern test: The test, its applications, and the future. Methodol. Innov. 2016, 9, 9. [Google Scholar] [CrossRef] [Green Version]
  38. Andresen, M.A.; Linning, S.J.; Malleson, N. Crime at Places and Spatial Concentrations: Exploring the Spatial Stability of Property Crime in Vancouver BC, 2003–2013. J. Quant. Criminol. 2016, 33, 255–275. [Google Scholar] [CrossRef] [Green Version]
  39. Andresen, M.A.; Malleson, N. Crime seasonality and its variations across space. Appl. Geogr. 2013, 43, 25–35. [Google Scholar] [CrossRef]
  40. Wheeler, A.P.; Steenbeek, W.; Andresen, M.A. Testing for similarity in area-based spatial patterns: Alternative methods to Andresen’s spatial point pattern test. Trans. GIS 2018, 22, 760–774. [Google Scholar] [CrossRef]
  41. Watson, G.S. Goodness-of-fit tests on a circle. Biometrika 1961, 48, 109–114. [Google Scholar] [CrossRef]
  42. McKenzie, G. Spatiotemporal comparative analysis of scooter-share and bike-share usage patterns in Washington, D.C. J. Transp. Geogr. 2019, 78, 19–28. [Google Scholar] [CrossRef]
  43. McKenzie, G. Urban mobility in the sharing economy: A spatiotemporal comparison of shared mobility services. Comput. Environ. Urban. Syst. 2020, 79, 101418. [Google Scholar] [CrossRef]
  44. Anselin, L.; Rey, S. Properties of tests for spatial dependence in linear regression models. Geogr. Anal. 1991, 23, 112–131. [Google Scholar] [CrossRef]
  45. Moran, P.A. The interpretation of statistical maps. J. R. Stat. Soc. Ser. B (Methodol.) 1948, 10, 243–251. [Google Scholar] [CrossRef]
  46. Anselin, L. Local Indicators of Spatial Association-LISA. Geogr. Anal. 1995, 27, 93–115. [Google Scholar] [CrossRef]
  47. Moran, P.A. Notes on continuous stochastic phenomena. Biometrika 1950, 37, 17–23. [Google Scholar] [CrossRef] [PubMed]
  48. Rosenfeld, R.; Lopez, E. Pandemic, Social Unrest, and Crime in US Cities; Council on Criminal Justice: Washington, DC, USA, 2020. [Google Scholar]
  49. Shiode, S.; Shiode, N.; Block, R.; Block, C.R. Space-time characteristics of micro-scale crime occurrences: An application of a network-based space-time search window technique for crime incidents in Chicago. Int. J. Geogr. Inf. Sci. 2015, 29, 697–719. [Google Scholar] [CrossRef]
  50. Twinam, T. Danger zone: Land use and the geography of neighborhood crime. J. Urban. Econ. 2017, 100, 104–119. [Google Scholar] [CrossRef]
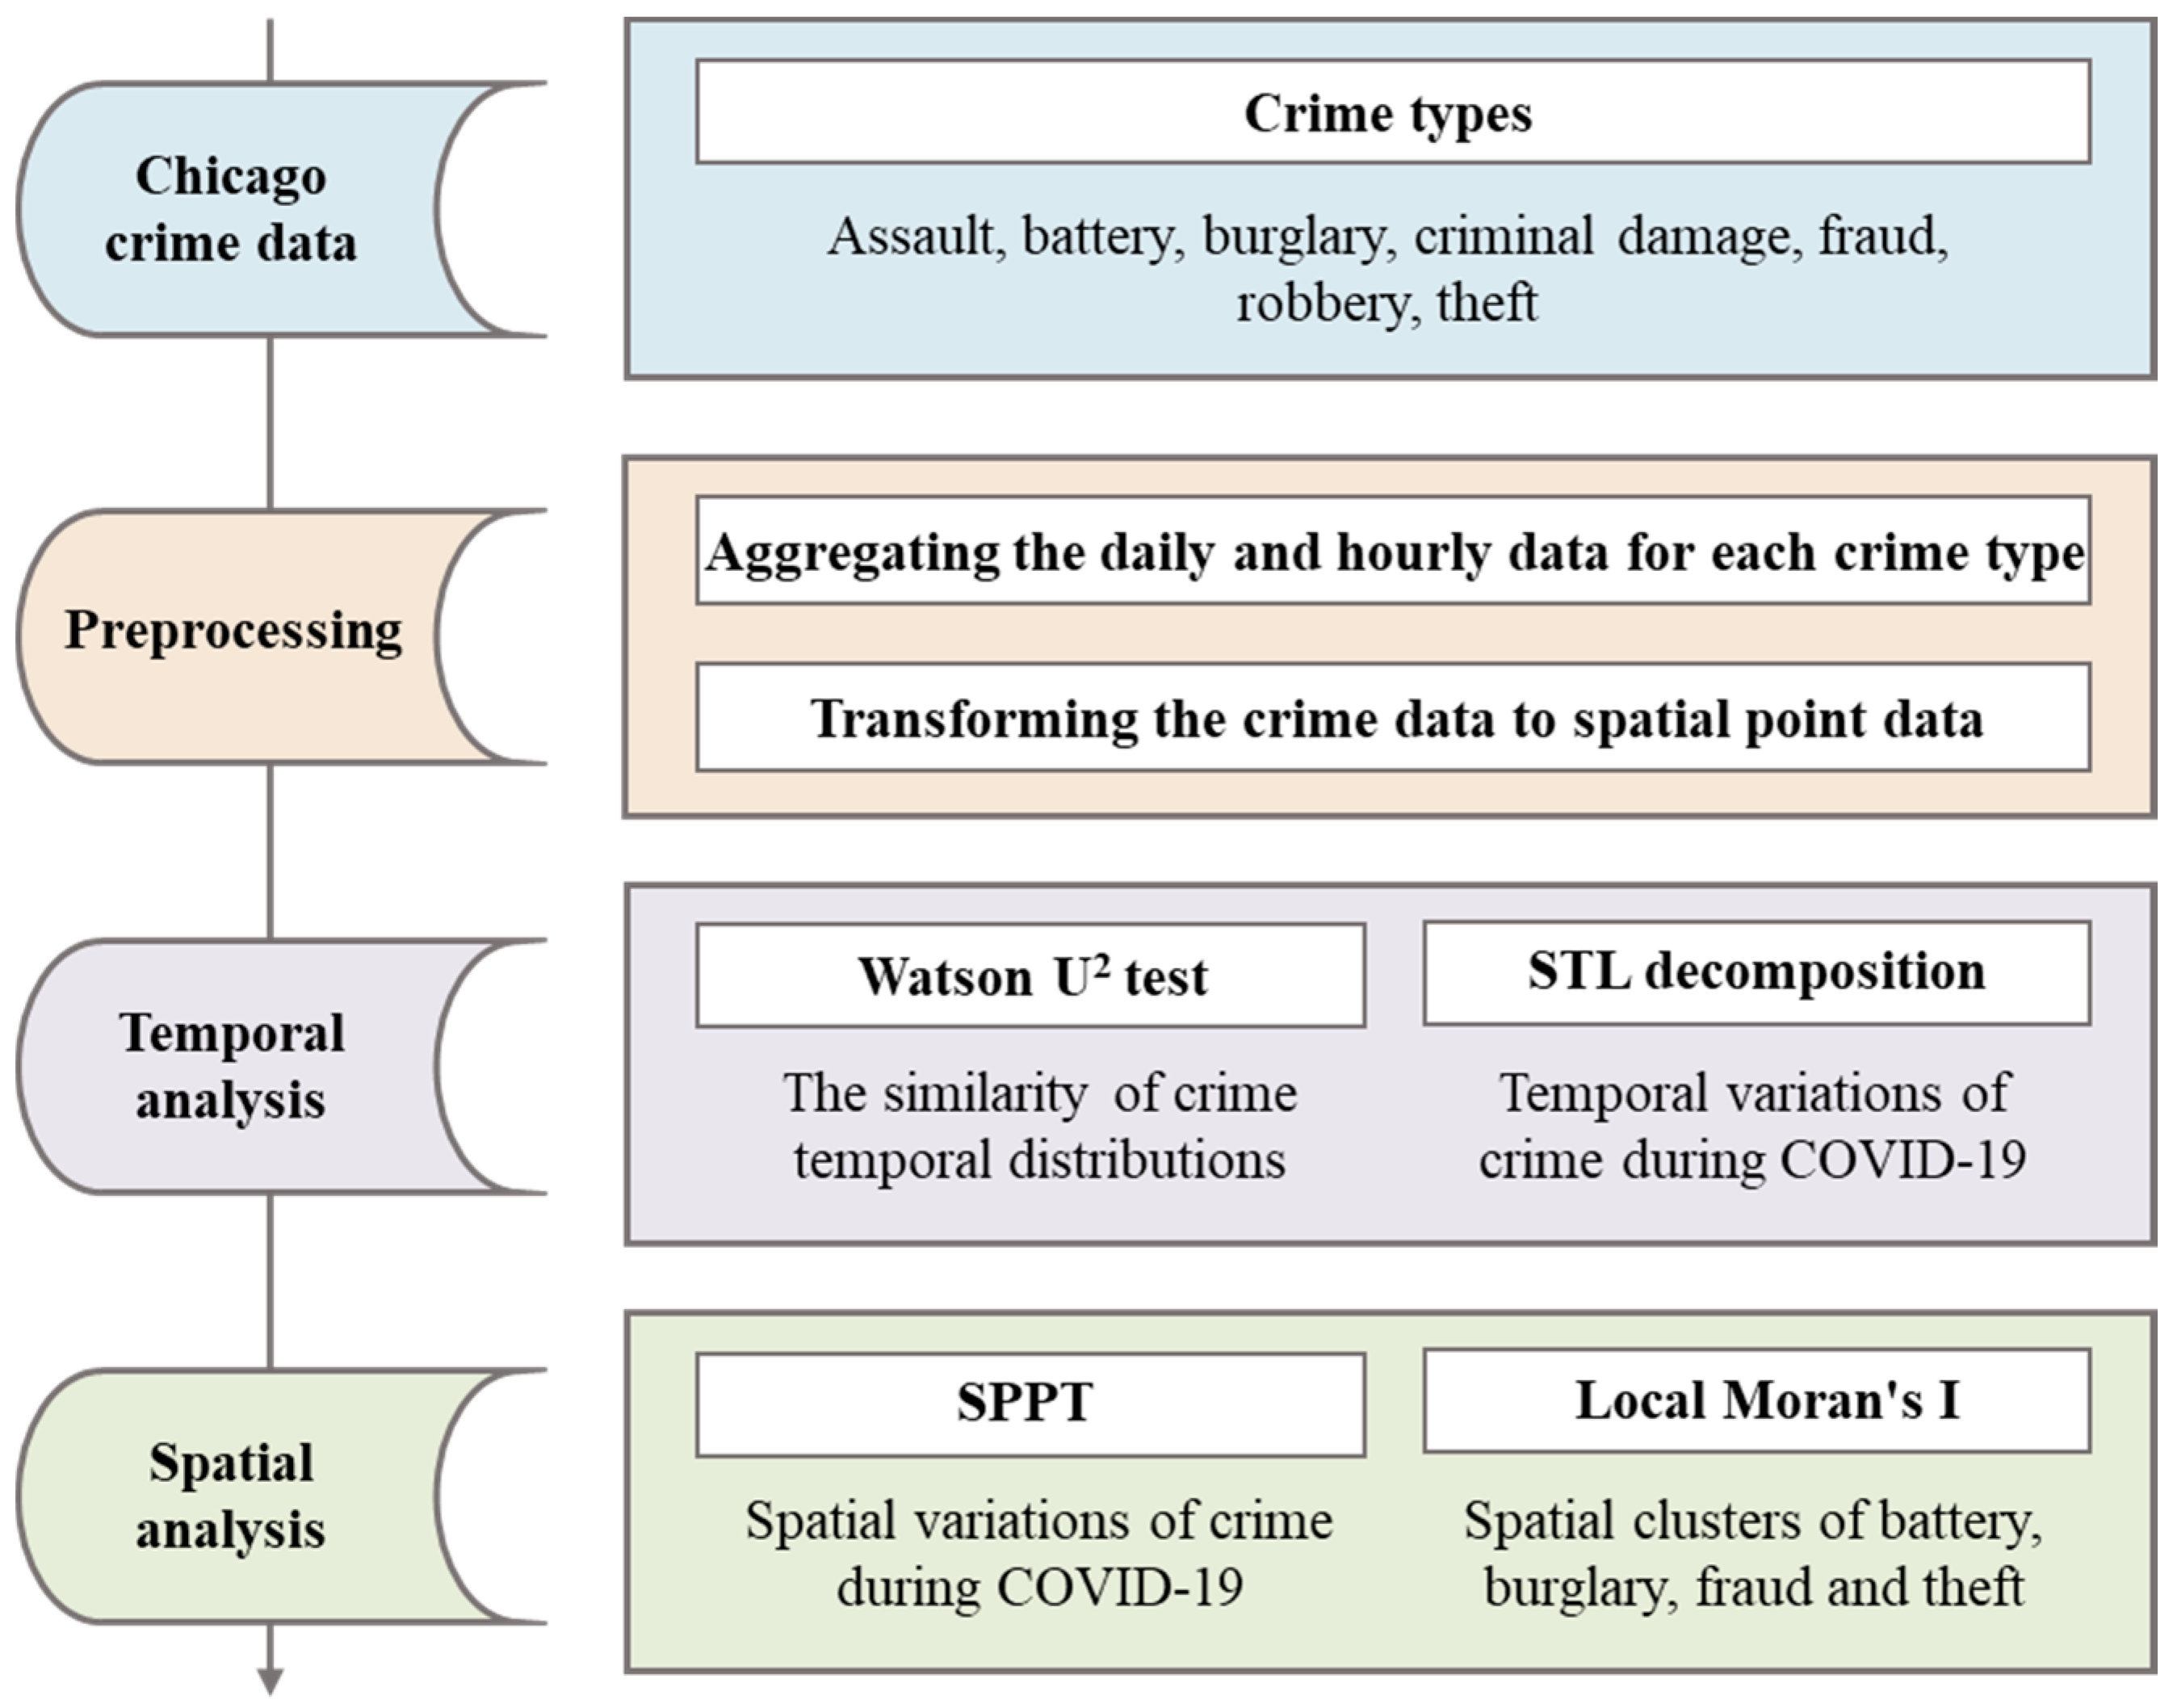
Figure 1. Workflow of the analytical process.
Ijgi 10 00152 g001
Figure 2. Community areas of Chicago. The black label is the code of each community area. Left table showed the community’s name of each code.
Ijgi 10 00152 g002
Figure 3. Temporal distributions (h) of different crimes, the number of crimes aggregated as hourly, from February to June in 2020. The ordinate represents the number of crimes, and the abscissa represents the hour of the day.
Ijgi 10 00152 g003
Figure 4. Seasonal-Trend decomposition procedure based on Loess (STL) decomposition for daily crime data (including seven types of crimes) from 1 February to 30 June in both 2020 and 2019. The number of observations of a seasonal cycle is 7. The decomposition includes three components: trend (red), seasonal (violet), and remainder components (green). Black vertical lines in the trend component indicate time nodes that divide the trend into three stages, whereas red vertical lines in the remainder component indicate the largest outliers.
Ijgi 10 00152 g004aIjgi 10 00152 g004b
Figure 5. A week variation in the seasonal component. It shows the weekly cyclical variation of different types of crimes in detail.
Ijgi 10 00152 g005
Figure 6. Differences in the percentages between 2020 and 2019 of different crimes’ spatial distributions based on the spatial unit when spatial point pattern test (SPPT) results are significant. Blue symbols indicate when the percentage for 2020 is significantly less than for 2019, and red indicates when the percentage is significantly larger.
Ijgi 10 00152 g006
Figure 7. The local Moran’s I for theft, battery, burglary, and fraud. Dark red regions represent the high-high clusters, dark blue regions represent the low-low clusters, light blue regions represent the low-high spatial outliers, and light red regions represent the high-low spatial outliers.
Ijgi 10 00152 g007
Table 1. The number of crimes of different crime types from February to June in 2020 and 2019, and the rate of crime change in 2020 relative to 2019.
Crime TypeNumber of Crimes (2019)Number of Crimes (2020)Rate of Change
Assault89077217Decrease by 18.97%
Battery20,96417,158Decrease by 18.15%
Burglary36603775Increase by 3.14%
Criminal damage11,09410,368Decrease by 6.54%
Fraud75305338Decrease by 29.11%
Robbery30152788Decrease by 7.53%
Theft24,65716,223Decrease by 34.21%
Table 2. Results of Watson’s test for different types of crimes (samples are from the temporal distribution of crimes from February to June in 2020 and 2019).
Crime TypeStatistic (Day)p-Value (Day)Statistic (h)p-Value (h)
Assault0.5996p < 0.0010.10830.2366
Battery0.23830.01800.09410.3138
Burglary9.2889p < 0.0010.12220.1791
Criminal damage8.5963p < 0.0010.06740.5270
Fraud0.15040.10260.02540.9729
Robbery4.1132p < 0.0010.02990.9417
Theft1.5205p < 0.0010.02600.9697
Table 3. Global Moran’s I of local changes between 2020 and 2019 in different crimes. The p-value is the significance level of Moran’s I, and the Z-value is the Moran’s I statistic standard deviation.
Crime TypesGlobal Moran’s Ip-ValueZ-Score
Theft0.4250.000324.711
Battery0.1267.981 × 10−116.396
Burglary0.2212.2 × 10−1611.201
Fraud0.4292.2 × 10−1623.839
Publisher’s Note: MDPI stays neutral with regard to jurisdictional claims in published maps and institutional affiliations.