
A New Approach to Measuring the Similarity of Indoor Semantic Trajectories


Abstract
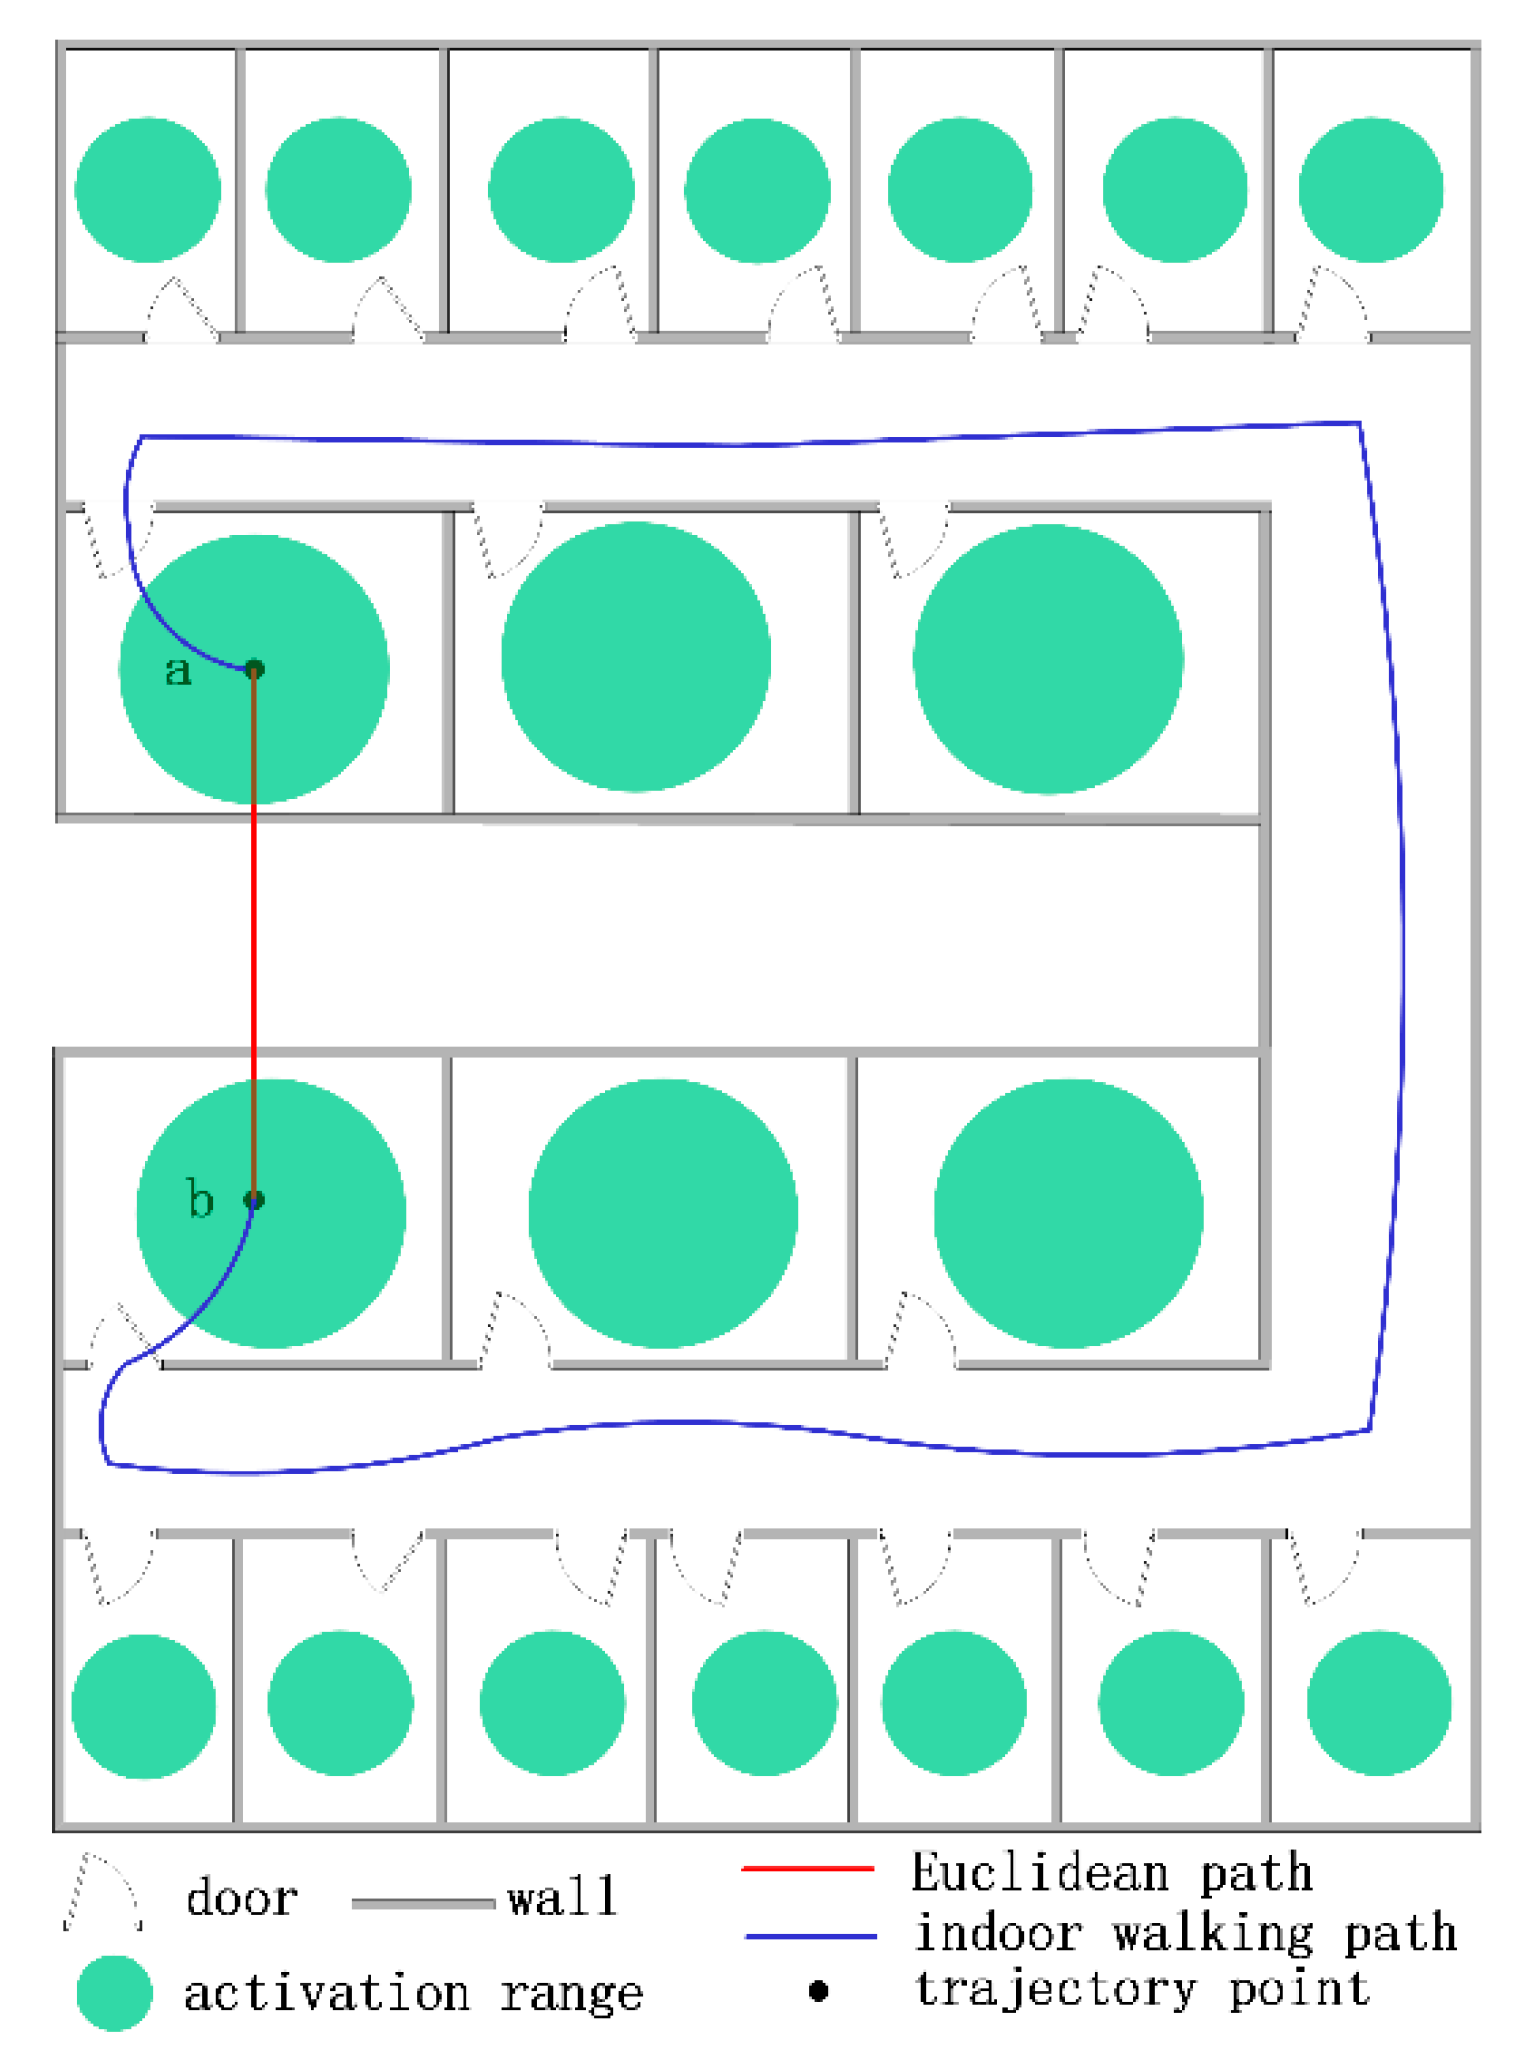
1. Introduction
2. Literature Review
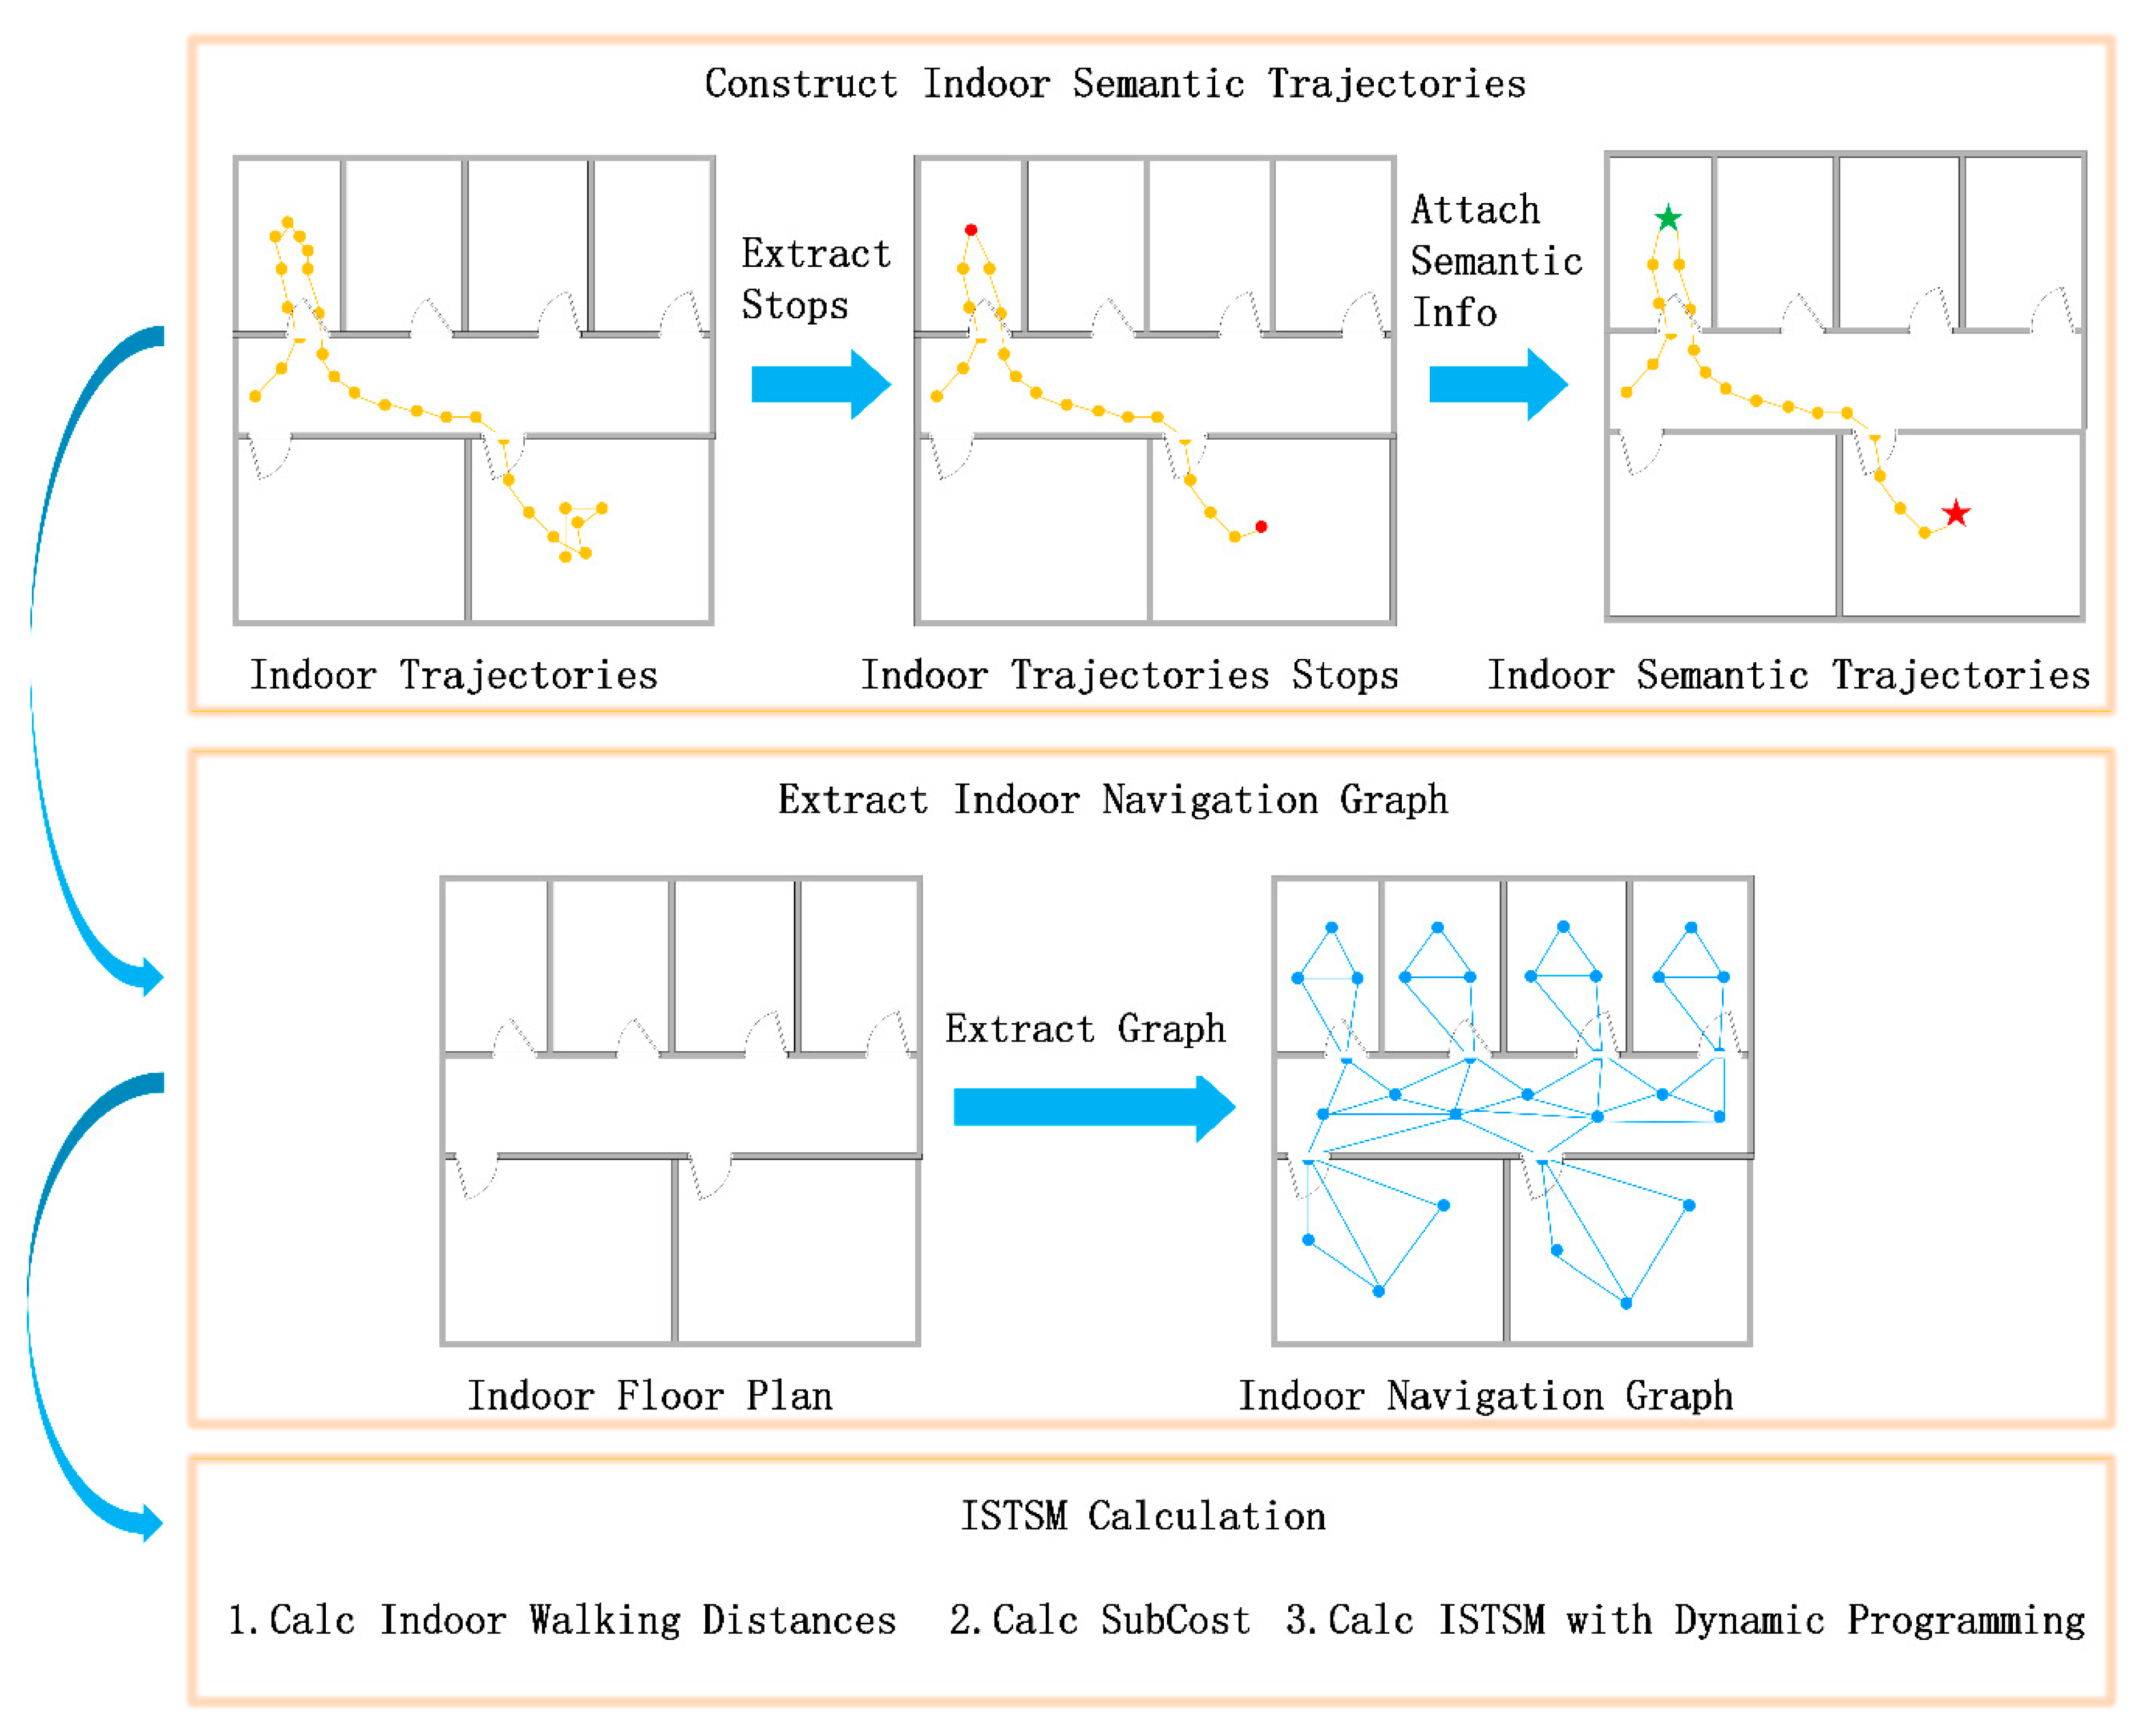
3. Methodology
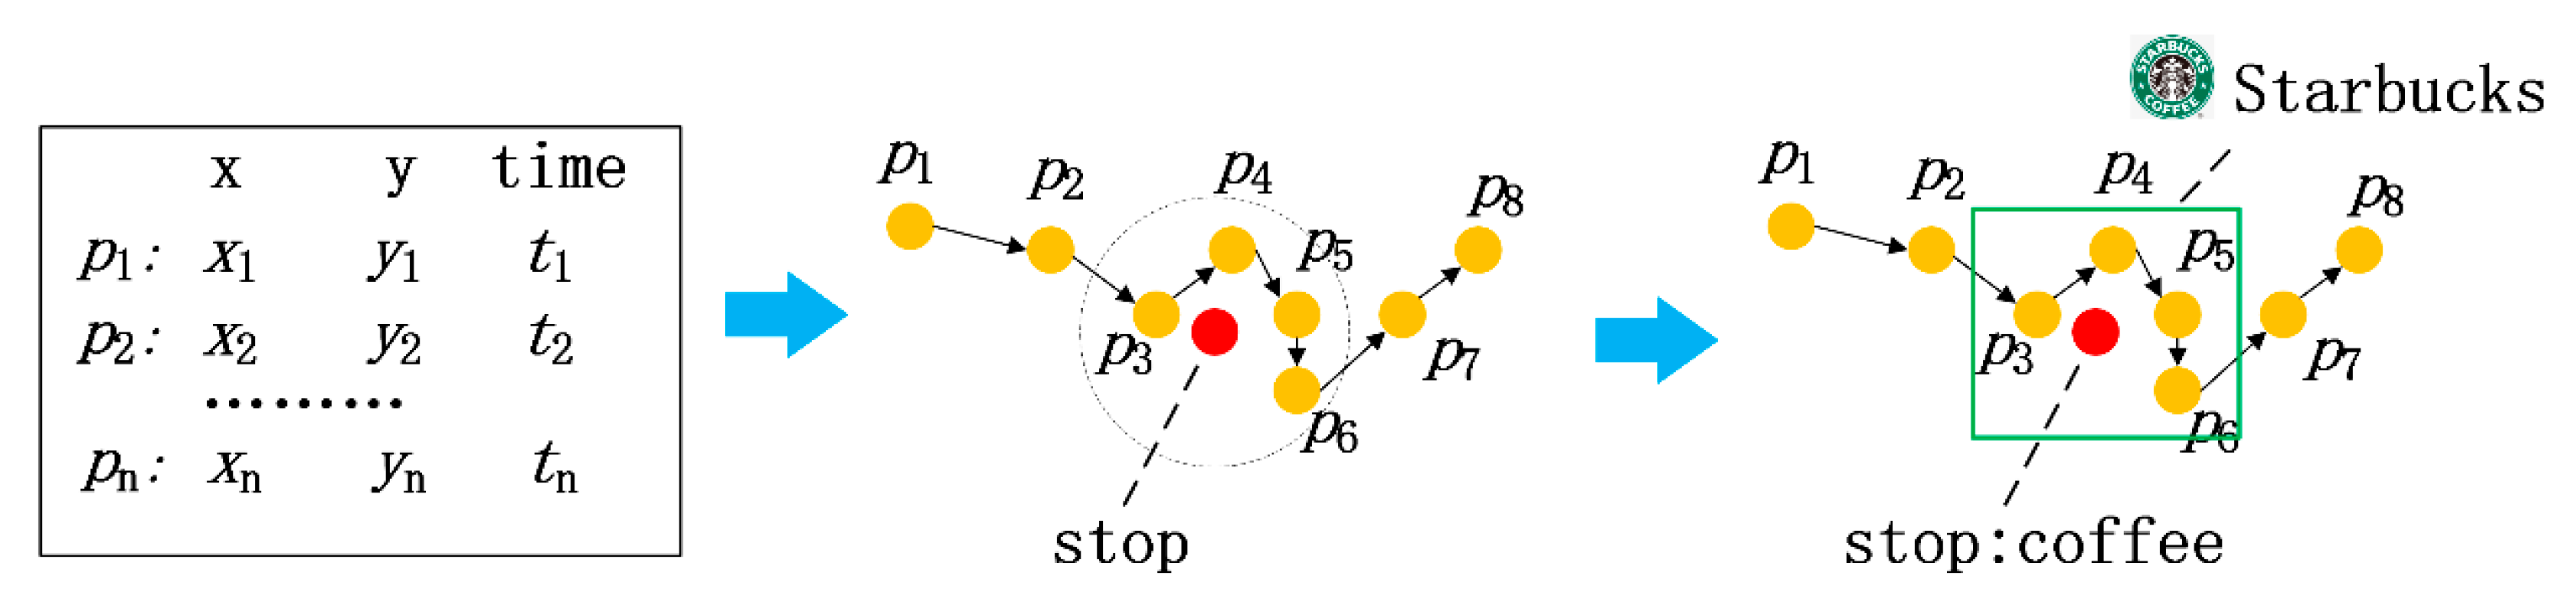
3.1. Constructing Indoor Semantic Trajectories
3.2. Extracting an Indoor Navigation Graph
3.3. ISTSM Computation
4. Experimental Evaluation
4.1. Experimental Analysis of the Synthetic Dataset
4.1.1. Data Transformation Methodology
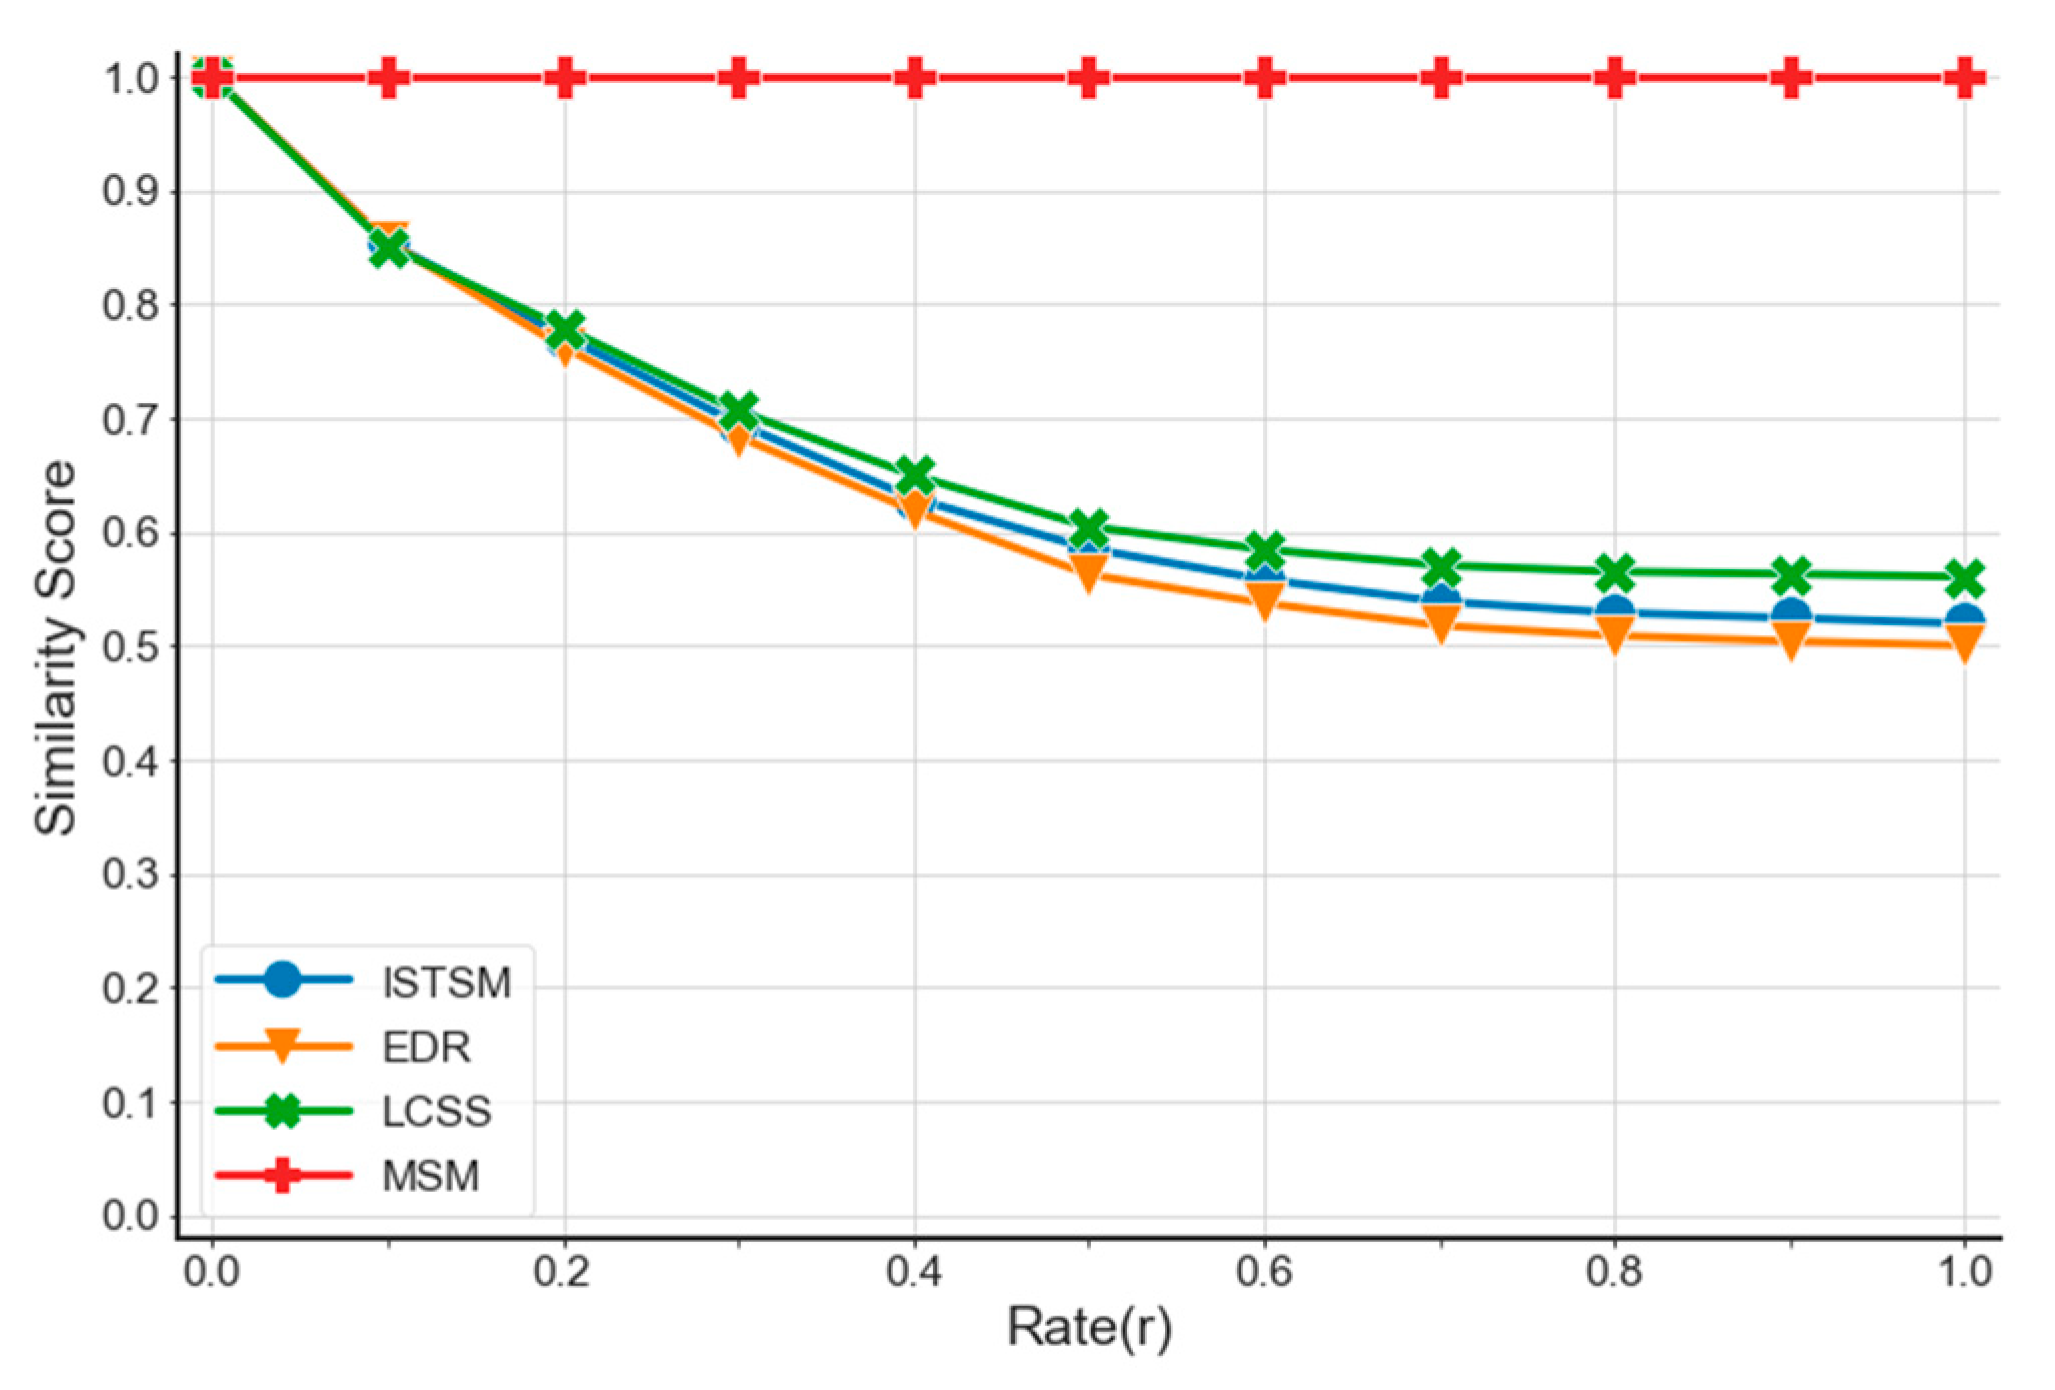
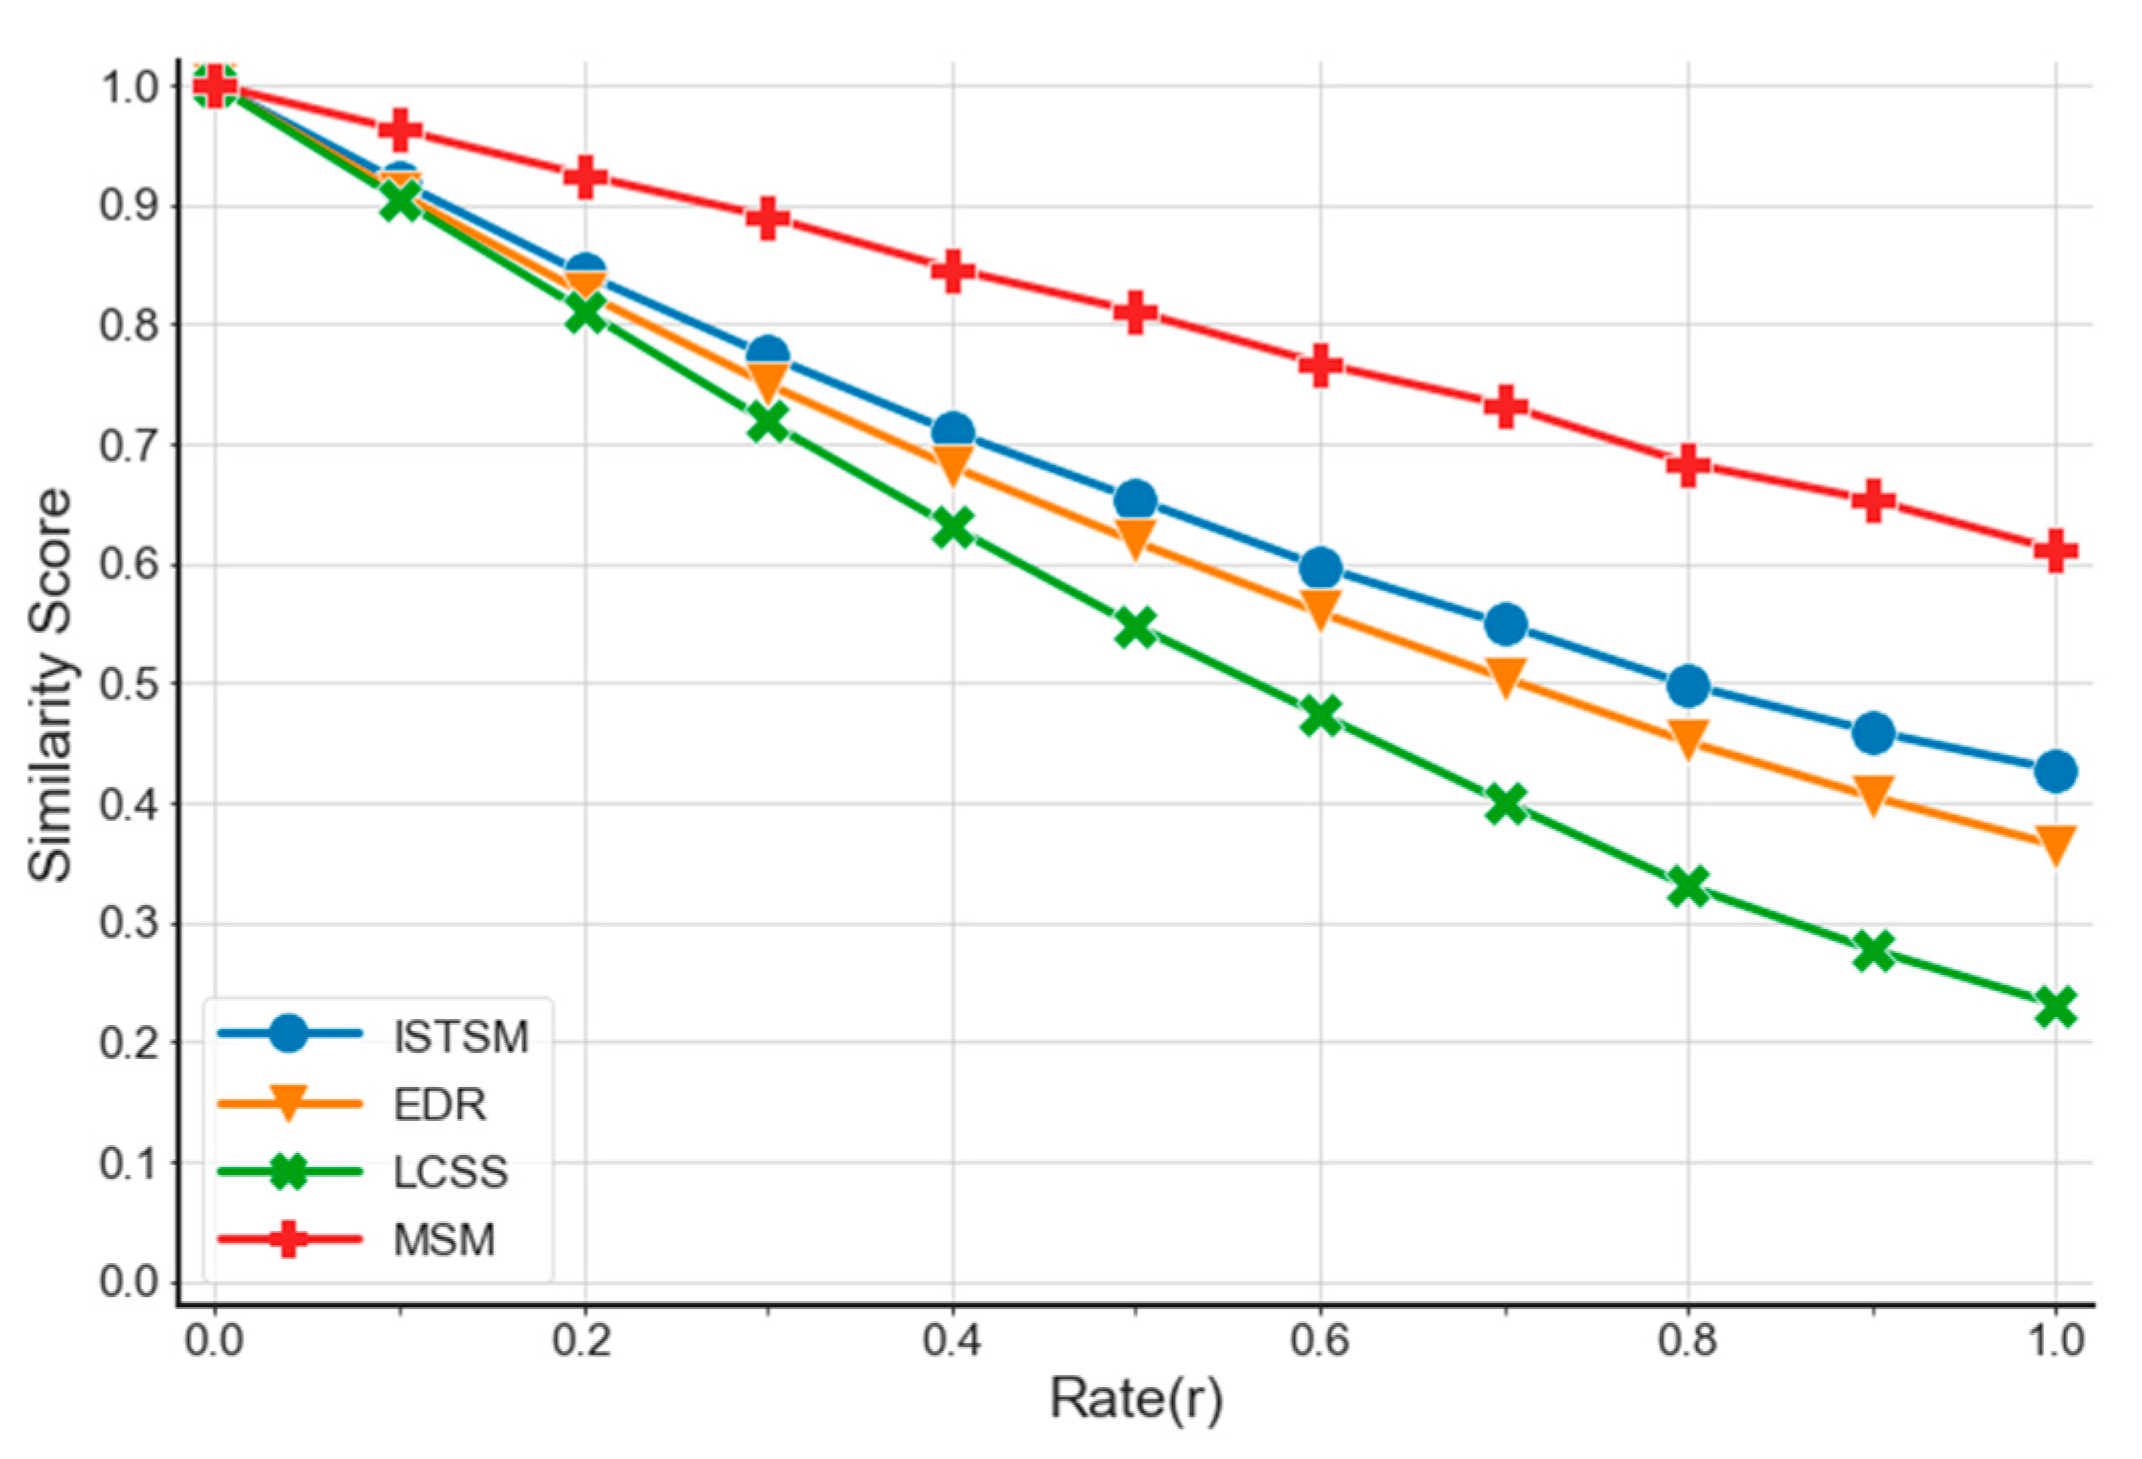
4.1.2. Experimental Results
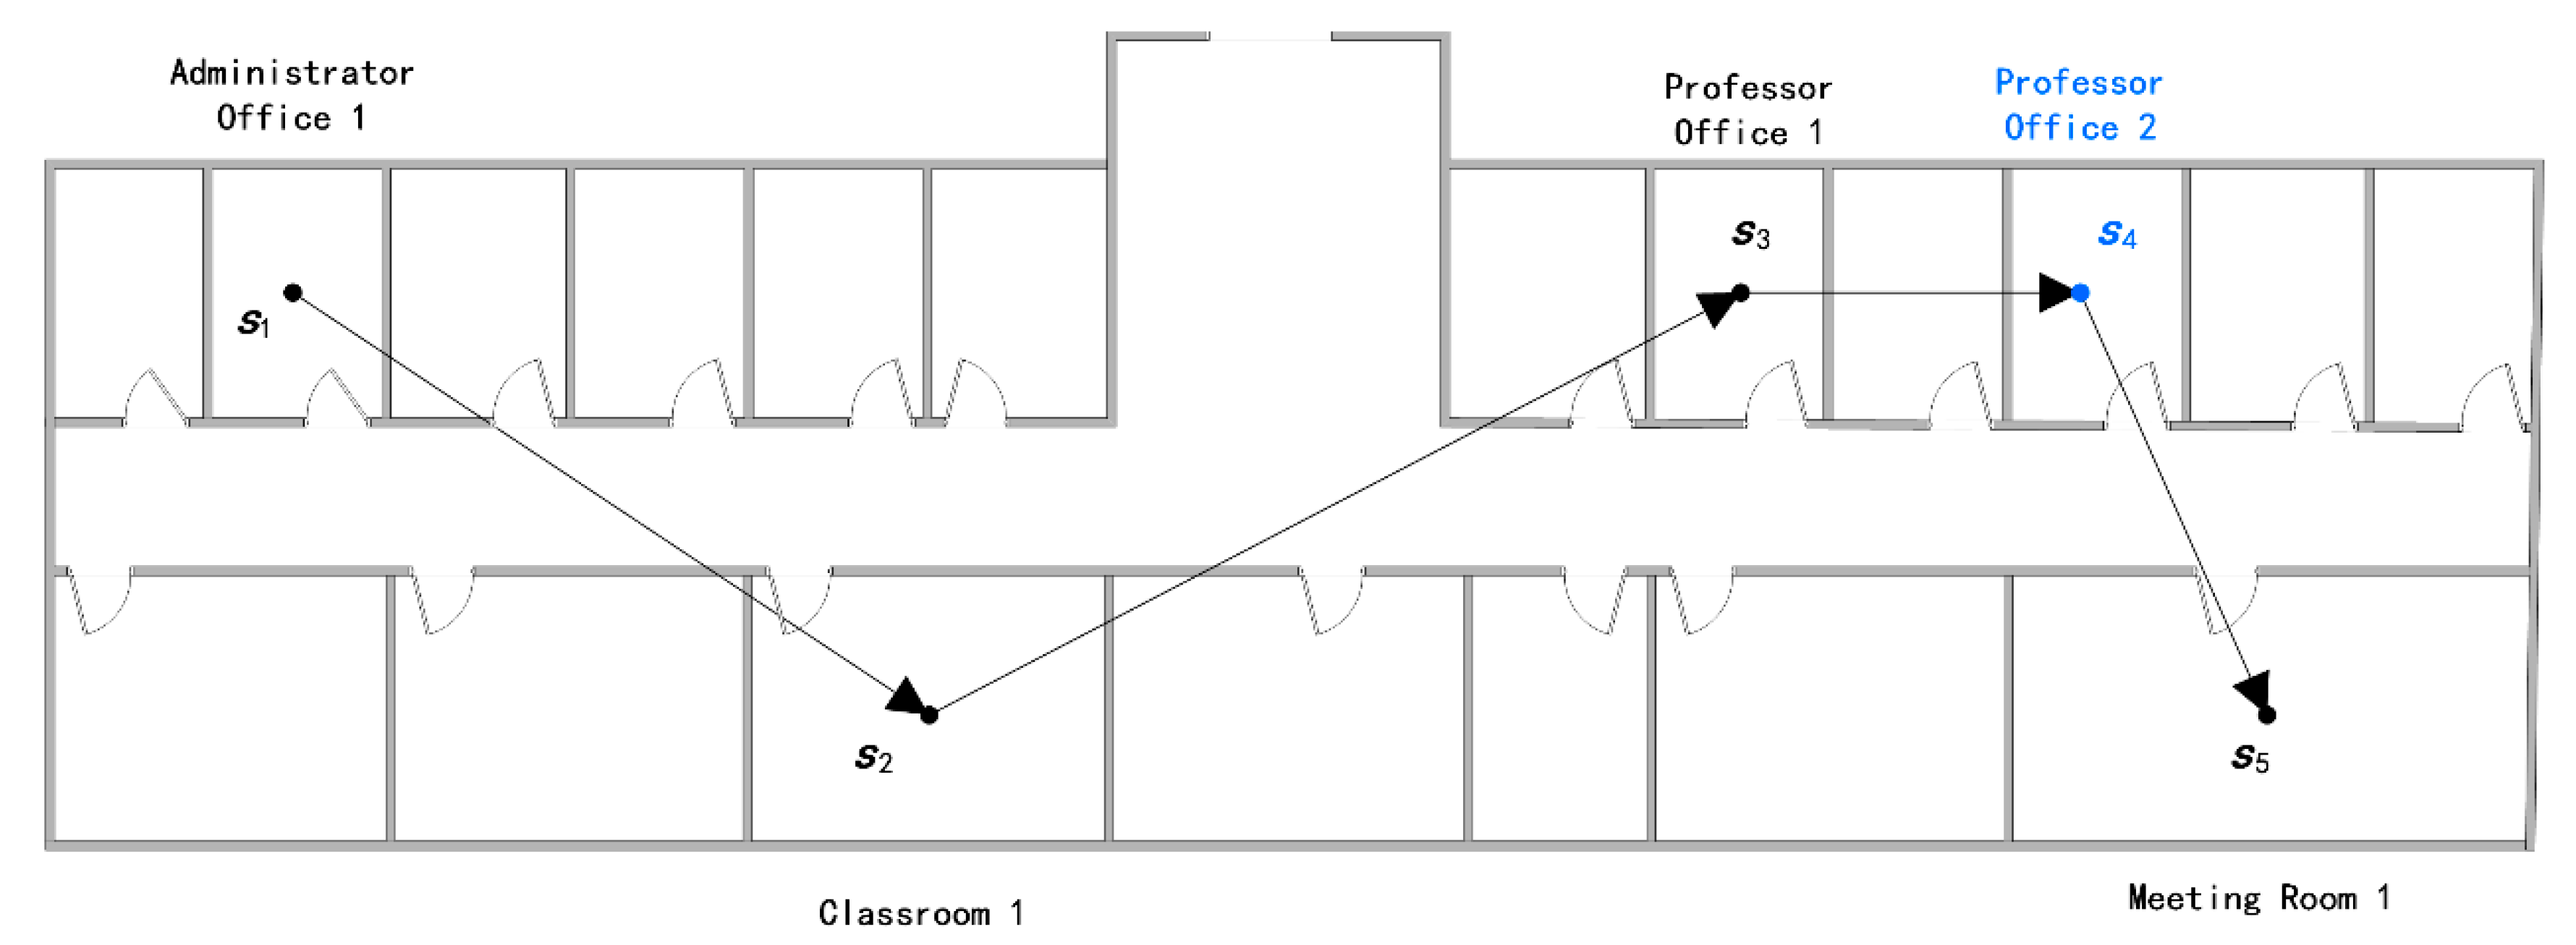
4.2. Case Study—Determining Customer Movement Patterns
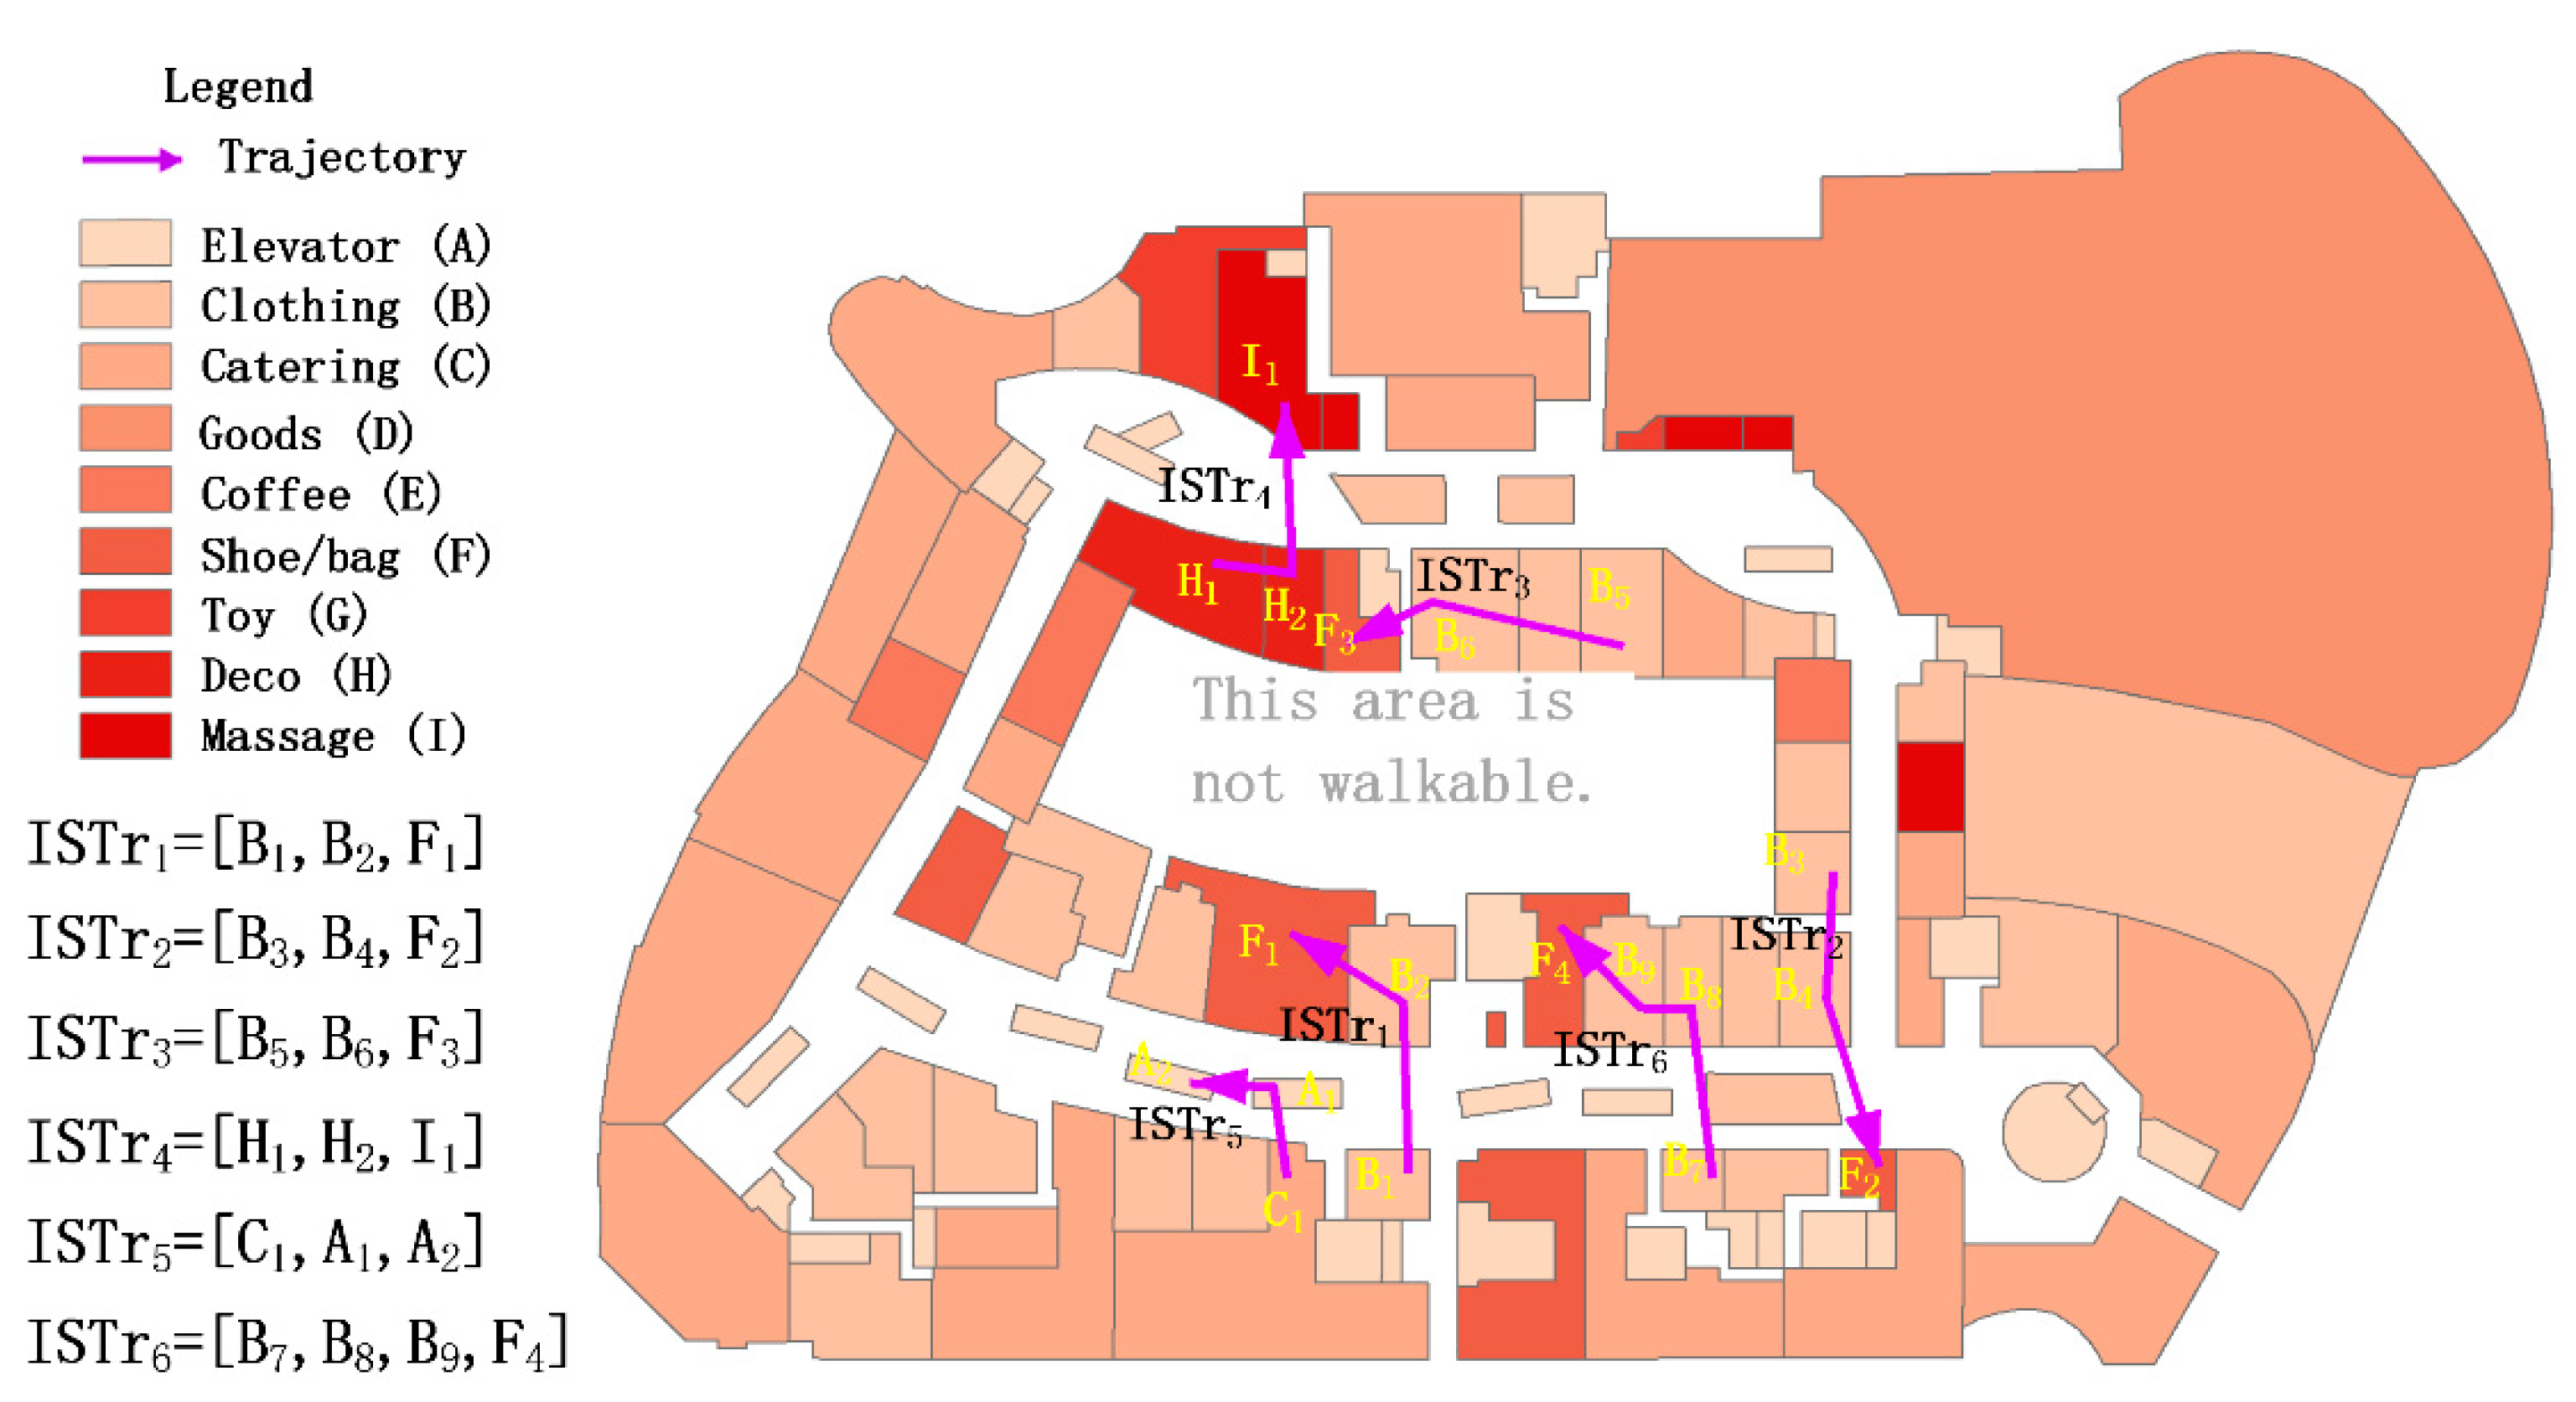
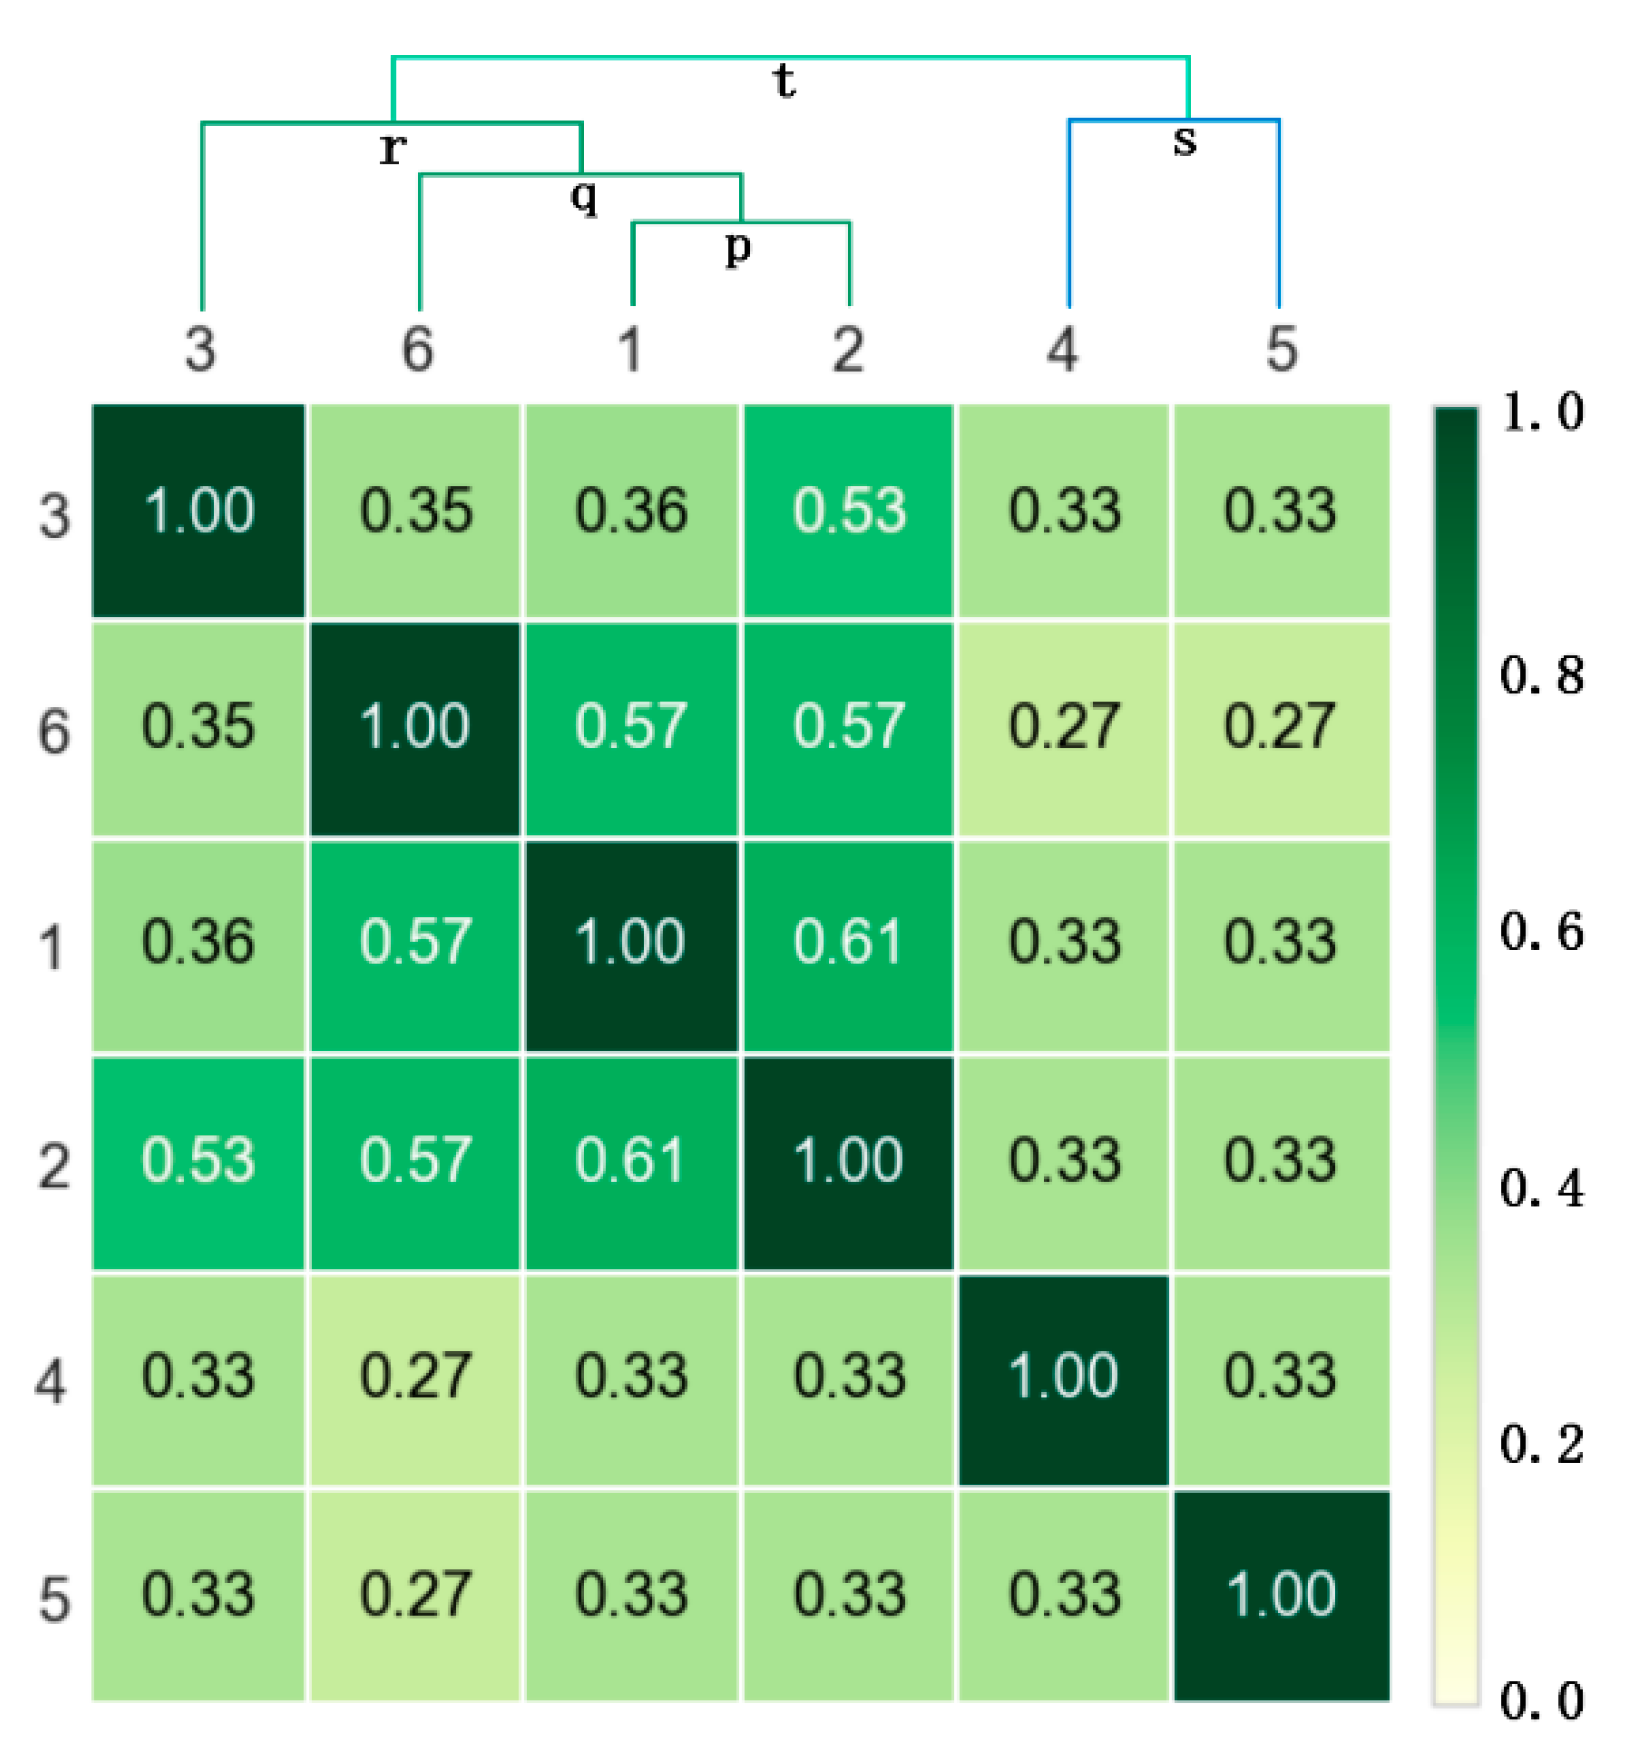
4.2.1. Trajectory Comparison
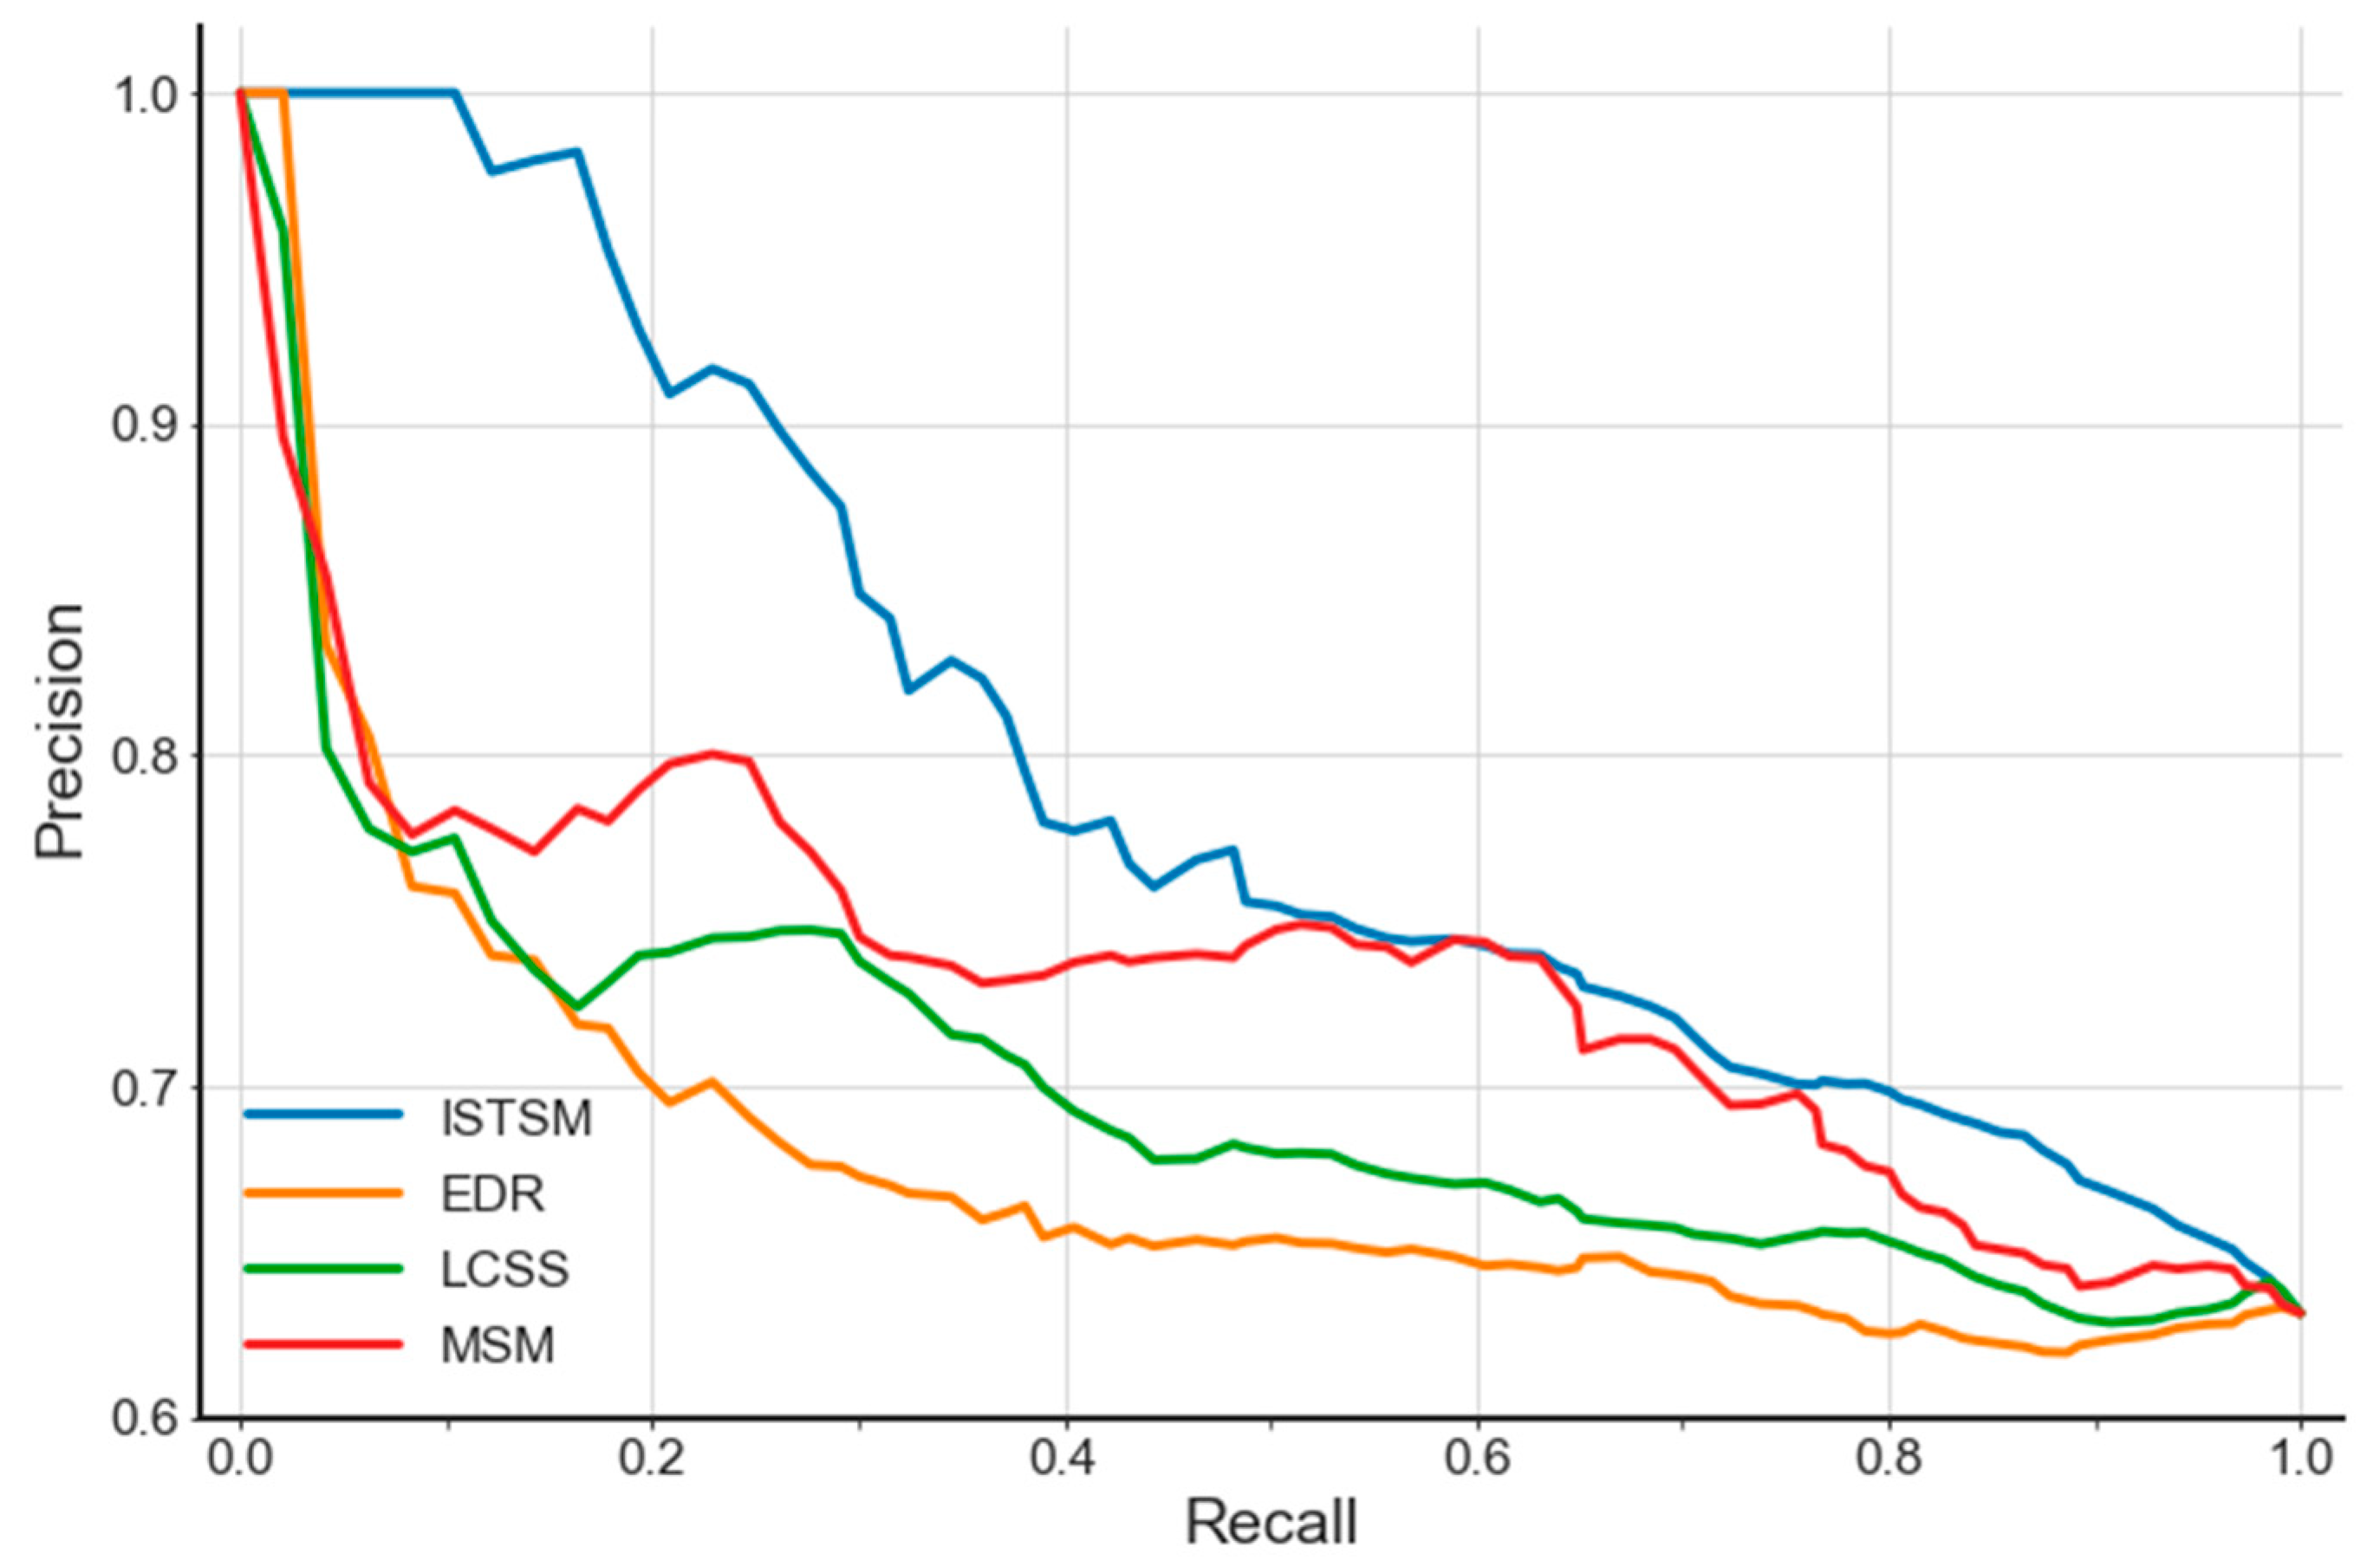
4.2.2. Precision Evaluation of ISTSM
4.2.3. Determining Customer Movement Patterns
5. Conclusions and Future Work
Author Contributions
Funding
Data Availability Statement
Acknowledgments
Conflicts of Interest
References
- Kim, J.; Hwangbo, H.; Kim, S.J.; Kim, S. Location-Based Tracking Data and Customer Movement Pattern Analysis Using for Sustainable Fashion Business. Sustainability 2019, 11, 6209. [Google Scholar] [CrossRef]
- Jin, P.; Cui, T.; Wang, Q.; Jensen, C.S. Effective Similarity Search on Indoor Moving-Object Trajectories. In Proceedings of the International Conference on Database Systems for Advanced Applications, Dallas, TX, USA, 16–19 April 2016; Springer: Cham, Switzerland, 2016; pp. 181–197. [Google Scholar]
- Wang, P.; Wu, S.; Zhang, H.; Lu, F. Indoor Location Prediction Method for Shopping Malls Based on Location Sequence Similarity. ISPRS Int. J. Geo-Inf. 2019, 8, 517. [Google Scholar] [CrossRef]
- Yoshimura, Y.; Sobolevsky, S.; Ratti, C.; Girardin, F.; Carrascal, J.P.; Blat, J.; Sinatra, R. An Analysis of Visitors’ Behavior in the Louvre Museum: A Study Using Bluetooth Data. Environ. Plan. B Plan. Des. 2014, 41, 1113–1131. [Google Scholar] [CrossRef]
- Parent, C.; Spaccapietra, S.; Renso, C.; Andrienko, G.; Andrienko, N.; Bogorny, V.; Damiani, M.L.; Gkoulalas-Divanis, A.; Macedo, J.A.; Pelekis, N.; et al. Semantic trajectories modeling and analysis. ACM Comput. Surv. 2013, 45, 1–32. [Google Scholar] [CrossRef]
- Ying, J.; Lu, E.; Lee, W.; Weng, T.; Tseng, V. Mining user similarity from semantic trajectories. In Proceedings of the Workshop on Location-Based Social Networks, San Jose, CA, USA, 2 November 2010; ACM: New York, NY, USA, 2010; pp. 19–26. [Google Scholar]
- Furtado, A.S.; Kopanaki, D.; Alvares, L.O.; Bogorny, V. Multidimensional Similarity Measuring for Semantic Trajectories. Trans. GIS 2016, 20, 280–298. [Google Scholar] [CrossRef]
- Lehmann, A.L.; Alvares, L.O.; Bogorny, V. SMSM: A similarity measure for trajectory stops and moves. Int. J. Geogr. Inf. Sci. 2019, 33, 1847–1872. [Google Scholar] [CrossRef]
- Petry, L.M.; Ferrero, C.A.; Alvares, L.O.; Renso, C.; Bogorny, V. Towards semantic-aware multiple-aspect trajectory similarity measuring. Trans. GIS 2019, 23, 960–975. [Google Scholar] [CrossRef]
- Liu, H.; Darabi, H.; Banerjee, P.; Liu, J. Survey of Wireless Indoor Positioning Techniques and Systems. IEEE Trans. Syst. Man Cybern. Part C Appl. Rev. 2007, 37, 1067–1080. [Google Scholar] [CrossRef]
- Laube, P. Computational Movement Analysis. Geogr. Inf. Sci. Technol. Body Knowl. 2017, 2017, 12–13. [Google Scholar] [CrossRef]
- Ranacher, P.; Tzavella, K. How to compare movement? A review of physical movement similarity measures in geographic information science and beyond. Cartogr. Geogr. Inf. Sci. 2014, 41, 286–307. [Google Scholar] [CrossRef]
- Vlachos, M.; Gunopulos, D.; Das, G. Rotation invariant distance measures for trajectories. In Proceedings of the Tenth ACM SIGKDD International Conference on Knowledge Discovery and Data Mining (KDD ‘04), Seattle, DC, USA, 22–25 August 2004; ACM: New York, NY, USA, 2004; pp. 707–712. [Google Scholar]
- Vlachos, M.; Kollios, G.; Gunopulos, D. Discovering similar multidimensional trajectories. In Proceedings of the 18th International Conference on Data Engineering (ICDE ‘02), San Jose, CA, USA, 26 February–1 March 2002; pp. 673–684. [Google Scholar] [CrossRef]
- Chen, L.; Özsu, M.; Oria, V. Robust and fast similarity search for moving object trajectories. In Proceedings of the 2005 ACM SIGMOD international conference on Management of data (SIGMOD ‘05), Baltimore, MD, USA, 14–16 June 2005; ACM: New York, NY, USA, 2005; pp. 491–502. [Google Scholar]
- Zhao, H.; Winter, S. A Time-Aware Routing Map for Indoor Evacuation. Sensors 2016, 16, 112. [Google Scholar] [CrossRef]
- Xie, D.; Li, F.; Phillips, J.M. Distributed trajectory similarity search. Proc. VLDB Endow. 2017, 10, 1478–1489. [Google Scholar] [CrossRef]
- Kang, H.; Kim, J.; Li, K. Similarity measures for trajectory of moving objects in cellular space. In Proceedings of the 2009 ACM symposium on Applied Computing, Honolulu, HI, USA, 8–12 March 2009; ACM: New York, NY, USA, 2009; pp. 1325–1330. [Google Scholar]
- Wang, Y.; Yu, G.; Gu, Y.; Yue, D.; Zhang, T. Efficient similarity query in RFID trajectory databases. In International Conference on Web-Age Information Management; Springer: Cham, Switzerland, 2010; pp. 620–631. [Google Scholar]
- Wan, Y.; Zhou, C.; Pei, T. Semantic-Geographic Trajectory Pattern Mining Based on a New Similarity Measurement. ISPRS Int. J. Geo-Inf. 2017, 6, 212. [Google Scholar] [CrossRef]
- Baba, A.I.; Lu, H.; Pedersen, T.B.; Xie, X. Handling False Negatives in Indoor RFID Data. In Proceedings of the 2014 IEEE 15th International Conference on Mobile Data Management, Brisbane, Australia, 14–18 July 2014; pp. 117–126. [Google Scholar]
- Baba, A.I.; Jaeger, M.; Lu, H.; Pedersen, T.B.; Ku, W.; Xie, X. Learning-Based Cleansing for Indoor RFID Data. In Proceedings of the 2016 International Conference on Management of Data, San Francisco, CA, USA, 26 June–1 July 2016; Association for Computing Machinery: San Francisco, CA, USA, 2016; pp. 925–936. [Google Scholar]
- Zhao, Z.; Ng, W. A model-based approach for RFID data stream cleansing. In Proceedings of the 21st ACM International Conference on Information and Knowledge Management, Maui, HI, USA, 29 October–2 November 2012; ACM: New York, NY, USA, 2012; pp. 862–871. [Google Scholar]
- Fazzinga, B.; Flesca, S.; Furfaro, F.; Parisi, F. Exploiting Integrity Constraints for Cleaning Trajectories of RFID-Monitored Objects. ACM Trans. Database Syst. 2016, 41, 1–52. [Google Scholar] [CrossRef]
- Fazzinga, B.; Flesca, S.; Furfaro, F.; Parisi, F. Interpreting RFID tracking data for simultaneously moving objects: An offline sampling-based approach. Expert Syst. Appl. 2020, 152, 113368. [Google Scholar] [CrossRef]
- Choset, H.; Burdick, J. Sensor-Based Exploration: The Hierarchical Generalized Voronoi Graph. Int. J. Robot. Res. 2000, 19, 96–125. [Google Scholar] [CrossRef]
- Xu, M.; Wei, S.; Zlatanova, S. An indoor navigation approach considering obstacles and space subdivision of 2D plan. ISPRS Int. Arch. Photogramm. Remote Sens. Spat. Inf. Sci. 2016, 339–346. [Google Scholar] [CrossRef]
- Giblin, P.; De Berg, M.; Van Kreveld, M.; Overmars, M.; Schwarzkopf, O. Computational Geometry: Algorithms and Applications. Math. Gaz. 2001, 85, 175. [Google Scholar] [CrossRef]
- Lee, J. A Spatial Access-Oriented Implementation of a 3-D GIS Topological Data Model for Urban Entities. GeoInformatica 2004, 8, 237–264. [Google Scholar] [CrossRef]
- Li, X.; Claramunt, C.; Ray, C. A grid graph-based model for the analysis of 2D indoor spaces. Comput. Environ. Urban Syst. 2010, 34, 532–540. [Google Scholar] [CrossRef]
- Hahmann, S.; Miksch, J.; Resch, B.; Lauer, J.; Zipf, A. Routing through open spaces–A performance comparison of algorithms. Geo-Spat. Inf. Sci. 2017, 21, 247–256. [Google Scholar] [CrossRef]
- Spaccapietra, S.; Parent, C.; Damiani, M.L.; De Macedo, J.A.; Porto, F.; Vangenot, C. A conceptual view on trajectories. Data Knowl. Eng. 2008, 65, 126–146. [Google Scholar] [CrossRef]
- Li, Q.; Zheng, Y.; Xie, X.; Chen, Y.; Liu, W.; Ma, W. Mining user similarity based on location history. In Proceedings of the 16th ACM Sigspatial International Conference on Advances in Geographic Information Systems, Irvine, CA, USA, 5–7 November 2008. [Google Scholar] [CrossRef]
- Dijkstra, E.W. A note on two problems in connexion with graphs. Numer. Math. 1959, 1, 269–271. [Google Scholar] [CrossRef]
- Levenshtein, V.I. Binary codes capable of correcting deletions, insertions, and reversals. Dokl. Akad. Nauk SSSR 1966, 163, 845–848. [Google Scholar]
- Yujian, L.; Bo, L. A Normalized Levenshtein Distance Metric. IEEE Trans. Pattern Anal. Mach. Intell. 2007, 29, 1091–1095. [Google Scholar] [CrossRef]
- Wang, H.; Su, H.; Zheng, K.; Sadiq, S.; Zhou, X. An Effectiveness Study on Trajectory Similarity Measures. In Proceedings of the Twenty-Fourth Australasian Database Conference (ADC 2013), Adelaide, Australia, 29 January–1 February 2013; pp. 13–22. [Google Scholar]
- Satopaa, V.; Albrecht, J.; Irwin, D.; Raghavan, B. Finding a “Kneedle” in a Haystack: Detecting Knee Points in System Behavior. In Proceedings of the 31st International Conference on Distributed Computing Systems Workshops, Minneapolis, MN, USA, 20–24 June 2011; pp. 166–171. [Google Scholar] [CrossRef]
- Manning, C.D.; Raghavan, P.; Schutze, H. Introduction to Information Retrieval; Cambridge University Press: Cambridge, UK, 2008. [Google Scholar]


| ISTSM | MSM | LCSS | EDR | |
|---|---|---|---|---|
| MAP | 0.80 | 0.75 | 0.71 | 0.68 |
Publisher’s Note: MDPI stays neutral with regard to jurisdictional claims in published maps and institutional affiliations. |
© 2021 by the authors. Licensee MDPI, Basel, Switzerland. This article is an open access article distributed under the terms and conditions of the Creative Commons Attribution (CC BY) license (http://creativecommons.org/licenses/by/4.0/).
Share and Cite
Zhu, J.; Cheng, D.; Zhang, W.; Song, C.; Chen, J.; Pei, T. A New Approach to Measuring the Similarity of Indoor Semantic Trajectories. ISPRS Int. J. Geo-Inf. 2021, 10, 90. https://doi.org/10.3390/ijgi10020090
Zhu J, Cheng D, Zhang W, Song C, Chen J, Pei T. A New Approach to Measuring the Similarity of Indoor Semantic Trajectories. ISPRS International Journal of Geo-Information. 2021; 10(2):90. https://doi.org/10.3390/ijgi10020090
Chicago/Turabian StyleZhu, Jin, Dayu Cheng, Weiwei Zhang, Ci Song, Jie Chen, and Tao Pei. 2021. "A New Approach to Measuring the Similarity of Indoor Semantic Trajectories" ISPRS International Journal of Geo-Information 10, no. 2: 90. https://doi.org/10.3390/ijgi10020090
APA StyleZhu, J., Cheng, D., Zhang, W., Song, C., Chen, J., & Pei, T. (2021). A New Approach to Measuring the Similarity of Indoor Semantic Trajectories. ISPRS International Journal of Geo-Information, 10(2), 90. https://doi.org/10.3390/ijgi10020090