Abstract
The new national IdroGEO web platform allows the navigation, social sharing and download of data, maps, reports of the Italian Landslide Inventory, national hazard maps, and risk indicators. It is a tool for communication and dissemination of information to support decisions in risk mitigation policies, land use planning, preliminary design of infrastructures, prioritization of mitigation measures, management of civil protection emergencies, and environmental impact assessment. The challenges that have been faced during the design and development of the platform concern usability, access on multiple devices (smartphones, tablets, desktops), interoperability, transparency, reuse of information and software in the public sector, and improvement of the updating of the Italian Landslide Inventory. The methodologies and solutions adopted to address them include Progressive Web Application (PWA), Application Programming Interface (API), open standards, open libraries, and software. A landslide inventory management system has been developed via REST API for data entry and approval workflow in order to maintain the inventory in a distributed and collaborative manner. As a result, IdroGEO provides a public service for citizens, public administration, and professionals, using the “mobile first” approach and with scalable and reliable architecture. IdroGEO represents a solid infrastructure for the interoperability of data that serves as the foundation for creating a first knowledge-graph on landslides and the community who manages them.
1. Introduction
The dissemination of information on natural hazards is a strategic objective for the Italian Institute for Environmental Protection and Research (ISPRA) and more generally for a Public Administration (PA). Informing citizens on the risks affecting one’s own territory promotes greater awareness and informed decisions on where to buy your home or locate new economic activities, and therefore it has an important social and economic implication, contributing to the reduction of damage and costs [1,2]. Data dissemination responds to the first priority “Understanding disaster risk” of the Sendai Framework for Disaster Risk Reduction 2015–2030 [3] and contributes to achieving targets 11.5 and 13.1 of the Sustainable Development Goals (SDGs), related to significantly reduce the number of deaths and the number of people affected and decrease the direct economic losses caused by disasters, as well as strengthen resilience and adaptive capacity to climate related hazards and natural disasters in all countries [4].
This paper reports on the development of the new IdroGEO platform [5], which is an integrated multilingual solution (IT, EN, FR, DE) and modular information system that allows the management and consultation of data, maps, reports, photos, videos, and documents of the Italian Landslide Inventory (IFFI), national hazard maps, and landslide and flood risk indicators. It is a tool for communication and dissemination of information and to support decisions in the context of risk mitigation policies, land use planning, preliminary design of infrastructures, planning of mitigation interventions, management of civil protection emergencies, and environmental impact assessment.
The rapid evolution of web mapping in the last 15 years, due to the technological development and the increased number of users, has changed the user interaction with geospatial data from passive to active and collaborative mode [6]. One of the most important aspects of web maps is that they should be easy to use and attractive to different groups of users despite not always fulfilling all of the needs of each [7,8]. Usability is defined in the ISO 9241-11 standard as “the effectiveness, efficiency, and satisfaction with which specified users achieve specified goals in particular environments” [9]. With the proliferation of apps and different web enabled devices, mapping applications also evolved and specialized to address use-cases spanning from making easily accessible proximity or contextual data in mobility, to collaborative collection of data for crowdsourced mapping [10]. Crowdsourcing or citizen science is a methodology of involving citizens to participate in data collection [11]. It is becoming increasingly common thanks to the availability of technical tools (wide use of internet, Global Positioning System (GPS), web mapping) and to better science communication [12]. In this context, the efficient use of existing (or more common) knowledge such as web development languages versus platform specific mobile programming languages has attracted developers and companies to adopt a web-based development approach as the Progressive Web Application (PWA) [13,14], which presents several benefits in making web applications working offline as installed apps on multiple devices [15].
Recently, the European Commission has decided a series of policy instruments to implement digital transformation in governments, such as the EU Directive 2019/1024 on open data and reuse of public sector information [16], the EU eGovernment Action Plan 2016–2020 [17], the eGovernment Declaration 2017-2021 [18], and the European Interoperability Framework (EIF) [19] (part of the Communication COM/2017/134). The European Commission promotes the adoption of Application Programming Interfaces (APIs) for the publication of public sector information and for public service provision [20]. Specifically, API solutions are modular, reusable, and easily scalable. These characteristics endow API-enabled environments with high flexibility, both technically and organisationally [21,22,23]. In Italy, the objectives of technological innovation and digital transformation of the PA, i.e., simplicity, transparency, open data, and interoperability of public services, are highlighted in the 3-year plan for information technology in the public administration 2020-2022 [24], in the rules of the digital administration code (legislative decree 82/2005), in the guidelines on the acquisition and reuse of software for public administrations by the Agency for Digital Italy (AgID) [25,26], in the legislative decree 33/2013 for access, transparency, and dissemination of PA data, and in the AgID guidelines for the design of digital services of the public administration.
2. Materials and Methods
In accordance with the ISO 9241-210 “Human-centred design for interactive systems” [27], the workflow for the development of the IdroGEO platform was organized into four phases: (1) specification of the context of use; (2) analysis of user requirements; (3) identification of design solutions; (4) evaluation of the platform.
With regard to phase 1, the following categories of users have been identified: decision makers, urban and land use planners of central and local public administrations, rail and road companies, professionals and citizens.
The main user requirements identified in phase 2 were: ease of use, accessibility with different types of devices (smartphones, tablets, desktops), clear and complete information, sharing on social networks, production of reports, and download of data.
The design solutions (phase 3) concerned: the definition of the data model and the editing and validation workflow of the Italian Landslide Inventory (Section 2.1.1), the user interface (Section 2.2), and the system architecture (Section 2.3).
Finally, methods have been set up to evaluate the use and usability of the platform (Section 2.4).
2.1. Data Description and Data Model
The Italian Landslide Inventory (Inventario dei Fenomeni Franosi in Italia (IFFI)) [28], with more than 620,000 landslides affecting an area of 23,700 km2, equal to 7.9% of the Italian territory, is the most complete and detailed landslide database in Italy, for the number of parameters and the 1:10,000 map scale [29]. Temporal coverage of the landslide dates of occurrence in the inventory goes from the year 1116 to 2020.
The inventory is carried out by ISPRA and by the Regions and Autonomous Provinces [30]. Inventory data is updated through the IFFI web editor or the API services of the IdroGEO application (see Section 2.2 and Section 2.3). The online map of landslides is refreshed every 24 h (Figure 1).
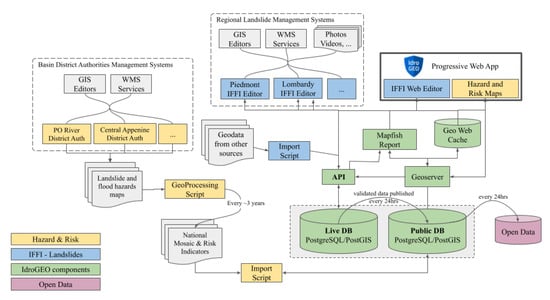
Figure 1.
Information data flow of IdroGEO platform.
The national mosaics of landslide and flood hazard zones are realised by ISPRA every 3 years on the basis of the data provided by the River Basin District Authorities (Figure 1). Landslide hazard is the probability of occurrence of a potentially damaging phenomenon within a given area and in a given period of time [31]. The landslide hazard zones of the river basin plans (Piani di Assetto Idrogeologico (PAI)) include, in addition to occurred landslides, areas of possible evolution of existing landslides and areas where new landslides potentially may occur [32,33,34]. The landslide hazard assessment has been done by the River Basin District Authorities using geomorphological, statistical or matrix methods. ISPRA harmonized the source data in 5 classes: very high hazard H4, high H3, medium H2, moderate H1, and attention zones AA. The total area of these zones in Italy is 59,981 km2 (19.9% of the national territory). If we take into account the most hazardous classes (high H3 and very high H4), the area amounts to 25,410 km2, equal to 8.4%. Some mapping inhomogeneities have been identified, mainly due to the different methods used by the River Basin District Authorities for landslide hazard assessment [29].
The national mosaic of flood hazard zones is realized according to the three hazard scenarios of Flood Directive 2007/60/EC [35]: high probability scenario with a return period of 20–50 years (frequent floods), medium probability scenario with a return period of 100–200 years, and low probability or extreme event scenario. The high flood hazard zones in Italy amount to 12,405 km2, the medium flood hazard zones to 25,398 km2, and the low hazard zones to 32,961 km2 [29].
The municipalities affected by landslide hazard zones (high and very high hazard) and/or flood hazard zones (medium probability scenario, return period of 100–200 years) are 7275 equal to 91.1% of the Italian municipalities. The area classified as high and very high landslide hazard and/or medium flood hazard in Italy amounted to 50,117 km2, equal to 16.6% of the national territory [29].
Risk indicators, developed by ISPRA and related to population, families, buildings, industries and services, and cultural heritage, provide an official reference for landslide and flood risk in Italy and an important tool to support national mitigation policies by identifying intervention priorities, allocation of funds, programming mitigation measures, and planning civil protection measures.
The adopted methodology responds to transparency and repeatability criteria and uses official data available across the national territory [29]. It refers to the equation R = H × E × V where R is the Risk, H is the Hazard, E is the exposed Element, and V is Vulnerability. The ISPRA national mosaics of landslide and flood hazard zones, the 15th ISTAT Population Census 2011, the 9th ISTAT Census of Industry and Services 2011, and the ISCR Database of Cultural Heritage have been used as input data. The estimate of the population exposed to landslide risk has been processed using the 402,678 ISTAT 2011 census sections as a mapping unit. The number of exposed people has been calculated with a proportional method, multiplying the percentage of landslide hazard zones inside each census section for the resident population of the section [36]. Data aggregation on municipal, provincial, regional, and national basis has been then performed. The population at risk represents the population living in landslide hazard zones exposed to the risk of damage (dead, missing, injured, evacuated people).
Vulnerability [34,37], which represents the degree of loss of the element at risk that can be damaged during an event (value from 0 to 1), has been assigned as a precaution equal to 1, as its assessment would require knowledge of the landslide magnitude (velocity and volume) as well as knowledge of the behaviour/resilience of the population categories (e.g., elderly, children, non-self-sufficient). Vulnerability may also vary based on the time of year (summer/winter), week (weekdays/holidays), and time (day/night) in which the event occurs.
Similarly, the population exposed to flood risk has been estimated. The vulnerability has also been set equal to 1, as the information on the flood water level and flow velocity was not available for the entire national territory.
Families, buildings, industry and services local units at risk have been estimated with a similar methodology. Cultural heritage at risk has been assessed through the intersection of the georeferenced points of cultural sites with the national mosaics of landslide and flood hazard [29].
2.1.1. IFFI Data Model and Editing Workflow
The data model of the Italian Landslide Inventory is composed of three entities: the “Landslide Report”, the “Landslide Event”, and the “IFFI Landslide”.
- Landslide Reports contain a limited amount of information (e.g., location, damage, date of occurrence) or multimedia content (photos, videos, documents). Reports are entered by public administration officers (e.g., forestry services, municipal technicians) or by professionals (geologists, engineers, etc.), and validated by the IFFI regional technical units.
- Landslide Events have a known date of occurrence and are recorded by filling in the Event online form, which contains a selection of fields from the IFFI Landslide form and fewer mandatory fields. The Event form can be used, especially during emergency activities, to easily register a landslide event, both for a newly formed landslide and for a reactivation of an existing IFFI landslide. Geometry can be represented only with a point or also with a polygon regardless of the landslide size.
- IFFI Landslides are recorded by filling in the complete IFFI Landslide online form. Each Landslide is represented by a point (Landslide Identification Point) located at the landslide crown, by a polygon when the area of the landslide can be mapped at the adopted survey scale or by a line, when the width of the landslide cannot be mapped (e.g., rapid debris flows) [30].
The data model is designed to encapsulate the smallest entity (the Landslide Report) into the others. There is a subset of fields in common between Reports, Events and Landslides, and others that are in common just between Events and Landslides. This approach defines a nested structure that represents the basement of the entities translation process: report information can be used as a template for events or landslides. Similarly, an event can be translated into a landslide once a more comprehensive set of details is available.
The resulting data model is composed of 144 main fields, including primitive and complex data types logically organized in 19 data categories (Table 1).

Table 1.
Italian landslide inventory—data categories.
The approach used to store such a number of information is to avoid a complex and branched relational model, and rather use a hybrid model, taking into account the solution adopted by already consolidated tools such as Osmium and OSM2pgsql, that leverage HSTORE fields to store OpenStreetMap (OSM) tags [38,39]. Semi-structured data types are stored as JSONB [40] fields, giving the developers the ability to dynamically define their content, easily adapt the structure of the field over time, and avoid being limited in size for growing fields (handled using JSONB arrays).
Going deeper on the landslide data model, mandatory fields have been identified in:
- Landslide ID
- Reporter
- Institution
- Date of report
- Geographical context related data (Region, Province, Municipality, River Basin District Authority)
- Description
- Type of movement
- Date of observation
- State of activity
- Method (used to evaluate the type of movement and state of activity)
- Damage
Landslides are categorized using a model composed of three levels, where a lower level identifies a less detailed entity. The first level contains basic data on landslide location, type of movement, and state of activity. The second level provides data on lithology, geotechnical properties, and causes. The third level gives information on investigations, date of occurrence or remedial measures for risk reduction. Levels have been defined to reflect the informative content associated with the landslide and are not related to the entity type (report, event, landslide). For such reasons, the level is not assigned to reports and events.
As well as for the level assignment, other data management procedures are delegated to database functions and triggers. The aim of the database-level defined functions is to leverage the database computation capacity and decuple the business logic from pure data processing execution. The adoption of the PostGIS [41] extension for the PostgreSQL [42] DBMS, enables the back-end developers to not care about the computation of geographical related information (bounding box or feature area measures), as they are automatically elaborated during entity persistence.
Geometries serialization is implemented using the Well-Known Text (WKT) representation of the geometry format [43], an open standard defined by the Open Geospatial Consortium (OGC) [44,45]. As stated by Wagner et al. [46], it is largely adopted in the semantic web context together with other web oriented standards such as GeoJSON [47]. The WKT adoption enables the application to serialize its content to a data format that can be easily converted and exchanged between the front-end and back-end. At the back-end level, the conversion (both serialization and deserialization) is applied using the PostGIS provided functions. In the front-end, it is handled by the Openlayers [48] library (serialization and deserialization, as well).
The IdroGEO platform represents the single point of truth for Landslide IDs definition and management at the national level. The generation of the IDs is handled by a dedicated function that, based on the geographical context of the landslide, assigns a unique ID to be used across other (regional) landslide management systems.
Once the landslide is created, an approval workflow needs to be executed before the entity becomes publicly available. During the process execution, the old instance of the entity remains the current official version, waiting for a new version to be confirmed. When the process is completed, a revised version of the landslide is published as a revision of the previous. The existing landslide is versioned (tagged), and a copy is kept for future reference to be used for monitoring and legal purposes.
The process involves a data quality protocol based on three figures: regional data entry, regional validator, and ISPRA validator (Figure 2).
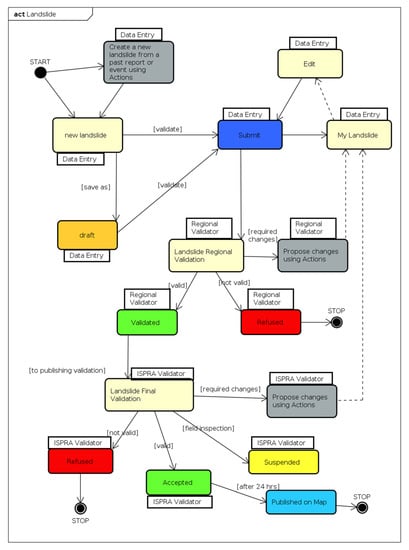
Figure 2.
Landslide data management lifecycle diagram.
2.2. User Interface
The IdroGEO user interface has been designed to ensure high usability. Usability is considered to be one of the most important quality factors for web applications [49]. Dissemination of information from government to citizen, which represent one of the IdroGEO platform objectives, is also impacted by usability up to the point that the ease or difficulty that users experience with these web applications determines their success or failure [50].
The IdroGEO application has been designed with two sections: one relating to the Italian Landslide Inventory, the other to the landslide and flood Hazard maps and Risk Indicators (HRI).
Access to the platform takes place in two ways: free access and registered access. In the free access mode, the user can navigate on the map and download the hazard and risk data. A registered access allows the reporting of new landslides, which is currently reserved to officers of public administrations and professionals. An access with login is also necessary to access the management area of the IdroGEO platform for updating the Italian Landslide Inventory by IFFI regional officers and by ISPRA.
By hovering the mouse over the map (mouseover function) on the desktop or with a tap on a smartphone, the user can view aggregated data on national, regional, provincial or municipal basis on the information panel, according to the current map scale (Figure 3). These data are presented through dynamic infographics which, in an innovative way compared to similar web map applications, provide immediacy to the content and a significant communicative impact.
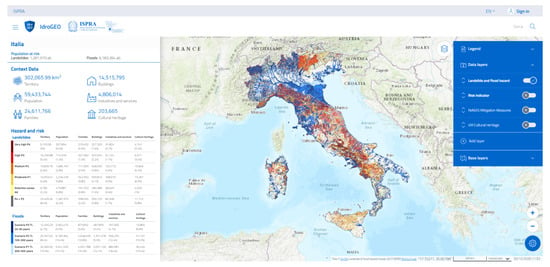
Figure 3.
IdroGEO platform—landslide and flood hazard maps and risk indicators (HRI) section.
The IFFI section displays data relating to the number of landslides, events, reports, and the histogram with the distribution by type of movement, contextualized on the selected administrative boundary. At appropriate zoom levels and by clicking on the single IFFI landslide, the user can view a selection of its attributes: Landslide ID, Region, Province, Municipality, River Basin District Authority, Type of movement, Description, Activity, Lithology, Land use, Method, Damage, Landslide area, Date of observation, Date of occurrence, Causes, Mitigation measures, and any attached multimedia files (Figure 4).
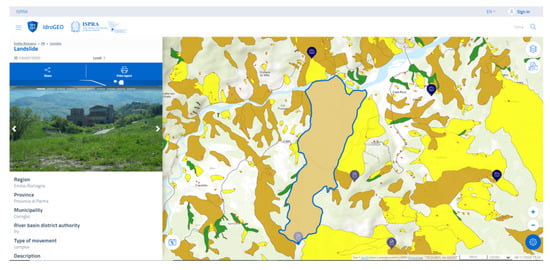
Figure 4.
IdroGEO platform—Italian landslide inventory (IFFI)) section: information and multimedia on a single landslide.
The IFFI management area allows authorized users from ISPRA and technical offices of the Regions and Autonomous Provinces to manage and upload landslide geometry and related parameters (Section 2.1.1) in the IFFI inventory in a distributed and collaborative manner, greatly simplifying the updated activities (Figure 5).
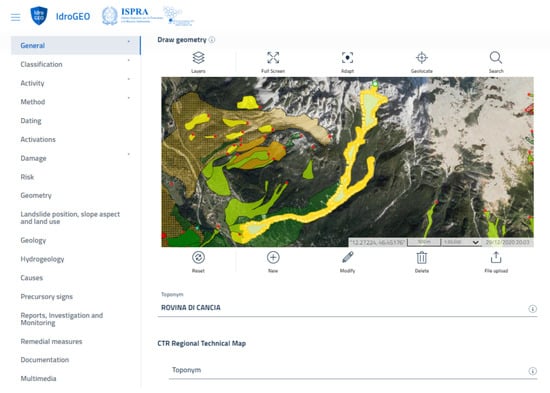
Figure 5.
IdroGEO platform—IFFI web editor.
According to the IdroGEO user requirements, the following map tools have been developed: production of reports, scenario calculation, reporting of new landslides, viewing of multimedia files, map sharing, and data download.
- Print landslide reportThe report contains the excerpt of the map of the selected landslide and all the associated information contained in the IFFI inventory database and structured into sections (General, Classification, Activity, Dating, Damage, etc.).
- Print hazard and risk reportThe report contains the map automatically sized as currently displayed on screen, the contextual and hazard data for landslides, floods, and risk related to the population, families, buildings, companies and services, and cultural heritages.
- Scenario calculationThe “Scenario calculation” tool returns the estimate of the elements exposed to landslide and flood risk in a portion of the territory circumscribed as desired through a polygon drawn by the user (Figure 6).
- Landslide reportingThe reporting of a new landslide is carried out by positioning a point on the map, entering the main information, and uploading photos/videos/documents or a web link regarding the landslide.
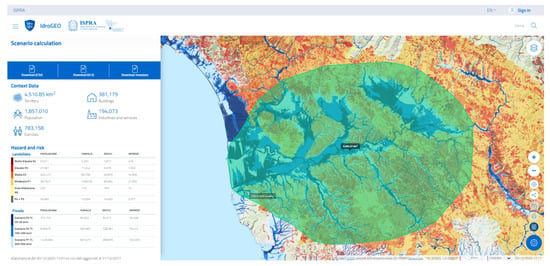
Figure 6.
Scenario calculation tool.
In line with the principle of “Openness & transparency” defined in the EU eGovernment Action Plan 2016–2020 [17], the user can download from the IdroGEO open data page the following data:
- National mosaics of landslide and flood hazard.
- Data relating to hazard zones and risk indicators on a national, regional, provincial, and municipal basis (XLS, CSV, JSON format), with the related metadata file (CSV).
- Landslides of the IFFI inventory by Region/Autonomous Province (shapefile format; point, line, and polygon geometries).
- Dictionaries of the IFFI inventory (JSON format).
To ensure optimal use on mobile devices, the application has been implemented as a Progressive Web App, a solution to provide a user experience comparable to that offered by native applications, but which does not involve the development of dedicated code and guarantees a fluency in navigation even in the case of temporary disconnection from the internet [13,51].
As defined by the guidelines for the design of digital services of the public administration, the IdroGEO User Interface (UI) was implemented using the UI kit (set of visual components to build the interface of a site or an app) and the web Kit (set of tools for the front end development) [52] provided by the Agency for Digital Italy [25]. The entire web application has been built using the Angular 8 framework [53] and the Bootstrap Italia [54] UI framework developed by the Italian Government Digital Transformation Team [55] and based on the well-known Twitter Bootstrap [56] framework. The UI map components have been engineered, extending the Bootstrap Italia kit and integrating the OpenLayers [48] library to provide the user with an intuitive navigation and favouring an exploration of the map to quickly find the area of interest and get the full set of information on hazard and risk in the HRI section or on reports, events or landslides in the IFFI section.
A specific address search function has been set up to provide quick access to a certain location through the Nominatim [57] geocoding service. A contextual search has also been made available in the IFFI section through the Landslide ID code.
The map visualization combined with UI elements to display contextual data (Figure 7) has been engineered using the HTML5 and CSS3 responsive web design [58] to maximize the map area in any display size, and specific dynamic UI elements (sliding up panel) that in turn can be slided over to the map (mobile and tablet version) to display additional details of the selected items (e.g., main parameters of the selected landslide or of the administrative boundary), using a drill-down approach as it happens in business intelligence analysis tools [59]. The responsive web design capabilities place the mobile with portrait orientation as the default resolution and the tablet and desktop as second and third available options (Figure 7).
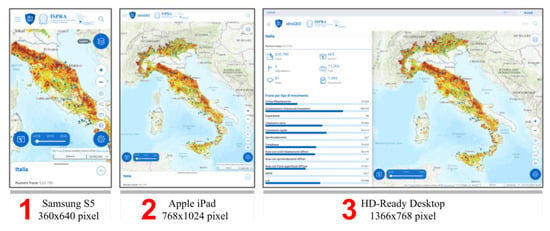
Figure 7.
Map tools and informative panels placement for different resolutions and devices.
Map tools and panels are arranged as depicted in Figure 8 based on the mobile screen: the same arrangement is maintained in both the typical tablet portrait and desktop landscape resolutions, where the contextual data and tools are kept visible in the left side panel (Figure 7).
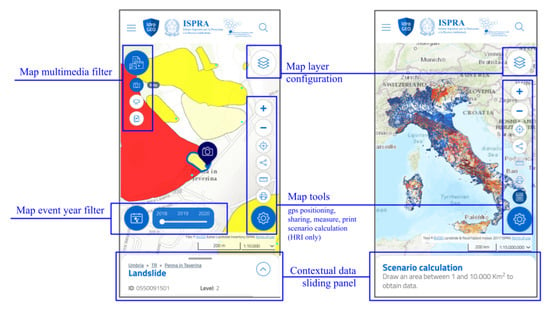
Figure 8.
User interface on the mobile screen.
2.3. Architecture of the Platform
The IdroGEO architecture has been designed to ensure the principles of reuse, interoperability, modularity, and scalability. Specifically, in order to guarantee the reuse of the software code between public administrations, all technologies and libraries adopted in the development of the IdroGEO platform are open source, with a large community of users.
The platform uses a microservice architecture and is implemented using the PEAN application stack (PostgreSQL [42], Express [60], Angular [53], Node.js [61]), very common for the development of modern open web applications that provide for the management of geospatial data (Figure 9). Among the main peculiarities of PEAN, it is particularly important that the architecture is scalable and ready for deployment in both a single node and clustered environment. The programming language used is the same for the server and client part, allowing the reuse of the code between the two application layers.
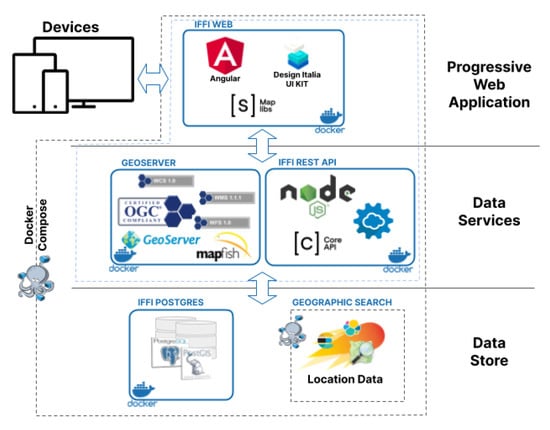
Figure 9.
Architecture of the IdroGEO platform.
The frontend web application is built as a Progressive Web App allowing easy portability and usability over different devices and supporting temporary offline usage to address the needs of landslide field mapping in areas with a limited mobile network coverage.
The geographical component of the “Data Services” layer (Figure 9) is provided by GeoServer [62], a server application that allows the consultation and modification of geospatial data using standard public formats and services maintained by the Open Geospatial Consortium (OGC) [45].
In line with the principle of “Interoperability by default” defined in the EU eGovernment Action Plan 2016–2020 [17] and in order to promote the adoption of the “API first” approach and simplify the procedures for exchanging data and services between PAs and between public administration and private individuals, the Representational State Transfer (REST) standard [63] has been adopted for the implementation of data access services. This standard allows accessing and manipulating textual representations of web resources using a predefined set of stateless operations and allowing easy integration from practically any programming language. It has been designed in the IdroGEO platform for widespread use in the application dialogue between ISPRA, Regions and Autonomous Provinces, and other PAs. The application data, which include the geospatial, multimedia, and documentation details of more than 600,000 landslides, has been exposed using REST API [64] defined and documented with the OpenAPI 3.0 specification/Swagger tools [65], in use also within government institutions [20] as well as recently adopted as a reference standard in Italy.
The IdroGEO API is designed to act as a gateway to all the underlying layers with the exception of the geographical data and tiles which are served by the GeoServer. The API enables access controls for authenticated and authorized users to perform reading and writing operations on the database. The control is handled using JSON Web Tokens (JWT) that the users generate using the IdroGEO PWA or programmatically using an external client (e.g., REST console, command line).
The API and the GeoServer take data from the “Data Store” layer, composed of the PostgreSQL [42] DBMS to which the PostGIS [41] plugin has been applied to add geographic components and the execution of spatial queries on objects. As part of the microservice architecture, the MapFish [66] open source component has been included providing map printing services and fine reporting capabilities.
The entire deployment is based on the Docker [67] technology, a container management platform with the aim of running individual processes in isolated environments. To ensure adequate reliability and scalability in the production environment, the solution adopted allows execution through an orchestration platform such as Kubernetes [68] or Swarm [69].
The Continuous Integration and Continuous Delivery (CI/CD) approach available on the platform GitLab [70] was used in order to guarantee the validation and publication flow of the changes made from the development phases to production and for a continuous verification of the progress in the implementation phases.
The model for the implementation of the “Data Services” layer is based on the interoperability model defined by the Italian 3-year plan for information technology in the public administration [24], which is in line with the European Interoperability Framework (EIF) [19].
The IdroGEO platform integrates heterogeneous data and services from several different providers. The main data repository is based on a geospatial relational database built on PostgreSQL with the PostGIS spatial extension, while the external data is accessed by the platform using different approaches, as detailed in Table 2. The choice behind the use of Nominatim [57] as the IdroGEO geocoder lies in the growing content available on OpenStreetMap (OSM). The OSM content is no longer maintained only by the community (Volunteered Geographic Information—VGI), but also by an increasing number of corporate editors that incremented over time the reliability and the quality of the data [71].

Table 2.
Services of the IdroGEO platform.
2.4. Use and Usability Evaluation of the IdroGEO Platform
In order to track and report the IdroGEO website use and activity, such as the number of users and sessions, session duration, views and source of the traffic, “Google Analytics 4” (GA4) has been used. Additional GA4 features to track the relevant chain of events (i.e., details of navigation on the map as a result of location search, planning, and scroll actions on the map, the number of generated reports, the number of generated printed maps, etc.) has been configured in order to collect useful data to perform remote user testing and application usability evaluation. In order to achieve such capabilities, the IdroGEO web application has been instrumented to send to the GA4 contextual information of actions performed by the users during its usage. The data is collected using Google Analytics Data Streams for the web and stored on the Google Analytics platform, where it has been directly analysed with its own analytics.
Usability has been investigated since the beginning of the project, discussing web application use cases and screen mock-ups with IdroGEO stakeholders, in order to ease the comprehension of both web artefacts [72].
In order to evaluate the usability of the IdroGEO platform and user satisfaction in terms of availability of data and tools, in November 2020 ISPRA promoted the compilation of an online questionnaire. The questionnaire was designed with 16 closed-ended questions with a rating scale from 1 (insufficient) to 4 (excellent) and with the opportunity to write a comment. The questions concerned the usability of the main tools (e.g., search, sharing on social media, scenario calculator) and the overall user satisfaction. The answers were collected anonymously and the navigation data were processed in compliance with the GDPR EU 2016/679 (General Data Protection Regulation).
3. Results and Discussion
3.1. Results
Regarding the management and updating of the IFFI inventory, the key results of the IdroGEO platform are:
- The time to publish data updates online has gone from about 1 year to an average of 60 days. Before the development of the IdroGEO platform, data updates were sent via email by the regional administrations once a year and manually loaded into the national database. Using the new platform, and specifically the IFFI web editor or the API services, it is now possible to upload the information via the web and then to proceed with the validation and approval cycle, shortly after the landslide occurs.
- The integration of regional landslide management systems has begun in Lombardy Region, whose data now interoperate through the IdroGEO APIs.
The IdroGEO platform has been used, in the first 7 months of activity (21 May to 20 December 2020), by 15,826 new users with over 26,000 engaged sessions and over 480,000 views (Figure 10). The peaks in the number of users are related to the webinar of presentation of the platform and the dissemination of information to professionals by a newsletter. The technology used for navigation was 75.1% on the desktop, 25.2% on the smartphone, and 1.3% on the tablet.

Figure 10.
Statistics of the IdroGEO platform. On the left, users by countries, on the right, the number of new users. Source: Google Analytics.
Regarding the survey on user satisfaction (see Section 2.4), although we received only 57 responses, representing a small percentage of the 15,826 users, we believe that these results may represent a first feedback and a starting point to improve the quality of the services offered by ISPRA. The results highlighted, with regard to the overall degree of user satisfaction, an excellent judgment for 44% of the sample, discreet for 40%, and sufficient for 16%. The most popular features of the platform were the ease of use, the clarity and completeness of the information, the availability and reuse of data, with 54%, 40%, and 37% of excellent ratings, respectively (Figure 11).
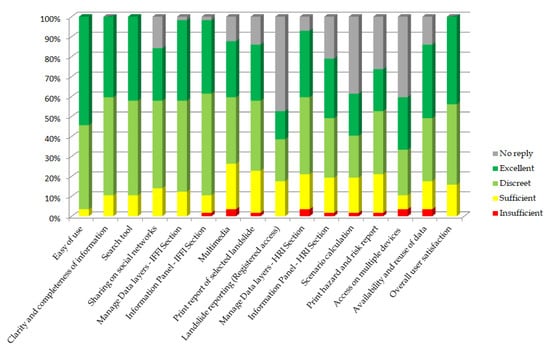
Figure 11.
IdroGEO platform user satisfaction statistics (sample: 57 survey answers).
3.2. Discussion
The IdroGEO platform fits into the categories of interactive and collaborative web mapping applications [6]. IdroGEO addresses three web mapping functionality categories: viewing, editing, and analysing. In addition to the basic tools (zooming, planning, turning on/off layers), it provides functionalities for queries and reports, uploading of new information (e.g., reporting a new landslide), sharing content on social media, including the possibility to perform spatial analysis (e.g., scenario calculation).
Regarding the EU principles of transparency and openness, the IdroGEO platform makes available data on landslides and floods in Italy according to the FAIR principles of Findability, Accessibility, Interoperability, and Reusability.
IdroGEO simplifies and increases the efficiency of landslide data collection. The landslide reporting tool allows the user to quickly locate and insert the landslide point on the map and to easily enter and submit its main information. On the other hand, the advanced tools of the IFFI inventory management area allow the online editing of point, linear, and polygonal geometries as well as collection up to 144 parameters into the landslide form, enabling multi-user acquisition and storage of large amounts of data into the national inventory.
Data collection in landslide inventories, particularly with regard to landslide geometry, type of movement, data of occurrence and damage, is the first fundamental step for landslide susceptibility, hazard and risk assessment and thus, for risk management [73]. Knowledge of past landslide helps predict future risk, since landslides are likely to occur in areas that have previously experienced a failure [12]. However, making a complete inventory is difficult, time consuming and resource intensive, due to the hard accessibility of places and dynamic nature of landslides [74]. Consequently, lack of information in inventories is the main criticality in hazard and risk assessment (e.g., information on damage is essential for the vulnerability analysis) [73].
The possibility for the user to add additional background layers (e.g., topographic, aerial or satellite maps) allows a multi-temporal analysis of changes and evolution of phenomena.
The online/offline operation of the IdroGEO Progressive Web Application makes in situ landslide mapping possible in areas of limited internet connectivity using a smartphone or tablet, increasing the use for field activity even during emergencies.
Regarding user experience, the graphical user interface and fast response functions are key factors to be considered when designing web maps. Some operations are requested to be carried out quasi-instantaneously to maintain relevance, logic flow, and user attention [6]. In order to improve the overall speed of the IdroGEO application, we optimized it adopting the HTTP/2 protocol on our web servers and implementing a lazy-loading strategy for data [75]. Rather than improving the speed of the first content paint as in traditional web applications, we focused on the speed of the following screens and in particular the main one where map data are presented. For the first content paint, we assumed that the caching capabilities available in the installed PWAs was enough to minimize the initial loading time. Lighthouse [76] was used as a tool to test and improve the application speed and adherence to good web applications development practices.
The option to implement a responsive web design for IdroGEO has been confirmed a successful choice given that in the first 7 months, 25% of the traffic was on smartphones.
Thanks to the usability of the IdroGEO web application (an excellent result score in 54% of the answers to the questionnaire; Section 3.1), we believe that the platform will contribute to increase citizen risk perception, awareness, and informed behaviour about landslides and floods in Italy. The improvement of the accessibility to natural hazard information and the engagement of citizens will promote the resilience of society in accordance with the implementation of the Sendai Framework on Disaster Risk Reduction [3].
Future outreach should focus on how to involve more community groups and educational groups, for example, through ISPRA training activities in schools and collaborations with universities in training programs. So far, the outreach has been made through online webinars, social media campaigns, informative articles, and newsletters.
IdroGEO approaches the Citizen science thanks to the landslide reporting tool. Other similar tools enable the general public to participate in the collection of landslide data, as those implemented by the British Geological Survey [77], the National Aeronautics and Space Administration (NASA) (Cooperative Open Online Landslide Repository (COOLR); [12]) and by some Geological Surveys in the United States (e.g., Kentucky and Maine [78,79]). By decreasing the level of professional experience required to complete the report, the number of users who can participate increases. During the IdroGEO first year experimental phase, the reporting tool is made available to government and local administration officers (forestry services, municipal technicians, etc.) and professionals. In order to facilitate the report validation by IFFI regional officers, it is mandatory for the user to upload a photo, video or document of the landslide. Considering that feedback is critical to the success of the collaborative approach [12], landslide reporting users can see the total number of reports they contributed in the IdroGEO platform and receive a notification of acceptance or rejection with reasons during the data validation process.
We also believe that IdroGEO can support the decision-making process of stakeholders and risk managers [80], thanks to the dynamic extraction of aggregated data on landslides and floods according to the area displayed on the map and the calculation of a risk scenario on a polygon drawn at will by the user.
During the development of the IdroGEO platform that took approximately 9 months, we started the development using Angular version 6 and ended up with Angular version 8 going through several application updates cycles of the main development framework for the frontend and its dependent libraries. It is interesting to notice how the mechanisms to prepare and build the app as PWA, despite its specification was relatively stable, it was affected by the breaking changes features. From a development point of view, we had to rethink the way we address the PWA online/offline usage and the mechanism to cache lazy-loaded resources and application map data.
The application code is hosted on GitLab [81] and will be released at the end of June 2021, making the IdroGEO technology accessible and reusable to a wider range of public administrations. The modular design, the use of open source, and the recommended standards (API) make the solutions developed for the IdroGEO platform easy scalable and portable.
IdroGEO represents a solid infrastructure for the interoperability of data at the national level. The great level of details captured for all the managed entities serves also as the foundation for creating a first knowledge-graph on landslides and the community of professionals who manage them. We believe a further step in this direction, eased also by the current availability of four languages in both UI and data controlled vocabularies, could be possible scaling the IdroGEO application to the entire European territory and to non-EU countries.
Author Contributions
Conceptualization, Carla Iadanza, Alessandro Trigila, Alessio Dragoni and Paolo Starace; Methodology, Carla Iadanza, Alessandro Trigila, Alessio Dragoni, Paolo Starace, Tommaso Biondo and Marco Roccisano; Software, Alessio Dragoni (software architect), Paolo Starace (data API and dashboards), Tommaso Biondo (web application and UX), Marco Roccisano (business analyst and data analysis), Carla Iadanza and Alessandro Trigila (conception and user requirements); Data curation, Carla Iadanza, Alessandro Trigila, Paolo Starace and Marco Roccisano; Formal analysis, Carla Iadanza and Alessandro Trigila; Validation, Carla Iadanza, Alessandro Trigila, Alessio Dragoni and Paolo Starace; Writing—original draft preparation, Carla Iadanza, Alessandro Trigila, Alessio Dragoni and Paolo Starace; Writing—review and editing, Carla Iadanza, Alessandro Trigila and Alessio Dragoni; Project administration, Alessandro Trigila; Funding acquisition, Alessandro Trigila. All authors have read and agreed to the published version of the manuscript.
Funding
The IdroGEO platform has been realized with the co-financing of the European Union, National Operational Programme on Governance, and Institutional Capacity 2014-2020.
Institutional Review Board Statement
Not applicable.
Informed Consent Statement
Not applicable.
Data Availability Statement
Data available in a publicly accessible repository that does not issue DOIs. Data can be found here: https://idrogeo.isprambiente.it/app/page/open-data.
Acknowledgments
Thanks to colleagues Mariaconcetta Giunta and Giovanni Finocchiaro (ISPRA Statistical Office) for support.
Conflicts of Interest
The authors declare no conflict of interest.
References
- Trigila, A.; Iadanza, C.; Vittori, E. The WebGIS Application of the IFFI Project (Italian Landslide Inventory). In Geophysical Research Abstracts, SRef-ID: 1607-7962/gra/EGU2007-A-09966. © European Geosciences Union. 2007. Available online: https://meetings.copernicus.org/www.cosis.net/abstracts/EGU2007/09966/EGU2007-J-09966.pdf (accessed on 30 December 2020).
- Bignami, D.F.; Dragoni, A.; Menduni, G. Assessing and Improving Flood and Landslide Community Social Awareness and Engagement via a Web Platform: The Case of Italy. Int. J. Disaster Risk Sci. 2018, 9, 530–540. [Google Scholar] [CrossRef]
- The United Nations Office For Disaster Risk Reduction—UNDRR. Sendai Framework for Disaster Risk Reduction 2015–2030; The United Nations Office For Disaster Risk Reduction: Geneva, Switzerland, 2015; Available online: https://www.preventionweb.net/publications/view/43291 (accessed on 30 December 2020).
- UN Sustainable Development Goals. Available online: https://www.un.org/sustainabledevelopment/ (accessed on 30 December 2020).
- IdroGEO Platform. Available online: https://idrogeo.isprambiente.it/ (accessed on 30 December 2020).
- Veenendaal, B.; Brovelli, M.A.; Li, S. Review of Web Mapping: Eras, Trends and Directions. ISPRS Int. J. Geo-Inf. 2017, 6, 317. [Google Scholar] [CrossRef]
- Nivala, A.M.; Brewster, S.; Sarjakoski, T.L. Usability Evaluation of Web Mapping Sites. Issue 2: Use and User Issues in Geographic Information Processing and Dissemination. Cartogr. J. 2008, 45, 129–138. [Google Scholar] [CrossRef]
- Heil, B.; Petzold, I.; Romang, H.; Hess, J. The common information platform for natural hazards in Switzerland. Nat. Hazards 2014, 70, 1673–1687. [Google Scholar] [CrossRef]
- International Organisation for Standardisation. ISO 9241–11:2018 Ergonomics of Human-System Interaction—Part 11 Usability: Definitions and Concepts; International Organisation for Standardisation: Geneva, Switzerland, 2018. [Google Scholar]
- Schörghofer, R.; Lang, S.; Wendt, L.; Riedler, B. CMaP—A Collaborative Mapping Platform for Humanitarian Organizations. J. Geogr. Inf. Sci. 2017, 2017, 207–216. [Google Scholar] [CrossRef][Green Version]
- See, L. A Review of Citizen Science and Crowdsourcing in Applications of Pluvial Flooding. Front. Earth Sci. 2019, 7, 44. [Google Scholar] [CrossRef]
- Juang, C.S.; Stanley, T.A.; Kirschbaum, D.B. Using citizen science to expand the global map of landslides: Introducing the Cooperative Open Online Landslide Repository (COOLR). PLoS ONE 2019, 14, e0218657. [Google Scholar] [CrossRef]
- Biørn-Hansen, A.; Majchrzak, T.A.; Grønli, T.M. Progressive Web Apps for the Unified Development of Mobile Applications. In Web Information Systems and Technologies; WEBIST 2017. Lecture Notes in Business Information, Processing; Majchrzak, T., Traverso, P., Krempels, K.H., Monfort, V., Eds.; Springer: Cham, Switzerland, 2017. [Google Scholar] [CrossRef]
- Progressive Web App—Google Developers. Available online: https://web.dev/progressive-web-apps/ (accessed on 20 January 2021).
- Magomadov, V.S. Exploring the role of progressive web applications in modern web development. J. Phys. Conf. Ser. 2020, 1679, 022043. [Google Scholar] [CrossRef]
- Directive (EU) 2019/1024 of the European Parliament and of the Council of 20 June 2019. Available online: https://eur-lex.europa.eu/legal-content/EN/TXT/?uri=uriserv:OJ.L_.2019.172.01.0056.01.ENG (accessed on 30 December 2020).
- European eGovernment Action Plan 2016–2020. Available online: https://ec.europa.eu/digital-single-market/en/european-egovernment-action-plan-2016-2020 (accessed on 30 December 2020).
- eGovernement Declaration. Available online: https://ec.europa.eu/digital-single-market/en/news/ministerial-declaration-egovernment-tallinn-declaration. (accessed on 22 January 2021).
- European Interoperability Framework—EIF. Available online: https://ec.europa.eu/isa2/eif_en (accessed on 20 January 2021).
- Vaccari, L.; Posada, M.; Boyd, M.; Gattwinkel, D.; Mavridis, D.; Smith, R.S.; Santoro, M.; Nativi, S.; Medjaoui, M.; Reusa, I.; et al. Application Programming Interfaces in Governments: Why, What and How; EUR 30227 EN; Publications Office of the European Union: Luxembourg, 2020; ISBN 978-92-76-18982-4. [Google Scholar] [CrossRef]
- Boyd, M.; Vaccari, L.; Posada, M.; Gattwinkel, D. An Application Programming Interface (API) Framework for Digital Government; EUR 30226 EN; Publications Office of the European Union: Luxembourg, 2020; ISBN 978-92-76-18980-0. [Google Scholar] [CrossRef]
- Williams, M. Digital Government Benchmark, API Study, Final Report; European Commission; DG Joint Research Centre: Ispra, Italy, 2018. [Google Scholar]
- Santoro, M.; Vaccari, L.; Mavridis, D.; Smith, R.S.; Posada, M.; Gattwinkel, D. Web Application Programming Interfaces (APIs): General-Purpose Standards, Terms and European Commission Initiatives; EUR 29984 EN; Publications Office of the European Union: Luxembourg, 2019; ISBN 978-92-76-13183-0. [Google Scholar] [CrossRef]
- Italian Government. Three-Year Plan for Digital Transformation of the Public Administration. Available online: https://pianotriennale-ict.italia.it/en/ (accessed on 19 January 2021).
- Agency for Digital Italy (AgID). Available online: https://www.agid.gov.it/en/ (accessed on 30 December 2020).
- Agency for Digital Italy (AgID). 3 Years of AgID. Challenges, Strategies And Objectives. Available online: https://www.agid.gov.it/sites/default/files/repository_files/agid.pdf (accessed on 20 January 2021).
- International Organization for Standardization. ISO 9241-210:2019 Ergonomics of Human-System Interaction—Part 210 Human-Centred Design for Interactive Systems; International Organisation for Standardisation: Geneva, Switzerland, 2019. [Google Scholar]
- Italian Landslide Inventory—IFFI. Available online: https://www.progettoiffi.isprambiente.it/en/ (accessed on 30 December 2020).
- Iadanza, C.; Trigila, A. Landslides and Floods in Italy: Hazard and Risk Indicators; ISPRA: Roma, Italy, 2018. [Google Scholar]
- Trigila, A.; Iadanza, C.; Spizzichino, D. Quality assessment of the Italian Landslide Inventory using GIS processing. Landslides J. Int. Consort. Landslides 2010, 7, 455–470. [Google Scholar] [CrossRef]
- Varnes, D.J. Landslide Hazard Zonation: A Review of Principles and Practice; Commission on Landslides of the IAEG; UNESCO: Paris, France, 1984; Volume 3. [Google Scholar]
- Trigila, A.; Iadanza, C.; Esposito, C.; Scarascia Mugnozza, G. Comparison of Logistic Regression and Random Forests techniques for shallow landslide susceptibility assessment in Giampilieri (NE Sicily, Italy). Geomorphology 2015, 249, 119–136. [Google Scholar] [CrossRef]
- Hervas, J. (Ed.) Guidelines for Mapping Areas at Risk of Landslides in Europe. In Proceedings of the Experts Meeting, JRC, Ispra, Italy, 23–24 October 2007; JRC Report EUR 23093 EN; Office for Official Publication of the European Communities: Luxembourg, 2007. [Google Scholar]
- Corominas, J.; van Westen, C.; Frattini, P.; Cascini, L.; Malet, J.; Fotopoulou, S.; Catani, F.; Van Den Eeckhaut, M.; Mavrouli, O.; Agliardi, F.; et al. Recommendations for the quantitative analysis of landslide risk. Bull. Eng. Geol. Environ. 2014, 73, 209–263. [Google Scholar] [CrossRef]
- Directive 2007/60/EC of the European Parliament and of the Council of 23 October 2007. Available online: https://eur-lex.europa.eu/legal-content/EN/TXT/?uri=CELEX:32007L0060 (accessed on 30 December 2020).
- Trigila, A.; Iadanza, C.; Munafò, M.; Marinosci, I. Population Exposed to Landslide and Flood Risk in Italy. In Engineering Geology for Society and Territory; Lollino, G., Manconi, A., Guzzetti, F., Culshaw, M., Bobrowsky, P., Luino, F., Eds.; Springer: Berlin/Heidelberg, Germany, 2015; Volume 5, pp. 843–848. [Google Scholar]
- Guzzetti, F. Landslide Hazard and Risk Assessment. Ph.D. Thesis, Mathematisch-Naturwissenschaftlichen Fakultät der Rheinischen Friedrich-Wilhelms-Universität University of Bonn, Bonn, Germany, 2006. [Google Scholar]
- Kang, L.; Wang, Q.; Yan, H.W. Building extraction based on OpenStreetMap tags and very high spatial resolution image in urban area. Int. Arch. Photogramm. Remote Sens. Spatial Inf. Sci. 2018, XLII-3, 715–718. [Google Scholar] [CrossRef]
- De Medeiros, G.F.B.; Degrossi, L.C.; Holanda, M. QualiOSM: Improving Data Quality in the Collaborative Mapping Tool OpenStreetMap. In Proceedings of the XXI Brazilian Symposium on Geoinformatics GEOINFO, São José dos Campos, Brazil, 30 November–3 December 2020; pp. 10–21. [Google Scholar]
- JSONB. Available online: https://www.postgresql.org/docs/9.5/functions-json.html (accessed on 21 January 2021).
- PostGIS Extension to Add Support for Geographic Objects. Available online: https://postgis.net/ (accessed on 19 January 2021).
- PostgreSQL—Open-Source Relational Database Management System. Available online: https://www.postgresql.org/ (accessed on 20 January 2021).
- WKT. Well-Known Text Representation of Coordinate Reference Systems. Available online: https://www.ogc.org/standards/wkt-crs (accessed on 21 January 2021).
- Open Geospatial Consortium—OGC. OpenGIS® Implementation Standard for Geographic Information—Simple Feature Access—Part 1: Common Architecture; Open Geospatial Consortium, Inc.: Wayland, MA, USA, 2011. [Google Scholar]
- Open Geospatial Consortium—OGC. Available online: https://www.ogc.org/ (accessed on 19 January 2021).
- Wagner, A.; Bonduel, M.; Pauwels, P.; Uwe, R. Representing construction-related geometry in a semantic web context: A review of approaches. Autom. Constr. 2020, 115, 103130. [Google Scholar] [CrossRef]
- GeoJSON Format. Available online: https://geojson.org/ (accessed on 20 January 2021).
- OpenLayers—Map Management Library. Available online: https://openlayers.org/ (accessed on 30 December 2020).
- Offutt, J. Quality attributes of Web software applications. IEEE Softw. 2002, 19, 25–32. [Google Scholar] [CrossRef]
- Fernandez, A.; Insfran, E.; Abrahão, S. Usability evaluation methods for the web: A systematic mapping study. Inf. Softw. Technol. 2011, 53, 789–817. [Google Scholar] [CrossRef]
- Tandel, S.S.; Jamadar, A. Impact of Progressive Web Apps on Web App Development. Int. J. Innov. Res. Sci. 2018, 7, 9439–9444. [Google Scholar]
- Designers Italia The Design System for the Italian Public Administration. Available online: https://developers.italia.it/en/designers/#ui-kit (accessed on 20 January 2021).
- Angular—Javascript Framework for the Creation of Dynamic Web Applications. Available online: https://angular.io/ (accessed on 30 December 2020).
- Bootstrap Italia. Available online: https://italia.github.io/bootstrap-italia/ (accessed on 30 December 2020).
- Italian Government Digital Transformation Team. Available online: https://teamdigitale.governo.it/en/ (accessed on 20 January 2021).
- Bootstrap—HTLM/CSS Framework and Components for Responsive Web-Applications. Available online: https://getbootstrap.com/ (accessed on 20 January 2021).
- Nominatim—Open-Source Geocoding with OpenStreetMap Data. Available online: https://nominatim.org/ (accessed on 20 January 2021).
- Fielding, J. Beginning Responsive Web Design with HTML5 and CSS3; Apress: Berkeley, CA, USA, 2014. [Google Scholar] [CrossRef]
- Cardoso, M.; Guimarães, T.; Portela, C.F.; Santos, M.F. Data Extraction and Exploration Tools for Business Intelligence. In Fourth International Congress on Information and Communication Technology; Advances in Intelligent Systems and Computing; Yang, X.S., Sherratt, S., Dey, N., Joshi, A., Eds.; Springer: Singapore, 2020. [Google Scholar] [CrossRef]
- Express—Web Framework for Node.js. Available online: https://expressjs.com/ (accessed on 20 January 2021).
- Node.js— the JavaScript Runtime Environment. Available online: https://nodejs.org/en/ (accessed on 20 January 2021).
- GeoServer—Open Source Server for Sharing Geospatial Data. Available online: http://geoserver.org/ (accessed on 20 January 2021).
- Fielding, R.T. Architectural Styles and the Design of Network-based Software Architectures. Ph.D. Thesis, University of California, Irvine, CA, USA, 2000. Chapter 5 Representational State Transfer (REST). Available online: https://www.ics.uci.edu/~fielding/pubs/dissertation/rest_arch_style.htm (accessed on 20 January 2021).
- Kulkarni, C.M.; Takalikar, M.S. Analysis of REST API Implementation. Int. J. Sci. Res. Comput. Sci. 2018, 3, 2456–3307. [Google Scholar]
- OpenApi/Swagger. Available online: https://swagger.io/ (accessed on 30 December 2020).
- Mapfish Print—Library that Allows Printing Maps as PDFs. Available online: http://www.mapfish.org/doc/print/ (accessed on 20 January 2021).
- Docker. Available online: https://www.docker.com/products/container-runtime (accessed on 20 January 2021).
- Kubernetes. Available online: https://kubernetes.io/ (accessed on 20 January 2021).
- Swarm. Available online: https://docs.docker.com/engine/swarm/ (accessed on 20 January 2021).
- GitLab Continuous Integration & Continuous Delivery Platform. Available online: https://about.gitlab.com/stages-devops-lifecycle/continuous-integration/ (accessed on 20 January 2021).
- Anderson, J.; Sarkar, D.; Palen, L. Corporate Editors in the Evolving Landscape of OpenStreetMap. ISPRS Int. J. Geo-Inf. 2019, 8, 232. [Google Scholar] [CrossRef]
- Ricca, F.; Scanniello, G.; Torchiano, M.; Reggio, G.; Astesiano, E. On the effort of augmenting use cases with screen mockups: Results from a preliminary empirical study. In Proceedings of the International Symposium on Empirical Software Engineering and Measurement, ESEM 2010, Bolzano/Bozen, Italy, 16–17 September 2010. [Google Scholar] [CrossRef]
- Olyazadeh, R.; Sudmeier-Rieux, K.; Jaboyedoff, M.; Derron, M.H.; Devkota, S. An Offline-Online WebGIS Android Application for Fast Data Acquisition of Landslide Hazard and Risk. Nat. Hazards Earth Syst. Sci. Discuss. 2016. [Google Scholar] [CrossRef]
- van Westen, C.J.; van Asch, T.W.J.; Soeters, R. Landslide hazard and risk zonation—why is it still so difficult? Bull. Eng. Geol. Environ. 2006, 65, 167–184. [Google Scholar] [CrossRef]
- Shivakumar, S.K. Modern Web Performance Optimization. Methods, Tools, and Patterns to Speed Up Digital Platforms; Apress: Berkeley, CA, USA, 2020. [Google Scholar]
- Lighthouse. Available online: https://developers.google.com/web/tools/lighthouse/ (accessed on 30 December 2020).
- British Geological Survey—BGS. Report a Landslide. Available online: https://www2.bgs.ac.uk/reportalandslide/reportForm.html (accessed on 5 February 2021).
- Kentucky Geological Survey—KGS. Report a Landslide. Available online: https://kgs.uky.edu/kgsweb/kgsweb/landslide2.asp (accessed on 5 February 2021).
- Maine Geological Survey—MGS. Landslide Questionnaire. Available online: https://mgs-collect.site/mgs-survey/landslide_survey_view.php (accessed on 5 February 2021).
- Aye, Z.C.; Jaboyedoff, M.; Derron, M.H.; van Westen, C.J. Prototype of a Web-based Participative Decision Support Platform in Natural Hazards and Risk Management. ISPRS Int. J. Geo-Inf. 2015, 4, 1201–1224. [Google Scholar] [CrossRef]
- GitLab—IdroGEO. Available online: https://gitlab.com/isprambiente/idrogeo (accessed on 30 December 2020).
Publisher’s Note: MDPI stays neutral with regard to jurisdictional claims in published maps and institutional affiliations. |
© 2021 by the authors. Licensee MDPI, Basel, Switzerland. This article is an open access article distributed under the terms and conditions of the Creative Commons Attribution (CC BY) license (http://creativecommons.org/licenses/by/4.0/).