Article

A Continuous Taxi Pickup Path Recommendation under The Carbon Neutrality Context

1
Faculty of Information Technology, Beijing University of Technology, Beijing 100124, China
2
College of Economics and Management, Beijing University of Technology, Beijing 100124, China
3
The Institute of Software, Chinese Academy of Sciences, Beijing 100190, China
4
Norwich Business School, University of East Anglia, Norwich NR4 7TJ, UK
*
Author to whom correspondence should be addressed.
ISPRS Int. J. Geo-Inf. 2021, 10(12), 821; https://doi.org/10.3390/ijgi10120821
Submission received: 28 October 2021 / Revised: 28 November 2021 / Accepted: 1 December 2021 / Published: 4 December 2021

Abstract

:
In the context of the carbon neutrality target, carbon reduction in the daily operation of the transportation system is more important than that in productive activities. There are few travel services that can quantify low-carbon travel, with a lack of effective low-carbon travel tools to guide transportation behavior. On-demand access to taxi services can effectively reduce the additional carbon emissions caused by cruising, which in turn increases efficiency in urban mobility with a reduced taxi fleet scale. For individual taxis, they lack macroscopic horizon in their choice of passenger pickup paths. The selected travel path based on personal operational experience or real-time location is limited by local optimization when making path decisions. In this work, we proposed a macro-path recommendation method to assist the taxi pickup path selection to accelerate the transformation of the taxi system towards low-carbon sharing. First, an adaptive learning spatiotemporal neural network was used to predict the coarse-grained distribution of potential trips. Next, the trajectory sharing graph was constructed based on the potential trips distribution to reallocate the taxi orders for the continuous pickup path optimization. As a result, the continuous pickup path balanced the relation between travel demands and taxi supply, improving the economic and environmental benefits of taxi operation and contributing to the goal of carbon neutrality. We conducted experiments on the Chengdu city ride-hailing dataset. Compared with the current status of taxi operations, the solution shows improvements in both the scale of taxi services and order gain.

1. Introduction

Achieving the carbon reduction target of “carbon neutrality” by 2060 poses a critical challenge to the development of various industries in China, with urban transportation emissions showing the fastest growth rate and continuous increase. The supply of urban mobility services is essential for achieving carbon neutrality in transportation, and it is necessary to design a low-carbon mobility-on-demand (MoD) service to minimize traffic carbon emissions and achieve sustainable development. Today, the on-demand access to taxi services has evolved into many effective and more convenient forms being promoted, such as Uber, Lyft, Ola, Didi, and many other ride-hailing MoD service providers, to meet the challenges of travel demands in large cities [1]. The taxi service system provides an efficient travel mode for urban transportation; however, the carbon emissions are increasing, and the operating costs are rising with the large number of taxis in supply. In terms of existing taxi operation, most taxis are cruising aimlessly on the streets looking for passengers. The vacant taxis increase the resource consumption during cruising due to the lack of information on time-varying travel demands, and the taxi dispatch system does not employ effective information to measure the economic and environmental costs of total travels.
The development goal of carbon neutrality in transportation also imposes an urgent requirement for a low carbon operation of the taxi system. For taxi drivers, cruising to find passengers improves their own orders. As for the taxi system, reducing the fleet scale of taxi operations and improving the circulation efficiency are the core aspects of low carbon transportation. However, taxi services have been in a dilemma. On the one hand, it is difficult for passengers to obtain taxi service during peak hours. On the other hand, the taxi cruising time for passenger searching has increased, resulting in traffic congestion [2]. The taxi drivers usually rely on their own operating or cruising experiences to find passengers randomly [3]. Without macro-level guidance to instruct taxis on their cruising behavior, the taxi system cannot be fully utilized [4]. The sharing mobility technologies create a new way for taxis to travel in a low-carbon mode, and these solutions can make it possible to match the taxi supply with user travel demands. While sharing mobility has huge potential to improve the global efficiency of transportation, it is insufficient to fully adopt it to hold all users. It should be integrated with other modes of transportation that have the explicit goal of optimizing carbon emission reduction [5]. Many studies related to MoD and fleet management have considered travelling without sharing rides [6].
Considering the unbalanced travel demands and the low utilization of taxi services, how to dynamically obtain the continuous passenger-carrying path is a valuable research problem. The current research on taxi routing focuses on the optimal path of a single trip at the microscopic level [7], ignoring the differences in economic and carbon emission attributes for continuous taxi paths. Some studies have analyzed taxi behavior to optimize individual operating strategies, but they rely on local optimization methods to increase pickup rates, which may lead to an imbalance in taxi supply and demand [4]. The macroscopic path strategy is also important for taxi operation. For example, by guiding the taxi pickup path with the low-carbon strategy and treating taxi resources as an MoD service, it will become an effective solution to reduce urban traffic emissions and meet travel demands.
In addition, analyzing the spatial and temporal distribution of historical trips can help taxis optimize their travel schedules. The travel flow on the road network changes with the tidal effect, and the existing path recommendation model, based on static pickup locations, cannot reflect its dynamic features. The continuous path recommendation can perceive the time-varying pattern of travel demands and make decisions according to the potential distribution, which helps the pre-scheduling of the taxi service. In terms of the relation between taxi supply and demand, the existing path recommendation models try to increase the individual order maximization, and there is competition among taxis. The competition for picking up passengers often leads to inefficient and underutilized operation for some taxis. Therefore, these models do not alleviate the unbalanced supply and demand relationship between travel services and passenger demands.
To solve these problems mentioned above, this paper combines the taxi travel path with the potential trip reallocation and builds a dynamic path recommendation model for continuous passenger pickup. This taxi service in the low-carbon context can minimize the total operating costs and emissions with trip sharing, which makes full use of the small fleet scale in the network to meet all travel demands, as shown in Figure 1.
Considering the periodicity of taxi trips and the complex features of the travel network, the recommendation model is constructed by the following steps. The real-time update and analysis of travel status using deep learning can predict the future status and support the decision making for seeking passengers. Based on the potential trip distribution obtained from the prediction, we can find a continuous pickup path to provide on-demand service through proper order reassignment. The diversity of passenger preferences is added as a heuristic factor to recommend different continuous pickup paths. This model can increase the number of taxi orders received for operating taxis and reduce the overall fleet of running vehicles. It is also hybrid, with both taxi-ride competition and cooperation being used to build an order-sharing assignment model. Based on the scale of on-demand taxis, we achieve the match between passenger travel demands and taxi service utilization.
In summary, to fill the gap of previous taxi path planning methods lacking macroscopic horizon, the study of continuous pickup path recommendation can not only meet the existing travel demands but also contribute to the full utilization of taxi services. The continuous pickup path optimizes the easiness of taking orders and the fleet scale of online operation from the spatial and temporal dimensions, which has great significance to reduce carbon emissions in the transportation field. The main contributions of this paper are as follows:
(1)
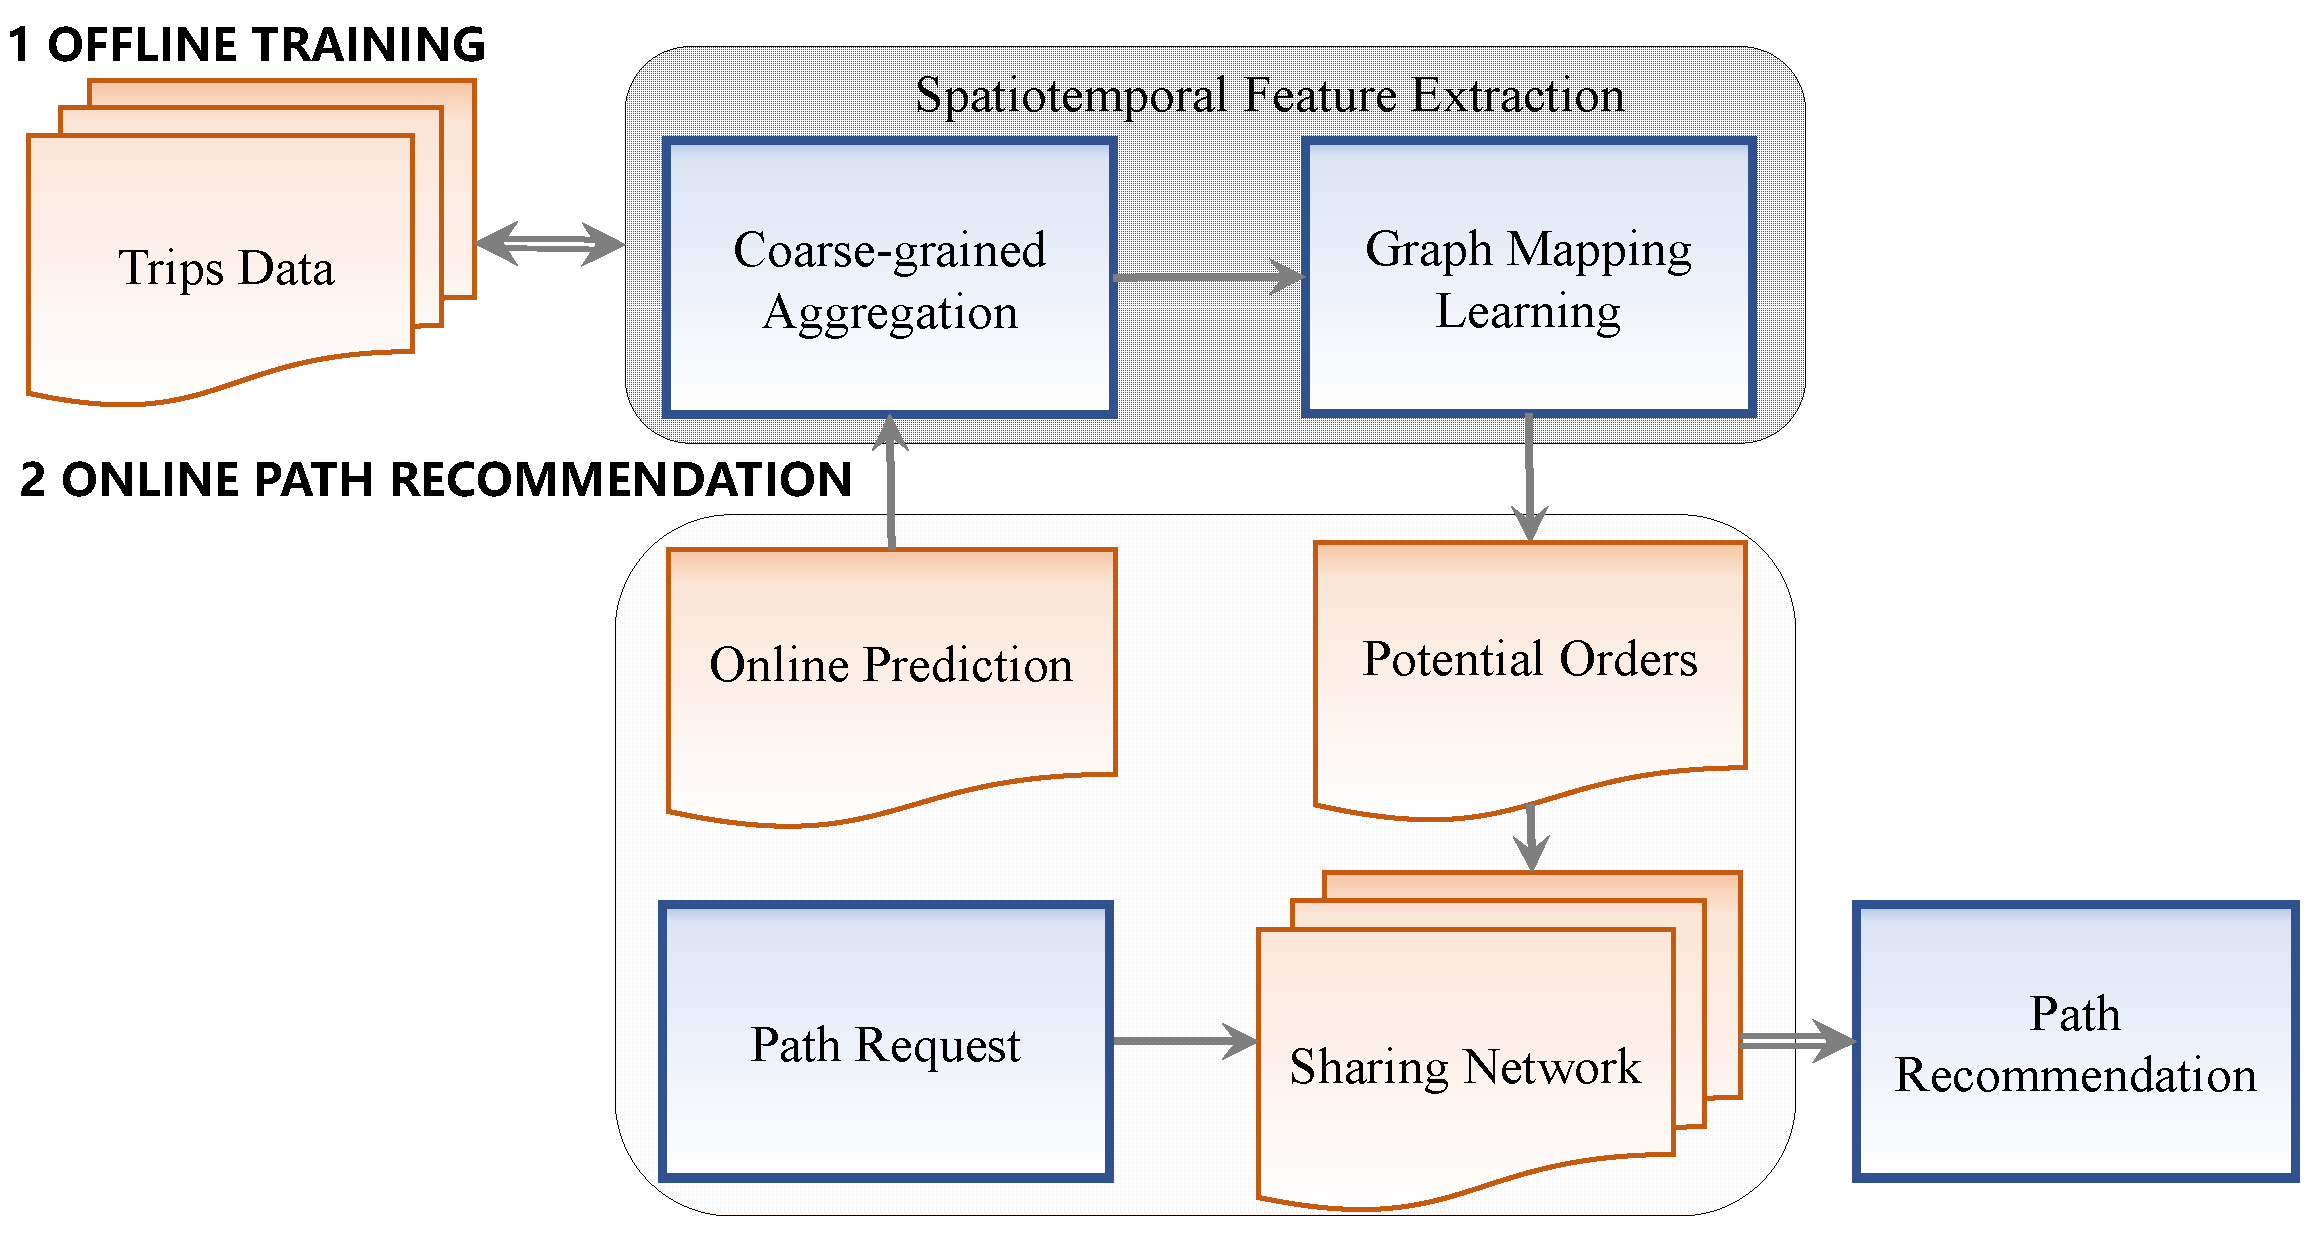
To overcome the sparsity of trip data, we construct a two-layer structure to reduce the relational space with the coarse-grained graph, which can better extract the implicit structure of the spatiotemporal association of trips.
(2)
We design a self-learning semantic relation to capture the dynamic spatial features between trips, combining that with a spatiotemporal neural network to mine the temporal patterns of travel behaviors.
(3)
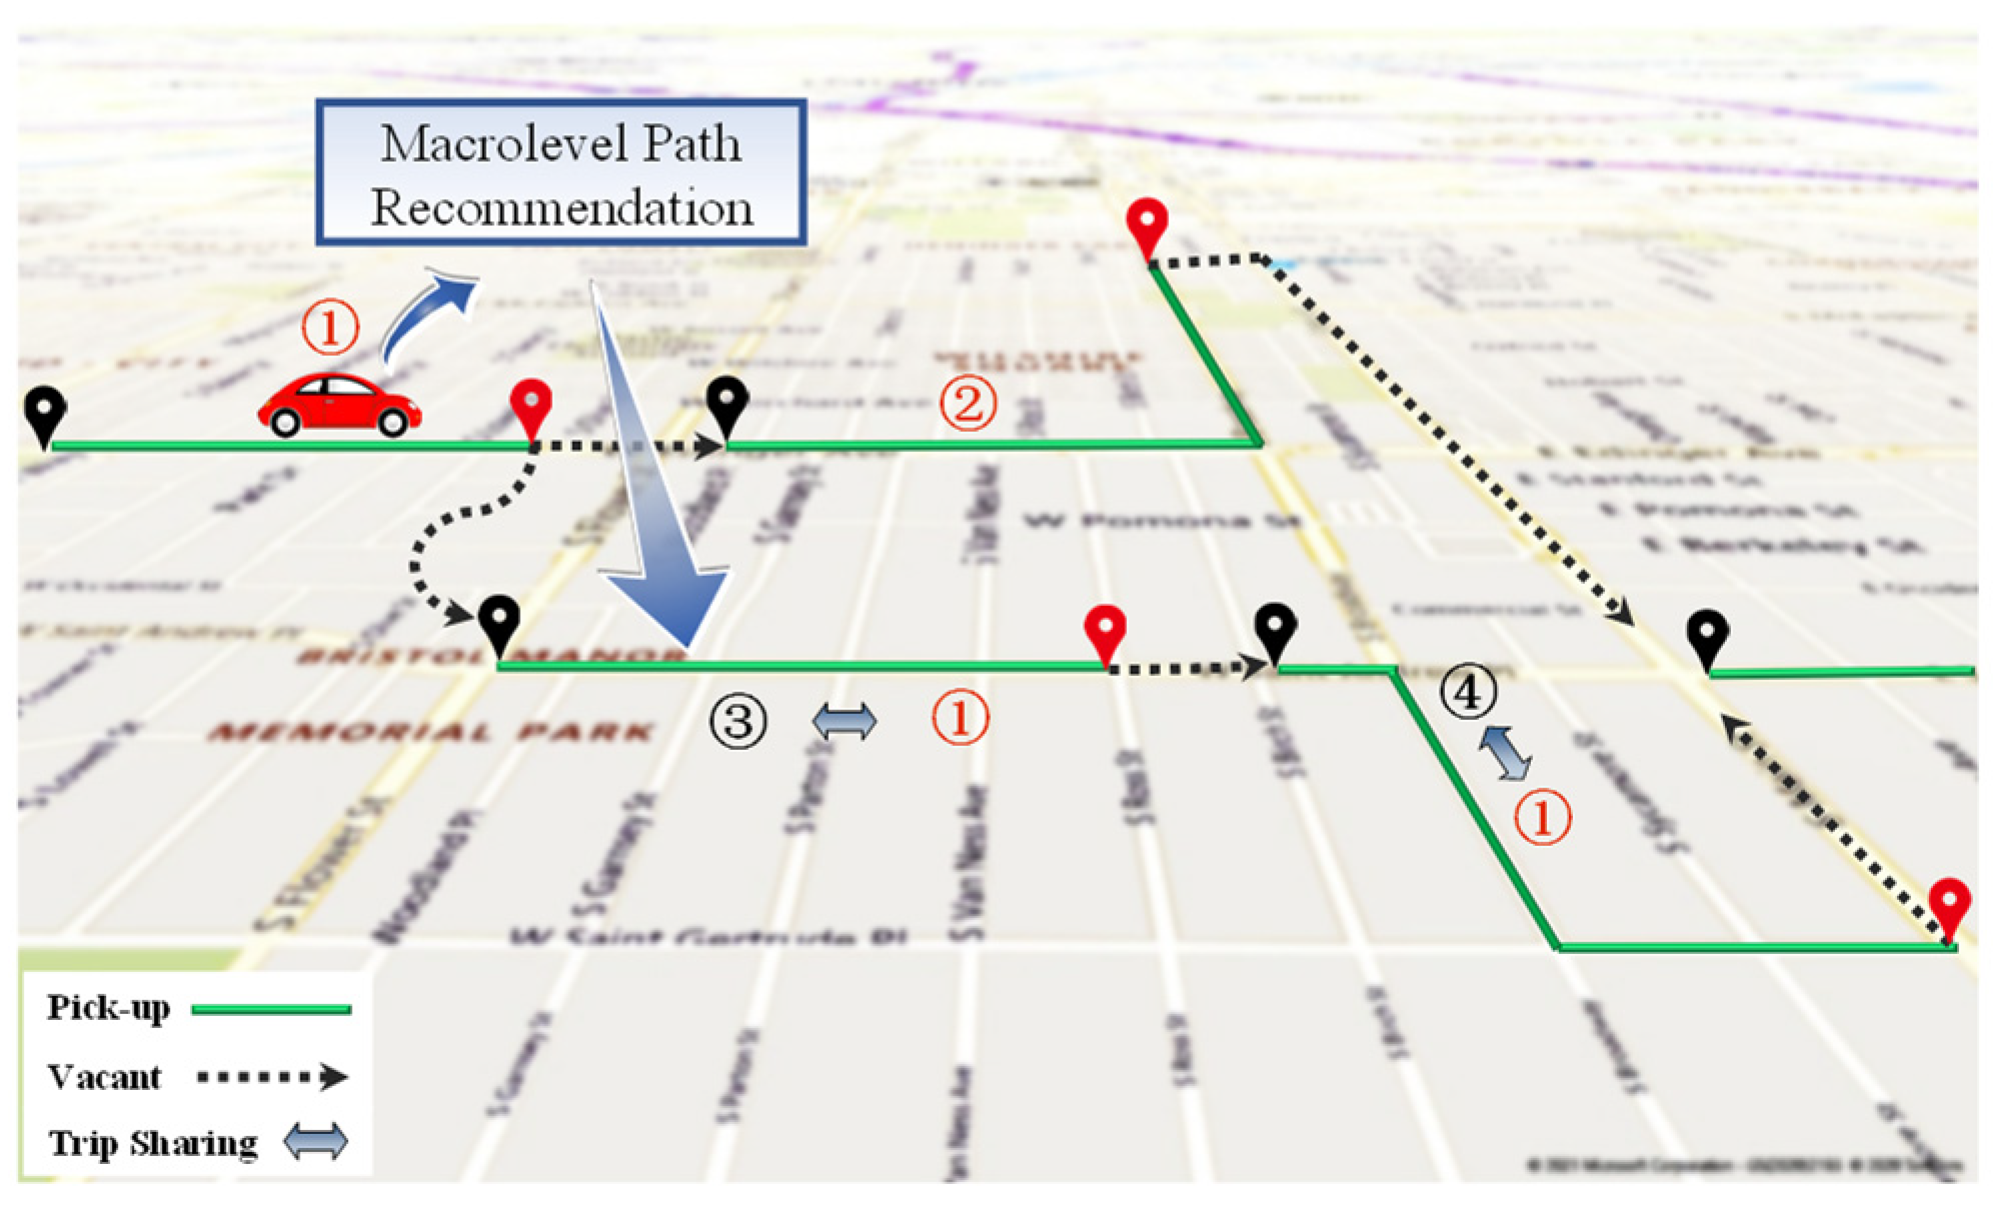
Without changing the existing travel patterns, we propose a macrolevel path recommendation method for continuous pick-up passengers that seeks the match between passenger demands and taxi service utilization.
The beginning of this paper lists the current research status related to taxi demand prediction and path recommendation. The second part will briefly describe the basics of the taxi order sharing network. The third section details the continuous pickup path recommendation method. In the fourth part, a series of experiments and result analyses on the traffic dataset of Chengdu are given to verify the effectiveness of the proposed method. In the last part of the paper, we conclude and look forward to later research.

2. Related Work

Informed driving is emerging as a key feature to improve taxi sustainability, combining deep learning approaches to estimate future patterns from historical data [8]. For the prediction of taxi pickup or drop-off locations, a common approach is to divide the road network into grids and count the traffic in them, which turns the prediction problem into a multi-class classification. To alleviate origin-destination (OD) data sparsity, the grid partitioning of the road network is used as a general method [9] to explore the correlation of ODs. It combines adjacent geographic and semantic neighborhoods, with the geographic neighborhoods measuring the intrinsic closeness of grids and the semantic neighborhoods modeling the intensity of traffic between grids. Most taxi OD prediction methods have only considered the demand at the origin but have ignored the supply of taxis at the arrival destination. The prediction of interactive demands usually requires the fusion of more semantic information to improve the prediction ability, such as the Contextualized Spatial-Temporal Network (CSTN) [10] and the Spatiotemporal Residual Neural Network (ST-ResNet) [11]. The CSTN is used to predict the future demand for travel interactions between regional pairs. Three independent components were constructed to extract correlations, which well integrates the local spatial context, temporal evolution context, and global correlation context into a unified framework. The ST-ResNet predicts user inflows and outflows for each city region based on temporal closeness, period, and trend features. By aggregating the outputs of multiple feature networks and assigning varying weights to different branches, the ability to predict interactive demands is further improved. For the irregularly arranged regions, community discovery is used to construct spatiotemporal networks to explore the semantic relationship between regions and to predict travel demands at the multi-regional level [12]. However, the multiclassification prediction models based on road network partition cannot learn some new locations. A feasible approach is to use geographic information from location-based social networks (LBSNs) to model taxi travel behavior and encode the semantics of the visited locations [13]. The coordinates of the destination are predicted by the functions that directly approximate the latitude and longitude to improve the precise location of the next drop-off point. To reduce the amount of feature engineering and of external data required to build deep learning models, some studies adopt multiple networks or reinforcement learning to enhance the predictive performance. For example, the CNN can be used to extract spatial features and the LSTM to extract temporal features, which are described by the embedding layer [14]. This architecture can be easily extended to other traffic prediction problems such as road traffic and flow prediction. The Multi-Intelligent Reinforcement Learning (MARL) based taxi dispatching model can balance the supply and demand of taxis in different regions [4]. Unlike the taxi scheduling method based on real-time location, it first predicts the demands in different areas for the next time period and then dispatches taxis in advance.
Due to the time-varying travel demands, the taxi service may generate a large number of vacant vehicles when operating in different regions. The vacant taxis operating on the road network not only waste travel resources but also burden the city with emission and traffic. To improve the utilization of vacant vehicles, the location of taxi parking can be accurately detected from the trajectories. These parking locations signify where the taxis stand waiting for passengers, and the probabilistic model can be constructed based on trajectories to describe the taxi dynamic behaviors, thus providing some real-time locations to pick up passengers quickly [15]. The other method is to predict crowd flows by discovering patterns of passenger pick-up quantity (PUQ) in urban hotspots, and the Auto-Regressive Integrated Moving Average (ARIMA) method can be used to predict the spatial and temporal variation of passengers in hotspots to help drivers find their next passenger [16]. As travel demands change dynamically over time, static solutions cannot adapt to the evolving scenario. The dynamic future demand-aware vehicle scheduling system [1] can dynamically search for vacant vehicle resources by considering both travel demand and traffic status. In addition, the MoD system’s historical travel data can be used to optimize vehicle distribution and fleet size. The MoD works by guiding the trips of the vehicles to meet all travel demands, allowing the one vehicle to serve multiple passengers [17]. It provides guidance on how many vehicle resources should be allocated to meet the demands of a given region. In the automated MoD system [18], passengers can share a group of self-driving vehicles. It also regularly adjusts the match between the supply of vehicles and travel demands, considering the sharing of travel resources from a system perspective.
In terms of path recommendation for vacant taxi cruising, there are no valid criteria for optimal routing evaluation. Some dynamic path planning methods that use historical data are used to improve the performance of the self-driving taxi network. The path planning assigns orders to taxis in a pre-assigned manner, minimizing the expected cost of current and future travel demands. It consists of three main steps, which are pruning travel trips, assigning vehicle order, and rebalancing vacant vehicles, so that the probability distribution of future demand is decoupled into the vehicle routing and order assignment [19]. In [20], a more general high-capacity ride-sharing model can dynamically generate optimal routes based on online demand and vehicle locations. It can effectively return a trip request that solves both the problem of assigning vehicles to passengers and rebalancing the fleet to meet travel demands. In the study of using taxi trajectories to reduce the cruising distance, an adaptive shortest expected cruising route (ASER) was proposed. The ASER builds a probabilistic network using Kalman filtering to predict the pickup probability and capacity of each location and then recommends the travel path to the taxi driver [21]. It also considers the load balance between passengers and taxis. Further, the multi-criteria path recommendation models that integrate real-time spatiotemporal prediction and traffic network status focus on optimizing the next passenger-carrying path. The travel demand prediction can estimate the probability of passenger pickup and drop-off, capturing the flows of potential passengers. The heuristic function J* algorithm [22] was proposed based on the distribution of the prediction module, combining the pickup probability, drop-off distribution, road network, distance, and time factors. To reduce the aimless cruising of taxis, some studies have fully analyzed the relation between supply and demand, such as the attraction between taxis and passengers and the competition between taxis. In [3], the traffic force for cruising taxis is calculated by collecting the density information of passengers and taxis from the trajectories. According to the corresponding traffic force, the taxis are assigned to the optimal road segments to pick up desired passengers. Dynamic taxi path recommendation aims to recommend cruising routes to vacant vehicles. Most of them focus on building probabilistic models, such as the Mixed Path Size Logit (MPSL) model [23], which analyzes taxi behaviors through spatiotemporal features with passenger generation rate, path travel time, cumulative intersection delay, path distance, and path size. With the development of deep learning recommendation models, dynamic taxi path recommendation is studied as a sequential decision-making problem. By extracting multiple spatiotemporal features related to the easiness degree of vacant taxis picking up passengers, an adaptive deep learning method was designed to achieve effective path recommendation [24].
As mentioned above, the travel status prediction in conjunction with the path recommendation system based on the trip sharing pool has the opportunity to solve the existing inefficiencies in taxi mobility, thus reducing the resource waste and carbon emission of transportation.

3. Preliminaries

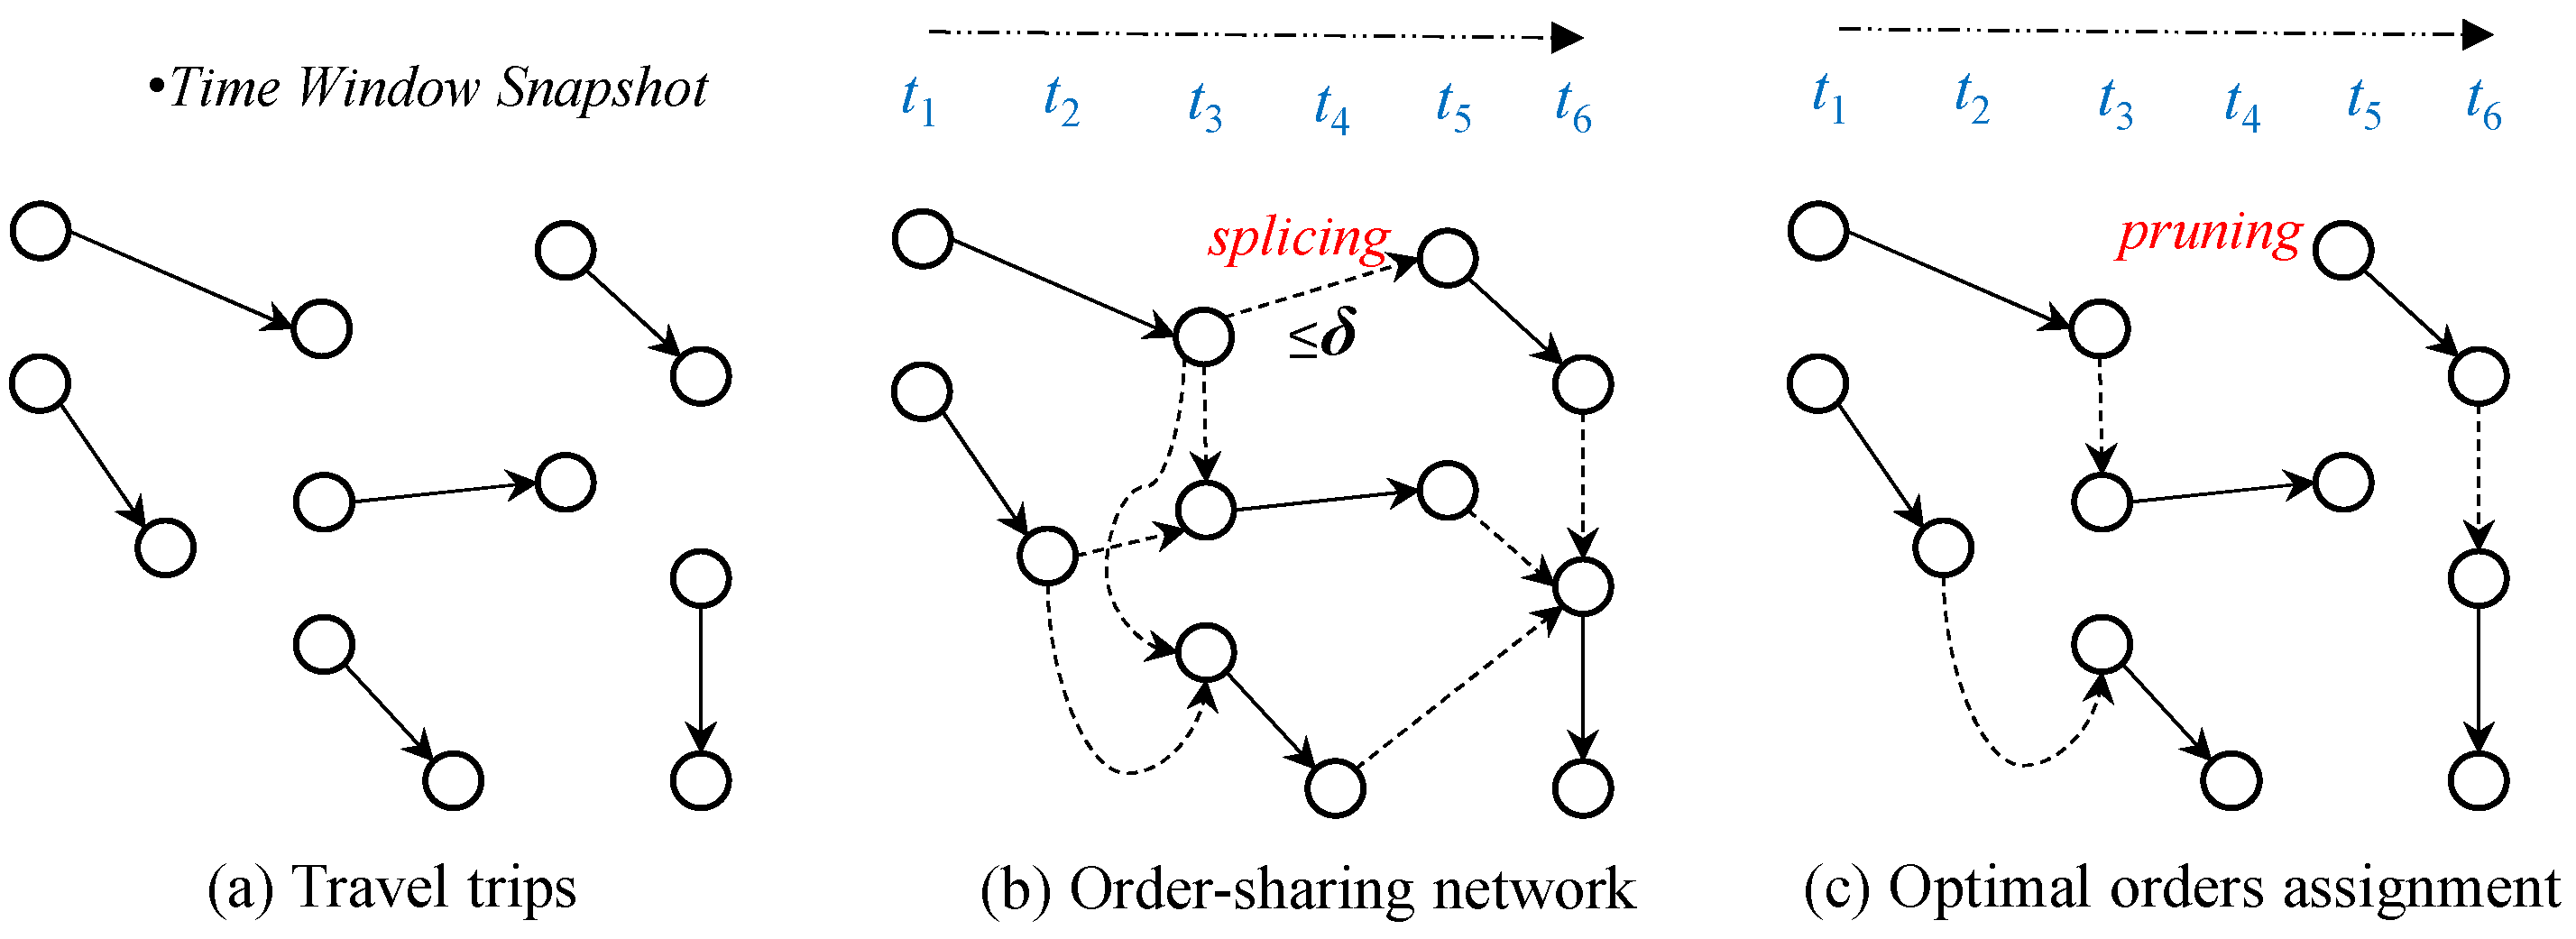
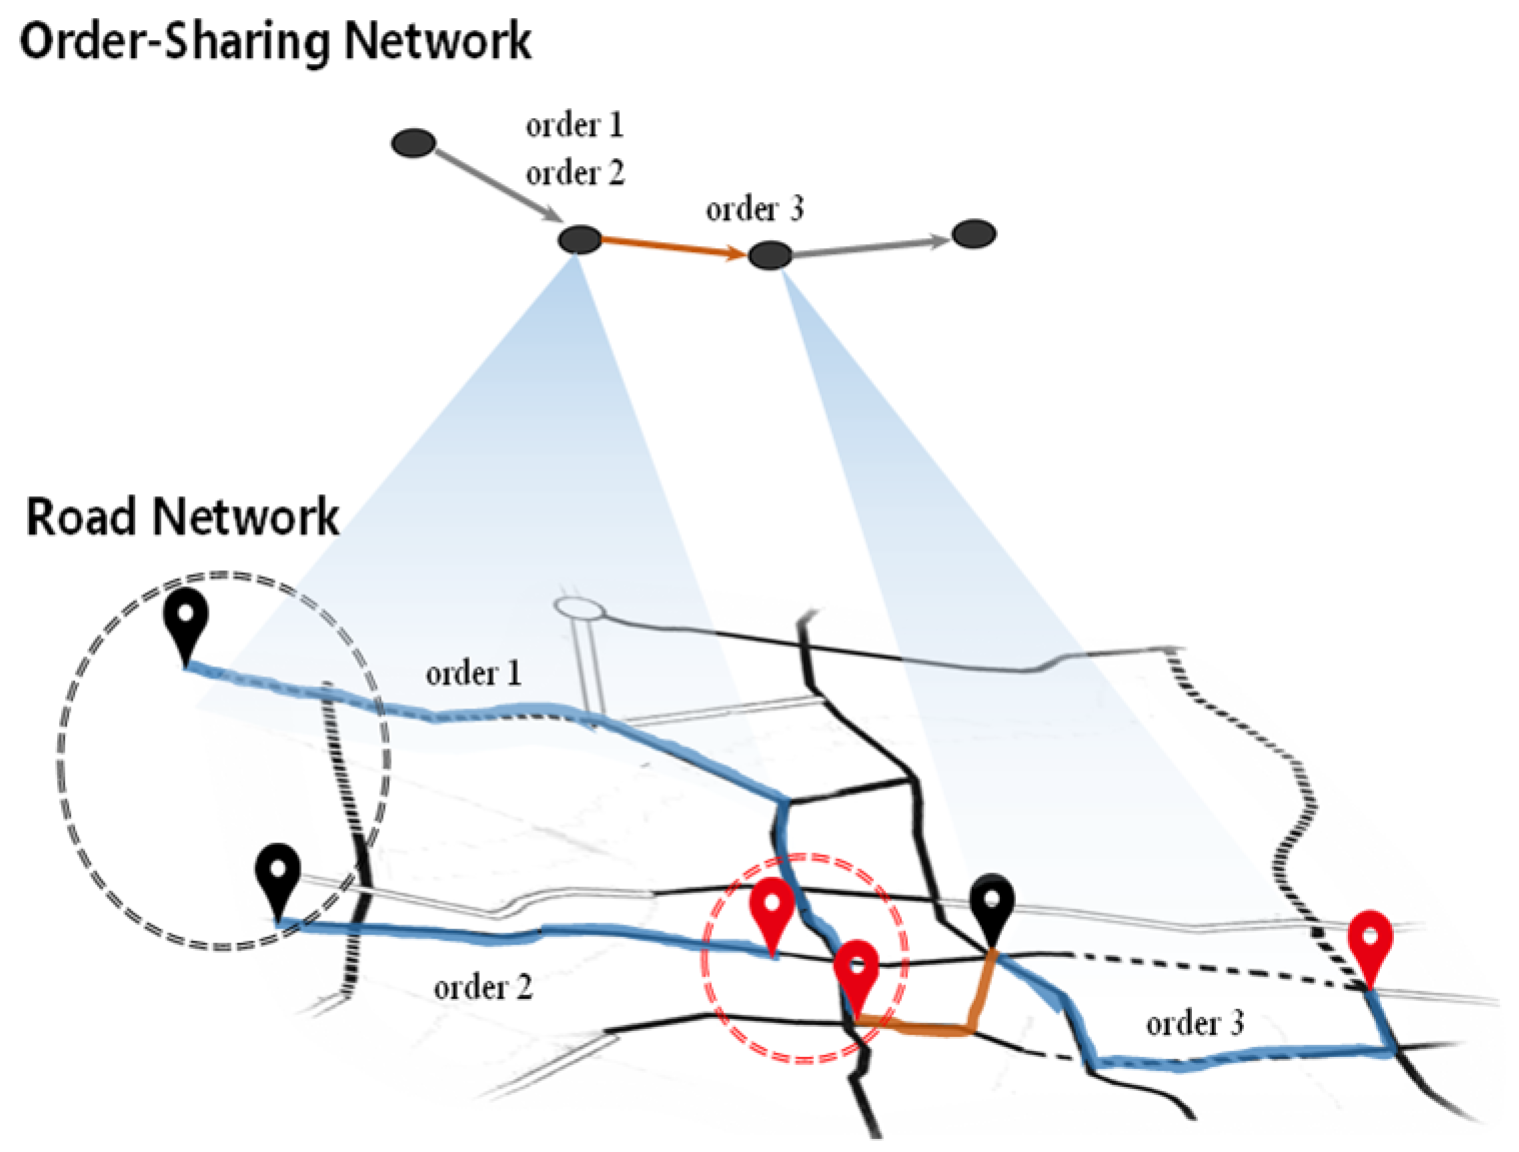
3.1. Taxi Trajectory Sharing Network

The taxi trajectory sharing network connects OD trajectories in a certain time period, thus enabling the same vehicle to pick up as many passengers as possible for the OD travel trips. The travel trajectories are modeled in a static way in time period T by introducing the maximum number of splices k that can be shared and the maximum waiting delay δ for connecting trips. Let T r a ( T ) = ( o m , d m , t m o , t m d ) denote the total number of trips in T, and m denotes the trip number. om and dm are the corresponding origin and destination of it, and t m o , t m d T are the starting and ending time, respectively. In Tra(T), it is assumed that there exist fewer paths that can connect all OD’s trajectories and satisfy the following spatiotemporal constraints. The OD trajectories are spliced in temporal sequence, and the trip time cannot overlap but can be linked by δ time delay. The om is located before the corresponding dm, and the maximum number of connections is k. Thus, the Tra(T) can be shareable for any vehicle.
The interval δ connecting two trips has a direct impact on the generated topology graph of sharing network [25]. It is assumed that two consecutive Tra(i) and Tra(j) are served by the same vehicle, i,j ∈ [1,m] and ij, and the time required to connect them is δ i j = t j o t i d . If δ i j is very short, most of the trips cannot be linked. On the contrary, if the time is long, it leads to an inefficient taxi service operation, with a lot of emissions and idling time being spent waiting for trip links. For k = 2, the two trips can be shared at a given δ by placing a link between Tra(i) and Tra(j). For k > 2, the sharing network becomes a hypergraph in which most k trajectories can be linked simultaneously. The maximum match for the trajectory sharing network is defined as follows:
Definition 1.
(Trajectory Sharing Network). The historical travel trajectories of all taxis carrying passengers are mapped into the road network to form a directed acyclic graph G = (V, E), where V represents the pickup or drop-off locations of the trips and E represents the connections. The sharing network assumes that there is no competition between taxis and each individual taxi can serve as many orders as possible, and we consider G as a trajectory sharing network for passenger pickup.
Definition 2.
(Maximum Match for Sharing Network) [26]. Given a trajectory sharing network G, the largest matching M in G is a pair of disjoint edges. The maximum matching contains as many edges as possible to minimize the number of M that satisfies all orders to be served with no conflicting time.
In the trajectory sharing network, the maximum match optimizes the fleet scale of valid taxi operations. According to the taxi order schedule, if it satisfies the temporal constraint between the drop-off point in the current trip and the pickup point in the next trip, the two trip trajectories can be spliced, as shown in Figure 2. By iteratively calculating until all trips are spliced, this allows the orders to be served with fewer vehicle assignments. In addition, the connecting time between trips must not exceed the upper limit δ. The maximum match generates a path set that covers the entire G, ensuring that all orders are served while minimizing the fleet scale of vehicles in this solution. This is also the optimal solution to the minimum fleet problem with parameter δ. In this paper, we use the matched M paths as the recommended paths for taxis to carry passengers continuously.

3.2. Problem Definition for Continuous Taxi Pickup Path Recommendation

It is necessary to distinguish that continuous passenger pickup paths are not focused on the path planning problem of one-way trip. During the course of the current taxi trip, the recommendation model advises the passenger location for the next order according to the arrival time and destination. The continuous taxi pickup path recommendation problem is mainly to help the taxi driver make the next passenger carrying decisions, and it can effectively improve the validity of the trip and benefit the global operation efficiency. Considering the inconsistent start and end time of each trip, we coarsen the trip data into an equal time series according to δ and mine the time pattern of trips. Let U = {u1, u2, …, uP} denote the unique identifier of the taxi, and P is the fleet scale of actual taxis. The E = {e1, e2, …, eL} denotes the unique identifier of the order trajectories, e is the trajectory between the one-way OD, and L is the total number of orders. The C = {c1, c2, …, cM} denotes the splicing trajectories in the sharing network, and M is the maximum number of matching paths, MPL. Each e is associated with the pickup point o and the drop-off point d of the trip and belongs to part of the spliced trajectory c.
Definition 3.
(Taxi Pickup Trajectory). In the temporal snapshot T of the sharing network, the pickup trajectory of taxi i is defined as a four-tuple (ui, ei, ci,  t i o ,   t i d ), where ui ∈ U denotes the taxi identification, ei ∈ E denotes the current trip, ci ∈ C denotes the continuous pickup path to which it belongs, and t i o , t i d ∈ T denotes the start and end time of the trip. The tuple represents the continuous pickup trajectory obtained by splicing the current trip.
The continuous pickup path recommendation is based on the maximum matching obtained from the trajectory sharing network under the current trip e and temporal constraint ( t o , t d ) to obtain the Top-n paths. We turned the continuous taxi pickup path recommendation problem into the generation of the trajectory sharing network and found the maximum match path of it. Specifically, it was divided into two stages.
Based on the OD trips of historical orders, it is possible to estimate the potential orders for the future. We built a spatiotemporal neural network to predict the temporal pattern of orders. The topology of the trajectory sharing network G is represented by the pickup and drop-off points V, the set of trip trajectories E, and the adjacency matrix A. We used discrete time points tT to record the orders, and XT denotes the travel volume. The xtXT denotes the status of an OD pair in the sharing network at time t. The prediction of taxi orders can be viewed as learning the mapping function f based on the vector XT in G, as shown in Equation (1):
( x t , , x t + s ) f { G ;   ( x t τ , , x t 1 ) }
where τ denotes the historical time window, and s denotes the prediction step.
The next stage was to construct a trajectory sharing network based on potential trips that satisfied the constraint δ and k to obtain the maximum match as the recommendation path. A taxi’s continuous pickup path c(ui) is defined as a trajectory of orders connected in time sequence, with time intervals between them less than threshold δ, denoted as c(ui)=<(ui, e1, ci, t 1 o , t 1 d ), …,(ui, ek, ci, t k o , t k d )>, and k is the count of hops of this continuous pickup path. To enhance the continuous passenger carrying capability of taxis, this paper was devoted to learning a path recommendation function Recommend{.} that maps the predicted travel trips to the sharing network for path computation. Given the order information xt~xt+s of ui and the arrival time t i d of current trip ei, the continuous pickup path recommendation returns a set of n paths, as shown in Equation (2).
< c 1 ( u i ) , , c n ( u i ) > = R e c o m m e n d { u i , e i , t i d | ( x t , , x t + s ) } .
From this, the c1(ui) is the optimal continuous pickup path for taxi ui in the next order, c2(ui) is the suboptimal solution, and so on. In fact, the potential trajectory sharing network is able to completely define the time-varying features of the taxi trips. Therefore, the continuous pickup path recommendation model extracts the historical features of the trips and calculates the travel paths based on them.

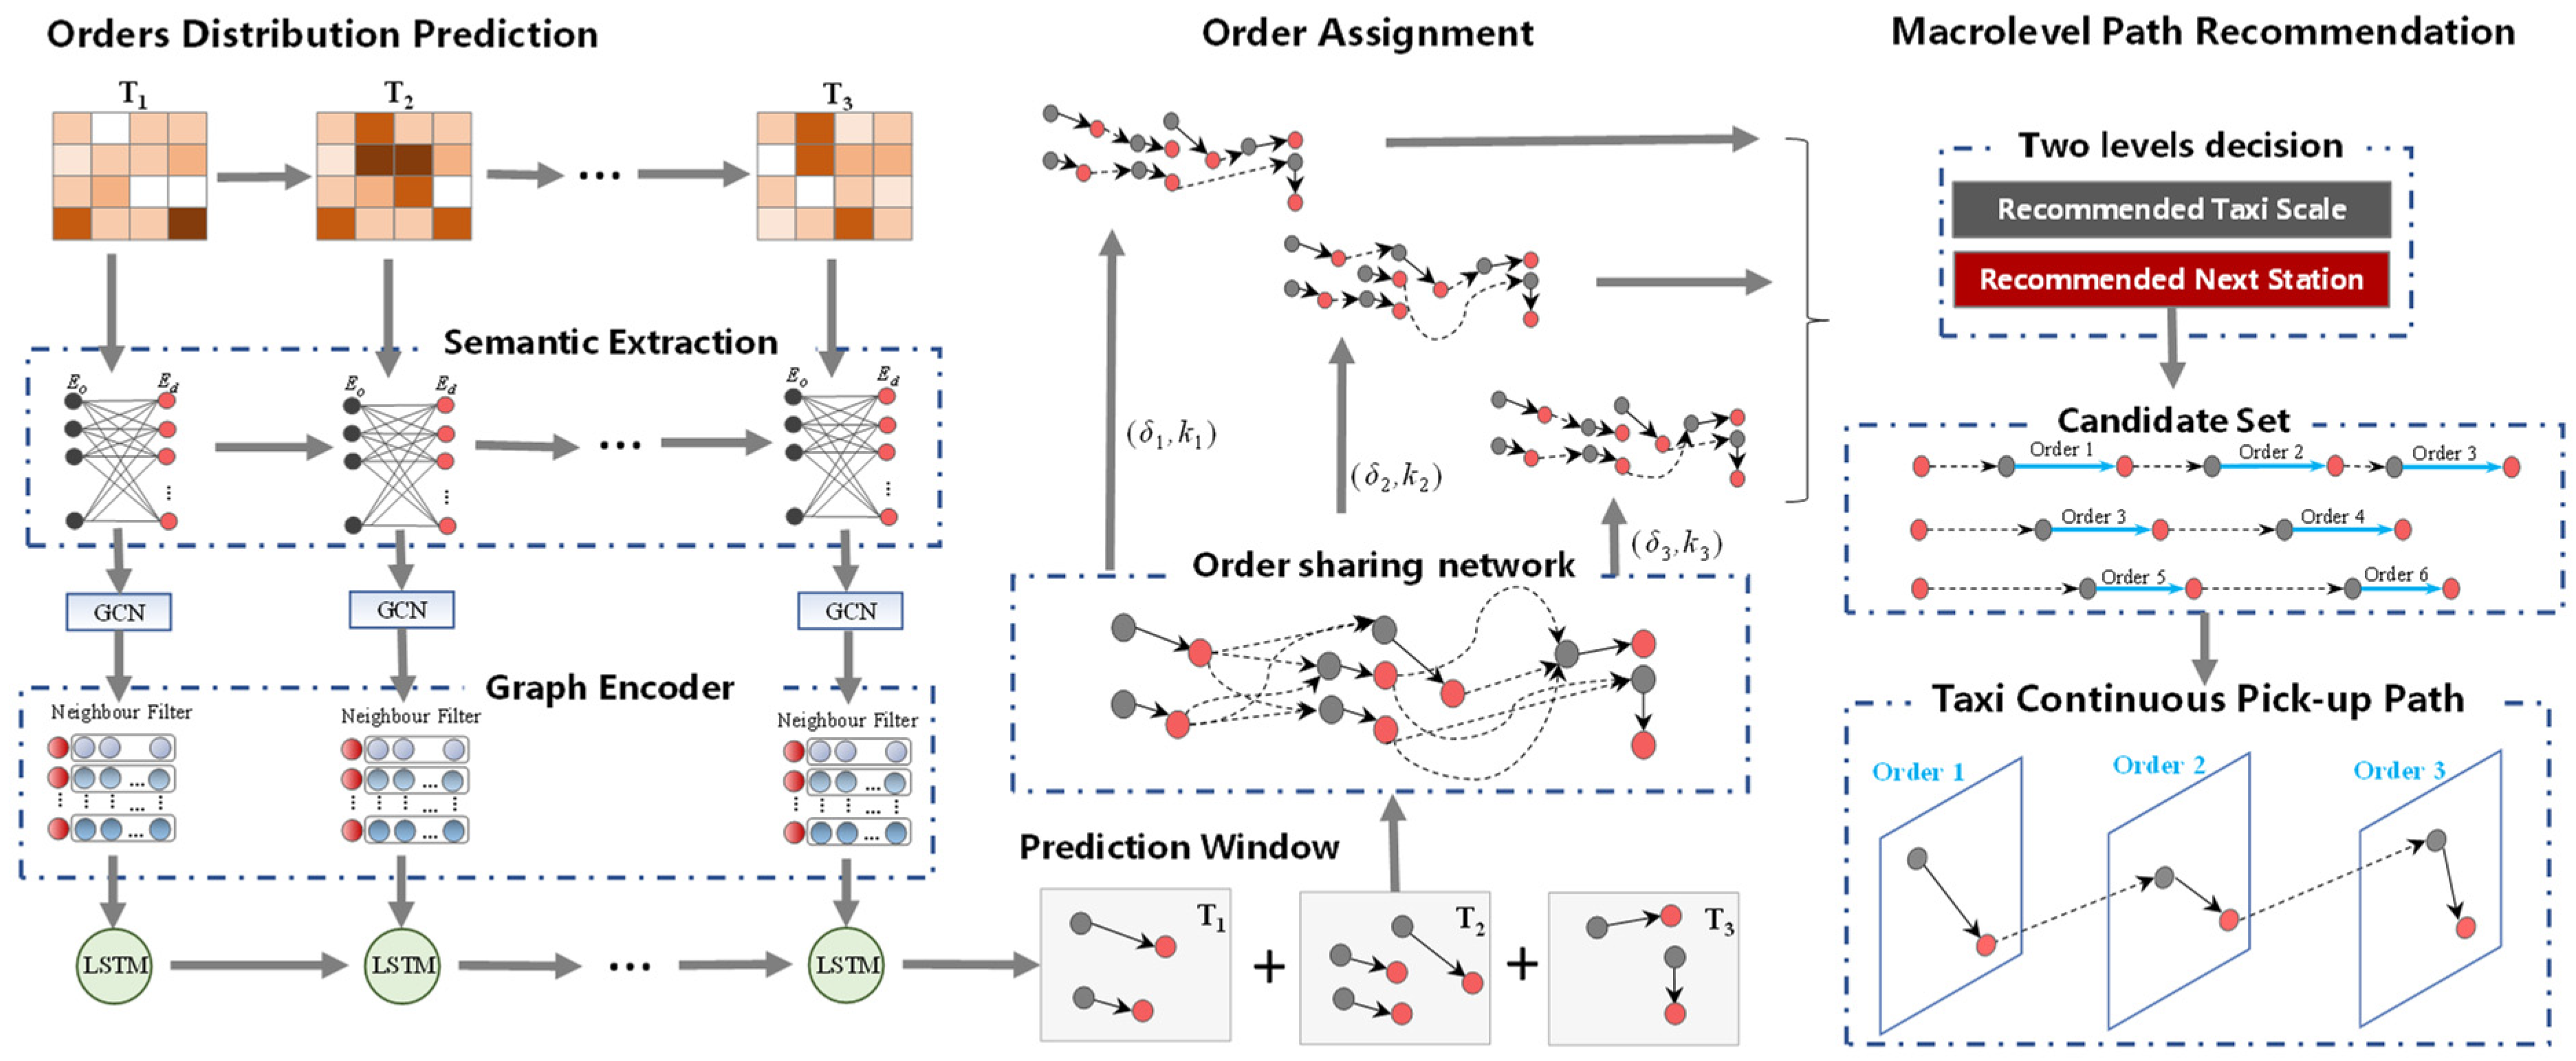
4. Continuous Taxi Pickup (CTPU) Path Recommendation Architecture

The CTPURec is a discrete dynamic path recommendation model that builds a continuous path based on the prediction of future travel demands. As the path recommendation is constructed based on a sharing network of potential orders, it first requires an accurate prediction of travel trips. We use the offline phase to train the historical taxi trip data, then the online phase to predict potential trips in real-time and generate recommended paths. The CTPURec defines and trains taxi demands and sharing network modules separately, and it interacts to capture the complex relationships between taxi trajectories and passenger pickup paths. The architecture of CTPURec can be subdivided into the spatiotemporal neural network for travel trip predictions and the trajectory sharing network for collaborative path recommendations, as shown in Figure 3. The spatiotemporal neural network generates a snapshot graph of the potential travel orders, which further extracts the ideal passenger pickup paths in the trajectory sharing network. This hybrid structure builds two levels of decision support, with system-level decisions guided by the minimum fleet size to satisfy the travel demands and user-level decisions to guide the next taxi trip selection.

4.1. Travel Trip Predictions Based on Self-Learning Semantic Relation

Travel demands are the main drivers for taxi operation, and accurate prediction of trips helps to capture taxi movement patterns. The road network-based OD matrix is a large dimensional sparse matrix that records the links between all nodes (intersections). Due to the sparsity and fine-grained scale of the data, node-level OD prediction is often difficult to extract effective features, and the learned features are often unreliable. The order-level ODs describe the travel demands of passengers in a coarse-grained manner. By extracting these order pickup and drop-off points, the taxi’s trajectory graph can be well characterized. The coarse-grained sharing network makes the ODs as nodes to construct a directed graph, reducing the node space for graph search. The aggregated network formed by removing the middle nodes of the trips is a coarse-grained representation of the road network.
The graph convolutional network is widely used for spatial feature extraction of temporal snapshots of traffic network [27]. The Laplace matrix L = D-A can be used to represent the structure of the graph, with the L normalized form L ¯ = D 1 2 L D 1 2 , where A, D denote the adjacency matrix and degree matrix. However, there are some limitations in using fixed adjacency relations to characterize dynamic graph features [28]. To better capture the semantic relation between orders, we extend the adjacency matrix A of the static topology to a dynamic OD semantic correlation matrix Ã. The à is composed of the OD semantic relations of nodes within a snapshot of time T. Combining the semantic relations of self-learning [29], we employ an adaptive correlation matrix and capture the interaction between node status and link relations by end-to-end supervised training. The adaptive correlation matrix can capture the hidden spatial dependencies in the data as shown in Equation (3).
A ˜ = S o f t m a x ( R e l u ( E o Τ · E d ) )
The A ˜ is obtained by two learnable parameters Eo and Ed, where Eo is the origin embedding and Ed is the destination embedding. Then, the Relu activation function is used to eliminate weak connections, and finally we obtain the à by using the Softmax. During the building process of A ˜ , the OD trajectory is considered as a node, and the interaction between them is symmetric and can be directly used for graph analysis. The state transition in the sharing network can be regarded as an aggregation function of the semantic node status, that is, the semantic features are the projections of the multidimensional features to first order, which is achieved by Ã. The first-order Chebyshev approximation to graph convolution [30] further simplifies the graph convolution operation. We added the semantic correlation matrix à and its dependency degree matrix D ˜ to define the GCN layer as follows:
H = Γ ( G C N ) ( D ˜ 1 2 A ˜ D ˜ 1 2 · X · Θ ) .
where D ˜ 1 2 A ˜ D ˜ 1 2 is the convolution filter for computing the semantic correlation, X denotes the node status, Θ is the training parameter matrix, and Γ ( G C N ) is the ReLU activation function for first-order spectral convolution. Finally, the node status X T is transformed into an implicit graph encoding H T through the encoding H of the sharing network. The CTPURec extracts the semantic features of the graph snapshot, then the output is fed into the temporal module to capture the time-dependent features.
In the potential travel trip prediction, the change of node status is the result of a combination of spatial propagation and temporal tidal effects. The baseline LSTM can predict future multi-step outputs based on historical sequences [31]. The prediction target is to fit the graph encoding ht+1 based on historical encoding {Hq | q = tτ, …, t}, where τ is the time interval. It takes Hq as the input, and the output layer, after processing performed by the internal memory unit, will generate a value ht+1 as the input of the next cell. Combined with the gate control units of LSTM, we propose a coarse-grained graph prediction method. The memory unit processes the vector Hq through the forget gate, input gate, and output gate, respectively. As a result, the xt is converted to Ft, It, Ot of hidden layers via the following gate update function as shown in Equation (5):
F t , I t , O t = Γ ( g a t e ) ( W ( x ) [ x t , h t 1 ] + b ( x ) ) .
where W(x) denotes the weight matrix of the input layer to the gate, and b(x) denotes the corresponding bias. The Γ ( g a t e ) is the Sigmod activation function. The latent encoding of gate control units is computed using the input and the historical hidden state within time t−1. The input gate and forget gate are used to update the cell state Ct, and the output ht is controlled by the output gate and the cell activation state, as in Equation (6):
C t = F t C t 1 + I t tanh ( W c [ x t , h t 1 ] + b c ) , h t = O t t a n h ( C t ) .
where ⊙ is the Hadamard product and Ct is the cell state with the corresponding weight Wc and bias bc. In summary, based on the sharing network statuses at time t, the CTPURec spatiotemporal memory unit utilizes A ˜ t 1 , Ct−1, and ht−1 as the a priori knowledge for prediction. The final prediction yt is obtained by the output ht of the spatiotemporal memory unit. This prediction result effectively integrates the semantic knowledge of historical status and dynamics, and it better fits the travel patterns of the real road network.

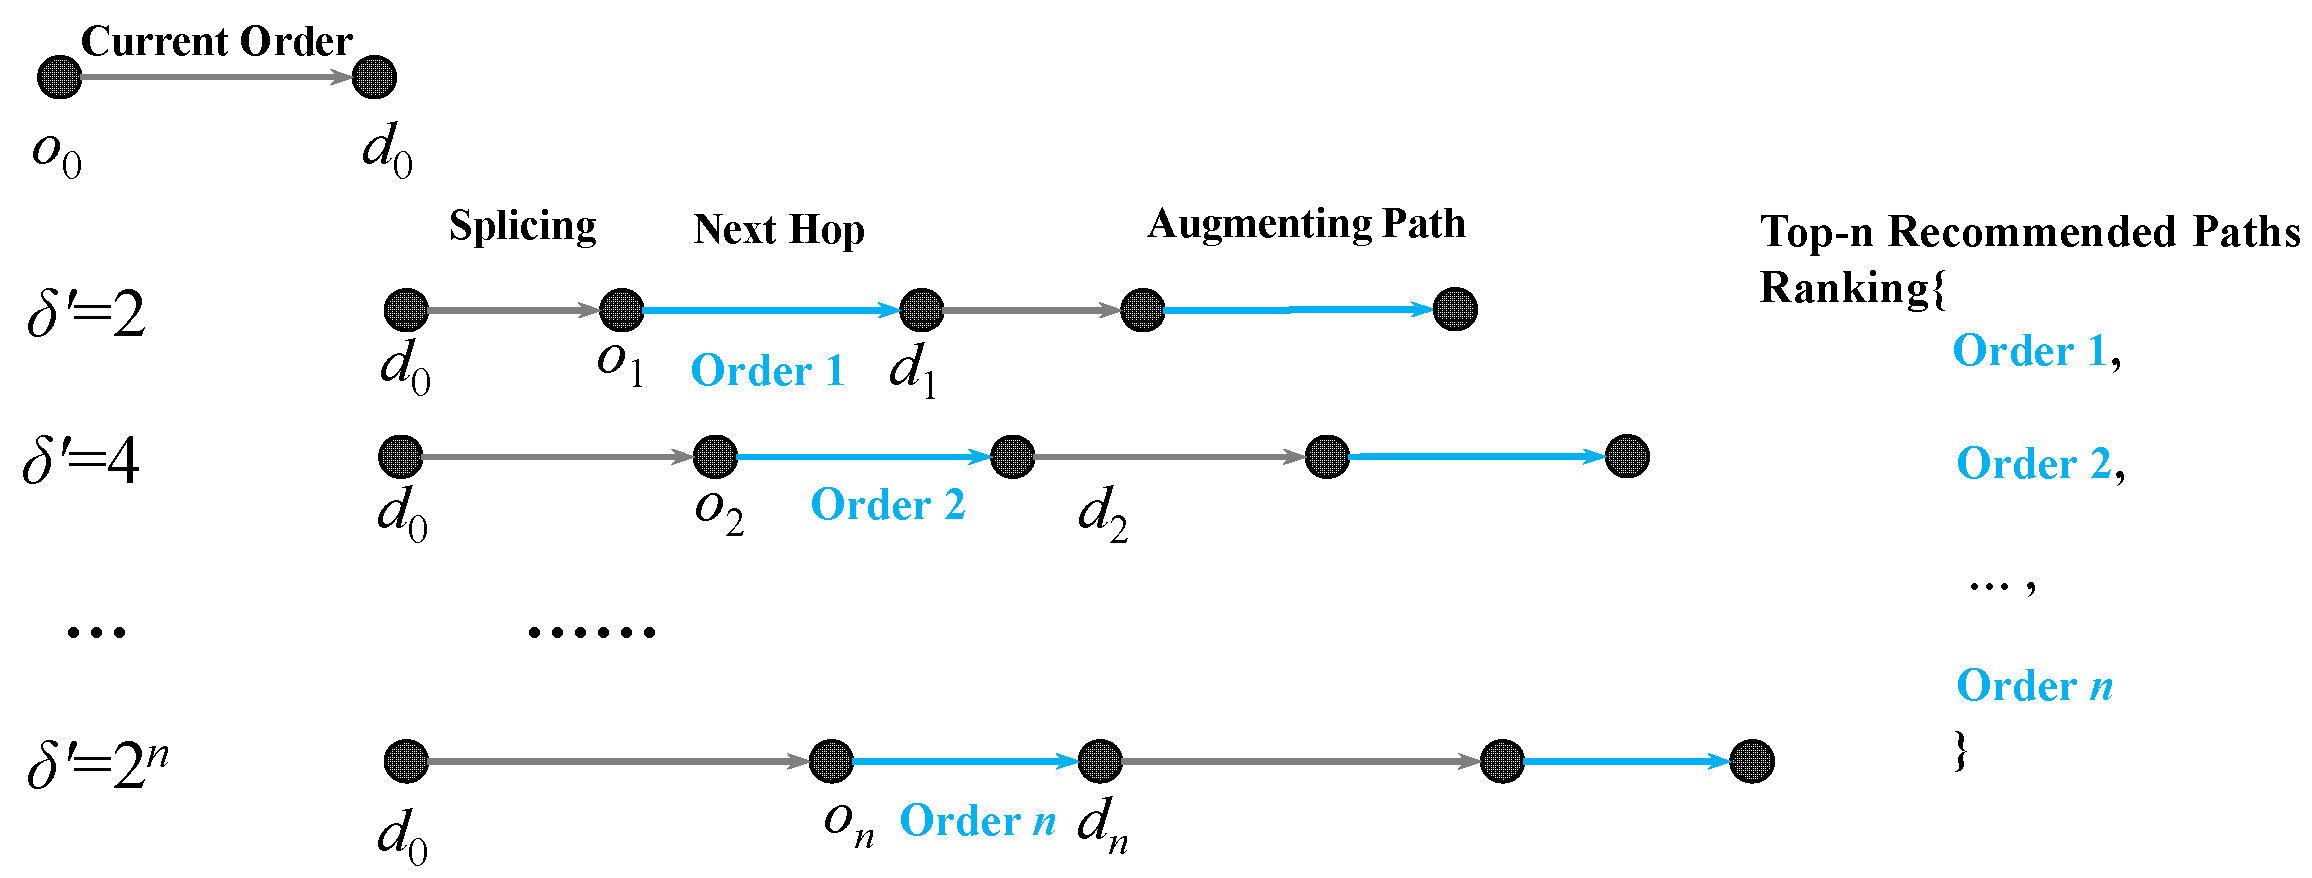
4.2. Continuous Passenger Pick-Up Path Recommendation

Traditional taxi path recommendation models focus on the path problem of a one-way trip and the lack of guidance on the macroscopic travel path. The trajectory sharing network covers the temporal trajectories of taxi orders, so a pre-assignment approach can be adapted to constrain the behavior of taxis for the purpose of global optimization. With the purpose of a balanced orders assignment, we propose a macrolevel path recommendation method based on the sharing network. By predicting the potential orders, we create an order-sharing graph snapshot based on the future taxi orders for the next three hours. The sharing network evolves different topology graphs with the snapshots, which obtain a series of dynamic trip distributions. The generation of the potential trip distributions will determine the macro planning of the taxi’s pickup path and the system-level order allocation strategy, and further, it can even be used to build a global travel equilibrium system.
The solution to the maximum path coverage of a directed graph is an NP-hard problem, but the optimal solution can be found in polynomial time if there are no closed-loop paths in it. There is no closed loop directed path in the trajectory sharing network, see Proof 1. Therefore, we transform the path extension problem for a sharing network into a maximum matching solution for a bipartite graph. First, the nodes set V of the sharing graph G is divided into two parts, Vo and Vd, VoVd = V, and the edges in E are connected for it. The bipartite graph is formulated as G′ = (VoVd, E). For the matching of G′, the set of trajectories M is used to connect the path from Vo to Vd, and the path is covered by, at most, one trajectory. The maximum matching problem of the order-sharing graph is thus transformed into the minimum number |M| of augmenting paths covering all nodes, which is also the maximum matching of G′.
Definition 4.
(Trajectory Splicing). Let M be a matching of the bipartite graph G′, and E is the next-hop trip that satisfies the time constraint. If M′ = M⊕E is still a match, and |M′| = |M| + 1, then E is a valid extension. The ⊕ is the symmetric difference operation.
For a given taxi order, we augment this order by path splicing until all trips are traversed. Finally, we obtain the fully covered connected branch of G′ by the trajectory-splicing process. The recommended path of continuous pickup is the next-hop trajectory in the augmentation path. In practice, the taxi drivers have different tolerances for order delays, and it is difficult to increase their individual costs to meet the global optimum. The CTPURec defines a delay relaxation parameter δ′ to generate different augmented paths, which are ranked according to the travel cost to obtain the Top-n recommendation. When an OD request is made, the personalized δ′ is added for path splicing, so that different output paths are possible for the same request of different taxi drivers, as shown in Figure 4.
At the same time, the prediction module transmits the potential orders to the online recommendation module in almost real-time. In this way, the online recommendation module is able to make continuous pickup path decisions that satisfy the taxi travel demands based on the trip distribution. The target of CTPURec is to obtain a potential order assignment scheme for the taxi service system, which converts taxi ridership competition into an on-demand assignment.
Proof 1.
It is assumed that the maximum matching M = {c1, c2, …, cM} of G′ contains the directed closed-loop path, and the trip sequence corresponding to the path of this loop is denoted as <e1,e2,…,e1>. For each trip e, its trajectory can be denoted as T r a ( T ) = ( o m , d m , t m o , t m d ) . Therefore, the loop path is transformed into a sequence of trajectories < ( o 1 , d 1 , t 1 o , t 1 d ) , ( o 2 , d 2 , t 2 o , t 2 d ) , , ( o 1 , d 1 , t 1 o , t 1 d ) > . In the trajectory sharing network, the sequence of trips in the splicing path c satisfies the temporal constraints, t 1 o < t 1 d ( t 1 d + t 1 2 ) t 2 o , t 2 o < t 2 d ( t 2 d + t 2 1 ) t 1 o . As for trip e1, the t 1 o < t 1 d contradicts the temporal constraint t 1 d < t 1 o in the loop, so the trajectory sharing network is a directed acyclic graph. □

4.3. CTPURec Optimization

The recommendation of the continuous pickup path relies on the generation of the order-sharing graph, and we obtain it by training the historical data through a neural network layer. The recommended path is based on the trajectory splicing on the potential trips. Thus, the taxi service system operation can be transformed into an order-balanced assignment for on-demand acquisition by training a sharing graph for path recommendation. We propose a data-driven deep learning solution for obtaining order-sharing graph sequences, as shown in Figure 5.
In the offline training phase, the historical taxi travel trip data provides input samples for network training. The spatiotemporal feature extraction first aggregates the data of the trips to obtain a coarse-grained sharing graph, and then it learns the sequence features of the graph based on temporal snapshots. The demand and supply of taxi services are complex and changing, so the links in the sharing network should also be dynamic. In particular, there are limitations in using fixed adjacent relationships to model spatial dependencies between trips. Therefore, we employ an adaptive correlation matrix to capture the hidden spatial dependencies between trip and topology. After offline training, the prediction module can perform real-time prediction for potential travel trips and periodically update the parameter configuration. With the obtained potential trips, they are spliced by constructing a trajectory sharing network to map the trips to the optimal (or near-optimal) branch of the maximum match. To train the learning parameters of the model, we use the average error between the real and predicted flows in the sharing graph as the objective function for the training process, as shown in Equation (7):
O b j ( x , y ) = 1 L e E ( y e t x e t ) + γ · 2 .
where x denotes the trip volume distribution in the real sharing graph, and y denotes the distribution of predicted trips. The second term 2 is a ridge regularization, and γ is a hyperparameter. After the pre-training procedure of the sharing network, the distribution of trips and the graph connectivity are obtained for future steps. Based on these predictions, the results are fed into the online recommendation module for real-time pickup path recommendations.
Online Path Recommendation: As the volume of passenger trips changes dynamically over time, the CTPURec needs to constantly update the trip distribution in the sharing graph to adapt to its evolution. The output y of the online prediction module indicates the potential trips of the passenger travel in the sharing network, interpreted as a coarse-grained travel trajectory. The CTPURec generates maximum matching paths based on the topological configuration of the trips, guiding taxis to adopt the matching paths for passenger pickup travel. The path recommendation is to perform path search on the sharing graph after maximum matching and return the pickup path that meets the travel demands and is consistent with the global optimization. Therefore, the taxi pickup path recommendation model, with consideration of order equilibrium, can effectively guide the taxi driver’s decision-making for the next hop.

5. Experimental Results and Analysis

In this work, we focused on a more meaningful and logical task of making continuous pickup paths to taxis in the next three hours. In the large-scale road network, if node-level data granularity is used for analysis, the sparsity of order data leads to poor performance. We performed data fusion on taxi trips data based on a sharing graph. The trip data was segmented and fused under the spatiotemporal slice, and then the sharing graph was obtained as the input to our model.
Data aggregation for sharing graph: Since the nodes covered in the trips were very sparse compared to the road network, it was difficult for node-level trip prediction to accurately capture the travel demand pattern. We built a sharing graph based on the node graph of road network to cope with the sparsity of the trip data. To calculate the link cost between orders in the sharing graph, it was necessary to bridge the sharing graph with the road network. The two-layer structure preserved order information and connection relationships, thus reducing the search space. The prediction was performed on the upper layer to overcome data sparsity. As shown in Figure 6, the data density at the order level was higher than that at the road network level. The structural complexity and link sparsity of the road network was significantly reduced after coarse-grained aggregation.
The road network for the experiments in this paper was derived from the map of Chengdu city provided by OpenStreetMap (www.openstreetmap.org by 7 April 2021), by further extracting 113,825 road sections and 81,371 nodes. The taxi trip data was obtained from the KDD CUP 2020 car-hailing datasets provided by Didi Chuxing (gaia.didichuxing.com by 7 April 2021). It contains taxi trajectories and car-hailing orders for Chengdu, where the travel data ranged from 1 November to 30 November 2016. The total number of order data after missing value processing was 7,062,959 trip records, and each trip record contained the start and end timestamps and the geographic coordinates of the origin and destination locations. The number of coarse-grained nodes after the aggregation of location points for taxi trips was 36,353. Finally, the taxi OD matrix in a fixed time interval was obtained by counting the number of interactions between nodes in the sharing graph. In the following, we will evaluate the effectiveness of the model from four aspects.
The experimental environment was (CPU: Intel(R) Xeon Silver [email protected], GPU: NVIDIA GeForce RTX 2080 Ti, Provided by OMNISKY of Beijing, China), 64GB RAM, Windows 10 64-bit operating system. The experiments used the Python to map and match the road network dataset, and then build the TensorFlow deep learning model optimized by the Adam optimizer to perform order prediction and trajectory analysis. The latent feature dimension of temporal gating and spatial convolution was set to 64 and the learning rate was 10−3.

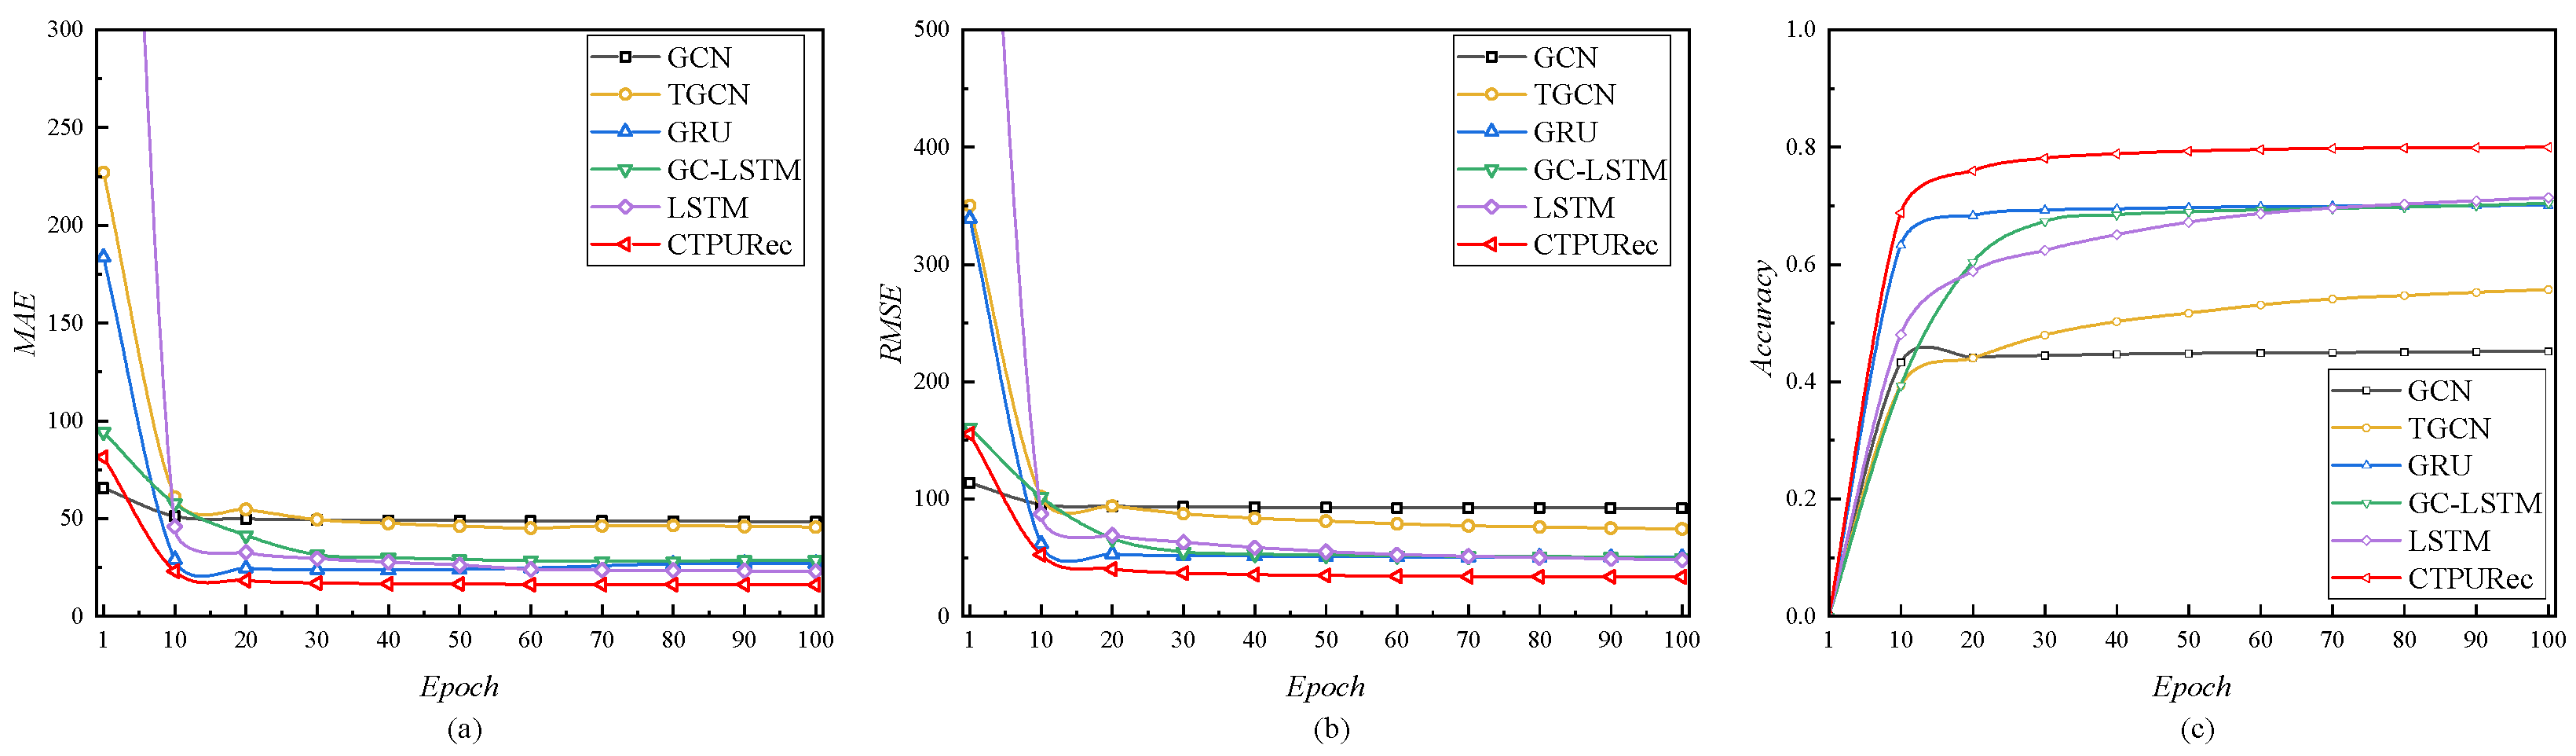
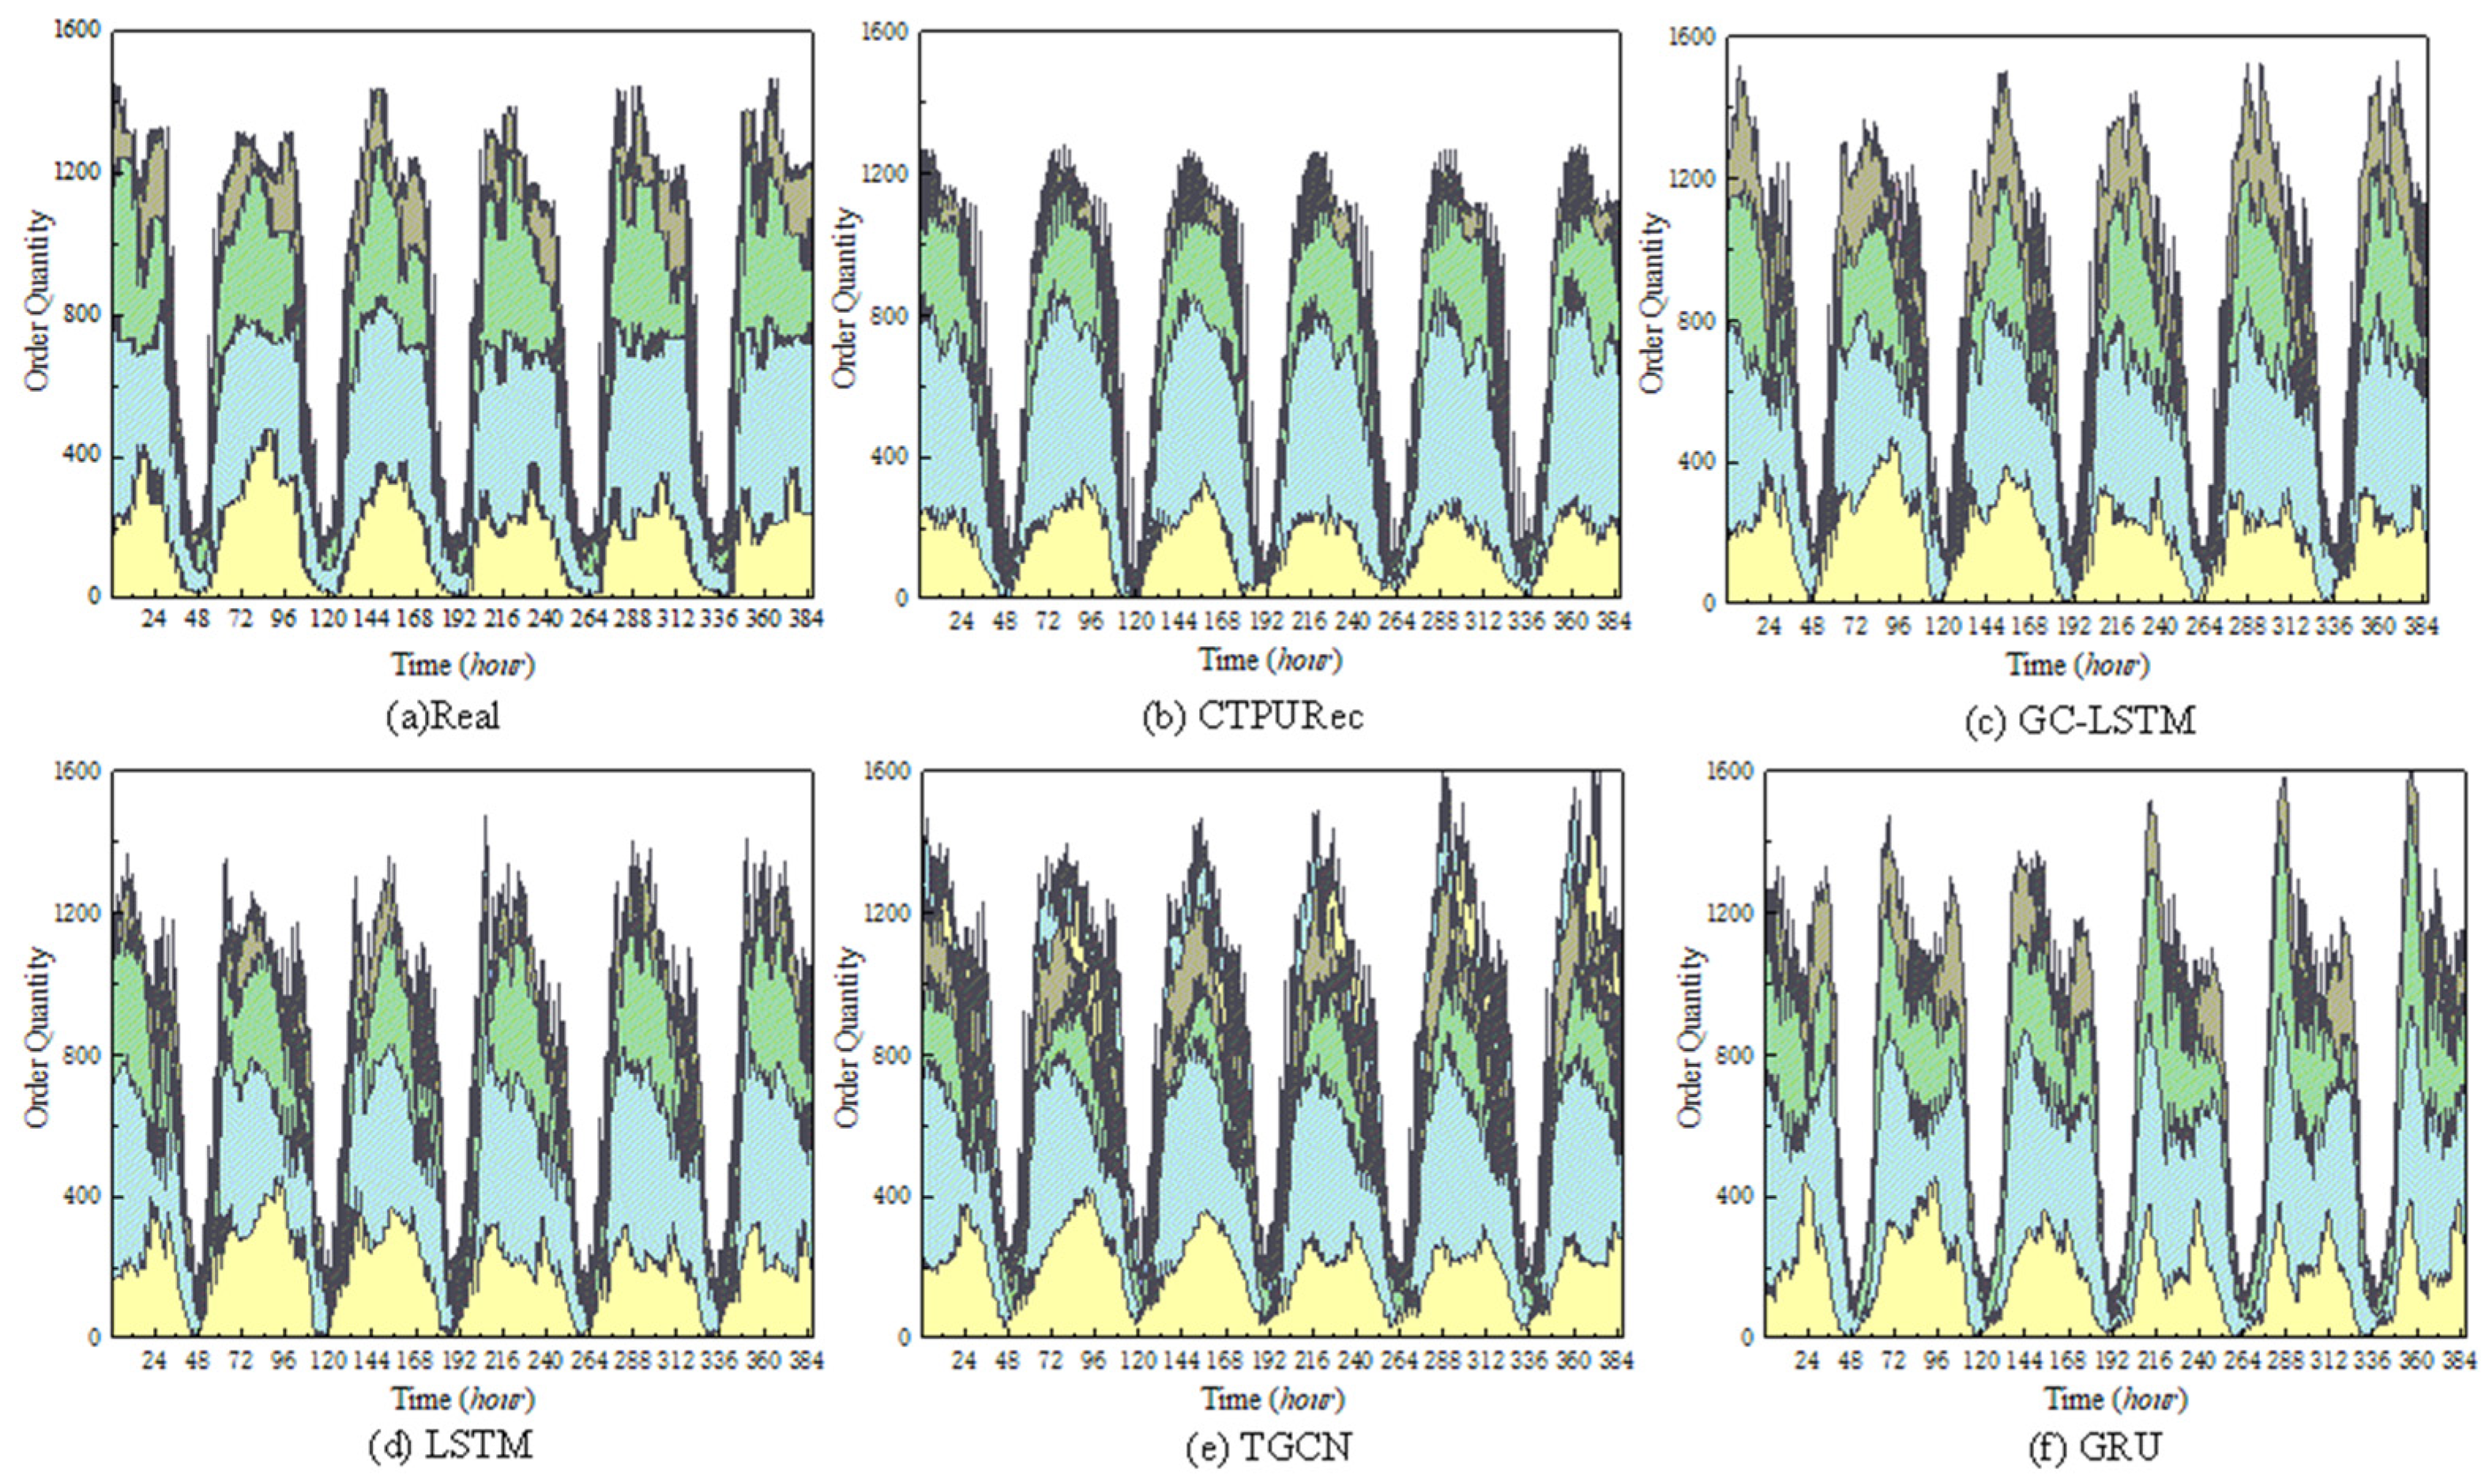
5.1. Potential Trips Sharing Network Distribution Prediction

The CTPURec divided the taxis acquired on-demand in the road network into two parts, the active set and the idle set, based on the potential sharing network prediction. The training process was to add the status sequence of orders to the road network, and the time-divisional sharing network was used as a time snapshot. We set a historical time window of 12 h and aimed to predict potential orders for the next 3 h. We used the first 80% of the travel dataset as the training data and the remaining 20% as the validation data. We chose three prediction errors as evaluation metrics, MAE, RMSE, and accuracy. The smaller the value of MAE and RMSE, the better the performance of the model. The value of accuracy ranged from 0 to 1, and the closer it was to 1, the better fitting ability of the model. The experiments compared the performance of our proposed CTPURec with other baselines, such as recurrent neural networks with LSTM [31], GRU [32], and graph neural networks with GCN [33], T-GCN [34], and GC-LSTM [35]. We trained the models separately for 500 epochs, and the prediction errors on the validation data are shown in Table 1.
As can be seen from the prediction errors at the three-time steps, the GCN had the worst prediction reliability because it only relied on the aggregated neighborhood features. The T-GCN combined the advantages of GCN and GRU, and there was no significant improvement on the results due to the graph feature extraction with fixed topological correlation. The GRU and LSTM had better prediction performance in timing-dependent trip sharing networks by introducing the gating mechanism. Meanwhile, both LSTM-based CTPURec and GC-LSTM used dynamic semantic vectors for spatial feature extraction to obtain lower errors and higher accuracy. Although the prediction performance decreased with an increasing time length, the CTPURec improved 32.33%, 25.56%, and 8.33% relative to the suboptimal solution at the 3 h prediction. This was due to the spatiotemporal coding capturing more information about potential trends, which made it more suitable for long time prediction.
The purpose of this set of experiments was to examine the feature fitting ability of the CTPURec and the baselines during the iterative process. Since the CTPURec was based on spatiotemporal feature fusion, we focused on its feature extraction ability during the training process. The Figure 7a,b shows the variation of MAE and RMSE of the models at the 3-h prediction steps. It is worth noting that the training errors of GCN, GC-LSTM, and SANN were relatively small and reached stability quickly in the initial stage of model training, indicating that the learning rate of graph features was better than that of the time-series recurrent networks. As can be seen from the change of accuracy curve in Figure 7c, the CTPURec achieved better accuracy in the initial stage, which means that the adaptive semantic relations could fit the spatial relations of trips well.
To clearly show the ability of different models to predict potential orders, we intercepted the change in overall order volume for the next 16 h prediction. As shown in Figure 8, we compared the TGCN, GC-LSTM, LSTM, GRU, and CTPURec, with different colors indicating different order magnitudes. In Figure 8b, the CTPURec uses adaptive spatial relations for prediction, and the fluctuation pattern of its order volume best matched the Real plot. The GC-LSTM also used dynamic neighborhood modeling, however, its nonlinear fitting ability was not as sufficient as that of the adaptive CTPURec. In outlier processing, LSTM and TGCN were more sensitive to sharply rising order quantity in the figure, while CTPURec generalized these orders. In Figure 8e, the fitted curve of TGCN fluctuates a lot. This is because the superposition of redundant spatial features increased the magnitude of the predicted values, resulting in an unstable curve. The GRU and LSTM are recurrent neural networks that performed predictions based on time series features. It can be seen that their performance was relatively stable, with no dramatic fluctuations in the prediction curves, but the fitting ability was not as good as that of the dynamic neighborhood model. As the GC-LSTM required constant dynamic adjustment of neighbor relationships, the spatial feature fitting ability was better than TGCN, but not as good as the CTPURec.

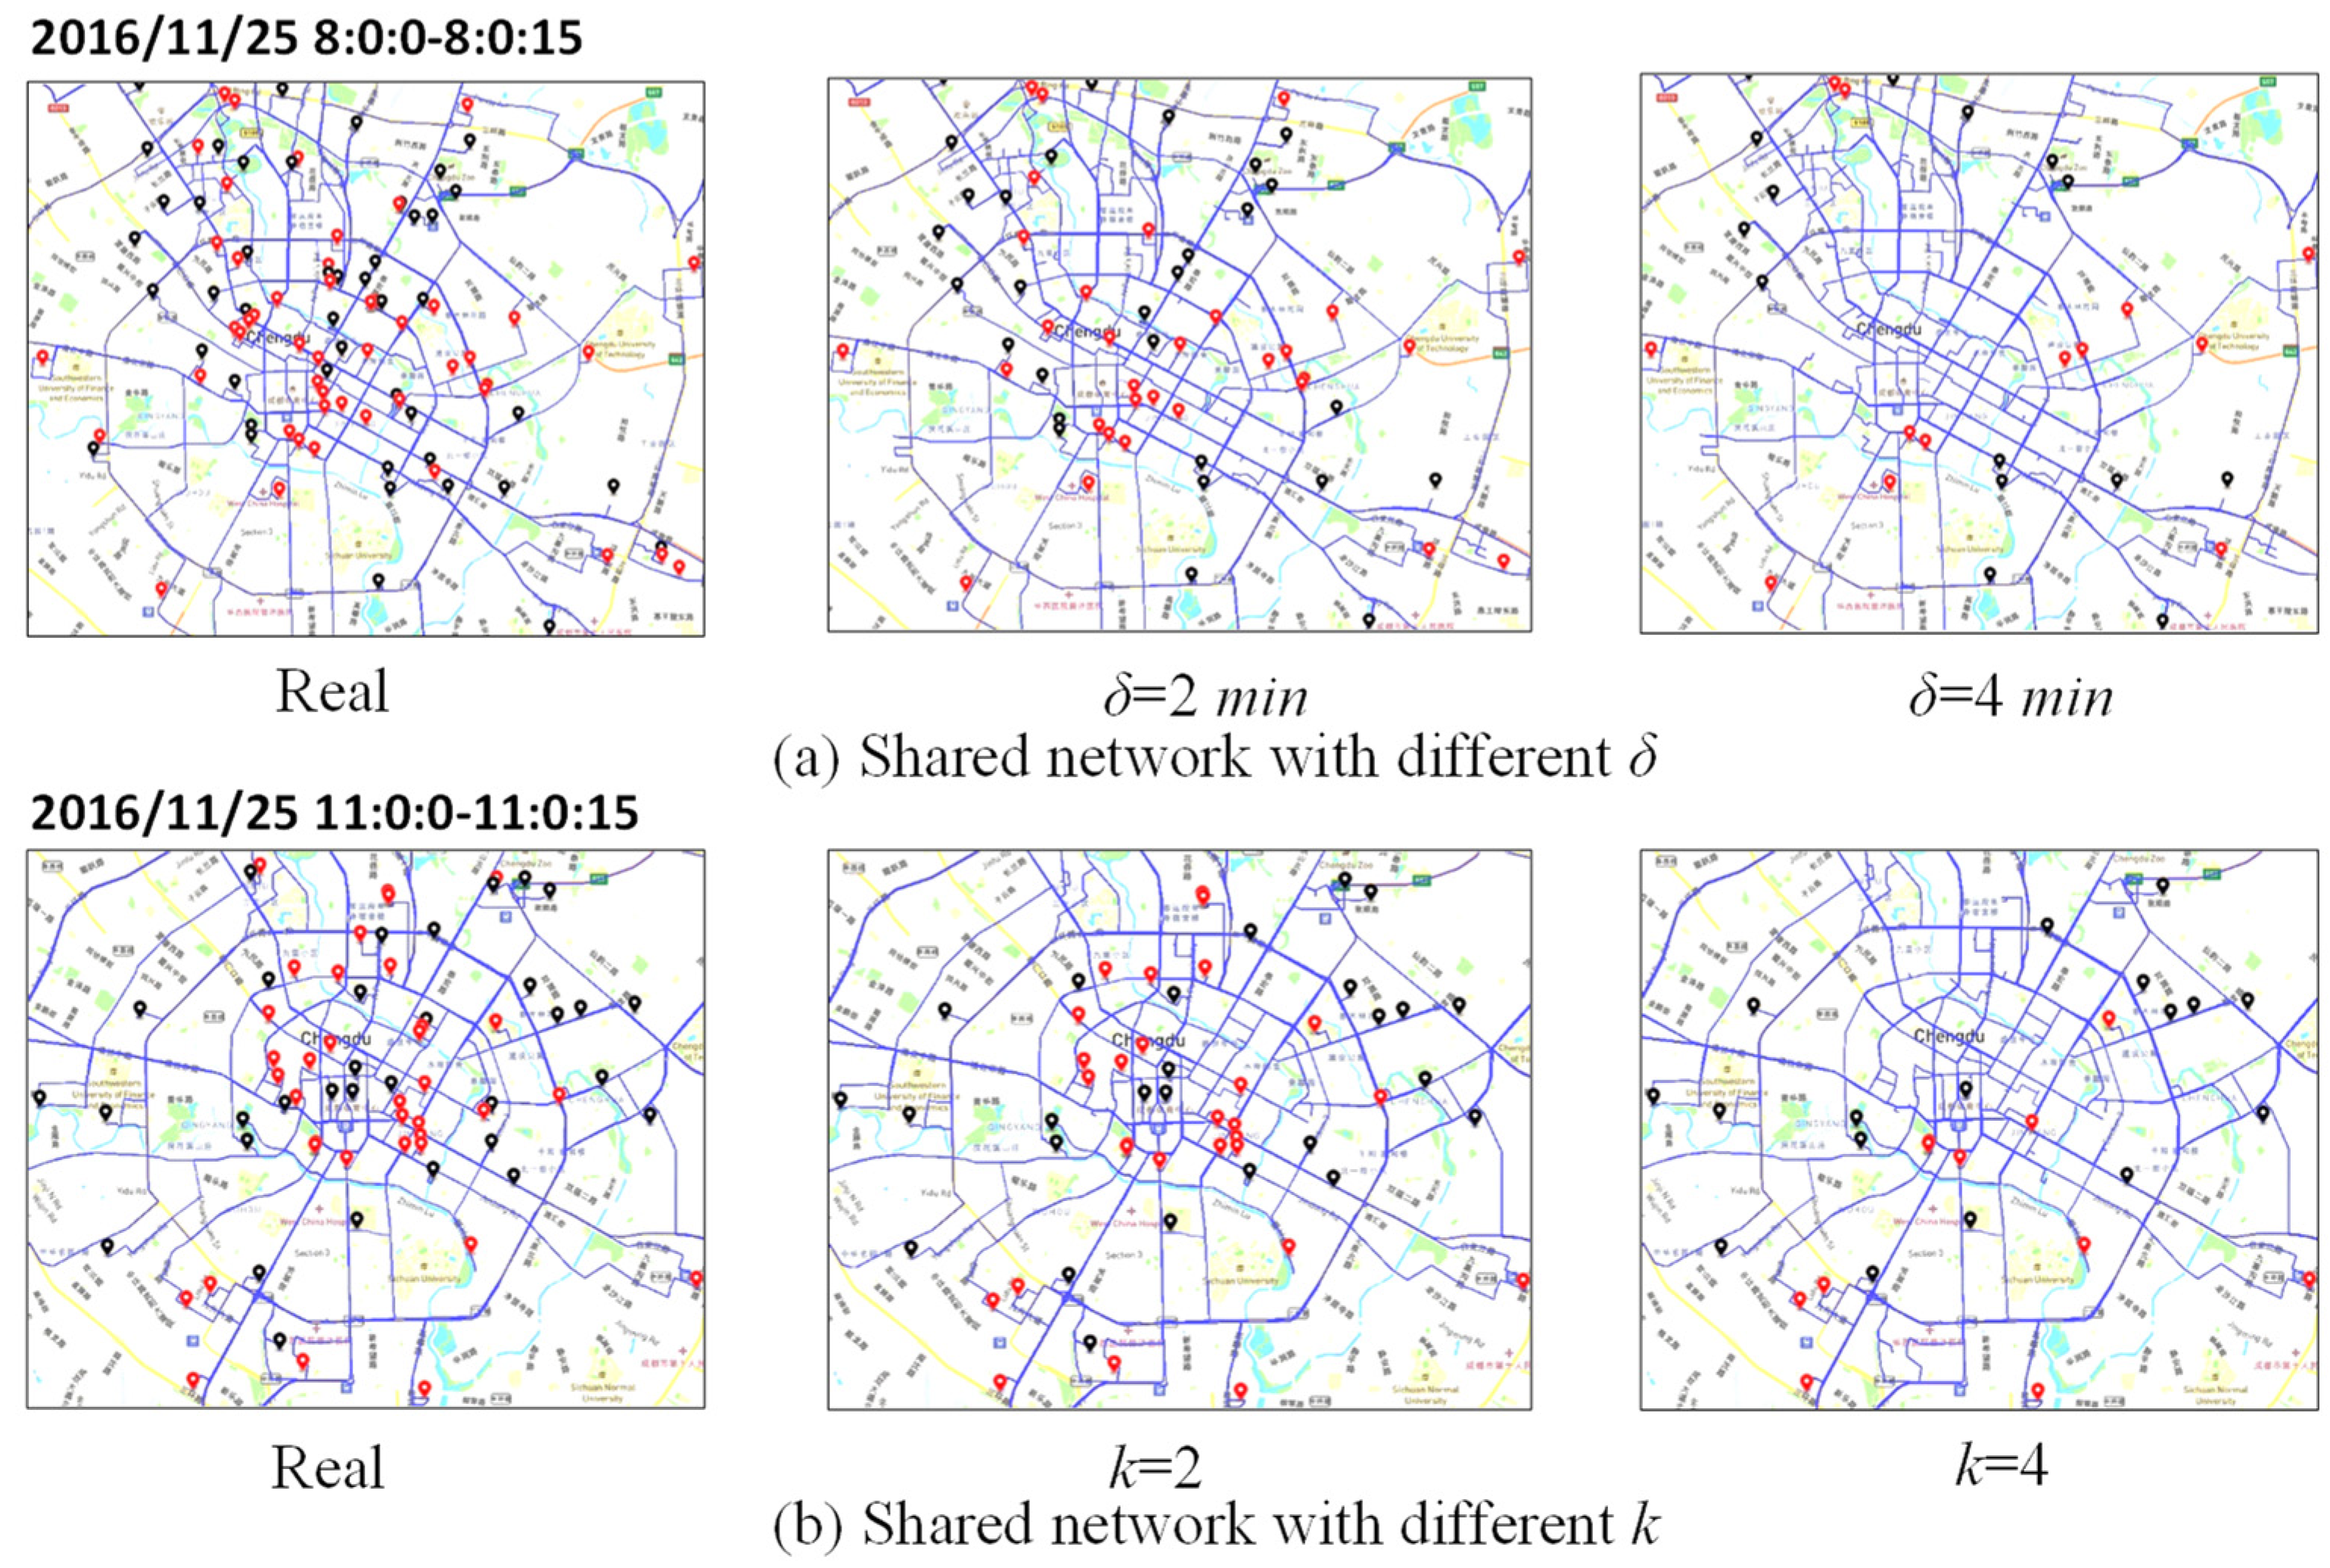
5.2. The Splicing Efficiency of Taxi Pickup Path with Different Parameters

To clearly demonstrate the impact of sharing trips for taxis, we conducted experiments using path extensions of trips sharing a network within 15 s. First, we verified the trips distribution variation for different maximum waiting delays δ, as shown in Figure 9a. The orders of Real within the time period 8:0:0–8:0:15 show that the destination and the origin of some orders were relatively close to each other. If the travel time cost between orders satisfied the δ constraint, the two orders could be spliced. The experiments were based on δ = 2 min and δ = 4 min, respectively, for the path splicing, and the connection start and end points of the spliced trips became intermediate points. Thus, the splicing path was used as a complete trajectory, and the fleet scale of taxis of the shared network was effectively reduced. It can be seen that more orders were spliced at δ = 4 min, and the taxi order volume was reduced to a smaller-scale continuous path at 15 s.
In addition to the limit on the maximum waiting delay, we further added a limit on the number of trips based on δ = 2 min, as shown in Figure 9b. The orders of Real within the time period 11:0:0–11:0:15 were mainly focused on suburban to downtown trips. The path splicing was performed on the basis of Real, and it can be seen that only a small reduction was performed for k = 2. For k = 4, a large number of orders were merged, resulting in a smaller fleet scale of taxis required for passenger travel, but increasing the additional cost of order splicing, such as the waiting time for splicing trips. Compared to the taxi order trajectories in Real, the trip distribution of the sharing network not only increased the order volume of the valid taxi, but also could have broken the distribution of the original orders and reallocated them in a uniform manner. The experiments illustrated that the order assignment strategy of the sharing network can reduce the taxi occupancy while satisfying the equal travel demands, which is achieved by recommending taxi orders on the spliced path for a given taxi.

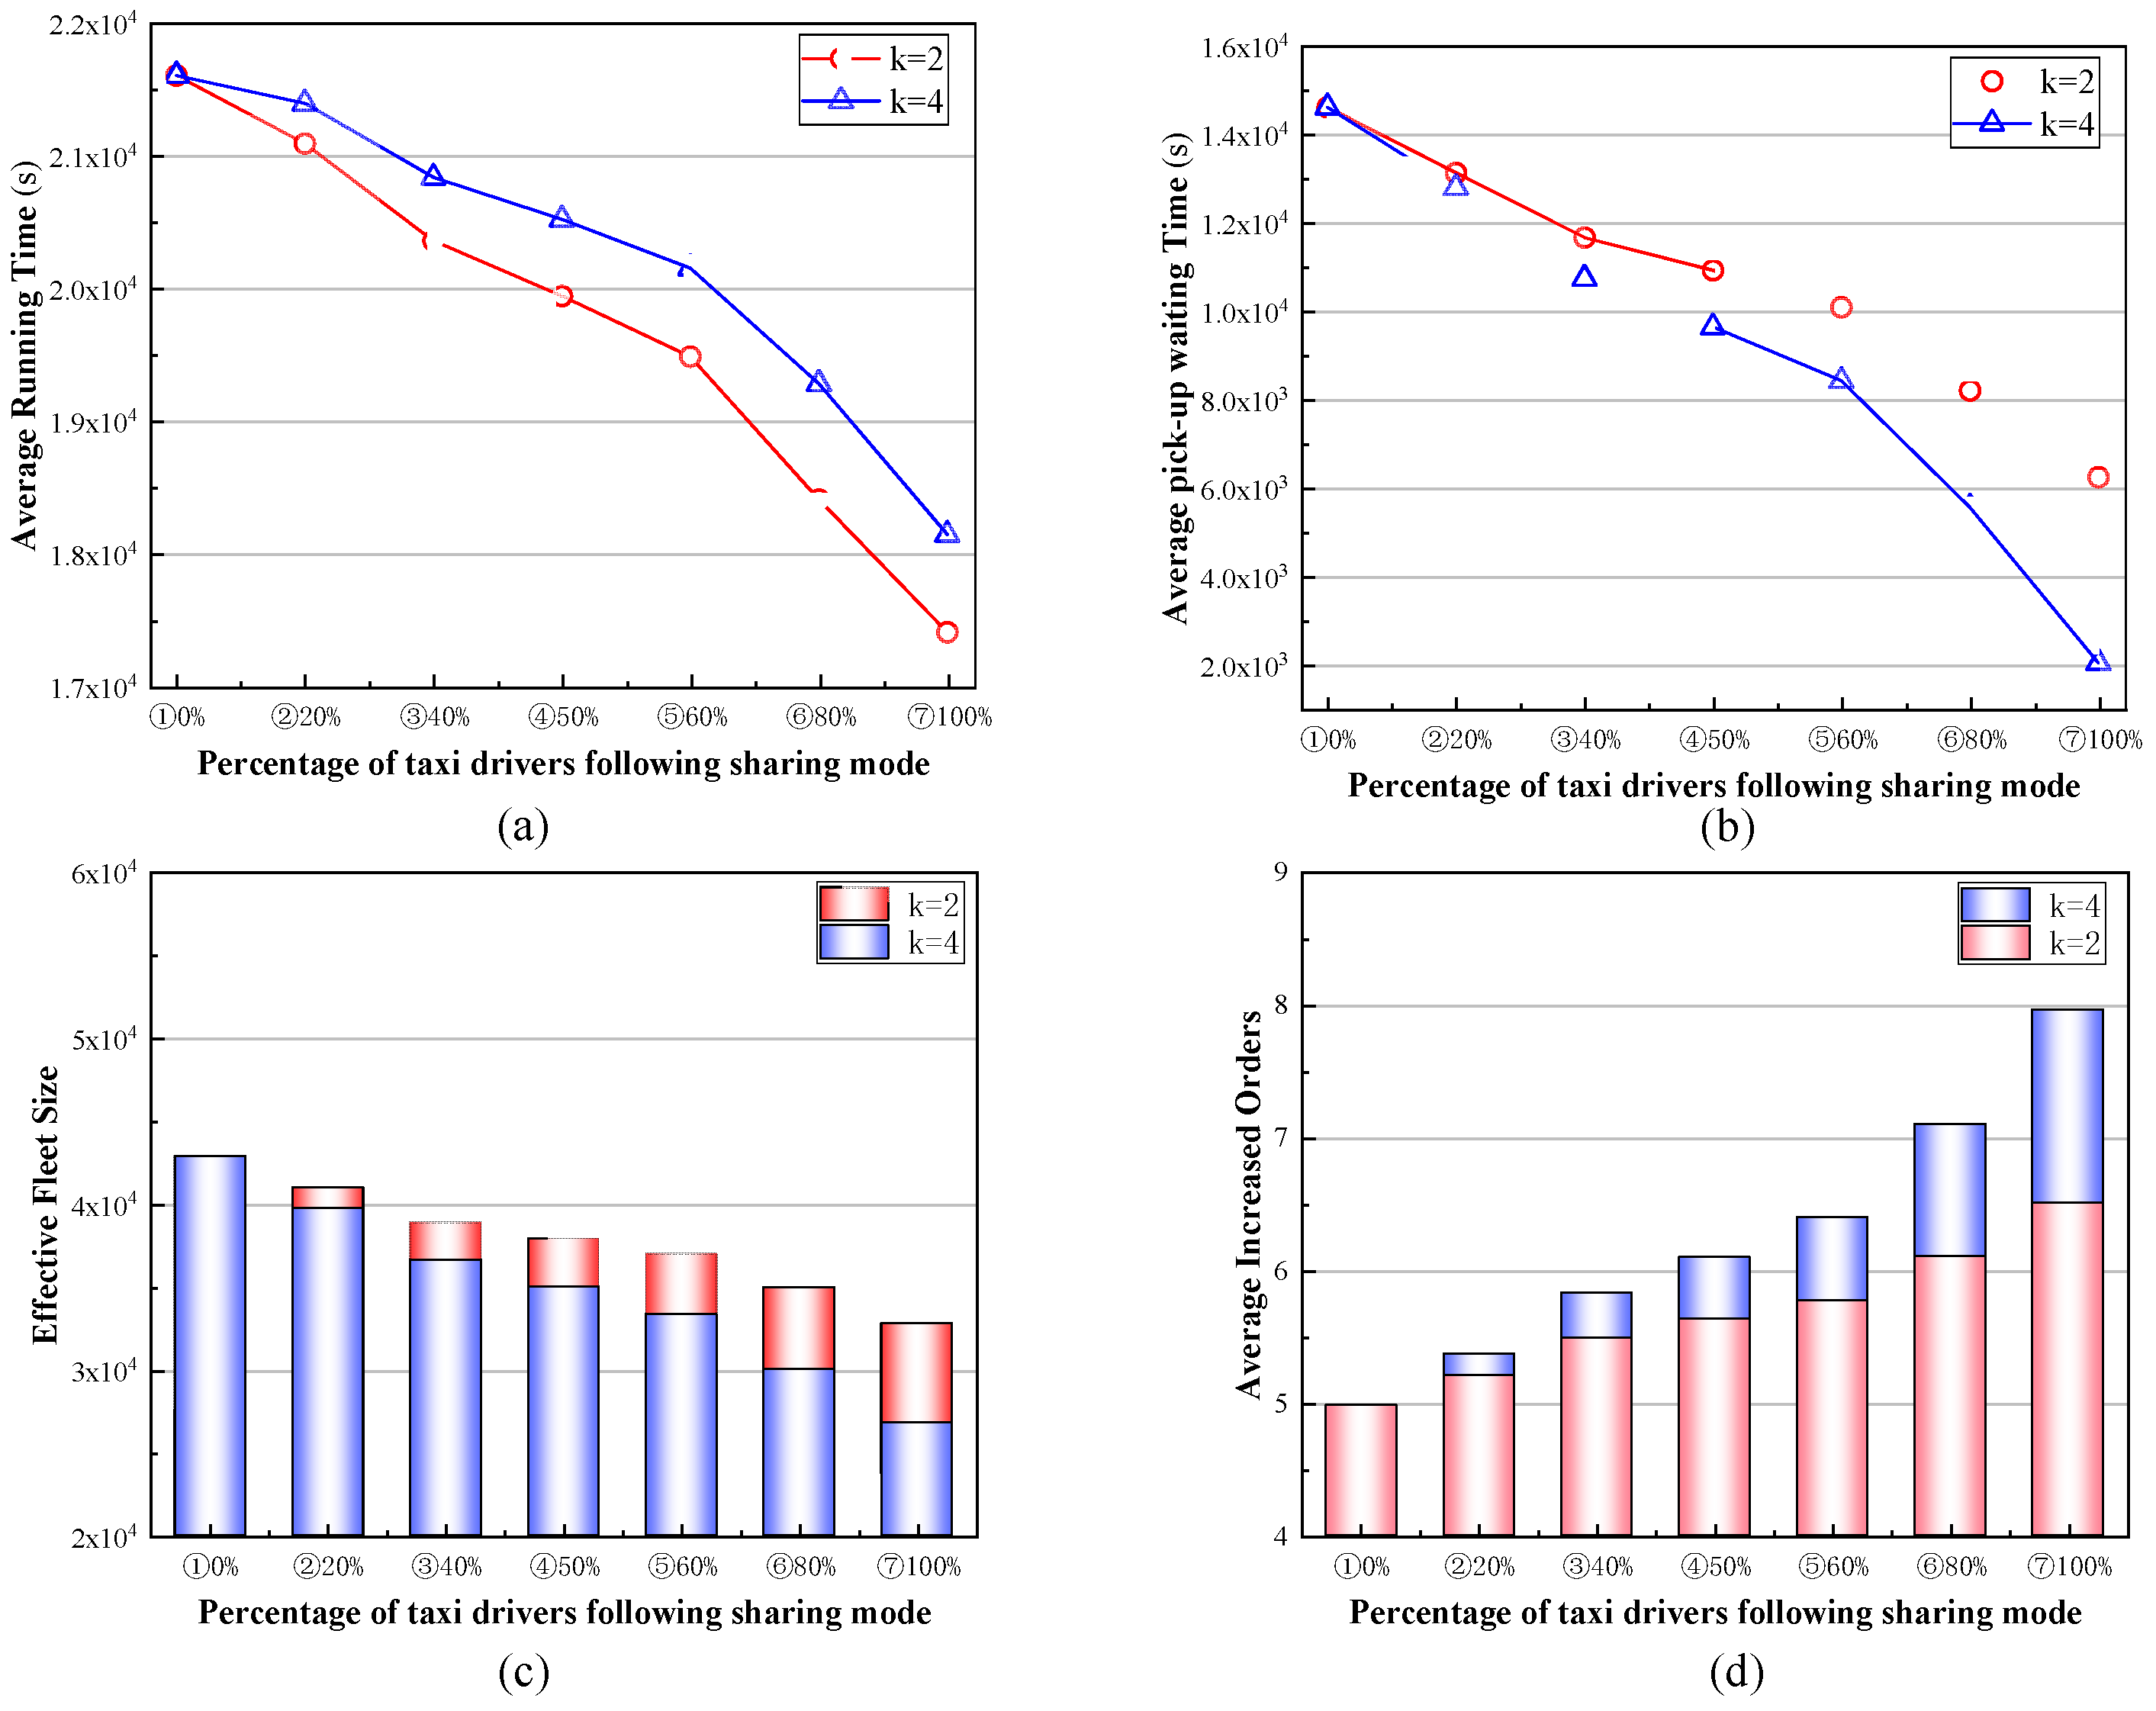
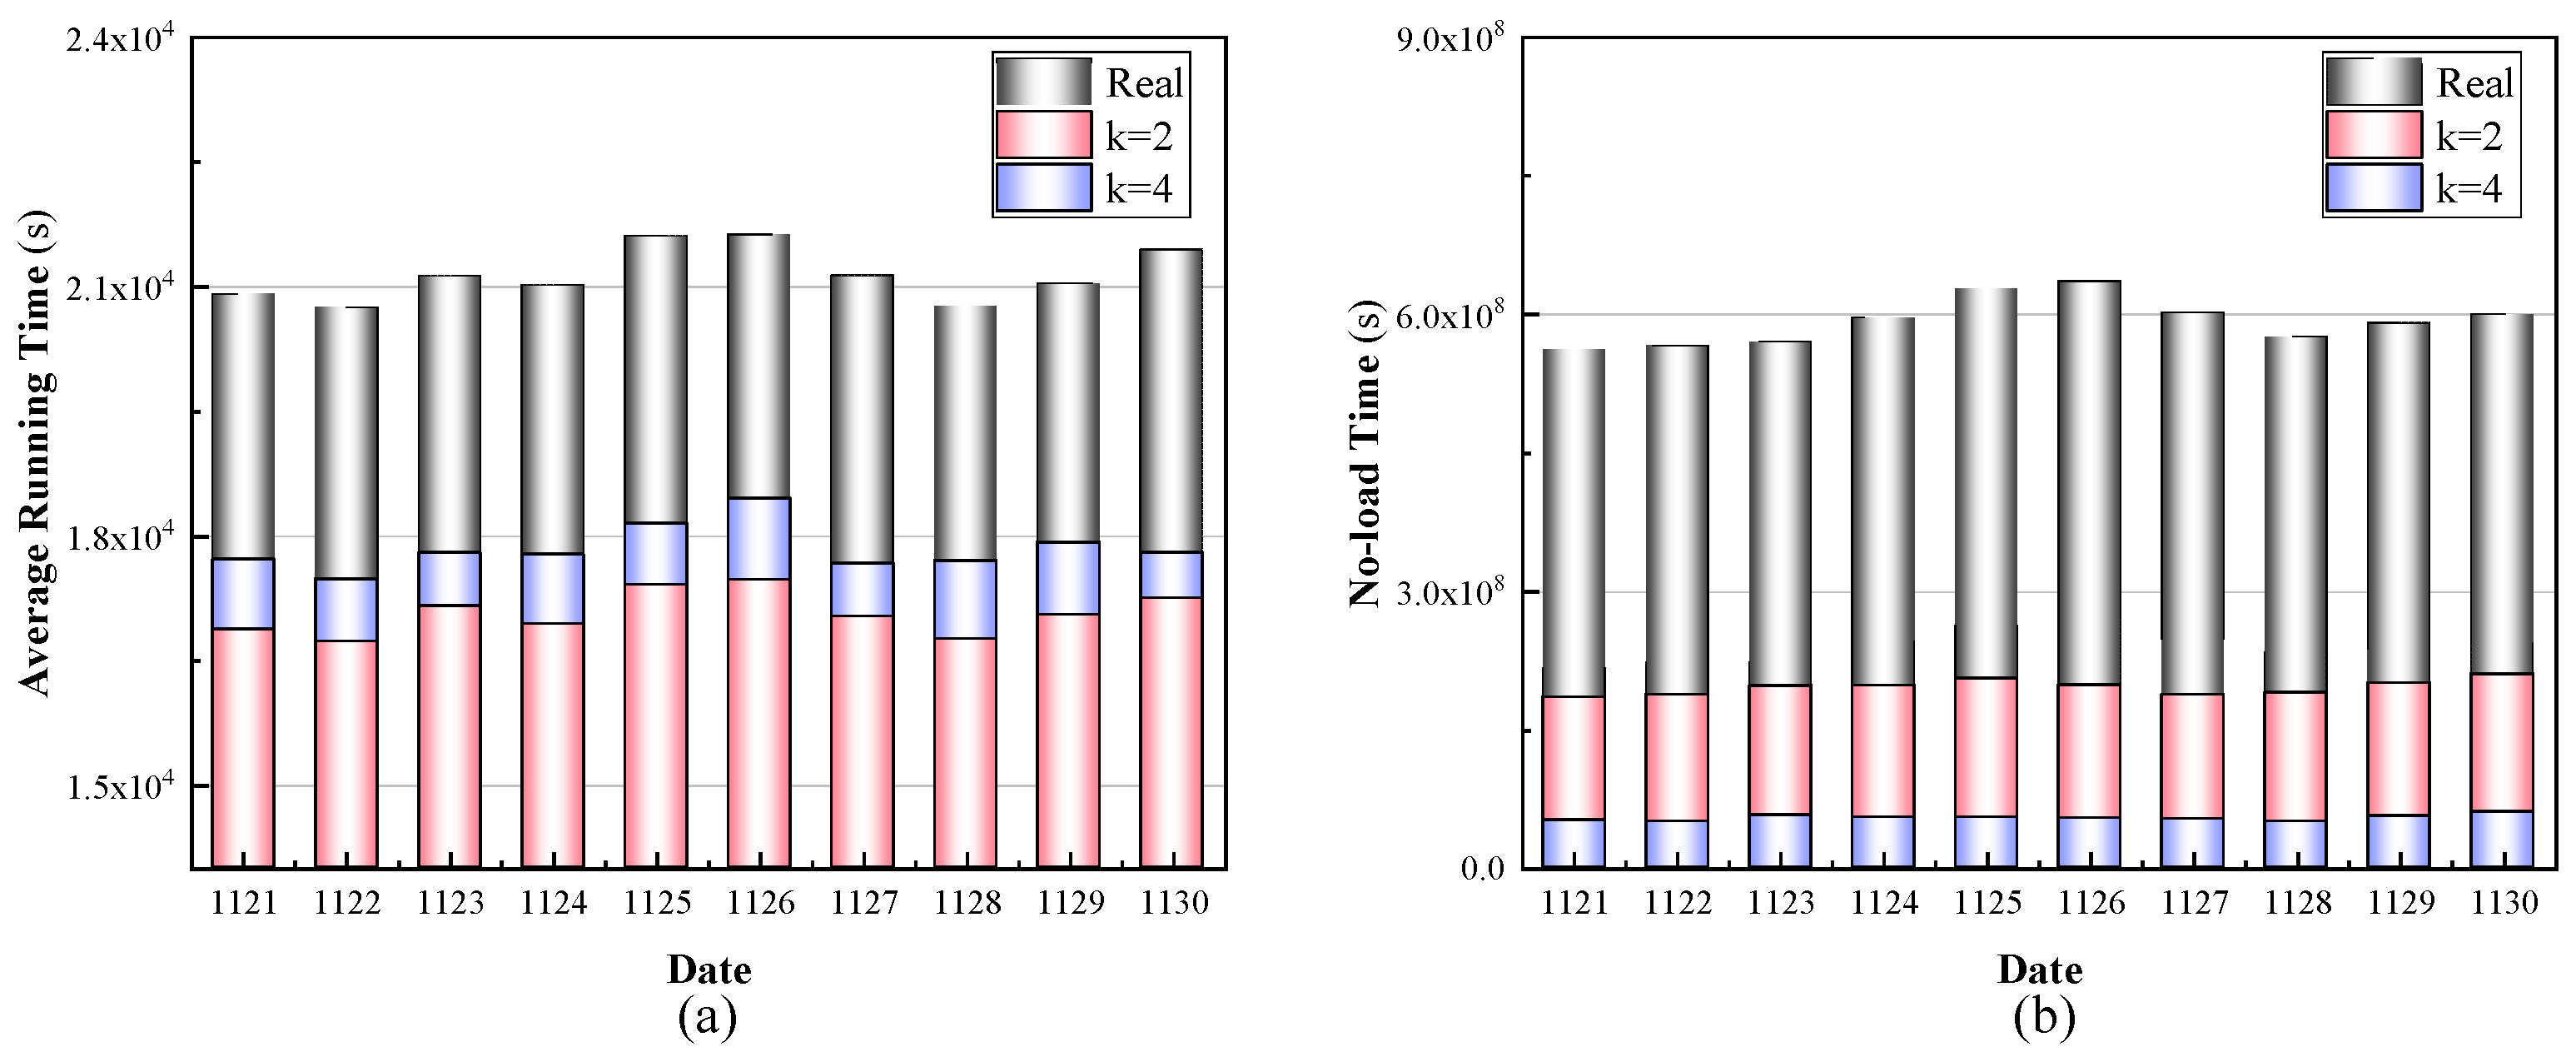
5.3. Optimization for Taxi System with Continuous Pickup Paths

To evaluate the influence of pickup path recommendation for the taxi service system, the experiments evaluated the average taxi running time, taxi no-load time, average pickup waiting time, effective fleet size, and the average increased orders under different parameter configurations. The running time is the time span from the to of the first passenger order to the td of the last order on a natural day. The no-load time is the accumulation of the non-passenger carrying period during the operating hours. We counted the daily average running time and no-load time from 21–30 November 2016, as shown in Figure 10. The experiments adopted the maximum connection limit k = 2, 4, and the waiting delay δ was set to 2 min. From Figure 10a, the path splicing reduced the daily average running time, which was attributed to order sharing improving vehicle operating efficiency with fixed travel demand. With k = 4, the total number of vehicles was 18.54% less than that with k = 2, thus requiring more orders to be filled per vehicle. As a result, the average running time for k = 4 increased compared to k = 2. In Figure 10b, the taxi no-load time decreased as k increased, indicating that continuous pickup path recommendations reduced the no-load time of individual vehicles in general. The experiments showed that order-sharing networks reduced inefficient time consumption in taxi systems, allowing travel orders to be reallocated on-demand and increasing the efficiency of vehicle operation.
In the following, we compare the influences of different recommendation steps on the average pickup waiting time, the effective fleet size, and the average increased orders. Table 2 shows the variation of the daily average pickup waiting time for all vehicle orders over a 10-day period. The metric was averaged based on the total number of effective taxis running each day. According to the difference between the k = 2, 4, 8, 16 and the Real, it can be concluded that the splicing path reduced the average pickup time of taxis. Since the fleet size of taxis decreased at k = 4 and the travel path linked more orders, the average pickup waiting time decreased. At k = 8,16, although the fleet size was further reduced, the waiting time was increased to connect more orders. Therefore, the range of k was not as large as possible and could bring inefficiency when exceeding the threshold. The order trajectory at k = 2 preferred to add additional orders to the existing order distribution, which was different from the reassignment. At k = 4, the subsequent orders were augmented around the first order, and the orders that originally belonged to it were reassigned. As can be seen in Table 3, the effective fleet size decreased as k increased, but the decreasing trend gradually decayed. The average effective fleet size from Real to k = 2 decreased by 9606, while from k = 8 to k = 16 it decreased by just 5068.
Table 4 shows the average increased orders after adopting the continuous recommended pickup paths. By the same token, the statistics here are only for valid taxis, some vacant vehicles will not be assigned orders that day. For valid vehicles, the order increased significantly with the number of links k. However, the increase in k did not consistently improve the efficiency of the taxi service system. More time cost was added to splicing k orders, and a large number of taxis were unused. Therefore, a suitable value of k is required. For this experiment, the order-sharing network constructed by k = 4 was more suitable for the taxi path optimization.

5.4. The Implementation Phase

Considering that, in the actual scenario, there are multiple taxi operators, and it is difficult to unify drivers’ recognition for sharing orders under the carbon neutral target, we tend to develop an order-sharing mode on existing taxi-hailing platforms. The driver has the flexibility to choose whether to turn on the mode or not, and the mode can be dynamically adjusted according to the period. First of all, the order-sharing mode has no impact on passengers’ travel demands and existing travel options. The CTPURec is only trained on the historical trajectories of taxis in sharing mode and generates continuous pickup paths for drivers under this customized service. In contrast, the free mode means that the drivers do not participate in the sharing program and use the original method to obtain orders.
Next, we analyzed the taxi system performance of CTPURec in partial sharing mode. The drivers were first divided into five groups with different proportions based on free mode and sharing mode, as shown in the abscissa axis of Figure 11. We built the order-sharing network based on scenarios ①–⑦, respectively, so as to guide the taxi path in the partial sharing mode. The experiments adopted the trip data of 25 November 2016, with the maximum waiting delay δ set to 4 min and the maximum number of splices k = 2, 4. The variation trends of different scenarios of the system performance index are shown in Figure 11. It can be seen that for the taxi average running time and average pickup waiting time, there was a decreasing trend as the proportion of drivers participating in the sharing program grew. For Figure 11a, the running time of taxis in k = 2 was lower for the same travel demands. This is due to the fact that the fleet size of k = 2 was higher than k = 4 after splicing the paths according to the configuration, as shown in Figure 11c. For Figure 11b, the k = 4 used more continuous pickup paths, reducing the waiting time to search for the next order. Therefore, the average cost of acquiring the next order for scenarios ②–⑦ was better than the fully free mode. For effective fleet size, it continued shrinking as the proportion of the sharing mode increased. The fleet size was minimized for k = 4 in fully sharing mode. At this point, the taxi fleet improved its own order-taking efficiency while reducing the cost of no-loading in free mode, as the total amount of travel demand was fixed. Finally, we compared the order gains at different proportions, as shown in Figure 11d. This order gain was complementary to the reduction in effective fleet size. As the sharing proportion increased, the order gain gradually improved until the fully sharing mode was reached.
Therefore, the partial order-sharing mode can also contribute to the operational efficiency of the taxi system when full sharing cannot be achieved. This implementation process also promotes a transformation for the driver’s low-carbon perception from the free mode to sharing mode. At the same time, the impact of the sharing mode on taxi drivers’ habits is minimal, without requiring them to understand the implementation of the sharing mode but simply referring them to the recommended path.

6. Conclusions and Future Work

In this paper, we proposed a macro taxi path recommendation model to guide the taxis’ travel behaviors by adopting the concept of low-carbon operation, which is an important contribution for transportation system emission reduction under the goal of “carbon neutrality.” The coarse-grained extraction of order data was used to mine the flow pattern of taxis in the transportation network for the perception of future travel demands. A shared trajectory network was constructed based on potential travel trips, guiding taxis to pick up passengers with a shared collaborative path decision. The combination of path recommendation and a sharing network not only selects the appropriate continuous path for taxis, but also promotes the balanced utilization of travel services.
In the experiment, we compared the predictive validity of the model, the path recommendation effects, and the impact on the taxi operation system. Combined with the carbon effect in the operation of the transportation system, we applied some system-level metrics that are positively correlated with carbon emissions to measure the usability of the recommended model. The results showed that continuous pickup paths can increase taxi orders while reducing the scale of vehicle operation, and this optimization has important guidance for upgrading low-carbon management in the transportation field.
Considering the application of our low-carbon sharing mode to existing ride-hailing technologies, we developed a preliminary implementation plan and conducted a quantitative sensitivity analysis. However, the evaluation metrics we used for taxi system operation are not equivalent to the carbon effect evaluation. In future work, we will use the specific carbon metrics to construct the path recommendation model to suggest the cruising path for taxis and the path choices for users. By further establishing a carbon effect incentive mechanism, the order-sharing network is deeply integrated with existing travel services to promote the transformation of taxi behaviors from free mode to sharing mode.

Author Contributions

Writing—original draft, Mengmeng Chang; validation, Yuanying Chi; resources, Zhiming Ding; data curation, Yuanying Chi; formal analysis, Jing Tian and Yuhao Zheng; writing—review and editing, Yuhao Zheng. All authors have read and agreed to the published version of the manuscript.

Funding

This research was funded by Limin Guo.

Institutional Review Board Statement

Not applicable.

Informed Consent Statement

Not applicable.

Data Availability Statement

The data presented in this study are available from www.openstreetmap.org and gaia.didichuxing.com both accessed on 7 April 2021.

Acknowledgments

This work is supported by the Beijing Natural Science Foundation (No. 4192004, 4212016), the National Natural Science of Foundation of China (No. 62072016), the Project of Beijing Municipal Education Commission (No.KM201810005023, KM201810005024).

Conflicts of Interest

No potential conflict of interest was reported by the authors.

References

  1. Guo, Y.; Anwar, T.; Yang, J.; Wu, J. dFDA-VeD: A Dynamic Future Demand Aware Vehicle Dispatching System. In 17th EAI International Conference on Mobile and Ubiquitous Systems: Computing, Networking and Services; Association for Computing Machinery, Inc.: New York, NY, USA, 2020; pp. 366–375. [Google Scholar]
  2. Tang, J.; Jiang, H.; Li, Z.; Li, M.; Liu, F.; Wang, Y. A two-layer model for taxi customer searching behaviors using GPS trajectory data. IEEE Trans. Intell. Transp. Syst. 2016, 17, 3318–3324. [Google Scholar] [CrossRef]
  3. Lai, Y.; Lv, Z.; Li, K.; Liao, M. Urban traffic coulomb’s law: A new approach for taxi route recommendation. IEEE Trans. Intell. Transp. Syst. 2019, 20, 3024–3037. [Google Scholar] [CrossRef]
  4. Yang, Y.; Wang, X.; Xu, Y.; Huang, Q. Multiagent Reinforcement Learning-Based Taxi Predispatching Model to Balance Taxi Supply and Demand. J. Adv. Transp. 2020, 2020, 8674512. [Google Scholar] [CrossRef] [Green Version]
  5. Santi, P.; Tatti, C. A future of shared mobility. Urban Regen 2017, 10, 328–333. [Google Scholar]
  6. Zhang, R.; Pavone, M. Control of robotic mobility-on-demand systems: A queueing-theoretical perspective. Int. J. Robot. Res. 2016, 35, 186–203. [Google Scholar] [CrossRef]
  7. Li, L.; Wang, S.; Wang, F.Y. An Analysis of Taxi Driver’s Route Choice Behavior Using the Trace Records. IEEE Trans. Comput. Soc. Syst. 2018, 5, 576–582. [Google Scholar] [CrossRef]
  8. Moreira-Matias, L.; Gama, J.; Ferreira, M.; Mendes-Moreira, J.; Damas, L. On Predicting the Taxi-Passenger Demand: A Real-Time Approach. In Portuguese Conference on Artificial Intelligence; Springer: Berlin/Heidelberg, Germany, 2013; Volume 8154, pp. 54–65. [Google Scholar]
  9. Wang, Y.; Yin, H.; Chen, H.; Wo, T.; Xu, J.; Zheng, K. Origin-destination matrix prediction via graph convolution: A new perspective of passenger demand modeling. In Proceedings of the 25th ACM SIGKDD International Conference on Knowledge Discovery and Data Mining, Anchorage, AK, USA, 4–8 August 2019; pp. 1227–1235. [Google Scholar]
  10. Liu, L.; Qiu, Z.; Li, G.; Wang, Q.; Ouyang, W.; Lin, L. Contextualized Spatial-Temporal Network for Taxi Origin-Destination Demand Prediction. IEEE Trans. Intell. Transp. Syst. 2019, 20, 3875–3887. [Google Scholar] [CrossRef] [Green Version]
  11. Zhang, J.; Yu, Z.; Qi, D. Deep Spatio-Temporal Residual Networks for Citywide Crowd Flows Prediction. arXiv 2017, arXiv:1610.00081v2. [Google Scholar]
  12. Tang, J.; Liang, J.; Liu, F.; Hao, J.; Wang, Y. Multi-community passenger demand prediction at region level based on spatio-temporal graph convolutional network. Transp. Res. Part C Emerg. Technol. 2021, 124, 102951. [Google Scholar] [CrossRef]
  13. Alberto, R.; Gianni, R.; Monica, B.; Bruno, L. Modelling Taxi Drivers’ Behaviour for the Next Destination Prediction. IEEE Trans. Intell. Transp. Syst. 2019, 21, 2980–2989. [Google Scholar]
  14. Niu, K.; Cheng, C.; Chang, J.; Zhang, H.; Zhou, T. Real-Time Taxi-Passenger Prediction with L-CNN. IEEE Trans. Veh. Technol. 2019, 68, 4122–4129. [Google Scholar] [CrossRef]
  15. Yuan, J.; Zheng, Y.; Zhang, L.; Xie, X.; Sun, G. Where to find my next passenger? In Proceedings of the 13th International Conference on Ubiquitous Computing, Beijing, China, 17–21 September 2011; ACM: New York, NY, USA, 2011; pp. 109–118. [Google Scholar]
  16. Li, X.; Pan, G.; Wu, Z.; Qi, G.; Li, S.; Zhang, D.; Zhang, W.; Wang, Z. Prediction of urban human mobility using large-scale taxi traces and its applications. Front. Comput. Sci. 2012, 6, 111–121. [Google Scholar]
  17. Wallar, A.; Alonso-Mora, J.; Rus, D. Optimizing Vehicle Distributions and Fleet Sizes for Shared Mobility-on-Demand. In Proceedings of the 2009 International Conference on Robotics and Automation, Montreal, QC, Canada, 20–24 May 2019; pp. 1794–1800. [Google Scholar]
  18. Spieser, K.; Samaranayake, S.; Gruel, W.; Frazzoli, E. Shared-vehicle mobility-on-demand systems: A fleet operators guide to rebalancing empty vehicles. In Proceedings of the Transportation Research Board 95th Annual Meeting, Washington, DC, USA, 10–14 January 2016; pp. 1–15. [Google Scholar]
  19. Alonso-Mora, J.; Wallar, A.; Rus, D. Predictive routing for autonomous mobility-on-demand systems with ride-sharing. In Proceedings of the 2017 IEEE/RSJ International Conference on Intelligent Robots and Systems (IROS), Vancouver, BC, Canada, 24–28 September 2017; pp. 3583–3590. [Google Scholar]
  20. Alonso-Mora, J.; Samaranayake, S.; Wallar, A.; Frazzoli, E.; Rus, D. On-demand high-capacity ride-sharing via dynamic trip-vehicle assignment. Proc. Natl. Acad. Sci. USA 2017, 114, 462–467. [Google Scholar] [CrossRef] [PubMed] [Green Version]
  21. Qu, B.; Yang, W.; Cui, G.; Wang, X. Profitable Taxi Travel Route Recommendation Based on Big Taxi Trajectory Data. IEEE Trans. Intell. Transp. Syst. 2020, 21, 653–668. [Google Scholar] [CrossRef]
  22. Hsieh, H.P.; Lin, F. Recommending taxi routes with an advance reservation—A multi-criteria route planner. Int. J. Urban Sci. 2021, 3, 1–22. [Google Scholar] [CrossRef]
  23. Tang, J.; Wang, Y.; Hao, W.; Liu, F.; Huang, H.; Wang, Y. A Mixed Path Size Logit-Based Taxi Customer-Search Model Considering Spatio-Temporal Factors in Route Choice. IEEE Trans. Intell. Transp. Syst. 2020, 21, 1347–1358. [Google Scholar] [CrossRef]
  24. Ji, S.; Wang, Z.; Li, T.; Zheng, Y. Spatio-temporal feature fusion for dynamic taxi route recommendation via deep reinforcement learning. Knowl.-Based Syst. 2020, 205, 106302. [Google Scholar] [CrossRef]
  25. Santi, P.; Resta, G.; Szell, M.; Sobolevsky, S.; Storgatz, S.; Ratti, C. Quantifying the benefits of vehicle pooling with shareability networks. Proc. Natl. Acad. Sci. USA 2014, 111, 13290–13294. [Google Scholar] [CrossRef] [PubMed] [Green Version]
  26. Vazifeh, M.; Santi, P.; Resta, G.; Strogatz, S.; Ratti, C. Addressing the minimum fleet problem in on-demand urban mobility. Nature 2018, 557, 534. [Google Scholar] [CrossRef]
  27. Jiang, W.; Luo, J. Graph Neural Network for Traffic Forecasting: A Survey. arXiv 2021, arXiv:2101.11174. [Google Scholar]
  28. Wu, Z.; Pan, S.; Long, G.; Jiang, J.; Zhang, C. Graph WaveNet for Deep Spatial-Temporal Graph Modeling. arXiv 2019, arXiv:1906.00121. [Google Scholar]
  29. Xu, K.; Li, C.; Tian, Y.; Sonobe, T.; Kawarabayashi, K.; Jegelka, S. Representation learning on graphs with jumping knowledge networks. Proceeding ICML 2018, 80, 5449–5458. [Google Scholar]
  30. Defferrard, M.; Bresson, X.; Vandergheynst, P. Convolutional Neural Networks on Graphs with Fast Localized Spectral Filtering. In Proceedings of the 30th Conference on Neural Information Processing Systems (NIPS 2016), Barcelona, Spain, 5–10 December 2016; pp. 3837–3845. [Google Scholar]
  31. Zaremba, W.; Sutskever, I.; Vinyals, O. Recurrent Neural Network Regularization. arXiv 2014, arXiv:1409.2329. [Google Scholar]
  32. Fu, R.; Zhang, Z.; Li, L. Using lstm and gru neural network methods for traffic flow prediction. In Proceedings of the 2016 31st Youth Academic Annual Conference of Chinese Association of Automation (YAC), Wuhan, China, 11–13 November 2016; pp. 324–328. [Google Scholar]
  33. Thomas, N.; Welling, M. Semi-supervised classification with graph convolutional networks. arXiv 2016, arXiv:1609.02907. [Google Scholar]
  34. Zhao, L.; Song, Y.; Zhang, C.; Liu, Y.; Wang, P.; Lin, T.; Deng, M.; Li, H. T-GCN: A Temporal Graph Convolutional Network for Traffic Prediction. IEEE Trans. Intell. Transp. Syst. 2020, 21, 3848–3858. [Google Scholar] [CrossRef] [Green Version]
  35. Chen, J.; Xu, X.; Wu, Y.; Zheng, H. GC-LSTM: Graph Convolution Embedded LSTM for Dynamic Link Prediction. arXiv 2018, arXiv:1812.04206. [Google Scholar] [CrossRef]
Figure 1. The macro path recommendation scenario. It reduces total operating costs through trip sharing.
Ijgi 10 00821 g001
Figure 2. The construction of the trajectory sharing network. The network is spliced using the parameter δ and satisfies the temporal constraint. According to the trip origin and destination (a), if t m + 1 d t m o δ between the drop-off point of the first trip and the pickup point of the next trip, splicing is performed. The maximum matching algorithm generates a set of paths covering the entire graph (b), ensuring that all trips are served while minimizing the number of paths (c).
Ijgi 10 00821 g002
Figure 3. The overall architecture for continuous taxi pickup path planning guided by trajectory sharing.
Ijgi 10 00821 g003
Figure 4. Different constraints generate different pickup paths.
Ijgi 10 00821 g004
Figure 5. Data-driven path recommendation process.
Ijgi 10 00821 g005
Figure 6. The sharing graph is a coarse-grained representation of taxi travel network with the order trajectory corresponding to a node in the upper-level network.
Ijgi 10 00821 g006
Figure 7. The metrics variations in the first 100 epochs based on validation data. The (a,b) show the variation of MAE and RMSE, and (c) is the the change of Accuracy.
Ijgi 10 00821 g007
Figure 8. Comparison of the next 16 h prediction effect of different models on the order quantity. (a) is the real order quantity. (bf) are the predicted values of the CTPURec, GC-LSTM, LSTM, TGCN and GRU, respectively.
Ijgi 10 00821 g008
Figure 9. Example of a trip sharing network for 15s; the blue line is the path, the black marker indicates the origin, and the red is the destination of the trips. (a) shows the shared network based on different δ and (b) based on different k.
Ijgi 10 00821 g009
Figure 10. Comparison of average running time and no-load time under different travel paths. (a) shows the average running time and (b) shows the no-load time.
Ijgi 10 00821 g010
Figure 11. Impact of the different driver’s percentage participating in sharing mode. (a) is the average running time, and (b) is the average pick-up waiting time. (c,d) are the effective fleet size and average increased orders based on different percentage of taxi driver’s following sharing mode.
Ijgi 10 00821 g011
Table 1. Prediction errors at different time lengths. The best performing method in each row is boldfaced, and the second-best method in each row is underlined.
Time Length1 h2 h3 h
MetricMAERMSEAccuracyMAERMSEAccuracyMAERMSEAccuracy
GCN43.7385.610.49245.3587.300.48146.5188.510.473
T-GCN29.7648.690.71129.7750.490.70032.3153.070.684
GRU14.7827.810.83519.1032.990.80427.0850.220.701
LSTM14.7426.350.84420.6732.020.81022.5845.720.728
GC-LSTM14.4627.270.83518.7033.730.80022.8340.960.756
CTPURec12.6825.020.85113.9727.810.83515.2830.490.819
%Improve12.31%5.05%0.83%25.29%13.15%3.09%32.33%25.56%8.33%
Table 2. The average pickup waiting time (/s) in CTPURec with different k.
Date1121112211231124112511261127112811291130
Real14,59214,39914,69114,58114,61714,68514,55514,34514,48014,883
k = 26297625766316383623660145944615963876710
k = 42143204923282175203020102038199321712353
k = 82173222221022200205818591523248926192208
k = 167122716873017179725763605594799381977871
Table 3. The effective fleet size in CTPURec with different k.
Date1121112211231124112511261127112811291130
Real38,50039,27938,78540,88542,88943,25741,31740,09640,77140,297
k = 229,25829,88329,63230,84232,81932,89731,48730,73531,26731,193
k = 423,71524,28124,23025,01526,83026,65125,69725,04225,56825,504
k = 817,92818,34918,47018,86620,17820,16819,37818,75219,32619,315
k = 1613,23113,57513,60213,84214,77314,73014,11413,73914,27414,168
Table 4. The average increased orders in CTPURec with different k.
Date1121112211231124112511261127112811291130
Real4.98 4.96 5.10 4.85 4.98 4.91 4.90 4.99 5.10 5.17
k = 26.55 6.526.68 6.44 6.51 6.466.43 6.52 6.656.68
k = 48.08 8.02 8.17 7.94 7.96 7.97 7.89 8.00 8.138.17
k = 810.6910.6210.7210.5310.5910.5410.4610.6810.7610.79
k = 1614.4914.3614.5614.3514.4614.4314.3614.5814.5714.72
Publisher’s Note: MDPI stays neutral with regard to jurisdictional claims in published maps and institutional affiliations.

