Article

The Societal Echo of Severe Weather Events: Ambient Geospatial Information (AGI) on a Storm Event

Physical Geography, University of Freiburg, Schreiberstraße 20, 79085 Freiburg, Germany
*
Author to whom correspondence should be addressed.
ISPRS Int. J. Geo-Inf. 2021, 10(12), 815; https://doi.org/10.3390/ijgi10120815
Submission received: 30 August 2021 / Revised: 12 November 2021 / Accepted: 27 November 2021 / Published: 2 December 2021
(This article belongs to the Special Issue Mapping, Modeling and Prediction with VGI)

Abstract

:
The given article focuses on the benefit of harvested Ambient Geographic Information (AGI) as complementary data sources for severe weather events and provides methodical approaches for the spatio-temporal analysis of such data. The perceptions and awareness of Twitter users posting about severe weather patterns were explored as there were aspects not documented by official damage reports or derived from official weather data. We analysed Tweets regarding the severe storm event Friederike to map their spatio-temporal patterns. More than 50% of the retrieved >23.000 tweets were geocoded by applying supervised information retrievals, text mining, and geospatial analysis methods. Complementary, central topics were clustered and linked to official weather data for cross-evaluation. The data confirmed (1) a scale-dependent relationship between the wind speed and the societal echo. In addition, the study proved that (2) reporting activity is moderated by population distribution. An in-depth analysis of the crowds’ central topic clusters in response to the storm Friederike (3) revealed a plausible sequence of dominant communication contents during the severe weather event. In particular, the merge of the studied AGI and other environmental datasets at different spatio-temporal scales shows how such user-generated content can be a useful complementary data source to study severe weather events and the ensuing societal echo.

1. Introduction

The digital age offers individuals a wide variety of application to share and publish self-created content on social media, which are often attributed to Web 2.0. The term “Web 2.0” refers primarily to a change in the way the Internet is used, whereby users are simultaneously consumers and producers of data [1]. Crowdsourced data from microblogging platforms reflect this trend. This user-generated content can lead to large amounts of unstructured data that can be analysed as big data and then used as relevant climatological information [2,3].
Information based on severe weather events from open data sources, such as the microblogging platform Twitter, provide valuable insights on societal perceptions and societal awareness and communications of such events. However, the extent to which perceived weather phenomena are shaped by climate change is discussed controversially [4,5,6]. Shared data during an extreme weather event not only provide a wide range of information in near real-time but also show how “Voluntweeters” [7] can organize themselves in a virtual environment. In order to retrieve and analyse Ambient Geospatial Information (AGI) systematically, crowdharvesting and text mining offer useful techniques. In turn, data-driven investigations on hazard patterns can be carried out on these types of information sources.

1.1. Ambient Geospatial Information (AGI) in Crisis Informatics

In the broadest sense, Ambient Geospatial Information (AGI) is data that are created using Web 2.0 technologies and that contain georeferences, which either includes explicitly or implicitly geospatial information. AGI is a phenomenon of the digital age: individuals create, share, and publish geospatial content on social media and microblogging platforms. This content can create large amounts of unstructured information that accrues in real time. This is also known as big data.
Similarly, Volunteered Geographic Information (VGI) also includes geospatial data from non-professionals but explicitly collects it for further use [8,9,10]. VGI is often collected within the framework of citizen science, whereas georeferences of AGI are merely a byproduct of the actual content (e.g., when an image file is uploaded to a microblogging service). Fischer [11] and Harvey [9] also emphasise the difference between data being intentionally or unintentionally generated and shared. Other authors [12] use the umbrella term “Citizen Contributed Geographic Information” (CGI) for generated geospatial information, regardless of the intended use. In summary, the context of data production (citizen science vs. social media) and data collection (crowdsourcing vs. harvesting) differs between VGI and AGI (Figure 1).
Stefanidis et al. [13] discuss AGI being used in the context of harvesting social media feeds. Geospatial information from other data sources is primarily used to analyse the spatial dimension. In comparison, tweets can be used to reflect social behaviour [2,14] whereby the data can provide an understanding of behavioural patterns in social systems against the background of environmental phenomena [15,16,17].
The analysis of user-generated content reveals wide-ranging applications for a networked world [18,19,20,21,22]. Although big data can be viewed sceptically and always requires a classification of the specific datasets [23,24], the multidisciplinary field of Crisis Informatics (or Disaster Informatics) is receiving increasing attention. The systematic analysis of shared content via Web 2.0 data sources in the context of extreme weather events or natural disasters can assist in supporting crisis response and communication [25,26,27,28,29,30,31,32,33].
Crisis Informatics often aims to create modern information environments that enable multi-directional and interactive communication [34] as opposed to traditional one-way communication models in crisis communication. Nowadays, AGI utilizes intelligent services on dynamic web maps to study disasters in real-time [35]. In the context of text mining [27] and machine learning [36], classifiers are needed for efficient information processing. Since such AGI is rarely formalized and varies greatly depending on the medium used, new forms of data standardization and appropriate approaches for evaluating the quality and accuracy of AGIs must be found [37,38].

1.2. Objectives and Research Questions

Although a number of studies demonstrate the benefits of georeferenced information collected by laypersons for society and science [39,40], questions remain regarding how society communicates about severe weather events on Web 2.0 platforms. This article discusses how such data sources can be implemented alongside damage reports as a form of geocommunication. The case study investigated spatio-temporal patterns using unstructered AGI posted in German tweets and official wind datasets about the Central European storm Friederike.
The study answered the following research questions for the study area (Figure 2) of Germany: (1) To what extent is the studied severe weather event reflected in short messages on the microblogging service Twitter? (2) To what extent can such an echo be linked to official weather data such as wind and speed? (3) How does population density influence the frequency of AGI in the study area? The overall object of this study was to demonstrate how official weather data and AGI can be combined to provide insights into societal perceptions and awareness of severe weather phenomena.

2. Materials and Methods

Official weather data of a severe storm event and the AGI gathered from a microblogging platform assist in analysing the societal echo of specific weather events. The microblogging platform that was used as the data source was Twitter. Twitter data can be retrieved with an application programming interface (API). The API allows to mine through large amounts of data using specific keywords in a more efficient way. Thus, relevant tweets can be retrieved within specific periods of time by using particular keywords. In addition, spatial filters and/or the language can be specified. However, spatial filters are only useful if users explicitly store this information with the metadata of their user profiles. Despite this slight shortfall, Twitter can be a very useful data source, because of its high number of active users and the available API [42].

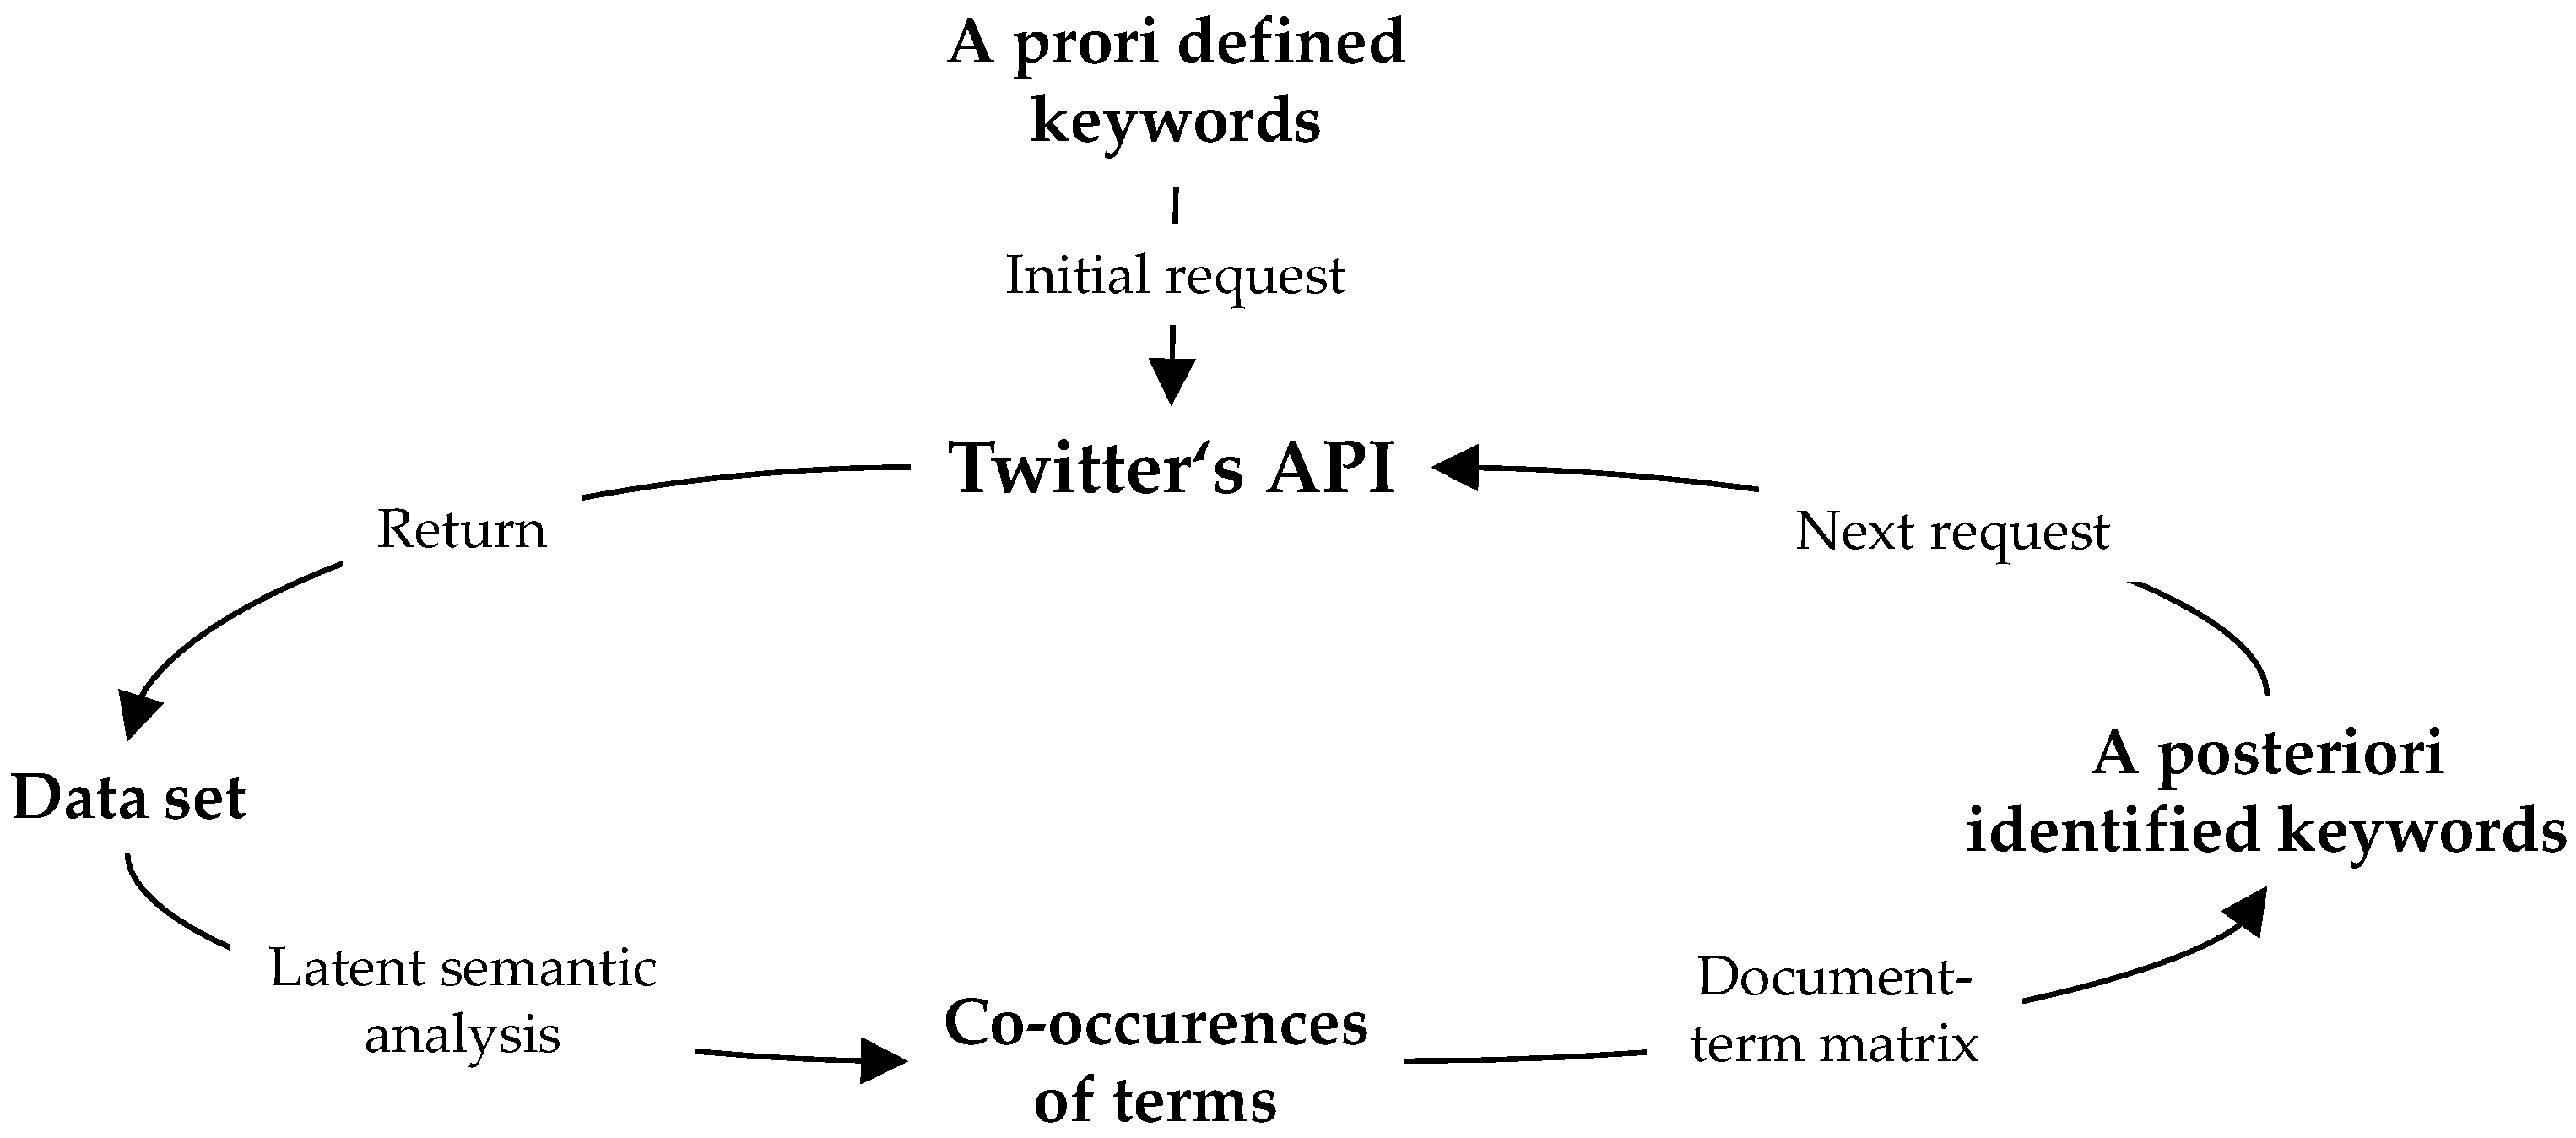
2.1. The Harvested Dataset

Between 17–19 January 2019, the severe storm Friederike moved across the Atlantic Ocean and Central Europe. The storm produced high winds, with gusts up to 203 km/h, and caused widespread damage in parts of the Harz National Park and Saxony-Anhalt in Germany. Frederike destroyed buildings and vehicles, halted train services, cancelled flights, limited road traffic, and caused power outages. There were also eight direct fatalities and numerous injuries.
To extract relevant data from this severe weather event, the authors derived a list of keywords by doing a qualitative content analysis on reports of past storm events. This specialised keyword list was used to retrieve tweets with matching hashtags (# labelled words) via Twitter’s API (Figure 3).
Users often use similar relevant terms as hashtags to emphasize their semantic meaning. Thereby, the primary Information Retrieval (IR) approach was based on hashtags. This is consistent with Zappavigna’s [43] linguistic interpretation. Zappavigna concludes that the # sign integrates metadata directly into the post. In that sense, it serves as a well-flagged label to make it more efficient to study the data generated from tweets.
High- and low-pressure systems in Central Europe are named by the Institute of Meteorology of the Free University of Berlin. The Institute attributed the name Friederike to the aforementioned storm in January 2018. Thus, mining for this term is an appropriate anchor term. Other hashtags include: severe weather (Unwetter), storm (Sturm), and hurricane (Orkan). In summary, the initial request was based only on the following four a priori defined keywords (translated into English): Friederike, severe weather, storm, and hurricane. Thus, the request was initially based on a restricted search, which was implemented using functions of the R package: “rtweet” [44]. Subsequently, for the next request, a latent semantic analysis (LSA) was conducted to expand the search space with additional keywords. Iteratively, the terms of the query vector were supplemented using a term ranking derived from a weighted document–term matrix and a singular value decomposition [45]. The derived query vector consisted of keywords that were frequently combined in tweets and that occurred in the previous dataset.
With this procedure, the semantic space of the retrieval could be extended, so that the initial problem of a narrowed retrieval based on only a priori defined keywords was reduced. Since it would not be expedient to use all the combinations that have occurred, only the most frequent 5% that overlapped with the initial terms were ranked and passed to the next request using a document–term matrix according to Zipf’s law [46] using the R package “zipfR” [47].
The authors expanded the query to include the following hashtags: flood (Flut), snow (Schnee), storm depression (Sturmtief), stormFriederike (SturmFriederike), flooding (Überflutung), doomsday (Weltuntergangsstimmung), weather (Wetter), weather warning (Wetterwarnung), train (Bahn), fire department (Feuerwehr), danger (Gefahr), thunderstorm (Gewitter), slippery (Glätte), hurricaneFriederike (OrkanFriederike), gale (Orkantief), storm warning (Sturmwarnung), severe weather warning (Unwetterwarnung), warning (Warnung), weather forecast (Wettervorhersage), wind (Wind), and long-distance traffic (Fernverkehr). The query was ordered according to the frequency with which it was mentioned in the previous collected tweets.
Only the term “rain” (Regen) was added as a search term to the last request, because other terms did not provide any further potential for implementation according to Zipf’s law. Accordingly, it can be assumed that all further relevant search terms were applied for the executed IR.
The authors harvested a raw dataset of ~58.000 unstructured tweets in German. Excluding retweets and duplicate entries, there were still >23.000 unique tweets. The authors defined the AGI period between the 15th and the 21st of January 2018 to cover the period before and after the actual storm event. The period includes the phase when the low-pressure weather formation swept through Central Europe with gusts exceeding 200 km/h, as well as the warnings and damage-incident reports before and after the event.

2.2. Wrangling and Filtering

It is generally assumed that individuals do not send tweets in such a tight timing as bots do. Frequencies per day and user were applied as filter criteria. Afterwards, the resulting plausibility was qualitatively approved. For the examined period of five days, 10≤ tweets was a suitable limit, i.e., on average, users who send ~2 tweets per day represent single individuals. Following this, the dataset consisted of ~16,000 tweets, which can be traced back to individuals. For filtering, mining, and coding the climatological information of interest, efficient methods of data processing were used in the R environment [48]. Manual filtering of such a large dataset would be too time-consuming and inefficient [49]. A three-dimensional feature space consisting of a spatial, temporal, and thematic class was required to formalize the data. Accordingly, the tweets were prepared according to their timestamp and the existence of geo-coordinates in the meta-data. Because the timestamp was already included in the metadata, the focus lay on the text mining of thematic and spatial codes based on the body of the text.

2.3. Geocoding of Implicit Location Names (Toponyms)

Accurately assigning spatial relationships to tweets is challenging when the geographic coordinates (lat–long) of the tweet are unknown [50,51,52]. Similar to other studies [53,54,55], only 1% of this study’s crowd-harvested tweets had explicit geographic coordinates. That is why the text bodies of the tweets were mined for implicit georeferences to increase the total number of geographic coordinates. Such hidden references come without specification of latitude and longitude detail but with place names or regional references (toponyms). That is why geocoding via external database locators for lookup references is necessary.
In practice, geocoding can only be successfully applied if corresponding toponyms are available and match with a string pattern of a gazetteer database. While, e.g., the pairing “Freiburg”: “Feribrug” still indicates a high similarity according to the standard Levenshtein distance, it is extremely low with the pairing “Freiburg”: “black forest city” despite their high semantic similarity.
Reverse geocoding refers to the opposite procedure. In this process, address information is generated from position information (in the case of a two-dimensional point geometry from longitude and latitude details). This, in turn, depends on the corresponding searched scale. The geographic coordinates 47.99690483768423, 7.84195104872818 can correspond to either one of the following: 1. Bismarkallee; 2. a city district in Freiburg; or 3. the federal state in which the point is situated, Baden-Württemberg.
In concrete terms, the single-string entities of all studied tweets were compared with the toponyms of the Eurostat’s database of nomenclature of territorial units for statistics (NUTS) and Local Administrative Units (LAU). During a supervised and iterative two-stage process, tweets’ georeferences were assigned to the dataset. Firstly, the geometries of the corresponding area were assigned by matched toponyms using the R package “fuzzyjoin” [56]. Secondly, in descending frequency of occurrence, it was evaluated whether hits matched toponyms only in terms of the string pattern and otherwise had a semantically different meaning. Thus, terms that had a semantic relation to the storm event, but that had the same string pattern as a toponym, could be identified. For example, the term “rain” (Regen) was not coded as the German place of the same name. Since the georeferences mentioned in the tweets refer to different spatial scales, the degree of informational detail varied from the local to the national level. The few explicit geo-coordinates of 1% were intersected to the fourth administrative level (LAU), which corresponds to Germany’s municipalities (Figure 4).
Through geocoding and harmonizing tweets’ georeferences, the authors were able to further analyse the spatial co-occurrence and interlinkages to supplementary geospatial datasets. The methodological approach follows common practices in the field of GIScience [57], according to which a nomothetic search for knowledge using software and algorithms is combined with idiographic research practices using databases.

2.4. Spatio-Temporal and Content-Related Patterns Analysis

A uniform spatio-temporal scale establishes common reference units for coupling tweets and other structured datasets, such as wind and population data. Hexagons (250 m edge length) represent administrative units to prevent typical zoning effects (e.g., Modifiable Areal Unit Problem (MAUP) or the ecological fallacy). These were used as spatial units and a scale to aggregate all georeferenced point datasets. Hexagons are compact and have a low perimeter-to-area ratio that makes them advantageous for representing edges and intersecting points [58].
Based on their inherent timestamps, all tweets were grouped into 3, 6, 12, and 24 h time intervals. This grouping allowed the analysis of the aforementioned temporal scales. As a result, the authors coupled spatial and temporal aspects of tweets, wind, and population data to analyse all information sources collectively.
Based on the common spatial reference unit (20 km-wide hexagons), the tweets were supplemented with population data derived from the Global Human Settlement Layer 2019 (GHSL) [41] and 3-hourly modelled wind speed data from the Global Forecast System (GFS) [59]. The authors first interpolated the GHSL data to the study area or the hexagonal areas using GIS techniques. Laterm the authors loaded wind data directly from the GFS server with the R package “rwind” [60] and further derived statistics from these data about population density and wind speed maxima. The R package “sf” [61] was used to perform geometric operations and spatial processing of the data. After that, both datasets were mapped using the R package “ggplot2” [62], in order to recognize patterns of tweets’ georeferences, population distribution, and wind-speed patterns.
The authors used Silge & Robinson’s tidy text format [63] for the content-related patterns analysis. Accordingly, the authors used the tibble data frames [64] in R to mine for text and hashtag features. All stop words, adjectives, and toponyms were removed for central topic evaluation. Based on this evaluation, the authors identified well-structured data objects, central terms of tweets and hashtags, and their co-occurence. Following this, the authors clustered all semantically synonymous terms to quantify the frequencies of central topics and their relationships over time.

3. Results

The main temporal, spatial, and content structures of the approach carried out are presented below. Particular attention was paid to the question of to what extent the societal echo of the storm event relates to official weather data and population density. Out of the entire raw dataset of ~58 k tweets, ~23 k were identified as unique user-generated, of which ~13 k tweets (~55% of unique tweets) in turn contained toponyms and could be finally used to analyse spatio-temporal patterns. This means that ~22% of the original dataset was used to analyse the content and spatio-temporal questions, as the other data were duplicates or had no spatial reference.
First, the central terms and their temporal density of the communicated text corpus is presented (Section 3.1). Thereupon, the detected georeferences according to administrative scales are listed (Section 3.2). The spatial patterns of AGI and wind speed data are presented in Section 3.3 and Section 3.4.

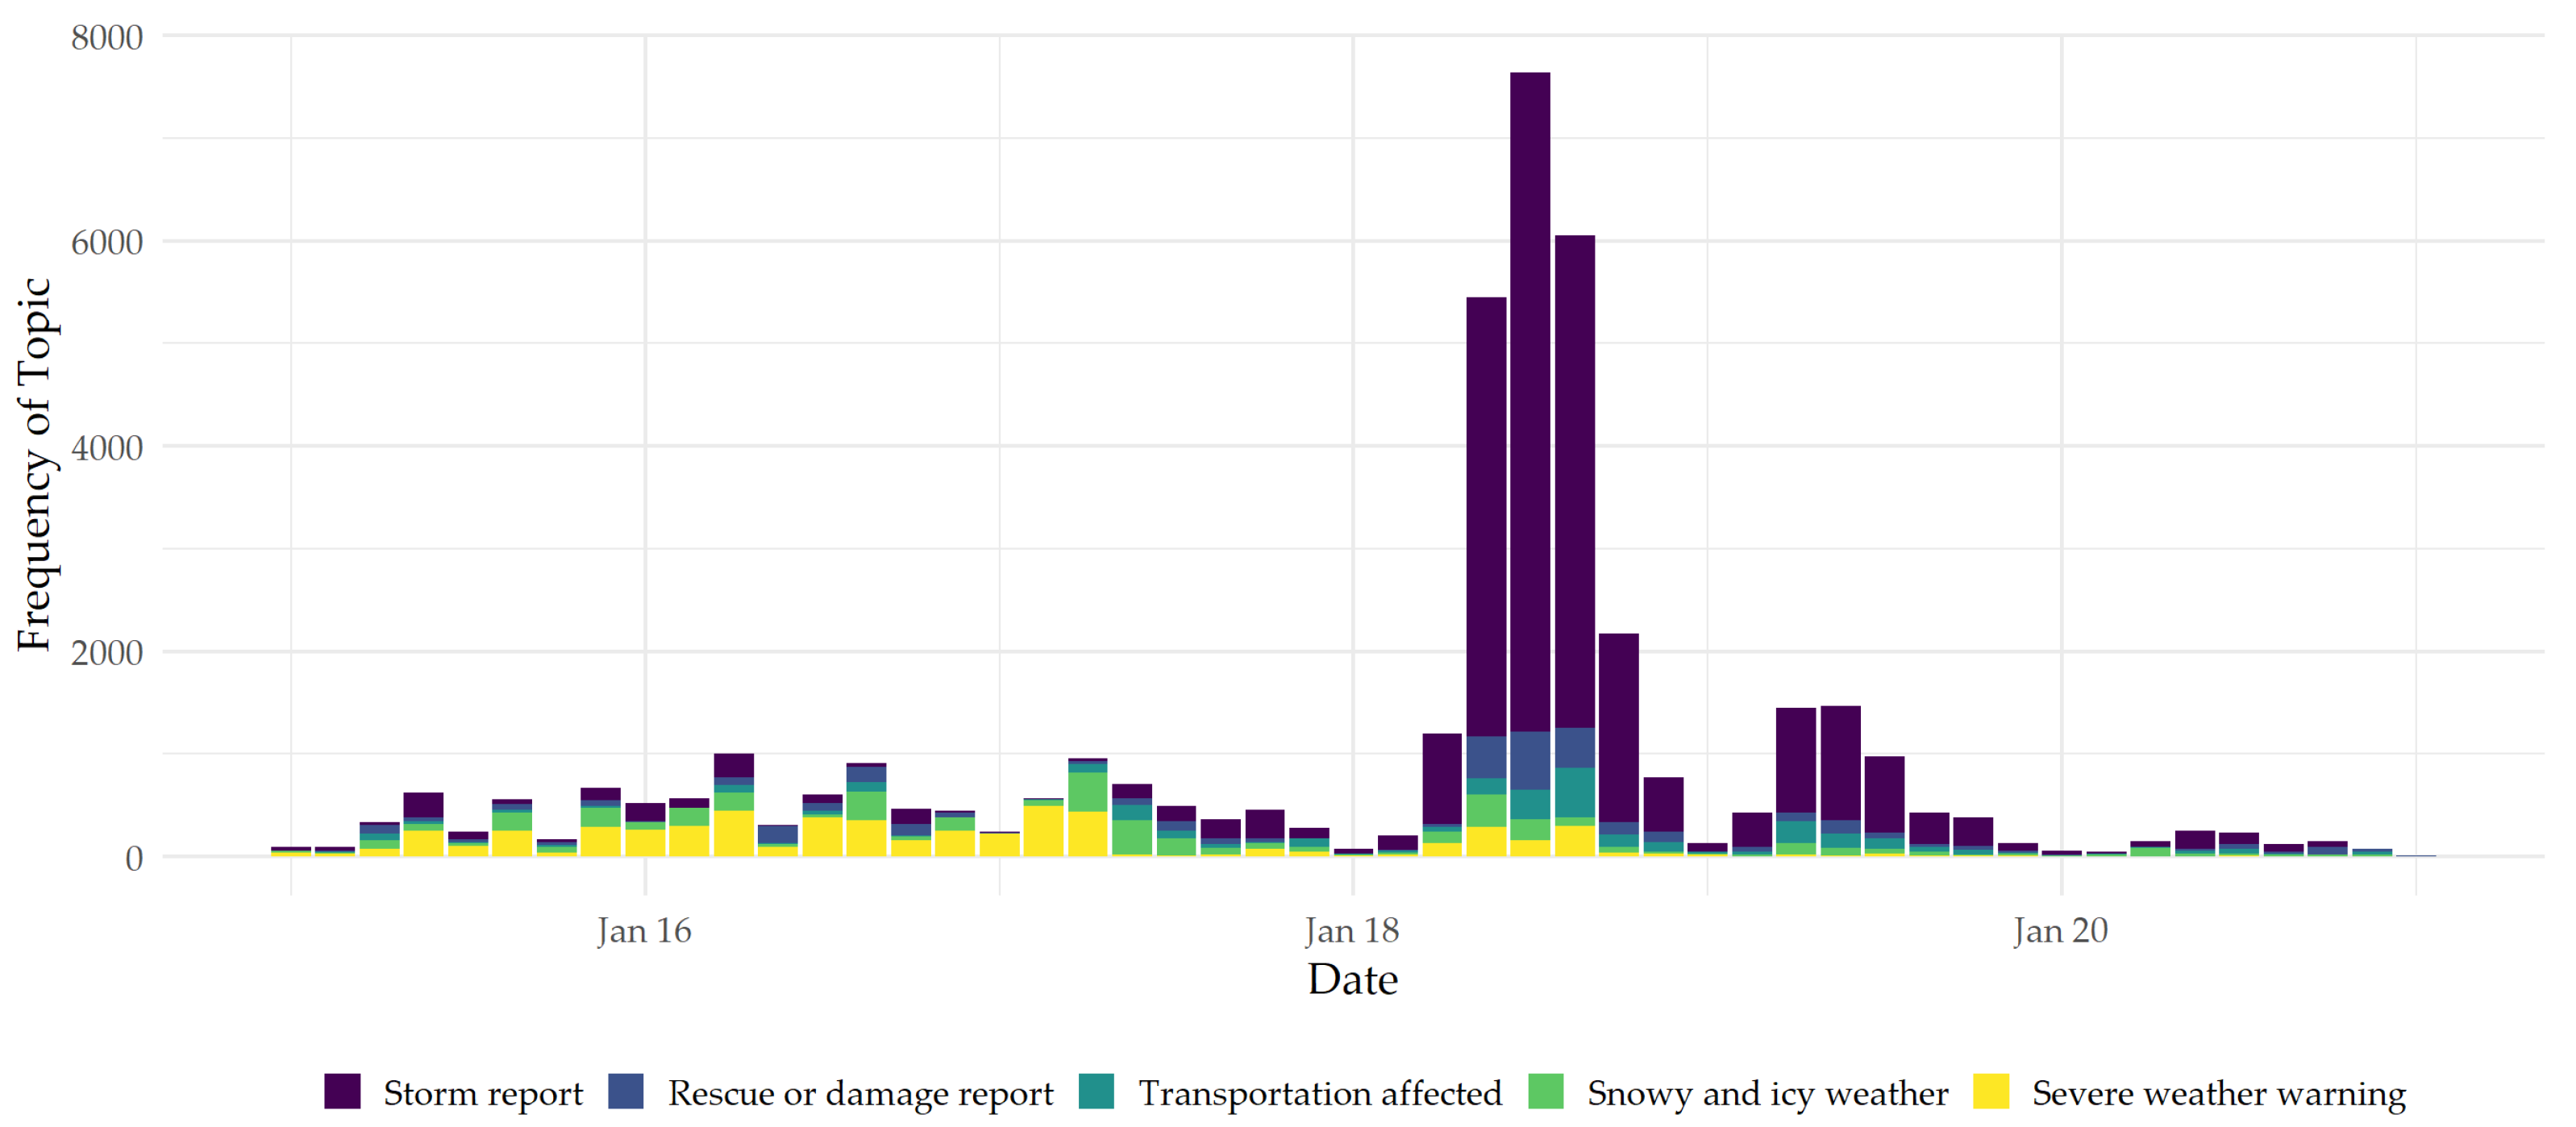
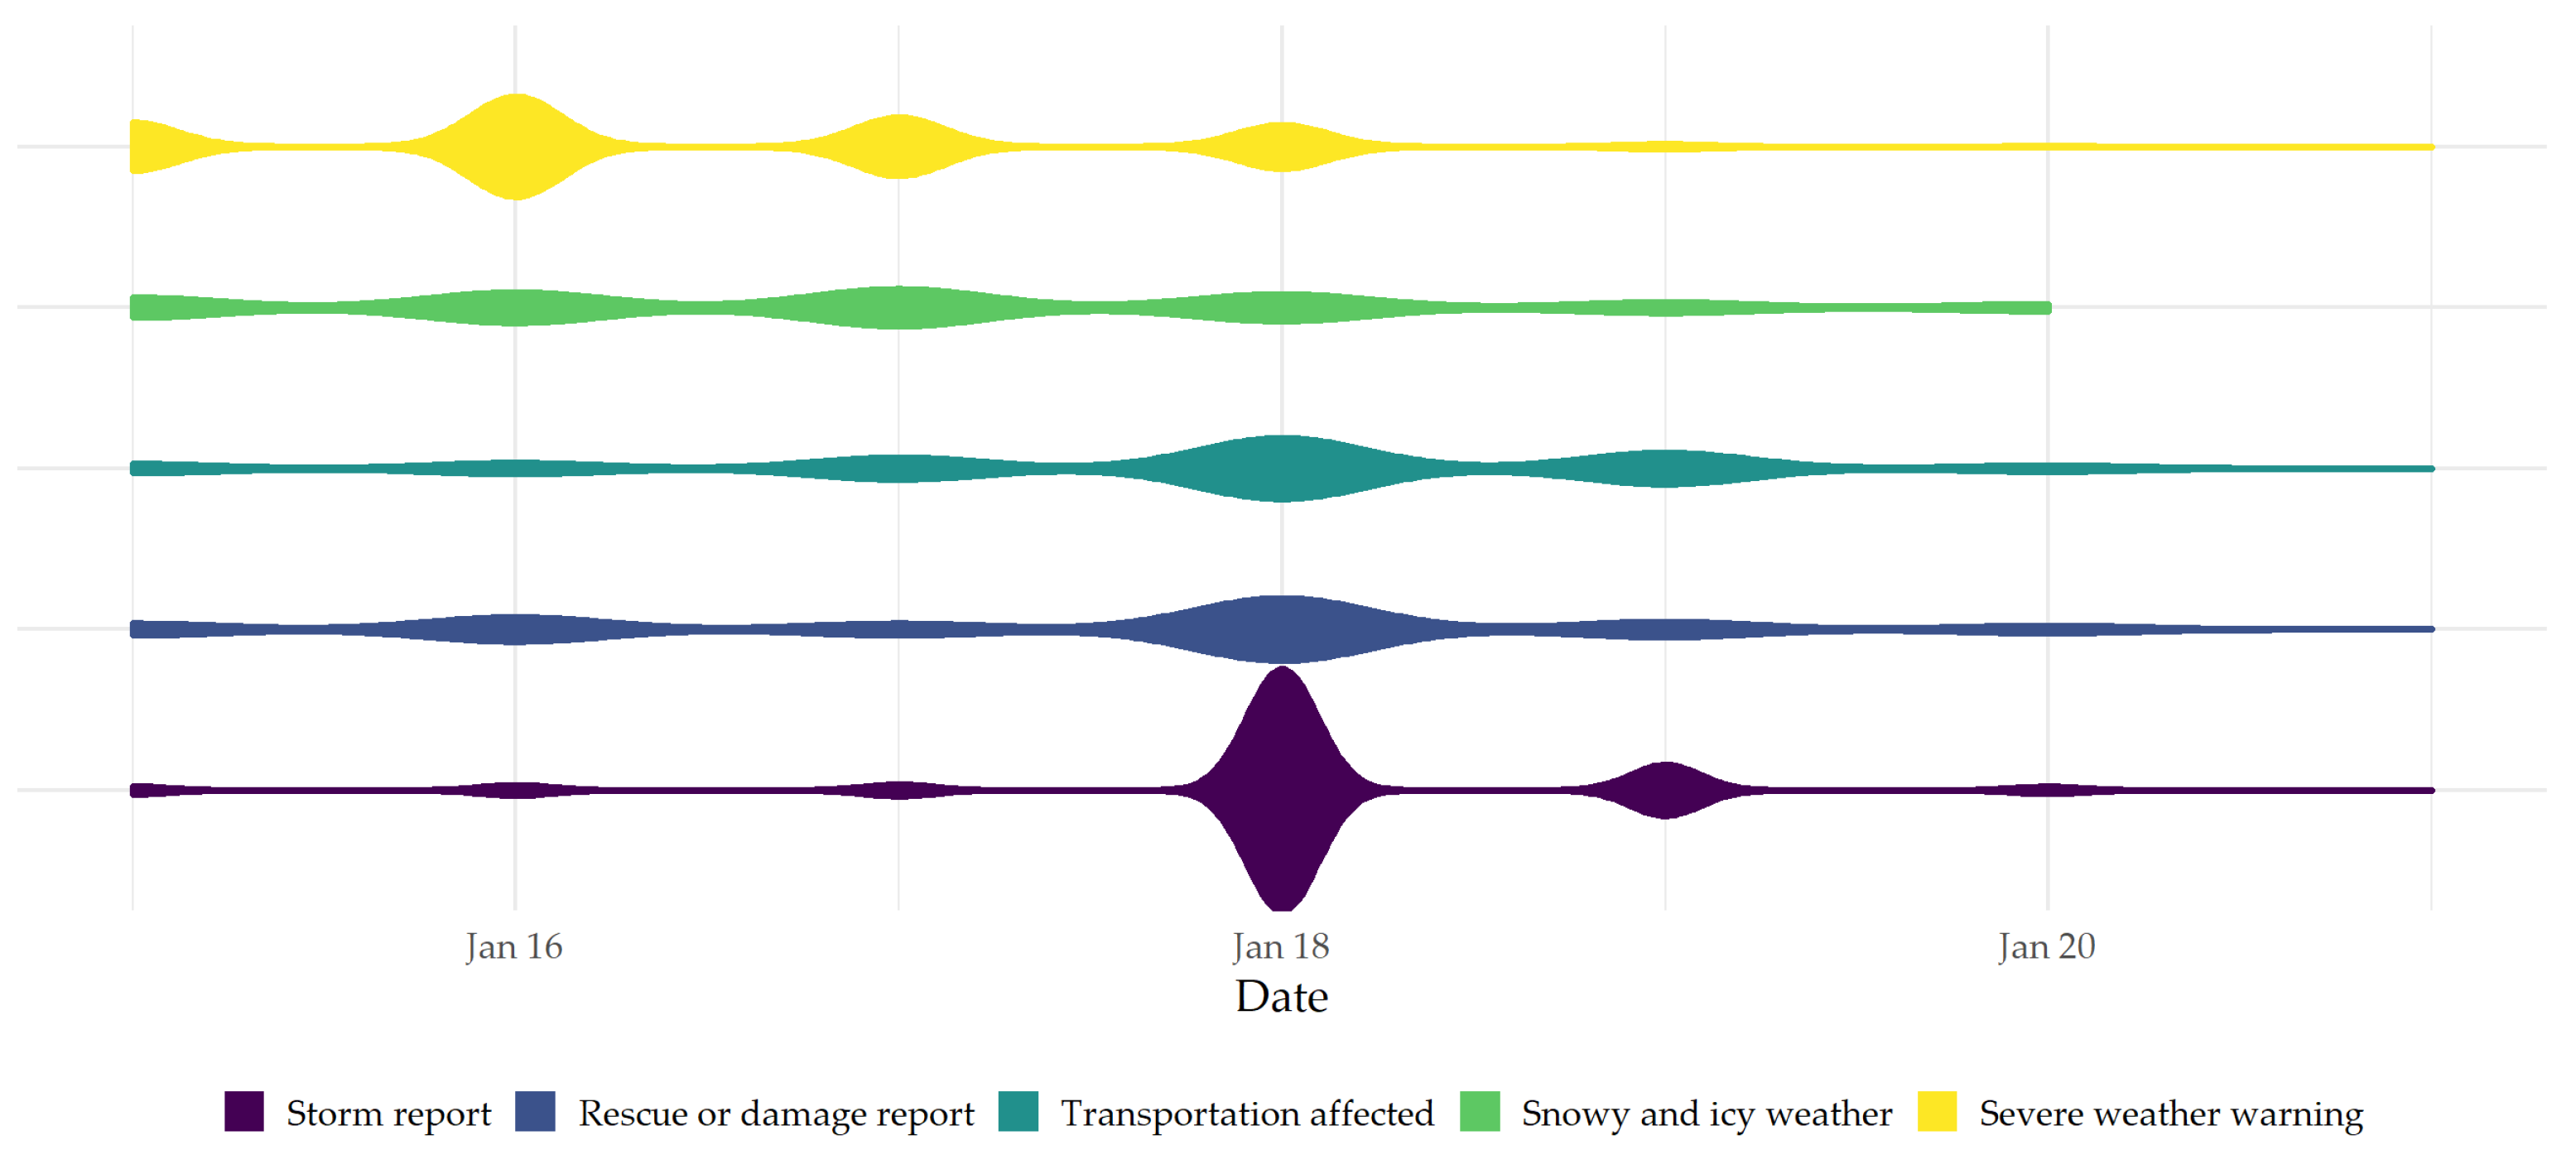
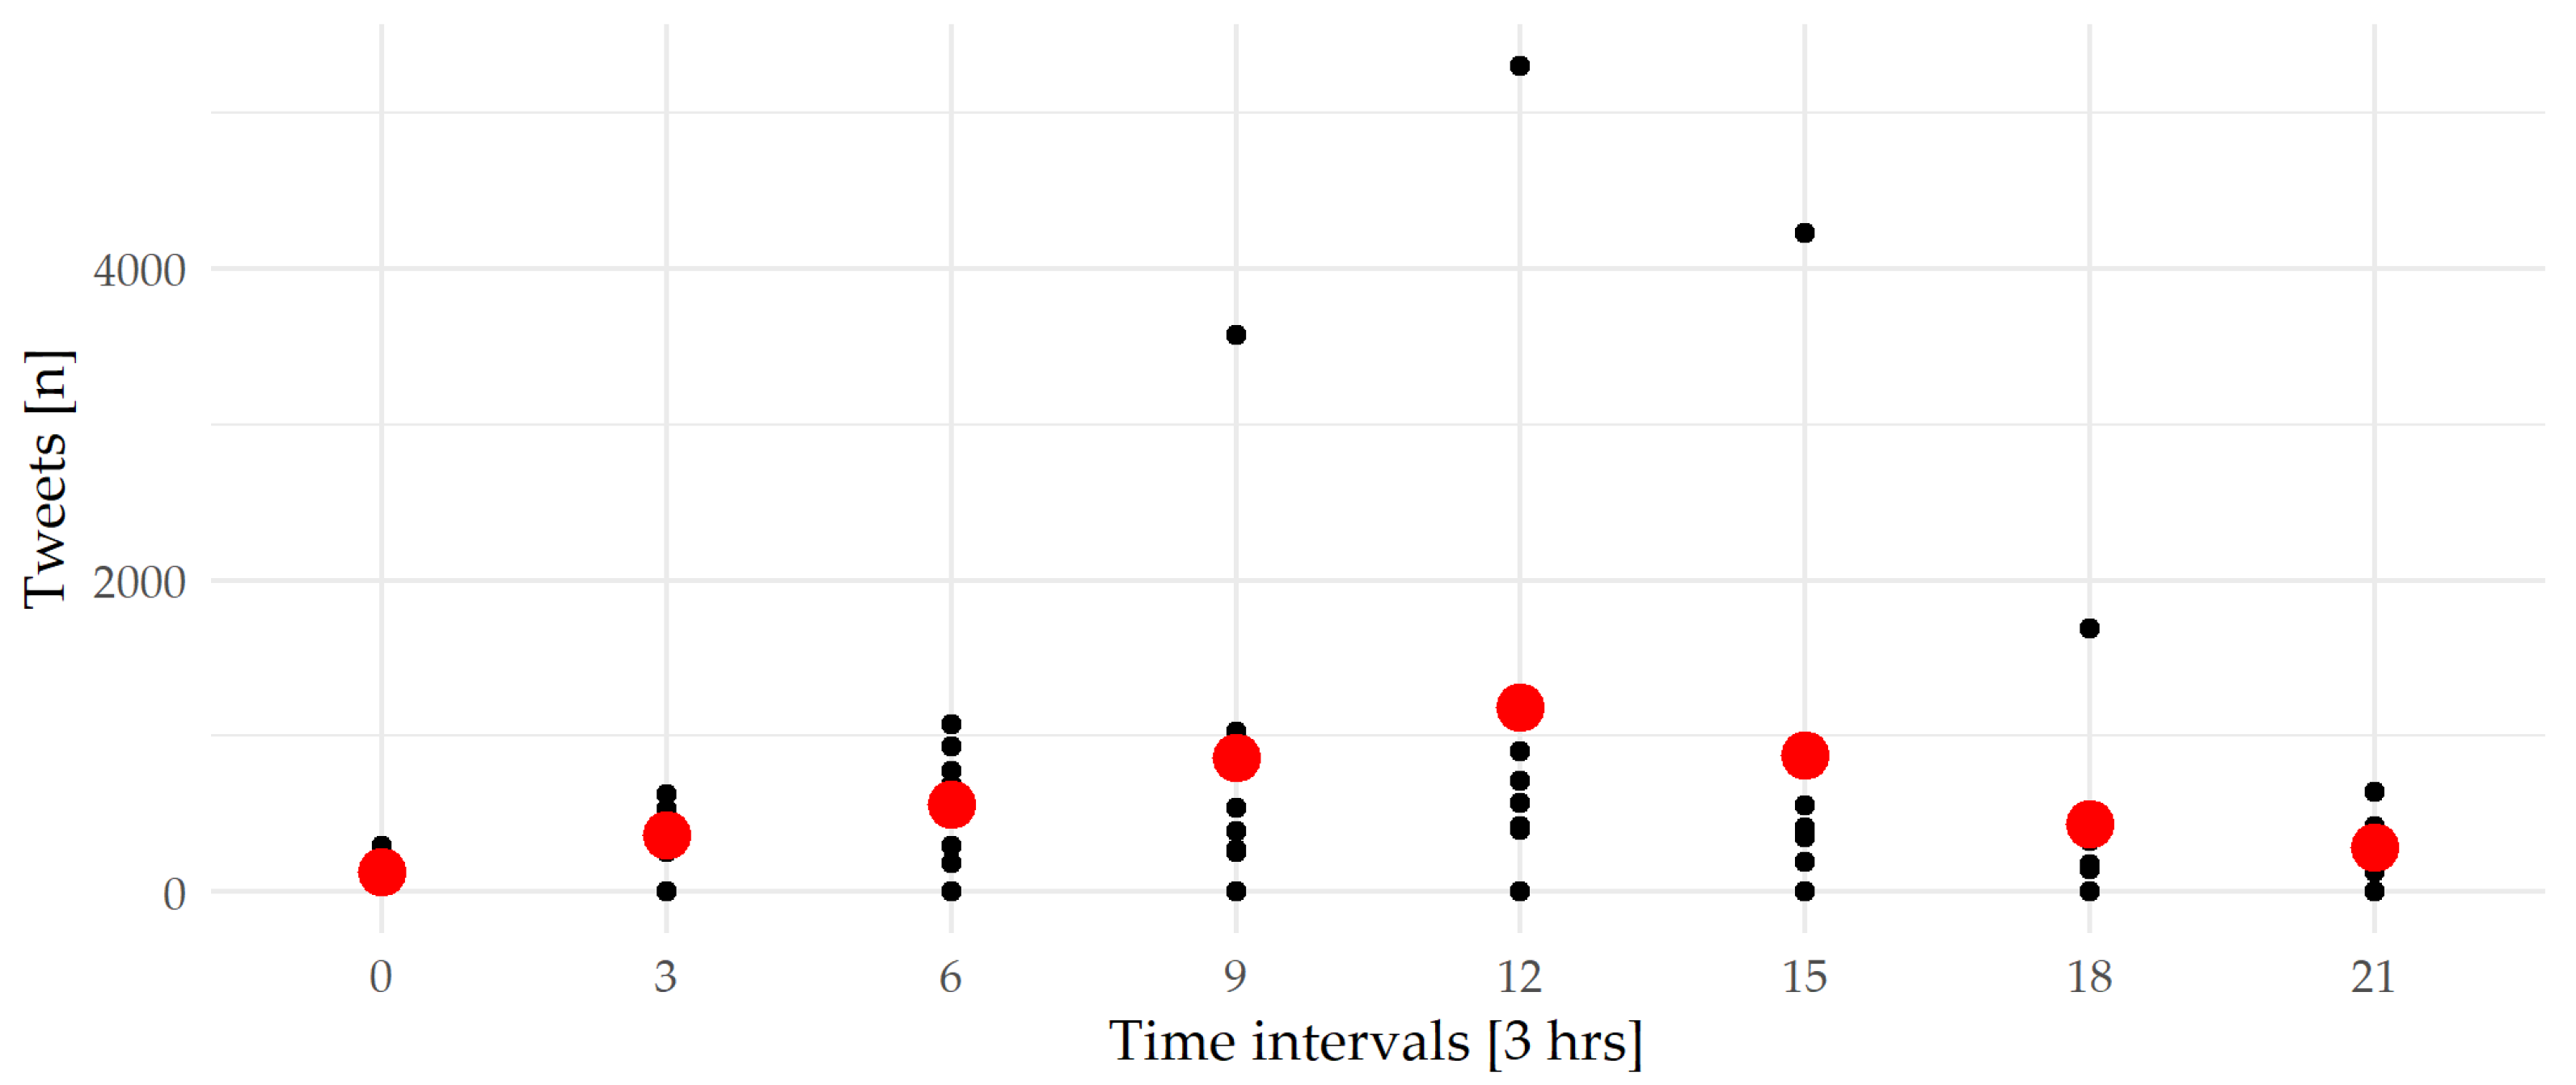
3.1. Central Topic Clusters and Their Temporal Density

Temporal analysis of the data showed that, at the onset of the event, the main topics were (1) severe weather warnings and (2) reports of snowy and icy weather conditions. Comparatively, during the peak of the storm, the (3) storm itself, (4) the rescue and damage reports, as well as the (5) affected transportation systems simultaneously arose as central topic clusters (Figure 5).
The central topic clusters reflect society’s response to the storm event. It becomes clear that disaster communication also took place in different phases, according to which corresponding topics were decisive. The clustered topics in the studied text corpus based on synonymous terms relate to the severe weather warnings, the storm itself, rescue and damage reports, affected transportation, and snowy and icy weather (Figure 6).
With regard to the 3 h time intervals, a distinctive diurnal pattern became clear, which points to a time-of-day effect. Accordingly, the frequency of the tweets correlates to the primary waking hours of human activity during daylight. While most reports are recorded at midday, slightly fewer occur in the morning and afternoon and hardly any at night (Figure 7). The time of day is, thus, associated with the frequency of the investigated AGI and consequently must be considered in further analysis.

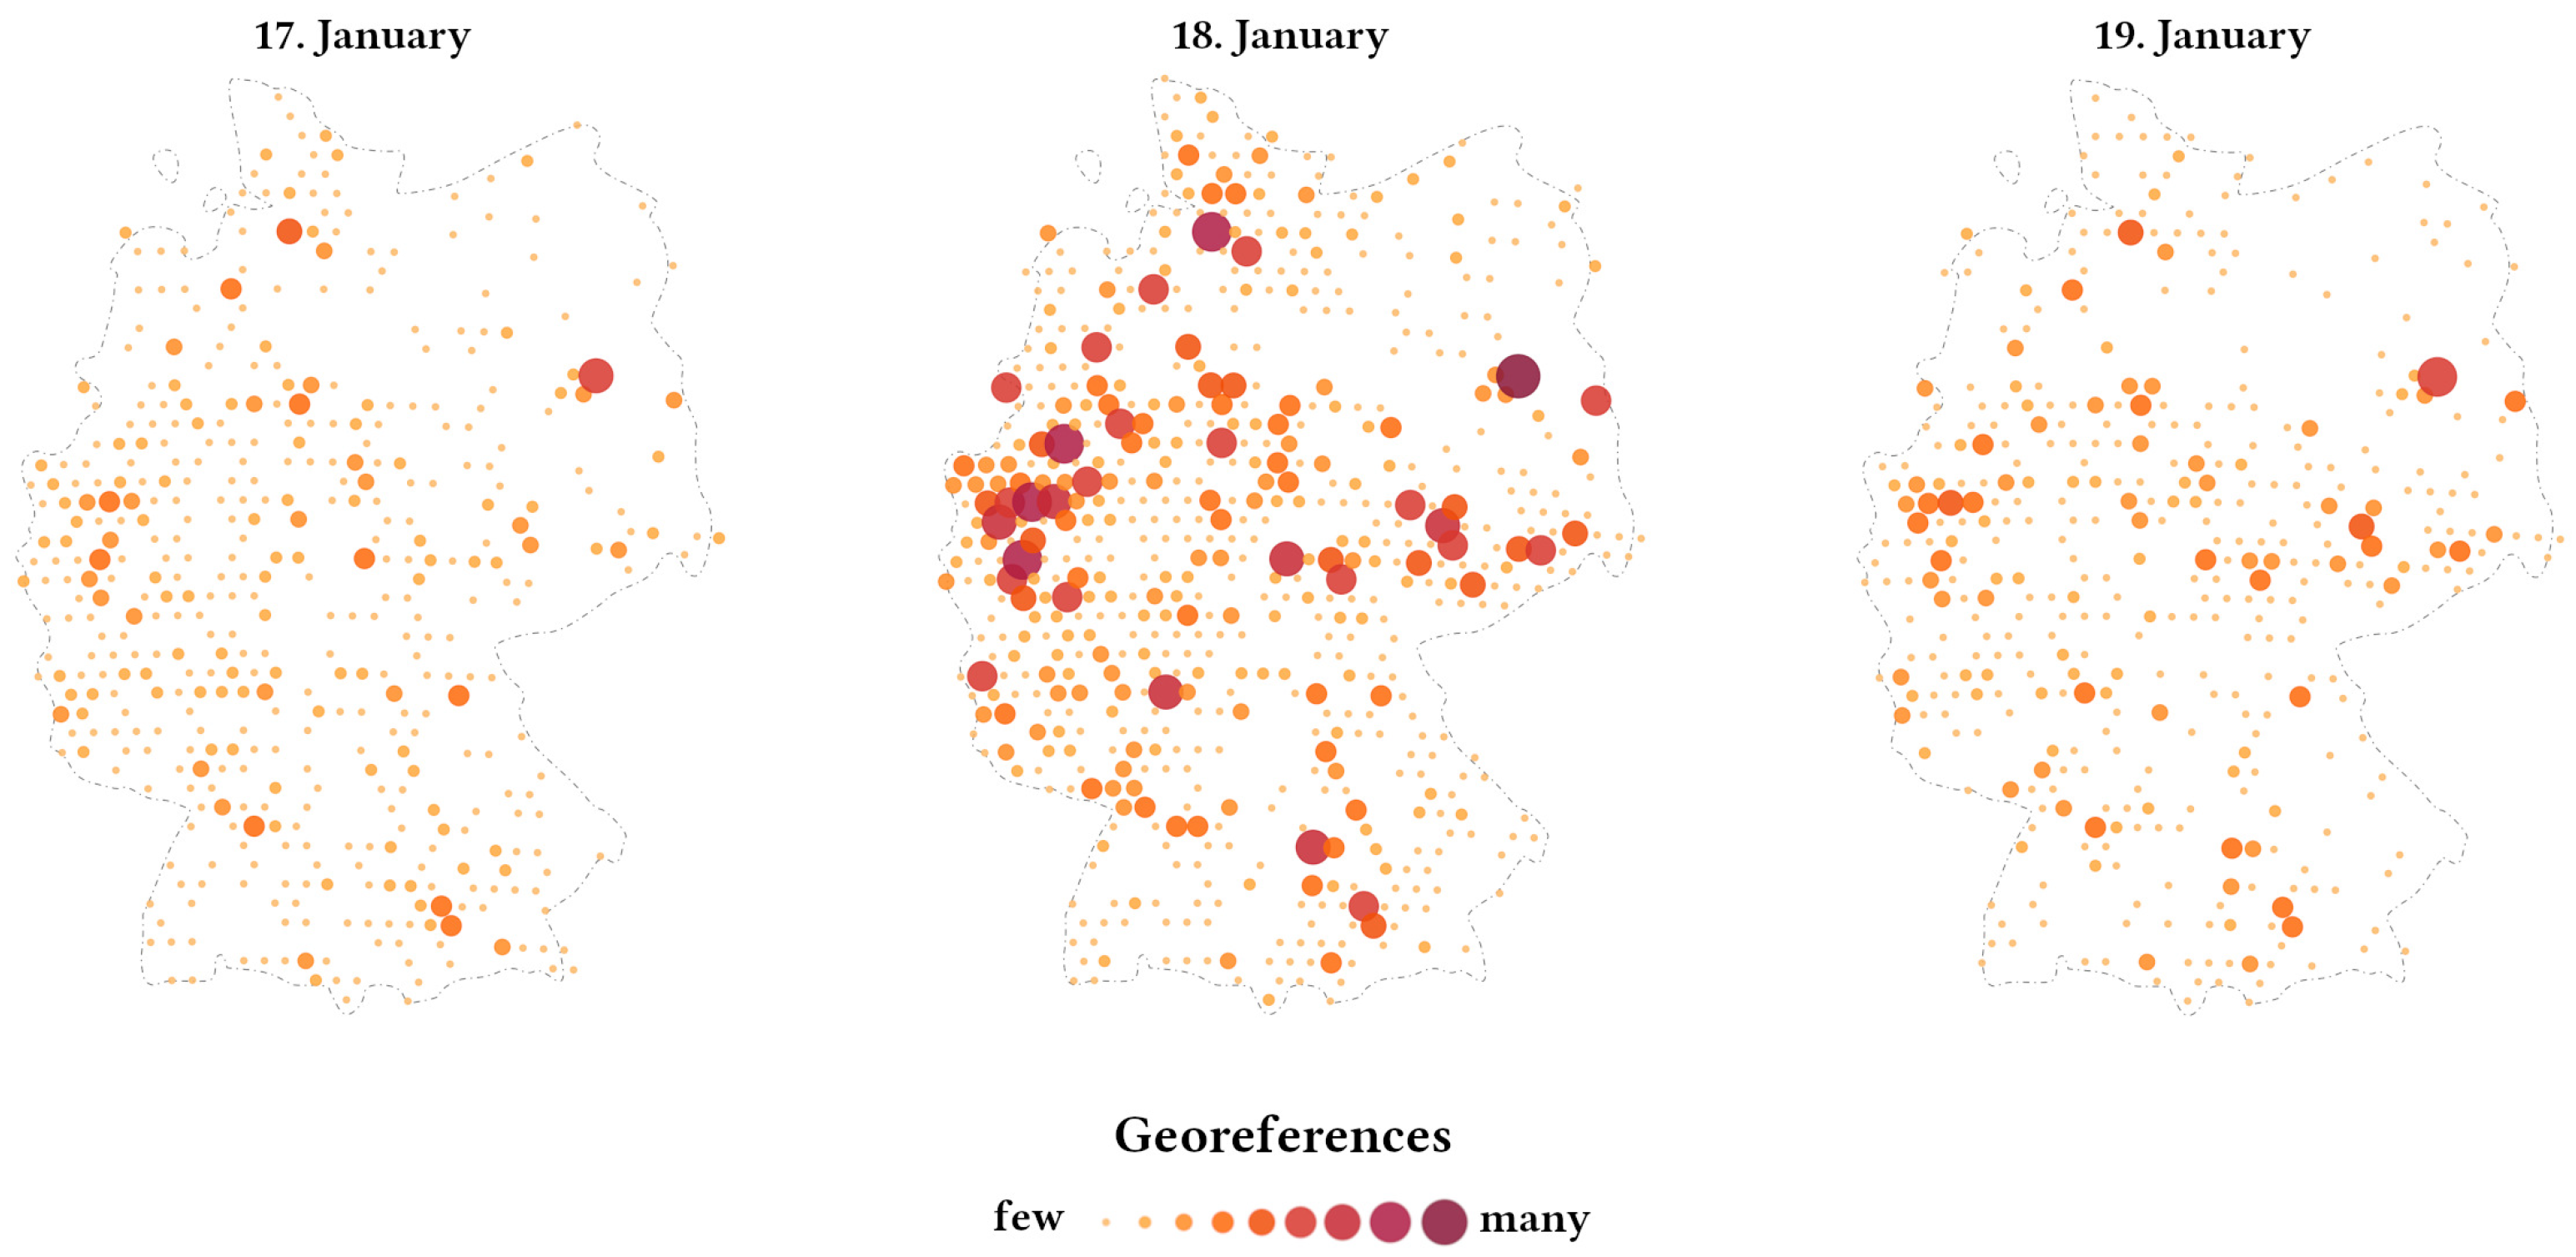
3.2. Implicit Toponyms of AGI

There was a relationship between tweets containing geo-coordinates in their meta-data and tweets with implicit georeferences. While about 1% of the 23,493 tweets contained geo-coordinates, a further 59.66% were detected with implicit georeferences. These accounted for 47 k toponyms that referred to five spatial scales, i.e., one single tweet may contain several georeferences on different scales (Table 1). Incorrect assignments occurred frequently (>10) and were hardly observed at low frequencies.

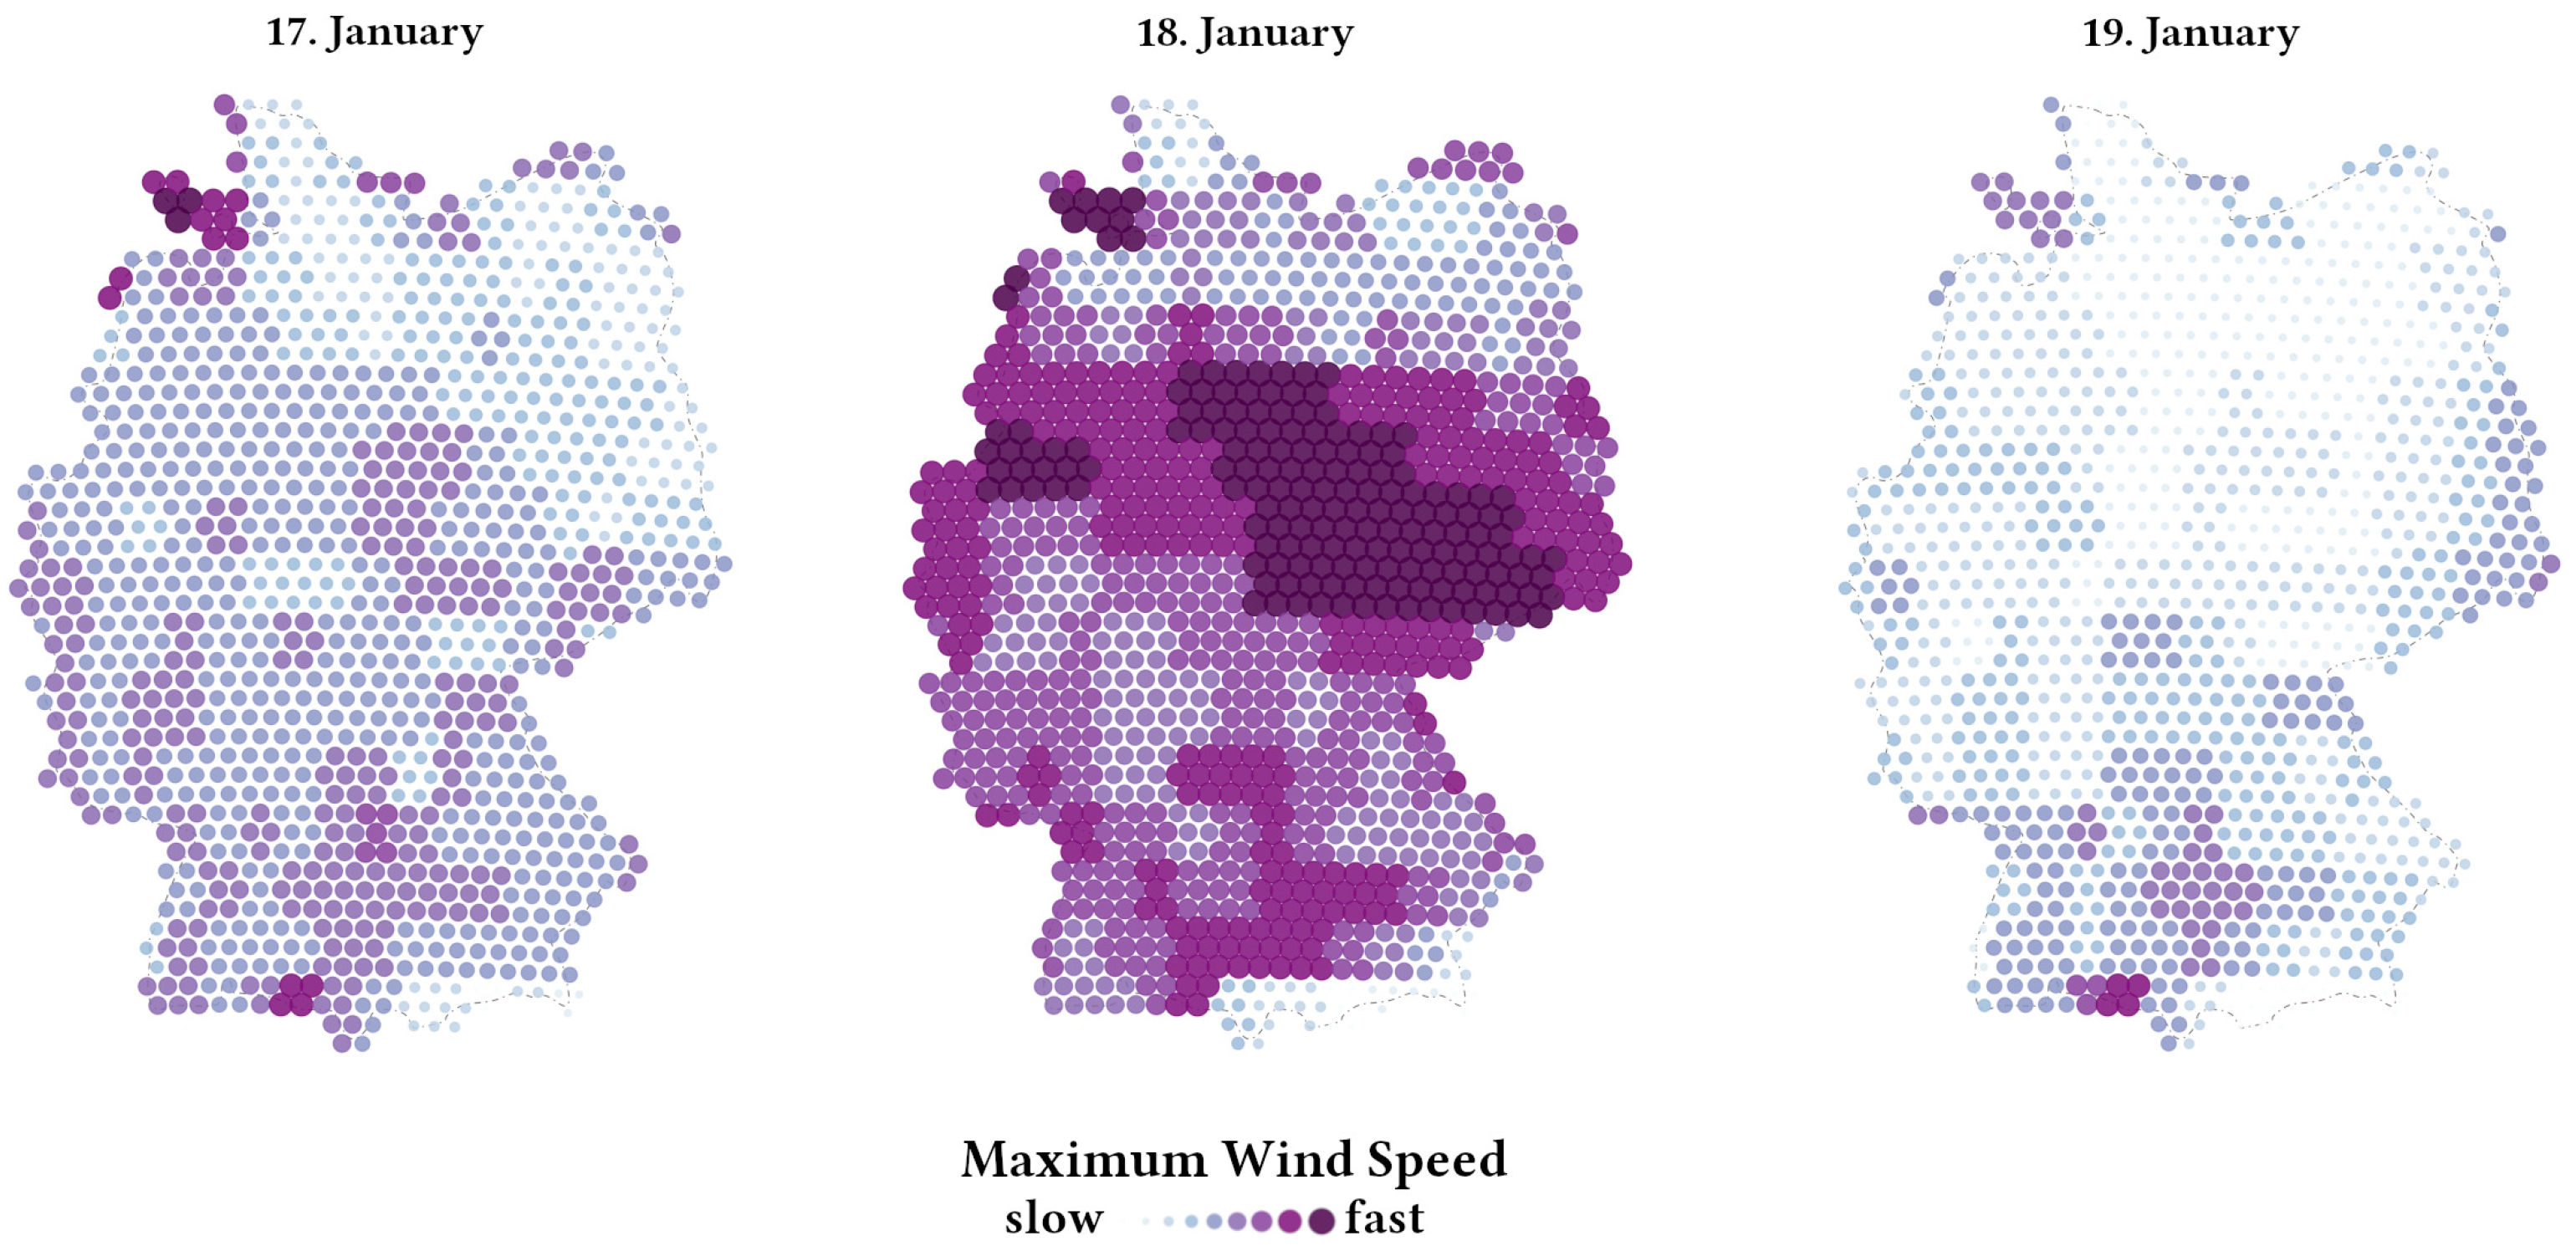
3.3. Spatial Patterns of AGI and Wind Speed Data

Looking at the total number of daily georeferences, it is noticeable that they are unevenly distributed over time and might be driven by the intensity of the storm event. The most frequent georeferences were available on 18 January, the day the storm reached its maximum speed. At the same time, the sample of coded georeferences represent the population distribution of all harvested tweets during the study period. In addition to the frequency of georeferencing, spatial patterns emerged. On 18 January, the mapped tweets indicate that the most-frequent societal responses to the storm event were located in western areas and along a corridor from west to east through central Germany (Figure 8).
For 18 January 2018, the top ten highest amount of tweets was in the capital Berlin in the northeast of Germany (1st rank), in the northern German city of Hamburg (2nd rank) near the coast, in the densely populated Ruhr region (3rd to 5th and 10th rank) in the western regions of the Sudy area, in the Swabian-Bavarian town of Donauwörth (7th rank), and in the Hesse-Thuringia regions in the central parts of Germany (6th, 8th, and 9th rank). In contrast, only a few tweets were received from Baden-Württemberg, the third-most-populous state in southwest Germany.
Considering the spatio-temporal distribution of modelled daily wind speed data, it stands out that the peak phase of the storm was recorded most extensively on 18 January for Germany (Figure 9). The mapped classes represent modelled wind speed levels at 10 m above ground, ranging from 1 to 18 (m/s). The visual interpretation of the modelled wind speed maxima shows that it reflects the communication pattern of the AGI. Interestingly, there were some areas areas with very fast wind speeds and a low number of tweets containing the investigated keywords Overall, the social response to storm Friederike was over-represented in some regions and under-represented in others.

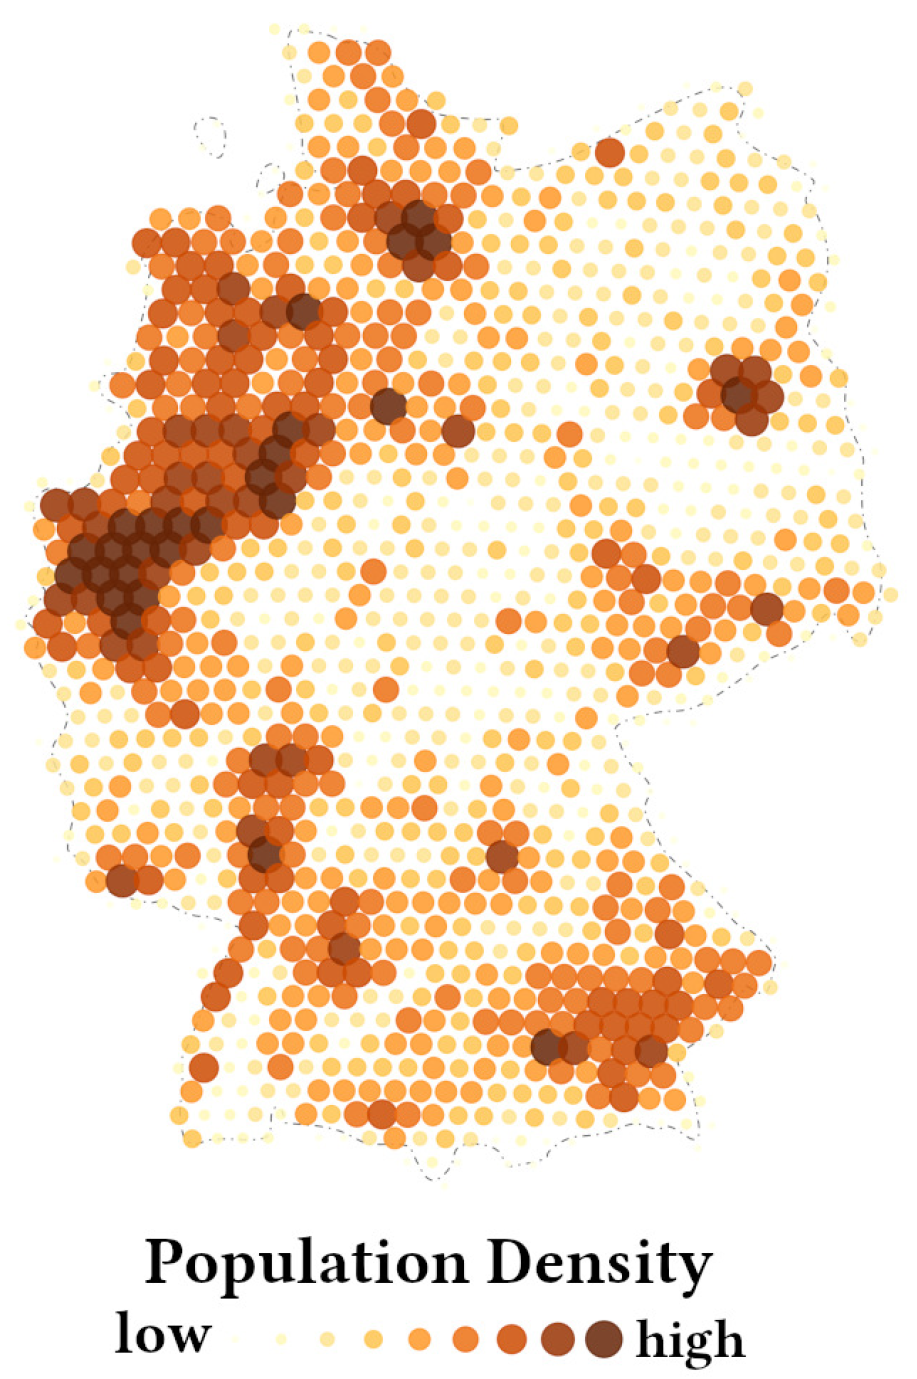
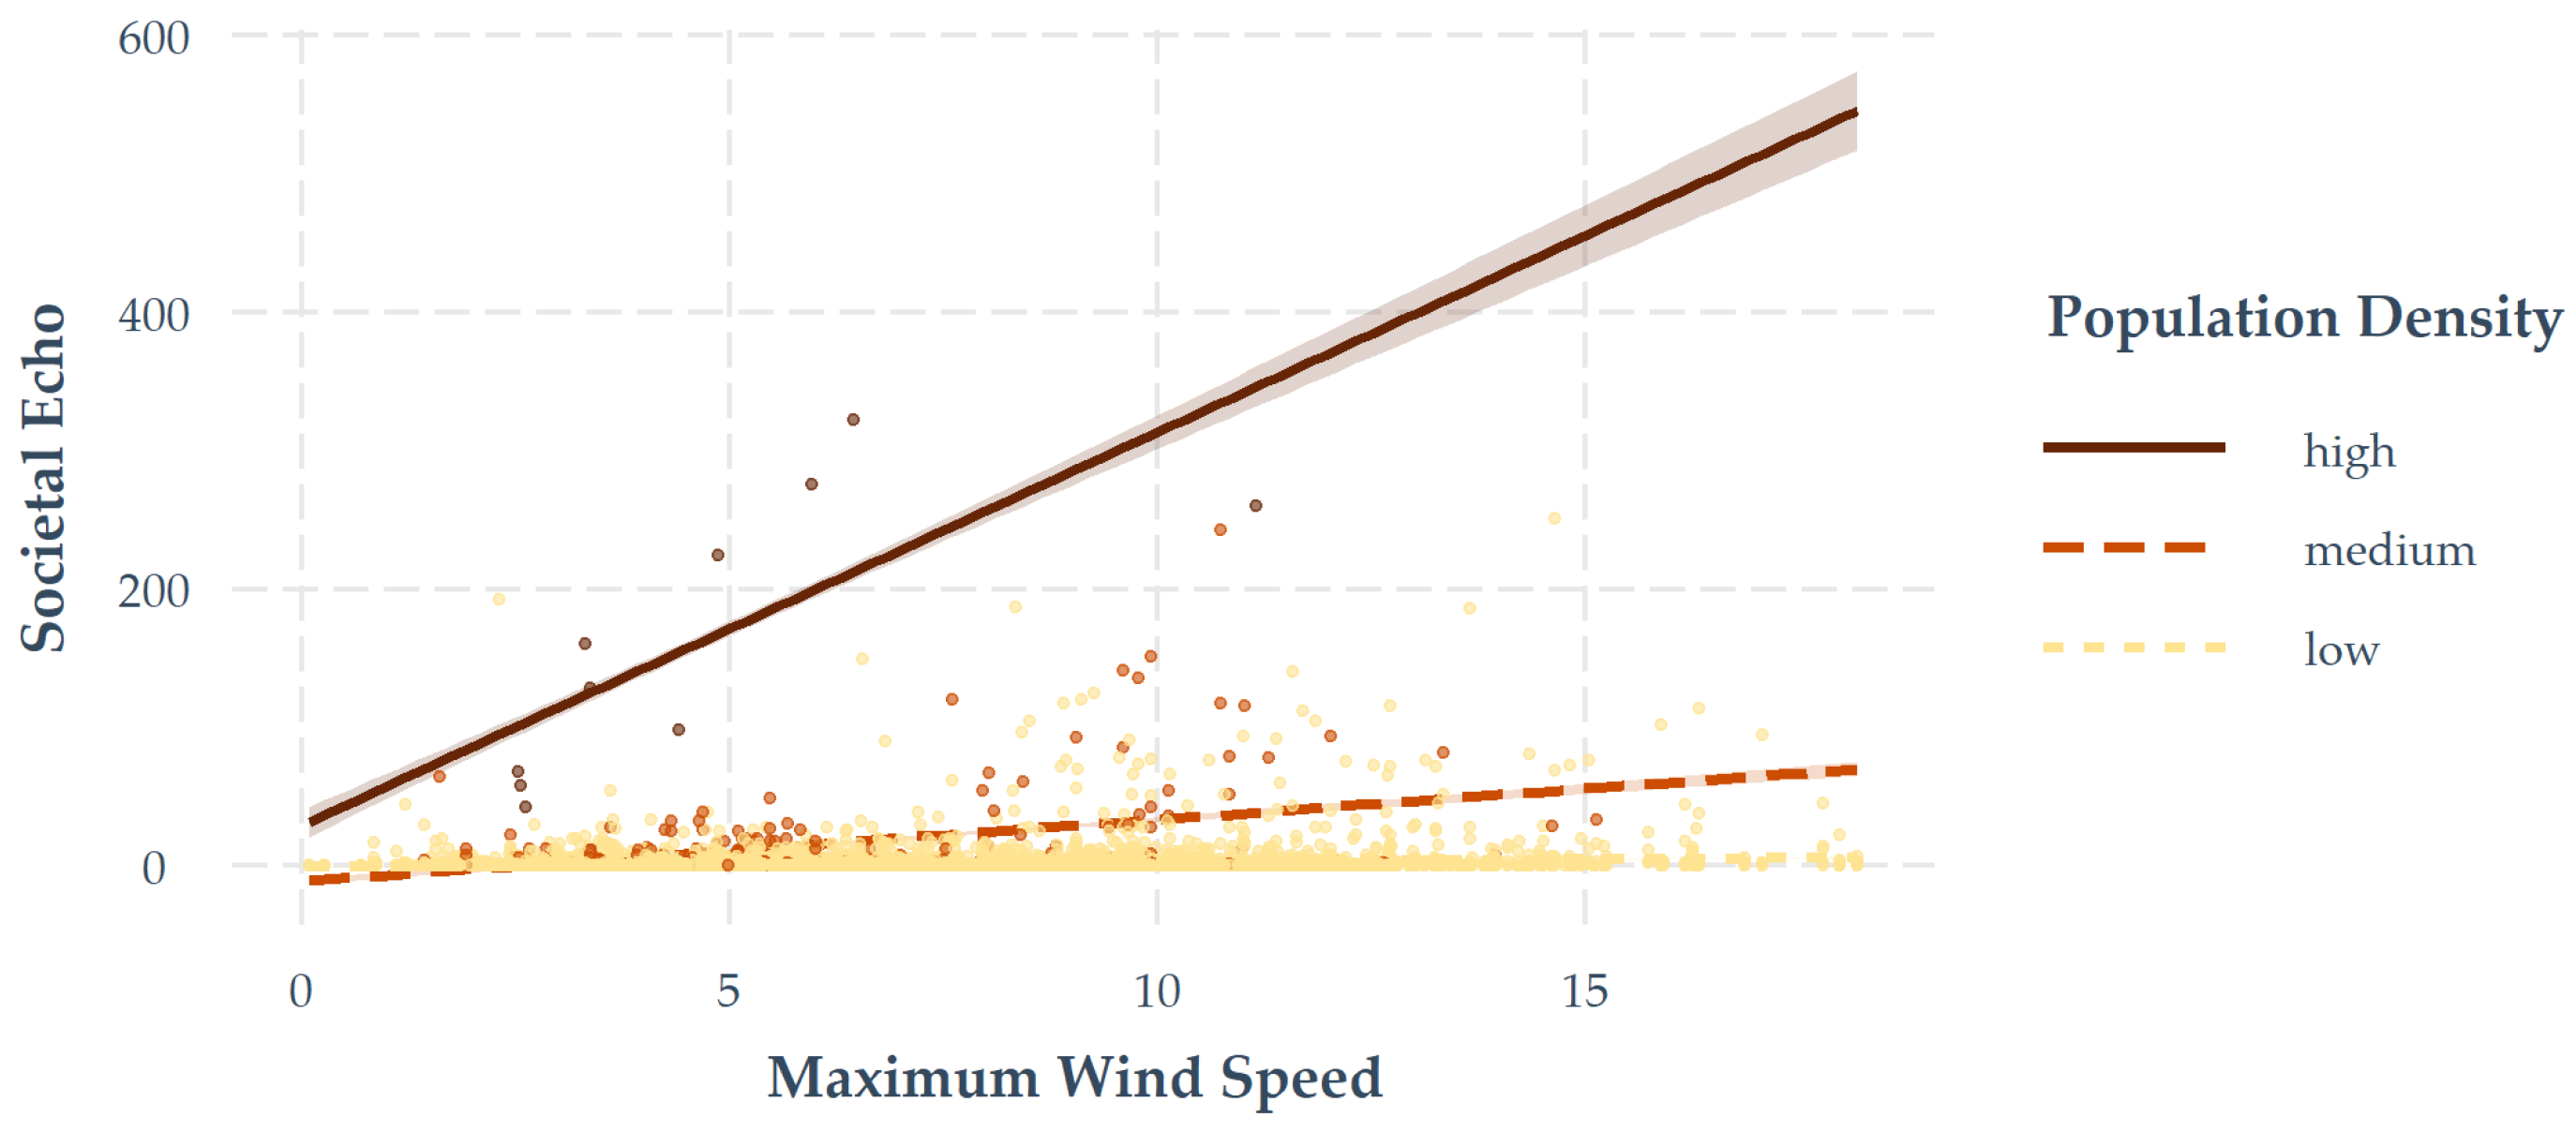
3.4. Synthesis of AGI, Wind, and Population Data

When synthesized, there was a weak to moderate correlation of AGI and population density, as well as AGI and wind speed. The spatial and temporal level of aggregation had a large impact on the degree of correlation according to Spearman’s ρ (rho). On the coarser countrywide scale, there was a clear correlation between the number of tweets and the maximum wind speed.
The correlation coefficients increased with temporal aggregation, since they are less influenced by the diurnal pattern. If the data were aggregated for 7-day periods, there was no significant correlation between tweets and wind speed, but a moderate association of tweets and population was determined (Table 2).
Considering the examined time intervals without a spatial allocation of the tweets, it becomes clear that there was a moderate or strong positive linear relationship between tweets (n) and wind speed (max)—excluding the time interval of 6–9 (Table 3).
For the storm of Friederike studied as an example, the hypothesis that the population density has an interactive effect on the relationship of wind speed and the societal echo can be confirmed in consideration of the equal-interval population density classes: (i) high, (ii) medium, and (iii) low. While the linear relationship of the societal echo and wind speed was positive and moderate for high and medium populated areas, there was a weak relationship for low populated areas (Figure 10). The relationship of the societal echo and the wind speed depends on the population density, which means that the population density influenced the reporting activity that took place in response to the studied wind event. For instance, compared to low populated areas, the increasing reports from more densely populated areas can be disproportionately highly linked to increasing wind speeds.

4. Discussion

In line with Andrienko et al. [65] and other geographic research on Twitter data that focus on the spatial dimension of tweets, this study contextualizes georeferences along the temporal dimension and patterns of content. Even though some authors problematize practices that overemphasize the geocodes of tweets [23] or encourage research that address aspects beyond the spatial dimension [66], the presented approach demonstrates the outstanding value of georeferenced tweets as a prerequisite to analyse them along with environmental data. For this purpose, the few explicit spatial references of ~1% of the initial raw dataset could be complemented many times over by the detection of implicit toponyms by matching with gazetteer entries. With this approach, georeferences for ~55% of the tweets could be used so that central topics and spatio-temporal patterns could be mapped (Figure 5, Figure 6 and Figure 8). This approach did not yield results as high as more-elaborate methods for geocoding [52]. Nevertheless, it delivered comparably acceptable results with relatively low analytical effort compared to more computationally intensive and elaborated methods. In general, it must be assumed that a certain amount of such user-generated content has no geographical references at all and cannot be geocoded.
According to Hahmann et al.’s insights [50], the precision of georeferenced tweets depends on the topic and the geographical scale. It remains open to what exact extent this is true for the toponymsand central topic clusters studied in this work. However, our analysis also indicates that crisis communication on the studied storm event takes place on a variety of geographical scales, with most references being very specific and assigned to the smallest administrative scale.
Using artificial areas, the analysis of deeper spatial patterns and linkages to other geospatial data, such as weather data or socio-economic data, was enabled. As a prerequisite, we adapted the recommendations of Birch et al. [58]. Accordingly, hexagons as reference geometry kept the ecological fallacies to a minimum. Thus, this study differs fundamentally from work that focuses exclusively on the temporal and content aspects of a Twitter corpus.
As other research on Twitter data commonly uses the temporal density or co-occurrence of similar content as an indicator of the importance of the communicated phenomenon [26,30], we also examined the temporal structure of the dataset used in this regard (Figure 5). Through the temporal analysis of the different resolutions, a typical diurnal cycle in user activity was identified (Figure 7), which can initially be observed independently of the occurring wind speeds. However, on a coarser scale, a comparison of the daily totals showed a clear signal that the crowd reacted simultaneously to changing wind speeds, with more or less event-related messages.
This evidence highlights the importance of considering the time-of-day effect, or the activity phases of people in their daily routines, when evaluating reporting frequencies. This inherent temporal pattern in the data has particular consequences for applied approaches, in which users act as real-time sensors to observe natural phenomena [42], since no notification is given when the sensor is “asleep.” In addition to these temporal artefacts, mapped communication indicates that tweets occur regionally and are also shaped by population distribution.
Existing knowledge about the frequency of reporting of storm events can be confirmed [5,67]; the Twitter user crowd pays attention to wind events, and they report significantly more during such an event. On the basis of the studied dataset, it could be shown for Germany what Spruce et al. [68] have already proven for several storm events in the United Kingdom and Ireland, i.e., that peaks of Twitter activity can be observed during a storm event. In turn, these logical and substantively valid structures allow conclusions on the practical applicability of such approaches. In addition to the aforementioned studies, the current study further suggests that a measurable societal echo can also be explained by the population distribution. However, this evidence should be investigated in further studies. The authors suggest that the relationship between settlement size and significant signal response should be further investigated, including whether these differences are attributable to urban–rural regimes.
When analysing big data, the context in which the data are produced needs to be equally scrutinized with the processing of these data because results are highly dependent on how data are produced. The socioeconomic characteristics of Twitter’s users should, for example, be considered for subsequent studies. While the technical infrastructure offered by Twitter for data retrieval is highly formalized through a set of query routines, almost none of the socioeconomic information is available on the data producers. However, because of the dedicated digital access, it should be assumed that the crowd is not composed of a representative cross-section of society but a specific subset of those who have a particular affinity for such forms of communication and its digital content [69]. Accordingly, the representativeness of the results presented here is limited and should be validated in further case studies on Central-European storms. However, due to Twitter’s popularity and high user numbers, it can be assumed that the spatial distribution of population density is approximately represented by the digital society of the microblogging platform.

5. Conclusions

Although some work on user-generated content in the context of hurricanes exists for the Central and North American regions, the evidence on the relationship between strong wind events and the production of AGI for the regional context of Central Europe is still very thin. When exploring real-time crisis communication, the exemplary dataset of AGI used in this work highlights how spatio-temporal and thematic patterns of a severe storm event can impact users of Web-2.0 technologies, specifically through the public Twitter community. Through the elaborate georeferencing of textual information, regional hotspots were identified. It was found that communication during the studied storm event was often generated from regional parts of Germany and not on a macro level, e.g., country-wide.
In addition, systematic spatial aggregation of the studied data made it possible to cross-correlate the crowd’s information with other spatial data such as wind patterns and the population distribution. This information could be used to determine to what extent society has been affected by the storm event. An informed assumption can be made that both population density and measured wind speeds have an influence on the communication frequency of the storm. The societal echo in terms of temporal density or high reporting activity of severe weather events could be used as an indicator of the severity of an extreme weather event. For instance, if people were affected by severe winds in real time, public shared communication signalled their severity. One could surmise that the common definition is illustrated according to which natural hazards only become disasters when people are affected by them.
Finally, this study demonstrates how AGI can be used to gain insight into societal perceptions during severe weather events or natural disasters, derived from spatio-temporal datasets. It provides an appropriate contribution to the communicative concern of society for the regional level on the basis of a typical storm event for the regional context of Central Europe, which occurs regularly and causes damage. Interestingly, the crowd produced a very realistic and descriptive picture of the severe weather event. Moreover, the usage of wide-ranging and various perceptions of an extreme weather event can broaden narrow views of remote experts and their evaluations, which are usually based on modelled weather data. Further developments of such techniques in the field of Crisis Informatics could be implemented to increase the efficiency and capacity of disaster management during an extreme weather event.

Author Contributions

Conceptualization, Rafael Hologa; methodology, Rafael Hologa; software, Rafael Hologa; validation, Rafael Hologa; formal analysis, Rafael Hologa; investigation, Rafael Hologa; resources, Rafael Hologa; data curation, Rafael Hologa; writing—original draft preparation, Rafael Hologa; writing—review and editing, Rüdiger Glaser; visualization, Rafael Hologa; supervision, Rüdiger Glaser; project administration, Rafael Hologa. All authors have read and agreed to the published version of the manuscript.

Funding

The article processing charge was funded by the Baden-Wuerttemberg Ministry of Science, Research, and Art and the University of Freiburg in the Open Access Publishing funding programme.

Informed Consent Statement

Not applicable.

Acknowledgments

The authors are grateful for the support from Joshua Heipel. We would like to thank Steffen Gutmann, Kyle Egerer and Jacqueline R. Rowlands for their proofreading and language advice. In addition, we would also like to show our gratitude to the editor and the four anonymous reviewers for their insights and recommendations.

Conflicts of Interest

The authors declare no conflict of interest.

Abbreviations

The following abbreviations are used in this manuscript:
AGIAmbient Geospatial Information
APIApplication Programming Interface
CGICitizen Contributed Geographic Information
GFSGlobal Forecast System
GISGeographic Information System
GHSLGlobal Human Settlement Layer
IRInformation Retrieval
LAULocal Administrative Units
LSALatent Semantic Analysis
MAUPModifiable Areal Unit Problem
NUTSNomenclature of Territorial Units for Statistics
RR Programming Language and Free Software Environment
VGIVolunteered Geographic Information

References

  1. O’Reilly, T. What is Web 2.0: Design Patterns and Business Models for the Next Generation of Software. Commun. Strateg. 2007, 1, 17–37. [Google Scholar]
  2. Hyvärinen, O.; Saltikoff, E. Social Media as a Source of Meteorological Observations. Mon. Weather. Rev. 2010, 138, 3175–3184. [Google Scholar] [CrossRef]
  3. Niforatos, E.; Vourvopoulos, A.; Langheinrich, M. Understanding the potential of human-machine crowdsourcing for weather data. Int. J. Hum. Comput. Stud. 2017, 102, 54–68. [Google Scholar] [CrossRef]
  4. Ratter, B.M.; Philipp, K.H.; Von Storch, H. Between hype and decline: Recent trends in public perception of climate change. Environ. Sci. Policy 2012, 18, 3–8. [Google Scholar] [CrossRef] [Green Version]
  5. Sisco, M.R.; Bosetti, V.; Weber, E.U. When do extreme weather events generate attention to climate change? Clim. Chang. 2017, 143, 227–241. [Google Scholar] [CrossRef]
  6. Shao, W.; Goidel, K. Seeing is Believing? An Examination of Perceptions of Local Weather Conditions and Climate Change Among Residents in the U.S. Gulf Coast. Risk Anal. 2016, 36, 2136–2157. [Google Scholar] [CrossRef]
  7. Starbird, K.; Palen, L. “Voluntweeters”. In Proceedings of the 2011 Annual Conference on Human Factors in Computing Systems—CHI ’11; ACM Press: New York, NY, USA, 2011; p. 1071. [Google Scholar] [CrossRef]
  8. See, L.; Mooney, P.; Foody, G.; Bastin, L.; Comber, A.; Estima, J.; Fritz, S.; Kerle, N.; Jiang, B.; Laakso, M.; et al. Geo-Information Crowdsourcing, Citizen Science or Volunteered Geographic Information? The Current State of Crowdsourced Geographic Information. ISPRS Int. J. Geo-Inf. 2016, 5, 55. [Google Scholar] [CrossRef]
  9. Harvey, F. To Volunteer or to Contribute Locational Information? Towards Truth in Labeling for Crowdsourced Geographic Information. In Crowdsourcing Geographic Knowledge: Volunteered Geographic Information (VGI) in Theory and Practice; Sui, D., Elwood, S., Goodchild, M., Eds.; Springer: Dordrecht, The Netherlands, 2013; pp. 31–42. [Google Scholar] [CrossRef]
  10. Goodchild, M.F. Citizens as sensors: The world of volunteered geography. GeoJournal 2007, 69, 211–221. [Google Scholar]
  11. Fischer, F. VGI as Big Data. A New but Delicate Geographic Data-Source. GeoInformatics 2012, 15, 46–47. [Google Scholar]
  12. Spyratos, S.; Lutz, M.; Pantisano, F. Characteristics of Citizen—Contributed Geographic Information. In Proceedings of the International Conference on Geographic Information Science, Castellón, Spain, 3–6 June 2014; pp. 3–6. [Google Scholar] [CrossRef]
  13. Stefanidis, A.; Crooks, A.; Radzikowski, J. Harvesting Ambient Geospatial Information from social media feeds. GeoJournal 2013, 78, 319–338. [Google Scholar] [CrossRef]
  14. Palen, L.; Starbird, K.; Vieweg, S.; Hughes, A. Twitter-based Information Distribution during the 2009 Red River Valley Flood Threat by. Bull. Am. Soc. Inf. Sci. Technol. 2010, 36, 13–18. [Google Scholar] [CrossRef]
  15. Ghermandi, A.; Sinclair, M. Passive crowdsourcing of social media in environmental research: A systematic map. Glob. Environ. Chang. 2019, 55, 36–47. [Google Scholar] [CrossRef]
  16. Poblete, B.; Guzman, J.; Maldonado, J.; Tobar, F. Robust Detection of Extreme Events Using Twitter: Worldwide Earthquake Monitoring. IEEE Trans. Multimed. 2018, 20, 2551–2561. [Google Scholar] [CrossRef]
  17. Mendoza, M.; Poblete, B.; Valderrama, I. Nowcasting earthquake damages with Twitter. EPJ Data Sci. 2019, 8, 1–23. [Google Scholar] [CrossRef] [Green Version]
  18. Palen, L.; Vieweg, S.; Liu, S.B.; Hughes, A.L. Crisis in a Networked World. Soc. Sci. Comput. Rev. 2009, 27, 467–480. [Google Scholar] [CrossRef]
  19. Meier, P. Digital Humanitarians: How Big Data Is Changing the Face of Humanitarian Response; Routledge: London, UK, 2015; pp. 1–259. [Google Scholar] [CrossRef]
  20. Castillo, C. Big Crisis Data: Social Media in Disasters and Time-Critical Situations; Cambridge University Press: New York, NY, USA, 2016; pp. 1–212. [Google Scholar] [CrossRef]
  21. Palen, L.; Anderson, K.M. Crisis informatics: New data for extraordinary times. Science 2016, 353, 224–225. [Google Scholar] [CrossRef] [Green Version]
  22. Li, G.; Zhao, J.; Murray, V.; Song, C.; Zhang, L. Gap analysis on open data interconnectivity for disaster risk research. Geo-Spat. Inf. Sci. 2019, 22, 45–58. [Google Scholar] [CrossRef] [Green Version]
  23. Kitchin, R. Big data and human geography: Opportunities, challenges and risks. Dialogues Hum. Geogr. 2013, 3, 262–267. [Google Scholar] [CrossRef]
  24. Graham, M.; Shelton, T. Geography and the future of big data, big data and the future of geography. Dialogues Hum. Geogr. 2013, 3, 255–261. [Google Scholar] [CrossRef] [Green Version]
  25. De Longueville, B.; Smith, R.S.; Luraschi, G. OMG, from here, I can see the flames! In Proceedings of the 2009 International Workshopon Location Based Social Networks (LBSN), Seattle, WA, USA, 3 November 2009; pp. 73–80. [Google Scholar] [CrossRef]
  26. Sakaki, T.; Okazaki, M.; Matsuo, Y. Earthquake shakes Twitter users: Real-time event detection by social sensors. In Proceedings of the 19th International Conference on World Wide Web, Raleigh, NC, USA, 26–30 April 2010; ACM: New York, NY, USA, 2010; pp. 851–860. [Google Scholar] [CrossRef]
  27. Verma, S.; Vieweg, S.; Corvey, W.J.; Palen, L.; Martin, J.H.; Palmer, M.; Schram, A.; Anderson, K.M. Natural Language Processing to the Rescue? Extracting “Situational Awareness” Tweets During Mass Emergency. In Proceedings of the Fifth International AAAI Conference on Weblogs and Social Media, Catalonia, Spain, 17–21 July 2011; pp. 385–392. [Google Scholar]
  28. Imran, M.; Castillo, C.; Diaz, F.; Vieweg, S. Processing Social Media Messages in Mass Emergency: Survey Summary. In Companion Proceedings of the the Web Conference 2018; International World Wide Web Conferences Steering Committee: Geneva, Switzerland, 2018; pp. 507–511. [Google Scholar] [CrossRef] [Green Version]
  29. Anderson, J.; Casas Saez, G.; Anderson, K.; Palen, L.; Morss, R. Incorporating Context and Location Into Social Media Analysis: A Scalable, Cloud-Based Approach for More Powerful Data Science. In Proceedings of the 52nd Hawaii International Conference on System Sciences, Maui, HI, USA, 8–11 January 2019; Volume 6, pp. 2274–2283. [Google Scholar] [CrossRef] [Green Version]
  30. Kryvasheyeu, Y.; Chen, H.; Obradovich, N.; Moro, E.; Van Hentenryck, P.; Fowler, J.; Cebrian, M. Rapid assessment of disaster damage using social media activity. Sci. Adv. 2016, 2, 1–12. [Google Scholar] [CrossRef] [PubMed] [Green Version]
  31. Eilander, D.; Trambauer, P.; Wagemaker, J.; Van Loenen, A. Harvesting Social Media for Generation of Near Real-time Flood Maps. Procedia Eng. 2016, 154, 176–183. [Google Scholar] [CrossRef] [Green Version]
  32. Kent, J.D.; Capello, H.T., Jr. Spatial patterns and demographic indicators of effective social media content during theHorsethief Canyon fire of 2012. Cartogr. Geogr. Inf. Sci. 2013, 40, 78–89. [Google Scholar] [CrossRef]
  33. Dong, Z.S.; Meng, L.; Christenson, L.; Fulton, L. Social media information sharing for natural disaster response. Nat. Hazards 2021, 107, 2077–2104. [Google Scholar] [CrossRef]
  34. Morss, R.E.; Demuth, J.L.; Lazrus, H.; Palen, L.; Barton, C.M.; Davis, C.A.; Snyder, C.; Wilhelmi, O.V.; Anderson, K.M.; Ahijevych, D.A.; et al. Hazardous weather prediction and communication in the modern information environment. Bull. Am. Meteorol. Soc. 2017, 98, 2653–2674. [Google Scholar] [CrossRef] [Green Version]
  35. Holderness, T.; Turpin, E. From Social Media to GeoSocial Intelligence: Crowdsourcing Civic Co-management for Flood Response in Jakarta, Indonesia. In Social Media for Government Services; Springer International Publishing: Cham, Switzerland, 2015; pp. 115–133. [Google Scholar] [CrossRef]
  36. Resch, B.; Usländer, F.; Havas, C. Combining machine-learning topic models and spatiotemporal analysis of social media data for disaster footprint and damage assessment. Cartogr. Geogr. Inf. Sci. 2018, 45, 362–376. [Google Scholar] [CrossRef] [Green Version]
  37. Niforatos, E.; Vourvopoulos, A.; Langheinrich, M. ‘Weather With You’: Evaluating Report Reliability in Weather Crowdsourcing. In Proceedings of the 14th International Conference on Mobile and Ubiquitous Multimedia, Linz, Austria, 30 November–2 December 2015; pp. 152–162. [Google Scholar] [CrossRef]
  38. Anderson, J.; Soden, R.; Keegan, B.; Palen, L.; Anderson, K.M. The Crowd is the Territory: Assessing Quality in Peer-Produced Spatial Data During Disasters. Int. J. -Hum.-Comput. Interact. 2018, 34, 295–310. [Google Scholar] [CrossRef]
  39. Elwood, S.; Goodchild, M.F.; Sui, D.Z. Researching Volunteered Geographic Information: Spatial Data, Geographic Research, and New Social Practice. Ann. Assoc. Am. Geogr. 2012, 102, 571–590. [Google Scholar] [CrossRef]
  40. Ahmouda, A.; Hochmair, H.H.; Cvetojevic, S. Analyzing the effect of earthquakes on OpenStreetMap contribution patterns and tweeting activities. Geo-Spat. Inf. Sci. 2018, 21, 195–212. [Google Scholar] [CrossRef] [Green Version]
  41. Florczyk, A.J.; Corbane, C.; Ehrlich, D.; Freire, S.; Kemper, T.; Maffenini, L.; Melchiorri, M.; Pesaresi, M.; Politis, P.; Schiavina, M.; et al. GHSL Data Package 2019; Technical Report; EU: Luxembourg, 2019. [Google Scholar] [CrossRef]
  42. Leetaru, K.H.; Shaowen, W.; Guofeng, C.; Padmanabhan, A.; Shook, E. Mapping the global Twitter hearbeat: The geography of Twitter. First Monday 2013, 18, 5–6. [Google Scholar] [CrossRef]
  43. Zappavigna, M. Ambient affiliation: A linguistic perspective on Twitter. New Media Soc. 2011, 13, 788–806. [Google Scholar] [CrossRef] [Green Version]
  44. Kearney, M.W. rtweet: Collecting and analyzing Twitter data. J. Open Source Softw. 2019, 4, 1829. [Google Scholar] [CrossRef]
  45. Manning, C.D.; Raghavan, P.; Schutze, H. An Introduction to Information Retrieval; Cambridge University Press: Cambridge, UK, 2009; p. 569. [Google Scholar] [CrossRef]
  46. Zipf, G.K. Selected Studies of the Principle of Relative Frequency in Language; Harvard University Press: Cambridge, MA, USA, 2013. [Google Scholar]
  47. Evert, S.; Baroni, M. zipfR: Word Frequency Distributions in R. In Proceedings of the 45th Annual Meeting of the Association for Computational Linguistics, Posters and Demonstrations Sessions, Prague, Czech Republic, 25–27 June 2007; pp. 29–32. [Google Scholar]
  48. R Core Team. R: A Language and Environment for Statistical Computing; R Foundation for Statistical Computing: Vienna, Austria, 2016. [Google Scholar]
  49. He, W.; Zha, S.; Li, L. Social media competitive analysis and text mining: A case study in the pizza industry. Int. J. Inf. Manag. 2013, 33, 464–472. [Google Scholar] [CrossRef]
  50. Hahmann, S.; Purves, R.S.; Burghardt, D. Twitter location (Sometimes) matters: Exploring the relationship between georeferenced tweet content and nearby feature classes. J. Spat. Inf. Sci. 2014, 9, 1–36. [Google Scholar] [CrossRef] [Green Version]
  51. Ogie, R.I.; Forehead, H. Investigating the accuracy of georeferenced social media data for flood mapping: The PetaJakarta.org case study. In Proceedings of the 2017 4th International Conference on Information and Communication Technologies for Disaster Management, ICT-DM Münster, Germany, 11–13 December 2017; pp. 1–6. [Google Scholar] [CrossRef] [Green Version]
  52. Ribeiro, S.; Pappa, G.L. Strategies for combining Twitter users geo-location methods. GeoInformatica 2018, 22, 563–587. [Google Scholar] [CrossRef]
  53. Craglia, M.; Ostermann, F.; Spinsanti, L. Digital Earth from vision to practice: Making sense of citizen-generated content. Int. J. Digit. Earth 2012, 5, 398–416. [Google Scholar] [CrossRef]
  54. Granell, C.; Ostermann, F.O. Beyond data collection: Objectives and methods of research using VGI and geo-social media for disaster management. Comput. Environ. Urban Syst. 2016, 59, 231–243. [Google Scholar] [CrossRef]
  55. Zhang, C.; Fan, C.; Yao, W.; Hu, X.; Mostafavi, A. Social media for intelligent public information and warning in disasters: An interdisciplinary review. Int. J. Inf. Manag. 2019, 49, 190–207. [Google Scholar] [CrossRef]
  56. Robinson, D. Fuzzyjoin: Join Tables Together on Inexact Matching. 2020. R Package Version 0.1.6. Available online: https://cran.r-project.org/web/packages/fuzzyjoin/ (accessed on 26 August 2020).
  57. Goodchild, M.F. GIScience, geography, form, and process. Ann. Am. Assoc. Geogr. 2004, 94, 709–714. [Google Scholar]
  58. Birch, C.P.; Oom, S.P.; Beecham, J.A. Rectangular and hexagonal grids used for observation, experiment and simulation in ecology. Ecol. Model. 2007, 206, 347–359. [Google Scholar] [CrossRef]
  59. Global Forecast System Data. 2021. Available online: https://www.ncei.noaa.gov/products/weather-climate-models/global-forecast (accessed on 5 February 2021).
  60. Fernández-López, J.; Schliep, K. rWind: Download, edit and include wind data in ecological and evolutionary analysis. Ecography 2019, 42, 804–810. [Google Scholar] [CrossRef] [Green Version]
  61. Pebesma, E. Simple Features for R: Standardized Support for Spatial Vector Data. R J. 2018, 10, 439–446. [Google Scholar] [CrossRef] [Green Version]
  62. Wickham, H. ggplot2: Elegant Graphics for Data Analysis; Springer: New York, NY, USA, 2016. [Google Scholar]
  63. Silge, J.; Robinson, D. tidytext: Text Mining and Analysis Using Tidy Data Principles in R. J. Open Source Softw. 2016, 1, 37. [Google Scholar] [CrossRef] [Green Version]
  64. Müller, K.; Wickham, H. tibble: Simple Data Frames. 2020. Available online: https://cran.r-project.org/package=tibble (accessed on 2 May 2021).
  65. Andrienko, G.; Andrienko, N.; Bosch, H.; Ertl, T.; Fuchs, G.; Jankowski, P.; Thom, D. Thematic patterns in georeferenced tweets through space-time visual analytics. Comput. Sci. Eng. 2013, 15, 72–82. [Google Scholar] [CrossRef]
  66. Crampton, J.W.; Graham, M.; Poorthuis, A.; Shelton, T.; Stephens, M.; Wilson, M.W.; Zook, M. Beyond the geotag: Situating ‘big data’ and leveraging the potential of the geoweb. Cartogr. Geogr. Inf. Sci. 2013, 40, 130–139. [Google Scholar] [CrossRef]
  67. Lachlan, K.A.; Spence, P.R.; Lin, X.; Greco, M.D. Screaming into the Wind: Examining the Volume and Content of Tweets Associated with Hurricane Sandy. Commun. Stud. 2014, 65, 500–518. [Google Scholar] [CrossRef]
  68. Spruce, M.; Arthur, R.; Williams, H.T. Using social media to measure impacts of named storm events in the United Kingdom and Ireland. Meteorol. Appl. 2020, 27, e1887. [Google Scholar] [CrossRef]
  69. Beevolve. An Exhaustive Study of Twitter Users Across the World—Social Media Analytics|Beevolve. 2012. Available online: http://www.beevolve.com/twitter-statistics (accessed on 15 August 2020).
Figure 1. Contextualization of Volunteered Geographic Information (VGI) and Ambient Geospatial Information (AGI) regarding data production (vertical axis) and data collection (horizontal axis).
Ijgi 10 00815 g001
Figure 2. The study area of Germany and its population density. Small light yellow dots represent a low population density, whereas large dark brown dots show areas with high population densities. The population data were aggregated according to hexagons 20 km-wide derived from the GHSL Data Package 2019 [41].
Ijgi 10 00815 g002
Figure 3. Request model for Information Retrieval (IR) of relevant tweets. The request was initially started with keywords derived qualitatively from past storm events. The loop request was stopped as soon as the top 5% of co-occurring terms were identical with the previously harvested terms.
Ijgi 10 00815 g003
Figure 4. The geographical information of the investigated terms were assigned by matching toponyms of Eurostat’s database.
Ijgi 10 00815 g004
Figure 5. Central topic clusters and their distributions between 15–21 January 2018.
Ijgi 10 00815 g005
Figure 6. Ridgeline plots of the five central topic clusters and their relative occurrence during the period under study.
Ijgi 10 00815 g006
Figure 7. Time-of-day effect of the dataset on a subtler temporal scale. The overlaid red dots predict the linear modelled trend of that daily activity pattern.
Ijgi 10 00815 g007
Figure 8. Spatially aggregated frequencies of georeferences according to hexagons 20 km-wide derived from toponyms of storm-related tweets between 17 and 19 January 2018. Small yellow dots indicate a low societal response, whereas large purple dots represent a strong societal echo in the considered zone.
Ijgi 10 00815 g008
Figure 9. Three-hourly wind speed maxima interpolated according to 20 km-wide hexagons based on data from the Global Forecast System (GFS) for the period between 17 and19 January 2018. Areas with small light blue dots represent slow daily maximum wind speeds for the days, whereas large dark purple dots show areas with high daily maximum wind speeds. Note that the recorded peak values measured with weather stations by the German Meteorological Service are significantly higher than the GFS data used.
Ijgi 10 00815 g009
Figure 10. The population density moderates the linear relationship of maximum wind speed and the societal echo during the storm peak phase of 18–19 January 2018. In regions with high and medium population density, a positive (r = 0.75, p ≤ 0.01) and moderate (r = 0.41, p≤ 0.01) relationship was observed. Whereas, in low populated regions, the relationships was weak (r = 0.16, p ≤ 0.01).
Ijgi 10 00815 g010
Table 1. Detected georeferences according to five administrative scales. The unique text bodies of the 13,241 tweets refer to multiple scales.
Spatial ScaleGeoreferencesTweets
Country (NUTS-0)528528
States (NUTS-1)21341899
Government regions (NUTS-2)31062886
Districts (NUTS-3)10,2147093
Municipalities (NUTS-4)31,55713,241
Total47,53925,647
Unique13,241
Table 2. Determined correlation coefficients (p ≤ 0.0001) for multiple temporal aggregation and spatial allocations.
HexagonwideCountrywide
Temporal
Aggregation
Tweets (n)∼
Population (%)
Tweets (n)∼
Wind Speed (Max)
Tweets (n)∼
Wind Speed (Max)
3 h0.200.150.54
6 h0.250.200.55
12 h0.300.250.60
24 h0.310.250.68
7 days0.460.01-
Table 3. Determined correlation coefficients (p ≤ 0.0001) for time intervals of day on a countywide scale.
Time Interval0–33–66–99–1212–1515–1818–2121–0
rho0.890.670.280.600.530.920.530.92
Publisher’s Note: MDPI stays neutral with regard to jurisdictional claims in published maps and institutional affiliations.

