
Identifying the Relatedness between Tourism Attractions from Online Reviews with Heterogeneous Information Network Embedding


Abstract
:1. Introduction
2. Materials and Methods
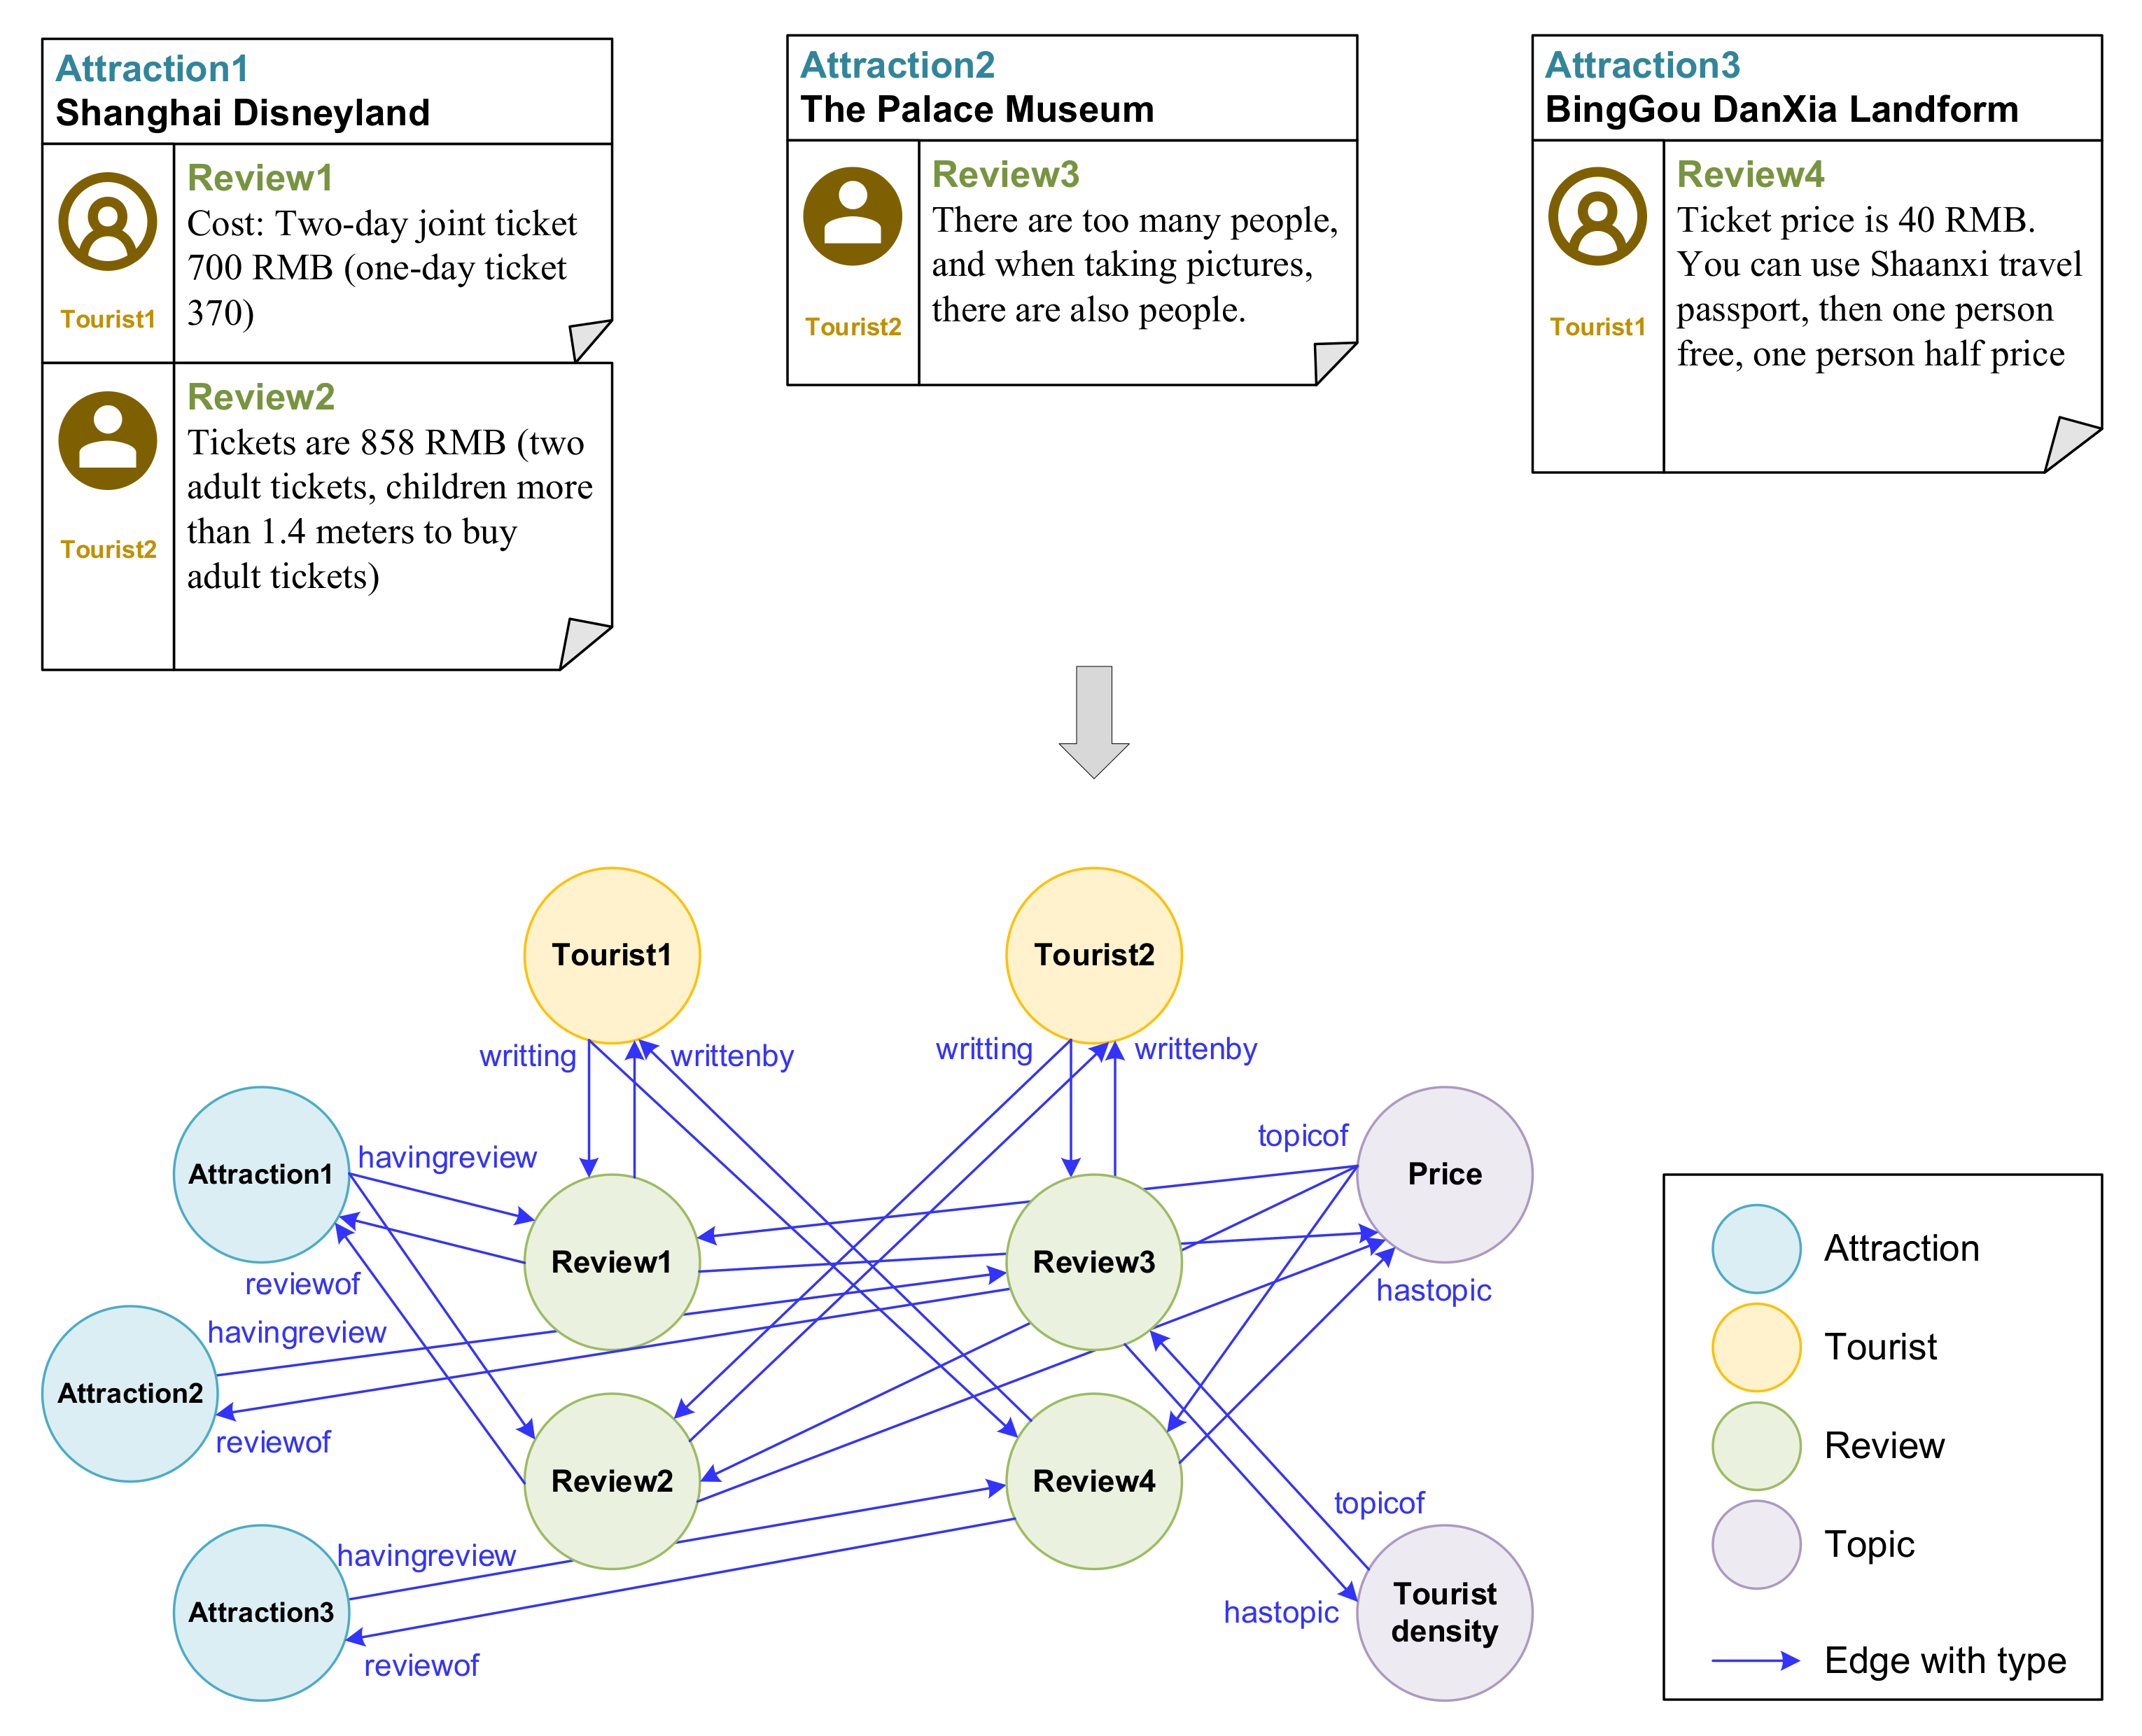
2.1. Online Review HIN Structure
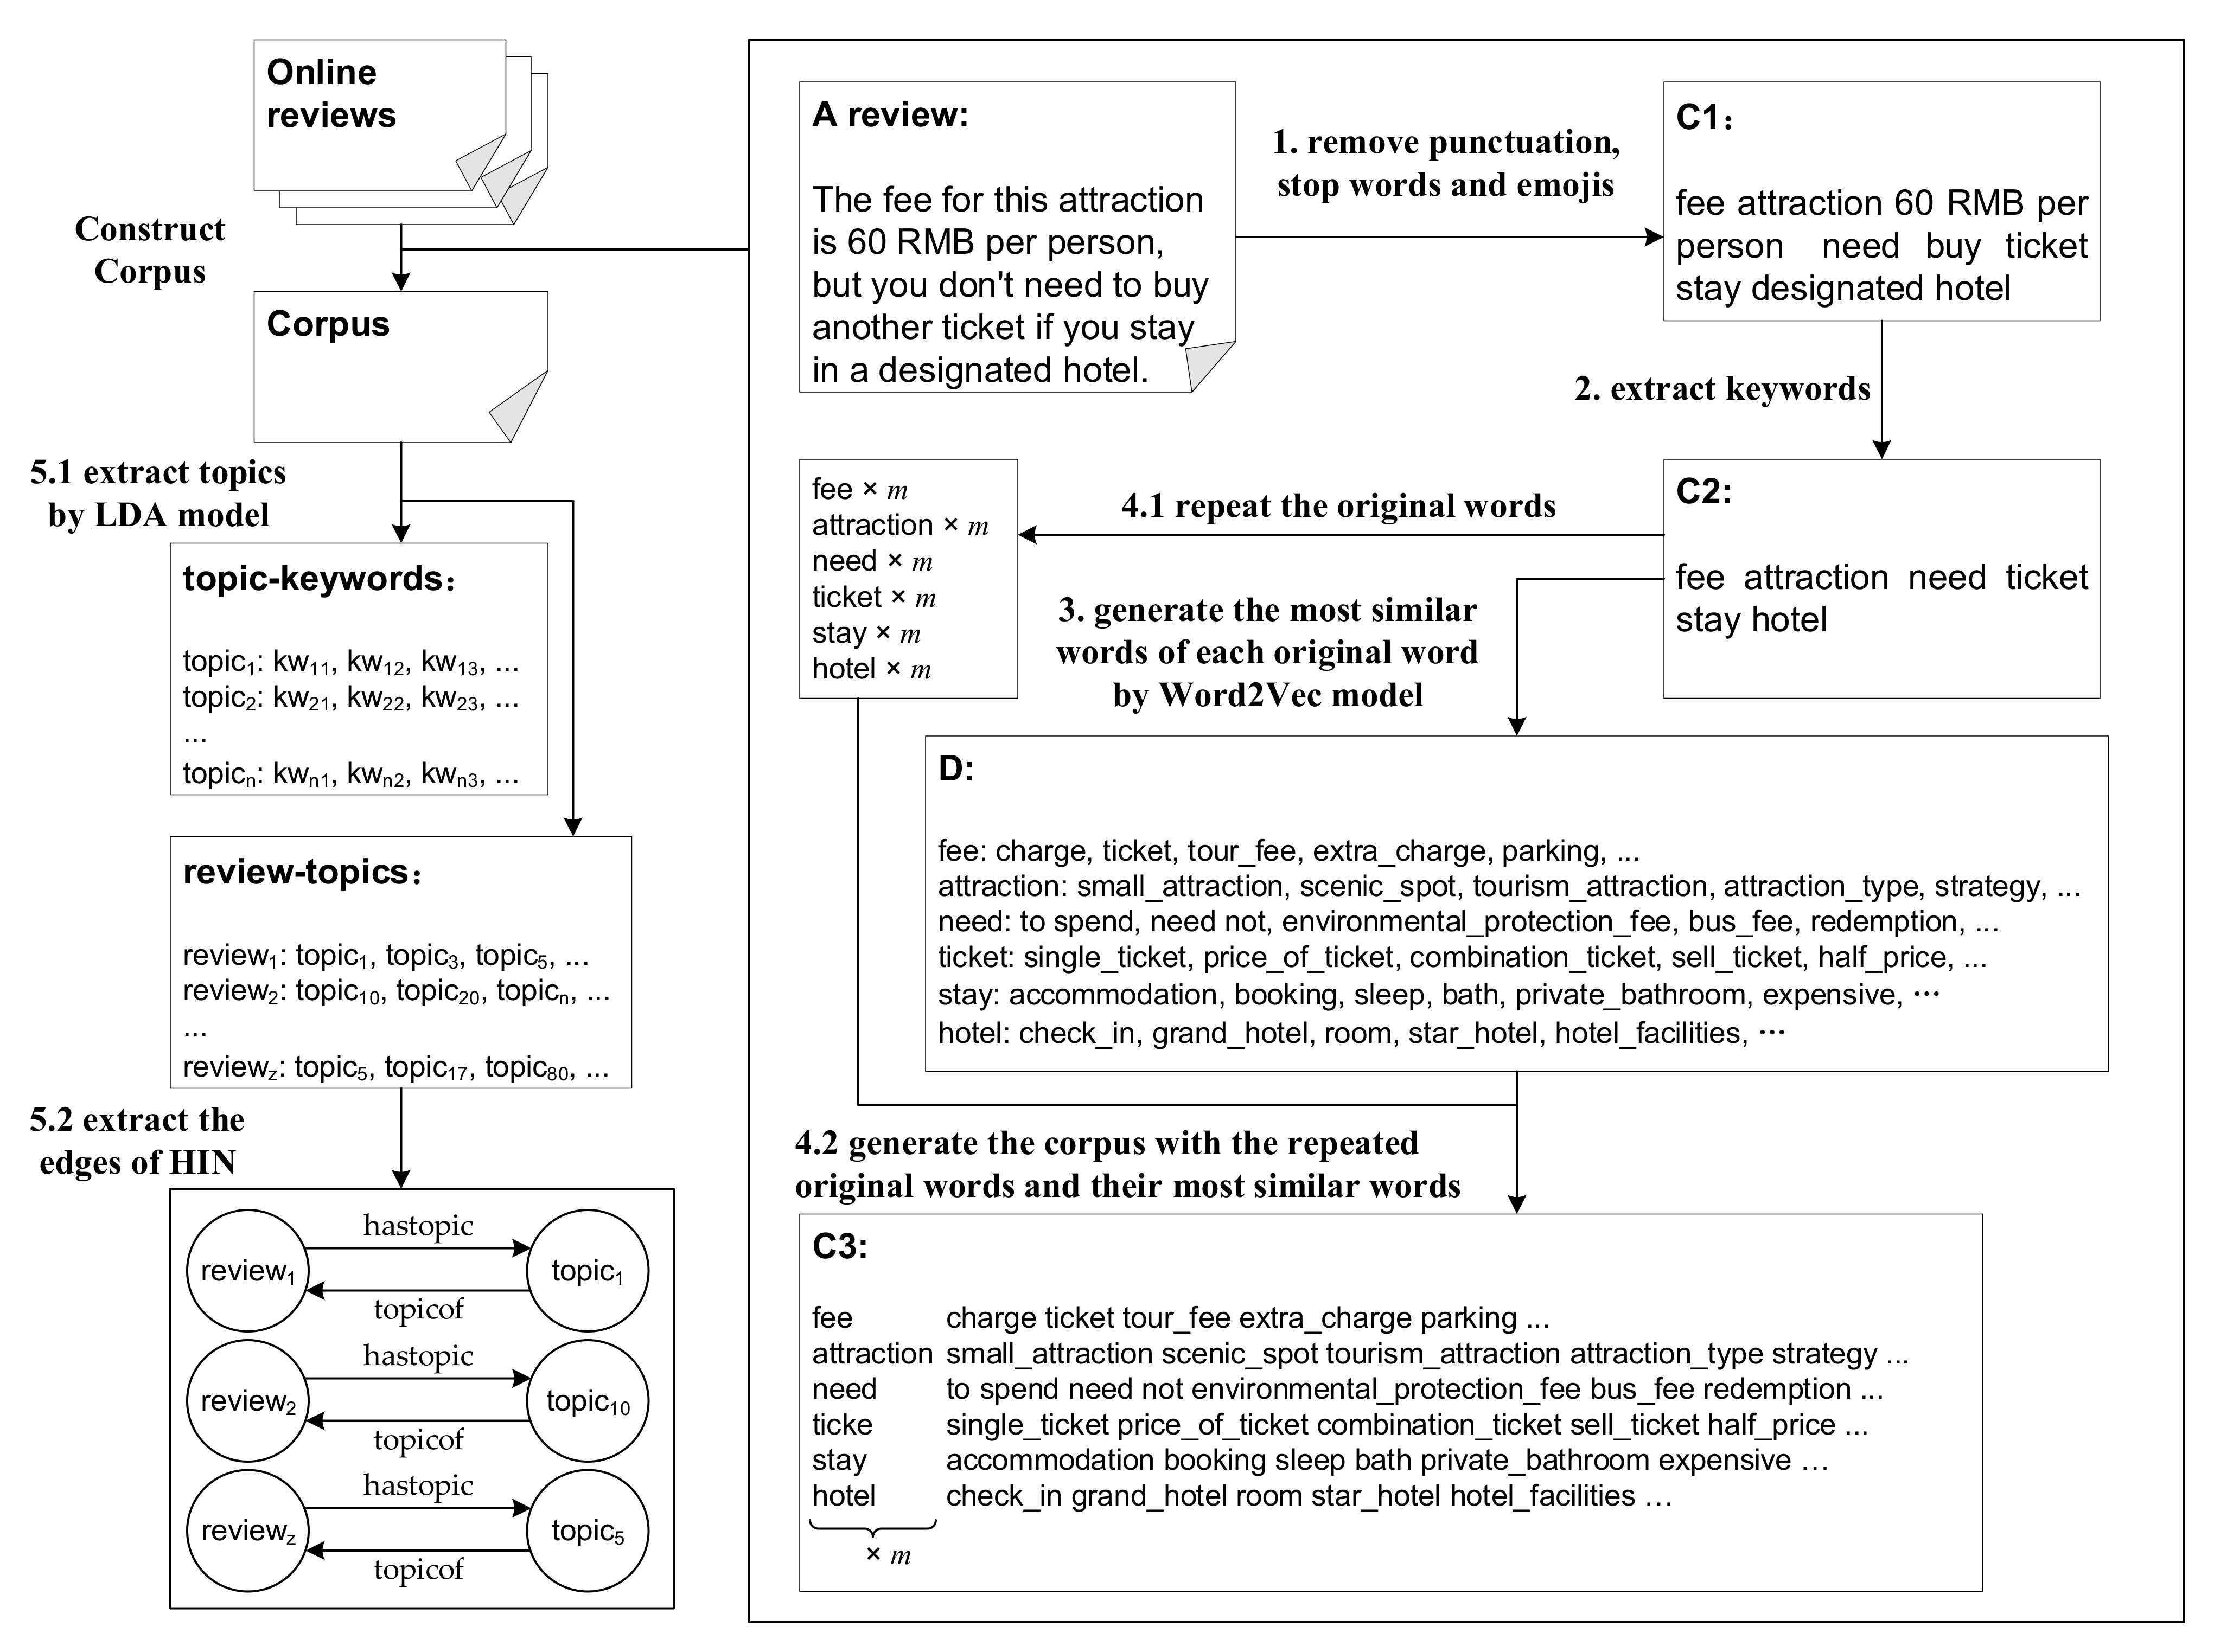
2.2. Topic Extraction and HIN Construction
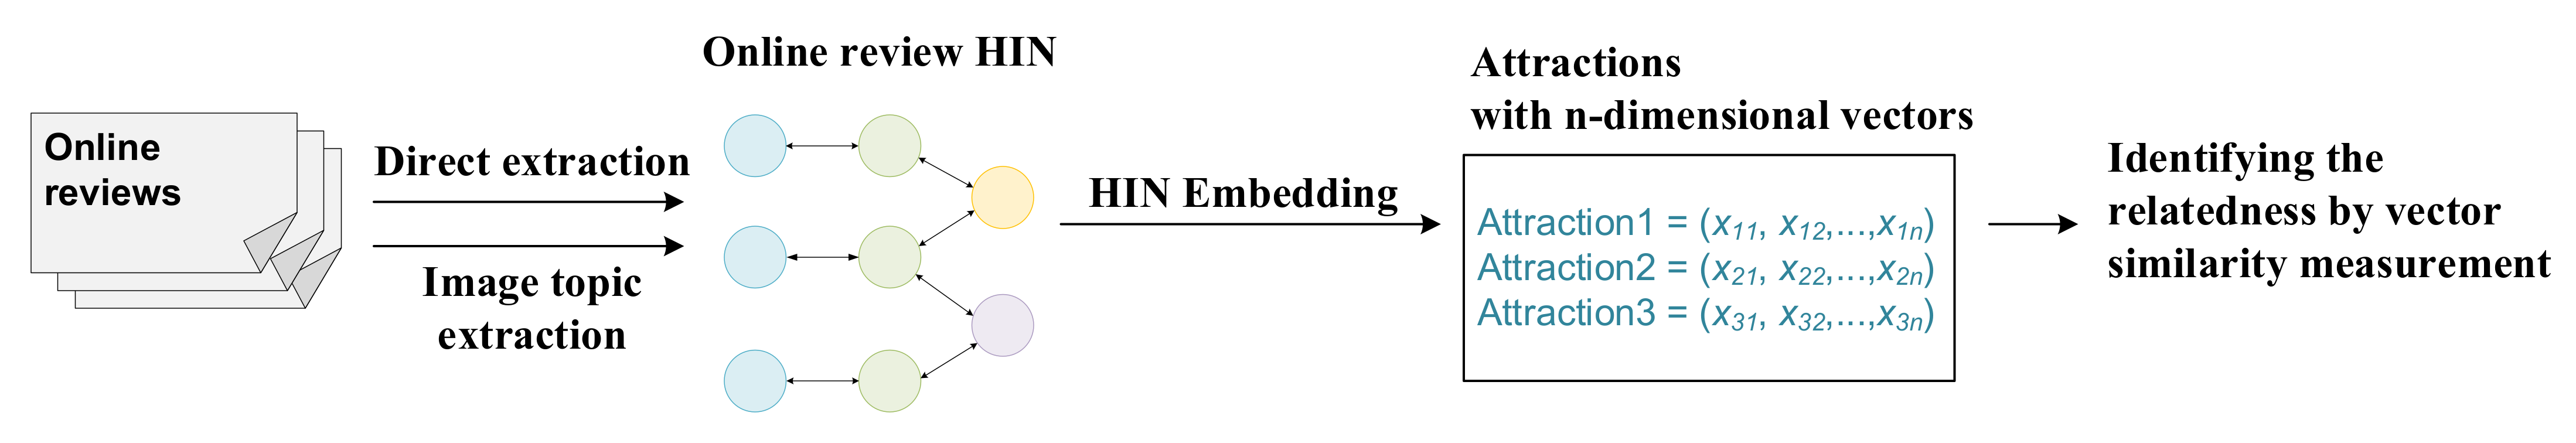
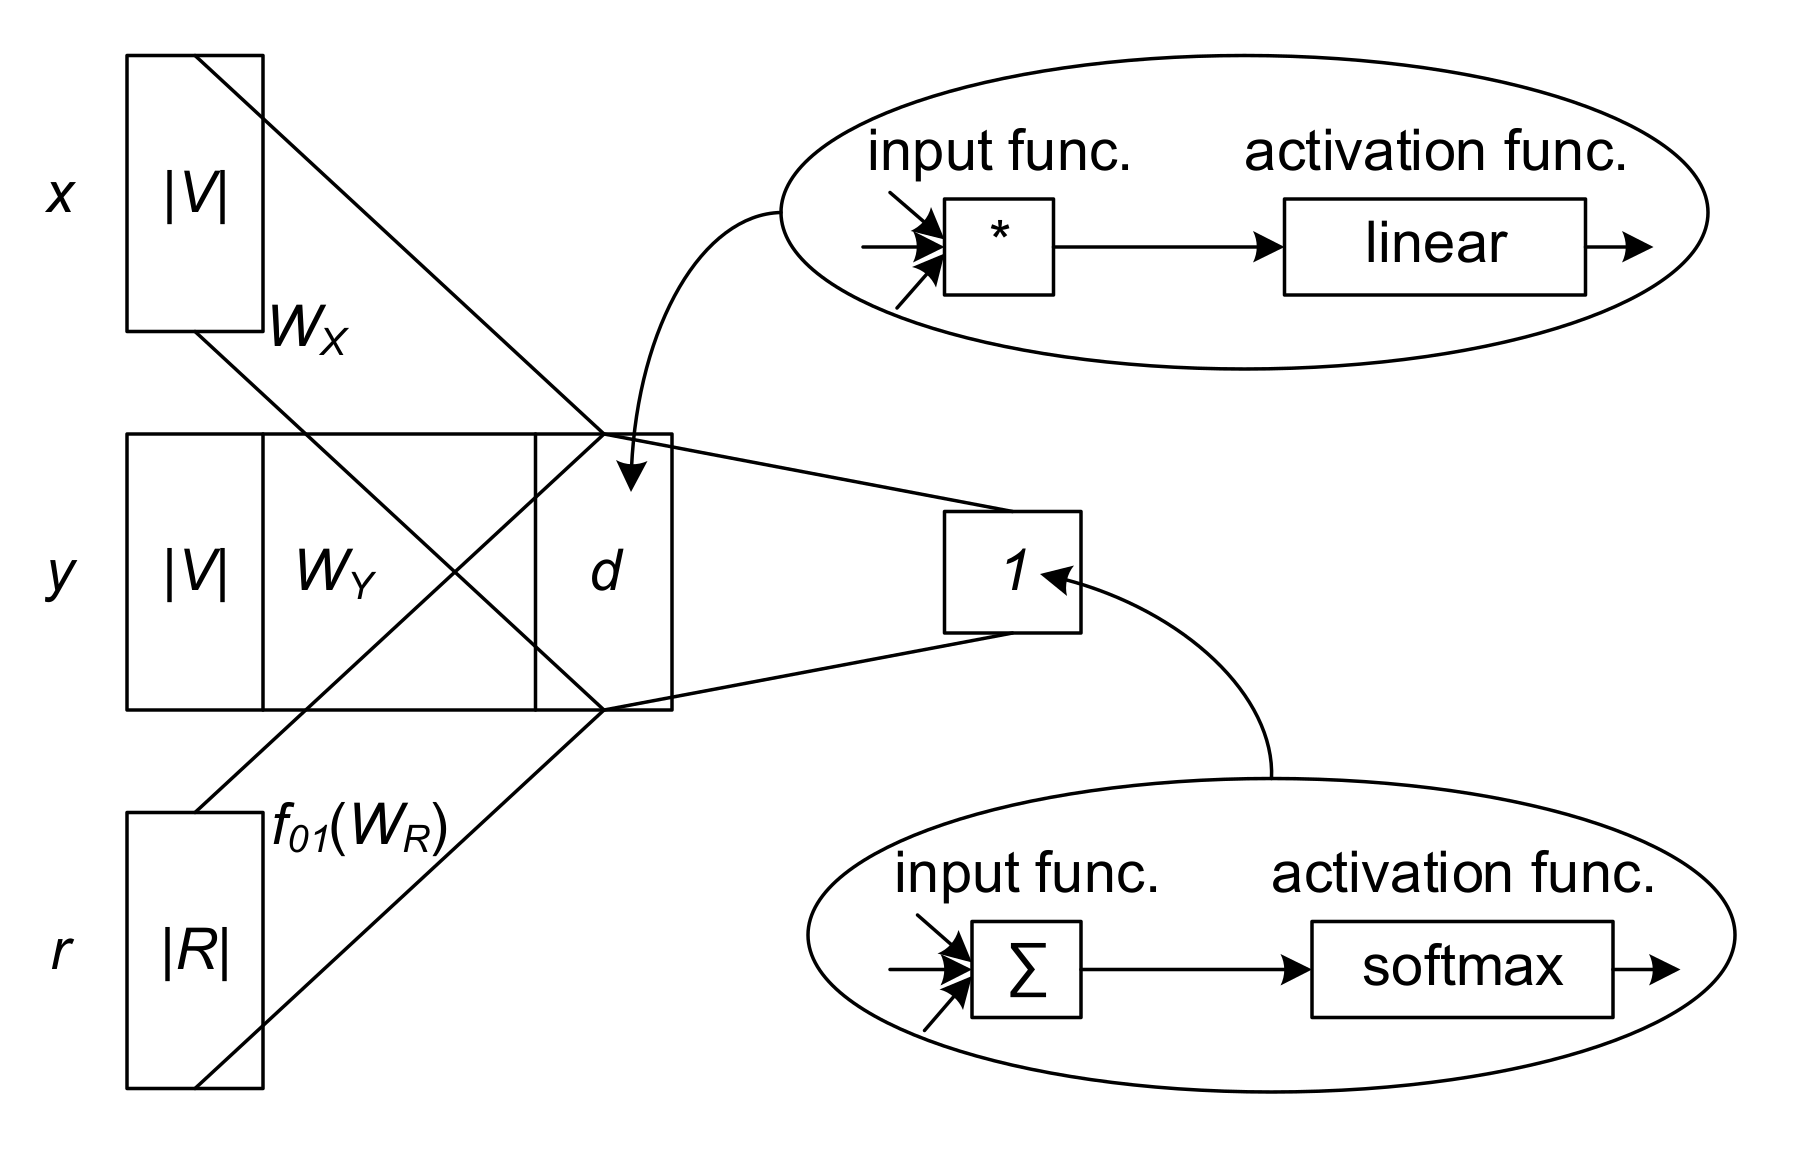
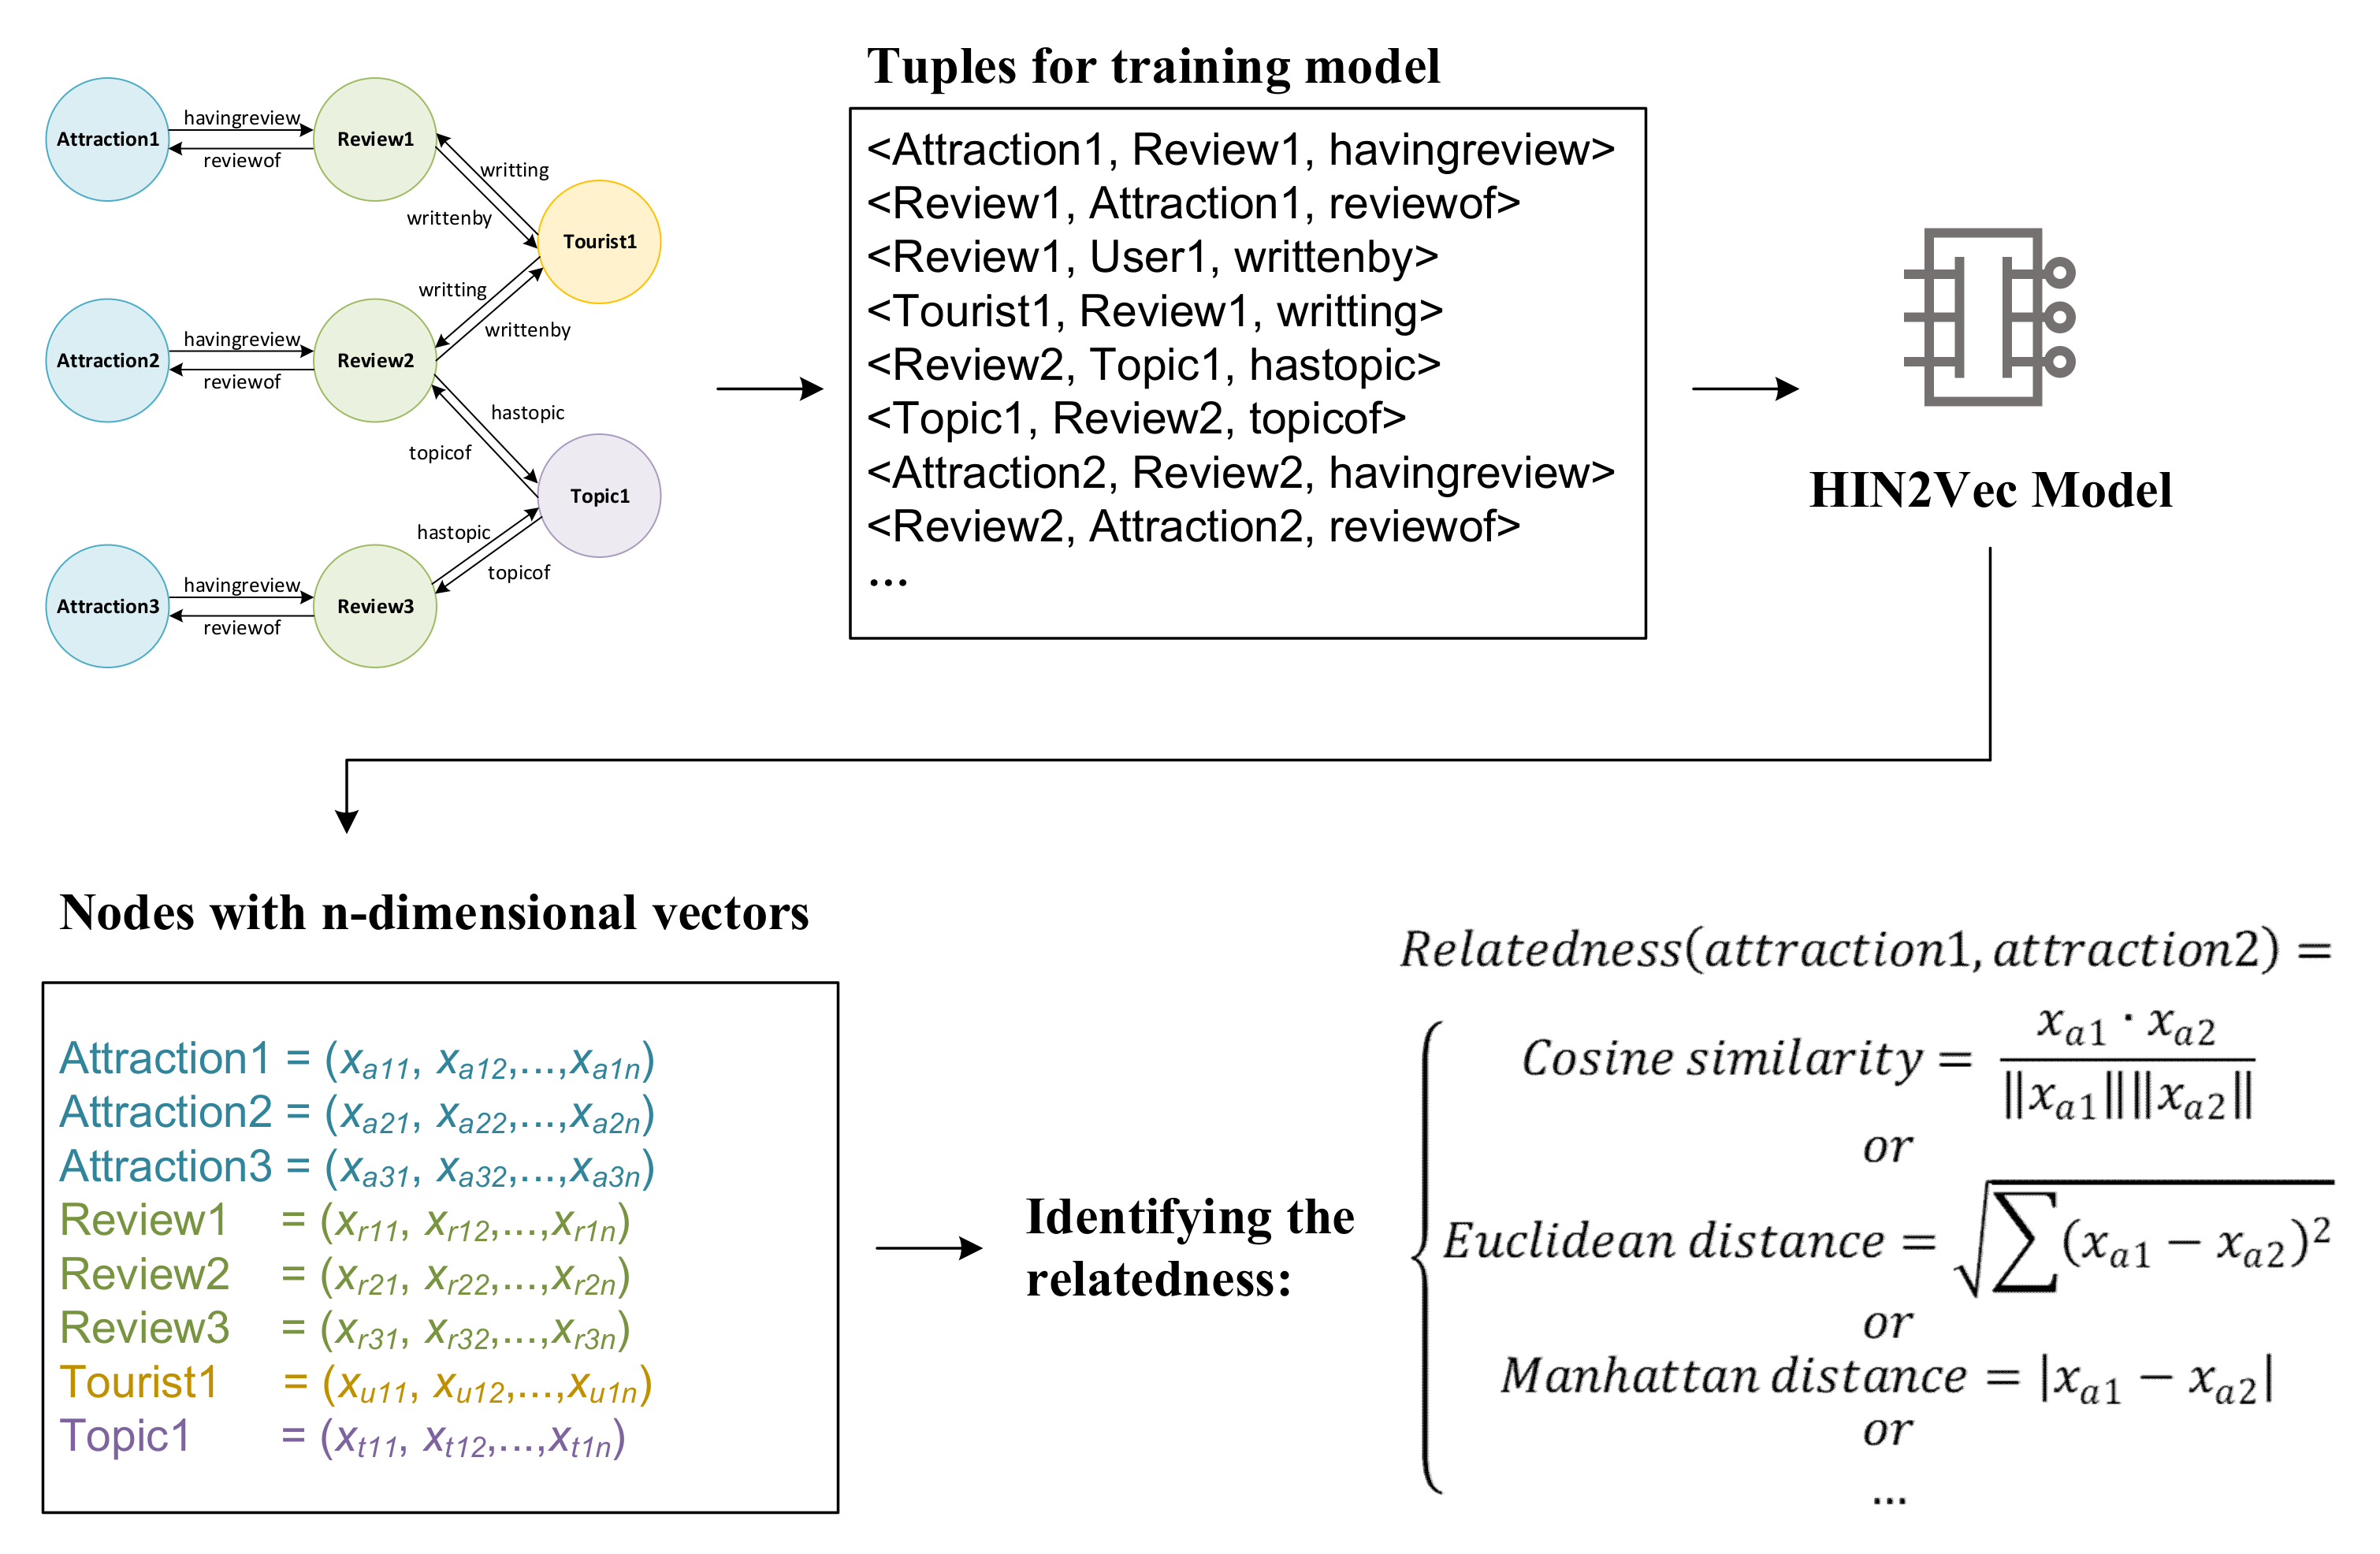
2.3. HIN Embedding and Identifying the Relatedness between Attractions
3. Case Study
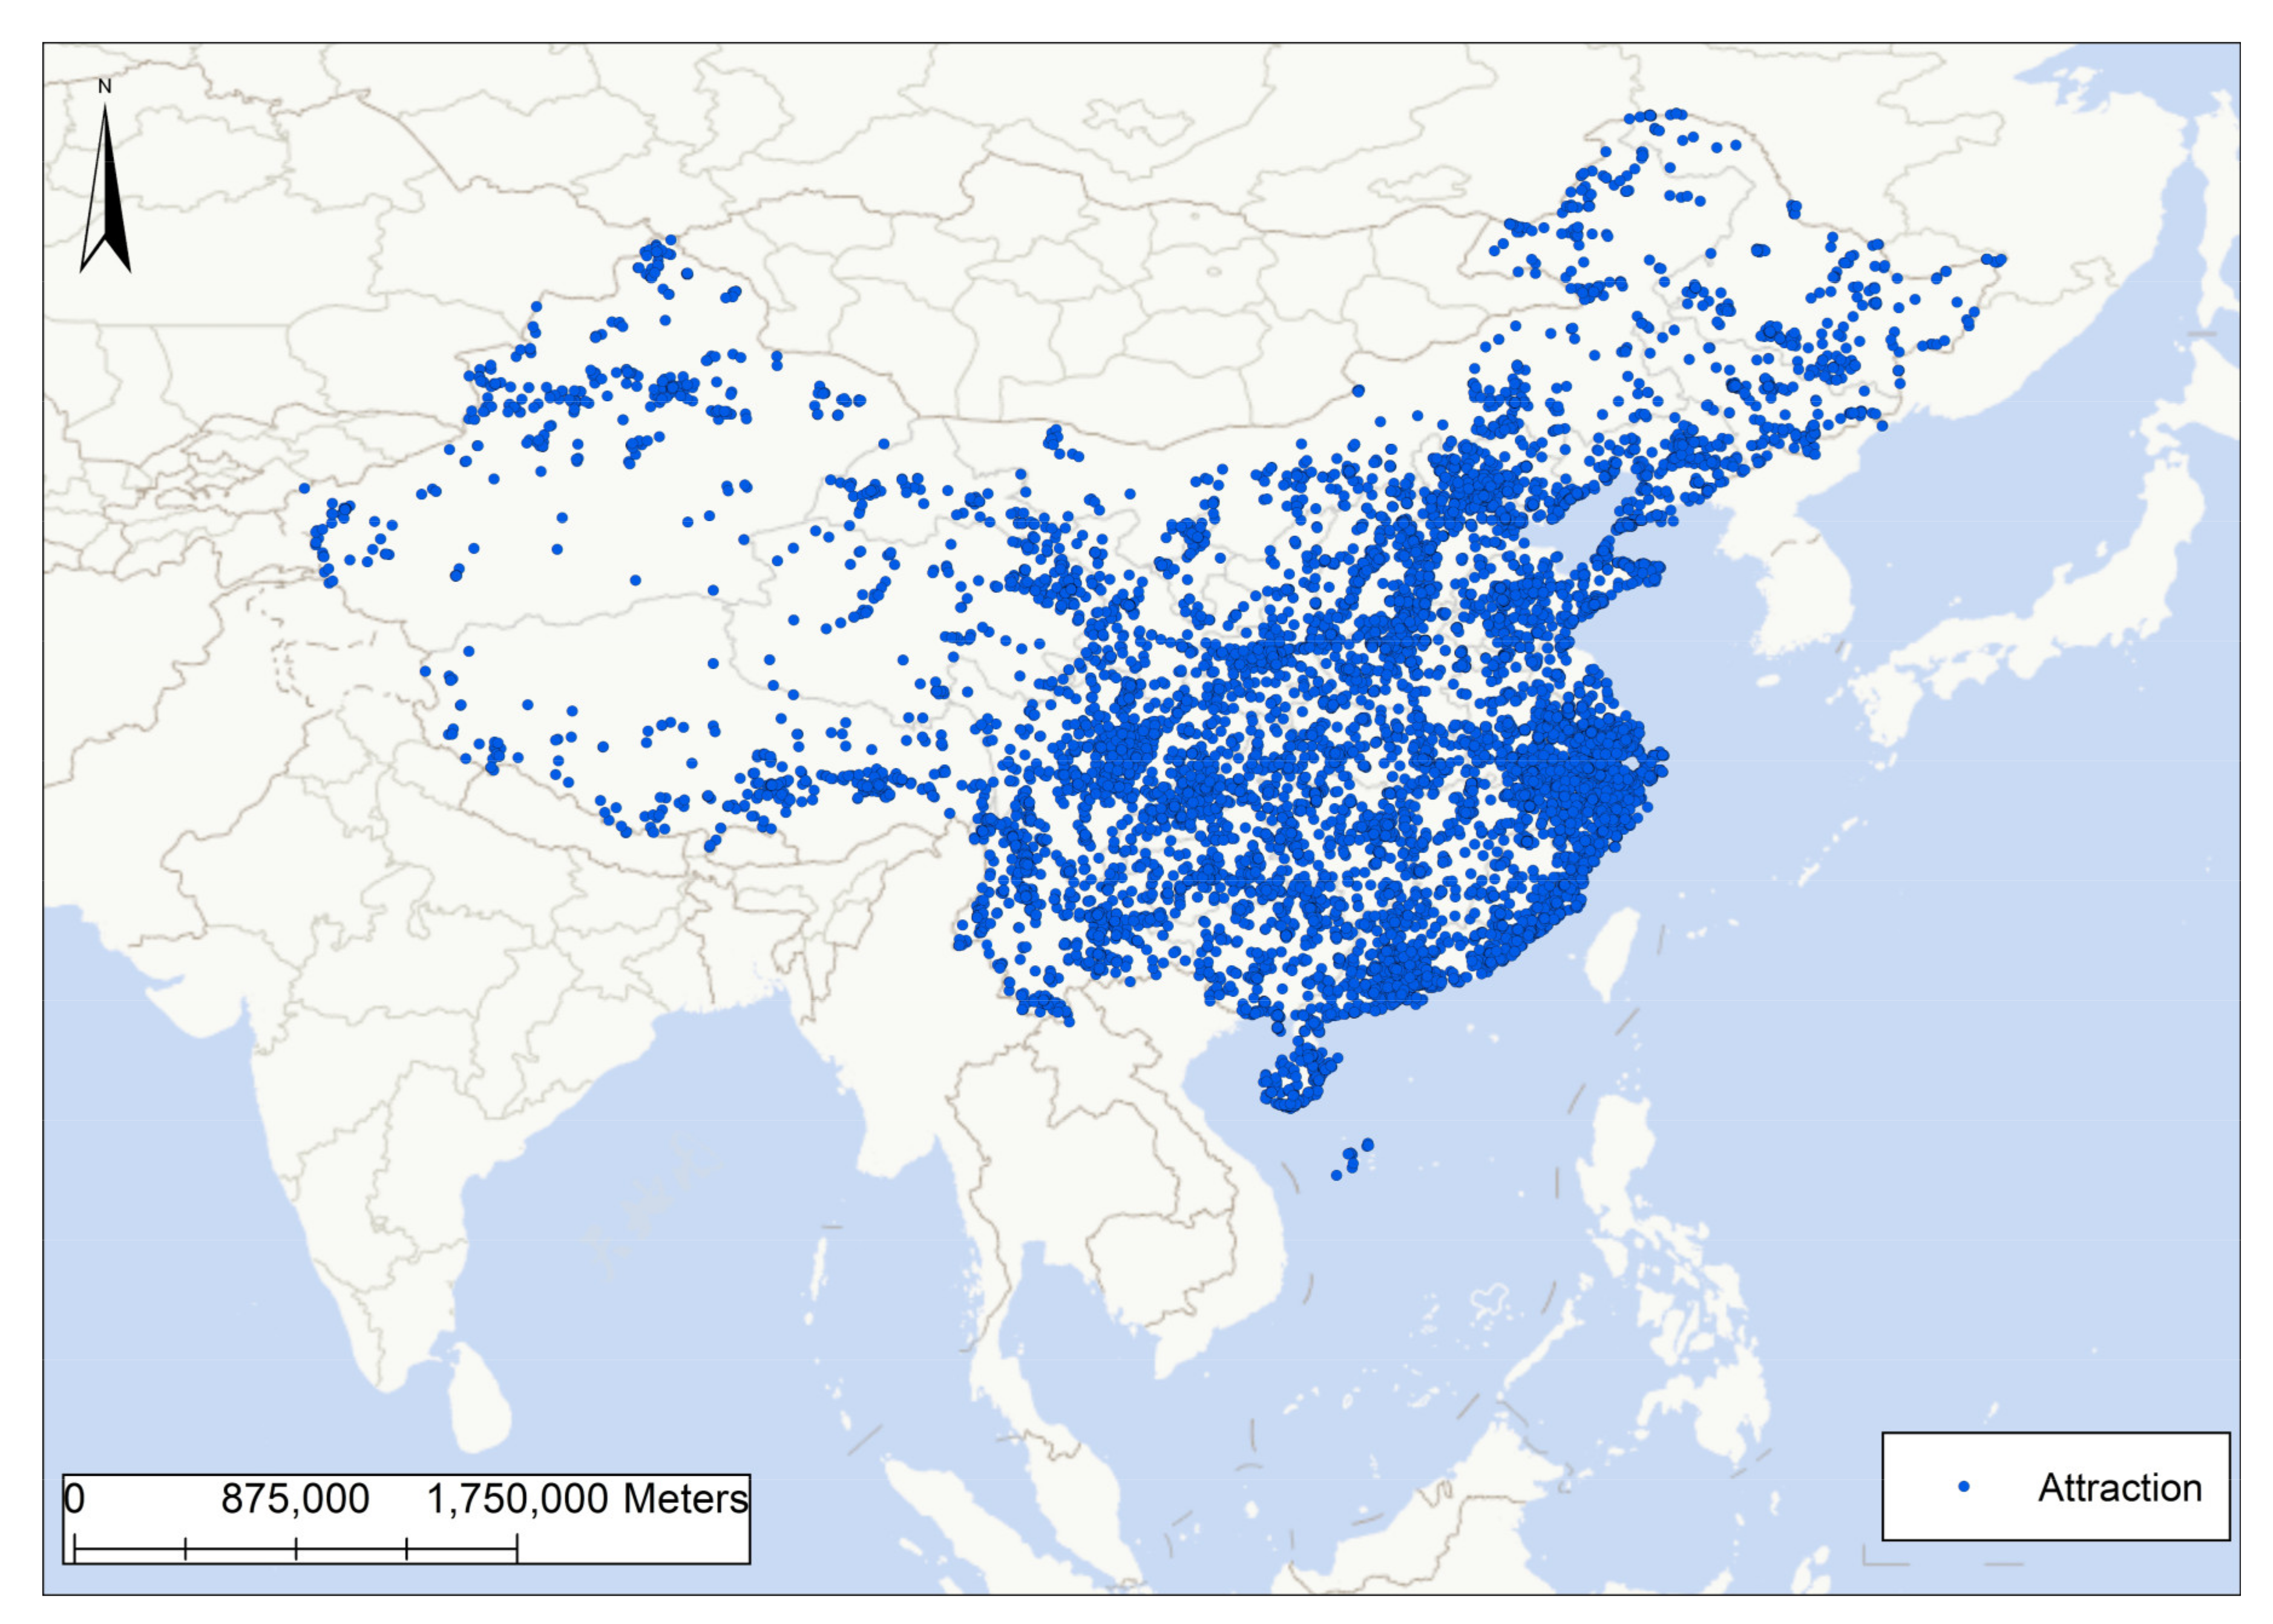
3.1. Review Data
3.2. Online Review HIN Construction
3.2.1. Image Topic Extraction
3.2.2. Online Review HIN
3.3. Online Review HIN Embedding
3.4. Top Related Attractions Finding
3.4.1. Comparative Relatedness Identification Methods
- (1)
- Relatedness Identification Based on Homogeneous Network Embedding
- (2)
- Relatedness Identification Based on Image Topic Distribution
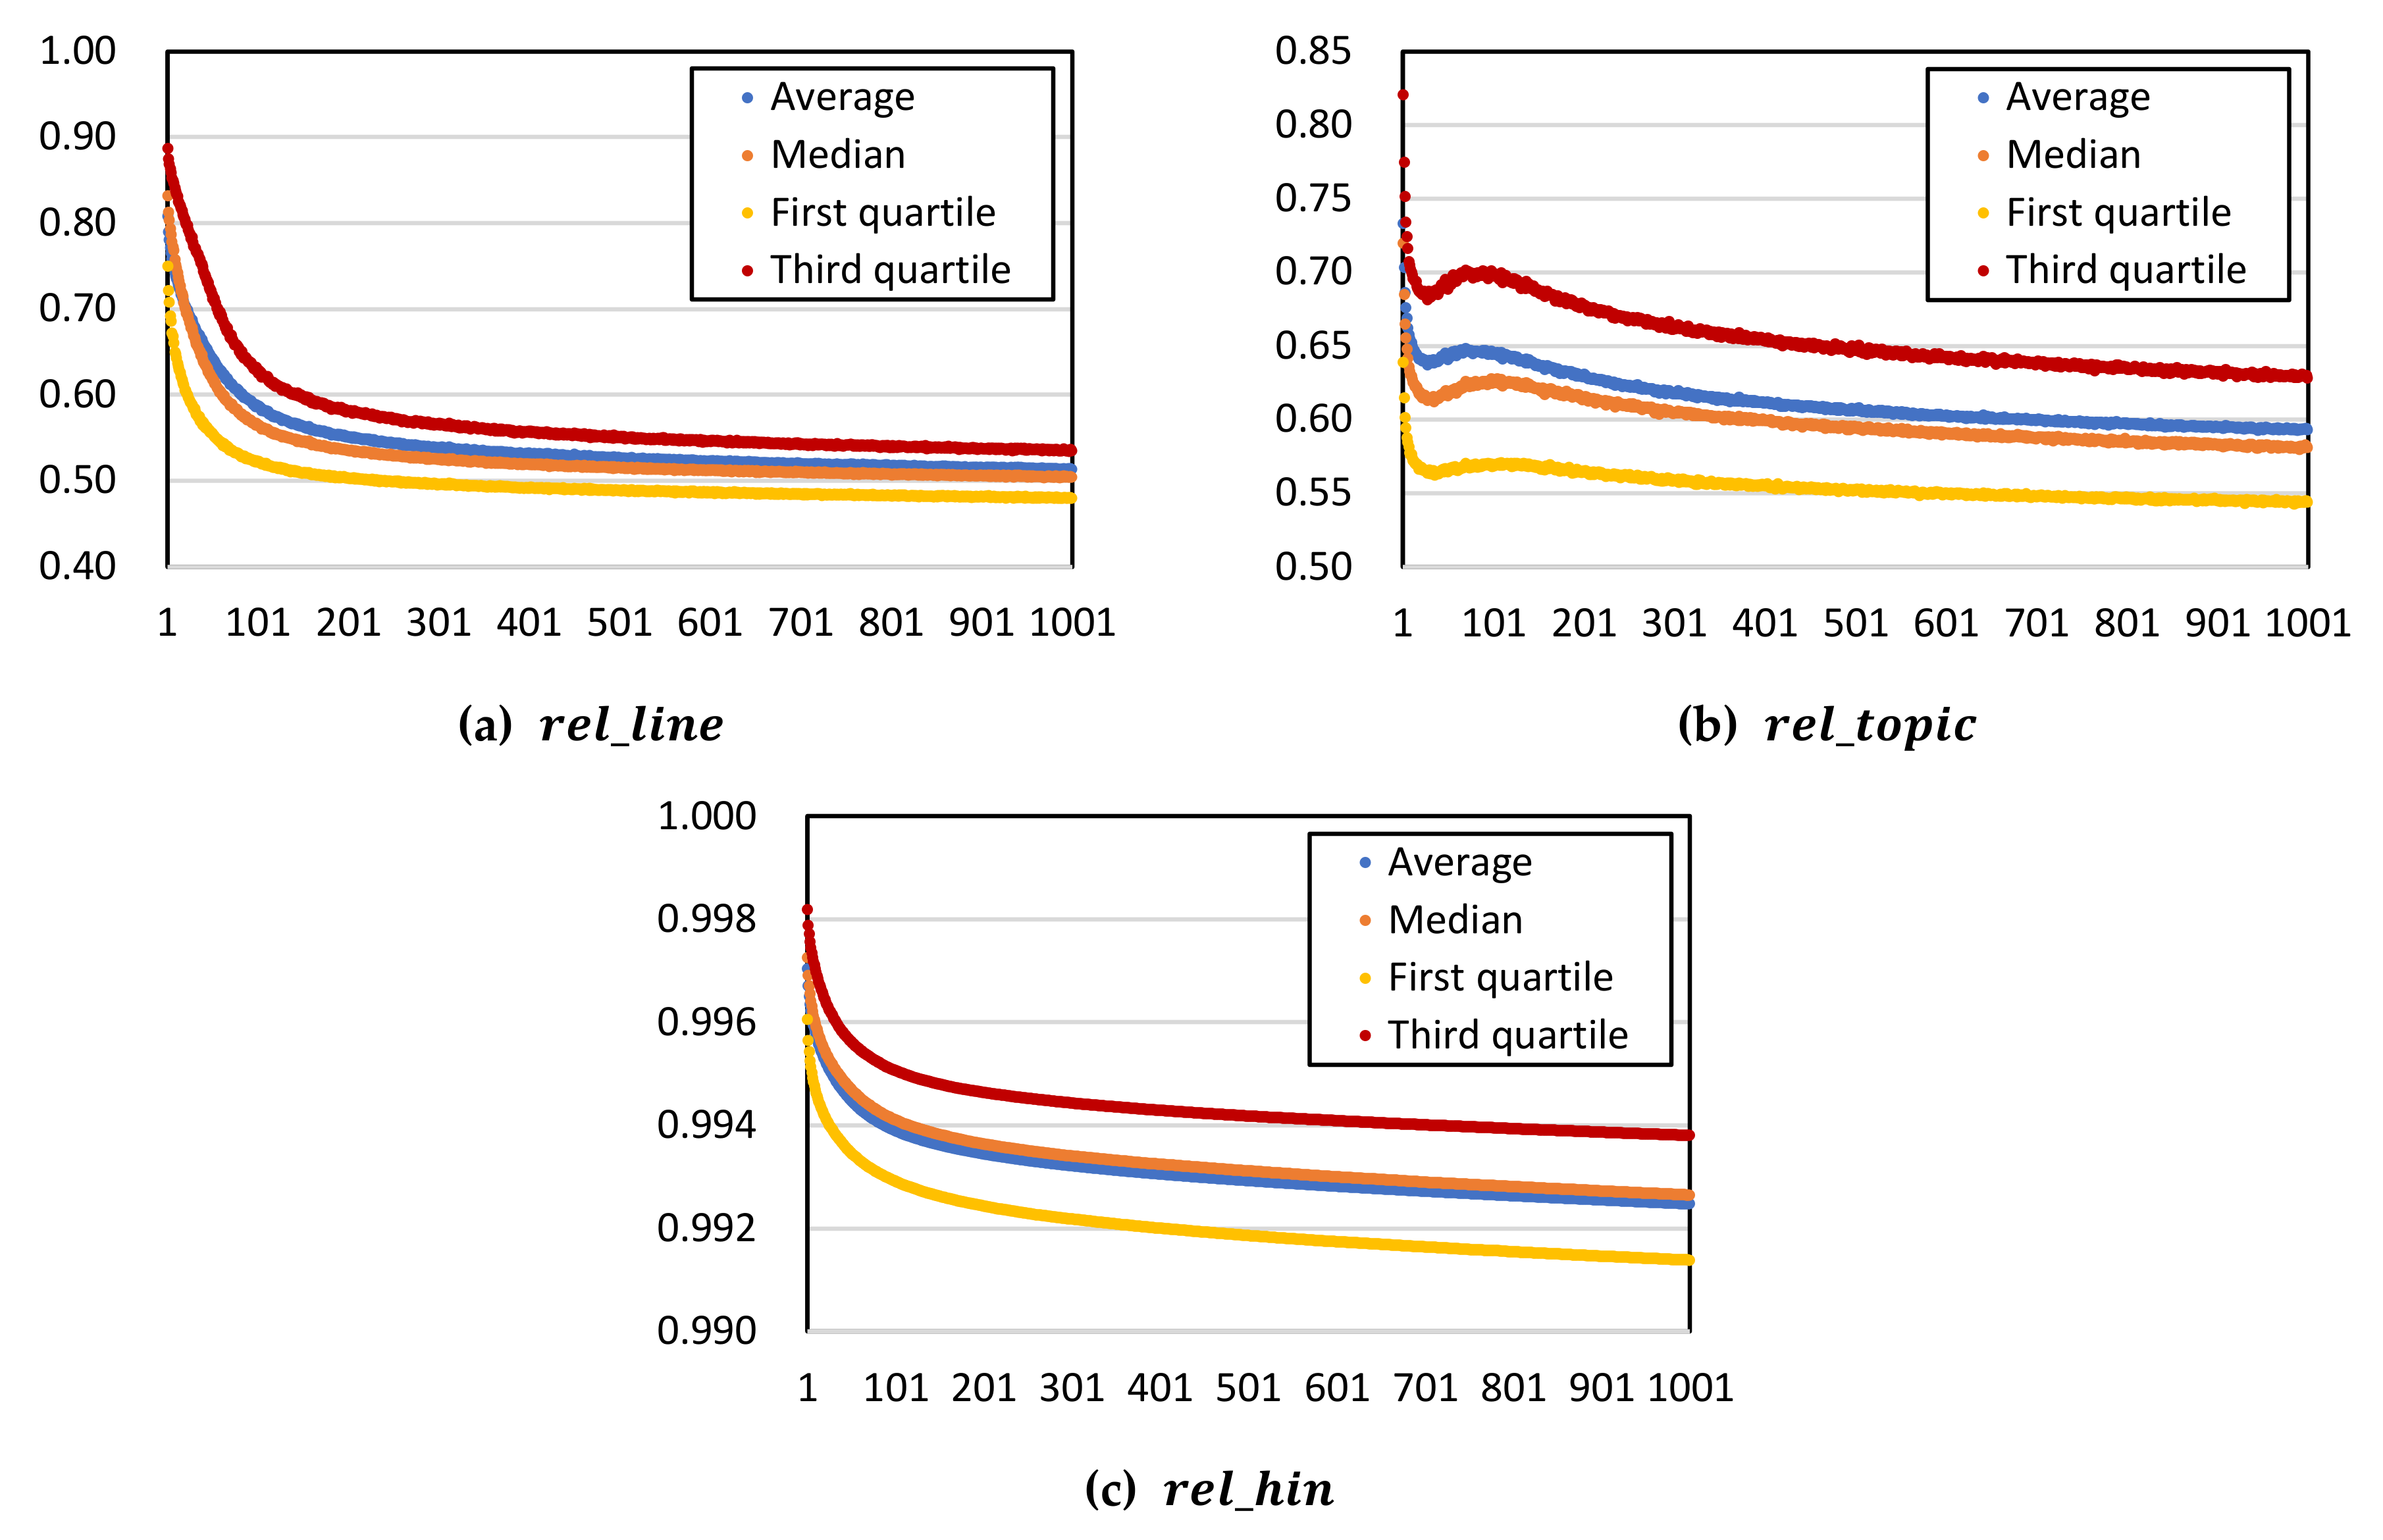
3.4.2. Results
3.4.3. Efficiency Analysis
3.5. Attractions Clustering
4. Discussion
5. Conclusions
Author Contributions
Funding
Data Availability Statement
Acknowledgments
Conflicts of Interest
References
- Liu, Y.; Wang, F.; Kang, C.; Gao, Y.; Lu, Y. Analyzing Relatedness by Toponym Co-Occurrences on Web Pages. Trans. GIS 2014, 18, 89–107. [Google Scholar] [CrossRef]
- Gu, Z.; Zhang, Y.; Chen, Y.; Chang, X. Analysis of Attraction Features of Tourism Destinations in a Mega-City Based on Check-in Data Mining—A Case Study of Shenzhen, China. ISPRS Int. J. Geo-Inf. 2016, 5, 210. [Google Scholar] [CrossRef] [Green Version]
- Hong, T.; Ma, T.; Huan, T.-C. Network behavior as driving forces for tourism flows. J. Bus. Res. 2015, 68, 146–156. [Google Scholar] [CrossRef]
- Du, S.; Zhang, H.; Xu, H.; Yang, J.; Tu, O. To make the travel healthier: A new tourism personalized route recommendation algorithm. J. Ambient Intell. Humaniz. Comput. 2019, 10, 3551–3562. [Google Scholar] [CrossRef]
- Li, J.; Xu, L.; Tang, L.; Wang, S.; Li, L. Big data in tourism research: A literature review. Tour. Manag. 2018, 68, 301–323. [Google Scholar] [CrossRef]
- Han, H.; Kim, S.; Otoo, F.E. Spatial movement patterns among intra-destinations using social network analysis. Asia Pac. J. Tour. Res. 2018, 23, 806–822. [Google Scholar] [CrossRef]
- Kirilenko, A.P.; Stepchenkova, S.O.; Hernandez, J.M. Comparative clustering of destination attractions for different origin markets with network and spatial analyses of online reviews. Tour. Manag. 2019, 72, 400–410. [Google Scholar] [CrossRef]
- Sugimoto, K.; Ota, K.; Suzuki, S. Visitor Mobility and Spatial Structure in a Local Urban Tourism Destination: GPS Tracking and Network analysis. Sustainability 2019, 11, 919. [Google Scholar] [CrossRef] [Green Version]
- Liu, B.; Huang, S.; Fu, H. An application of network analysis on tourist attractions: The case of Xinjiang, China. Tour. Manag. 2017, 58, 132–141. [Google Scholar] [CrossRef]
- Mou, N.; Zheng, Y.; Makkonen, T.; Yang, T.; Tang, J.; Song, Y. Tourists’ digital footprint: The spatial patterns of tourist flows in Qingdao, China. Tour. Manag. 2020, 81, 104151. [Google Scholar] [CrossRef]
- Haris, E.; Gan, K.H.; Tan, T.-P. Spatial information extraction from travel narratives: Analysing the notion of co-occurrence indicating closeness of tourist places. J. Inf. Sci. 2020, 46, 581–599. [Google Scholar] [CrossRef]
- Yuan, H.; Xu, H.; Qian, Y.; Li, Y. Make your travel smarter: Summarizing urban tourism information from massive blog data. Int. J. Inf. Manag. 2016, 36, 1306–1319. [Google Scholar] [CrossRef]
- Lin, M.S.; Liang, Y.; Xue, J.X.; Pan, B.; Schroeder, A. Destination image through social media analytics and survey method. Int. J. Contemp. Hosp. Manag. 2021. Epub ahead of printing. [Google Scholar] [CrossRef]
- Blei, D.M.; John, D.L. Topic models. In Text Mining: Classification, Clustering, and Applications; Taylor and Francis: London, UK, 2009. [Google Scholar]
- Rossetti, M.; Stella, F.; Zanker, M. Analyzing user reviews in tourism with topic models. Inf. Technol. Tour. 2016, 16, 5–21. [Google Scholar] [CrossRef]
- Guo, Y.; Barnes, S.J.; Jia, Q. Mining meaning from online ratings and reviews: Tourist satisfaction analysis using latent dirichlet allocation. Tour. Manag. 2017, 59, 467–483. [Google Scholar] [CrossRef] [Green Version]
- Wang, J.; Li, Y.; Wu, B.; Wang, Y. Tourism destination image based on tourism user generated content on internet. Tour. Rev. 2020, 76, 125–137. [Google Scholar] [CrossRef]
- Kurashima, T.; Iwata, T.; Hoshide, T.; Takaya, N.; Fujimura, K. Geo topic model: Joint modeling of user’s activity area and interests for location recommendation. In Proceedings of the Sixth ACM International Conference on Web Search and Data Mining (WSDM’ 13), Association for Computing Machinery, Rome, Italy, 4–8 February 2013; pp. 375–384. [Google Scholar]
- Zheng, X.; Luo, Y.; Sun, L.; Zhang, J.; Chen, F. A tourism destination recommender system using users’ sentiment and temporal dynamics. J. Intell. Inf. Syst. 2018, 51, 557–578. [Google Scholar] [CrossRef]
- An, H.; Moon, N. Design of recommendation system for tourist spot using sentiment analysis based on CNN-LSTM. J. Ambient Intell. Humaniz. Comput. 2019, 1–11. [Google Scholar] [CrossRef]
- Shafqat, W.; Byun, Y.-C. A Recommendation Mechanism for Under-Emphasized Tourist Spots Using Topic Modeling and Sentiment Analysis. Sustainability 2020, 12, 320. [Google Scholar] [CrossRef] [Green Version]
- Shi, C.; Philip, S.Y. Heterogeneous Information Network Analysis and Applications; Springer: Berlin/Heidelberg, Germany, 2017. [Google Scholar]
- Sun, Y.; Han, J. Mining heterogeneous information networks: A structural analysis approach. ACM SIGKDD Explor. Newsl. 2013, 14, 20–28. [Google Scholar] [CrossRef]
- Shi, C.; Hu, B.; Zhao, W.X.; Yu, P.S. Heterogeneous Information Network Embedding for Recommendation. IEEE Trans. Knowl. Data Eng. 2019, 31, 357–370. [Google Scholar] [CrossRef] [Green Version]
- Wang, C.; Raina, R.; Fong, D.; Zhou, D.; Han, J.; Badros, G. Learning relevance from heterogeneous social network and its application in online targeting. In Proceedings of the 34th International ACM SIGIR Conference on Research and Development in Information Retrieval (SIGIR’ 11), Association for Computing Machinery, Beijing, China, 24–28 July 2011; pp. 655–664. [Google Scholar]
- Yu, J.; Gao, M.; Li, J.; Yin, H.; Liu, H. Adaptive Implicit Friends Identification over Heterogeneous Network for Social Recommendation. In Proceedings of the 27th ACM International Conference on Information and Knowledge Management (CIKM’ 18), Torino, Italy, 22–26 October 2018; pp. 357–366. [Google Scholar]
- Hosseini, A.; Chen, T.; Wu, W.; Sun, Y.; Sarrafzadeh, M. HeteroMed: Heterogeneous Information Network for Medical Diagnosis. In Proceedings of the 27th ACM International Conference on Information and Knowledge Management (CIKM’ 18), Torino, Italy, 22–26 October 2018; pp. 763–772. [Google Scholar]
- Chen, X.; Yin, J.; Qu, J.; Huang, L. MDHGI: Matrix Decomposition and Heterogeneous Graph Inference for miRNA-disease association prediction. PLOS Comput. Biol. 2018, 14, e1006418. [Google Scholar] [CrossRef]
- Zhang, F.; Wang, M.; Xi, J.; Yang, J.; Li, A. A novel heterogeneous network-based method for drug response prediction in cancer cell lines. Sci. Rep. 2018, 8, 3355. [Google Scholar] [CrossRef] [PubMed]
- Shi, C.; Li, Y.; Zhang, J.; Sun, Y.; Yu, P.S. A Survey of Heterogeneous Information Network Analysis. IEEE Trans. Knowl. Data Eng. 2017, 29, 17–37. [Google Scholar] [CrossRef]
- Blei, D.M.; Ng, A.Y.; Jordan, M.I. Latent Dirichlet Allocation. J. Mach. Learn. Res. 2003, 3, 993–1022. [Google Scholar]
- Qiang, J.; Qian, Z.; Li, Y.; Yuan, Y.; Wu, X. Short Text Topic Modeling Techniques, Applications, and Performance: A Survey. IEEE Trans. Knowl. Data Eng. 2020, 1–19. [Google Scholar] [CrossRef]
- Bengio, Y.; Ducharme, R.; Vincent, P.; Janvin, C. A Neural Probabilistic Language Model. J. Mach. Learn. Res. 2003, 3, 1137–1155. [Google Scholar]
- Mikolov, T.; Chen, K.; Corrado, G.; Dean, J. Efficient Estimation of Word Representations in Vector Space. In Proceedings of the Workshop at International Conference on Learning Representations 2013, Scottsdale, AZ, USA, 2–4 May 2013; pp. 1–12. [Google Scholar]
- Liu, K.; Gao, S.; Qiu, P.; Liu, X.; Yan, B.; Lu, F. Road2Vec: Measuring traffic interactions in urban road system from massive travel routes. ISPRS Int. J. Geo-Inf. 2017, 6, 321. [Google Scholar] [CrossRef] [Green Version]
- Mihalcea, R.; Tarau, P. TextRank: Bringing Order into Text. In Proceedings of the 2004 Conference on Empirical Methods in Natural Language Processing (EMNLP 2004), Association for Computational Linguistics, Barcelona, Spain, 25–26 July 2004; pp. 404–411. [Google Scholar]
- Dong, Y.; Chawla, N.V.; Swami, A. Metapath2Vec: Scalable Representation Learning for Heterogeneous Networks. In Proceedings of the 23rd ACM SIGKDD International Conference on Knowledge Discovery and Data Mining (KDD’ 17), Halifax, NS, Canada, 13–17 August 2017; pp. 135–144. [Google Scholar]
- Fu, T.; Lee, W.-C.; Lei, Z. HIN2Vec: Explore Meta-paths in Heterogeneous Information Networks for Representation Learning. In Proceedings of the 2017 ACM on Conference on Information and Knowledge Management (CIKM’ 17), Singapore, Singapore, 6–10 November 2017; pp. 1797–1806. [Google Scholar]
- Wang, X.; Ji, H.; Shi, C.; Wang, B.; Ye, Y.; Cui, P.; Yu, P.S. Heterogeneous Graph Attention Network. In Proceedings of the 2019 World Wide Web Conference (WWW’ 19), San Francisco, CA, USA, 13–17 May 2019; pp. 2022–2032. [Google Scholar]
- Liu, N.; Huang, X.; Li, J.; Hu, X. On Interpretation of Network Embedding via Taxonomy Induction. In Proceedings of the 24th ACM SIGKDD International Conference on Knowledge Discovery & Data Mining, Association for Computing Machinery (KDD’ 18), London, UK, 19–23 August 2018; pp. 1812–1820. [Google Scholar]
- Tang, J.; Qu, M.; Wang, M.; Zhang, M.; Yan, J.; Mei, Q. LINE: Large-scale Information Network Embedding. In Proceedings of the 24th International Conference on World Wide Web (WWW’ 15), International World Wide Web Conferences Steering Committee, Florence, Italy, 18–22 May 2015; pp. 1067–1077. [Google Scholar]
- Frey, B.J.; Dueck, D. Clustering by Passing Messages between Data Points. Science 2007, 315, 972–976. [Google Scholar] [CrossRef] [PubMed] [Green Version]
- Dong, Y.; Hu, Z.; Tang, J.; Sun, Y.; Wang, K. Heterogeneous Network Representation Learning. In Proceedings of the Twenty-Ninth International Joint Conference on Artificial Intelligence (IJCAI-20), Online, 7–15 January 2021; Volume 5, pp. 4861–4867. [Google Scholar]


| Category | Sub-Categories |
|---|---|
| dining (5) | no sub-category (2); seafood (1); farmer meal (1); flavor (1) |
| cost (6) | no sub-category (1); ticket (4); discount (1) |
| environment (25) | no sub-category (1); quietness (1); safety (1); furnishings (1); panorama (1); scenery (7); air (1); facility (2); beauty (1); tourist density (2); color (2); hygiene (2); atmosphere (1); sunshine (1); vegetation (1) |
| advice (9) | no sub-category (6); book ticket (1); tour guide (1); scheduling (1) |
| traffic (11) | no sub-category (3); walk (2); subway (1); bus (1); riding (1); parking (1); road trip (1); rental car (1) |
| experience (26) | no sub-category (24); climbing mountain (2) |
| feature of attraction (58) | ice & snow (1); museum (2); urban core (1); Hmong village (1); village (1); panda (1); landmark (1); sculpture (1); animal (2); cave (1); high-rise building (1); college (1); park (1); historic site (1); piazza (1); beach (1); aquarium (1); waterfall (1); lake (1); flower (3); building (1); river (1); alley & street (1); attraction (2); Kaifeng (1); national custom (2); bridge (1); place to film (1); forest (1); mountain (2); business (1); stone carving (1); water town (1); temple (1); theme park (1); railroad (1); hot spring (1); protected historic site (2); cultural heritage (1); canyon (1); modern city (1); town (1); recreation (1); art (1); gingkgo (1); playground (1); garden (1); arboretum (1); natural landform (1); natural scenery (1) |
| introduction (22) | no sub-category (3); preservation condition (1); locals (1); allusion (1); style (1); custom (1); scale (1); building structure (1); history (3); area (1); entrance (2); picture (1); location (2); development (1); culture (1); religion (1) |
| evaluate (15) | no sub-category (2); negative (4); positive (9) |
| time (5) | peak and slack season (1); queuing time (1); opening time (2); duration (1) |
| activity (16) | no sub-category (1); boating (1); taking cable car (1); temple fair (1); rafting (1); family activity (1); shopping (2); photography (3); show (3); exhibition (1); worship (1) |
| accommodation (1) | no sub-category (1) |
| MaFengWo self (1) | no sub-category (1) |
| Topic ID | Category | Top 10 High-Frequency Keywords |
|---|---|---|
| 0 | activity: show | role; music; image; wax; vivid (2); lifelike; dance; song and dance; wonderful |
| 16 | feature of attraction: landmark | different; landmark (3); seem; county; mark; road; landmark building; difference |
| 21 | time: opening time | aspect; open (2); crowds; crowd; close; museum close; off duty; closed on Monday |
| 26 | experience | pass by; relax; excellent; just pass by; highlight; destination; cannot miss; by pure chance; specially; mind |
| 28 | cost: ticket | free of charge; free to visit; watch; open for free; Admission with ID; get ticket; exchange; verify ID (2); Admission with ticket |
| 34 | evaluate: positive | be worth; tourism; be very worth; small and beautiful; nice nice nice; nice; with somebody; play; be worth to come |
| 40 | dining: seafood | seafood; characteristic; fresh; bathroom; mantis shrimp; seafood market; Musculus senhousei; taste; food stall; corner |
| 41 | traffic: parking | park; parking (2); parking fee; hold; park at; park at will; no bathroom; toll collector; park to the side of the road |
| 54 | introduction: history | a part; founded in (2); built in; divided into; AD; access; formal; period; old name |
| 77 | activity: photography | take photo with (3); take photo (3); Fairy Lake; be tempted to; population; area |
| 85 | environment: air | air; fun; breathe (2); interesting; natural oxygen bar; fresh air; facility; site; anion |
| 97 | feature of attraction: panda | lovely; panda; cute (2); panda kindergarten; very cute; charmingly nave; cute critter; so lazy; see panda |
| 109 | introduction: location | located (5); adjoin; to the north; take road as boundary; west of; to the west |
| 126 | environment: tourist density | tourist; protect; worshipper; foreign tourist; endless stream of tourists; surge; vociferously; popular; large party; too popular |
| 140 | evaluate: negative | problem; owner; manage; on file; warn; attitude; service attitude; very poor; chaos; servant |
| 169 | accommodation | hotel (2); romantic; see; big bedroom; check in; suite; starred hotel; booking; standard room |
| 171 | experience: climbing mountain | up; add; flower perfume; up to; climbing mountain; climb up; quite steep (2); wear knee; tired |
| 183 | feature of attraction: beach | sand beach; seawater; beach; comfortable; sand; white sand; soft; sandiness; swimming; fine sand beach |
| 191 | advice: booking ticket | in advance; put in; luggage; tourist center; information; book on; taobao; book; online shopping; buy ticket |
| 195 | traffic: subway | subway; scene; subway station; ordinary people; seek; Line 1; station; Xintiandi Station; Xincheng Station; Line 10 |
| Node | |||||
|---|---|---|---|---|---|
| #Attraction | #Tourist | #Review | #Topic | ||
| 11,122 | 202,777 | 1,087,438 | 200 | ||
| Edge | |||||
| #Having Review/Review of | #Writting/Written by | #Hastopic/Topic of | |||
| 2,176,454 | 2,176,454 | 2,664,614 | |||
Publisher’s Note: MDPI stays neutral with regard to jurisdictional claims in published maps and institutional affiliations. |
© 2021 by the authors. Licensee MDPI, Basel, Switzerland. This article is an open access article distributed under the terms and conditions of the Creative Commons Attribution (CC BY) license (https://creativecommons.org/licenses/by/4.0/).
Share and Cite
Qiu, P.; Gao, J.; Lu, F. Identifying the Relatedness between Tourism Attractions from Online Reviews with Heterogeneous Information Network Embedding. ISPRS Int. J. Geo-Inf. 2021, 10, 797. https://doi.org/10.3390/ijgi10120797
Qiu P, Gao J, Lu F. Identifying the Relatedness between Tourism Attractions from Online Reviews with Heterogeneous Information Network Embedding. ISPRS International Journal of Geo-Information. 2021; 10(12):797. https://doi.org/10.3390/ijgi10120797
Chicago/Turabian StyleQiu, Peiyuan, Jialiang Gao, and Feng Lu. 2021. "Identifying the Relatedness between Tourism Attractions from Online Reviews with Heterogeneous Information Network Embedding" ISPRS International Journal of Geo-Information 10, no. 12: 797. https://doi.org/10.3390/ijgi10120797
APA StyleQiu, P., Gao, J., & Lu, F. (2021). Identifying the Relatedness between Tourism Attractions from Online Reviews with Heterogeneous Information Network Embedding. ISPRS International Journal of Geo-Information, 10(12), 797. https://doi.org/10.3390/ijgi10120797