
Resilience of Urban Network Structure in China: The Perspective of Disruption


Abstract
:1. Introduction
2. Literature Review
3. Data and Methods
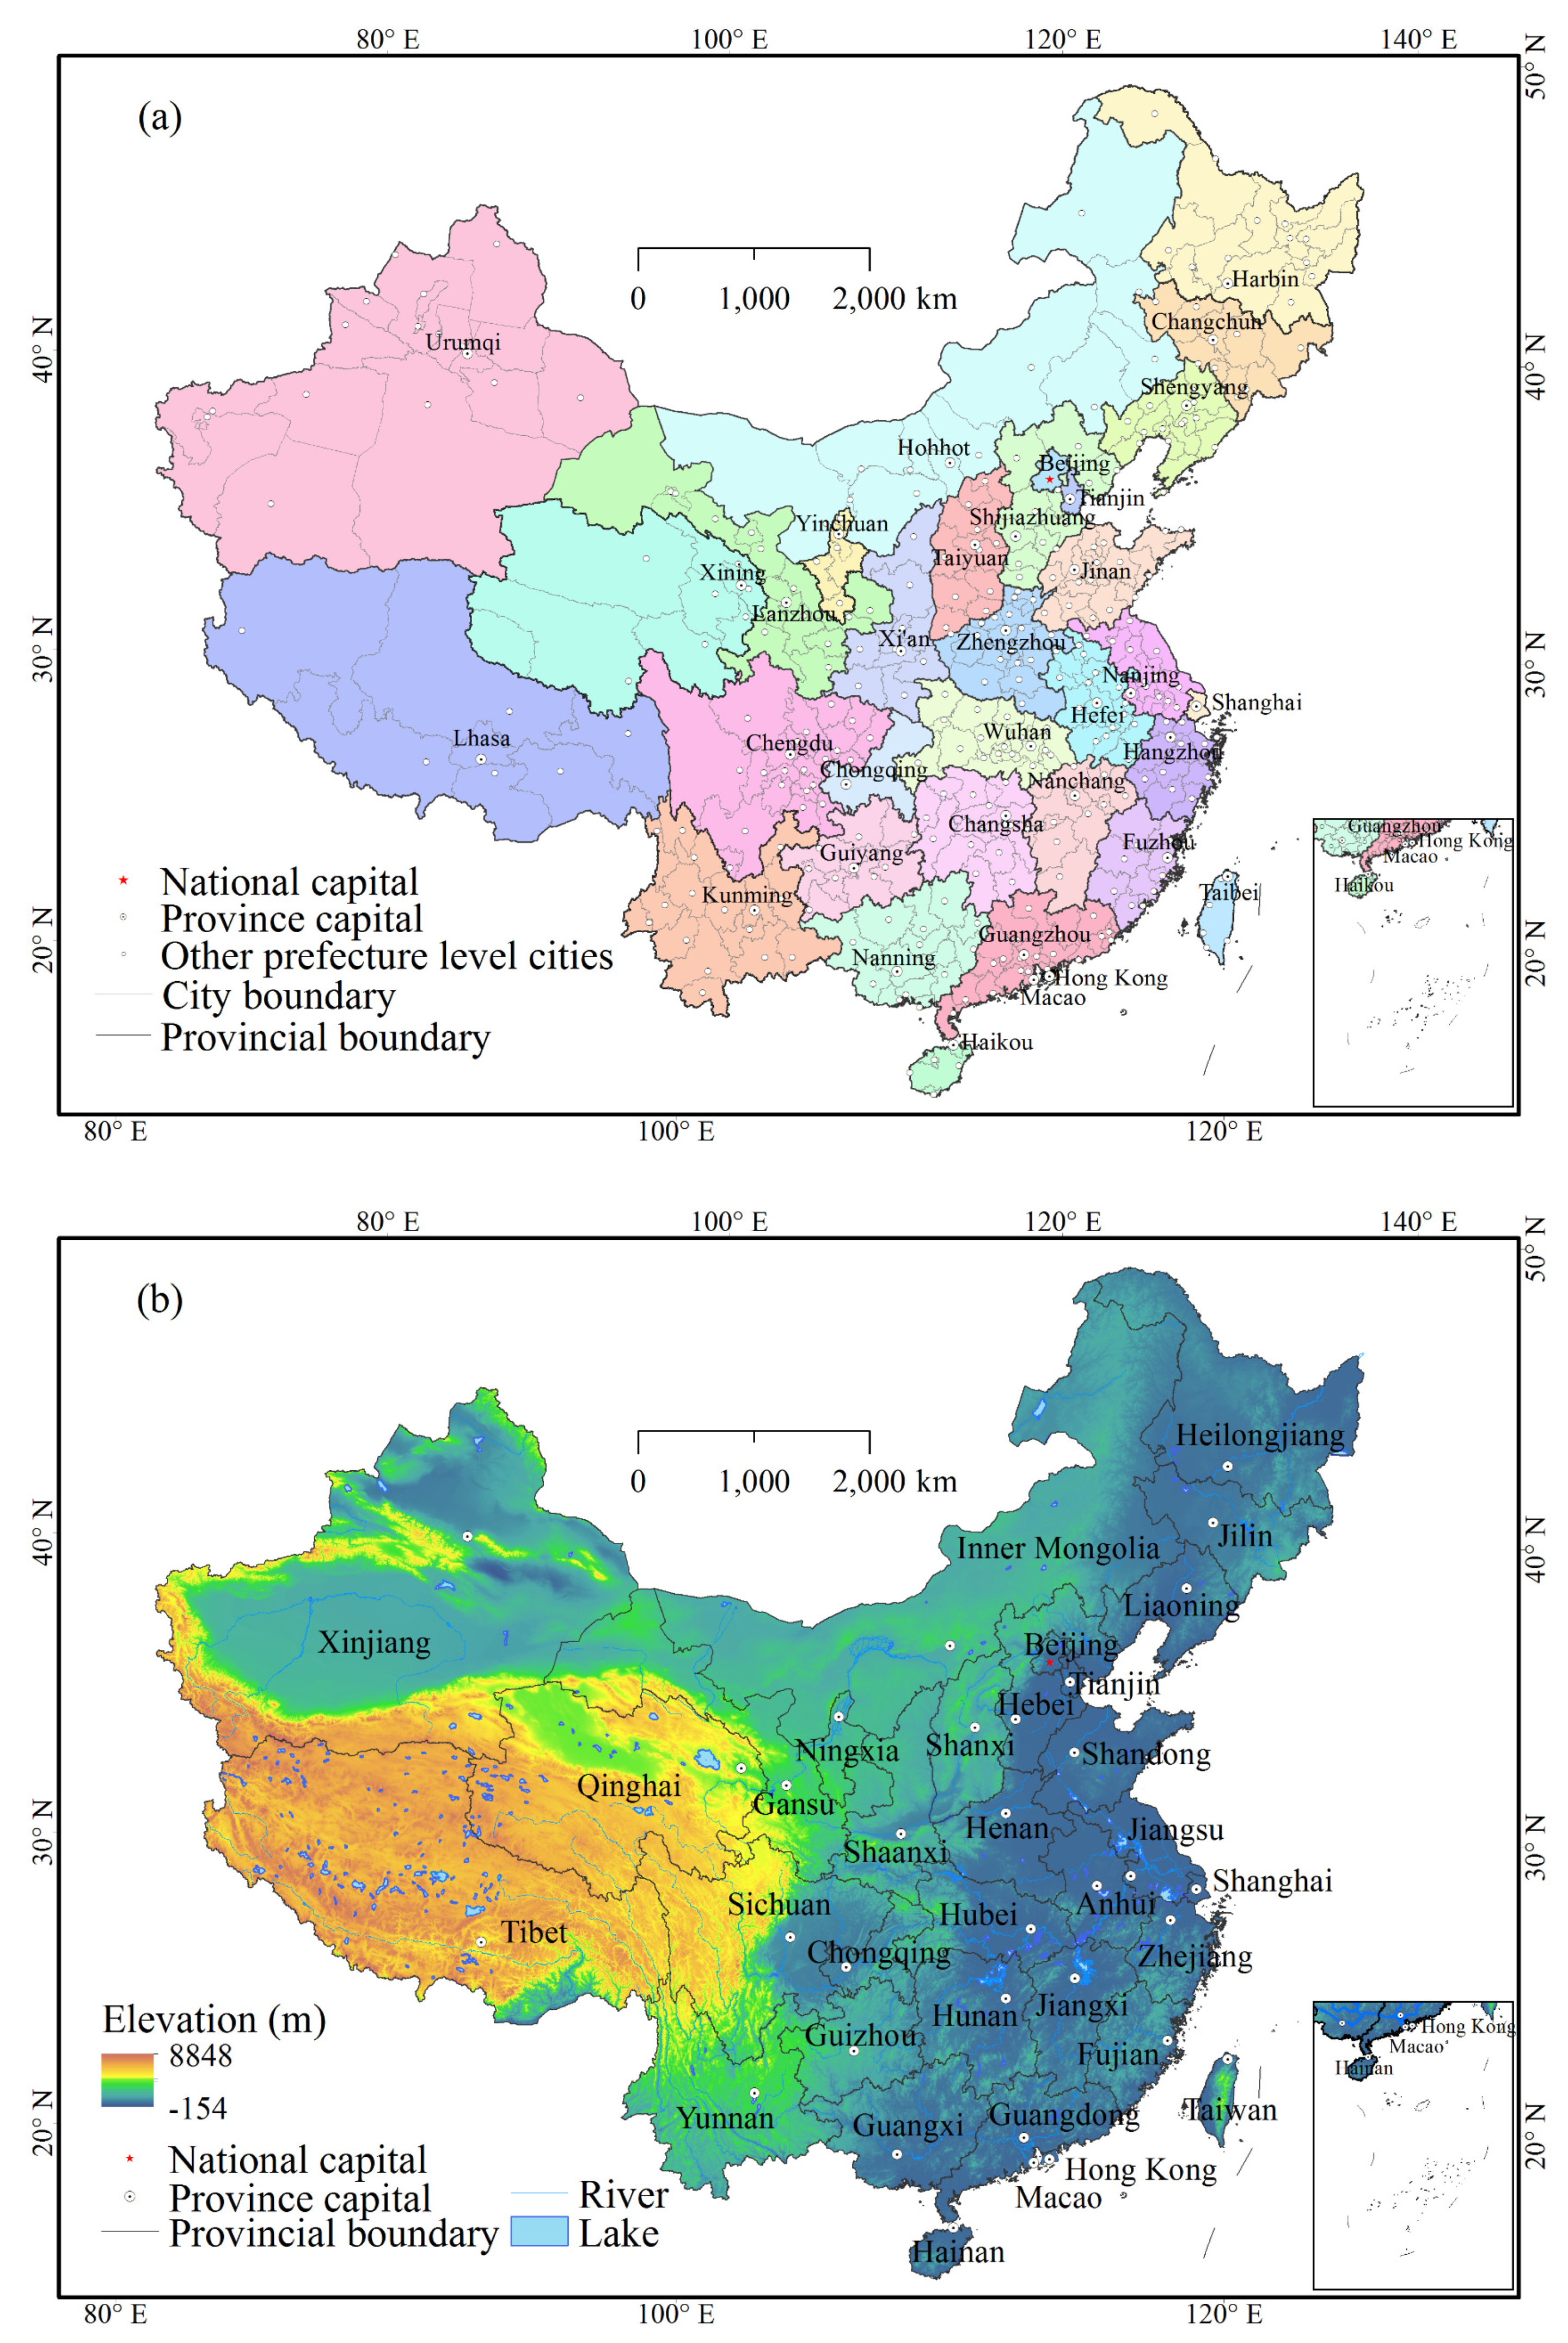
3.1. Data Sources
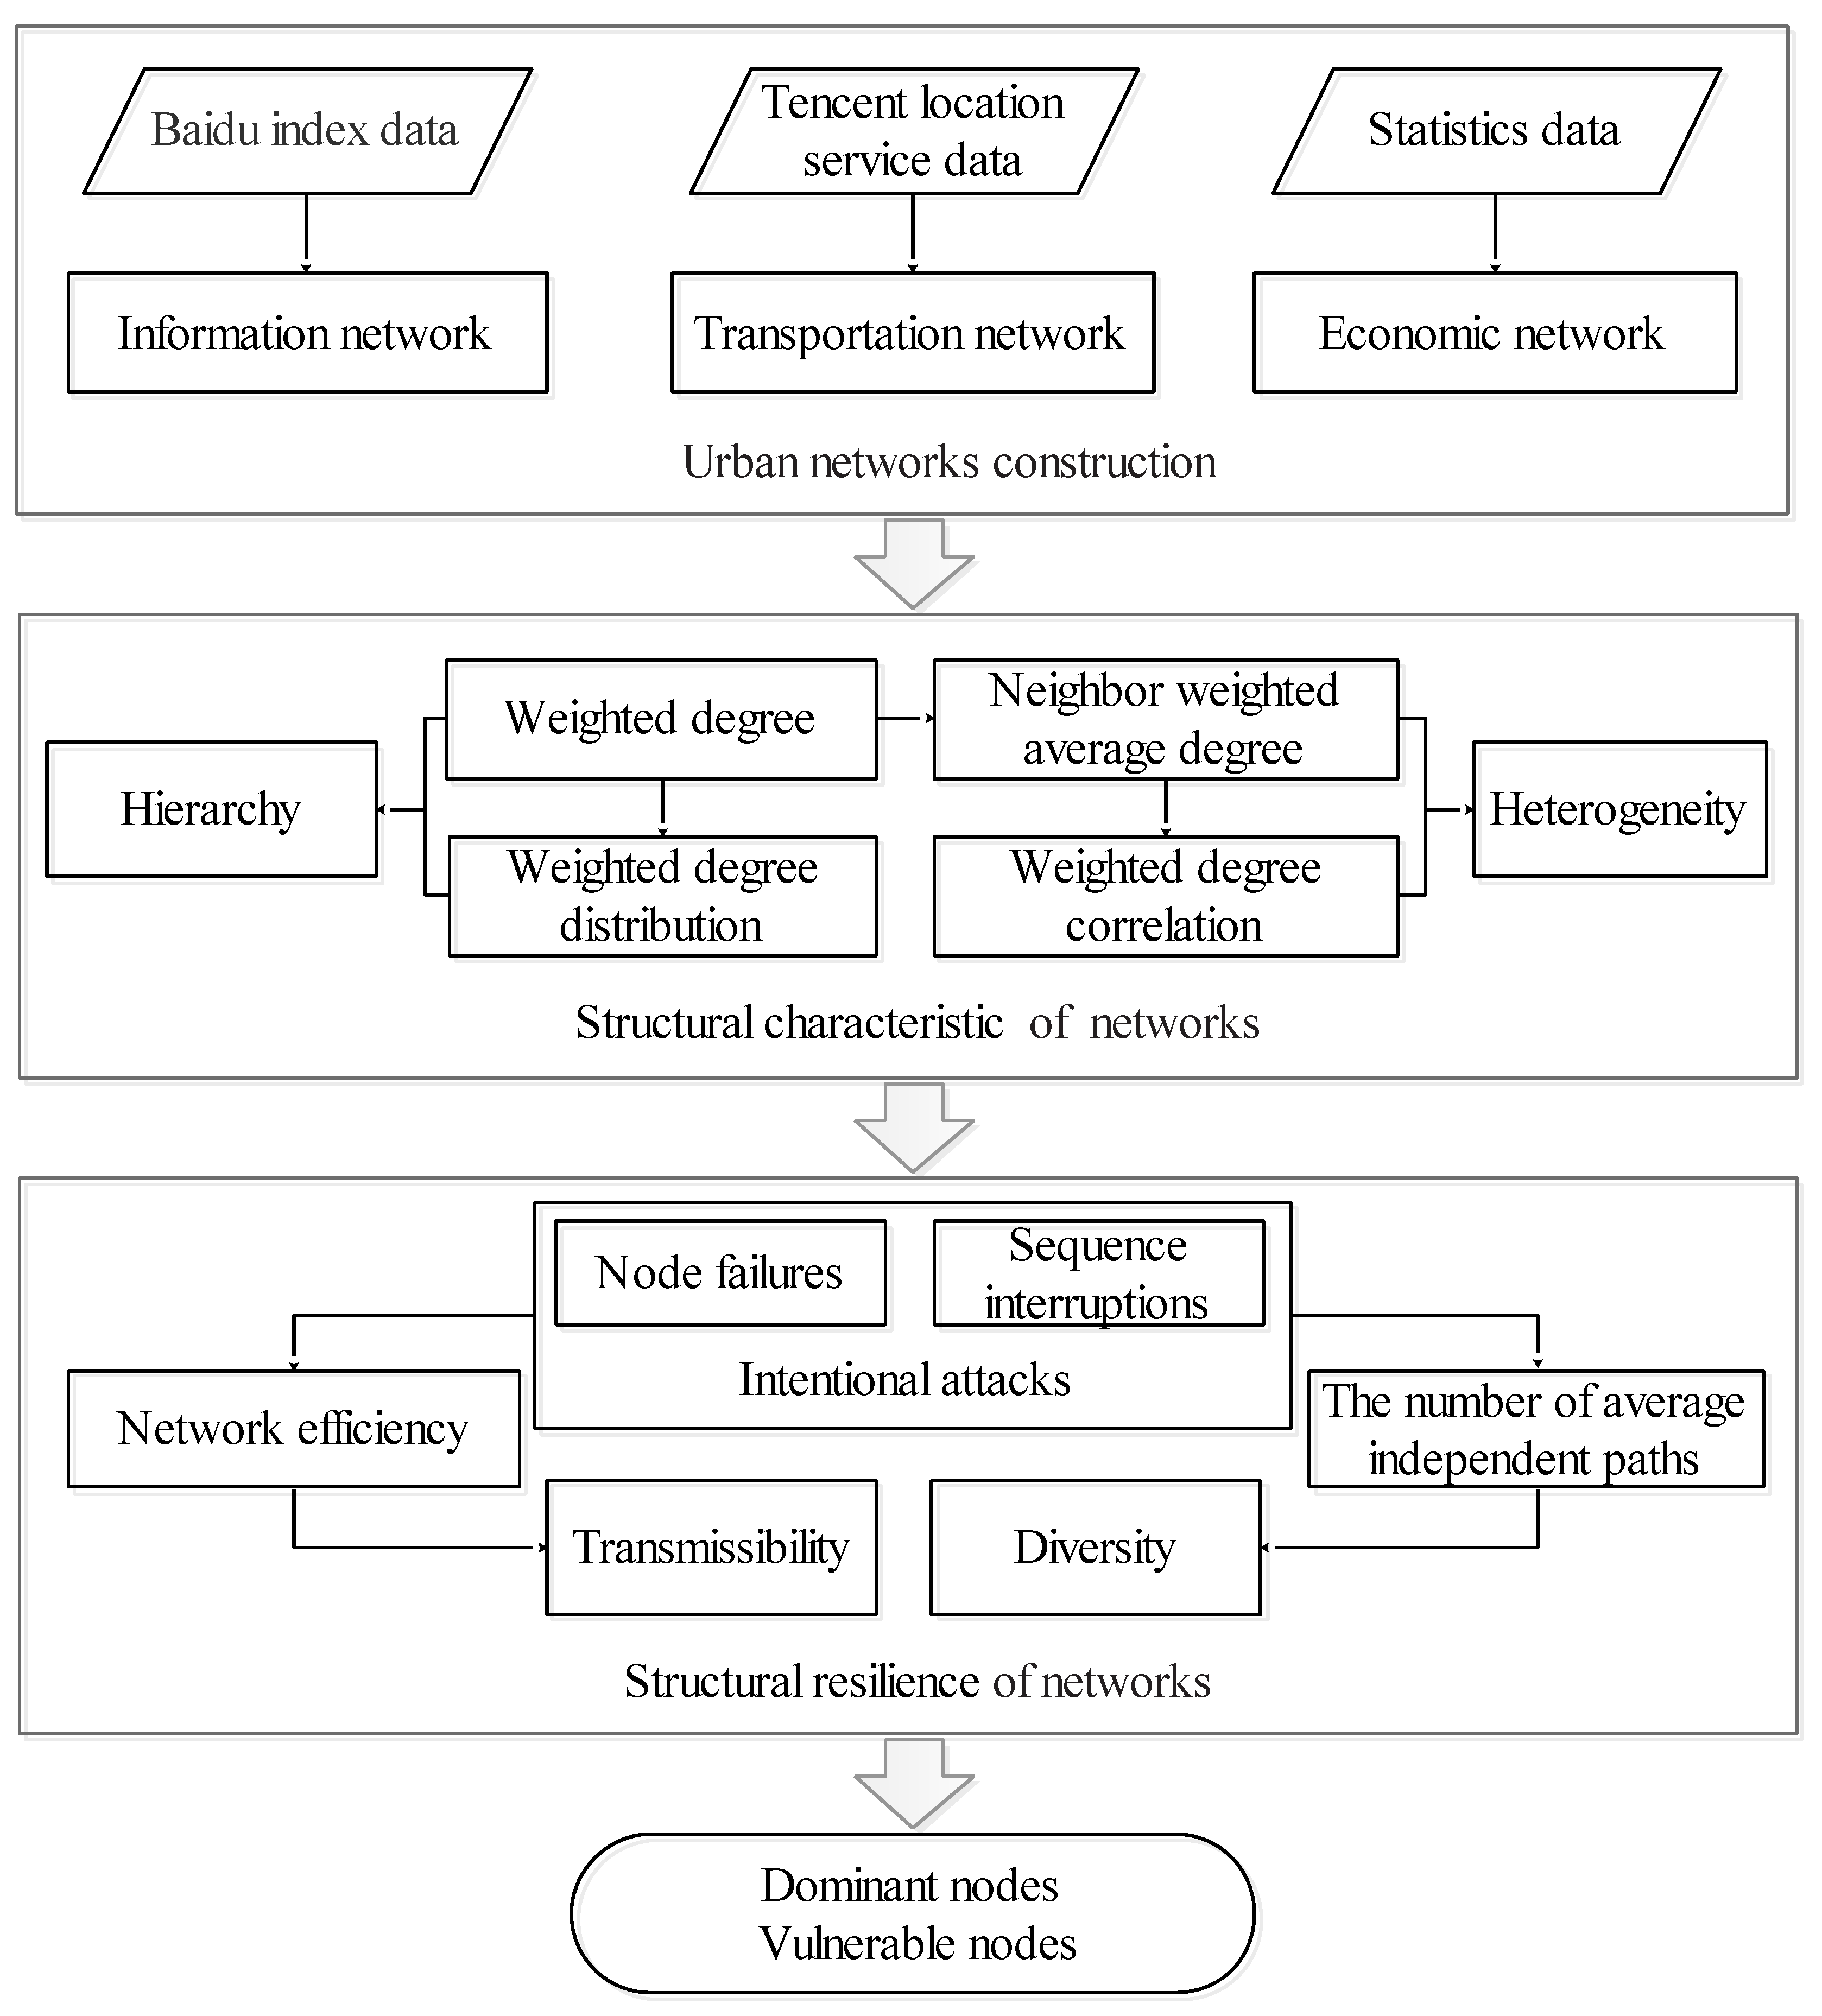
3.2. Methods
3.2.1. Calculation of Intensity of Urban Connections
3.2.2. Measurement of Network Structural Characteristics
3.2.3. Assessment of Network Structure Resilience
4. Results
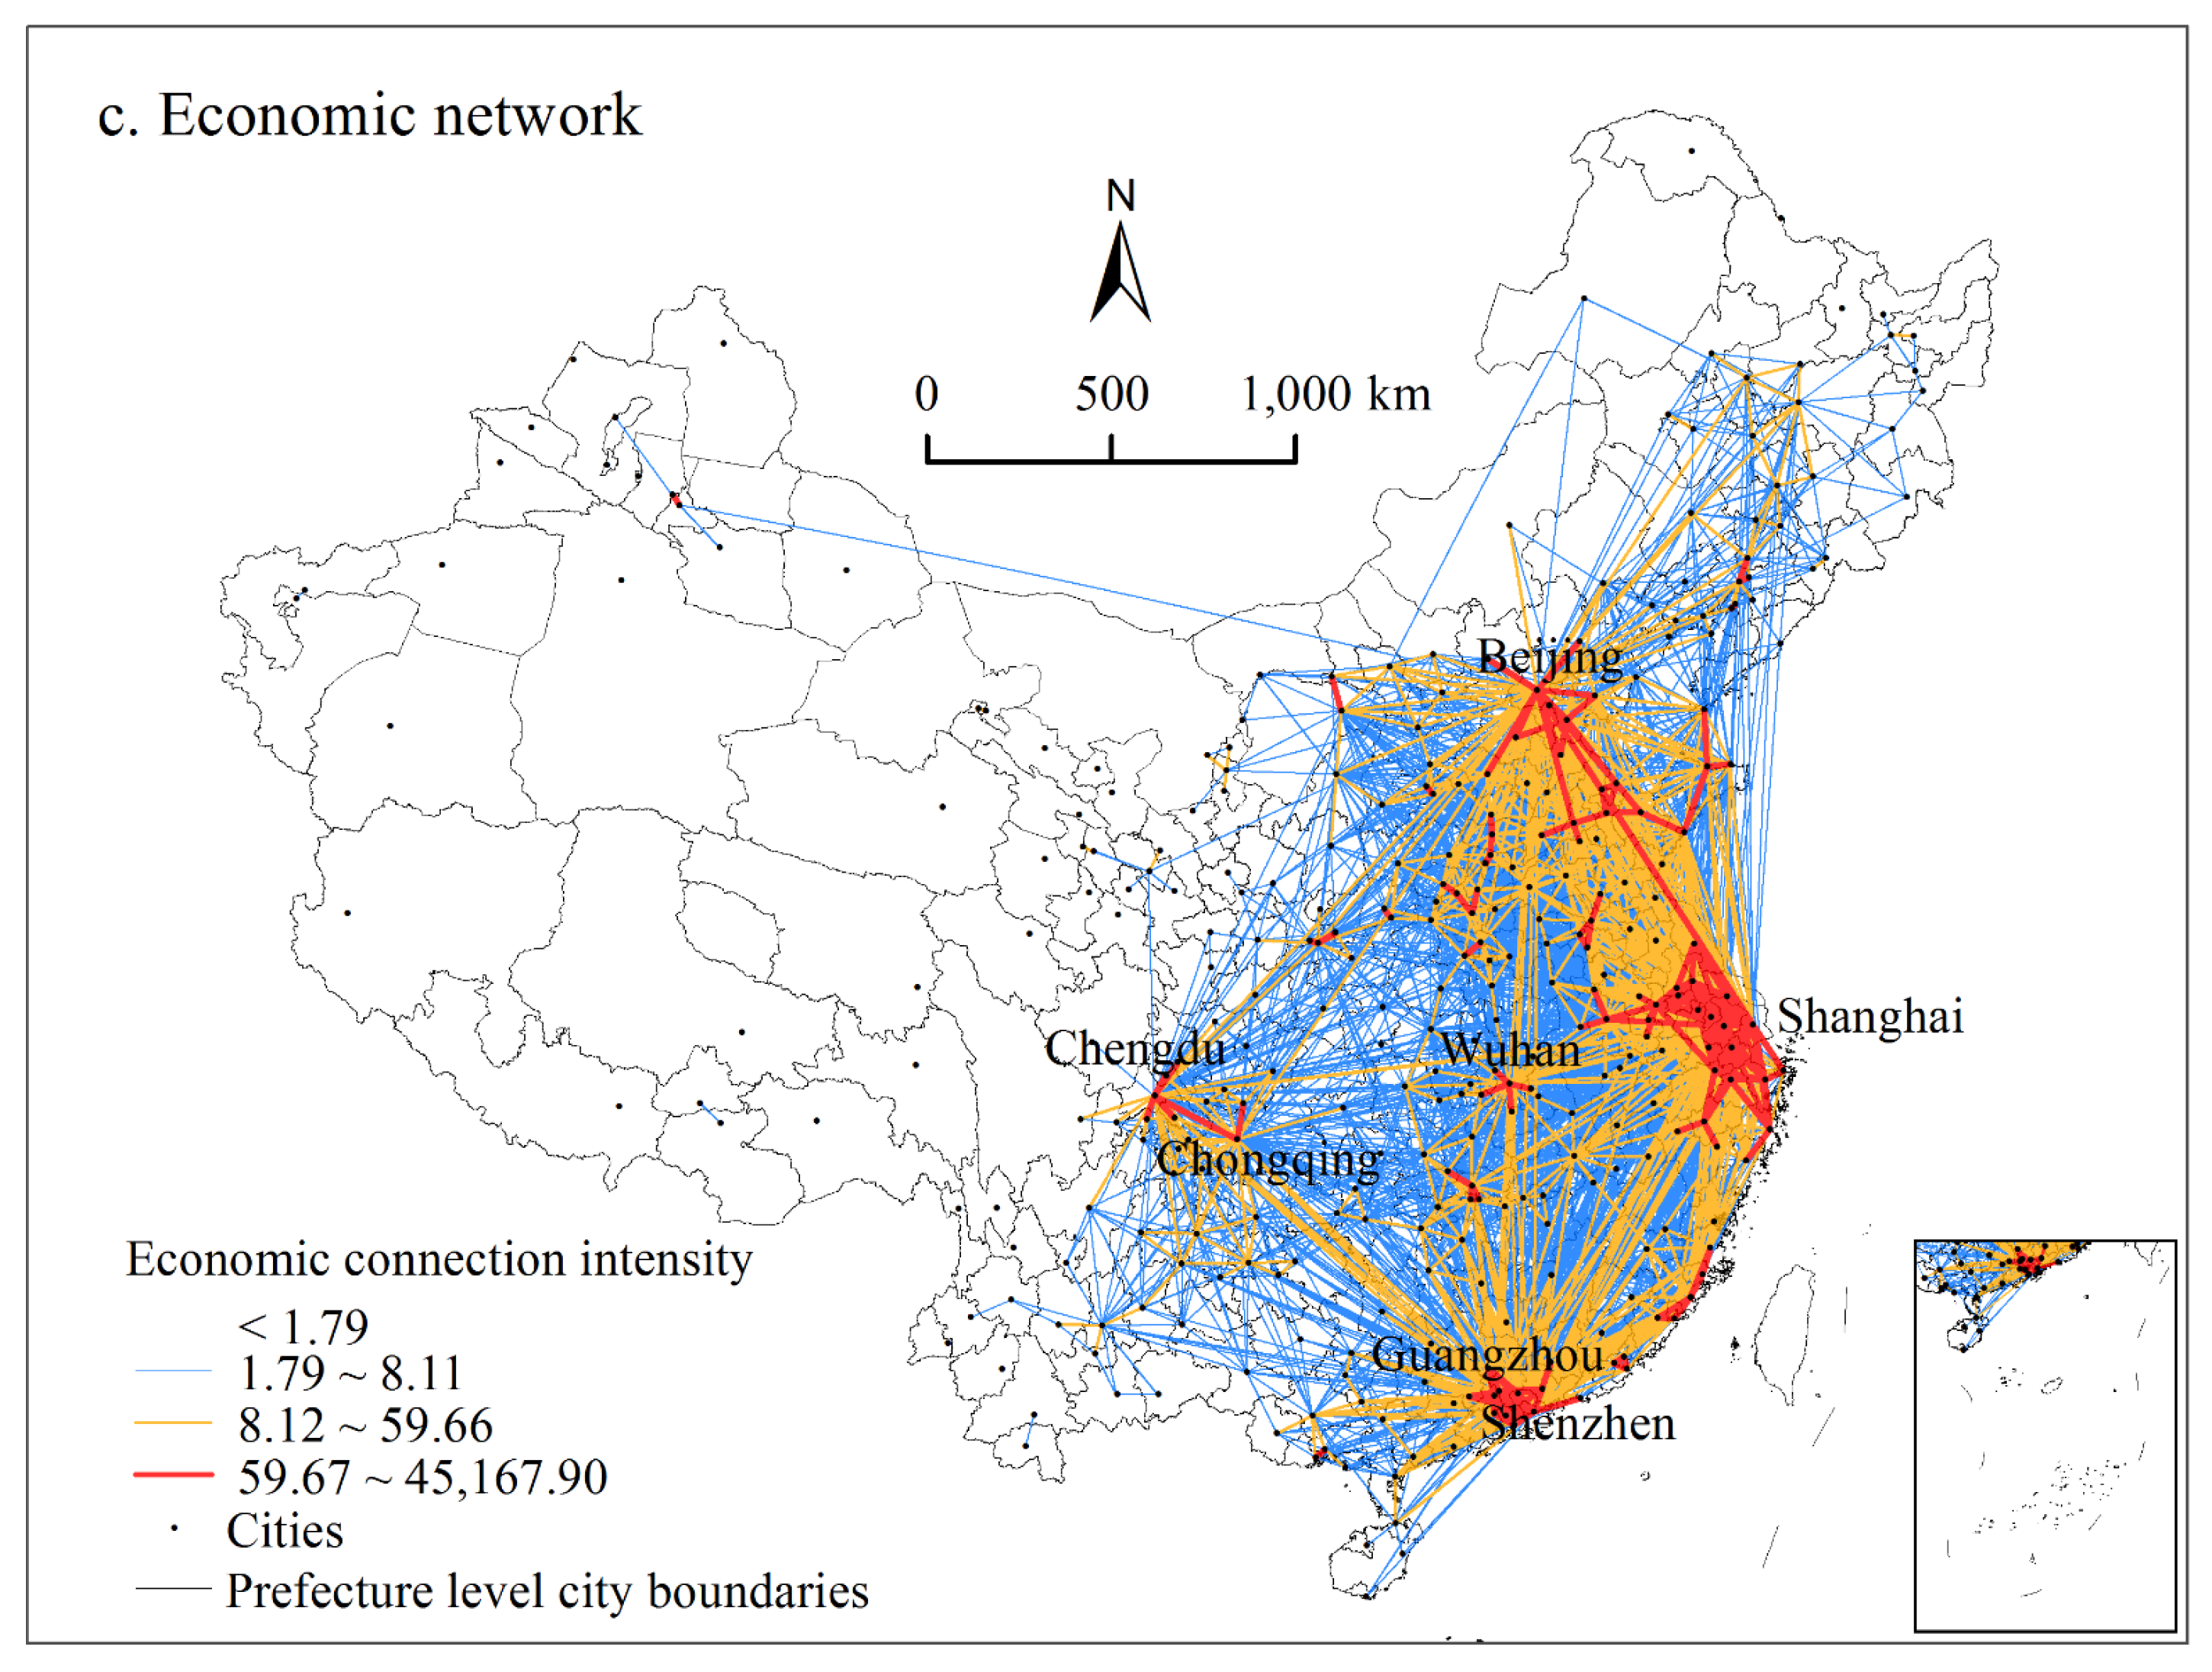
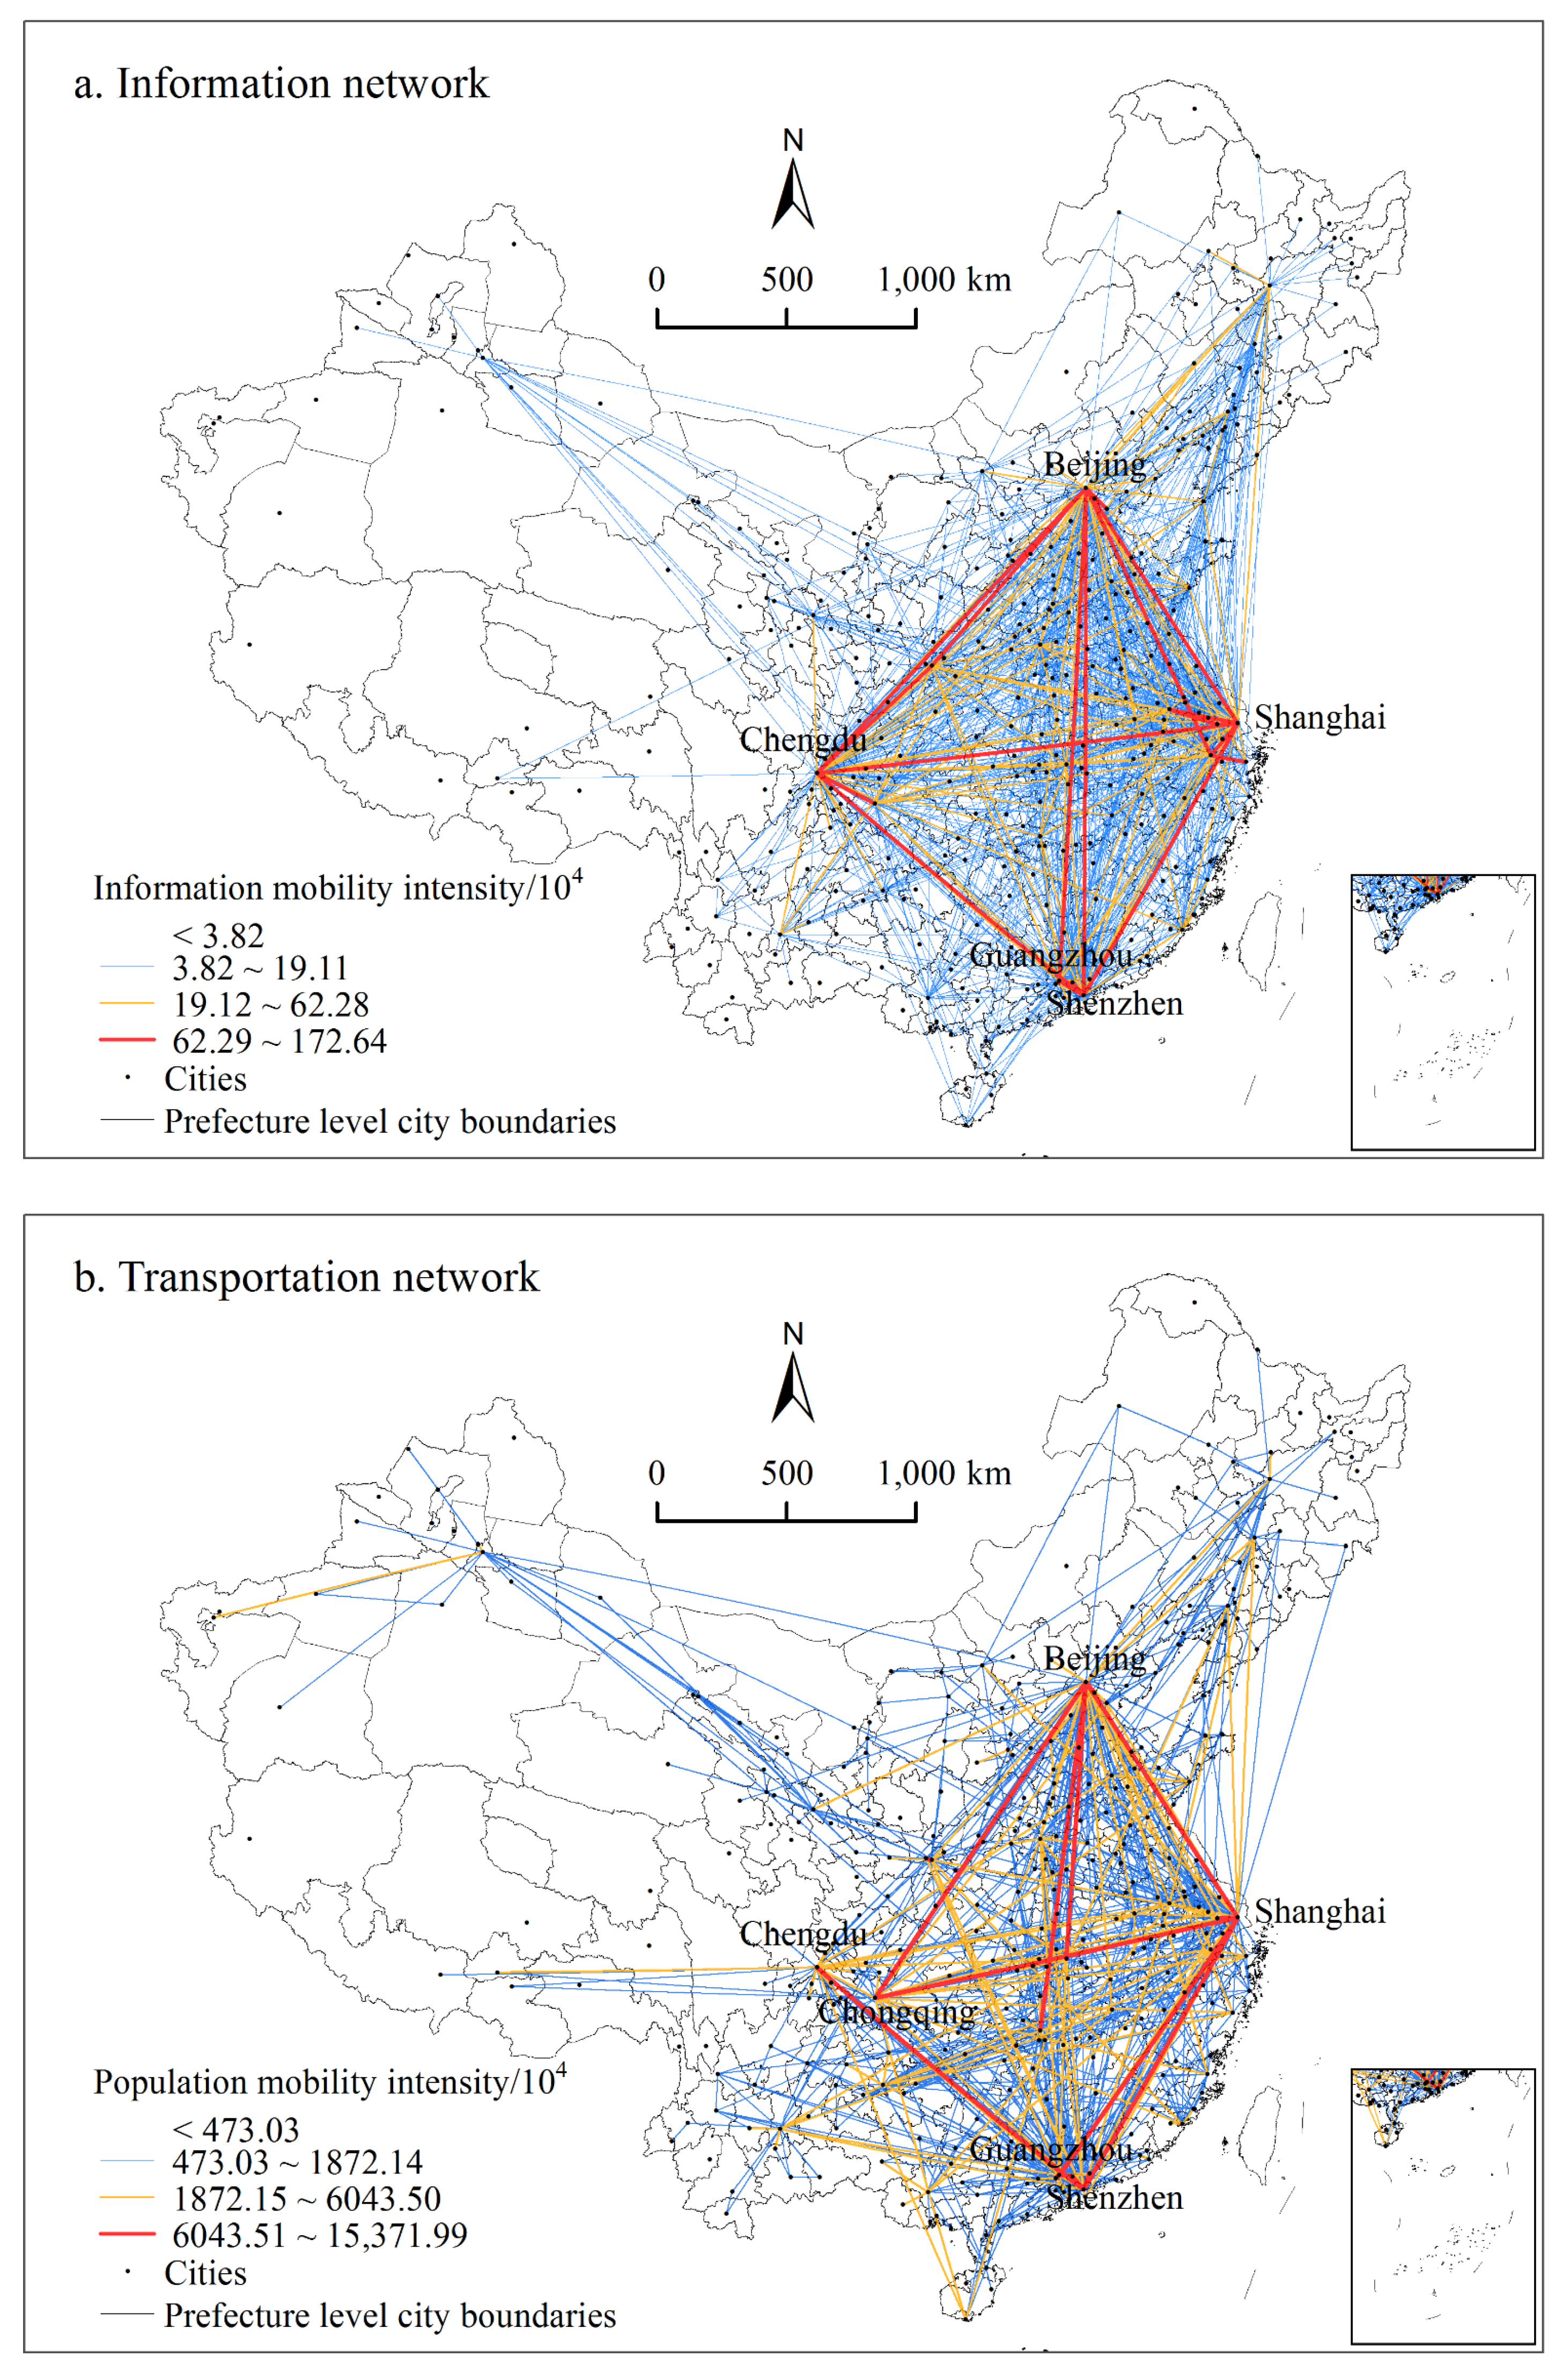
4.1. Spatial Pattern of Urban Connection Networks
4.2. Structural Characteristics of Urban Networks
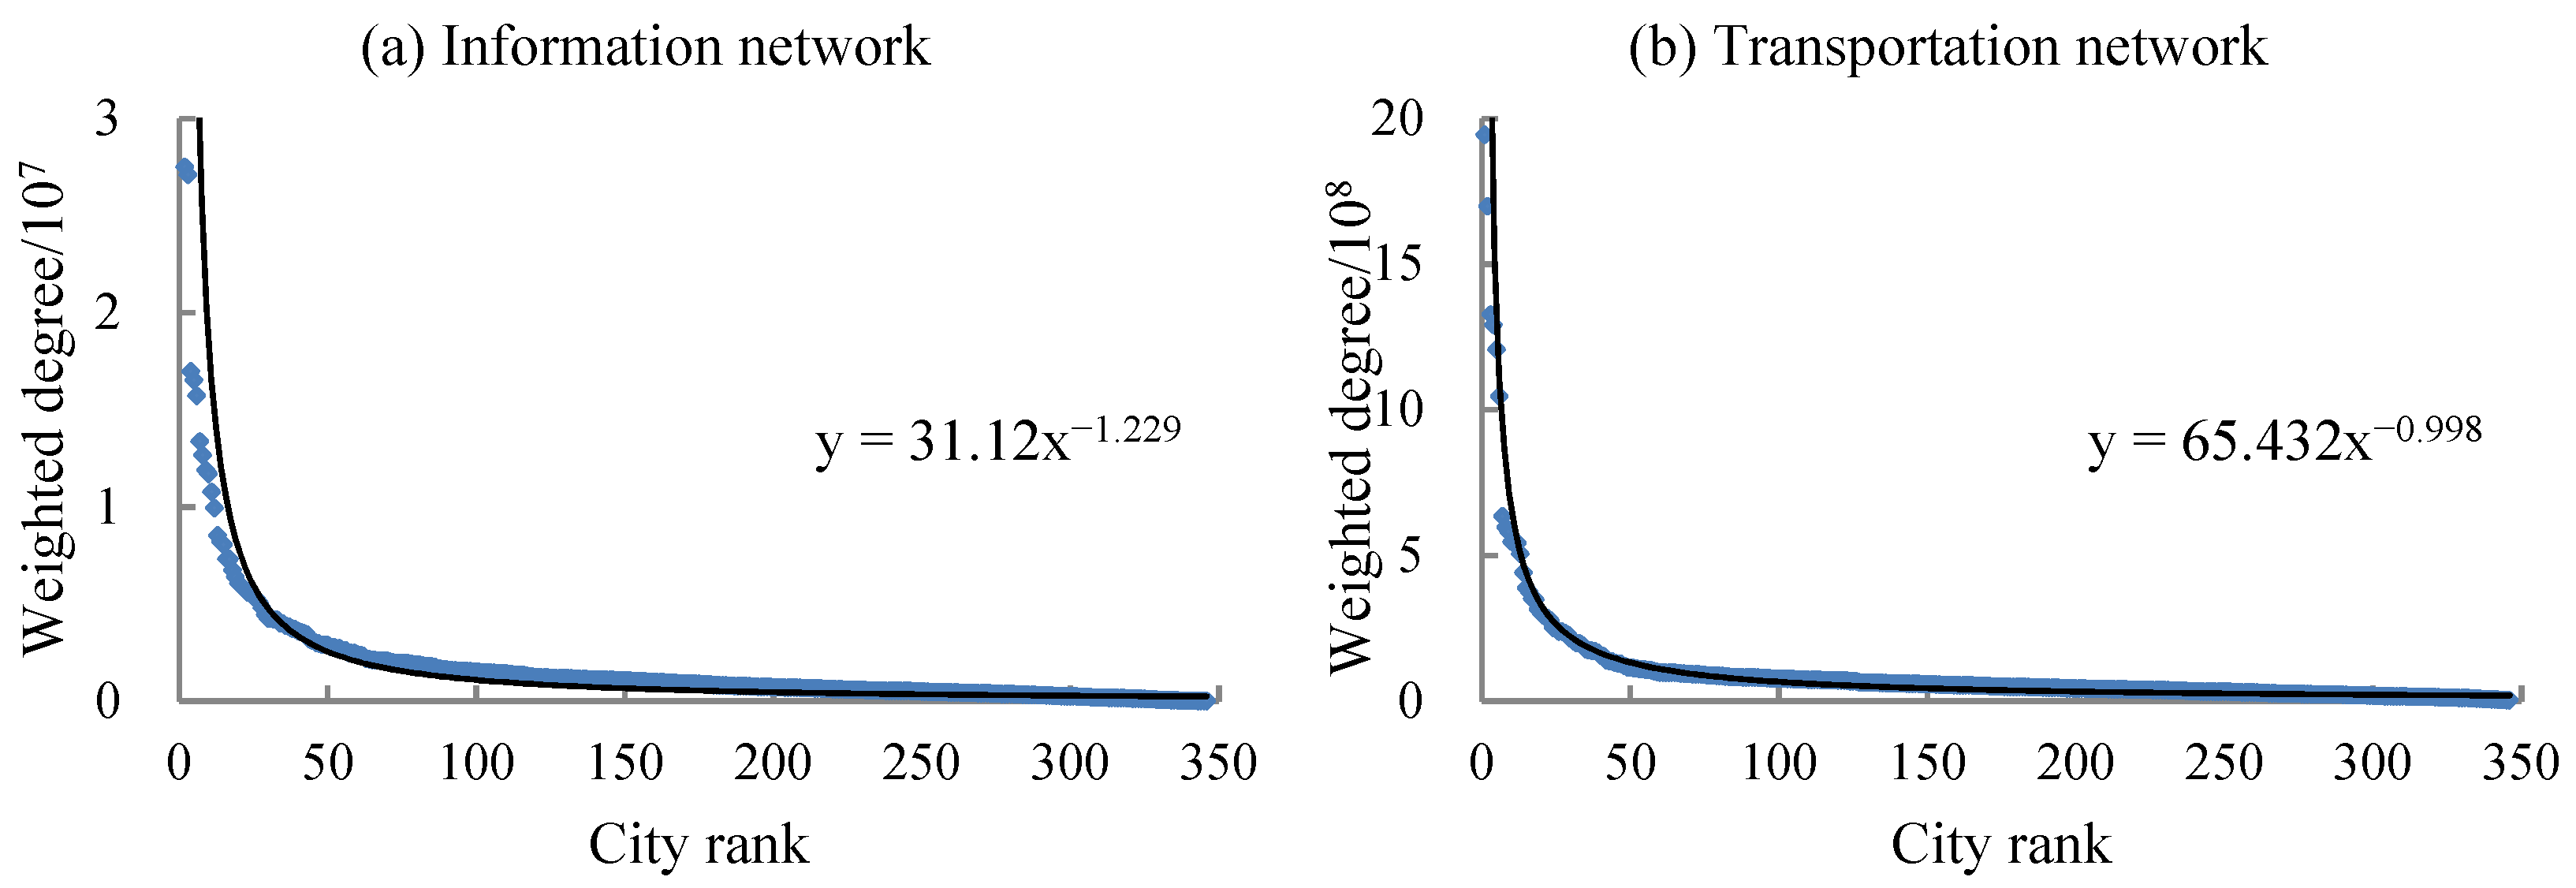
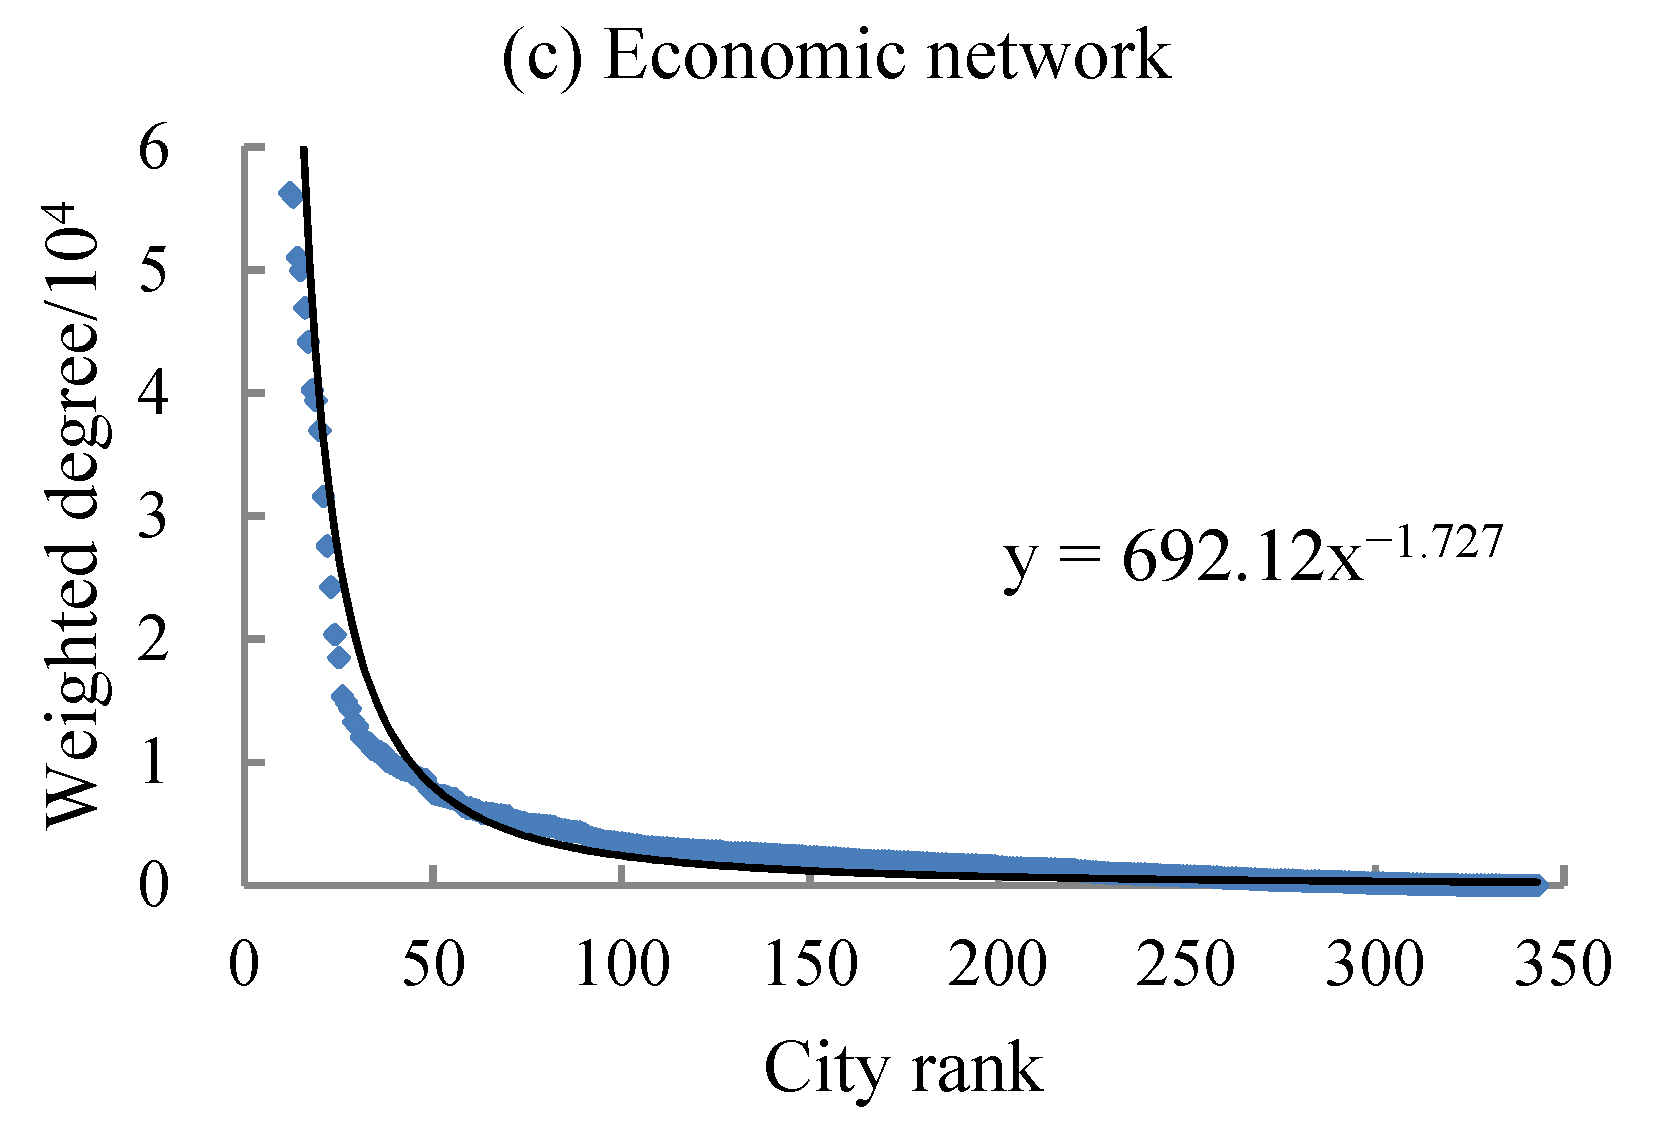
4.2.1. Hierarchy (Weighted Degree and Weighted Degree Distribution)
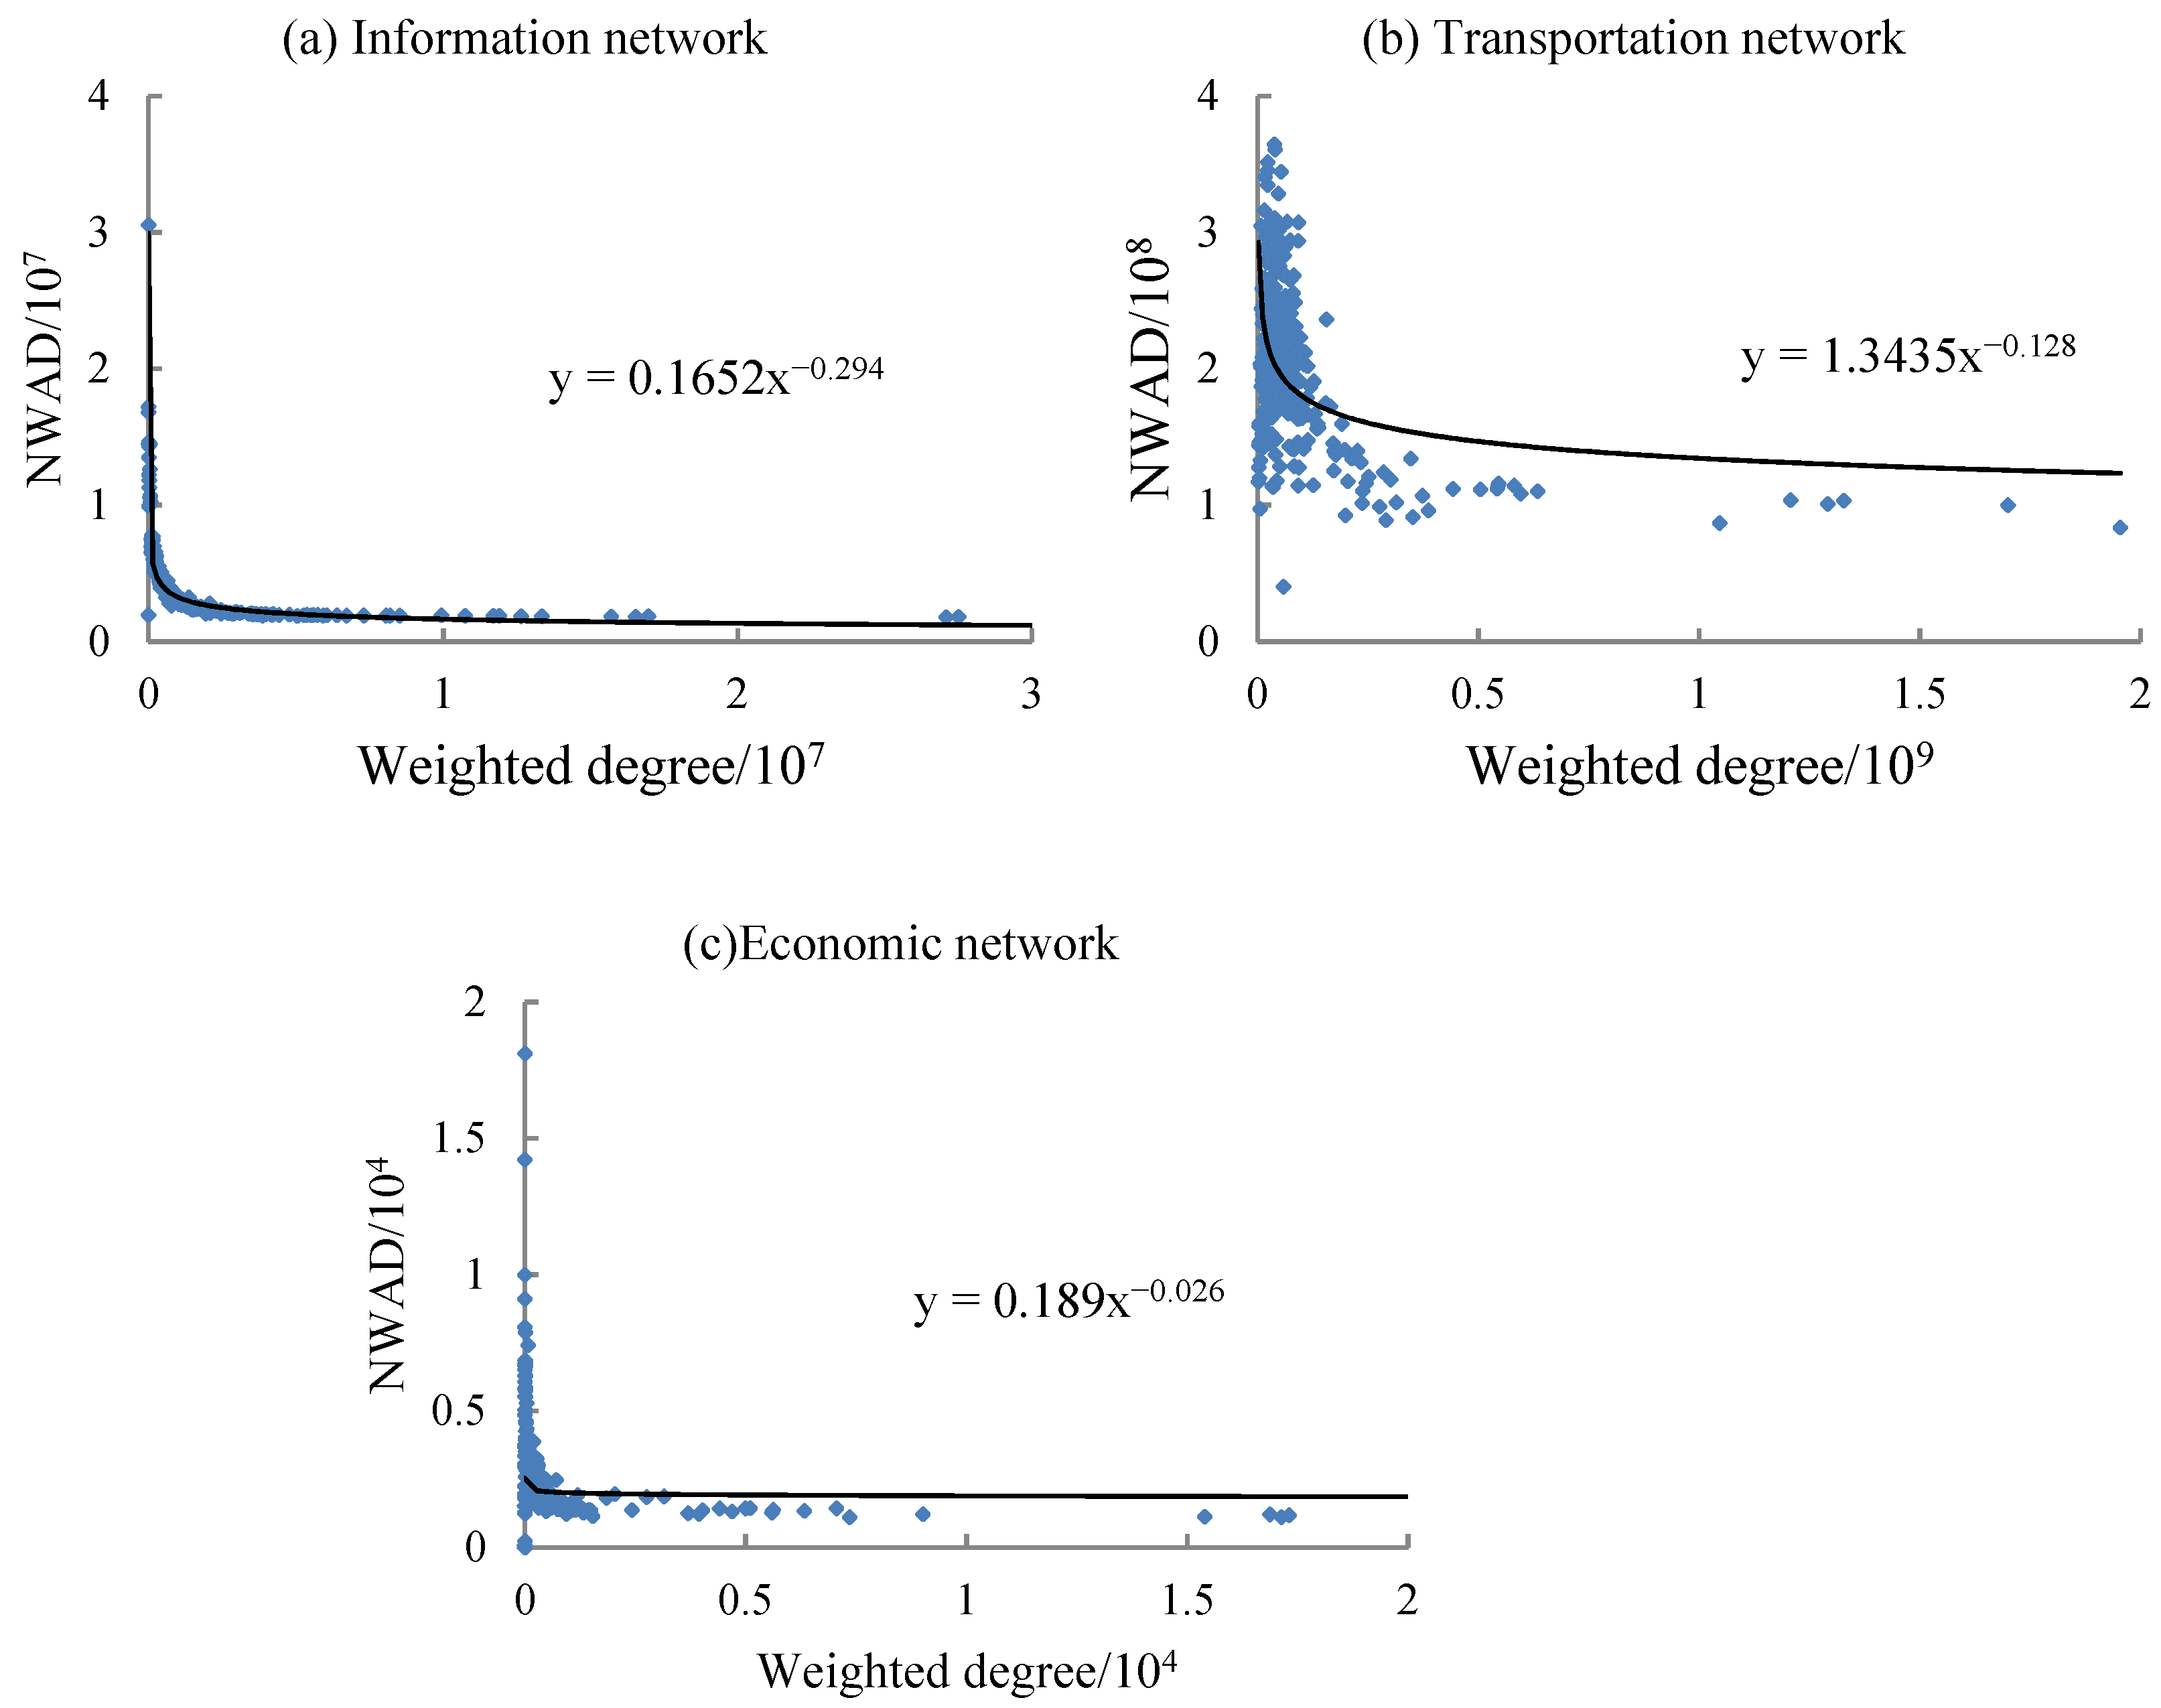
4.2.2. Assortativity (Neighbor-Weighted Average Degree and Weighted Degree Correlation)
4.3. Structural Resilience of Urban Networks under Disruption Scenarios
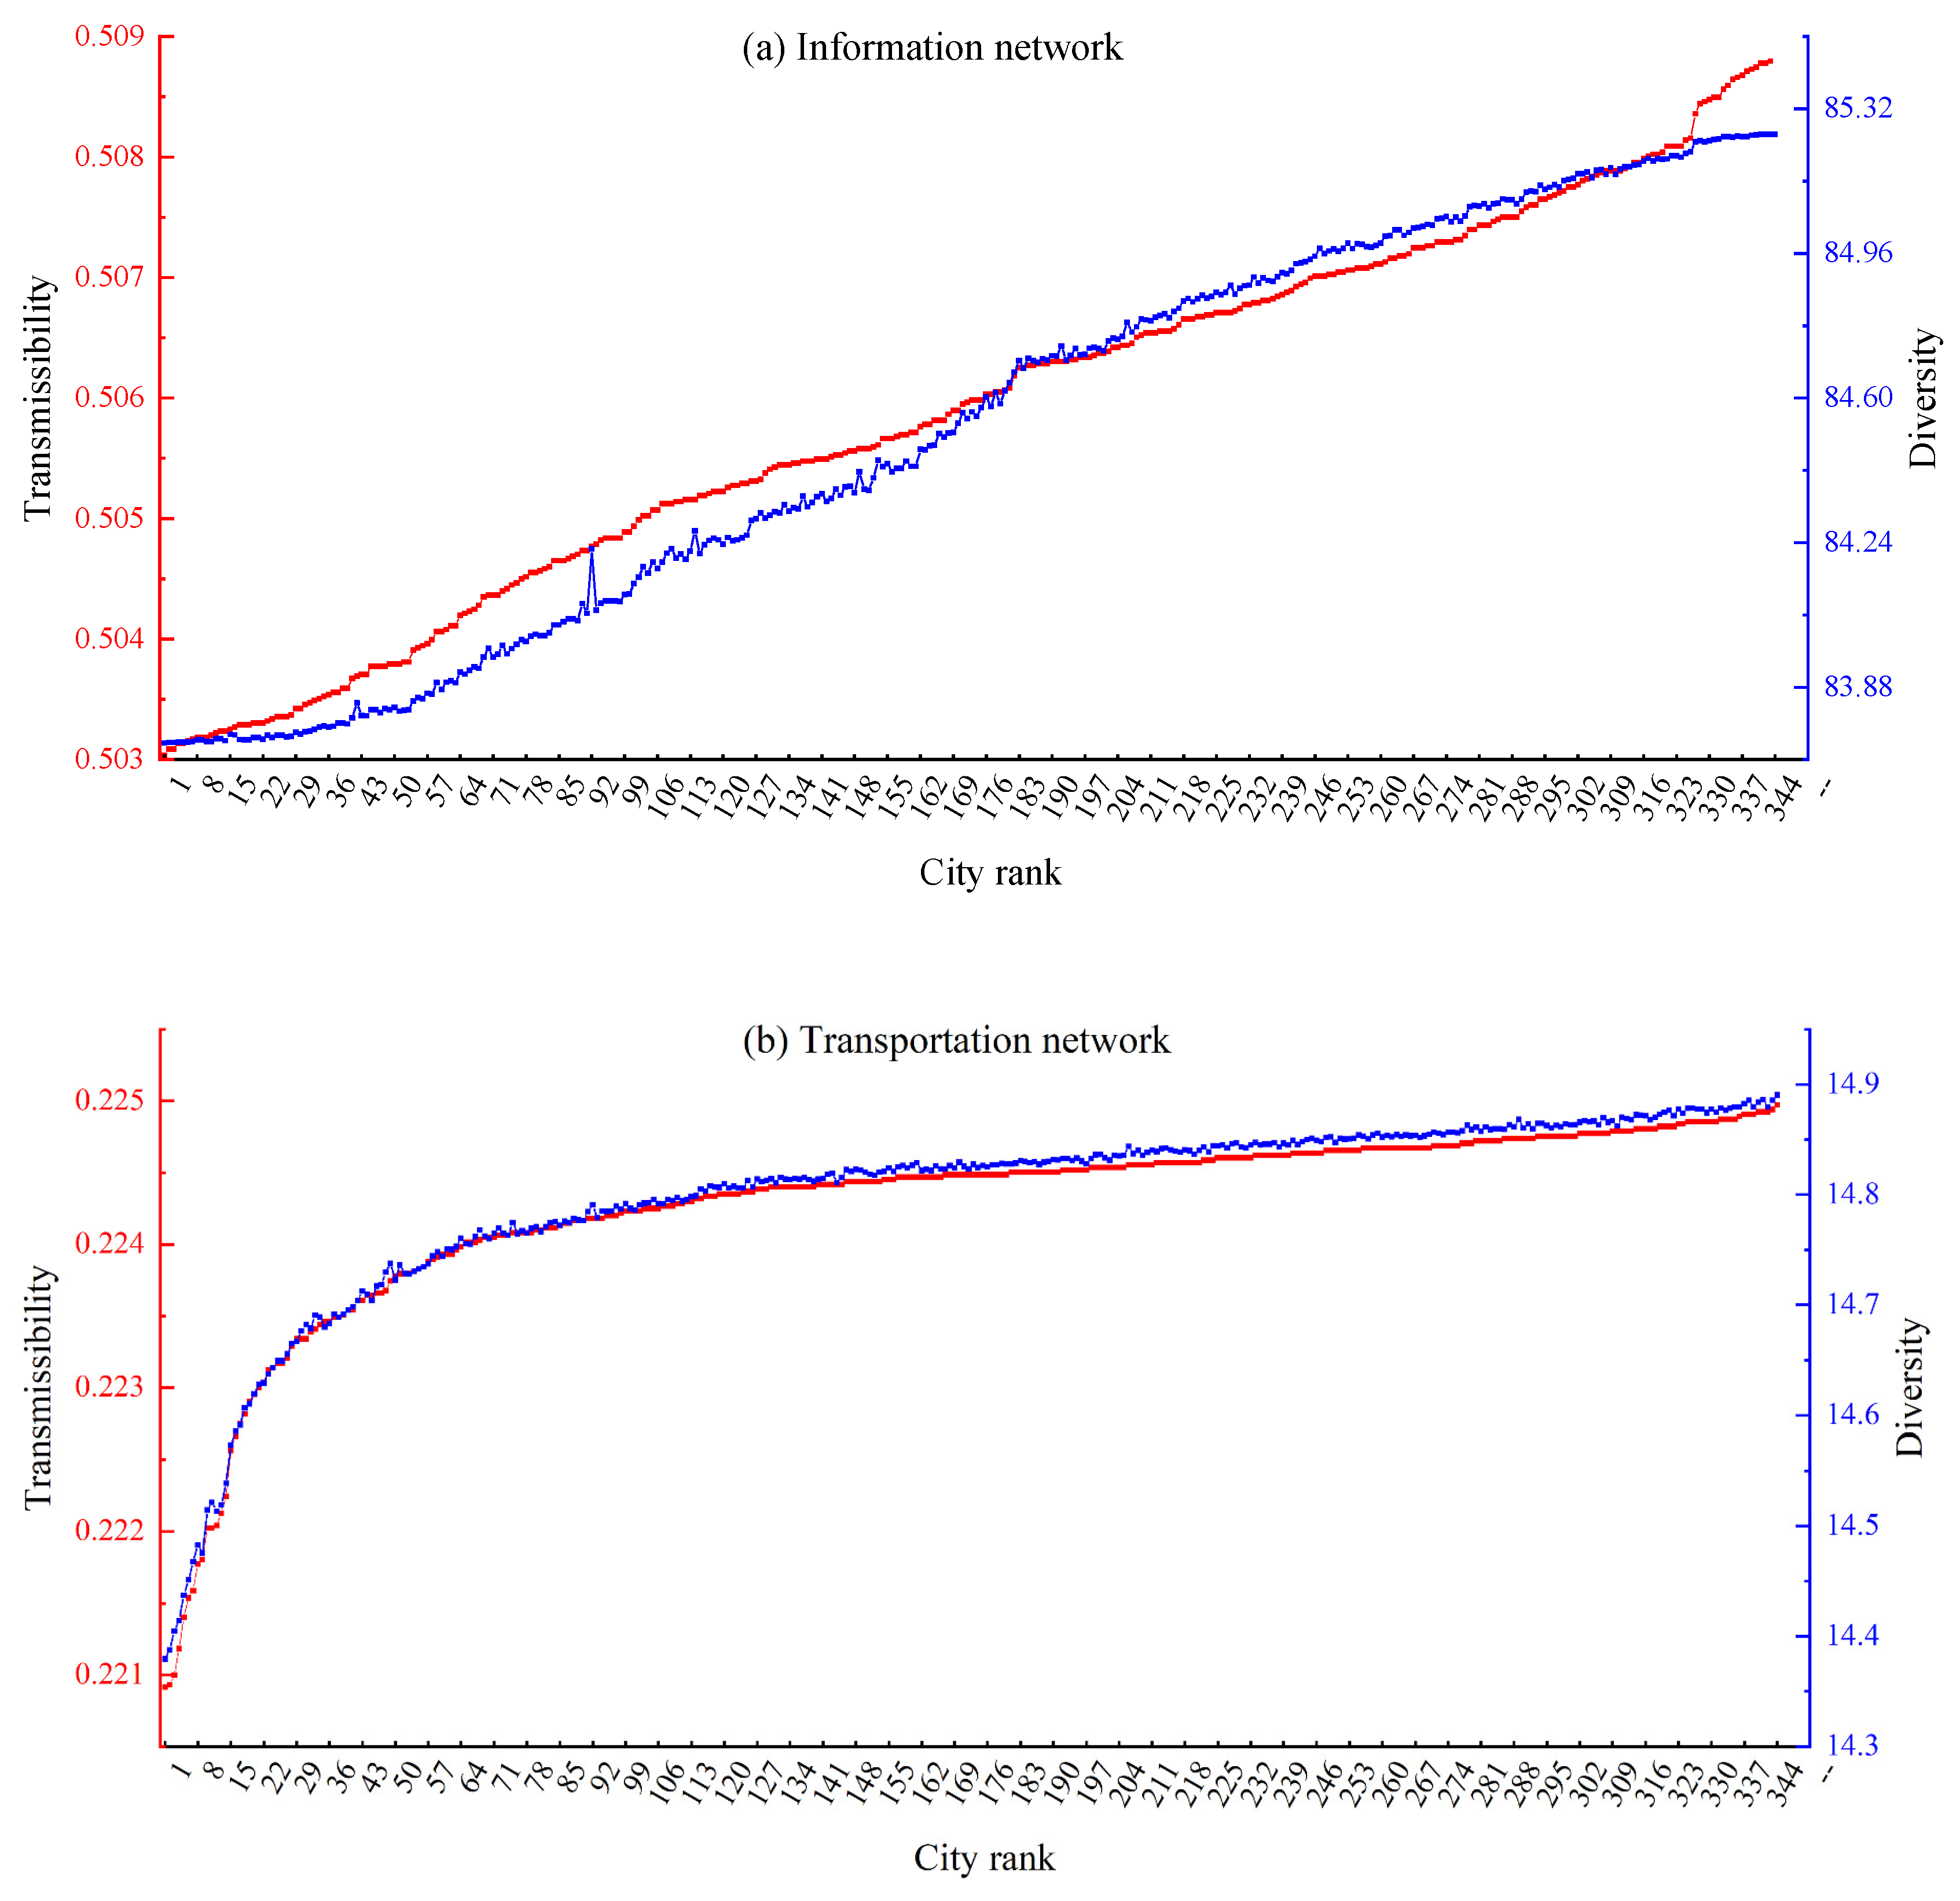
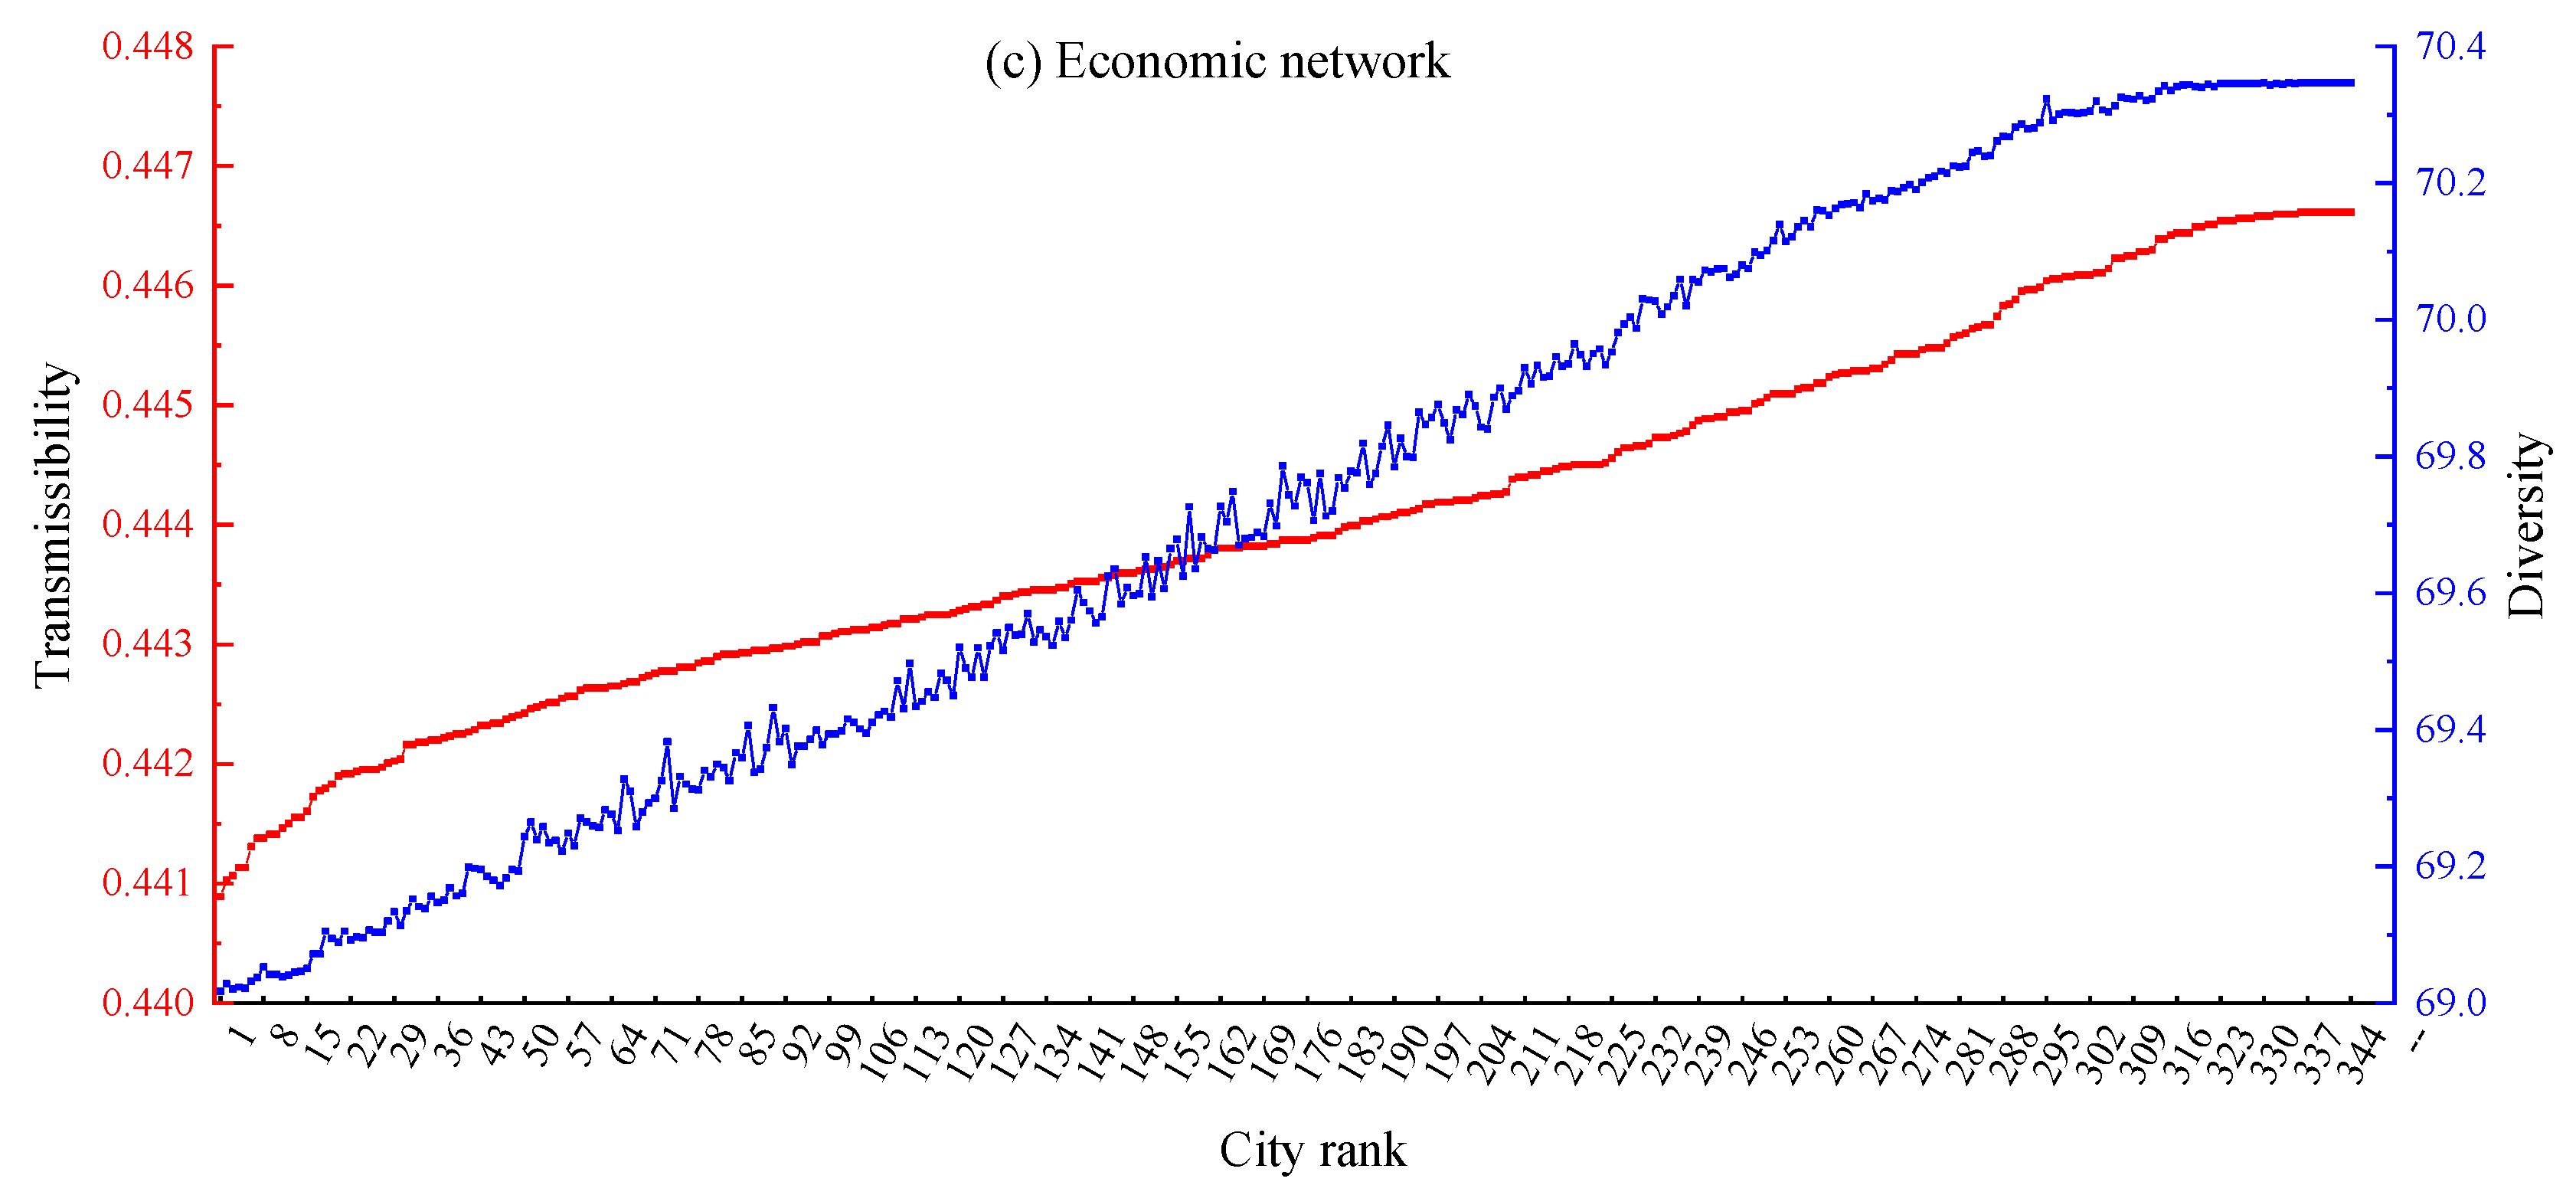
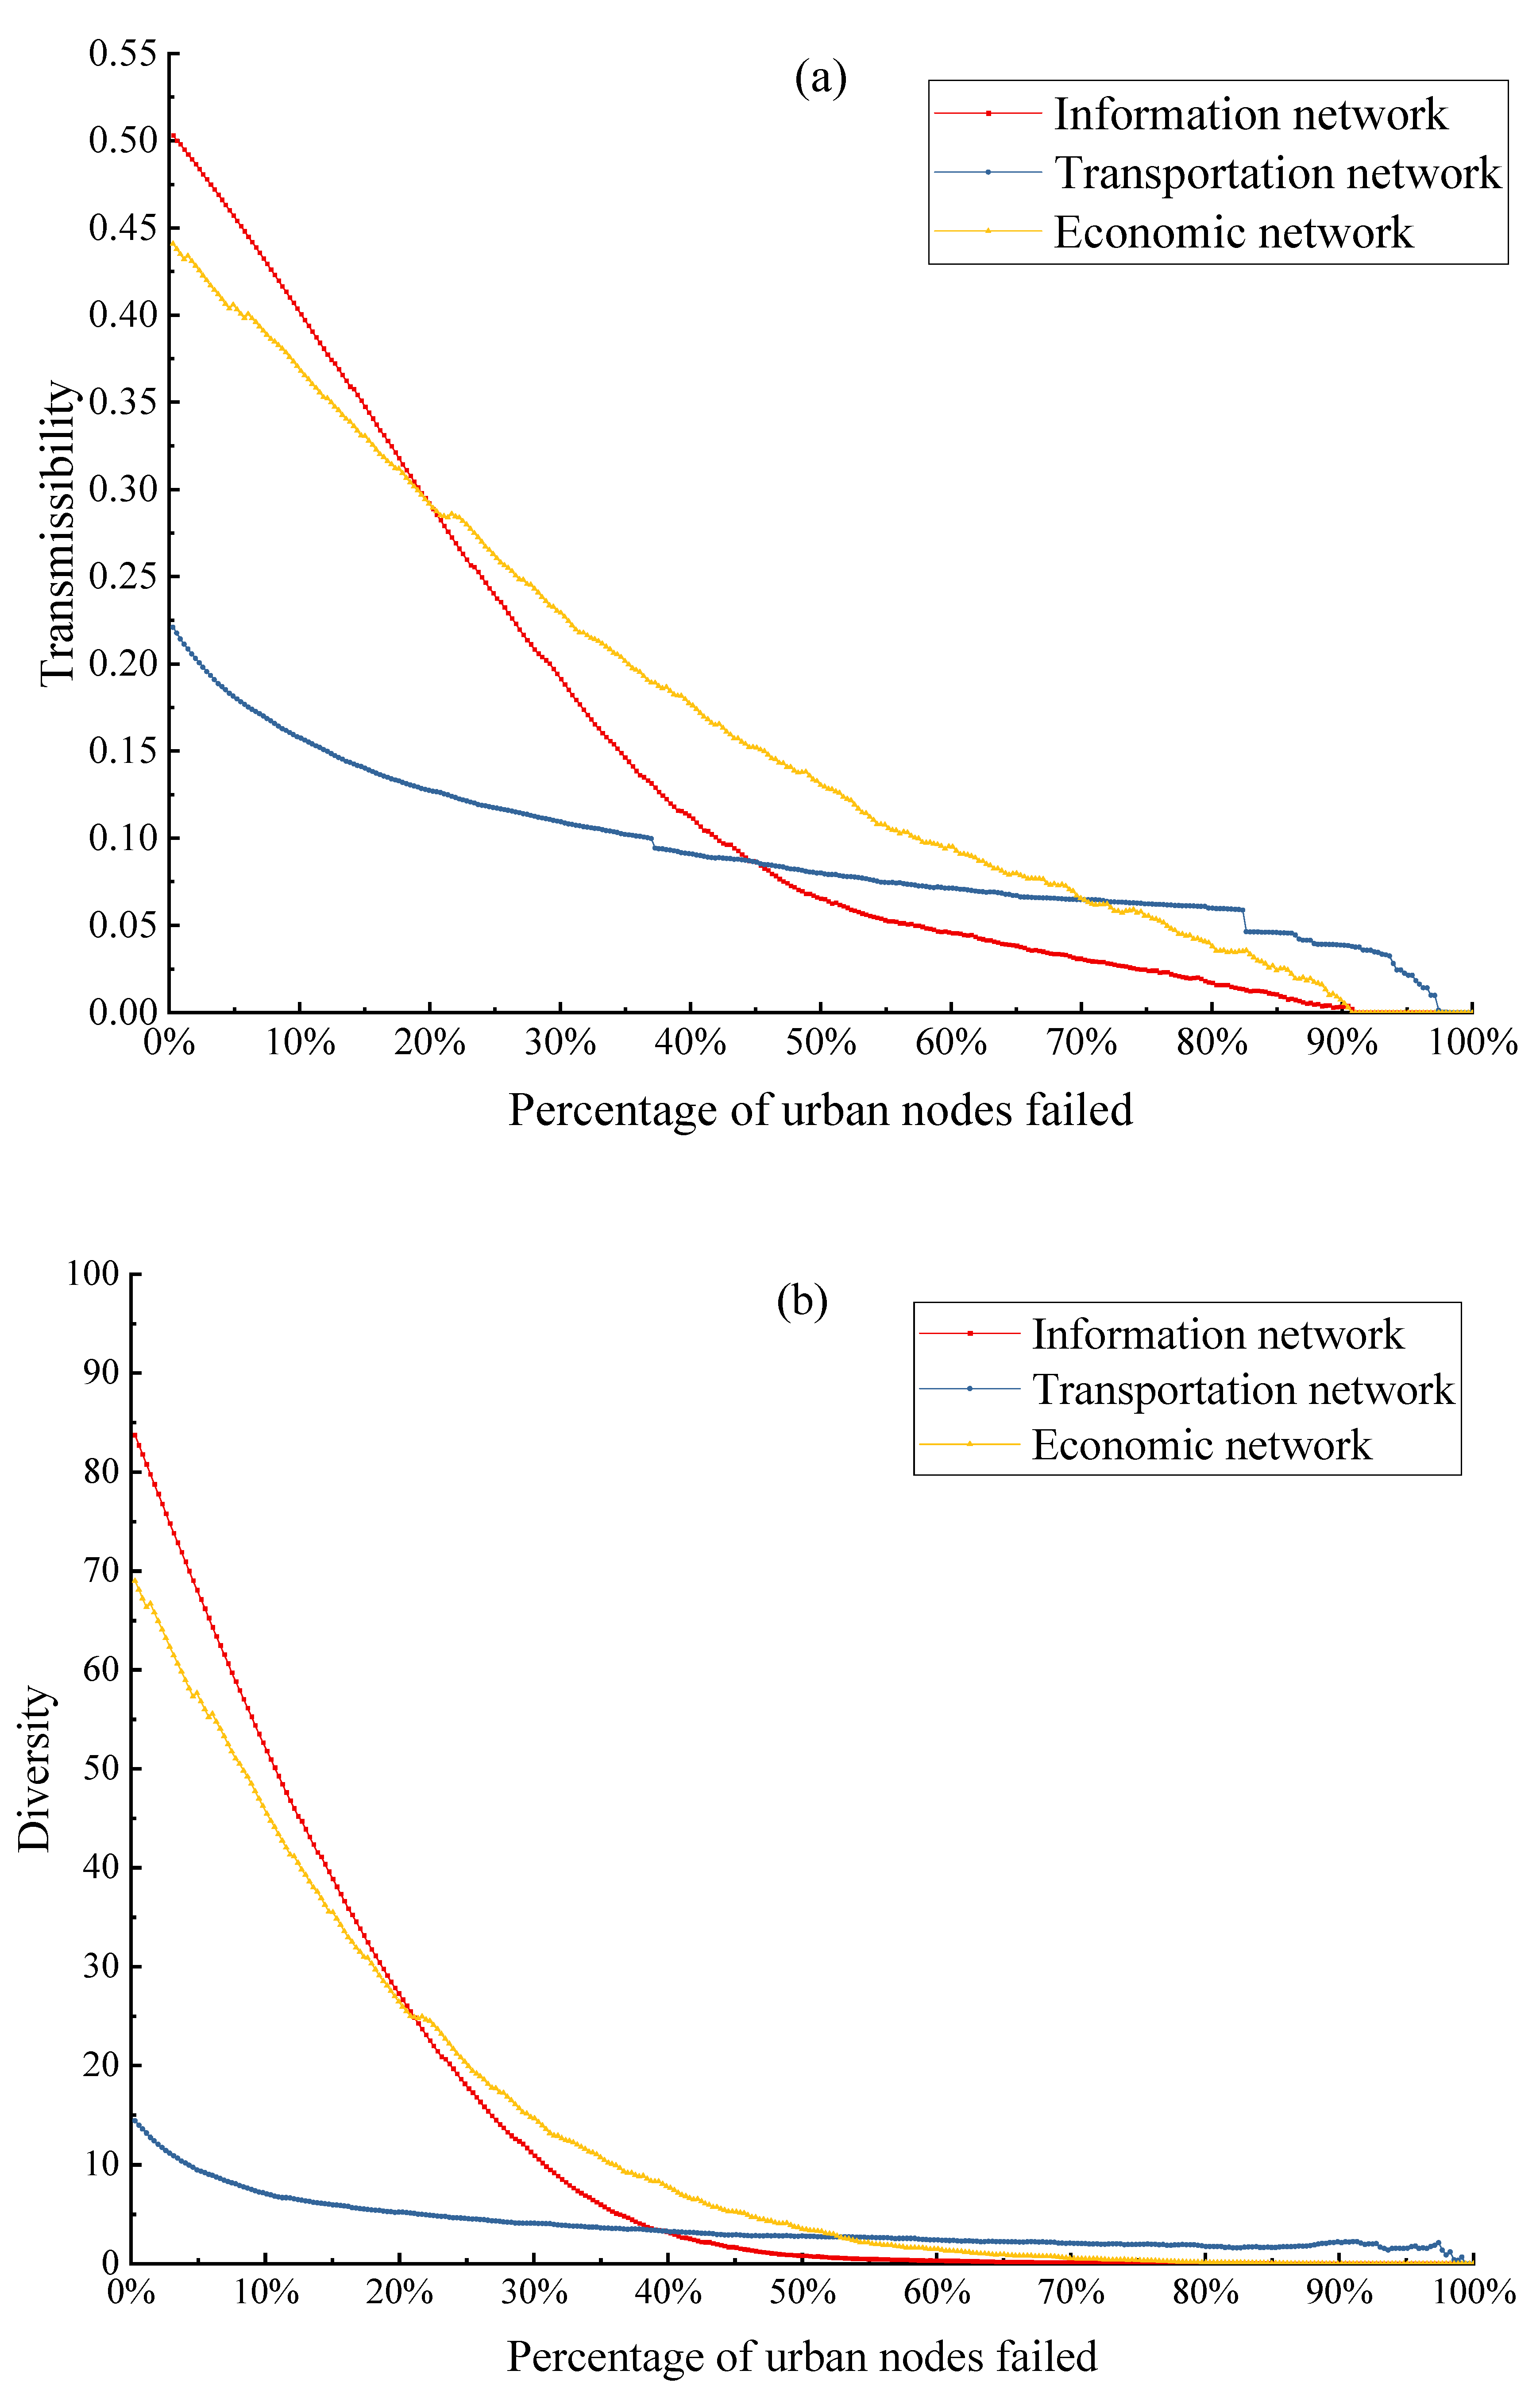
4.3.1. Transmissibility and Diversity of Urban Networks under Node Failures
4.3.2. Urban Network Resilience under Maximum Load Attack
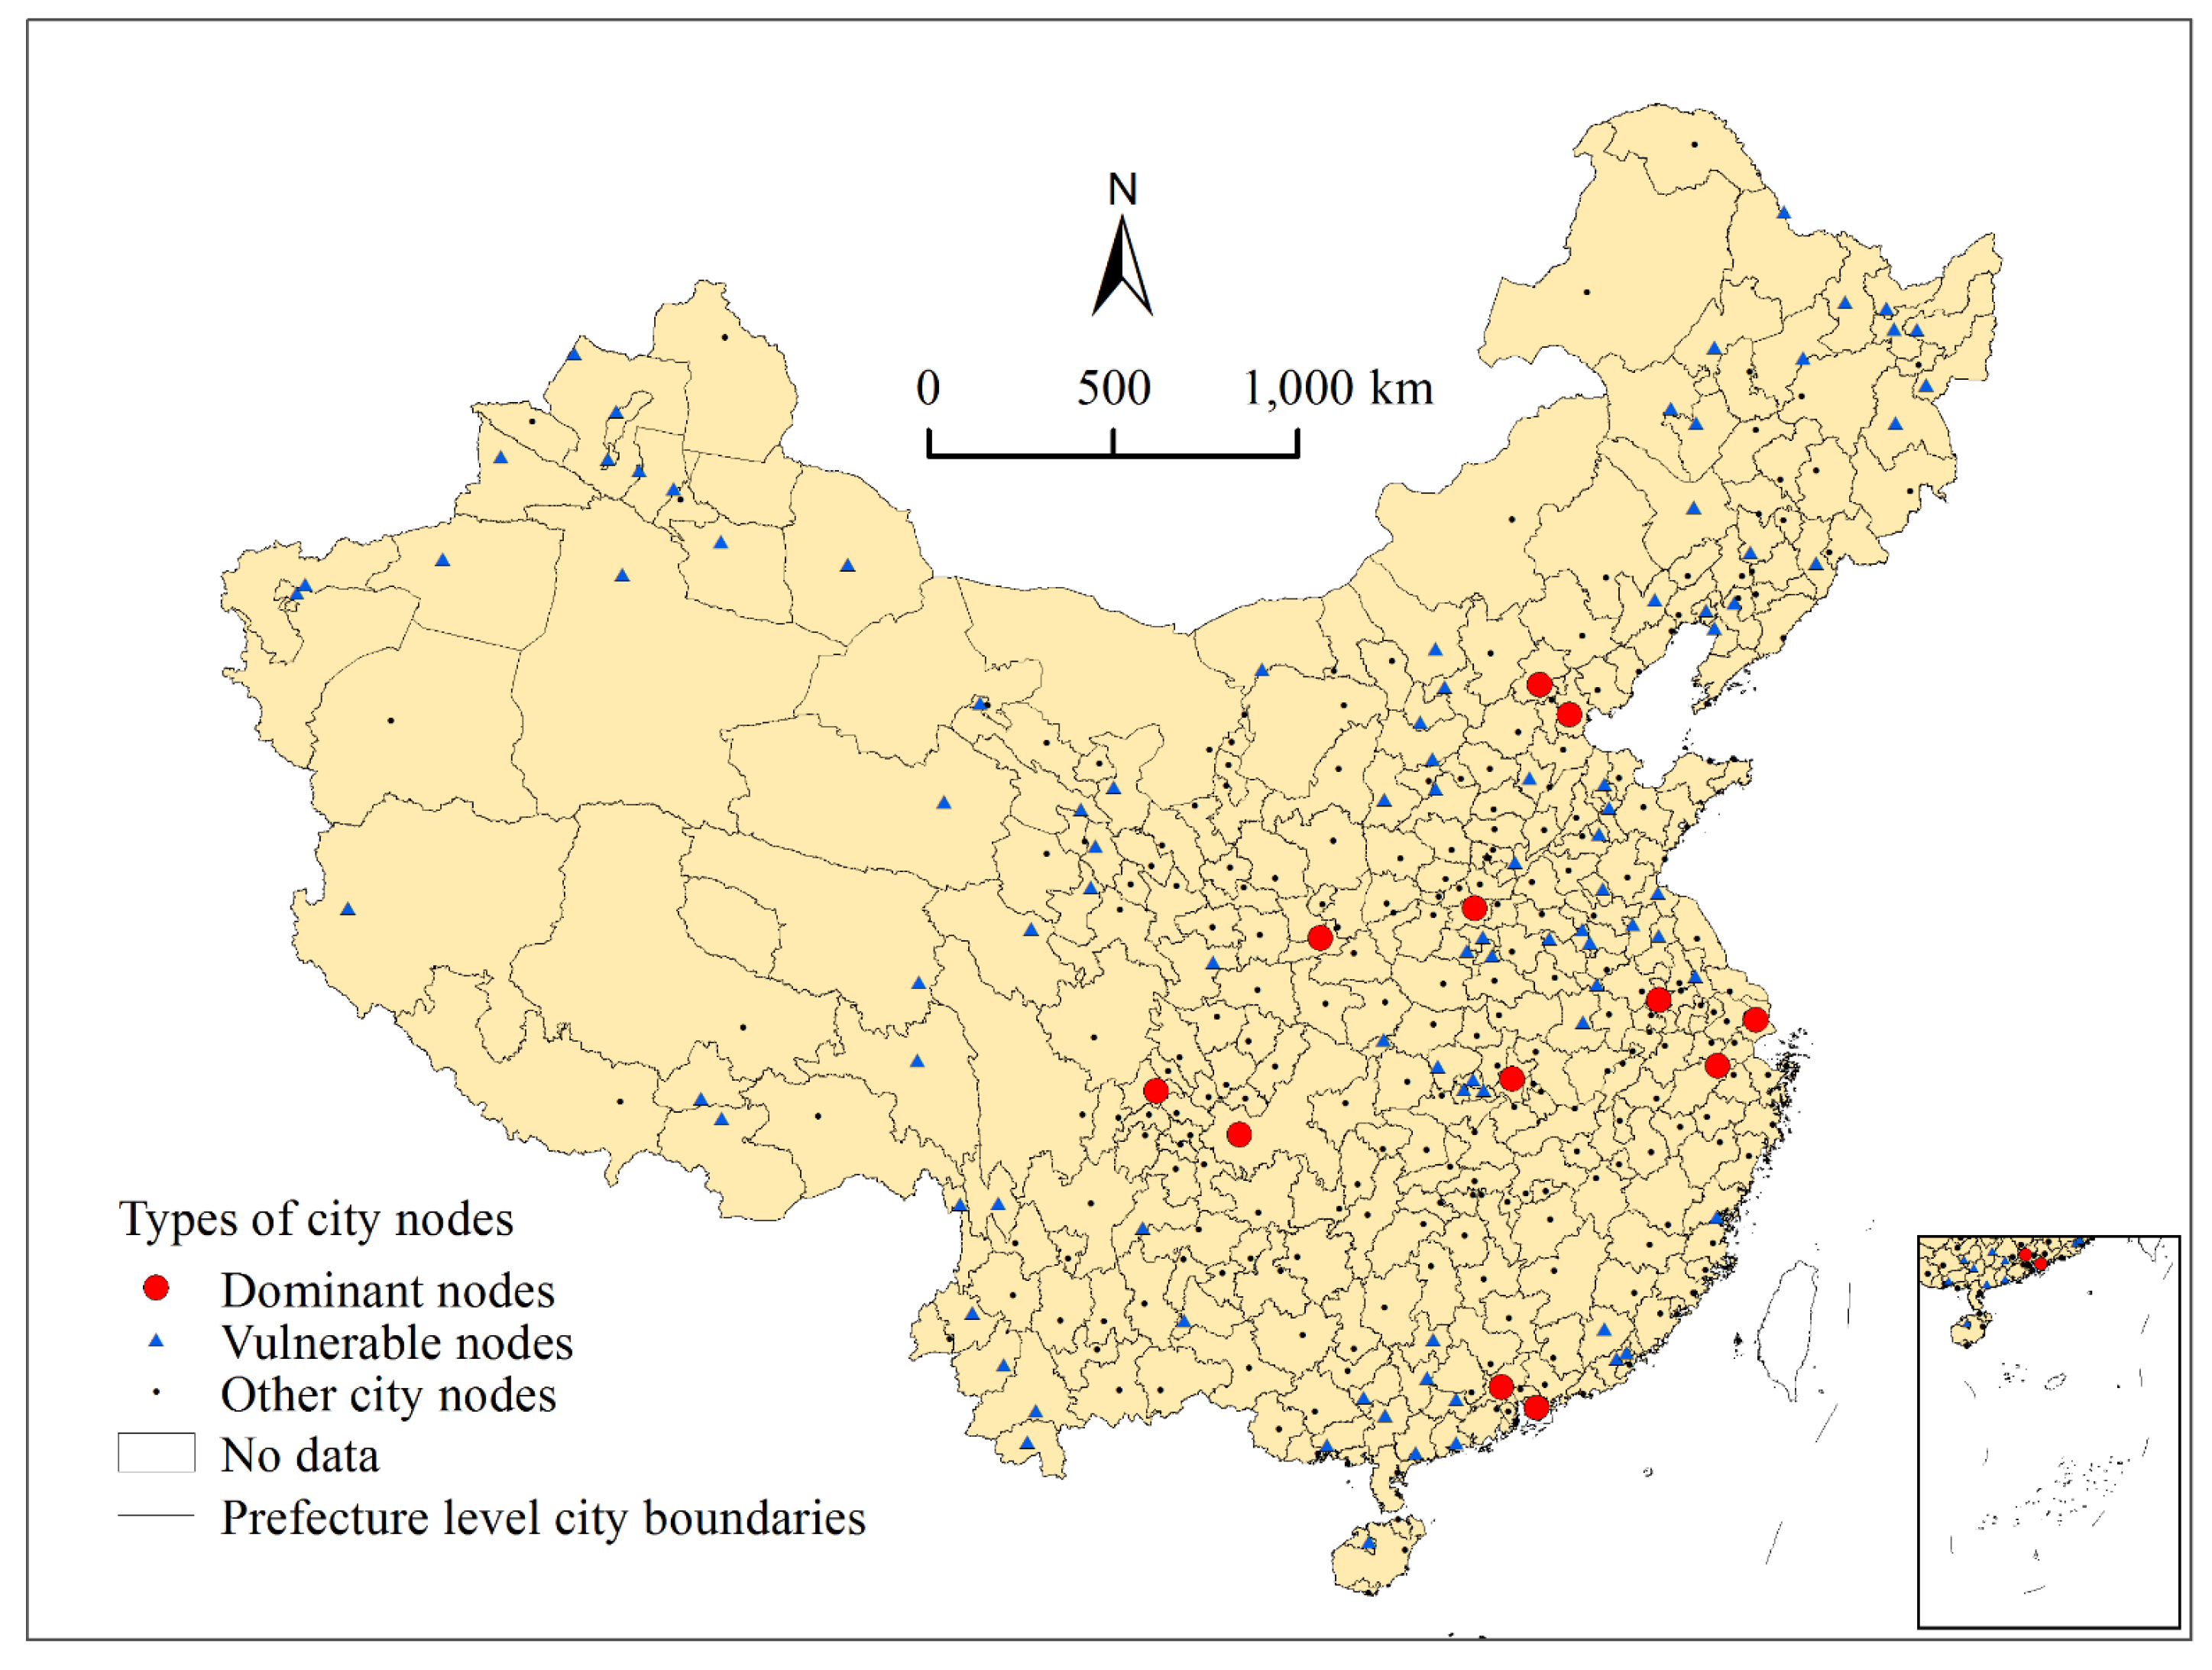
4.3.3. Dominant and Vulnerable Nodes
5. Discussion
5.1. Research Significance and Signatures of Urban Networks
5.2. Suggestions for Improving Regional Resilience
5.3. Limitations and Directions for Future Research
6. Conclusions
- (1)
- The pattern of spatial distribution of the information, transportation, and economic networks of cities at the prefecture level and above in China in 2017 is characterized by density in the east and sparsity in the west. Compared with the transportation network, the information network is more active in the exchange of elements among cities because it is less limited by region and distance. Even so, it tends to be more active in developed cities or regions. The economic network is affected by distance attenuation, which reflects the conservative exchange of elements among cities, and its cross-regional interaction is weak.
- (2)
- The information, transportation, and economic networks have different structural characteristics in terms of hierarchy and disassortativity. The information network, with a high hierarchy and the strongest heterogeneous connection, has the highest transmissibility and diversity, whereas the economic network has the highest hierarchy and the lowest disassortativity. The transportation network has high heterogeneity, but its hierarchy, transmissibility, and diversity are the lowest.
- (3)
- In the face of an external impact or interference, a highly heterogeneous network is more likely to experience structural shocks owing to its cross-regional urban links. Core cities can use their control and competitive advantages to stimulate regional conformity and to improve the overall efficiency of the network. Moreover, numerous and diversified heterogeneous connections can activate the vitality of the functional complementarity of the network and directional cooperation by softening path inertia between core cities and general nodes. However, this also exposes the vulnerability of the network in a complex regional environment.
- (4)
- Identifying dominant and vulnerable nodes can help accurately determine the motivation of network structure resilience. When the network is paralyzed in the case of a crisis, as the core cities of China’s urban network, 12 dominant nodes seriously interfere with the resilience of the network. Therefore, government officials should try to reduce the possibility that dominant nodes will fail and should improve their response capacity by strengthening the construction of emergency systems and risk prevention mechanisms. As edge nodes, the 93 vulnerable nodes should focus on enhancing resistance to risk by promoting the circulation of elements and by enhancing their centrality. Furthermore, it is necessary to strengthen the relationships between vulnerable nodes and adjacent regions in order to form a more resilient intraregional structure.
Author Contributions
Funding
Data Availability Statement
Conflicts of Interest
References
- Capello, R. The city network paradigm: Measuring urban network externalities. Urban Stud. 2000, 37, 1925–1945. [Google Scholar] [CrossRef]
- van Oort, F.; Burger, M.; Raspe, O. On the economic foundation of the urban network paradigm: Spatial integration, functional integration and economic complementarities within the Dutch Randstad. Urban Stud. 2010, 47, 725–748. [Google Scholar] [CrossRef] [Green Version]
- Tan, C.H.; Guan, M.M.; Dou, J.M. Understanding the impact of high speed railway on urban innovation performance from the perspective of agglomeration externalities and network externalities. Technol. Soc. 2021, 67, 101760. [Google Scholar] [CrossRef]
- Castells, M. Grassrooting the space of flows. Urban Geogr. 1999, 20, 294–302. [Google Scholar] [CrossRef]
- Camagni, R.; Salone, C. Network urban structures in Northern Italy: Elements for a theoretical framework. Urban Stud. 1993, 30, 1053–1064. [Google Scholar] [CrossRef]
- Huang, Y.; Hong, T.; Ma, T. Urban network externalities, agglomeration economies and urban economic growth. Cities 2020, 107, 102882. [Google Scholar] [CrossRef]
- Derudder, B.; Taylor, P.J.; Witlox, F.; Catalano, G. Hierarchical tendencies and regional patterns in the world city network: A global urban analysis of 234 cities. Reg. Stud. 2003, 37, 875–886. [Google Scholar] [CrossRef]
- Castells, M. Globalisation, networking, urbanisation: Reflections on the spatial dynamics of the information age. Urban Stud. 2010, 47, 2737–2745. [Google Scholar] [CrossRef]
- Lai, J.B.; Pan, J.H. China’s city network structural characteristics based on population flow during Spring Festival travel rush: Eempirical analysis of “Tencent Migration” big data. J. Urban Plan. Dev. 2020, 146, 04020018. [Google Scholar] [CrossRef]
- Sheppard, E. The spaces and times of globalization: Place, scale, networks, and positionality. Econ. Geogr. 2002, 78, 307–330. [Google Scholar] [CrossRef] [Green Version]
- Khunwishit, S.; Choosuk, C.; Webb, G. Flood resilience building in Thailand: Assessing progress and the effect of leadership. Int. J. Disaster Risk Sci. 2018, 9, 44–54. [Google Scholar] [CrossRef] [Green Version]
- Niu, X.Y.; Yue, Y.F.; Liu, S.H. Negative effects of massive intercity population movement on the security of urban agglomerations. J. Nat. Resour. 2021, 36, 2181–2192. [Google Scholar] [CrossRef]
- Christopherson, S.; Michie, J.; Tyler, P. Regional resilience: Theoretical and empirical perspectives. Camb. J. Reg. Econ. Soc. 2010, 3, 3–10. [Google Scholar] [CrossRef]
- Palekiene, O.; Simanaviciene, Z.; Bruneckiene, J. The application of resilience concept in the regional development context. Procedia-Soc. Behav. Sci. 2015, 213, 179–184. [Google Scholar] [CrossRef] [Green Version]
- Newman, M.E.J. Mixing patterns in networks. Phys. Rev. E Stat. Nonlinear Soft Matter Phys. 2003, 67, 241–251. [Google Scholar] [CrossRef] [Green Version]
- Crespo, J.; Suire, R.; Vicente, J. Lock-in or lock-out? How structural properties of knowledge networks affect regional resilience? J. Econ. Geogr. 2013, 14, 199–219. [Google Scholar] [CrossRef]
- Revi, A.; Satterthwaite, D.; Aragon-Durand, F.; Corfee-Morlot, J.; Kiunsi, R.B.R.; Pelling, M.; Roberts, D.; Solecki, W.; Gajjar, S.P.; Sverdlik, A. Towards transformative adaptation in cities: The IPCC’s Fifth Assessment. Environ. Urban. 2014, 26, 11–28. [Google Scholar] [CrossRef]
- Chen, C.K.; Xu, L.L.; Zhao, D.Y.; Xu, T.; Lei, P. A new model for describing the urban resilience considering adaptability, resistance and recovery. Saf. Sci. 2020, 128, 104756. [Google Scholar] [CrossRef]
- Zhao, K.; Kumar, A.; Harrison, T.P.; Yen, J. Analyzing the resilience of complex supply network topologies against random and targeted disruptions. IEEE Syst. J. 2011, 5, 28–39. [Google Scholar] [CrossRef]
- Chopra, S.S.; Khanna, V. Understanding resilience in industrial symbiosis networks: Insights from network analysis. J. Environ. Manag. 2014, 141, 86–94. [Google Scholar] [CrossRef]
- Peng, C.; Lin, Y.Z.; Gu, C.L. Evaluation and optimization strategy of city network structural resilience in the middle reaches of Yangtze River. Geogr. Res. 2018, 37, 1193–1207. [Google Scholar] [CrossRef]
- Ding, Y.T.; Zhang, M.; Chen, S.; Nie, R. Assessing the resilience of China’s natural gas importation under network disruptions. Energy 2020, 211, 118459. [Google Scholar] [CrossRef]
- Hosseini, S.; Barker, K.; Ramirez-Marquez, J.E. A review of definitions and measures of system resilience. Reliab. Eng. Syst. Saf. 2016, 145, 47–61. [Google Scholar] [CrossRef]
- Holling, S.C. Resilience and stability of ecological systems. Annu. Rev. Ecol. Syst. 1973, 4, 1–23. [Google Scholar] [CrossRef] [Green Version]
- Jabareen, Y. Planning the resilient city: Concepts and strategies for coping with climate change and environmental risk. Cities 2013, 31, 220–229. [Google Scholar] [CrossRef]
- Klein, R.; Nicholls, R.J.; Thomalla, F. Resilience to natural hazards: How useful is this concept? Glob. Environ. Chang. Part B Environ. Hazards 2003, 5, 35–45. [Google Scholar] [CrossRef]
- Meerow, S.; Newell, J.P.; Stults, M. Defining urban resilience: A review. Landsc. Urban Plan. 2016, 147, 38–49. [Google Scholar] [CrossRef]
- Chen, Y.; Zhu, M.K.; Zhou, Q.; Qiao, Y.R. Research on spatiotemporal differentiation and influence mechanism of urban resilience in China based on MGWR model. Int. J. Environ. Res. Public Health 2021, 18, 1056. [Google Scholar] [CrossRef]
- Fitzgibbons, J.; Mitchell, C.L. Just urban futures? Exploring equity in “100 Resilient Cities”. World Dev. 2019, 122, 648–659. [Google Scholar] [CrossRef]
- Walker, B.; Holling, C.S.; Carpenter, S.R.; Kinzig, A.P. Resilience, adaptability and transformability in social-ecological systems. Ecol. Soc. 2004, 9, 5. [Google Scholar] [CrossRef]
- Krellenberg, K.; Koch, F.; Kabisch, S. Urban sustainability transformations in lights of resource efficiency and resilient city concepts. Curr. Opin. Environ. Sustain. 2016, 22, 51–56. [Google Scholar] [CrossRef]
- Heinzlef, C.; Robert, B.; Hémond, Y.; Serre, D. Operating urban resilience strategies to face climate change and associated risks: Some advances from theory to application in Canada and France. Cities 2020, 104, 102762. [Google Scholar] [CrossRef]
- Ahern, J. From fail-safe to safe-to-fail: Sustainability and resilience in the new urban world. Landsc. Urban Plan. 2011, 100, 341–343. [Google Scholar] [CrossRef] [Green Version]
- Zhao, R.D.; Fang, C.L.; Liu, H.M. Progress and prospect of urban resilience research. Prog. Geogr. 2020, 39, 1717–1731. [Google Scholar] [CrossRef]
- Boschma, R. Towards an evolutionary perspective on regional resilience. Reg. Stud. 2015, 49, 733–751. [Google Scholar] [CrossRef] [Green Version]
- Feng, X.H.; Xiu, C.L.; Bai, L.M.; Zhong, Y.X.; Wei, Y. Comprehensive evaluation of urban resilience based on the perspective of landscape pattern: A case study of Shenyang city. Cities 2020, 104, 102722. [Google Scholar] [CrossRef]
- Suire, R.; Vicente, J. Clusters for life or life cycles of clusters: In search of the critical factors of clusters’ resilience. Entrep. Reg. Dev. 2014, 26, 142–164. [Google Scholar] [CrossRef]
- Zhen, F.; Wang, B.; Chen, Y.X. Research on China’s city network based on users’ friend relationships in online social networks: A case study of Sina Weibo. Geojournal 2016, 81, 1–10. [Google Scholar] [CrossRef]
- Pan, J.H.; Lai, J.B. Spatial pattern of population mobility among cities in China: Case study of the National Day plus Mid-Autumn Festival based on Tencent migration data. Cities 2019, 94, 55–69. [Google Scholar] [CrossRef]
- Zhang, P.F.; Zhao, Y.Y.; Zhu, X.H.; Cai, Z.W. Spatial structure of urban agglomeration under the impact of high-speed railway construction: Based on the social network analysis. Sustain. Cities Soc. 2020, 62, 102404. [Google Scholar] [CrossRef]
- Amini, H.; Cont, R.; Minca, A. Stress testing the resilience of financial networks. Int. J. Theor. Appl. Financ. 2012, 15, 1250006. [Google Scholar] [CrossRef]
- Ip, W.H.; Wang, D.W. Resilience and friability of transportation networks: Evaluation, analysis and optimization. IEEE Syst. J. 2011, 5, 189–198. [Google Scholar] [CrossRef]
- Kim, Y.; Chen, Y.S.; Linderman, K. Supply network disruption and resilience: A network structural perspective. J. Oper. Manag. 2015, 33, 43–59. [Google Scholar] [CrossRef] [Green Version]
- Ahmadian, N.; Lim, G.J.; Cho, J.; Bora, S. A quantitative approach for assessment and improvement of network resilience. Reliab. Eng. Syst. Saf. 2020, 200, 106977. [Google Scholar] [CrossRef]
- Aydin, N.Y.; Duzgun, H.S.; Wenzel, F.; Heinimann, H.R. Integration of stress testing with graph theory to assess the resilience of urban road networks under seismic hazards. Nat. Hazards 2018, 91, 1–32. [Google Scholar] [CrossRef]
- Baidu Announces Third Quarter 2020 Results. Available online: http://news.10jqka.com.cn/field/sn/20201117/27798643.shtml (accessed on 12 November 2021).
- Baidu Index Platform. Available online: http://index.baidu.com (accessed on 12 November 2021).
- Tencent Population Migration Location Big Data Platform. Available online: https://heat.qq.com/qianxi.php (accessed on 12 November 2021).
- Wang, H.J.; Miao, C.H. Spatial distribution of external service capabilities of Chinese central cities. Geogr. Res. 2009, 28, 957–967. [Google Scholar] [CrossRef] [Green Version]
- Leng, B.R.; Yang, Y.C.; Li, Y.J.; Zhao, S.D. Spatial characteristics and complex analysis: A perspective from basic activities of urban networks in China. Acta Geogr. Sin. 2011, 66, 199–211. [Google Scholar] [CrossRef]
- Boccaletti, S.; Latora, V.; Moreno, Y.; Chavez, M. Complex networks: Structure and dynamics. Complex Syst. Complex. Sci. 2006, 424, 175–308. [Google Scholar] [CrossRef]
- Mou, N.X.; Sun, S.Y.; Yang, T.F.; Zhang, L. Assessment of the resilience of a complex network for crude oil transportation on the Maritime Silk Road. IEEE Access 2020, 8, 181311–181325. [Google Scholar] [CrossRef]
- Rak, J. K-Penalty: A novel approach to find κ-Disjoint paths with differentiated path costs. IEEE Commun. Lett. 2010, 14, 354–356. [Google Scholar] [CrossRef]
- Ruiz-Martin, C.; Paredes, A.L.; Wainer, G.A. Applying complex network theory to the assessment of organizational resilience. IFAC-Pap. 2015, 48, 1224–1229. [Google Scholar] [CrossRef]
- Li, X.M.; Xiao, R.B. Analyzing network topological characteristics of eco-industrial parks from the perspective of resilience: A case study. Ecol. Indic. 2017, 74, 403–413. [Google Scholar] [CrossRef]
- Sterbenz, J.P.; Cetinkaya, E.K.; Hameed, M.A.; Jabbar, A.; Qian, S.; Rohrer, J.P. Evaluation of network resilience, survivability, and disruption tolerance: Analysis, topology generation, simulation, and experimentation. Telecommun. Syst. 2013, 52, 705–736. [Google Scholar] [CrossRef]


| Rank Order | Information Network | Transportation Network | Economic Network | |||||||||
|---|---|---|---|---|---|---|---|---|---|---|---|---|
| City | E | City | V | City | E | City | V | City | E | City | V | |
| 1 | Chengdu | 0.503 | Chengdu | 83.7408 | Chongqing | 0.2209 | Chongqing | 14.3793 | Beijing | 0.4408 | Beijing | 69.0172 |
| 2 | Beijing | 0.5031 | Shanghai | 83.7425 | Shanghai | 0.221 | Shanghai | 14.3878 | Chengdu | 0.4409 | Shanghai | 69.0204 |
| 3 | Shanghai | 0.5031 | Beijing | 83.7427 | Beijing | 0.2211 | Beijing | 14.4045 | Shanghai | 0.441 | Suzhou | 69.0217 |
| 4 | Nanjing | 0.5032 | Nanjing | 83.7431 | Guangzhou | 0.2214 | Guangzhou | 14.4371 | Shenzhen | 0.4411 | Shenzhen | 69.0232 |
| 5 | Shenzhen | 0.5032 | Shenzhen | 83.7433 | Shenzhen | 0.2215 | Shenzhen | 14.451 | Suzhou | 0.4411 | Chengdu | 69.0283 |
| 6 | Xi’an | 0.5033 | Xi’an | 83.7435 | Chengdu | 0.2216 | Chengdu | 14.4674 | Guangzhou | 0.4413 | Guangzhou | 69.0323 |
| 7 | Wuhan | 0.5034 | Wuhan | 83.7441 | Hangzhou | 0.2217 | Wuhan | 14.4755 | Tianjin | 0.4413 | Tianjin | 69.038 |
| 8 | Guangzhou | 0.5035 | Zhengzhou | 83.7446 | Wuhan | 0.2218 | Hangzhou | 14.4826 | Chongqing | 0.4413 | Nantong | 69.0383 |
| 9 | Hangzhou | 0.5035 | Qingdao | 83.7453 | Nanjing | 0.222 | Suzhou | 14.5135 | Dongguan | 0.4414 | Wuxi | 69.0412 |
| 10 | Zhengzhou | 0.5035 | Xiamen | 83.7468 | Tianjin | 0.2221 | Nanjing | 14.5146 | Foshan | 0.4414 | Dongguan | 69.0424 |
| … | … | … | … | … | … | … | … | … | … | … | … | … |
| 335 | Nujiang | 0.5083 | Haidong | 85.2509 | Bazhou | 0.2246 | Jiamusi | 14.8793 | Tulufan | 0.4463 | Kashgar | 70.3458 |
| 336 | Changdu | 0.5083 | Diqing | 85.2511 | Jiamusi | 0.2246 | Yunfu | 14.8794 | Tarbagatay | 0.4464 | Aksu | 70.3458 |
| 337 | Diqing | 0.5083 | Hainanzhou | 85.2511 | Kashgar | 0.2247 | Huai’an | 14.8795 | Yushuzhou | 0.4464 | Guoluo | 70.3458 |
| 338 | Shennongjia | 0.5084 | Changdu | 85.2523 | Yunfu | 0.2247 | Tulufan | 14.8798 | Kezhou | 0.4465 | Tarbagatay | 70.3459 |
| 339 | Lhoka | 0.5085 | Lhoka | 85.2541 | Changjizhou | 0.2247 | Changjizhou | 14.8827 | Guoluo | 0.4465 | Yushuzhou | 70.346 |
| 340 | Ali | 0.5086 | Ali | 85.2547 | Meizhou | 0.2248 | Meizhou | 14.8839 | Aletai | 0.4465 | Kezhou | 70.346 |
| 341 | Haibei | 0.5087 | Haibei | 85.256 | Ningde | 0.2248 | Kashgar | 14.886 | Hotan | 0.4466 | Shihezi | 70.346 |
| 342 | Guoluo | 0.5087 | Guoluo | 85.2562 | Tulufan | 0.2248 | Jieyang | 14.8858 | Ali | 0.4466 | Hotan | 70.3462 |
| 343 | Kezhou | 0.5088 | Huangnanzhou | 85.257 | Jieyang | 0.2249 | Ningde | 14.8865 | Shihezi | 0.4466 | Ali | 70.3466 |
| 344 | Huangnanzhou | 0.5088 | Kezhou | 85.257 | Ili | 0.225 | Ili | 14.8905 | Aksu | 0.4467 | Aletai | 70.3466 |
Publisher’s Note: MDPI stays neutral with regard to jurisdictional claims in published maps and institutional affiliations. |
© 2021 by the authors. Licensee MDPI, Basel, Switzerland. This article is an open access article distributed under the terms and conditions of the Creative Commons Attribution (CC BY) license (https://creativecommons.org/licenses/by/4.0/).
Share and Cite
Wei, S.; Pan, J. Resilience of Urban Network Structure in China: The Perspective of Disruption. ISPRS Int. J. Geo-Inf. 2021, 10, 796. https://doi.org/10.3390/ijgi10120796
Wei S, Pan J. Resilience of Urban Network Structure in China: The Perspective of Disruption. ISPRS International Journal of Geo-Information. 2021; 10(12):796. https://doi.org/10.3390/ijgi10120796
Chicago/Turabian StyleWei, Shimei, and Jinghu Pan. 2021. "Resilience of Urban Network Structure in China: The Perspective of Disruption" ISPRS International Journal of Geo-Information 10, no. 12: 796. https://doi.org/10.3390/ijgi10120796
APA StyleWei, S., & Pan, J. (2021). Resilience of Urban Network Structure in China: The Perspective of Disruption. ISPRS International Journal of Geo-Information, 10(12), 796. https://doi.org/10.3390/ijgi10120796