You are currently on the new version of our website. Access the old version .
  • Article
  • Open Access

4 October 2021

Nanjing’s Intracity Tourism Flow Network Using Cellular Signaling Data: A Comparative Analysis of Residents and Non-Local Tourists

,
and
School of Architecture, Southeast University, Nanjing 210096, China
*
Author to whom correspondence should be addressed.
This article belongs to the Special Issue Geo Data Science for Tourism

Abstract

With the rapid development of transportation and modern communication technology, “tourism flow” plays an important role in shaping tourism’s spatial structure. In order to explore the impact of an urban tourism flow network on tourism’s spatial structure, this study summarizes the structural characteristics of the tourism flow networks of 43 scenic spots in Nanjing from three aspects—tourism flow network connection, node centrality, and communities—using cellular signaling data and the social network analysis method. A comparative analysis revealed the tourism flow network structures of residents and non-local tourists. Our findings indicated four points. Firstly, the overall network connectivity was relatively good. Core city nodes displayed high spatial concentration and connection strength. However, suburban nodes delivered poor performance. Secondly, popular nodes were intimately connected, although there were no “bridging” nodes. Lesser-known nodes were marginalized, resulting in severe node polarization. Thirdly, regarding the network community structure, the spatial boundary between communities was relatively clear; the communities within the core city were more closely connected, with some parts encompassing suburban nodes. Most suburban communities were attached to the communities in the core area, with individual nodes existing independently. Fourthly, the primary difference in the tourism flow network structures between residents and non-local tourists was that the nodes for residents manifested a more balanced connection strength and node centrality. Core communities encompassed more nodes with more extensive coverage. Conversely, the nodes for non-local tourists showed wide discrepancies in connection strength and node centrality. Furthermore, core communities were small in scale with clear boundaries.

1. Introduction

Since the 1960s, due to the continued developments in modern science and technology (including computer and network information technology, advanced transportation, modern communications, globalization, and informatization), global networking has become a significant development tendency. Against this background, by integrating the Marxist theory of globalization, information theory, and postmodern space theory, sociologist Manuel Castells proposed a novel social research theory—the space of flows theory—revealing a new perspective on the organizational logic of the modern social system [1]. Under its influence, “space of flows” has become a research hotspot in the geography domain, and has inspired many research topics, including information flow, traffic flow, knowledge flow, culture flow, and technology flow.
Tourism space is the projection of tourist activities in space. Regarding tourism destinations, tourists display the characteristic of mobility [2]. Therefore, the concept of tourism flow appeared when the spatial structures of tourism, at urban and regional levels, were studied from the perspective of tourist behavior [3]. It has become an important research topic in western tourism geography, which unfolds mainly from the spatial models of tourism flow, its causes and impact mechanisms, and tourists’ spatiotemporal behavior. The study of the spatial models of tourism flow started in 1977 when Hill et al. proposed the “core-edge” model of tourism flow [4]. Most of the literature that followed also began from the spatial analysis angle, and successively proposed such laws or models as distance decay, the gravity model, and spatial dimension [5]. The research on the causes and impact mechanisms of tourism flow began in the 1980s, when knowledge from related subjects (including mathematics, geography, and economics) was introduced to explore the causal mechanism of the economic impact of tourism flow on destinations, and the law of its endogenous occurrence and occurrence pattern simulations. Since the beginning of the 21st century, such research has gradually matured into a system. There is quantitative research focusing on the related political factors and economic constraints [6], and the impacts of various supply-side resources [7]. The research on tourists’ spatiotemporal behavior only began in the late 1990s. It focused on the prediction of the direction and quantity of tourism flow, and tourism consumption [8,9]. By comparison, tourism flow-related research in China started late, commencing in the 1980s. It focused mainly on spatiotemporal distribution and the law of evolution. The relevant explorations centered around the laws of the spatiotemporal evolution of tourism flow [10], and its node transfer mechanism on a countrywide, provincewide, and citywide scale [11,12], summarized in the spatial structural model of tourism flow [13,14]. In a preliminary exploration of the driving-force mechanisms of tourism flow, researchers usually relied on annual and seasonal change indices. They based their studies on statistical indicators, such as in-degree and out-degree nodes in social networks [15] and the skewness index [16]. They performed their research using time-series and cluster analyses, while simultaneously drawing on the push-pull theory, origin–destination (OD) distribution theory, and driving-force theory [17,18]. Whether it is information, traffic, or tourism flow, in this study, they are all significant channels through which we may glimpse the structure of urban social and spatial networks.
Tourism flow shaped the structure of the tourism network, which is of great significance to the spatial study of tourism. Tourism networks are fundamentally social networks constituted by tourist behavior. In recent years, scholars have brought the social network analysis from the sociological domain into the analysis of tourism flow network structures [19,20]. A social network is a structure made of mutually connected behavioral objects, which is considered to be a structure that is constituted by social relations. It is used extensively in studying social media networks, information communication networks, friend circles, business networks, kinship networks, and disease transmission networks [21]. Social network analysis is a research method that is based on social network theory and is applied to the social interaction between individuals in complex relationships [22]. This method has established rich model parameters for studying node objects, edge objects, and the constitutive features of networks themselves (including centrality analysis, community analysis, network correlation, and core-edge structure). These areas became the research directions for multiple-domain applications in sociology, mathematics, and computer and communication science. With the rapid development of information technology, the large-scale statistics and a vast amount of data regarding tourists’ spatiotemporal behavior are readily available. This data enables the study of tourism flow network structures, based on the social network analysis method, to move further toward refinement and quantification. Currently, the related big data studies concentrate on national and regional scales [23]. Scholars study tourists’ spatial distribution and construct tourism flow networks using big data [24] (such as the GPS location information of pictures [25], independent itineraries [26], network travel notes, and tour routes in online bookings [27]), and further investigate the influencing evolutionary factors or network formation. Some scholars use location-based social networks to understand human mobility and people’s behavior by mining check-in patterns, studying the influence of hidden structural patterns in social network nodes, and the changes in external environment, on user check-in patterns [28]. In addition, due to the current global spread of COVID-19, many scholars have combined the geo-tagged data of social media with epidemic prevention needs to establish a reference model to predict the infection risk of social interaction and travel between residents and tourists [29,30].
Considering the lack of existing research, this study highlights three aspects of innovation. Firstly, it highlights the combination of the application of big data and research on tourism flows within cities at the medium and micro scales. Due to the limited precision of big data, the demand for washing and screening users’ phone signaling data within a city is higher; therefore, the existing research is mainly from a regional perspective, focusing on the tourist flow between cities and the relationship between the cities’ tourism resources [31]. This study carried out data processing on a variety of filter condition experiments, and the processing results, multiple times, meaning the relatively accurate basic data could be used to analyze the spatial structure of tourism flow within the city. Secondly, it highlights the combination of the social network analysis method and traditional space theory. Traditional space theory emphasizes static material space expression; however, this study used the social network analysis method to connect human activities with spatial structures, which can reflect the functional connection in urban space more accurately. Thirdly, it analyses the differences between local residents and tourists in a tourism network structure. The differences in tourism flow network structures, caused by different sources of tourists (local and non-local, age structure differences, consumption level differences, etc.) have been ignored in the existing research. This study attempts to conduct a comparative analysis of the tourism flow network that is formed by local residents and tourists, and to excavate the differences between them.
Therefore, in order to further explore the impact of an urban tourism flow network on tourism’s spatial structure, this study uses the social network analysis method and cellular signaling data. From the perspective of tourists’ spatiotemporal behavior, and using a summary of the overall characteristics of the tourism flow network structure of Nanjing city proper, this paper differentiates between resident and non-local tourism flow network structures. In addition to addressing the deficiency in the existing research, regarding the application of big data and the absence of research scale, it provides a scientific basis for the differentiated organization of tourism space and tourism routes, urban infrastructure, transportation planning, and tourism social management.

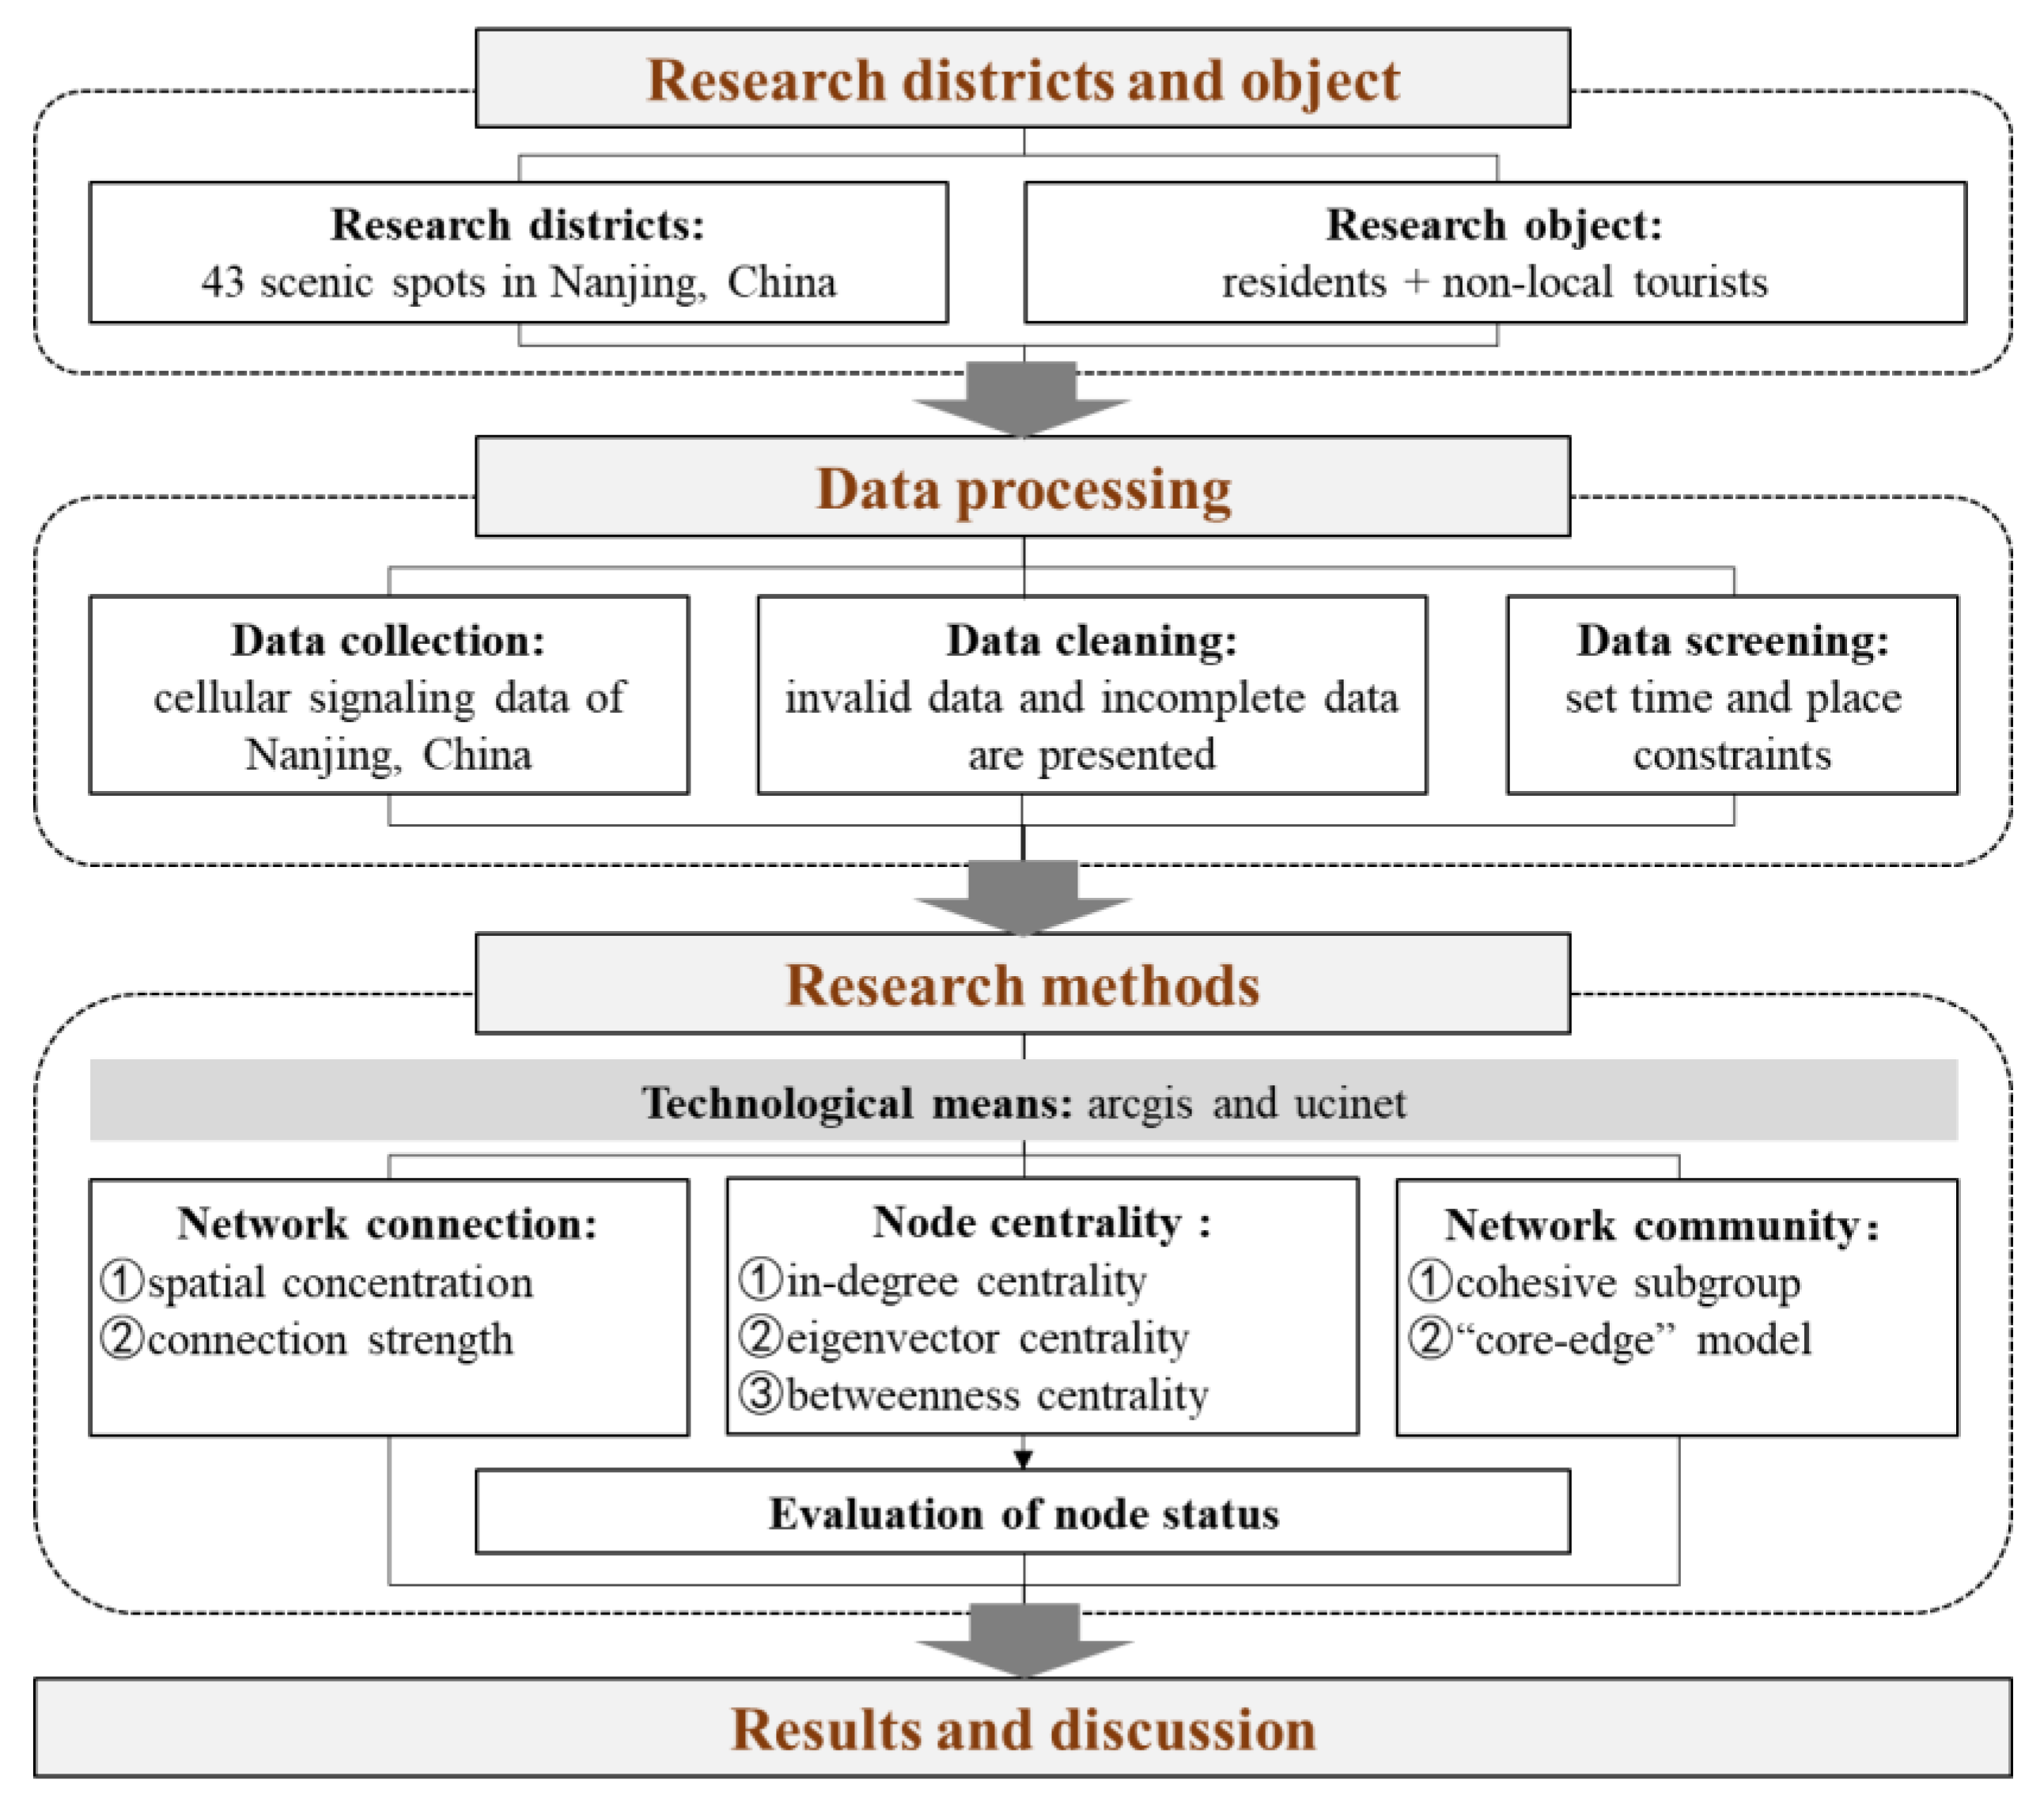
2. Materials and Methods

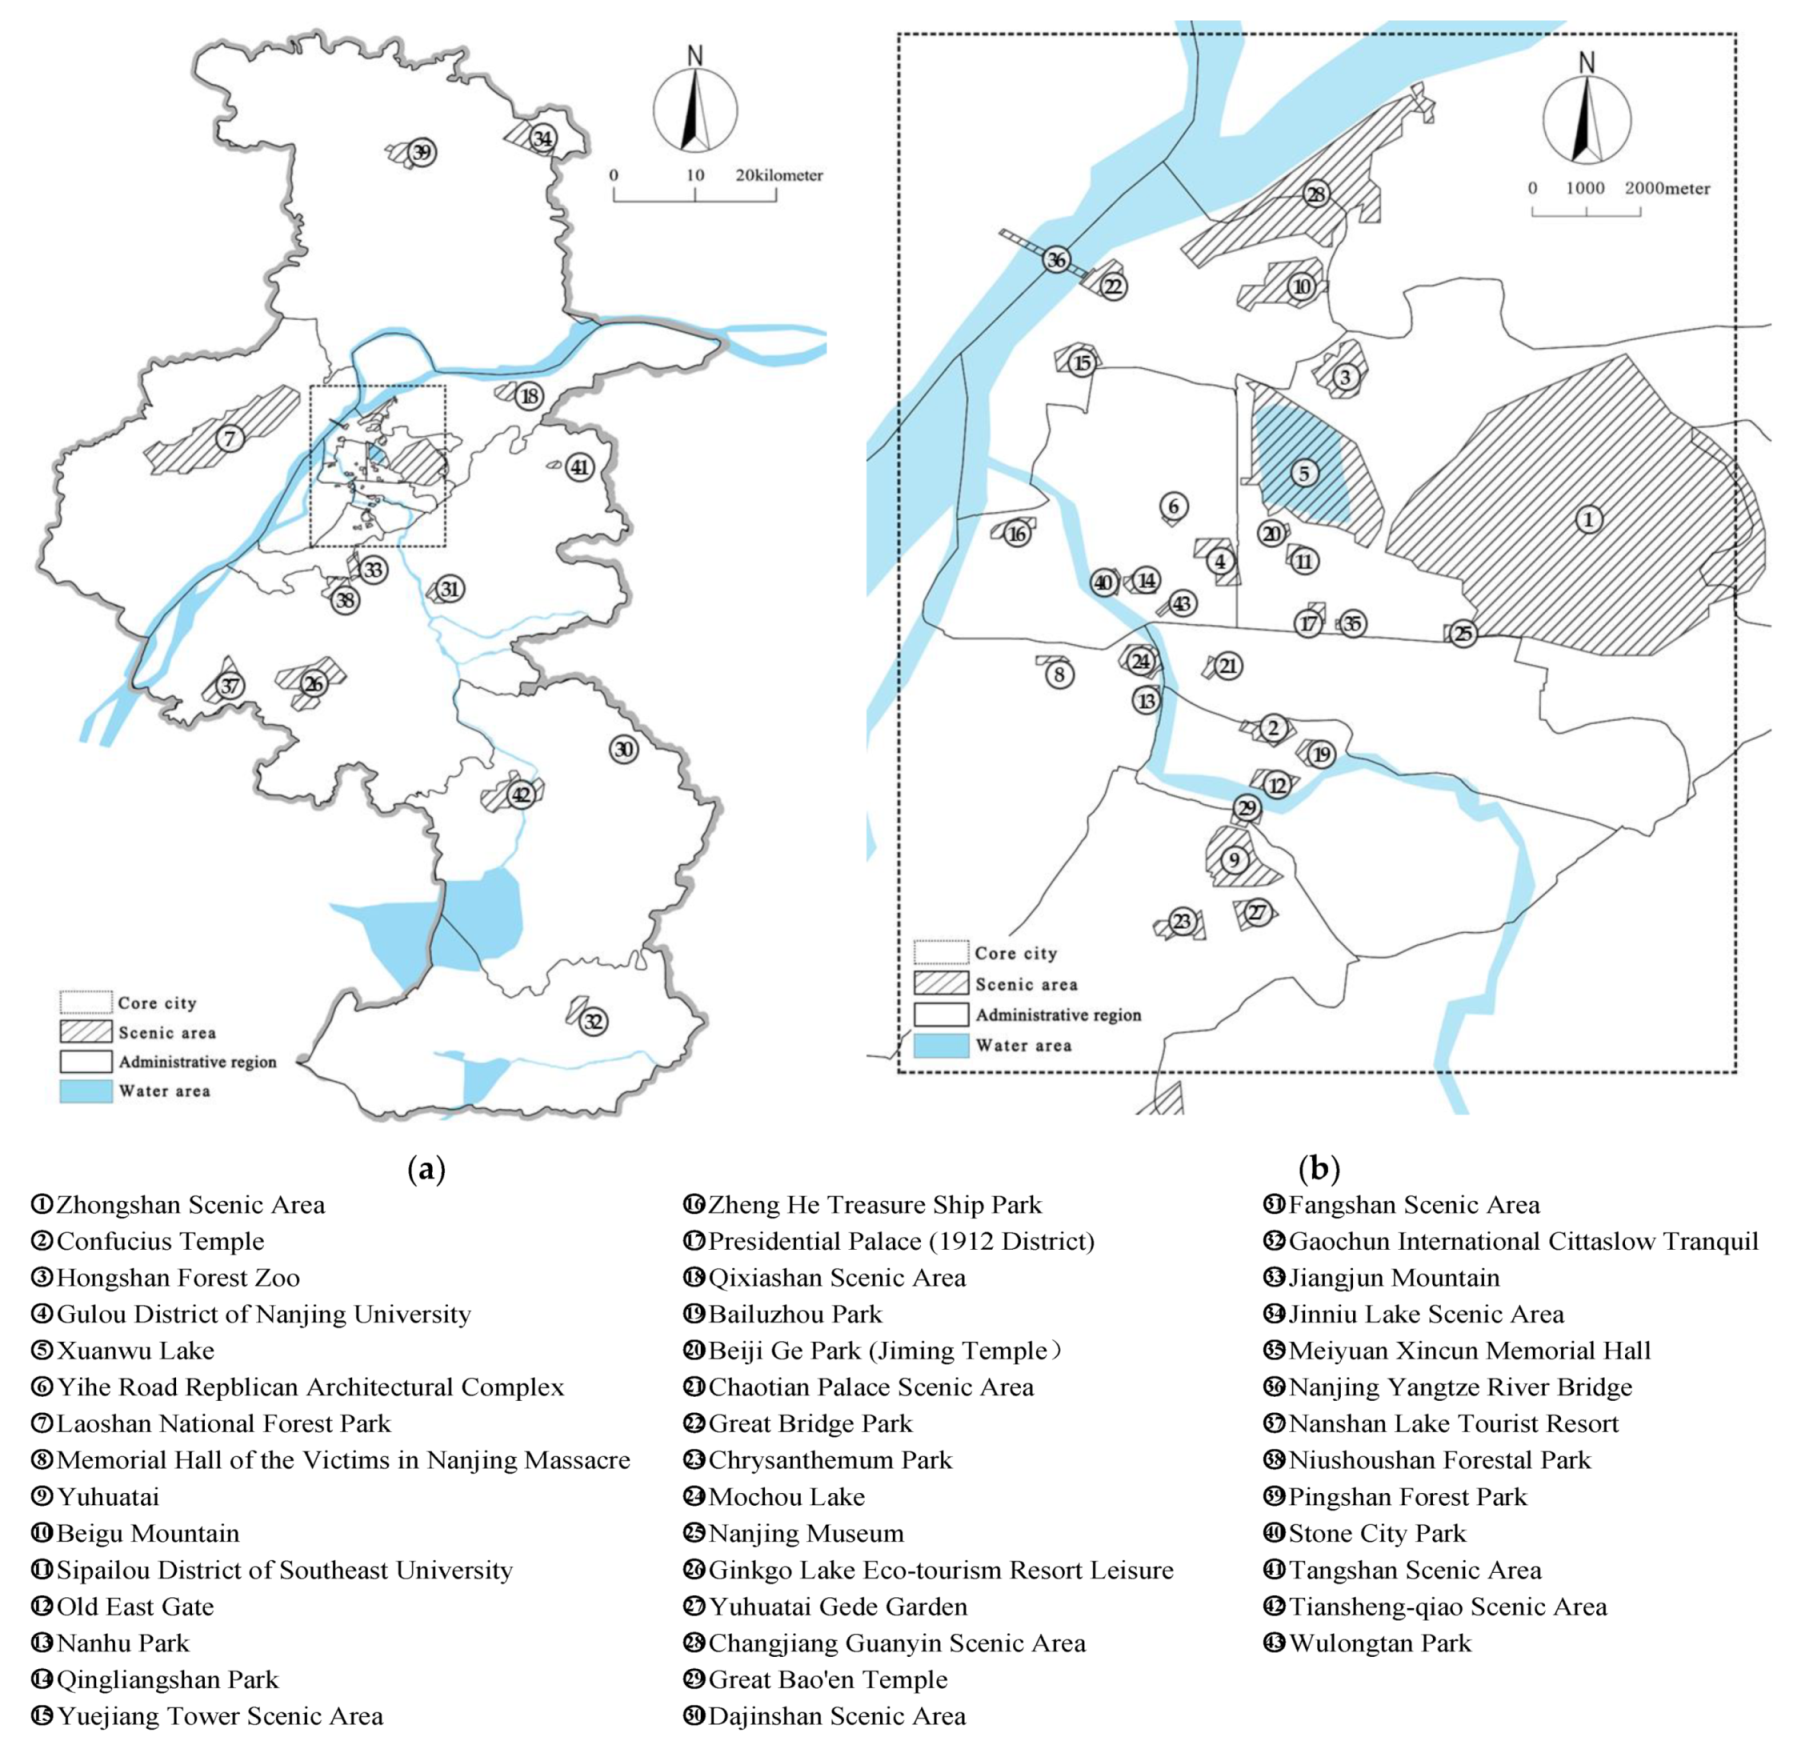
2.1. Research Districts

Nanjing city has a long history and culture, and unique natural landscapes, making it a major scenic tourist destination at the national level. In 2015, the number of domestic tourists reached 99.9266 million, ranking it among the top tourist cities in the country. According to the 2018 monthly “Report on the Platform for Operation Monitoring of Smart Tourism Big Data in Nanjing”, issued by the Nanjing Municipal Bureau of Culture and Tourism, the number of tourists visiting scenic spots with grades of 2A or above reached 91.8% (referring to China’s “Classification and Evaluation of Tourist Scenic Spot Quality Grade”, the scenic spot classification includes five grades; 5A is the highest grade for scenic spots). This study took Nanjing city proper as its spatial scope, selecting all three A-grade or above scenic spots in the city as the specific research districts, including 43 popular scenic spots (see Figure 1), for tabulating the statistics of tourist spatial behaviors.
Figure 1. Research scope and selected scenic spots: (a) entire city of Nanjing; (b) core city of Nanjing.

2.2. Data Sources

This study performed two statistical analyses on different temporal and spatial scales, using cellular signaling data, to examine the phenomenon of tourism flow resulting from the spatial displacement of tourist crowds. This method overcame the predicament of the insufficient temporal and spatial accuracy of tourist behavior, encountered in previous research adopting the traditional analytical method of regional perspective. The data in this study came mainly from the cellular signaling data (user ID, number attribution, geographical position of triggering base station, and triggering moment) provided by Nanjing Mobile. The concrete selection steps are outlined as follows. First, data collection appearing in Nanjing city proper on four statutory holidays in 2015, viz., November 14, 15, 21, and 27. Second, tourist monitoring at related scenic spots in Nanjing city, referencing average length of visit for each scenic spot in the city. Data were selected from at least two scenic spots within the research scope (see the above 44 scenic spots) that tourists visited for over an hour. These two scenic spots were treated as the spatial departure and destination points. Third, on this basis, per number attribution, the data of local and non-local users were identified. Based on the length of evening visits (staying for more than 3 consecutive hours between 24:00 and 07:00) on working days, versus day visits during working hours (staying for more than 4 consecutive hours between 07:00 and 19:00), the residences and workplaces of local users were identified. Based on the time spent on handling business in the daytime (staying for more than 2 consecutive hours between 08:00 and 19:00), the destinations of non-local users on business travel were identified, which were later excluded. In the end, from the 2.365 million active users (who appeared at least twice on the four statutory holidays), the data of 1.212 million local users and 108,000 non-local users were identified and used as the foundational data for this comparative study on tourism flow structures of local and non-local users.
Of the sampled users, Nanjing Mobile’s market share was 64.7%, meaning the above identification results were tantamount to a large sample. Based on the permanent resident population of approximately 8 million in Nanjing’s 6th population census, the sample of identified local users equaled 23.4% of the total population. Considering the average daily reception of 270,000 non-local tourists in Nanjing, the amount of non-local users in the sample was 10%. Such samples are far larger than those in traffic and manual questionnaire surveys. No statistical data were available to examine the tourist spots identification results in terms of identification accuracy. However, on the four holidays, the correlation coefficients between the daily distribution of any two recreation areas all reached over 0.8, indicating that the recreation areas’ identification results were stable and should also be credible, thereby bearing overall representativeness.

2.3. Research Methods

The transfer and diffusion of tourists between tourism destinations produces a certain connection between each destination, giving rise to a dynamic evolutionary system. The social network analysis method can precisely depict the various relationships within a system, from the perspective of macro-structural relations. For this reason, has been used reliably in recent tourism studies. Therefore, this study, with the aid of the social network analysis software UCINET [32], analyzed three aspects—namely, tourism flow network connection, node centrality, and network communities. In addition, the overall characteristics of Nanjing’s tourism flow network structure were summarized visually using the ArcGIS digital technology platform. On this basis, this study further compared the differences in the characteristics of tourism flow network structures, between local residents and non-local tourists. The concrete research methods are shown in Figure 2.
Figure 2. Research methodology.

2.3.1. Methods for Analyzing Tourism Flow Network Connections

Based on social network analysis, the spatial departure statistics and tourist destination points in users’ tourist activities were collected at each scenic spot, per their spatial positions. The scenic spots were set as network nodes, and visiting tourists were sequentially linked to form a network. By collecting the flow volume statistics of each node, we obtained the spatial concentration of each node in the entire tourism flow network to represent the out-degree centrality. Next, an asymmetric adjacency matrix was constructed, the multi-valued matrix was converted to a binary matrix, and the ArcGIS software analyzed the strength of network connection between nodes.

2.3.2. Methods for Analyzing Node Centrality in Tourism Flow Networks

The centrality of nodes is a significant indicator in social network analysis. Through the depiction of the centrality of different standards, the value and status of a node’s existence can be reflected in tourism flow network structures. Three forms of centrality have been selected for analysis in this study:
  • In-degree centrality (popularity and attractiveness)
In-degree centrality measures the popularity of a certain node, representing the extent of a scenic node’s clustering ability. This study selected the in-degree centrality and standardized it to the [0,1] interval. The calculating formula of the standard in-degree centrality CRDi of node i is as equation:
C R D i = j a j i max (   a )
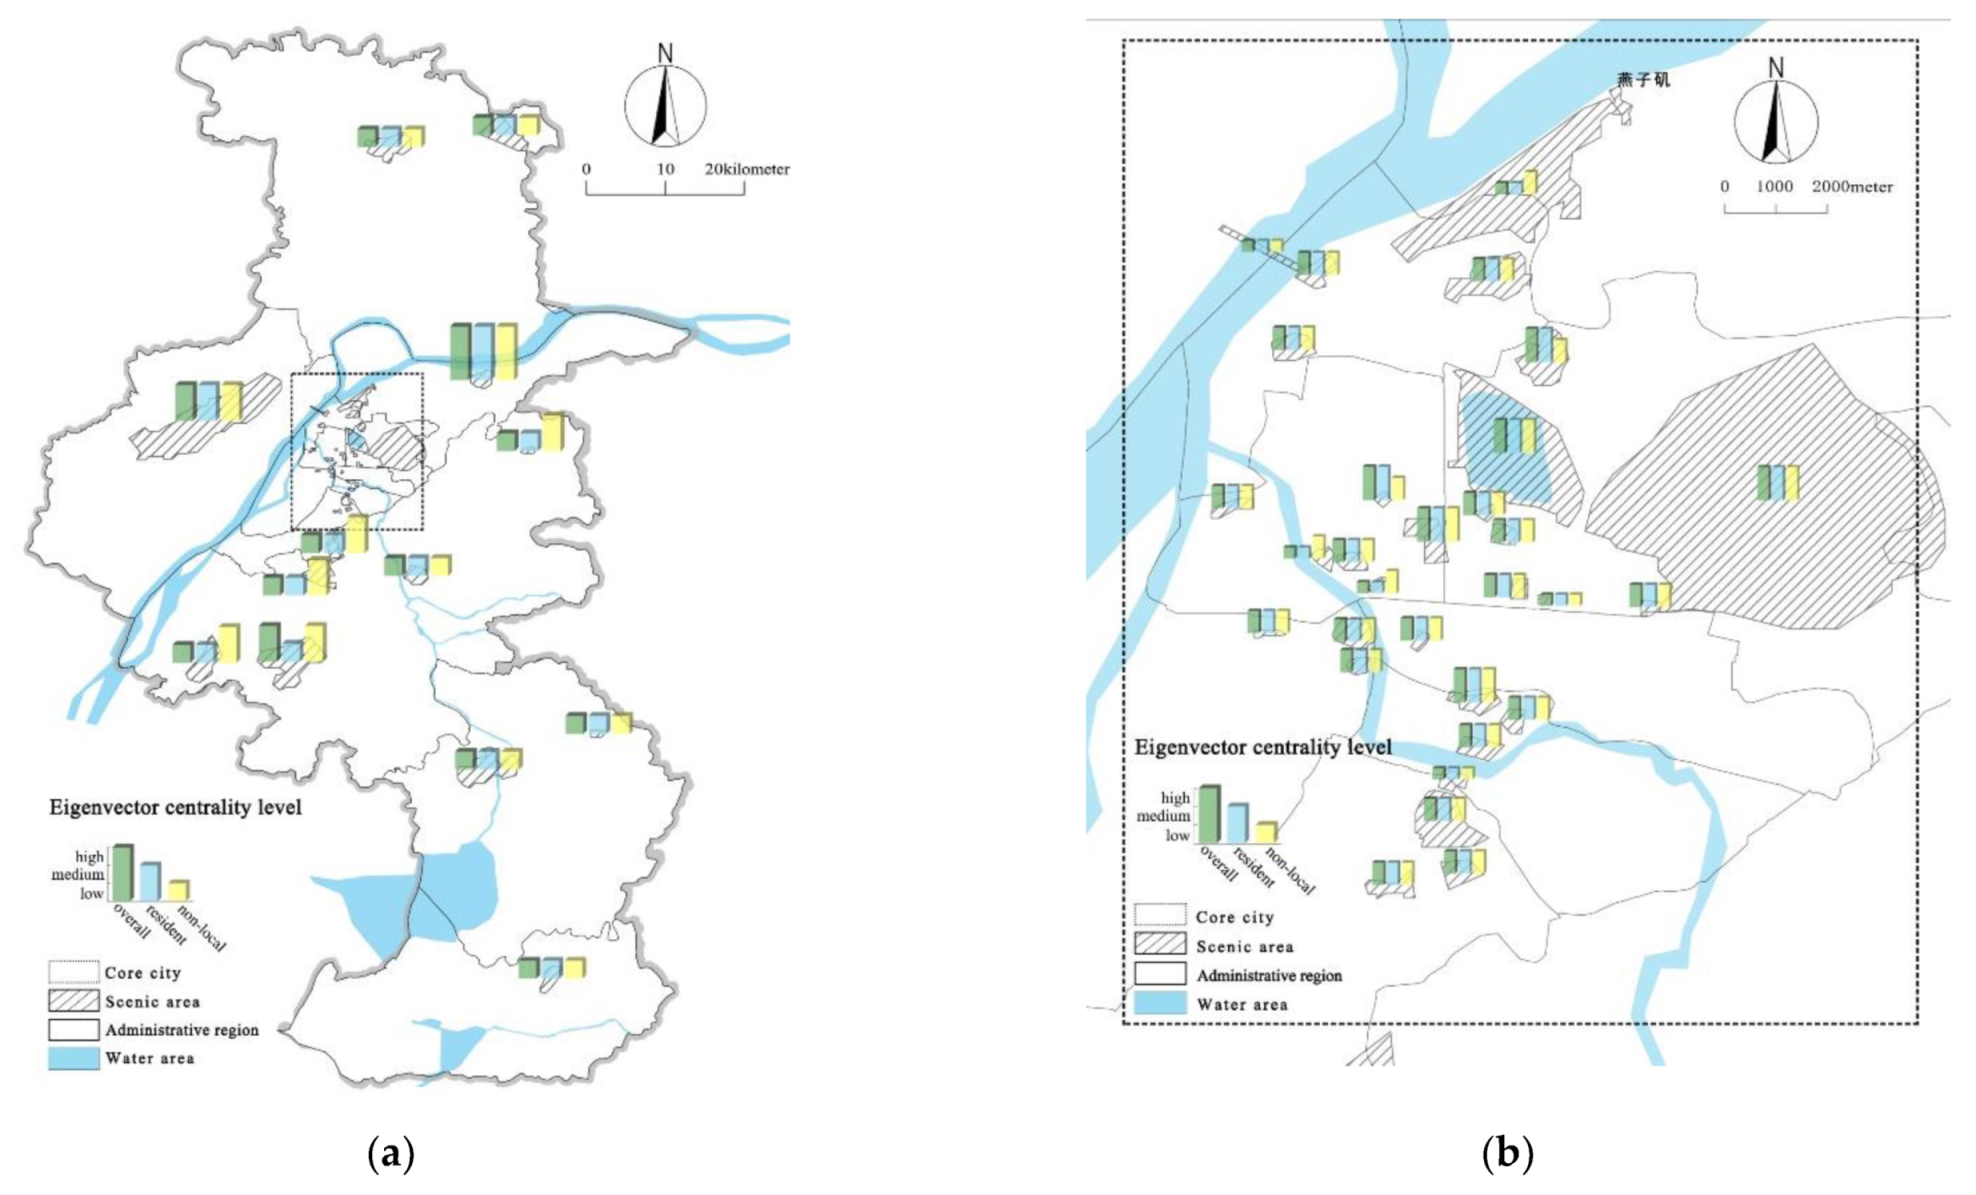
  • Eigenvector centrality (latent attractiveness)
This depends on the direct relation of a node with its adjacent point and represents the connectivity level of tourism nodes. Regarding adjacent matrix A, the score Xi of the relative centrality of node i should exist:
X i = 1 λ j a j i X j
Rewriting the expression gives the eigenvector calculating equation:
A x = λ x
Solving and standardizing the matrix gives the calculating equation of the standard eigenvector centrality C:
C R β = α ( I λ A ) 1 A I
In the equation, α is the standardized constant, λ is the eigenvalue corresponding to the first eigenvector, which determines the importance of the adjacent point to centrality, and I is the identity matrix.
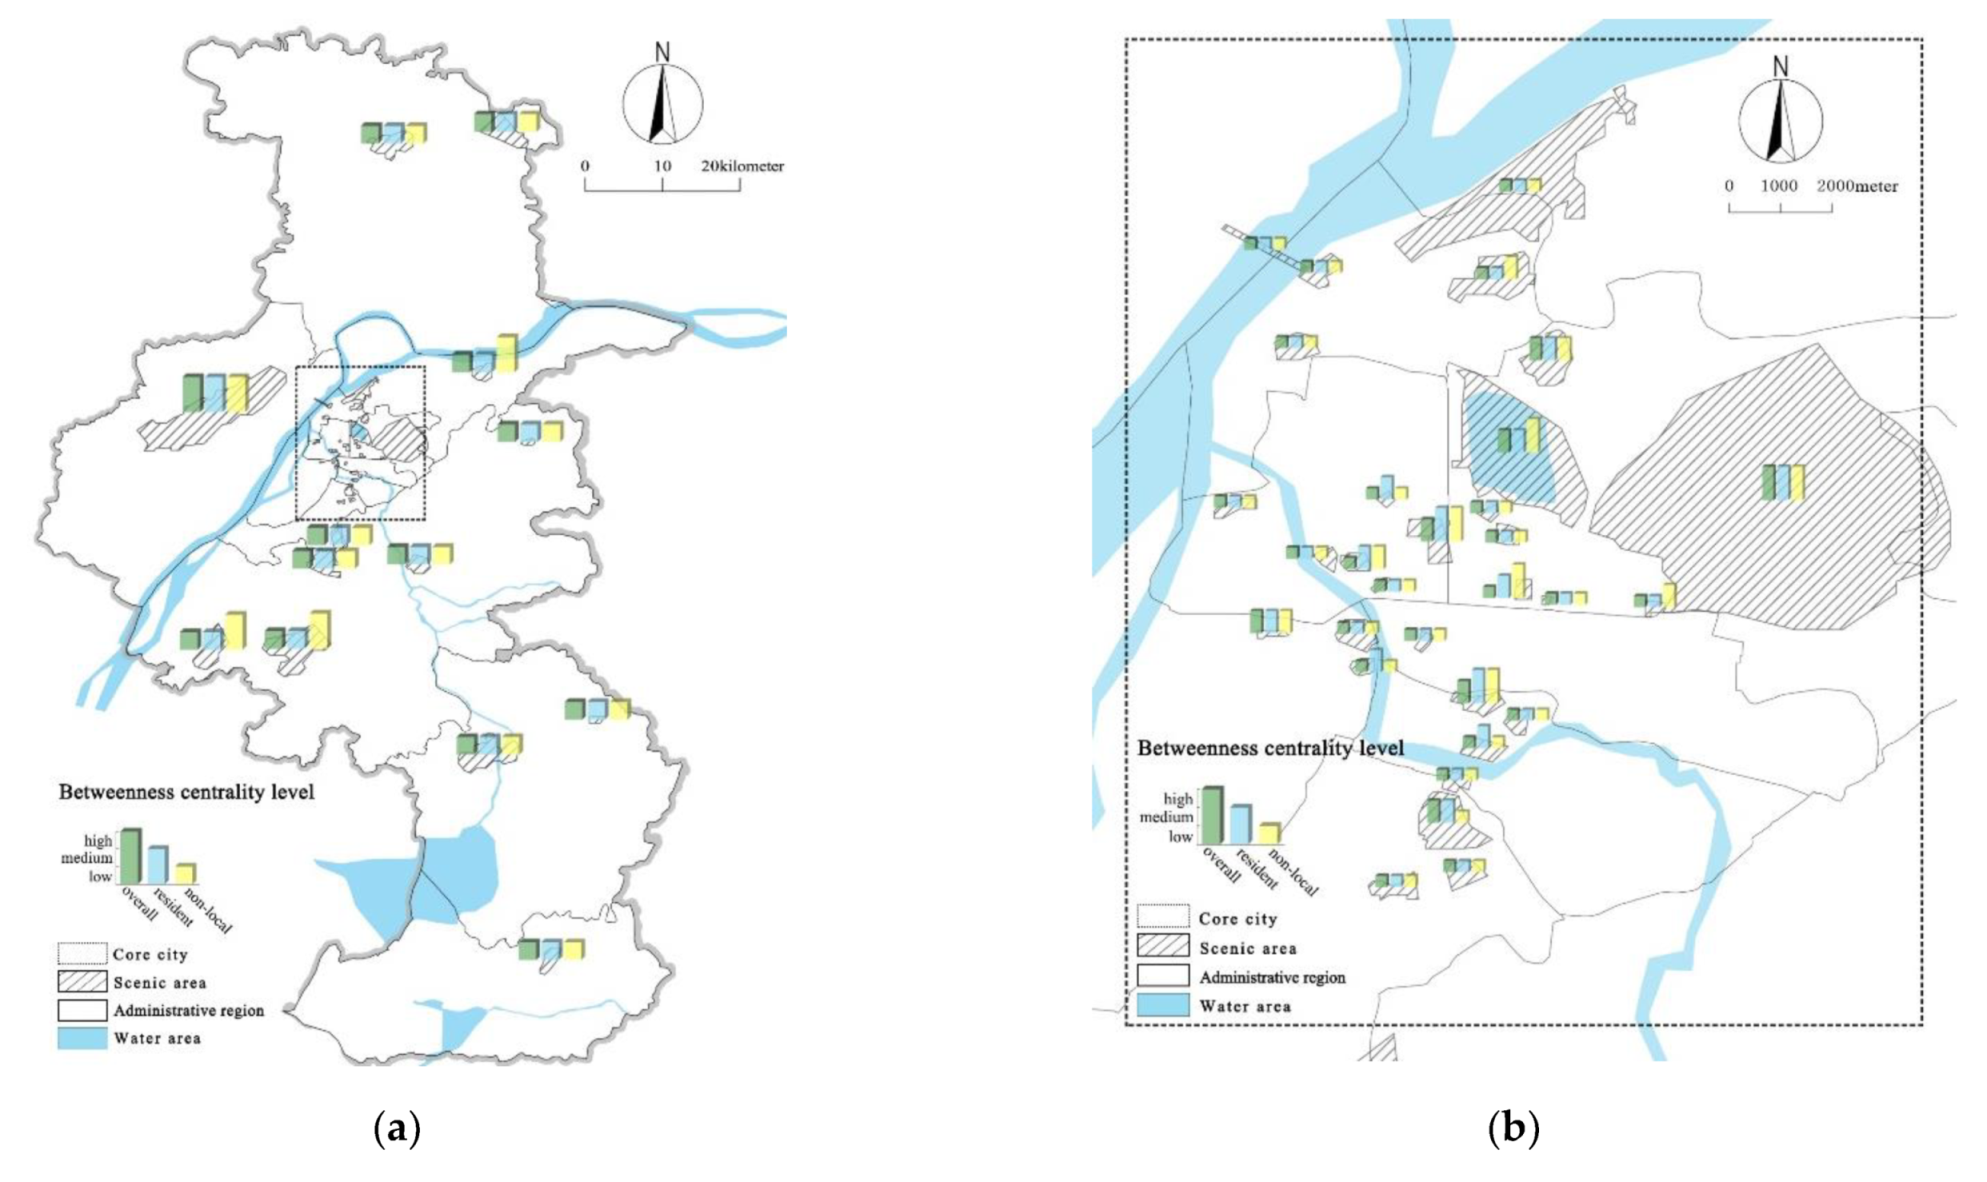
  • Betweenness centrality (controlling ability of mediation)
This measures the ability of a node to control the movement of tourists between node pairs in the tourism flow network, manifesting the controlling ability of a node, or its network mediating and moderating effects.
Assuming that the number for the shortest path between node j and node k is gjk, and the number for the shortest path between node j and node k that must pass through i is gjk(i), then the probability of i situating in the shortest path between j and k can indicate the betweenness centrality of node i. The calculating formula of the standard betweenness centrality is as calculating equation:
C R B i = 2 j k g j k ( i ) g i k ( n 1 ) ( n 2 )
Based on the above standard centrality, centrality was divided into three classes (high, middle, and low) through natural breaks, in order to ensure that the internal difference within the same class was minimized, while the differences between different classes was maximized. This paper combined the characteristics of node centrality (in-degree centrality, eigenvector centrality, and betweenness centrality) (see Table 1), and constructed an evaluation system for the node status in the tourism network through the (matrix) model.
Table 1. Combination relationship of three types of node centrality in the tourism network.

2.3.3. Methods for Analyzing the Communities in the Tourism Flow Network

Community analysis is another important focus of research in social network analysis. The communities that are demarcated through nodes, and their connections, can reflect the extent of independence and popularity change of network tourism routes. This paper used the CONCOR method of the UCINET analysis software to perform a cohesive subgroup analysis, measuring the strength of node connections in flow volume. The entire network was divided into several sub-networks with powerful internal connections. Through multiple iterations, a correlation coefficient matrix was created. The higher the numerical value of the density matrix, the closer the connection between subgroups. It has guiding significance regarding tourists in their selection of combinations of tourism nodes, and designation of tourism routes. Furthermore, through the “core-edge” model, we further determined the status of tourism nodes in the overall network, and summarized and analyzed the structural model of Nanjing’s tourism flow network.

3. Results

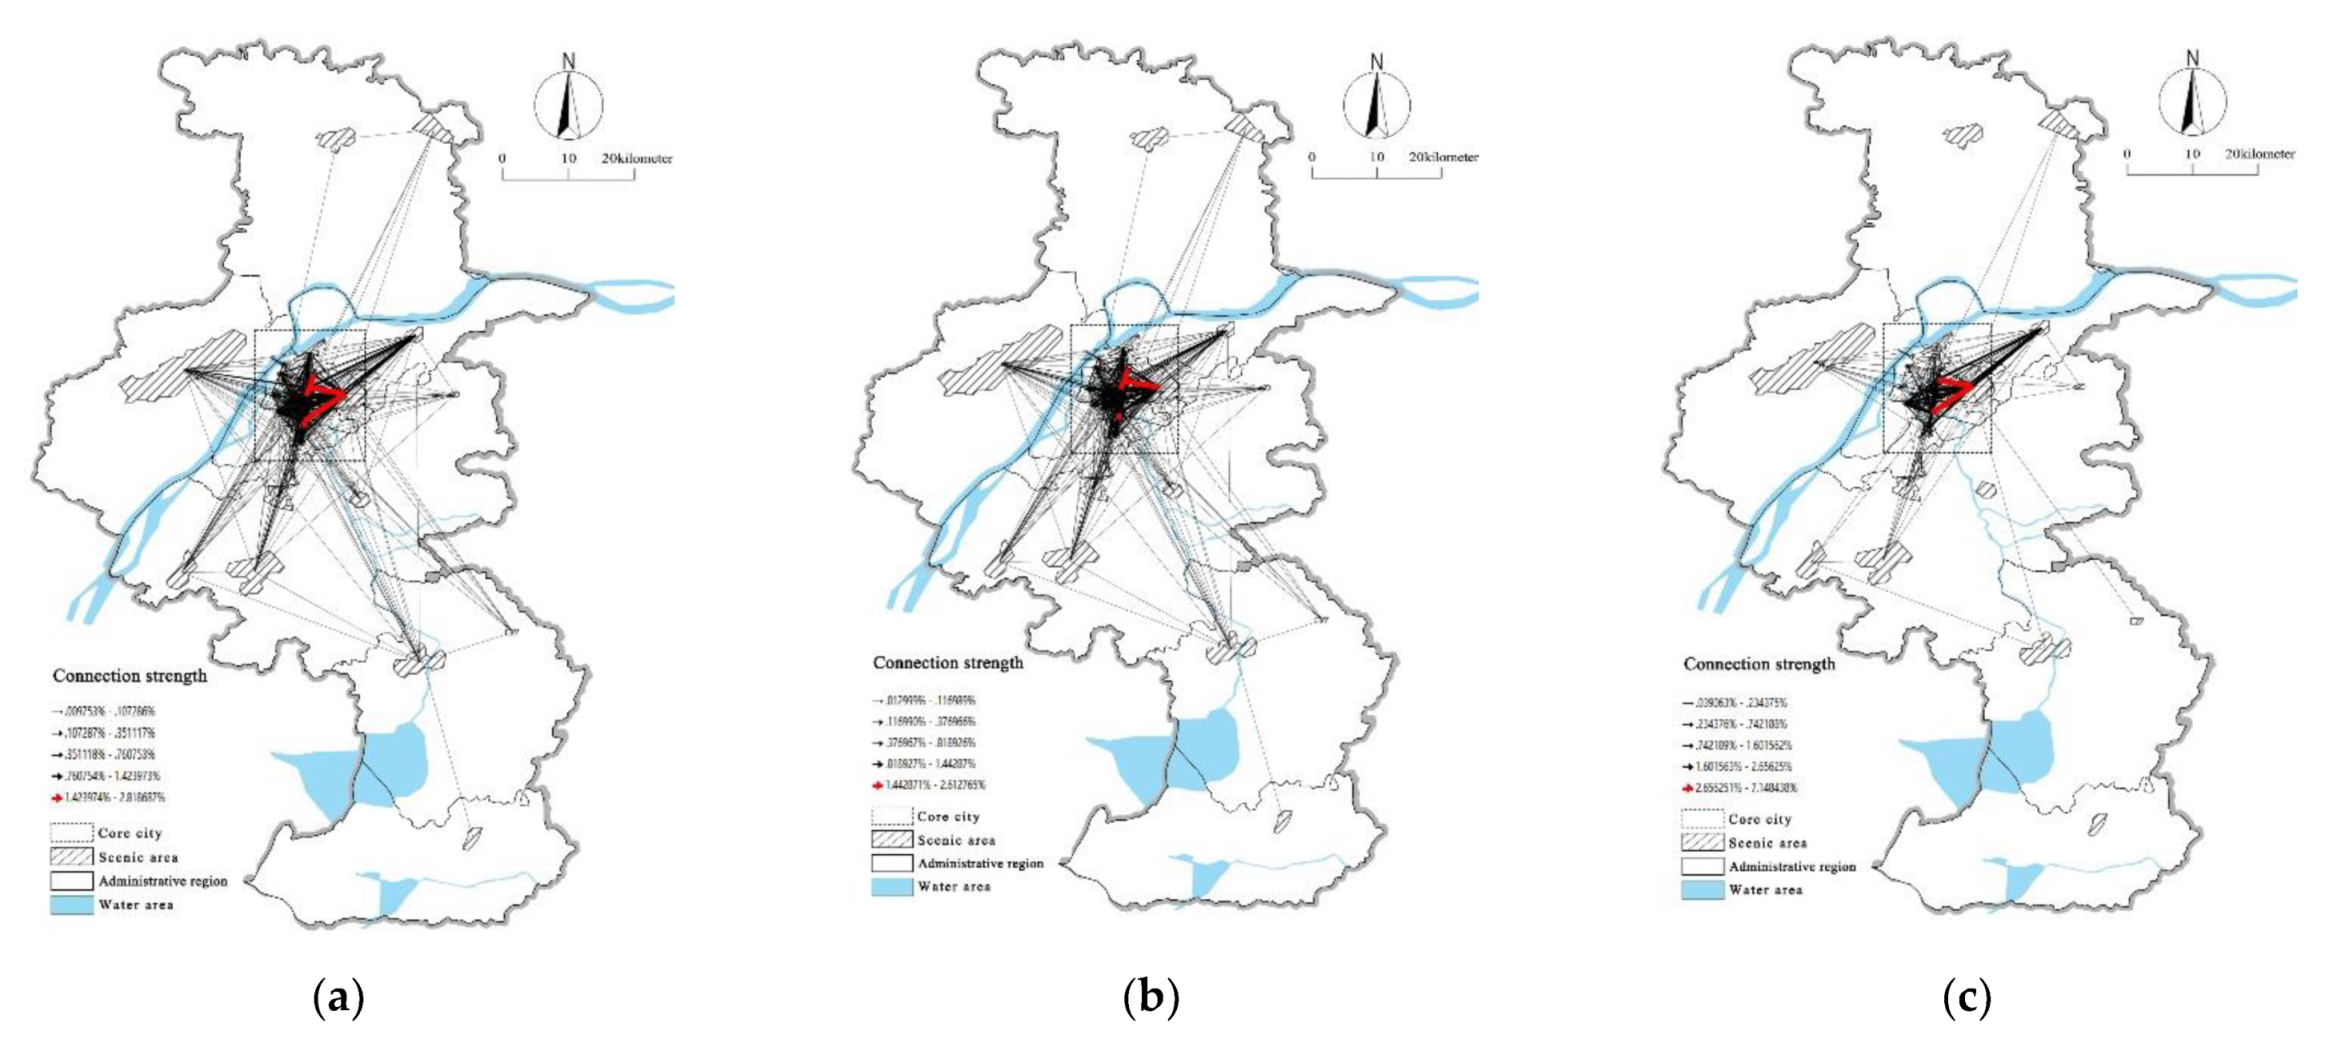
3.1. Analysis of Tourism Network Connections

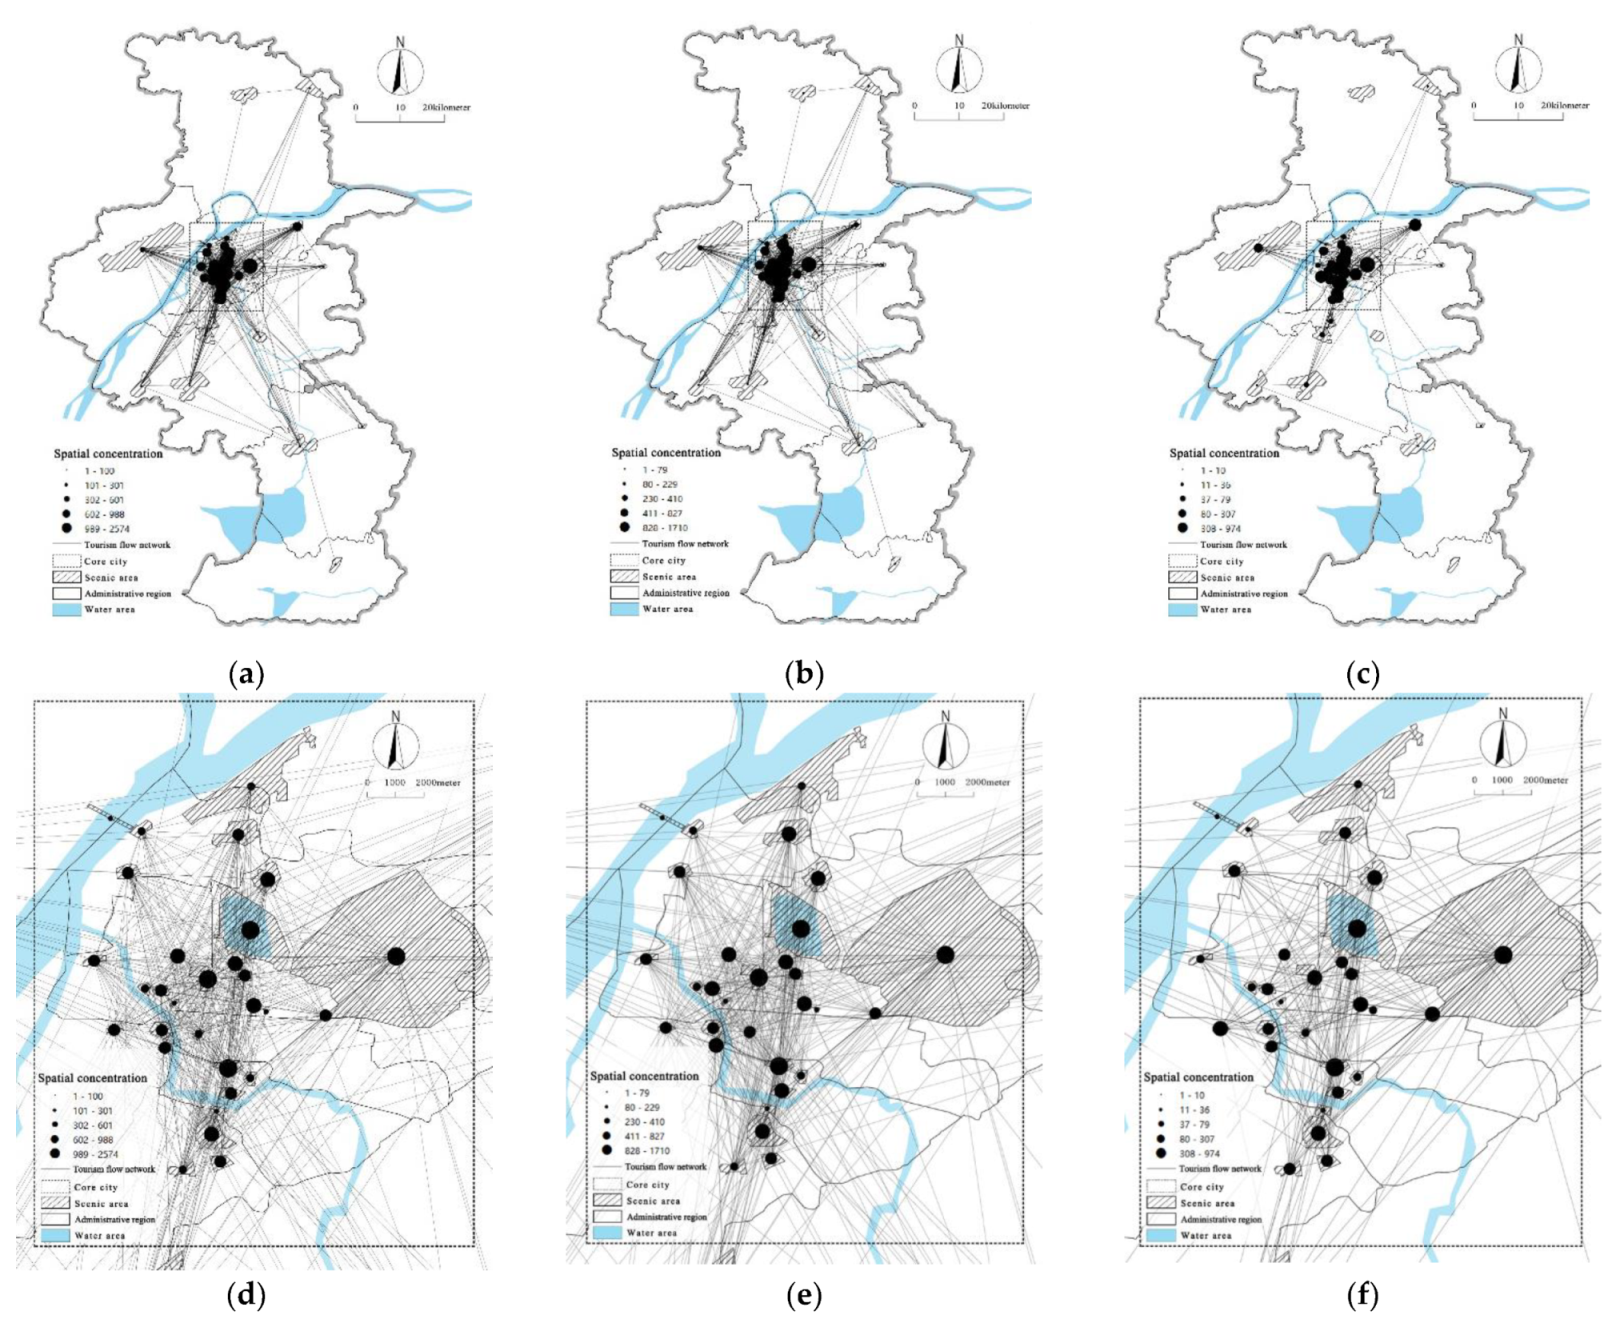
3.1.1. Spatial Concentration of the Tourism Flow Network

According to the research methods stated in Section 2.3.1, of the 43 scenic spots comprising the spatial scope, we selected 10,252 pairs of nodes with vectors. We collected the statistics of each node’s visit volume. Then, the nodes were divided into five classes, according to natural breaks. The larger the nodes, the higher their spatial concentration. The spatial concentration of the overall–local–non-local networks (see Figure 3) was thus derived, representing their out-degree centrality. The results showed the following.
Figure 3. Spatial concentration of the tourism flow network under three types of network context (overall, resident, and non-local tourist): (a) overall tourism flow network of entire city; (b) resident tourism flow network of entire city; (c) non-local tourism flow network of entire city; (d) overall tourism flow network of core city; (e) resident tourism flow network of core city; (f) non-local tourism flow network of core city.
As a whole, the overall connectivity of Nanjing’s tourism flow network was relatively good. No nodes were completely isolated. From the entire city proper, the network density was not high. However, the nodes in the core city were highly popular, with flows exhibiting the clustering feature. Nodes whose spatial concentration was in the first class (Zhongshan Scenic Area, Confucius Temple, Xuanwu Lake, Presidential Place (1912 District), Nanjing University Gulou District, and Hongshan Forest Zoo) were all located in the core city. Their spatial concentrations were far higher than those in the second class, thus demonstrating their absolute core status. Additionally, all of the nodes whose spatial concentration ranked in the first three classes were in the core city. Most of the 14 nodes with the lowest class spatial concentration were in the suburbs outside the core city (including Gaochun International Cittaslow Tranquil, Pingshan Forest Park, Jinniu Lake Scenic Area, Fangshan Scenic Area, Dajinshan Scenic Area, Tiansheng Bridge Scenic Area, etc.), except for the Nanjing Yangtze River Bridge and Meixian Xincun Memorial Hall, which were in the core city. Generally, the spatial concentration of Nanjing’s tourism flow showed a network characteristic of “exceptionally high spatial concentration for core city nodes, low spatial concentration for suburban nodes, and outstanding performance of core nodes”.
By comparing the nodes’ spatial concentrations formed by the tourism behavior of residents and non-local tourists, we discovered that the local network visits to scenic spots manifested higher densities than non-local tourists, although both displayed the characteristic of high spatial concentration for the core city network, and low spatial concentration for the suburban network. The spatial concentration of residents and non-local tourists related to core city nodes was generally similar. Residents displayed higher spatial concentration than non-local tourists, in terms of humanistic scenic spots (e.g., the Nanjing Museum, Nanjing University Gulou District, and Yihe Road Republican Architecture Complex). In comparison with non-local tourists, residents showcased higher and more comprehensive spatial concentration regarding suburban scenic spots. For non-local tourists, the nodes of Pingshan Forest Park, Fangshan Scenic Area, and Gaochun International Cittaslow Tranquil were isolated. In sum, both groups, residents and non-local tourists, displayed a characteristic of “relatively consistent overall spatial concentration, with slight differences existing in individual nodes”.

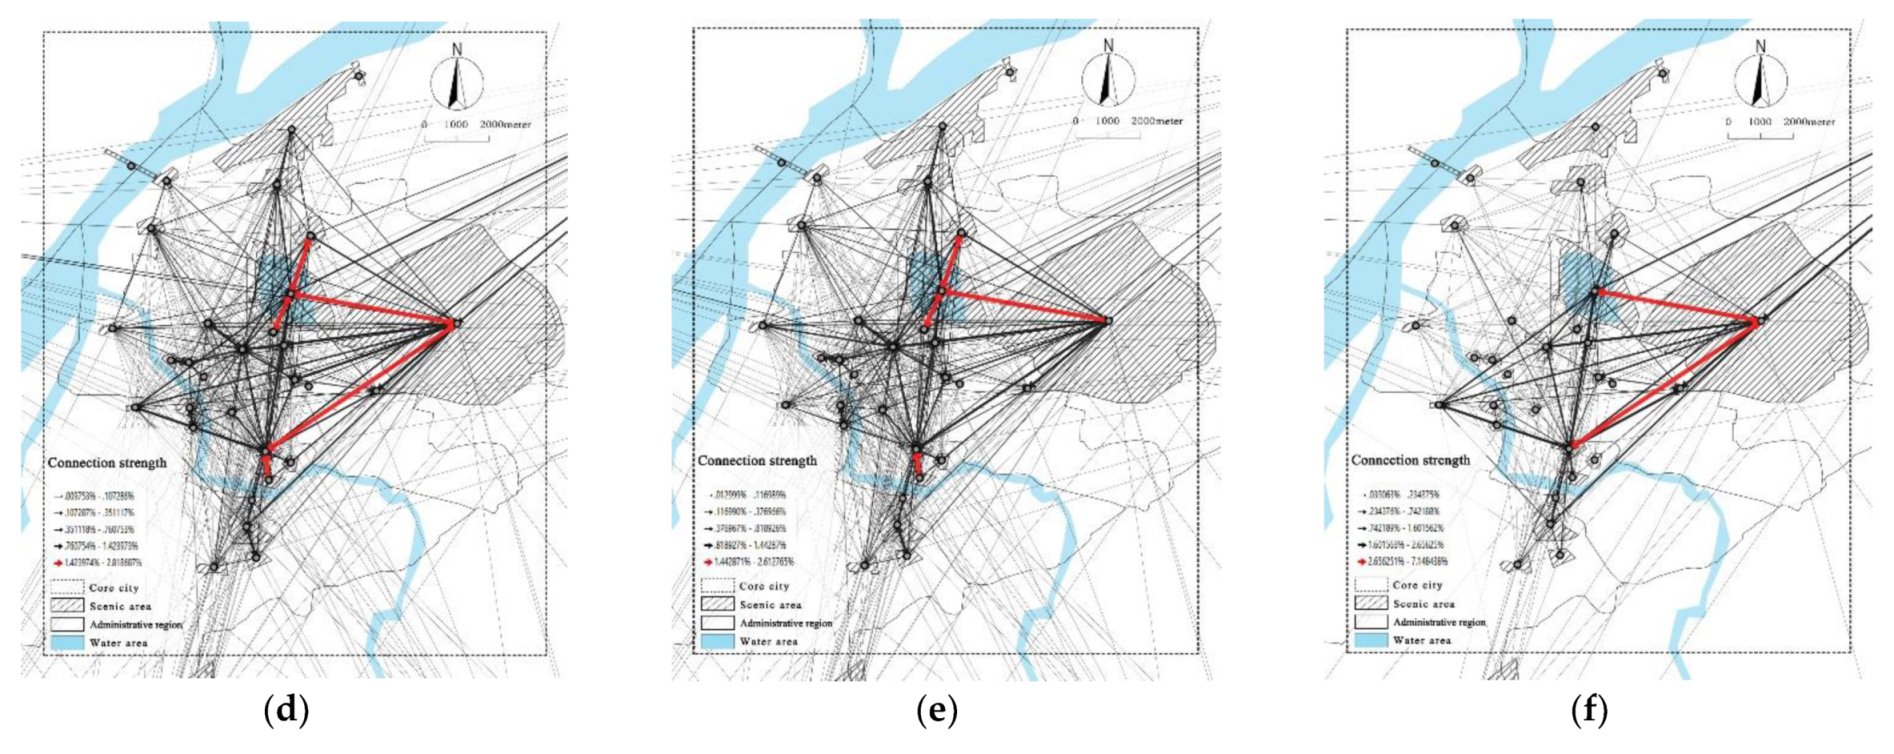
3.1.2. Analysis of the Connection Strength of the Tourism Flow Network

Based on the above conclusion, this study further analyzed the strength of the network connection between nodes. The lines between tourism nodes represent the volume of tourism flows, with the thickness of the lines indicating the volume size, and the arrows signifying the direction of the flows. The connection strength was obtained from the overall–local–non-local networks (see Figure 4). Our findings showed the following.
Figure 4. Connection strength of tourism flow networks under three types of network context (overall, resident, and non-local tourist): (a) overall tourism flow strength of entire city; (b) resident tourism flow strength of entire city; (c) non-local tourism flow strength of entire city; (d) overall tourism flow strength of core city; (e) resident tourism flow strength of core city; (f) non-local tourism flow strength of core city.
Generally, over 85% of Nanjing’s node connections were concentrated in the core city area. Fundamentally, the node connections gradually weakened as the distance from the core city area increased. Most of the suburban nodes showed a unidirectional inflow. Such connections resulted from the spillover from the core city nodes. The top five node pairs in the network connections (Zhongshan Scenic Area–Confucius Temple, Zhongshan Scenic Area–Xuanwu Lake, Beiji Ge Park (Jiming Temple)–Xuanwu Lake, Hongshan Forest Zoo–Xuanwu Lake, and XuanwuLake–Hongshan Forest Park) were all bidirectionally connected. Among them, Zhongshan Scenic Area, Confucius Temple, and Xuanwu Lake formed strong connections with two or more nodes and, thus, served as the absolute core in the network connection. Most of the second class node pairs formed from the first class node connection with other nodes, and so on. Thus a “tree” network structure manifests in Nanjing city’s tourism flow network, where nodes with high connection strength spill over progressively to those with low connection strength. On the whole, the connection strength of Nanjing’s tourism flow showed a “high-strength connection between nodes in the core city area, with a progressive decrease towards the periphery spatially”.
Comparing the node connection strength that was formed by residents and non-local tourist behaviors, we found that both exhibited high connection strength in the core city, and low connection strength in the suburbs. However, the nodes that residents visited showed a higher overall connection strength than those of non-local tourists. The connection strength of the nodes visited by residents displayed a relatively balanced spatial distribution, and more diverse types. Comparatively, the connection strength of the nodes visited by non-local tourists showed a more concentrated spatial distribution, with blank spaces appearing in the network connection of some suburb nodes. Additionally, the spatial concentration tended to fall on higher-rated and better-known node connections. Resident-visited nodes that fell in the first grade of connection strength included the following four pair nodes: Xuanwu Lake–Zhongshan Scenic Area, Xuanwu Lake–Beijing Ge Park (Jiming Temple), Xuanwu Lake–Hongshan Forest Zoo, and Old East Gate–Confucius Temple; non-local resident-visited nodes with first grade connection strengths include the following two node pairs: Xuanwu Lake–Zhongshan Scenic Area and Confucius Temple–Zhongshan Scenic Area. This shows that marked differences existed between these two groups. In terms of tourism route selection, residents attached greater priority to proximity in spatial location, whereas non-local tourists tended to choose well-known scenic spots. Generally, concerning node connection strength, “the nodes residents visited displayed a spatial balance in connection strength and diversification of types, while the nodes visited by non-local tourists exhibited a spatial concentration and inclination toward highly-rated nodes. The two groups showed distinct differences in tourism route selection”.

3.2. Analysis of Node Centrality in the Tourism Flow Network

3.2.1. Node Centrality Analysis

Centrality is a quantitative statistic of node power, as seen in the analytical methods for tourism flow networks in Section 2.3.2. Centrality can depict the values of nodes in tourism networks. The calculations in this paper produced the differentiated measure values of the three types of centrality under different tourism flow network contexts—namely, overall, local, and non-local (see Table 2). The natural break classification categorized them into three levels. The internal difference within the same level was minimized, while the differences between different classes was maximized. A spatial visualization was also performed (see Figure 5, Figure 6 and Figure 7).
Table 2. Tabulation of three types of node centrality in the tourism flow network.
Figure 5. Classification map of the in-degree centrality of nodes under three types of network context (overall, resident, and non-local tourist): (a) entire city of Nanjing; (b) core city of Nanjing.
Figure 6. Classification map of the eigenvector centrality of nodes under three types of network context (overall, resident, and non-local tourist): (a) entire city of Nanjing; (b) core city of Nanjing.
Figure 7. Classification map of the betweenness centrality of nodes under three types of network context (overall, resident, and non-local tourist): (a) entire city of Nanjing; (b) core city of Nanjing.
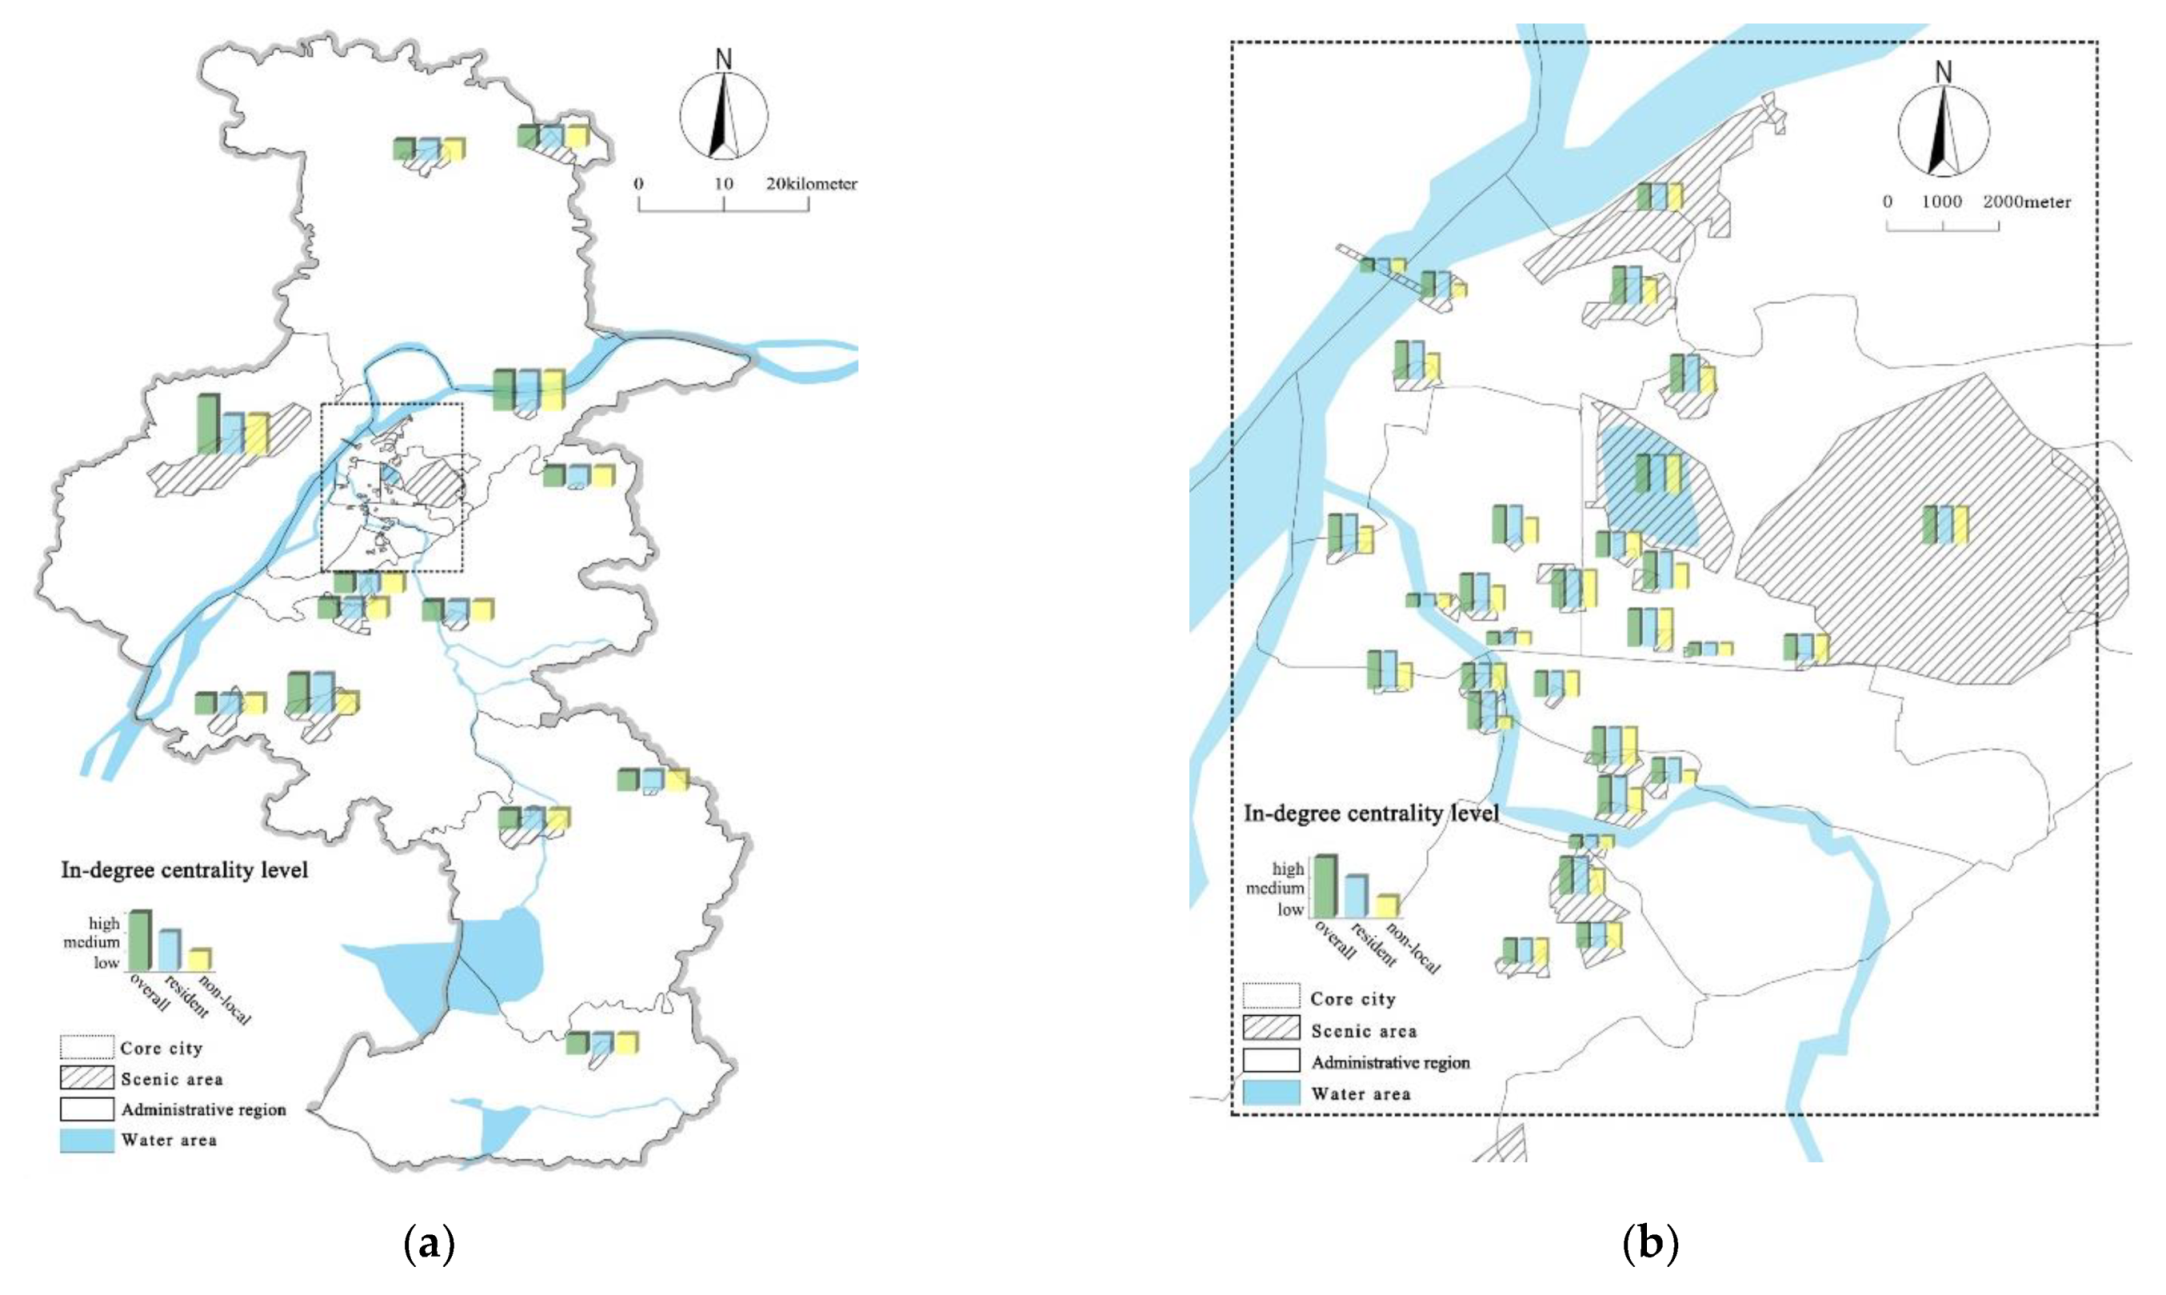
  • Popularity and Attraction of Network Nodes (In-degree Centrality)
As shown in Figure 5, the popularity and attraction of the core city nodes were far higher than the suburban nodes. A total of 90% of the core city nodes were within the high and medium levels of popularity and attraction, with a relatively small range. As for the suburban nodes, their popularity and attractiveness were low, with only a small number at the high and medium levels of popularity and attractiveness.
A comparison of the popularity and attractiveness of the nodes visited by residents and non-local tourists showed that, in both groups, core city nodes were more popular than suburban nodes. The most popular nodes included Xuanwu Lake, Zhongshan Scenic Area, Confucius Temple, and Nanjing University Gulou District. The nodes that attracted residents were more balanced in their spatial distribution (particularly in the core city), with many of the nodes falling within the high and middle classes. By comparison, the nodes that attracted non-local tourists were more concentrated, and the number of popular nodes was far lower than that of the popular nodes visited by residents.
  • Latent Attraction of Network Nodes (Eigenvector Centrality)
As indicated in Figure 6, the intensity of the activities around the core city nodes was far higher than in the suburban nodes. Six nodes were located in centers of intense activity (Zhongshan Scenic Area, Xuanwu Lake, Hongshan Forest Zoo, Confucius Temple, Nanjing University Gulou District, and Yihe Road Republican Architectural Complex). Qixiashan Scenic Area, in the suburbs, had a high-level latent attraction, which resulted from the high intensity in the core city nodes.
Comparing the latent attraction of the nodes that were visited by residents and non-local tourists, our results showed that both bore similarities in the core city area. The nodes that were visited by residents achieved a higher rate of latent attraction than those that were visited by non-local tourists. In the suburbs, the nodes in the non-local tourist network displayed a higher level of latent attraction than those that were visited by residents. The findings show that residents had more flexible and varied selections of tourism nodes, while non-local tourists selected popular nodes as often as possible.
  • Mediating and Controlling Power of Network Nodes (Betweenness centrality)
As shown in Figure 7, there was an unclear relationship between the mediating and controlling power of the nodes in the city proper and their spatial locations. Almost all of the nodes were at medium and low levels, with Zhongshan Scenic Area being the only essential node. This indicates that all of Nanjing city’s nodes have weak mediating and controlling power, meaning each node was relatively independent, or mostly combinations of nodes, with no nodes being necessary. Thus, the network structure was rather loose, with no significantly popular tourism routes (links whose node number was greater than two).
Similarities were found in the comparison of the mediating and controlling power of the nodes visited by residents and non-local tourists. The nodes that non-local tourists selected had slightly stronger mediating and controlling power than those that were selected by residents. This shows that the combinations of nodes in the non-local tourism flow network were relatively uniform and stable, while those in the resident networks were more flexible and varied.

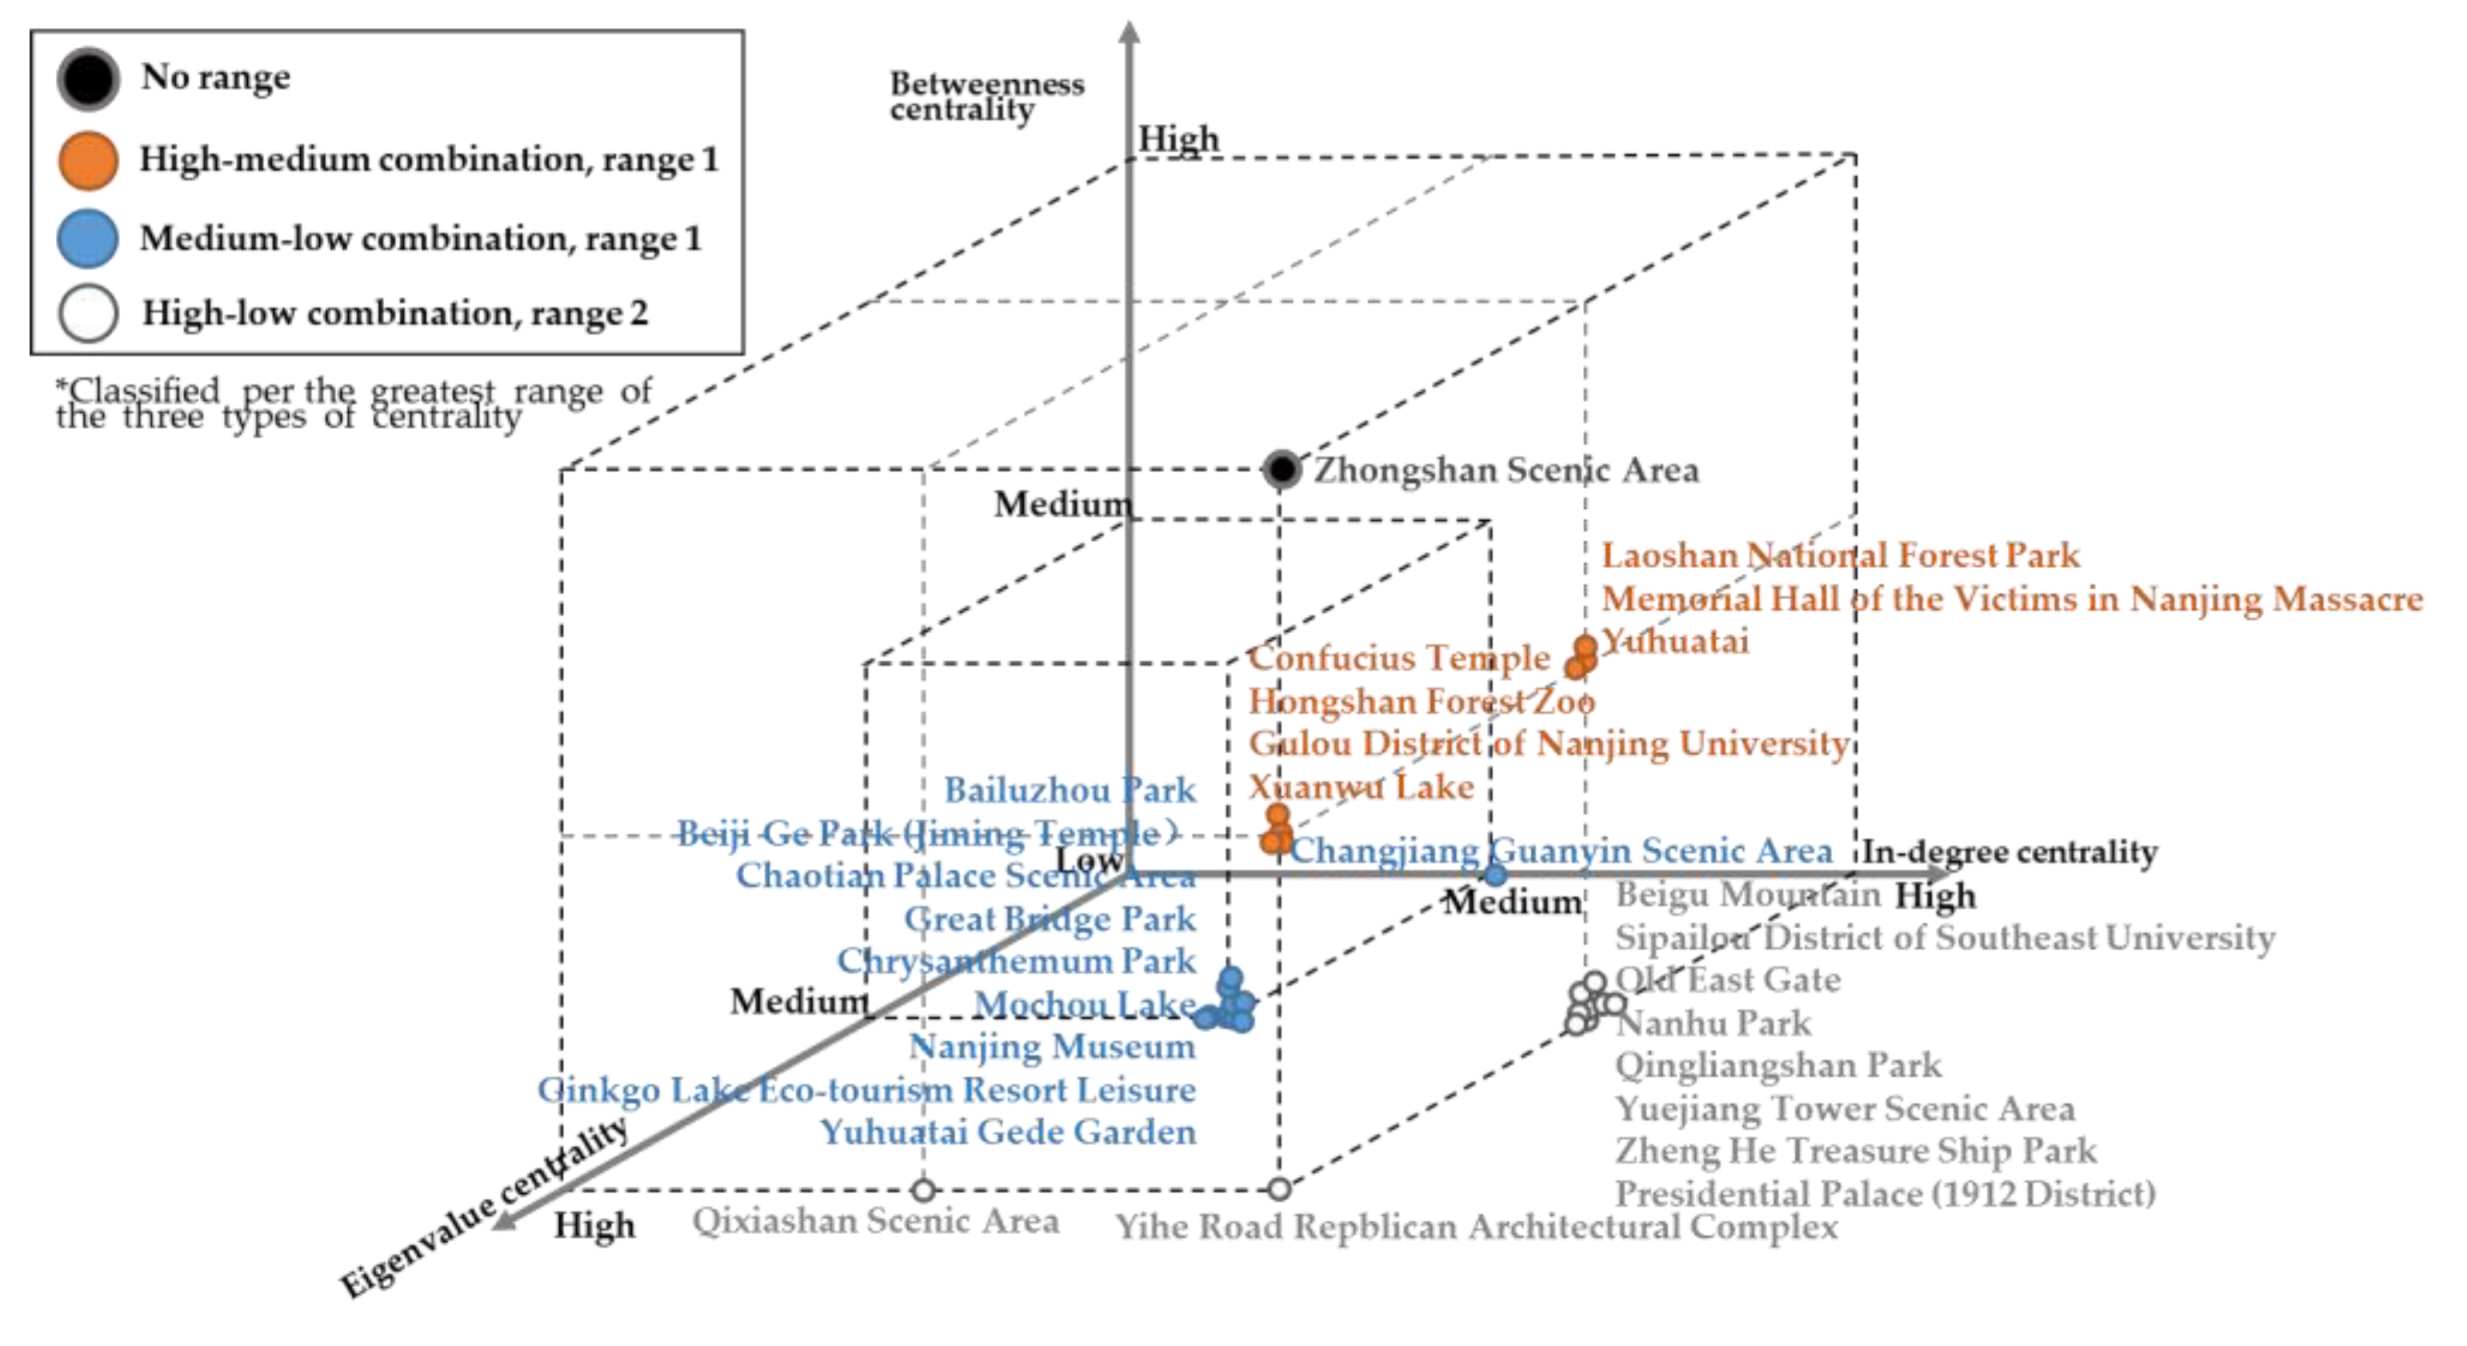
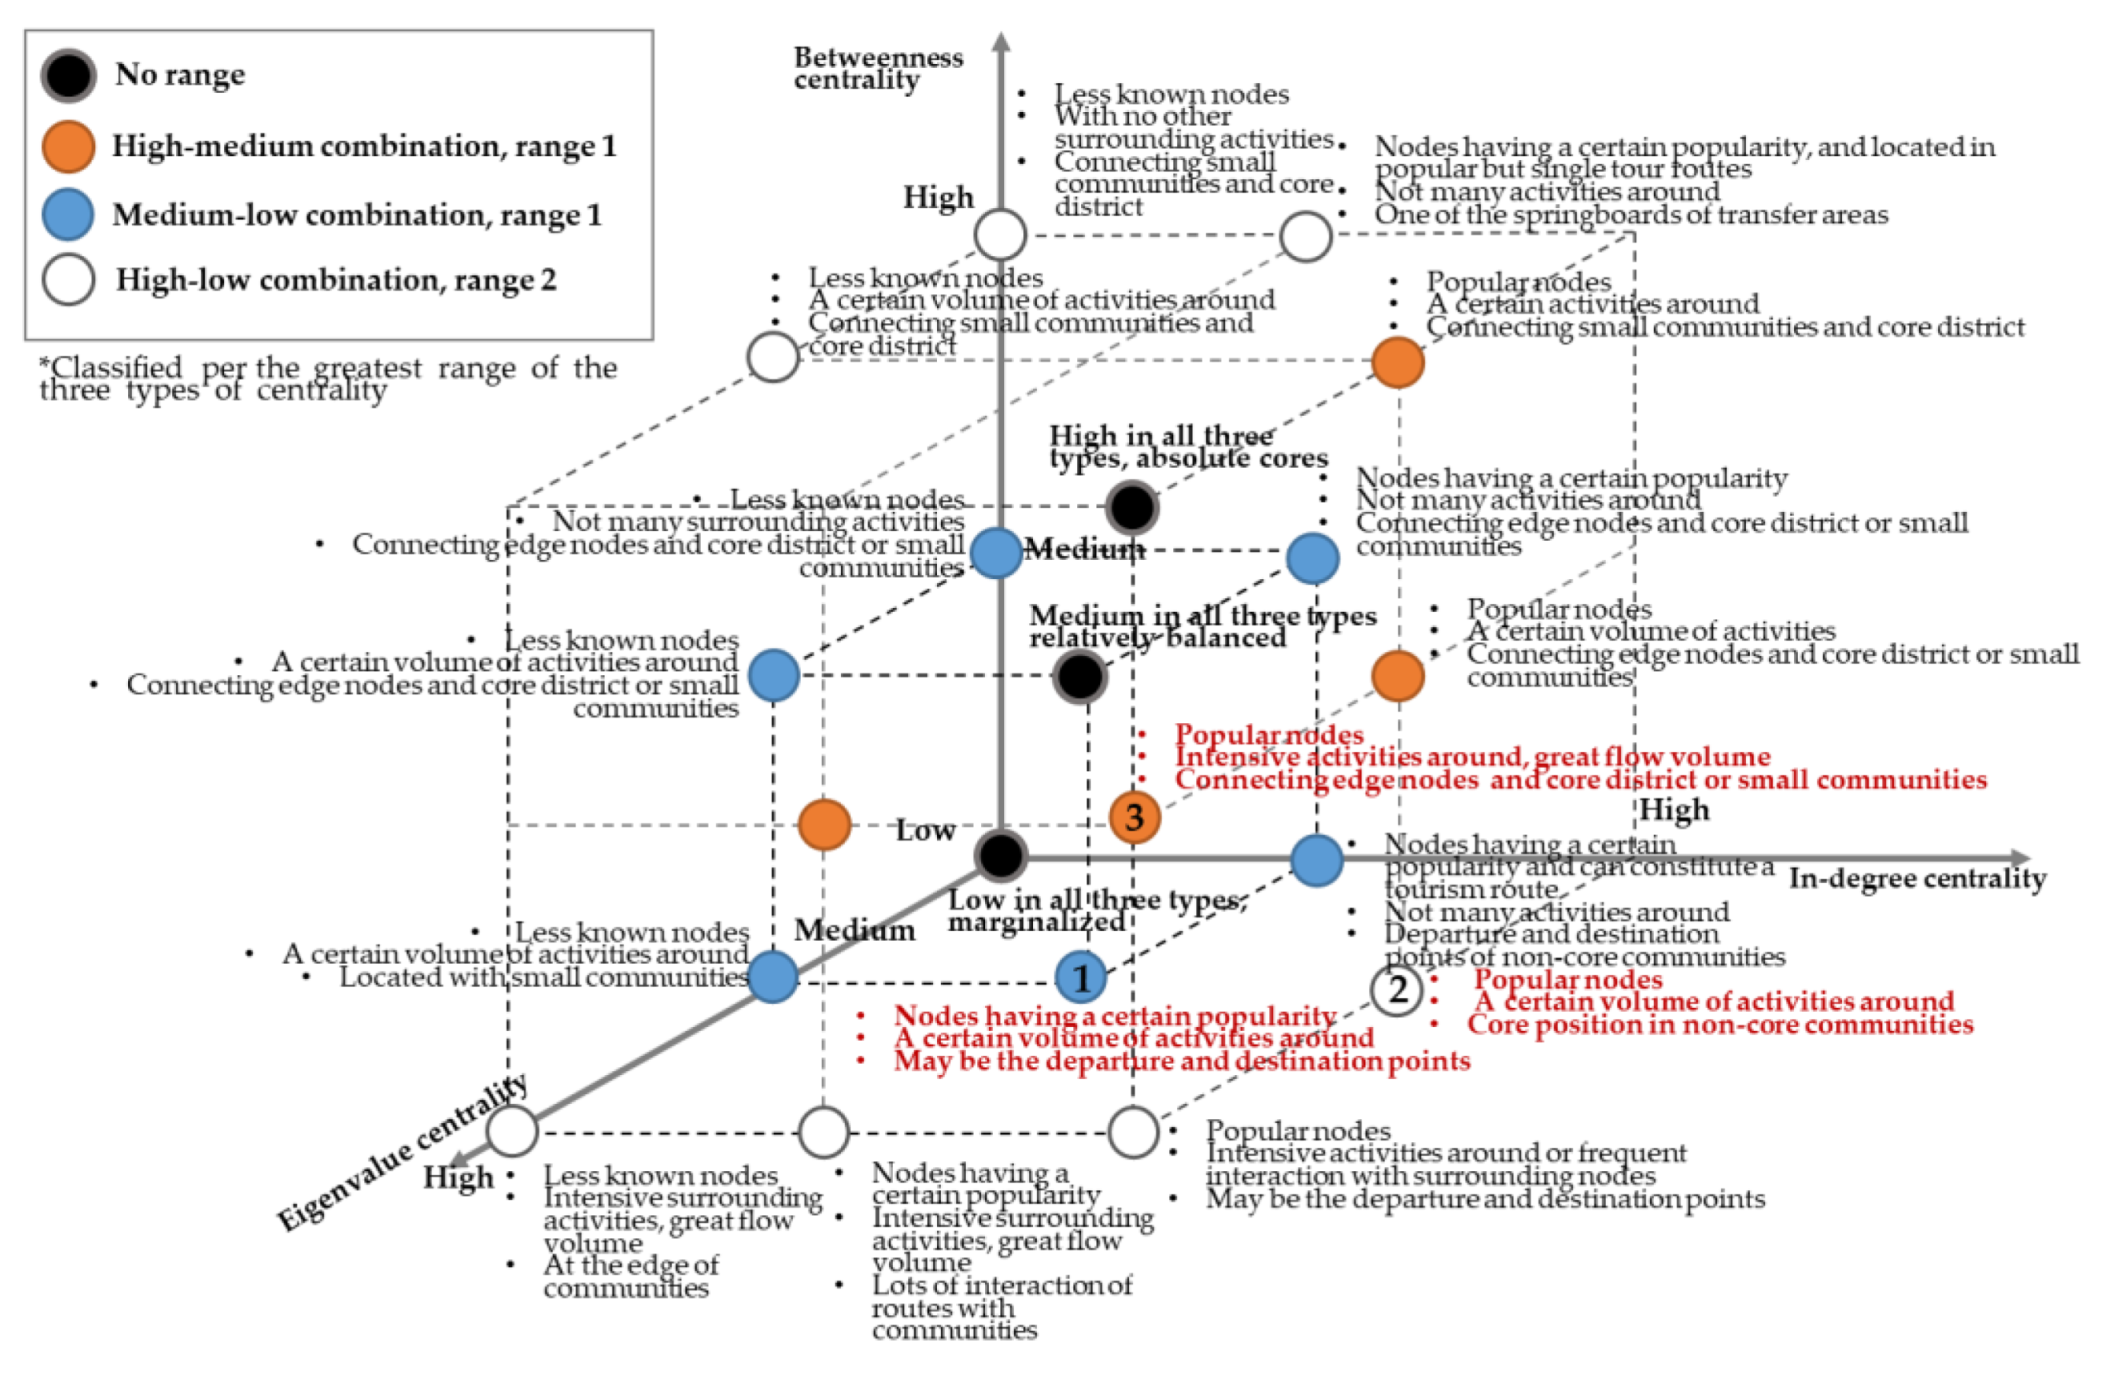
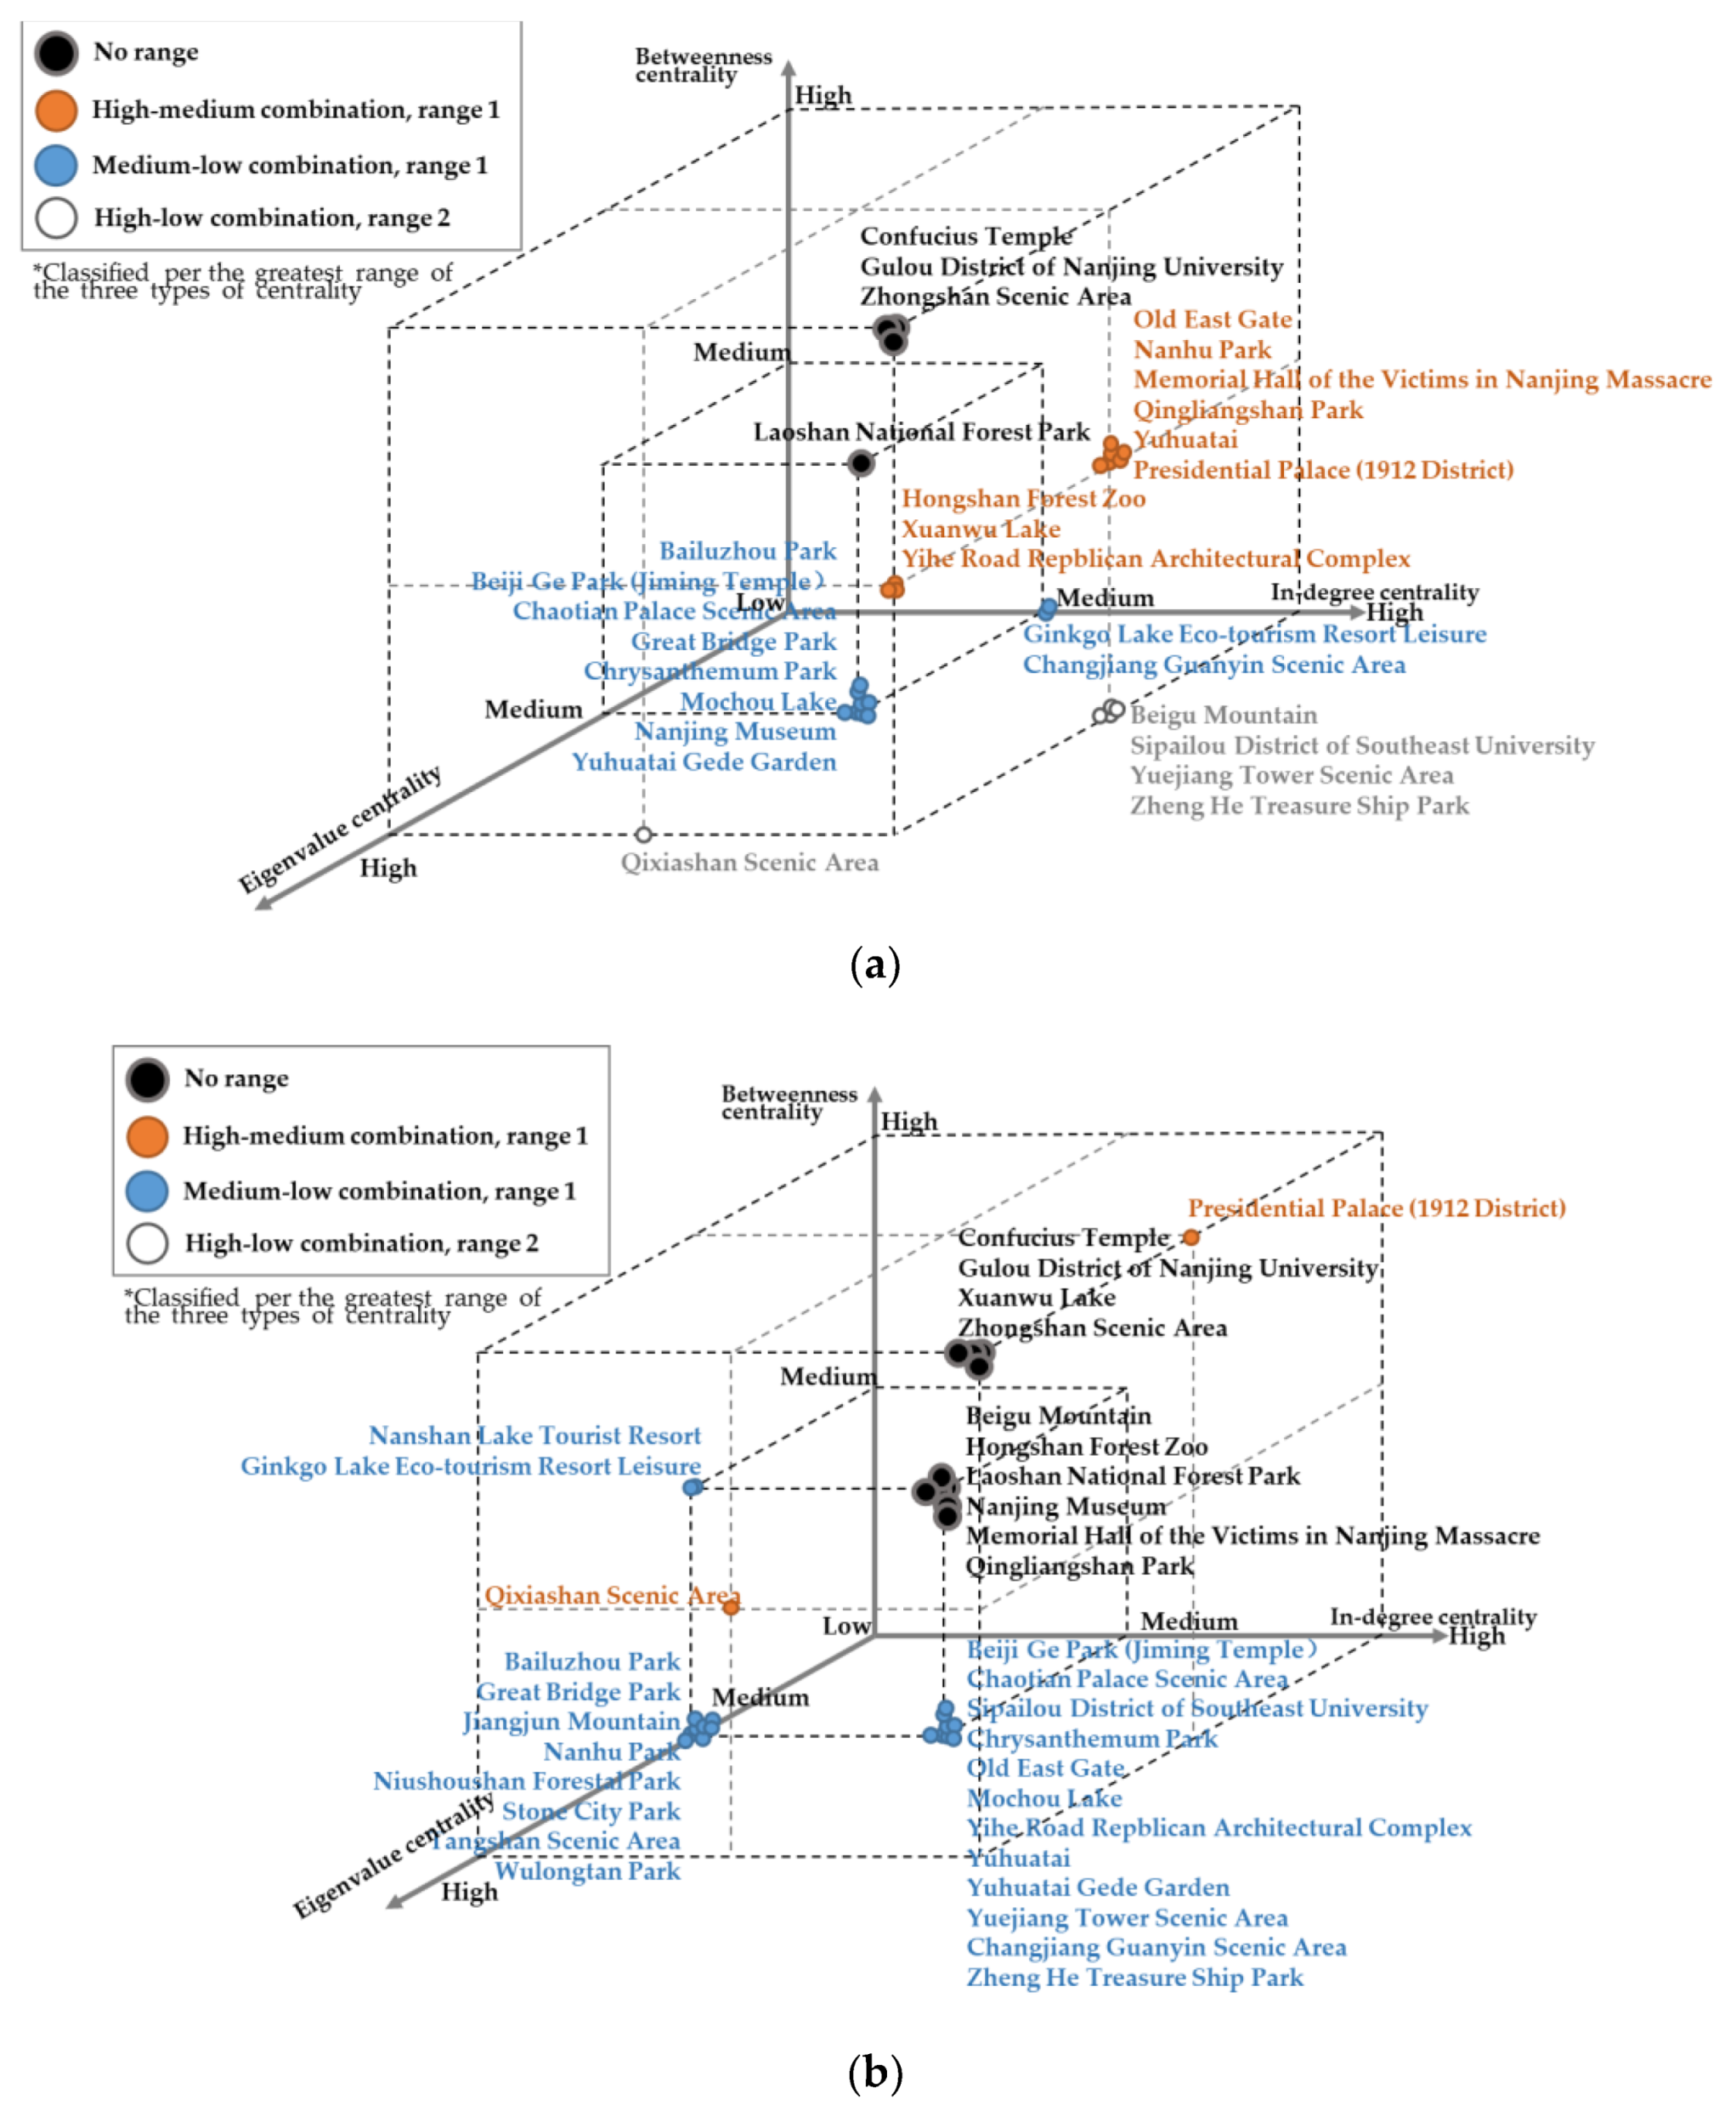
3.2.2. Evaluation of Node Status Based on Node Centrality

A correlation exists between all of the types of tourism node centrality. Therefore, these three types of node centrality were arranged and combined to create a more comprehensive status evaluation system. Figure 8 depicts a coordinate system of differences in centrality combinations. In this system, axes X, Y, and Z represent in-degree centrality, eigenvector centrality, and betweenness centrality, respectively, and each divides into high, medium, and low levels. If a node had a combination of high and medium levels, or medium and low levels, the range was one. However, if it consisted of all three levels, or only high and low levels, the range was two. When all of the three centrality type levels were identical, there was no gradation. When all of the three node centrality types were low, there was always an edge node in the tourism network. When all of the three node centrality types were at the medium level, this meant that the node was still in balanced development. When the three node centrality types were high from beginning to end, it was a popular core node. This coordinate system arranged and combined the three different centrality type levels (high, medium, and low) to highlight tourism significance.
Figure 8. Node status evaluation system for tourism flow networks.
All of the nodes populated the coordinate system according to the three centrality combination types depicted in the node status evaluation system (see Figure 9). Three nodes with low levels of eigenvalue centrality were excluded from the diagram to improve readability. In the overall table, the more common combinations were: (1) middle in-degree, middle eigenvalue, and low betweenness—nodes had a certain popularity, as did the adjacent points, although it is very likely that they were the tourist’s starting and destination points; (2) high in-degree, medium eigenvalue, and low betweenness—nodes were popular, and the adjacent points also had a certain level of popularity, being situated in the core position of non-core communities; (3) high in-degree, high eigenvalue, and medium betweenness—nodes and adjacent points were popular, situated at the “bridging” position between edge nodes and the core district, or between small communities.
Figure 9. Evaluation of the node status in the overall tourism flow network.
This study further compared the resident and non-local tourist networks (see Figure 10). We revealed and ranked the resident network’s first three combinations: (1) medium in-degree, medium eigenvalue, and low betweenness; (2) medium in-degree, high eigenvalue, and medium betweenness; (3) high in-degree, medium eigenvalue, and low betweenness. This showed “high in-degree centrality, generally moderate eigenvalue centrality, and seriously polarized betweenness centrality”. The results indicate that the popular nodes that were approved by residents were more diversified. Some of the popular nodes showed close connections and balanced development, while others existed independently. The first three combinations in the ranking of non-local tourist networks were: (1) medium in-degree, medium eigenvalue, and low betweenness; (2) low in-degree, medium eigenvalue, and low betweenness; (3) medium in-degree, medium eigenvalue, and medium betweenness—manifesting the characteristic of “overall low in-degree centrality, higher eigenvalue centrality, and seriously polarized betweenness centrality”. Compared to those visited by residents, the popular nodes that were approved by non-local tourists were relatively concentrated and stable, and mostly in a state of moderate popularity or marginalization.
Figure 10. Comparison of the node status evaluation in resident networks and non-local tourist networks: (a) resident networks; (b) non-local tourist networks.

3.3. Analysis of Tourism Flow Network Communities

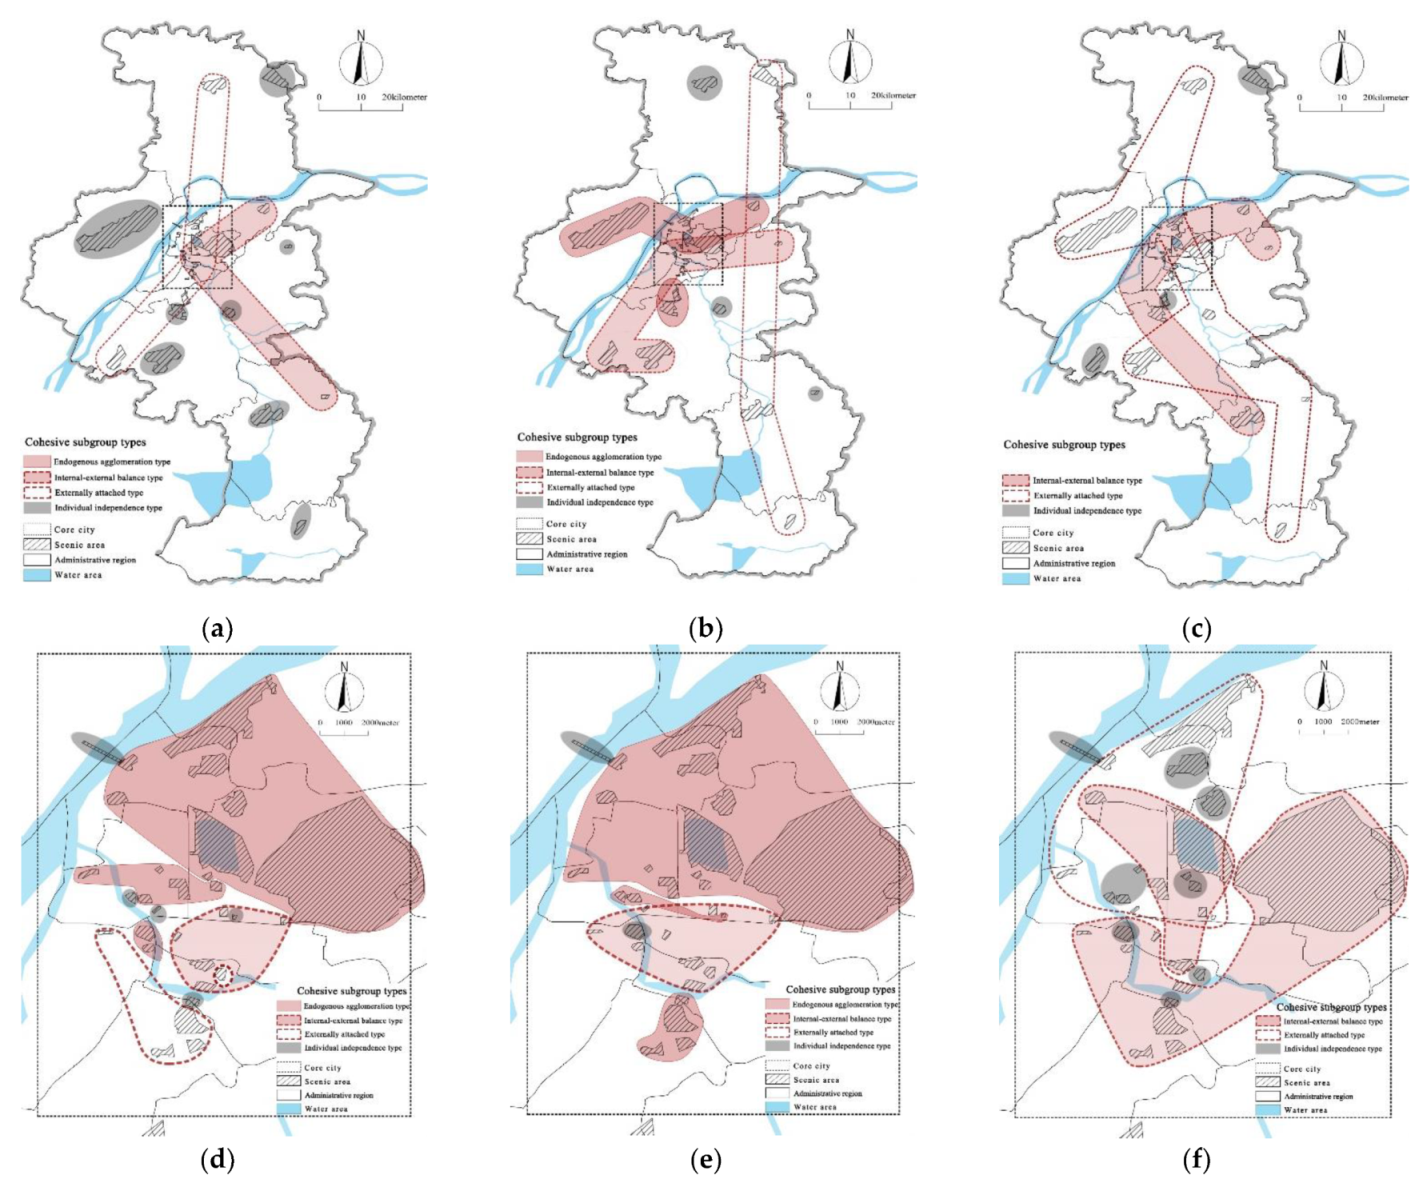
3.3.1. Cohesive Subgroup Analysis of the Tourism Flow Network

The CONCOR method in the UNICET software was used to perform a cohesive subgroup analysis. We calculated the coefficients of each row (or column) in the matrix, with the final results shown in Table 3. The higher the numerical value of the density matrix, the closer the subgroup connection.
Table 3. Density matrix of the cohesive subgroups in the tourism flow network.
The results of the cohesive subgroup analysis revealed the substructures within the tourism flows, and show more tourist route combinations. In the cohesive subgroup density matrix of the overall tourism flow network in Nanjing city (see Table 3), eight substructures formed, each with varying closeness of flow connections between the subgroups. Subgroup 5, 6, and 8 showed the most frequent interactions between internal node members. Subgroup 7 showed a higher frequency in the internal interaction between its subgroup nodes and their external connections. In this light, combination marketing, or combined tourism tickets, may appeal to these two subgroups. The nodes in subgroup 1 and 3 were mainly dependent on their connections with other subgroups. These node types may be treated as additional products to the above subgroups. Subgroup 2 and 4 were relatively independent, with comparatively weak internal and external connections, and can be branded separately as tourism products with unique features.
Based on the analysis of the eight cohesive subgroups in the overall tourism flow network, these subgroups fall into four classifications: (1) endogenous agglomeration type—AVG1 (degree of internal connection > AVG, and AVG2 (degree of external connection) ≤ AVG, manifesting as the subgroups converging inward, powerful connections between internal individual members, and weak connections outside of the subgroups; (2) internal-external balance type—AVG1 (degree of internal connection) > AVG, and AVG2 (degree of external connection) > AVG, manifesting as the subgroups having strong internal and external connections; (3) externally attached type—AVG1 (degree of internal connection) ≤ AVG, and AVG2 (degree of external connection) > AVG, manifesting as weak connections between members and internal subgroups, although forming a strong connection with one or several external subgroups; (4) individual independence type—AVG1 (degree of internal connection) ≤ AVG, and AVG2 (degree of external connection) ≤ AVG, with members within subgroups having relatively weak internal and external connections, and failing to form obvious network connections with other subgroups and individuals (or forming a connection with individual subgroups).
Likewise, the local and non-local tourism flow networks could be classified according to this criterion, which produced our results for the analysis of the tourism flow networks of the three types of subgroup (overall, local, non-local) (see Table 4, Figure 11).
Table 4. Cohesive subgroups of tourism flow networks under three types of network context.
Figure 11. Cohesive subgroups’ spatial distribution of tourism flow networks under three types of network context (overall, resident, and non-local tourist): (a) overall cohesive subgroup of entire city; (b) resident cohesive subgroup of entire city; (c) non-local cohesive subgroup of entire city; (d) overall cohesive subgroup of core city; (e) resident cohesive subgroup of core city; (f) non-local cohesive subgroup of core city.
Overall, in Nanjing city, all of the tourism nodes with a high visit volume (tourism brand image) were within the endogenous agglomeration and internal-external balance types, thereby becoming the absolute cores of these two kinds of subgroups. Spatially, they connected to several adjacent nodes, with well-defined edges to the subgroups, and all were within the core city of Nanjing. Furthermore, some nodes that were on the periphery of the core city existed by attaching to these two kinds of subgroups. There were also some relatively independent, small-scale node groups, with only a single flow path. These results align with the study on the all-for-one tourism policy of cities.
From the residents’ point of view, more nodes were classified as endogenous agglomeration and internal-external balance types. These form an even greater agglomeration network in the tourism flow, breaking down the spatial boundary of the core city, and absorbing more suburban nodes. Furthermore, the subgroups of externally attached and individual independence types had relatively few nodes, and showed the tendency of gradual absorption by the subgroups with a high agglomerative nature.
From the perspective of non-local tourists, no subgroup emerged from the endogenous agglomeration type. Additionally, almost all of the subgroups of the internal-external balance type were within the core city. Such subgroups were formed by core nodes and a few adjacent nodes, and were, therefore, subject to spatial limitations. More than half of the nodes were situated within the subgroups of the externally attached and individual independence types, indicating that only the core nodes in tourism flow network structures performed prominently, whereas the overall connection was insufficient and fragmented.

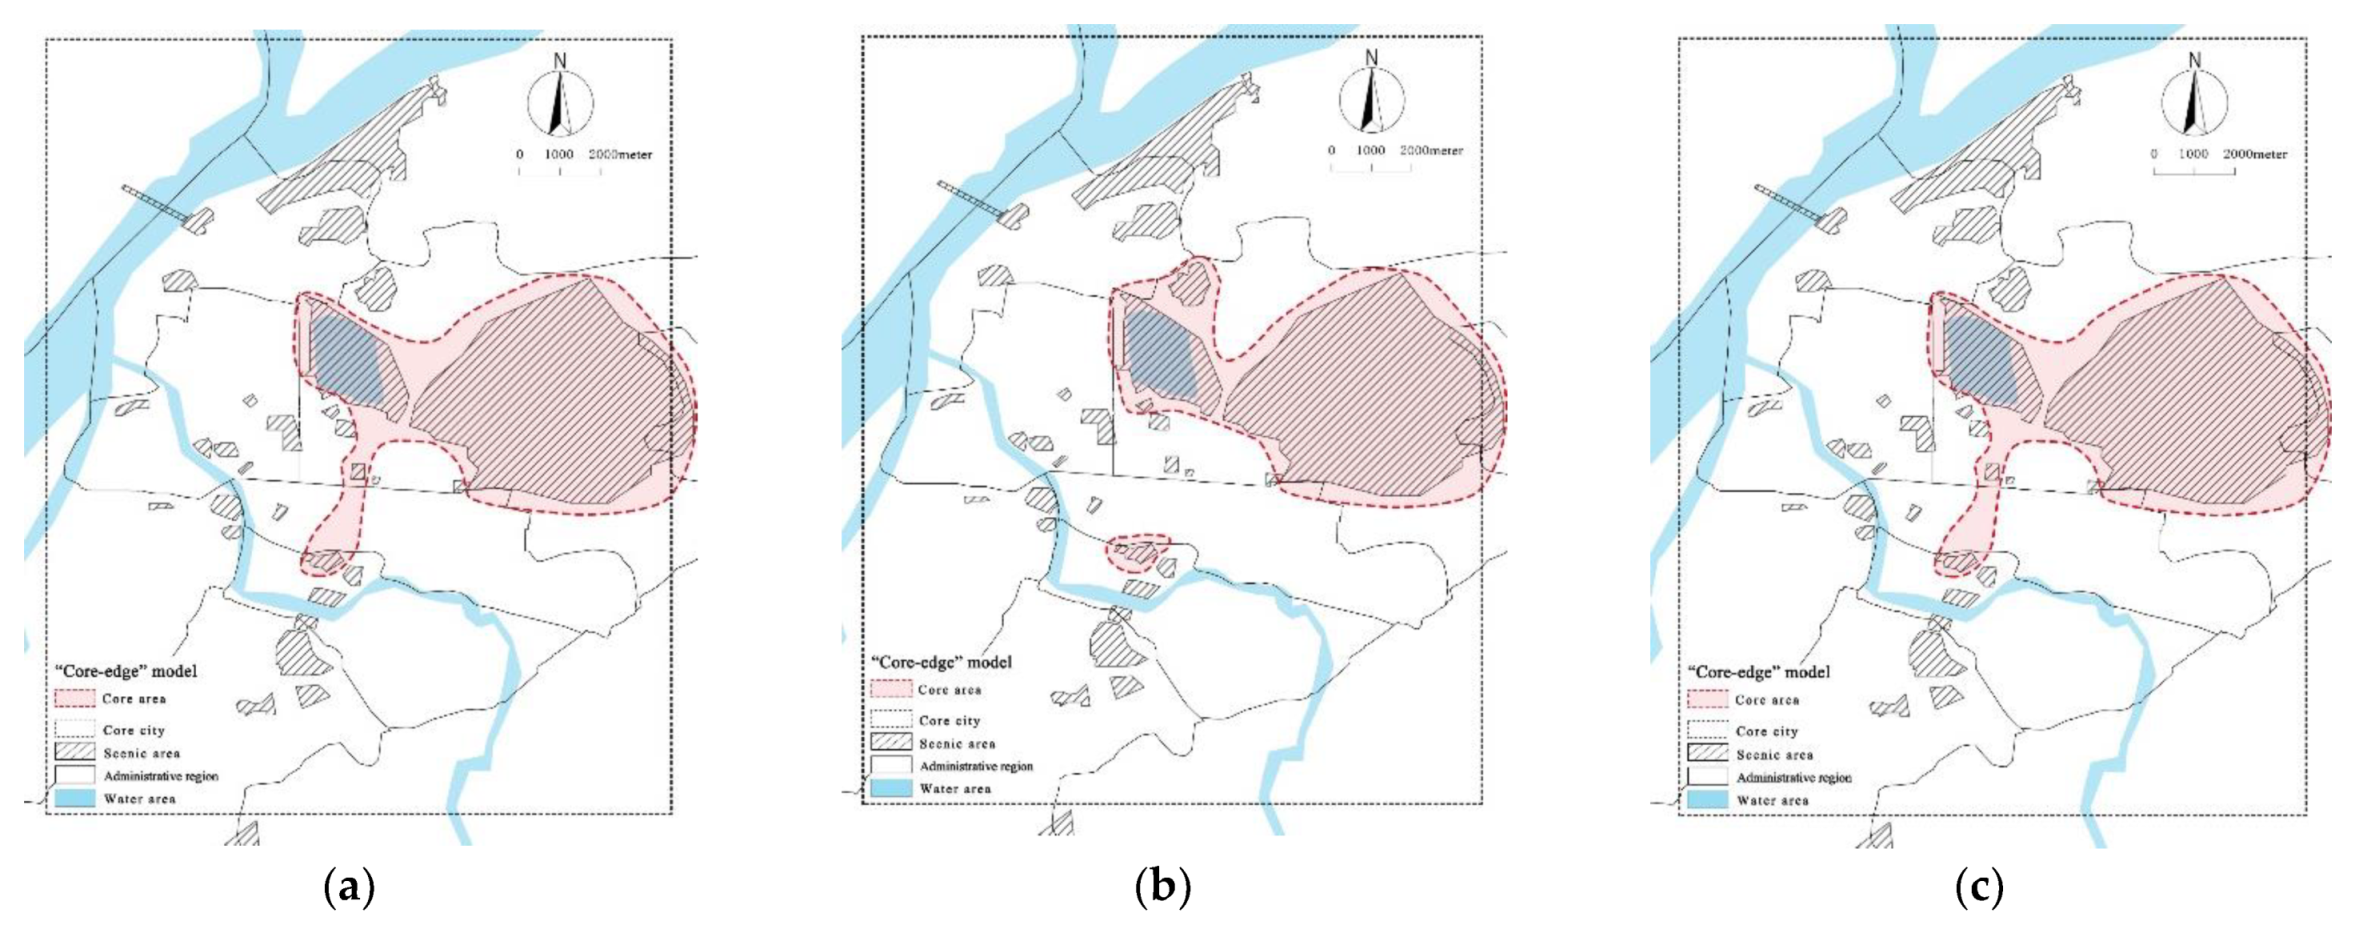
3.3.2. “Core-Edge” Model

Based on the binarization results of the communities in the tourism flow networks that were extracted using the “core-edge” model of UNICET, the results of the overall tourism flow in Nanjing indicate the following (see Table 5, Figure 12). The core district members included four nodes—namely, Confucius Temple, Presidential Palace (1912 District), Xuanwu Lake, and Zhongshan Scenic Area. The remaining 39 nodes were at the district’s edge. Regarding the correlation degree, core district members reached 0.78, while district edge members were only 0.08, indicating obvious structural stratification in the tourism network in Nanjing. Furthermore, the correlation degree between core members and edge members reached 0.29, indicating that a connection between core and district edge was also relatively close. Regarding spatial distribution, the core district nodes were all located within the core city. Spatially, a diminished connection density was observed between the district edge and the core district nodes, from the core to the periphery. Therefore, aside from actively developing the core tourism districts, it is necessary to simultaneously enhance the overall tourism competitiveness of Nanjing city through positive cultivation, systematic and active expansion, and linkage to edge tourism districts.
Table 5. “Core-edge” model under three types of network context (overall, resident, and non-local tourist).
Figure 12. “Core-edge” model spatial distribution under three types of network context (overall, resident and, non-local tourist): (a) overall “core-edge” model of core city; (b) resident “core-edge” model of core city; (c) non-local “core-edge” model of core city.
By comparing the “core-edge” structures that were formed by resident and non-local tourist tourism flow networks (see Table 5), this study found that the respective core district members had slightly different compositions. The core district that was formed by resident tourism flow included Zhongshan Scenic Area, Xuanwu Lake, Beiji Ge Park (Jiming Temple), Confucius Temple, and Hongshan Forest Zoo. The non-local tourist district included Zhongshan Scenic Area, Confucius Temple, Xuanwu Lake, and Presidential Palace (1912 District). These findings show that the approval rate of Beiji Ge Park (Jiming Temple) and Hongshan Forest Zoo was only high within Nanjing, while the Presidential Place (1912 District) was generally a check-in spot for non-local tourists. In terms of correlation degree, the core districts that were formed by the non-local tourist tourism flow had a higher degree of internal correlation than those that were formed by residents, although residents had a higher degree of internal correlation for the edge districts, and between the core members and edge members. This shows that the node combinations for non-local tourists were relatively stable, and their polarization was more serious. On the other hand, resident tourism routes have begun to develop in a diversified and individualized direction, with some niche scenic spots beginning to enter their horizons. In terms of spatial distribution, the core districts that were formed by non-local tourists in the tourism flow network showed a concentrated and contiguous distribution. Meanwhile, residents have just begun to break through the spatial contiguity, manifesting a spatial form of separation between the two groups. Therefore, the differences between the tourist groups should be considered when a tourism development strategy is formulated for differentiation, individualization, and diversification.

4. Discussion

This study summarized the structural characteristics of the tourism flow network of 43 scenic spots in Nanjing city from three aspects: tourism flow network connection, node centrality, and communities. A comparative analysis revealed the tourism flow net structures that were formed by resident and non-local tourist behavior. The results are presented in Table 6.
Table 6. Summary of tourism flow network structures under three context types (overall, resident and, non-local tourist).
The tourism network structure in Nanjing city exhibits the characteristics of single center (core city), core-edge differentiation, and spatial agglomeration and diffusion. Furthermore, differences exist between the resident and non-local tourist characteristics. What are the reasons for the formation of such a tourism flow network structure in Nanjing? Generally speaking, at the urban scale, traffic flow is the main carrier of tourism flow. Therefore, traffic accessibility and travel mode must be the most directly influencing factors. Nanjing’s road and rail traffic, for example, is radiated outward, from a central city layout; the density inside the core city road network is much higher than in other areas, meaning that the good traffic accessibility attracts tourists from all parts of the city. This directly caused the single center tourist flow network structure, which is located in the core city center. At the same time, due to the low accessibility of public transportation in the outer suburbs’ scenic spots, road trips have become the main means of arrival. Additionally, local residents are more qualified to use this means of travel, which results in the tourism flow network of local residents virtually covering the whole city, while non-local tourists are mostly concentrated in the inner city of the central city.
Moreover, these differences are due to the combined influence of scenic spot characteristics and tourists forming the tourism flow network structure. Tourist spot characteristics (in addition to traffic factors) concretely involve the locations of scenic spots, grade, type differences (historical-cultural, natural landscape, indoors versus outdoors), and popularity (Internet heat). Furthermore, tourist characteristics include tourist source locations (local and non-local), residence, travel time (travel season, length of commute), travel motives, knowledge of and affection for destinations, information sources, revisit rate, and travel modes.
In light of the aforementioned conclusion, this study suggests that we should grasp the characteristics of the overall structure and nodes of the Nanjing city tourism flow network, and develop the entire region in unison. Efforts could include the following: (1) bringing nodes to maturity to form core tourism subdistricts; (2) energizing developing nodes; (3) devising specialized and themed tourism routes; (4) developing individualized ways of traveling for relatively independent nodes; (5) focusing on group differences among tourists and precisely positioning the audience groups for scenic spots; (6) executing accurate publicity.
The result of this study is the network structure of tourist flow represented by people flow. Therefore, it cannot reflect all of the characteristics of spatial structure, and different conclusions may be drawn by using other data, such as information flow, logistics and traffic flow. Secondly, the research uses mobile phone signaling data as the basic data, which is less authoritative than traditional official statistics; however, the characteristics of tourism flow networks are difficult to be realized using traditional data analysis. Although the data itself, and the processing process, will produce errors, the identification results were tested to ensure the randomness of the sampling, and can reflect the overall characteristics and rules. In addition, due to the length limit, this study focused on grasping the overall structural characteristics of the tourism flow network in Nanjing city and does not elaborate on the strategies used. Future studies should discuss in-depth methods to optimize tourism flow networks.

Author Contributions

Conceptualization, Lingjin Wang; methodology, Lingjin Wang; software, Lingjin Wang and Yan He; validation, Lingjin Wang and Xiao Wu; formal analysis, Lingjin Wang; investigation, Lingjin Wang; resources, Lingjin Wang; data curation, Yan He; writing—original draft preparation, Lingjin Wang; writing—review and editing, Lingjin Wang; visualization, Lingjin Wang; supervision, Xiao Wu; project administration, Xiao Wu; funding acquisition, Xiao Wu. All authors have read and agreed to the published version of the manuscript.

Funding

This research was funded by the National Natural Science Foundation of China(51878142), National Key Research and Development Program of China(2019YFD1100800), Postgraduate Research&Practice Innovation Program of Jiangsu Province(KYCX20_0143) and the Fundamental Research Funds for the Central Universities(3207032101D).

Data Availability Statement

Restrictions apply to the availability of these data. Data were obtained from China Mobile Communications Group Co., Ltd., and are available from Lingjin Wang, with the permission of China Mobile Communications Group Co., Ltd.

Conflicts of Interest

The authors declare no conflict of interest.

References

  1. Castells, M. Rise of the Network Society; Blackwell Publishers: Oxford, UK, 1996. [Google Scholar]
  2. Feng, Z. Tourism and transport: Modes, networks and flows. Tour. Geogr. 2010, 12, 579–582. [Google Scholar] [CrossRef]
  3. Zhang, J.; Jensen, C. Comparative advantage—Explaining tourism flows. Ann. Tour. Res. 2007, 34, 223–243. [Google Scholar] [CrossRef]
  4. Hills, L.; Lundgren, J. The impact of tourism in the Caribbean: A methodological study. Ann. Tour. Res. 1977, 5, 248–267. [Google Scholar] [CrossRef]
  5. Lundgren, J. Geographic concepts and the development of tourism research in Canada. Geo J. 1984, 9, 17–25. [Google Scholar] [CrossRef]
  6. Prideaux, B. Factors affecting bilateral tourism flows. Ann. Tour. Res. 2005, 32, 780–801. [Google Scholar] [CrossRef]
  7. Jensen, C.; Zhang, J. Trade in tourism services: Explaining tourism trade and the impact of the general agreement on trade in services on the gains from trade. J. Int. Trade Econ. Dev. 2013, 22, 398–429. [Google Scholar] [CrossRef]
  8. Santeramo, F.G.; Morelli, M. Modelling tourism flows through gravity models: A quantile regression approach. Curr. Issues Tour. 2015, 19, 1077–1083. [Google Scholar] [CrossRef]
  9. Sharipov, S.; Demirkol, H.G. Analysing the flow pattern in the tourism city of eskisehir. Int. J. Tour. Cities 2018, 4, 342–354. [Google Scholar] [CrossRef]
  10. Ding, Z. A Research on the Space-Time Evolution of the Domestic Tourist Flow in Nanjing. Tour. Trib. 2004, 2, 37–40. [Google Scholar]
  11. Zhang, Y.; Ma, Y.; Ma, H.; Gu, J. Research on the Transition of the Equilibrium Point of Inbound Agglomeration and Diffusion Tourism Flow in Beijing. Tour. Trib. 2009, 24, 31–35. [Google Scholar]
  12. Hong, T.; Ma, T.; Huan, T.-C. Network behavior as driving forces for tourism flows. J. Bus. Res. 2015, 68, 146–156. [Google Scholar] [CrossRef]
  13. Qiu, Y.; Ge, P.; Ren, P. An Empirical Study on Cluster Distributaries of the Initial State of Jiuzhaigou. Resour. Sci. 2010, 32, 118–123. [Google Scholar]
  14. Jin, Z. An Analysis of Optimization Effects of the Changes in Product Spatial Structure of Tourist Flow—A Case Study on Hangzhou. Tour. Trib. 2006, 7, 42–47. [Google Scholar]
  15. Jin, C.; Cheng, J.; Xu, J. Using User-Generated Content to Explore the Temporal Heterogeneity in Tourist Mobility. J. Travel Res. 2018, 57, 779–791. [Google Scholar] [CrossRef]
  16. Liu, Z.; Li, H.; Shi, C.; Wang, X.; Zhang, H. Response of Temporal Distribution of Short-term Tourist Flows to Regional Tourism Spatial Structure—A Case Study of Golden Week Tourist Flows in Yunnan Province. Acta Geogr. Sin. 2010, 65, 1624–1632. [Google Scholar] [CrossRef]
  17. Liu, F.; Zhang, J.; Zhang, J.; Chen, D.; Liu, Z.; Lu, S. Roles and functions of tourism destinations in tourism region of south anhui: A tourist flow network perspective. Chin. Geogr. Sci. 2012, 22, 755–764. [Google Scholar] [CrossRef]
  18. Wang, Z.; Liu, Q.; Xu, J.; Fujiki, Y. Evolution characteristics of the spatial network structure of tourism efficiency in china: A province-level analysis. J. Destin. Mark. Manag. 2020, 18, 100509. [Google Scholar] [CrossRef]
  19. Li, A.; Mou, N.; Zhang, L.; Yang, T.; Liu, W.; Liu, F. Tourism Flow Between Major Cities during China’s National Day Holiday: A Social Network Analysis Using Weibo Check-in Data. IEEE Access 2020, 8, 225675–225691. [Google Scholar] [CrossRef]
  20. Sun, Y.; Shao, Y.; Chan, E. Co-visitation network in tourism-driven peri-urban area based on social media analytics: A case study in Shenzhen, China. Landsc. Urban Plan. 2020, 204, 103934. [Google Scholar] [CrossRef]
  21. Chen, Y.; Chen, R.; Hou, J.; Hou, M.; Xie, X. Research on users’ participation mechanisms in virtual tourism communities by bayesian network. Knowl.-Based Syst. 2021, 226, 107161. [Google Scholar] [CrossRef]
  22. Heinz, E. Social Structures: A Network Approach; Cambridge University Press: New York, NY, USA, 1989. [Google Scholar]
  23. Hu, M.; Qiu, R.T.R.; Wu, D.C.; Song, H. Hierarchical pattern recognition for tourism demand forecasting. Tour. Manag. 2021, 84, 104263. [Google Scholar] [CrossRef]
  24. Chen, S.; Wang, X.; Zhang, H.; Wang, J.; Peng, J. Customer purchase forecasting for online tourism: A data-driven method with multiplex behavior data. Tour. Manag. 2021, 87, 104357. [Google Scholar] [CrossRef]
  25. Nistor, M.M.; Nicula, A.-S.; Dezsi, S.; Petrea, D.; Kamarajugedda, S.A.; Carebia, I.A. Gis-based kernel analysis for tourism flow mapping. J. Settl. Spat. Plan. 2020, 11, 137–145. [Google Scholar] [CrossRef]
  26. Li, T.; Li, Q.; Liu, J. The spatial mobility of rural tourism workforce: A case study from the micro analytical perspective. Habitat Int. 2021, 110, 102322. [Google Scholar] [CrossRef]
  27. Oender, I.; Koerbitz, W.; Hubmann-Haidvogel, A. Tracing tourists by their digital footprints: The case of Austria. J. Travel Res. 2016, 55, 566–573. [Google Scholar] [CrossRef]
  28. Comito, C. NexT: A framework for next-place prediction on location based social networks. Knowl.-Based Syst. 2020, 204, 106205. [Google Scholar] [CrossRef]
  29. Shakeri, E.; Far, B.H. Exploring the requirements of pandemic awareness systems: A case study of COVID-19 using social media data. In Proceedings of the 35th IEEE/ACM International Conference on Automated Software Engineering Workshops, Association for Computing Machinery, Virtual Event, Australia, 21–25 December 2020; pp. 33–40. [Google Scholar]
  30. Nurbakova, D.; Ermakova, L.; Ovchinnikova, I. In Understanding the Personality of Contributors to Information Cascades in Social Media in Response to the COVID-19 Pandemic. In Proceedings of the 2020 International Conference on Data Mining Workshops (ICDMW), Sorrento, Italy, 17–20 November 2020; pp. 45–52. [Google Scholar]
  31. Qian, C.; Li, W.; Duan, Z.; Yang, D.; Ran, B. Using mobile phone data to determine spatial correlations between tourism facilities. J. Transp. Geogr. 2021, 92, 103018. [Google Scholar] [CrossRef]
  32. Hanneman, R.; Riddle, M. Introduction to Social Network Methods; University of California: Los Angeles, CA, USA, 2005. [Google Scholar]
Publisher’s Note: MDPI stays neutral with regard to jurisdictional claims in published maps and institutional affiliations.

Article Metrics

Citations

Article Access Statistics

Multiple requests from the same IP address are counted as one view.