
Crowd-Sourced City Images: Decoding Multidimensional Interaction between Imagery Elements with Volunteered Photos


Abstract
:1. Introduction
2. Background
2.1. Previous Studies on City Image
2.2. Related Works on Geotagged Photos
3. Methodology and Data
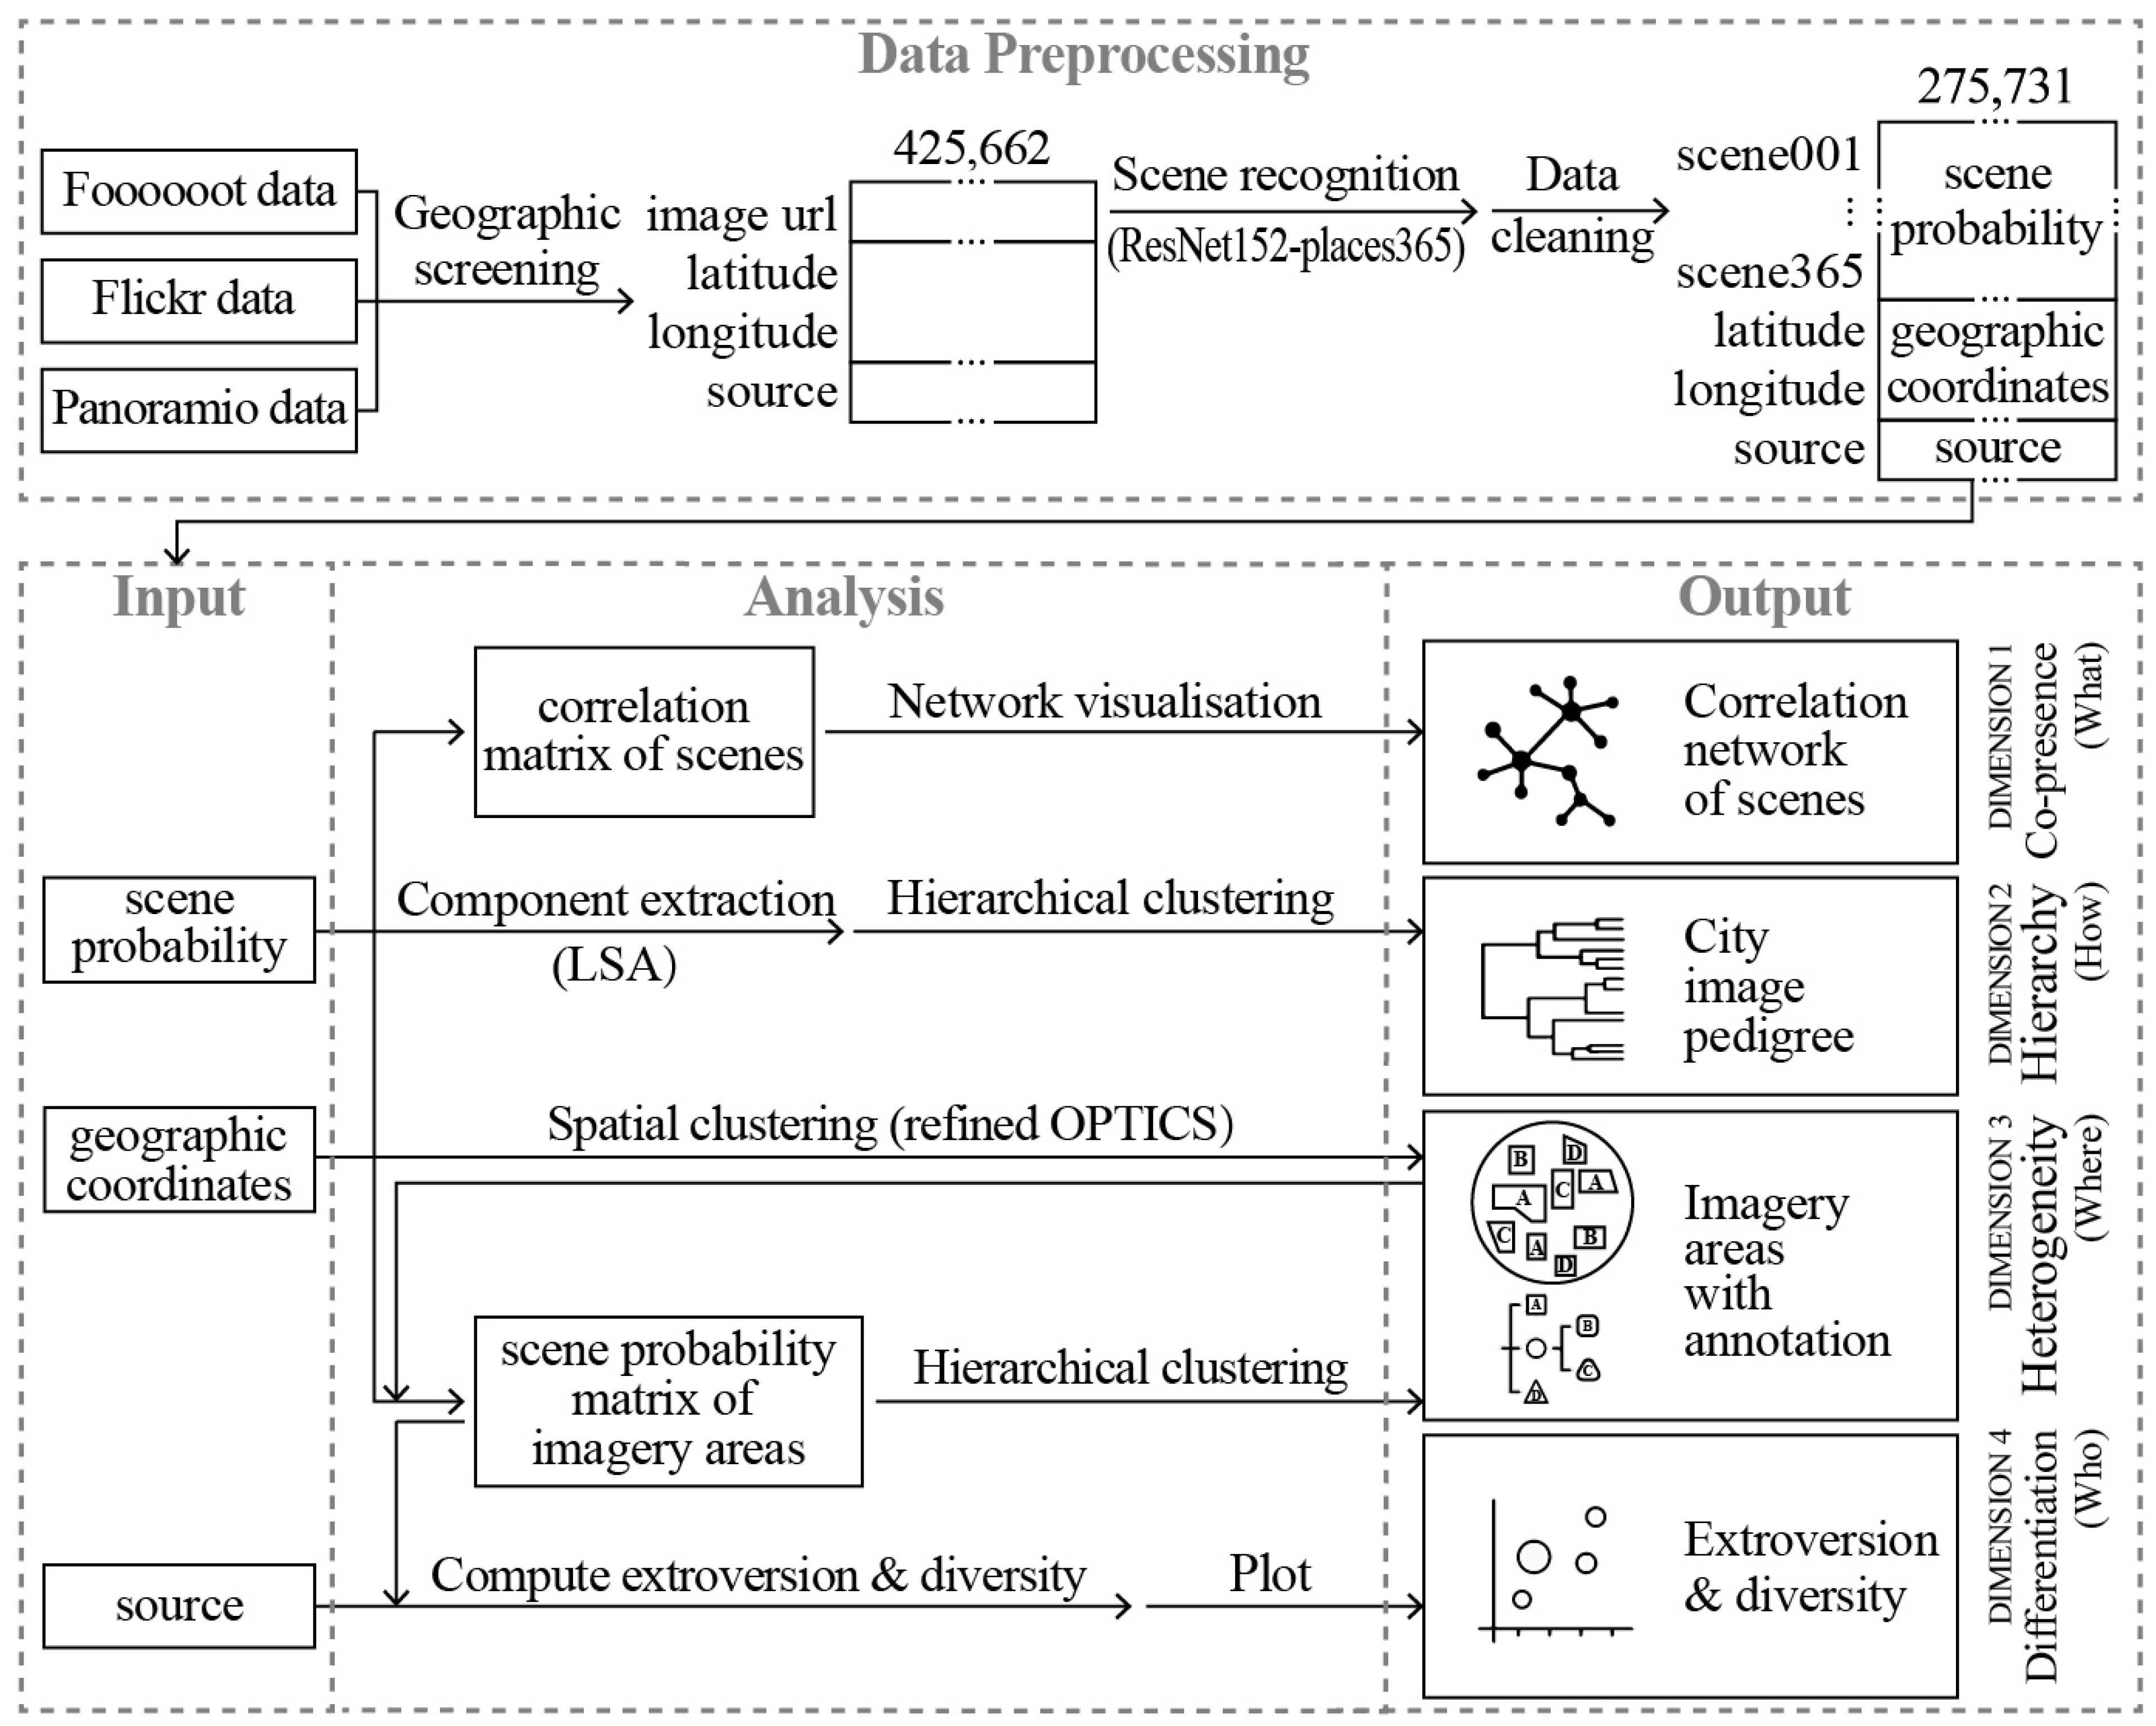
3.1. Framework
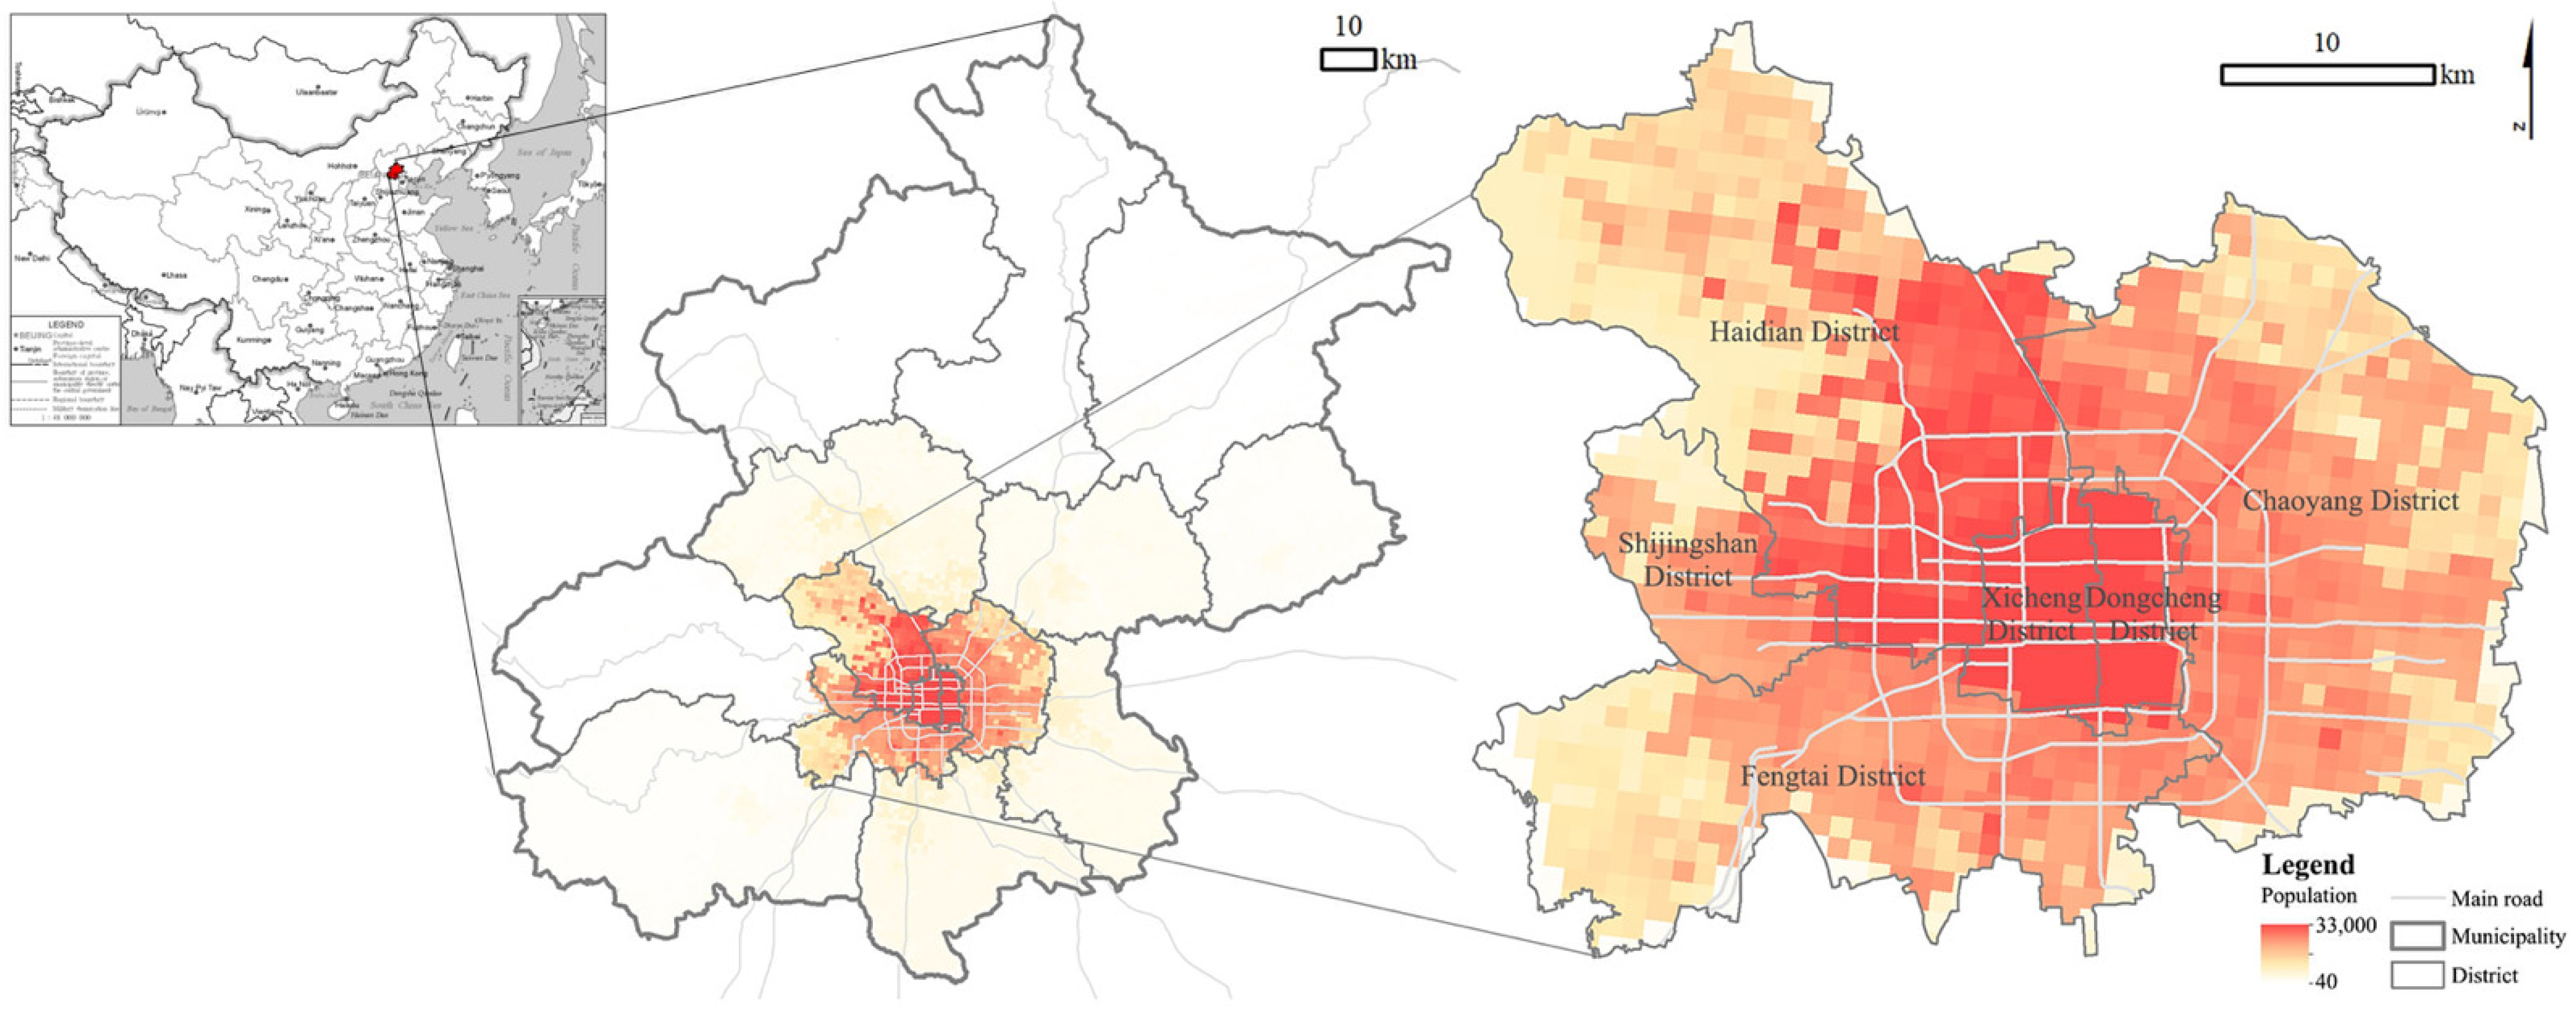
3.2. Study Area
3.3. Data
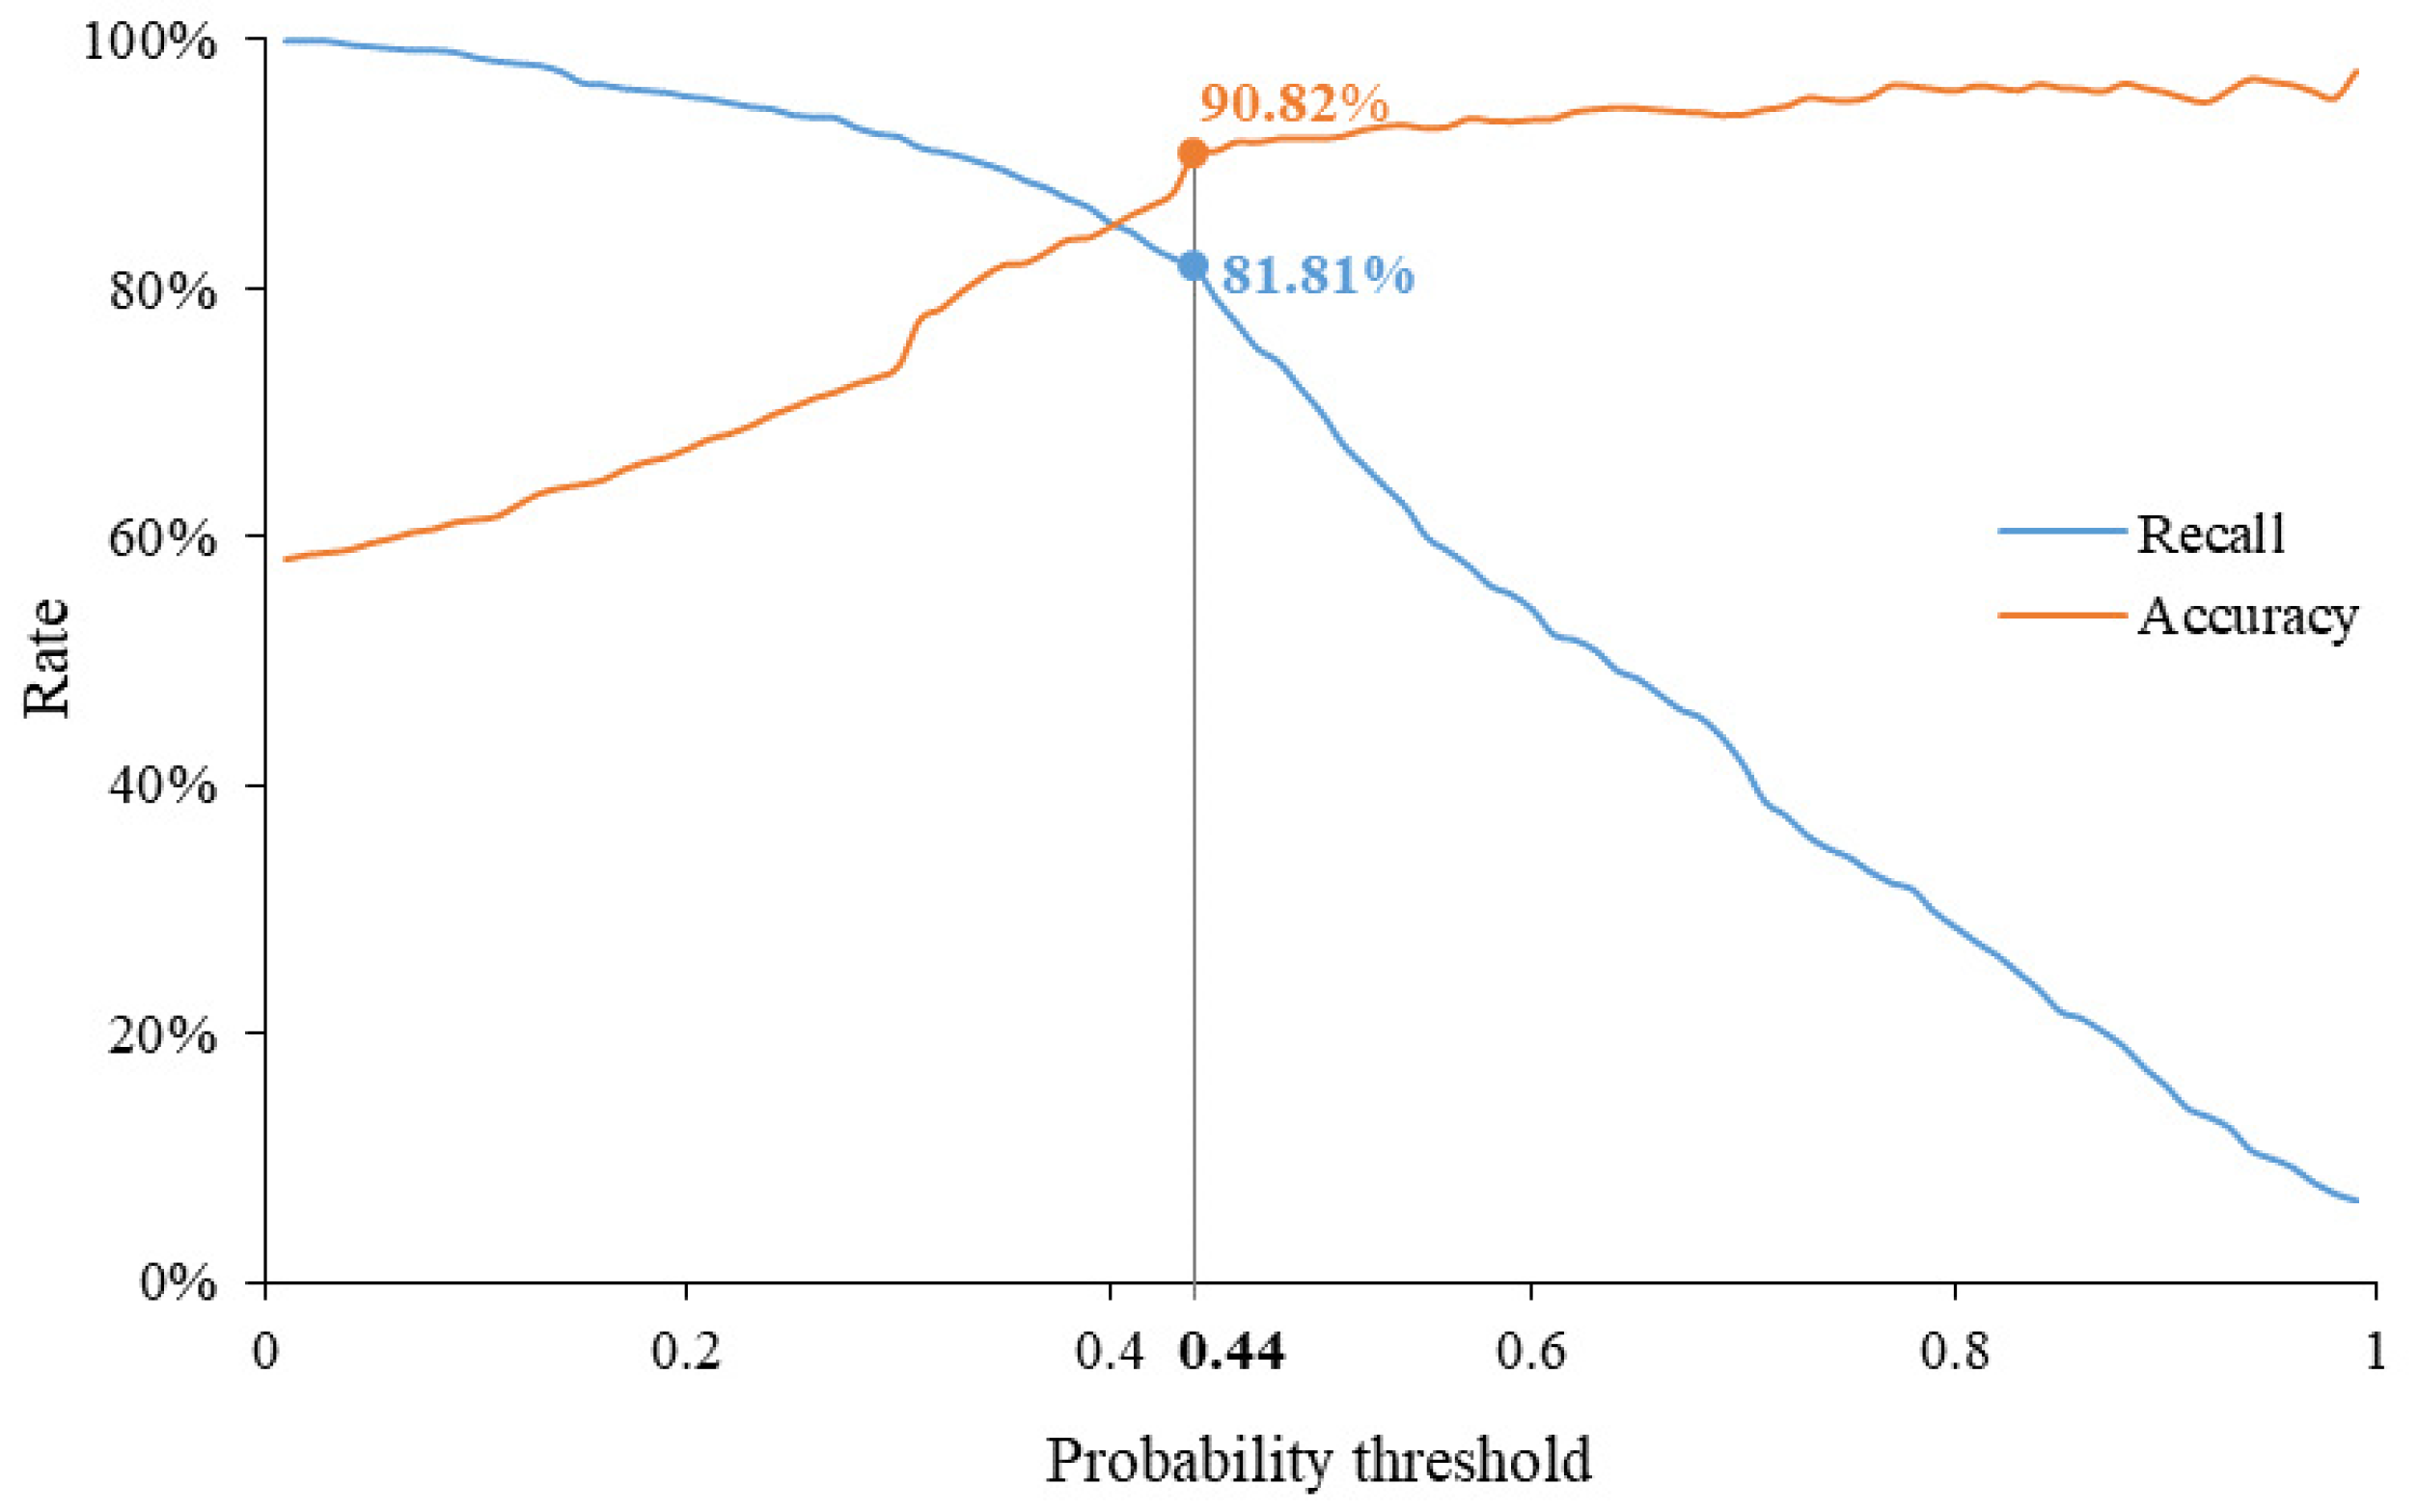
3.4. Setting and Evaluation
4. Results
4.1. Co-Presence between Imagery Elements: Interdependent Elements
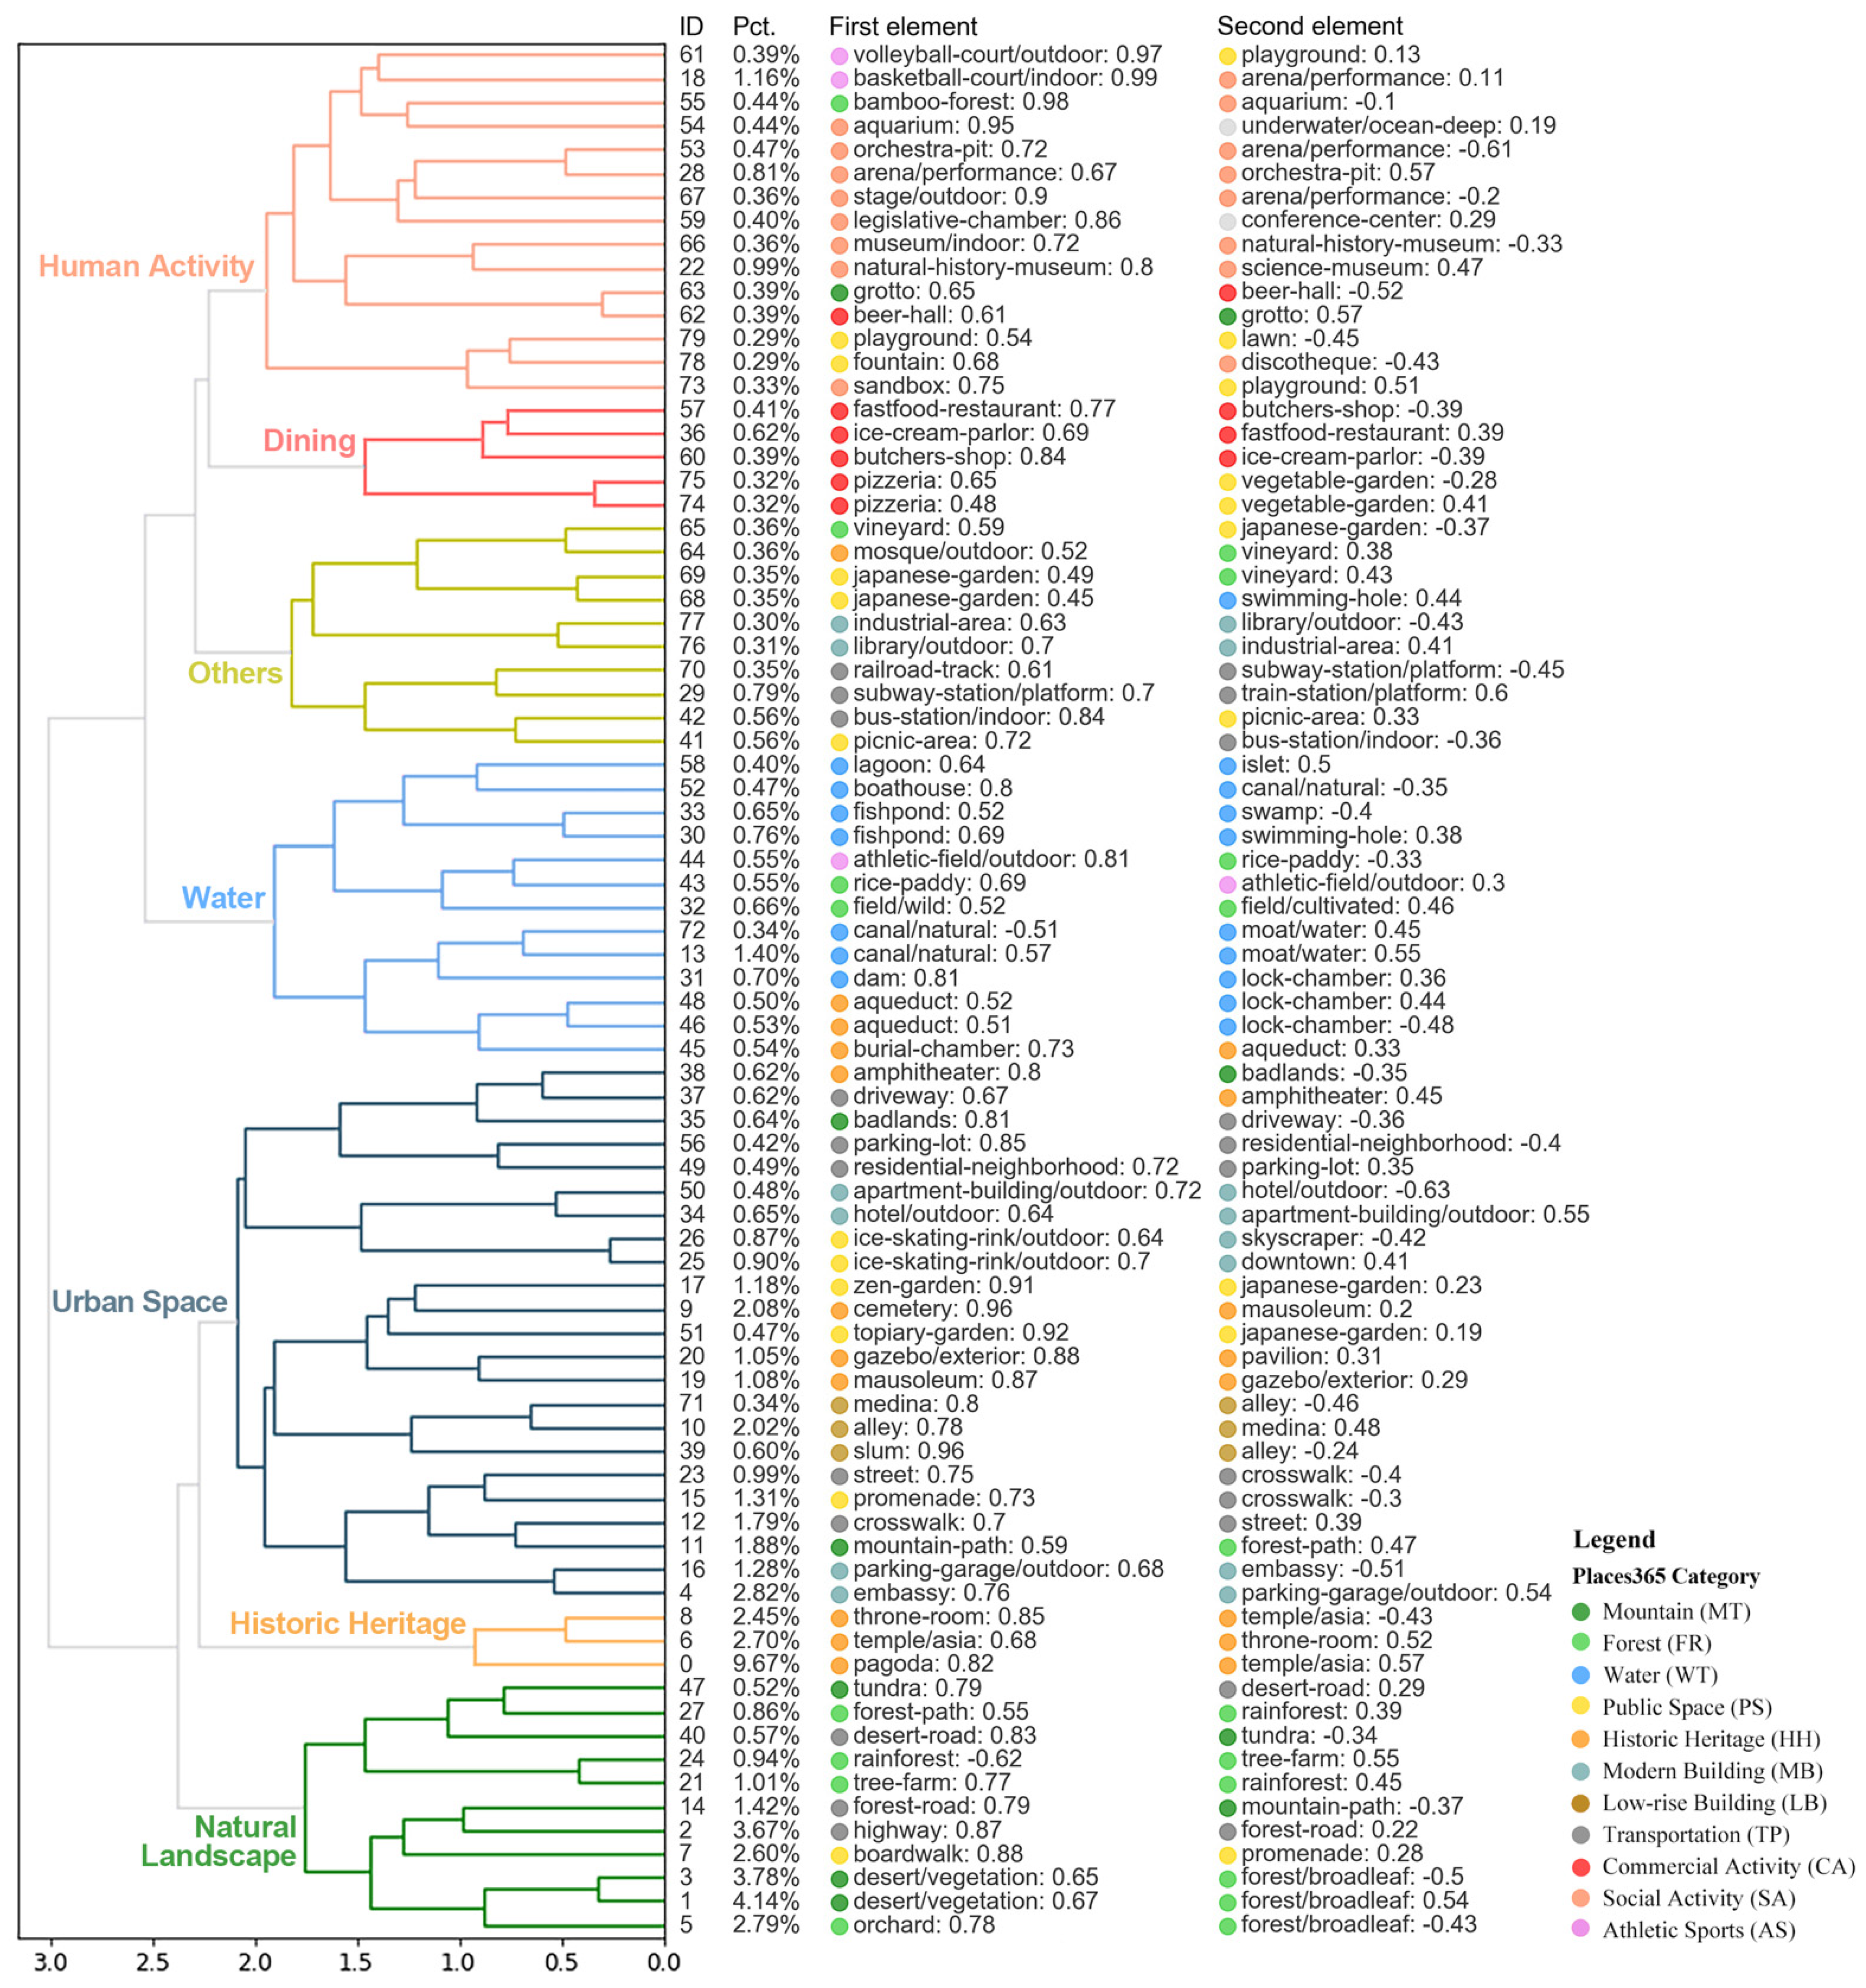
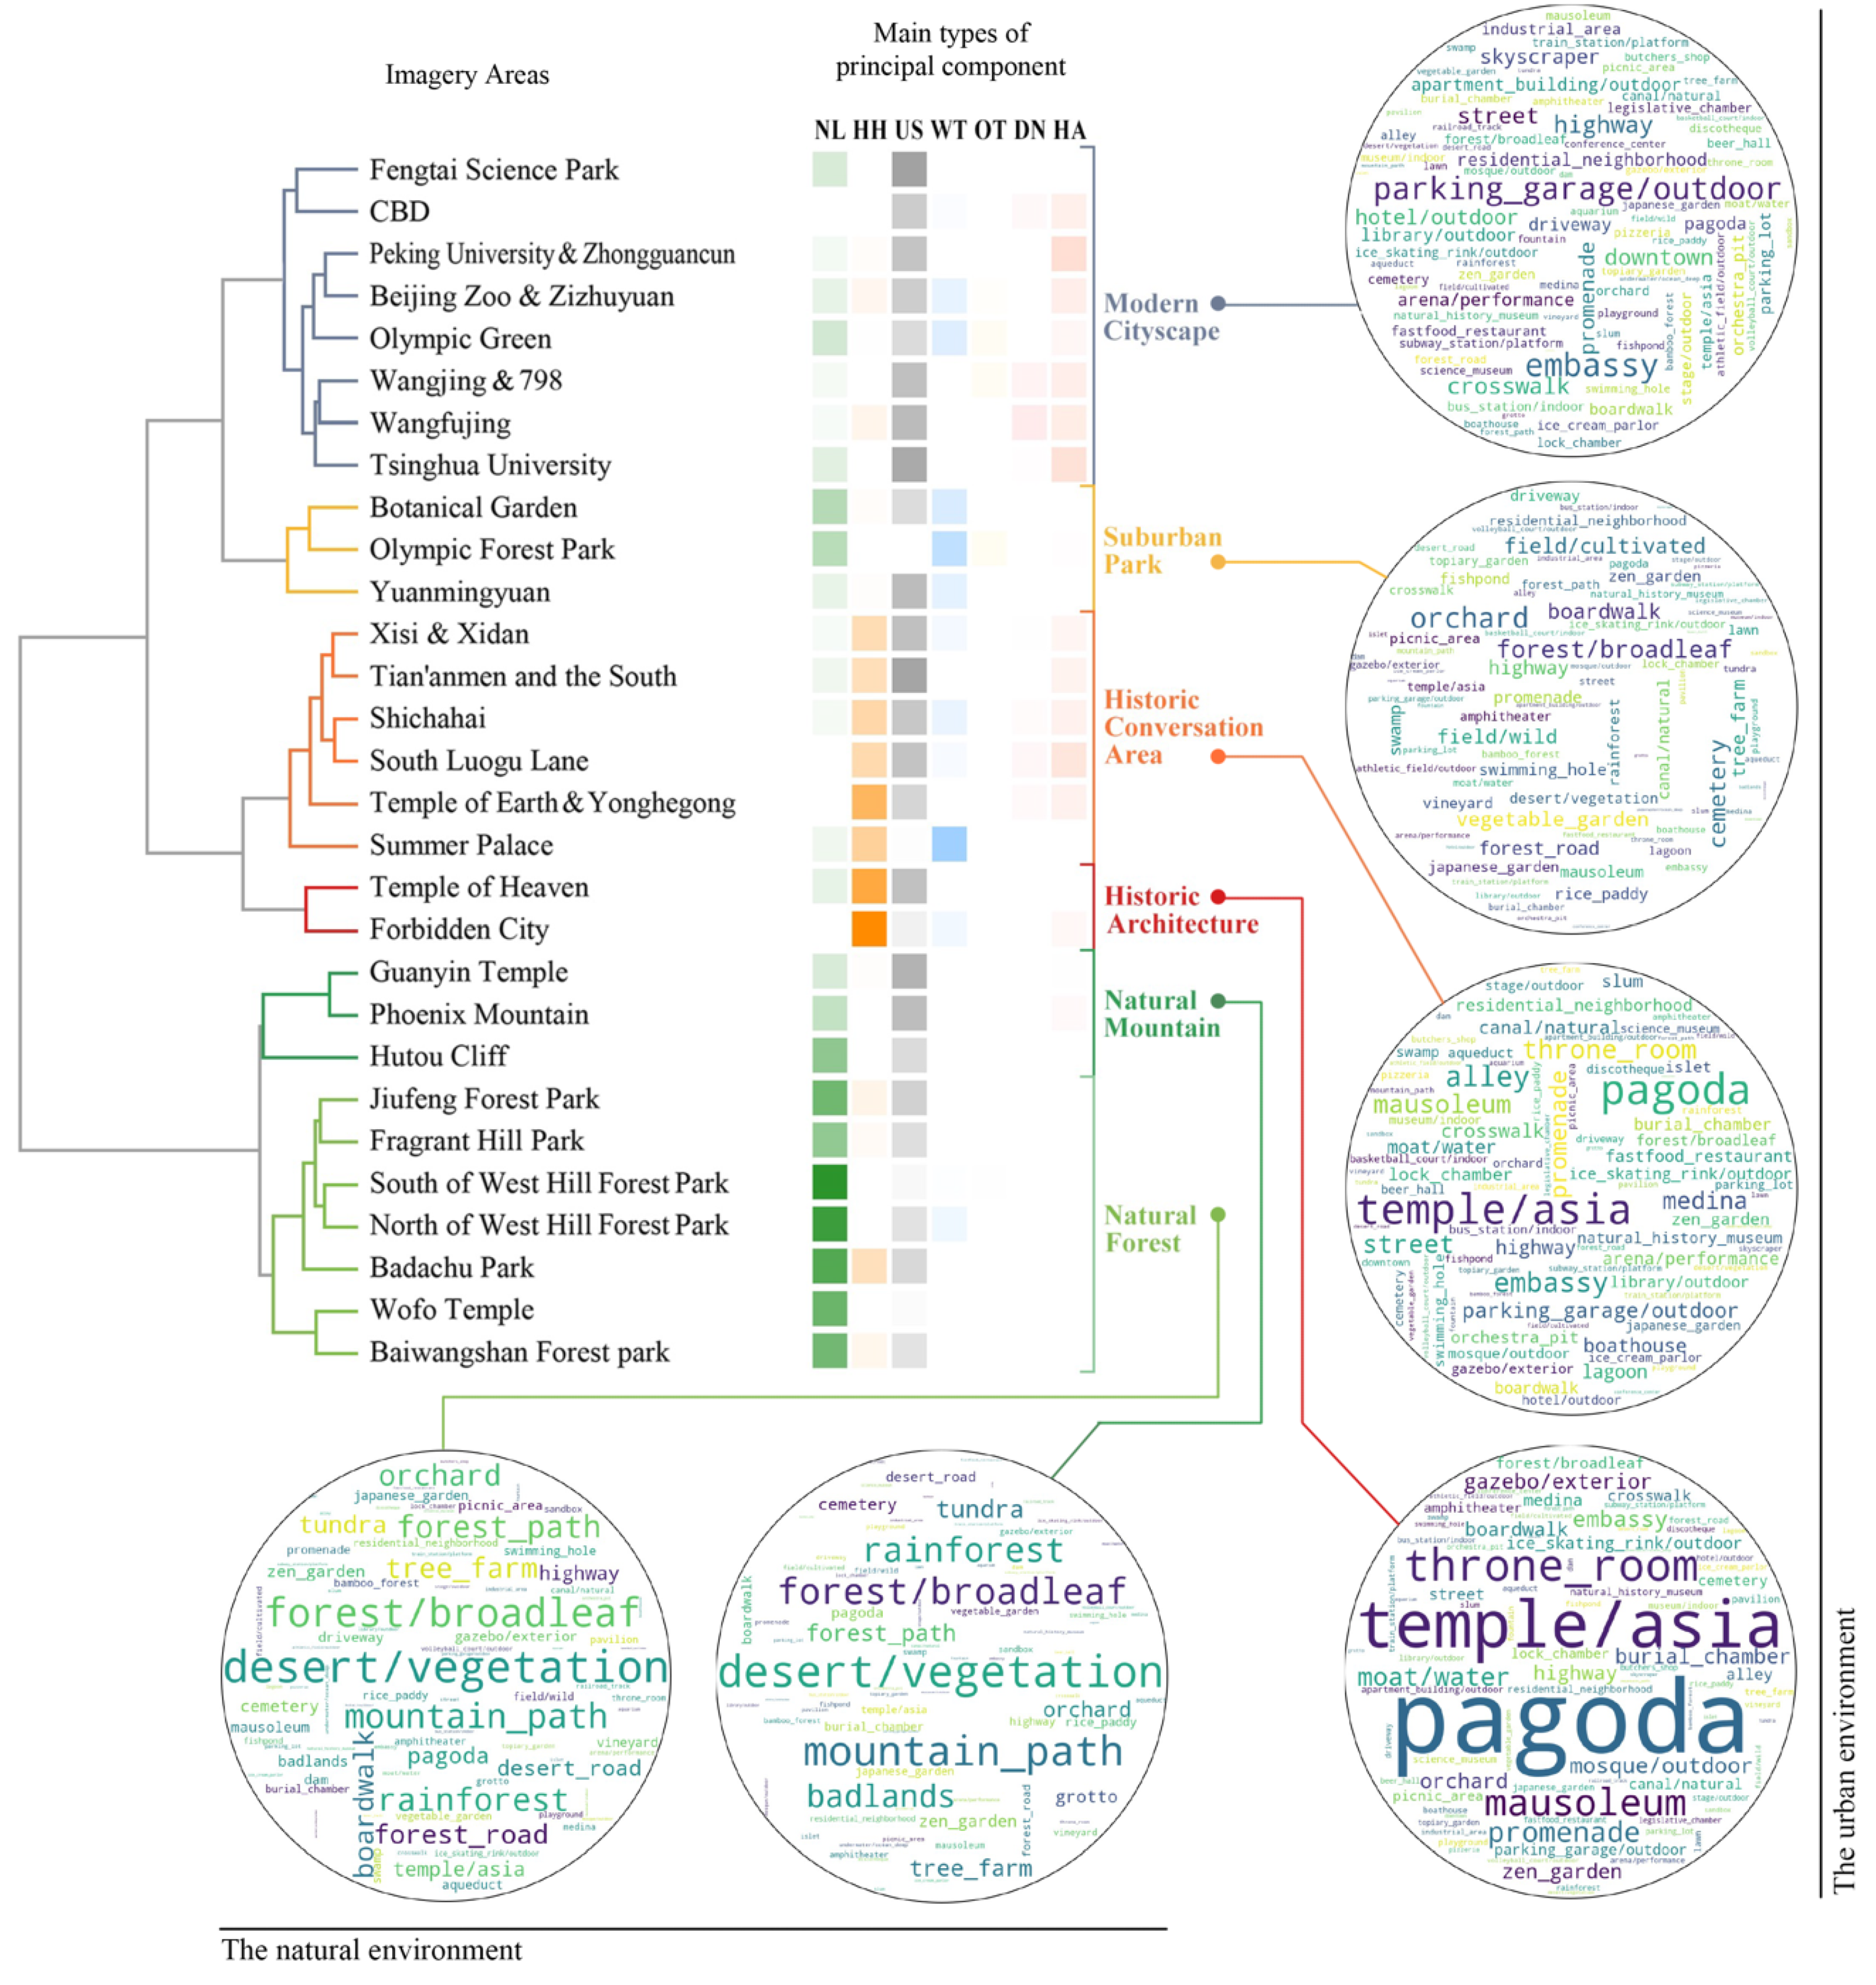
4.2. Hierarchy of Imagery Elements: Principal Components and Main Typologies
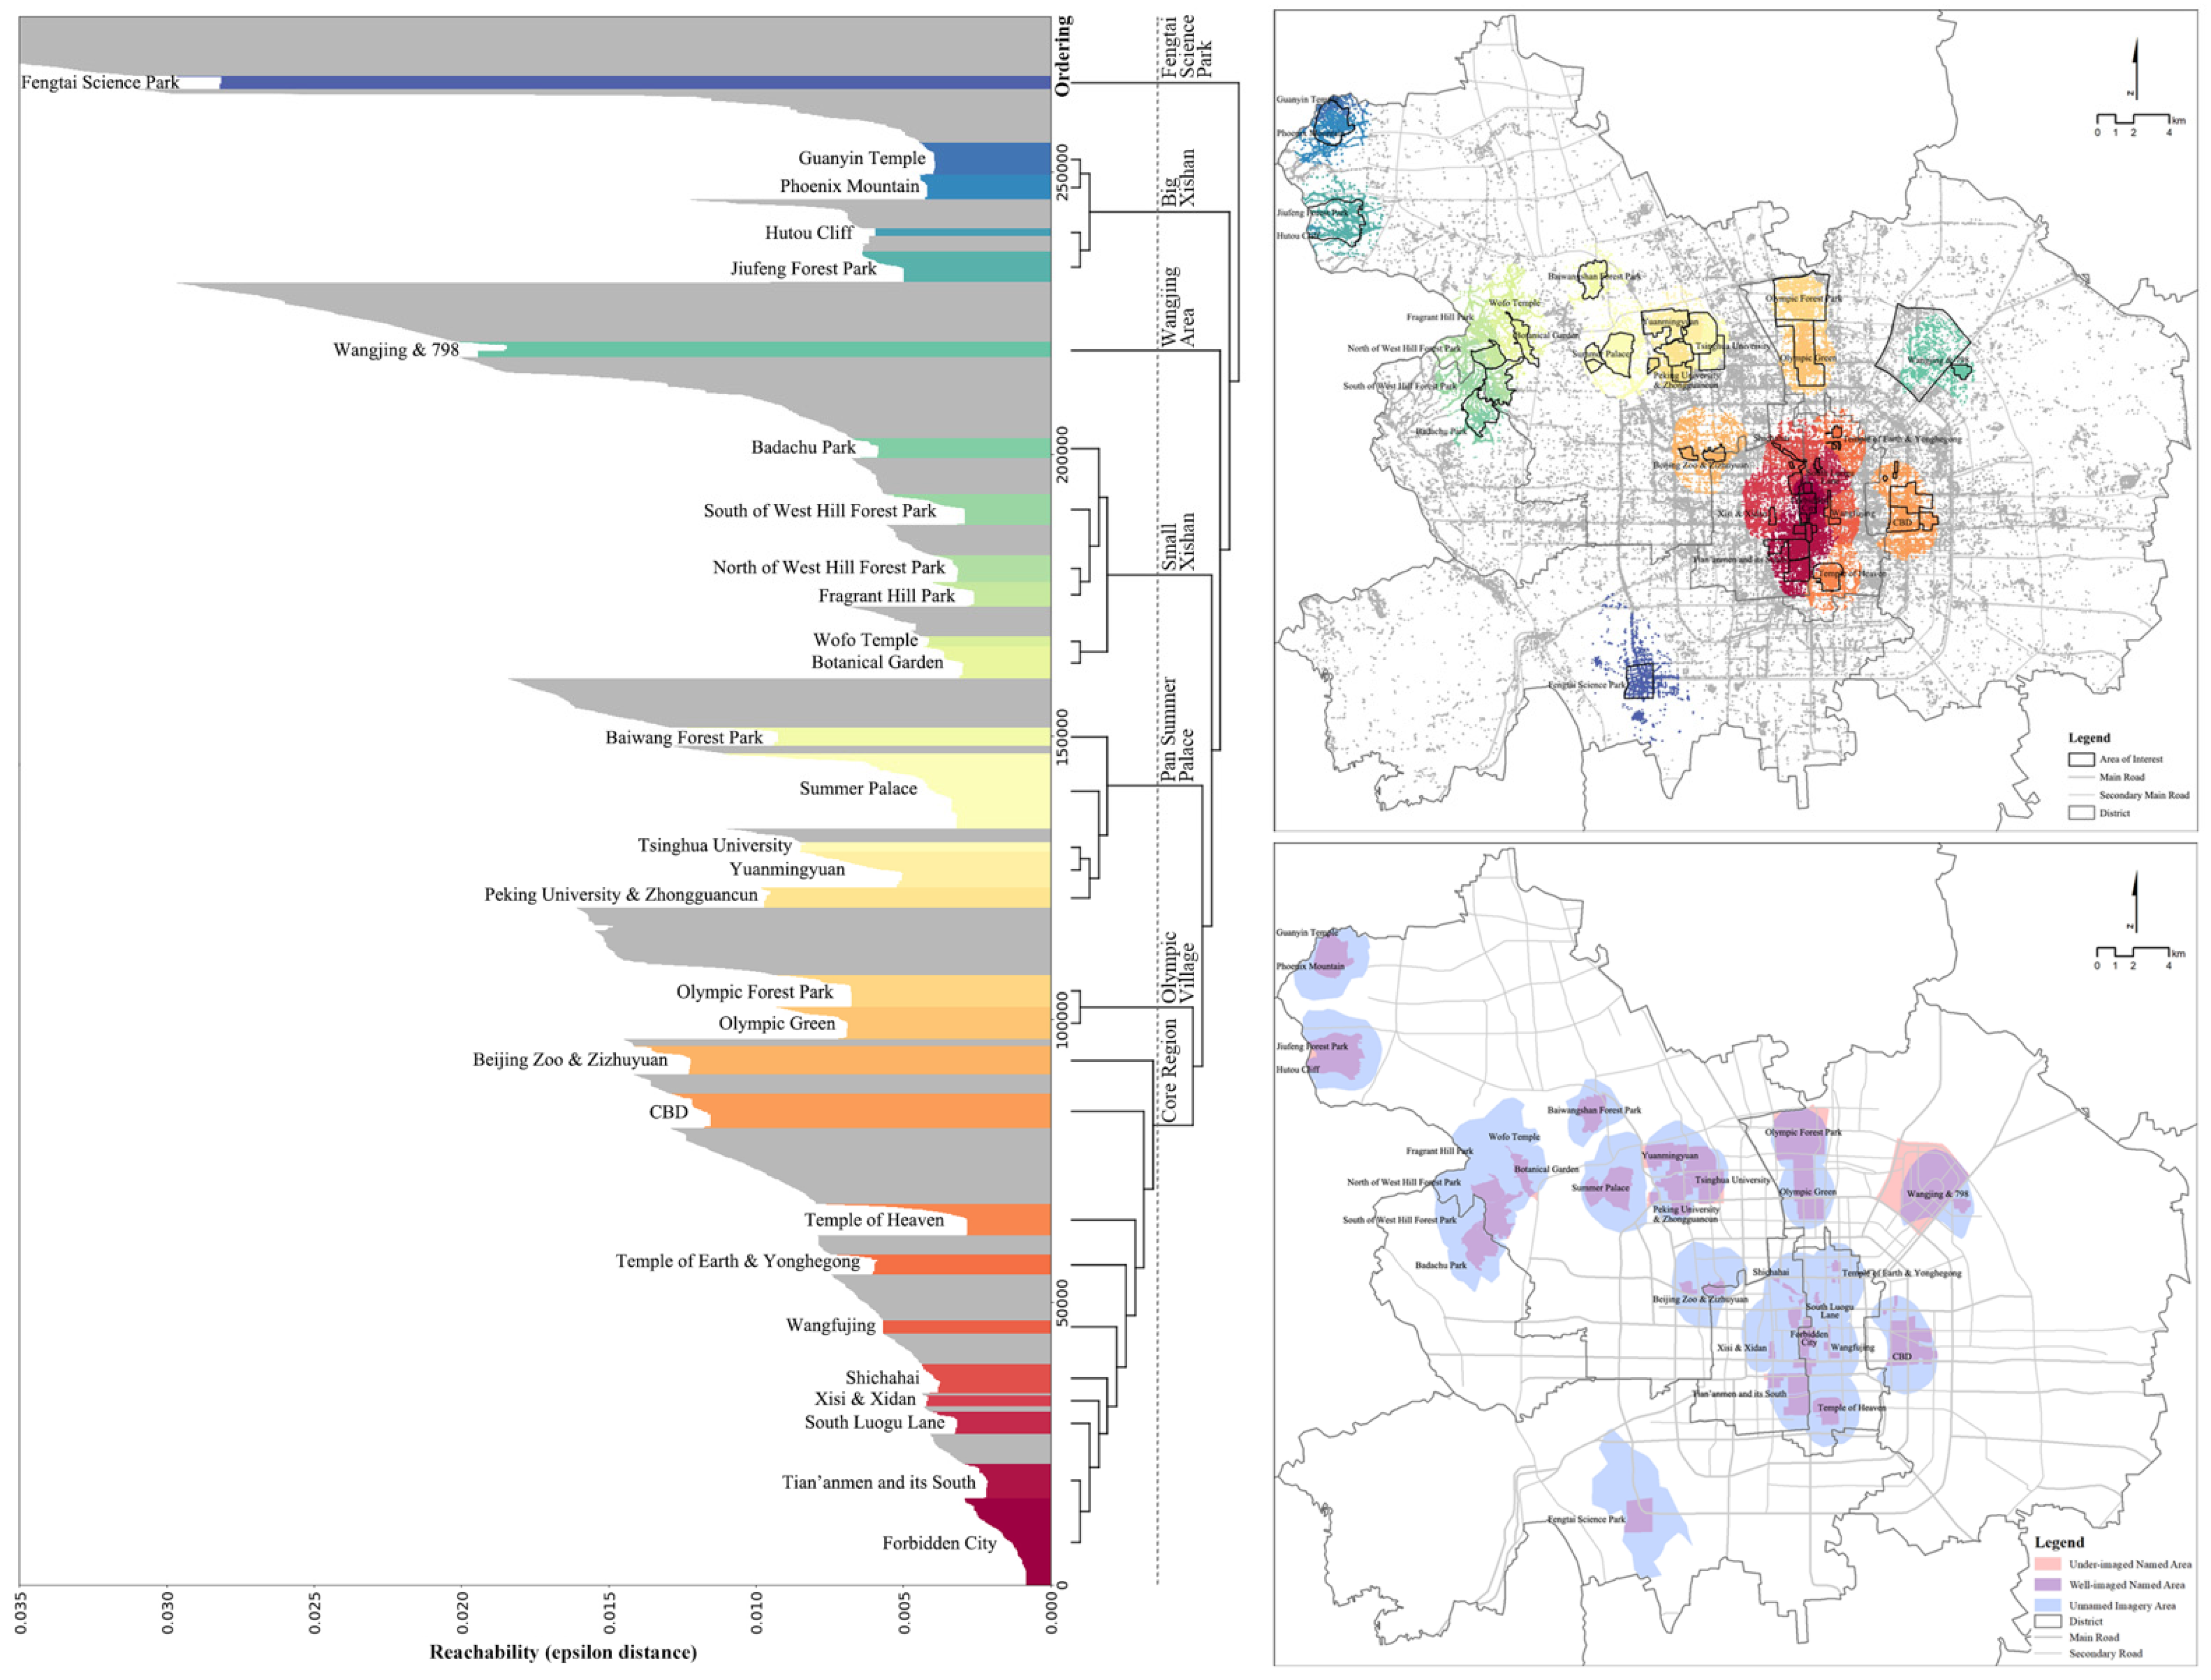
4.3. Heterogeneity of Imagery Elements across Space: Imagery Areas
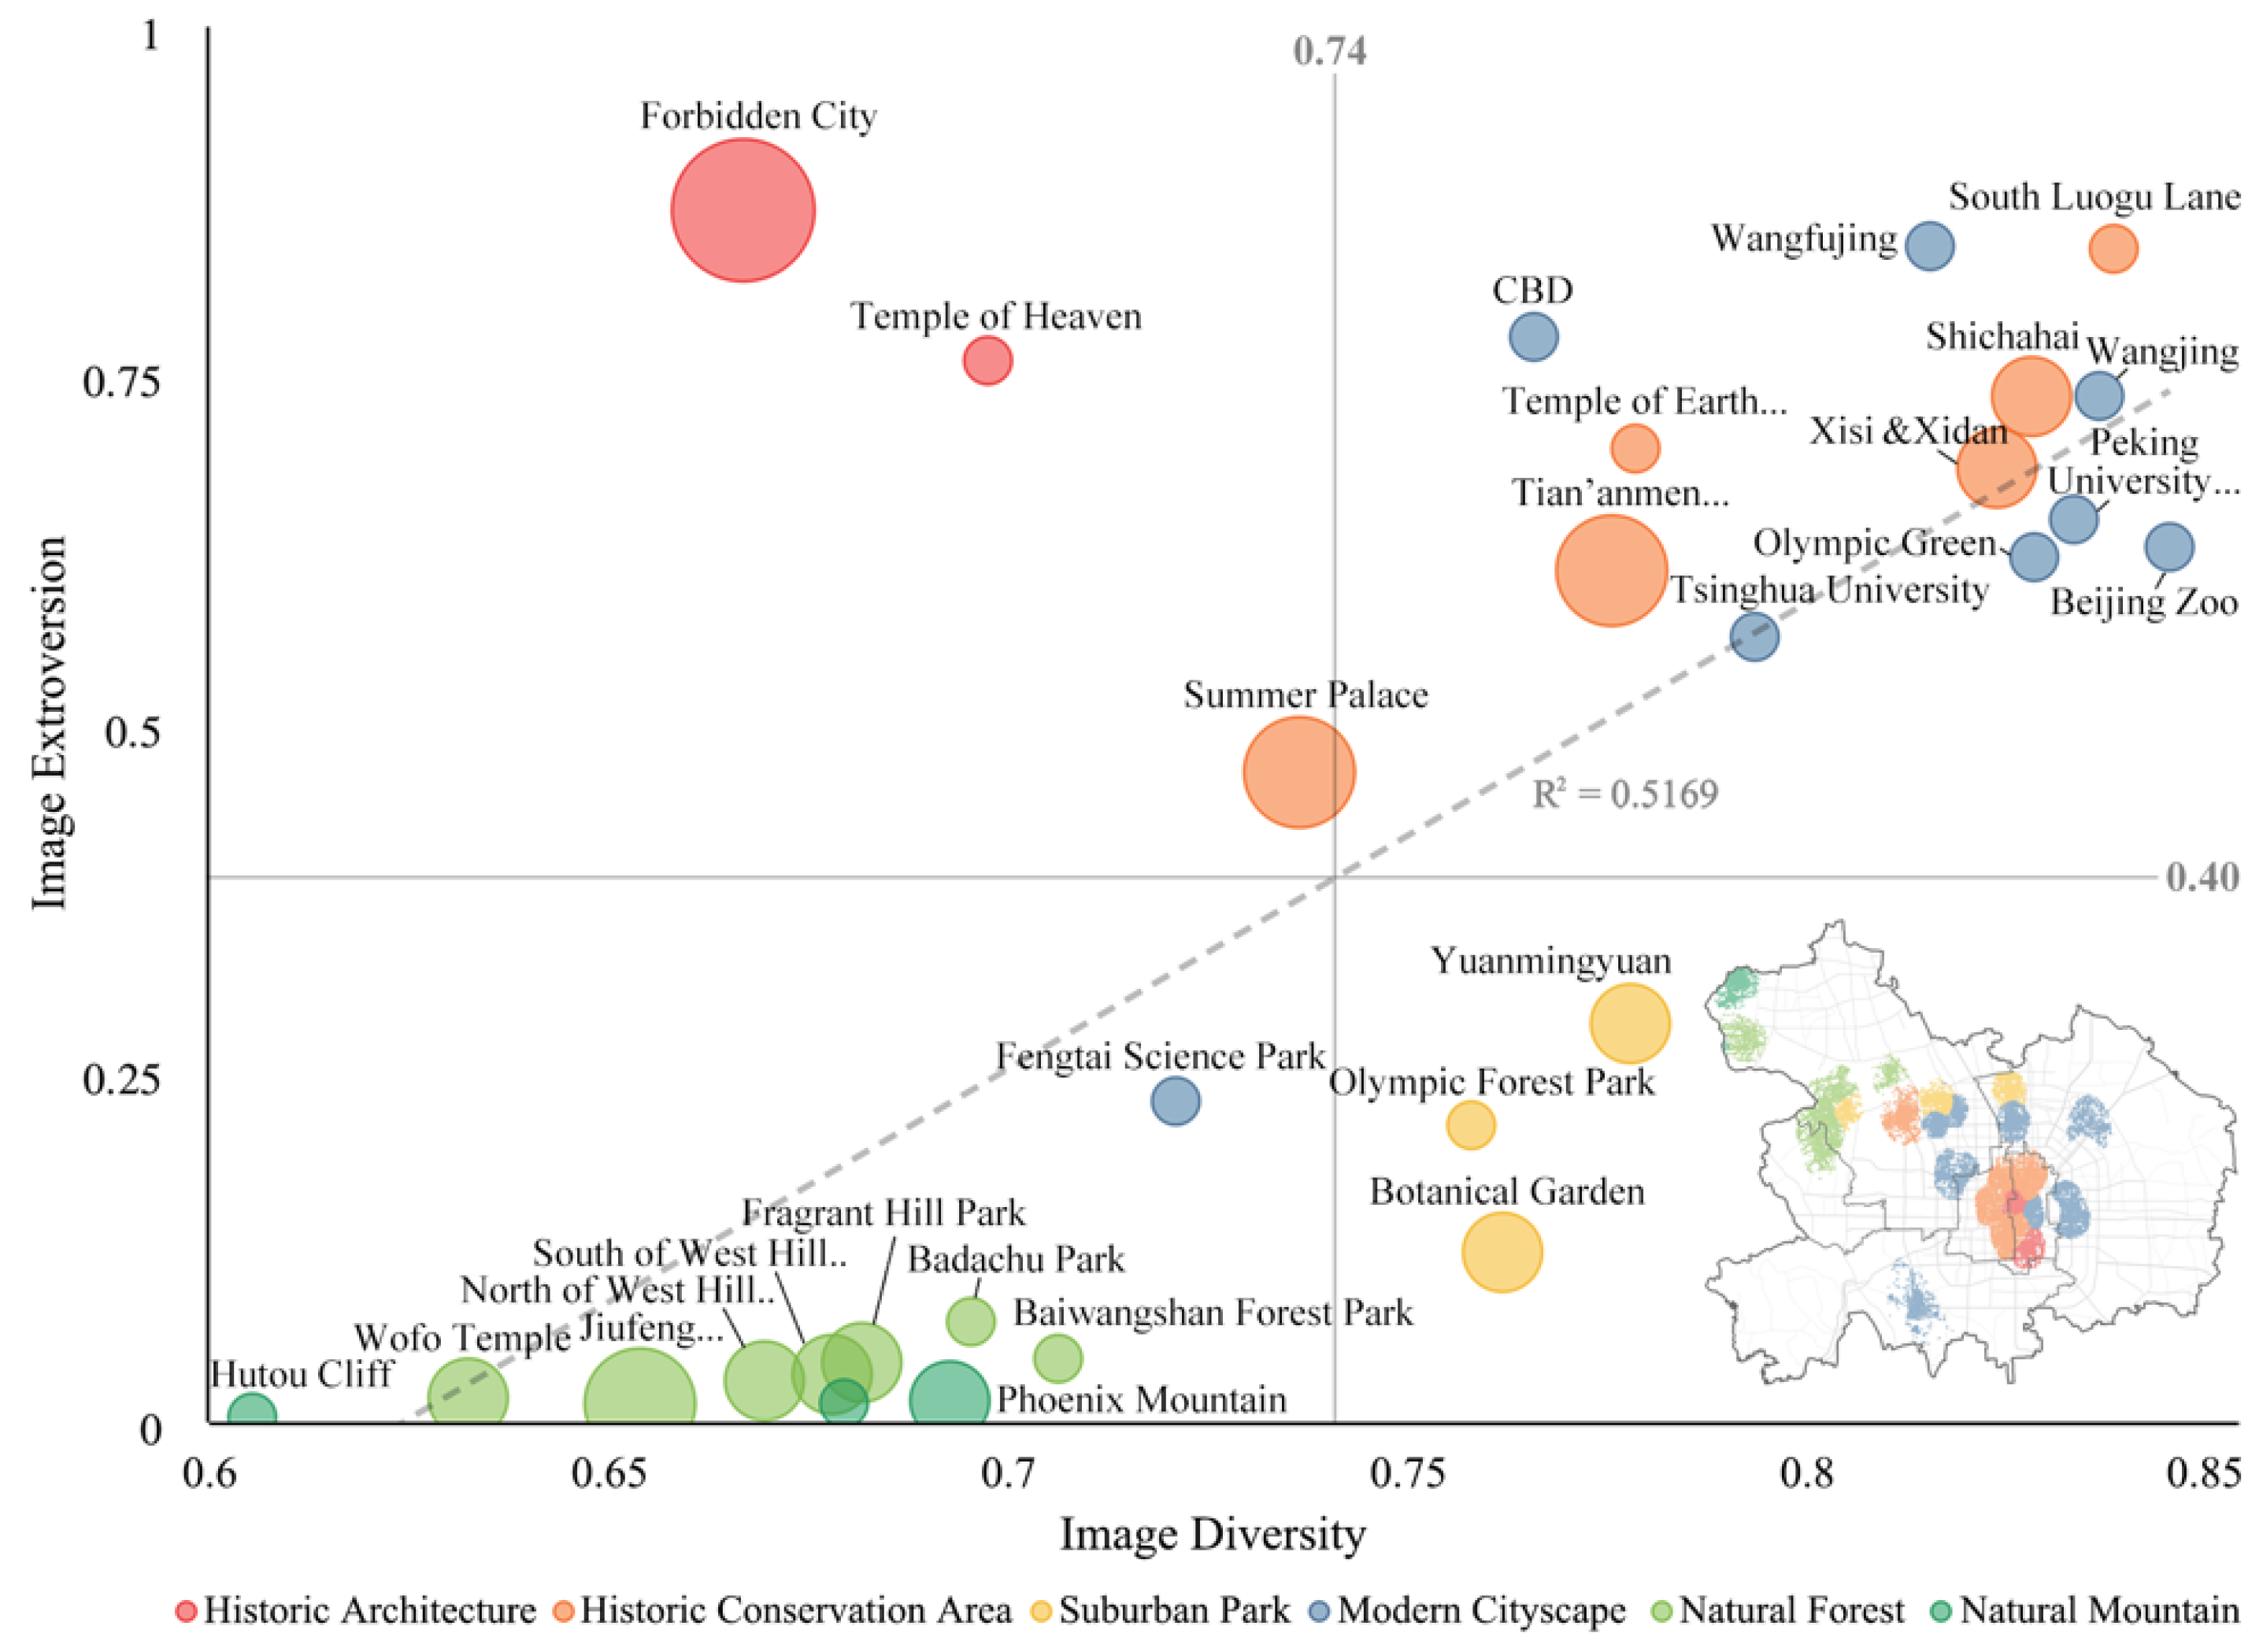
4.4. Differentiation of Imagery Elements across Groups: Diversity and Extroversion
5. Conclusions and Discussion
Author Contributions
Funding
Institutional Review Board Statement
Informed Consent Statement
Conflicts of Interest
References
- Lynch, K. The Image of the City; The MIT Press: Cambridge, MA, USA, 1960. [Google Scholar]
- Kennedy, L.; Naaman, M.; Ahern, S.; Nair, R.; Rattenbury, T. How flickr helps us make sense of the world: Context and content in community-contributed media collections. In Proceedings of the 15th international conference on Multimedia (MULTIMEDIA’07), Augsburg, Germany, 24–27 September 2007; Lienhart, R., Prasad, A.R., Hanjalic, A., Choi, S., Bailey, B.P., Sebe, N., Eds.; ACM: New York, NY, USA, 2007; pp. 631–640. [Google Scholar]
- Liu, L.; Zhou, B.; Zhao, J.; Ryan, B. C-IMAGE: City cognitive mapping through geo-tagged photos. GeoJournal 2016, 81, 817–861. [Google Scholar] [CrossRef] [Green Version]
- I Agustí, D.P. Characterizing the location of tourist images in cities. Differences in user-generated images (Instagram), official tourist brochures and travel guides. Ann. Tour. Res. 2018, 73, 103–115. [Google Scholar] [CrossRef]
- Mobasheri, A. (Ed.) Open Source Geospatial Science for Urban Studies: The Value of Open Geospatial Data; Springer Nature: Berlin/Heidelberg, Germany, 2020. [Google Scholar]
- Appleyard, D. Styles and Methods of Structuring a City. Environ. Behav. 1970, 2, 100–117. [Google Scholar] [CrossRef]
- Morello, E.; Ratti, C. A digital image of the city: 3D isovists in Lynch’s urban analysis. Environ. Plan. B Plan. Des. 2009, 36, 837–853. [Google Scholar] [CrossRef] [Green Version]
- Nasar, J.L. The Evaluative Image of the City. J. Am. Plan. Assoc. 1990, 56, 41–53. [Google Scholar] [CrossRef]
- Hospers, G.-J. Lynch’s The Image of the City after 50 Years: City Marketing Lessons from an Urban Planning Classic. Eur. Plan. Stud. 2010, 18, 2073–2081. [Google Scholar] [CrossRef]
- Pearce, P.L.; Fagence, M. The legacy of Kevin Lynch: Research implications. Ann. Tour. Res. 1996, 23, 576–598. [Google Scholar] [CrossRef]
- Lynch, K. Reconsidering the image of the city. In City Sense and City Design: Writings and Projects of Kevin Lynch; Banerjee, T., Southworth, M., Eds.; The MIT Press: Cambridge, MA, USA, 1985; pp. 247–256. [Google Scholar]
- Francescato, D.; Mebane, W. How citizens view two great cities: Milan and Rome. In Image and Environment: Cognitive Mapping and Spatial Behavior; Downs, R., Stea, D., Eds.; Edward Arnold: London, UK, 1973; pp. 182–220. [Google Scholar]
- Deng, N.; Liu, J.; Dai, Y.; Li, H. Different cultures, different photos: A comparison of Shanghai’s pictorial destination image between East and West. Tour. Manag. Perspect. 2019, 30, 182–192. [Google Scholar] [CrossRef]
- Peng, X.; Bao, Y.; Huang, Z. Perceiving Beijing’s “City Image” Across Different Groups Based on Geotagged Social Media Data. IEEE Access 2020, 8, 93868–93881. [Google Scholar] [CrossRef]
- Carmona, M.; Heath, T.; Oc, T.; Tiesdell, S. Public Places, Urban Spaces: The Dimensions of Urban Design; Architectural Press: London, UK, 2003. [Google Scholar]
- Lloyd, R.; Heivly, C. Systematic distortions in urban cognitive maps. Ann. Assoc. Am. Geogr. 1987, 77, 191–207. [Google Scholar] [CrossRef]
- Anholt, S. The Anholt-GMI City Brands Index: How the world sees the world’s cities. Place Brand. 2006, 2, 18–31. [Google Scholar] [CrossRef]
- Gartner, W.C. Image Formation Process. J. Travel Tour. Mark. 1994, 2, 191–216. [Google Scholar] [CrossRef]
- Gilboa, S.; Jaffe, E.D.; Vianelli, D.; Pastore, A.; Herstein, R. A summated rating scale for measuring city image. Cities 2015, 44, 50–59. [Google Scholar] [CrossRef]
- Stylos, N.; Vassiliadis, C.A.; Bellou, V.; Andronikidis, A. Destination images, holistic images and personal normative beliefs: Predictors of intention to revisit a destination. Tour. Manag. 2016, 53, 40–60. [Google Scholar] [CrossRef] [Green Version]
- Stern, E.; Krakover, S. The Formation of a Composite Urban Image. Geogr. Anal. 1993, 25, 130–146. [Google Scholar] [CrossRef]
- Luque-Martínez, T.; Del Barrio-García, S.; Ibáñez-Zapata, J.; Molina, M.R. Modeling a city’s image: The case of Granada. Cities 2007, 24, 335–352. [Google Scholar] [CrossRef]
- Urry, J. The Tourist Gaze; Sage: London, UK, 1990. [Google Scholar]
- Crandall, D.J.; Backstrom, L.; Huttenlocher, D.; Kleinberg, J. Mapping the world’s photos. In Proceedings of the 18th International Conference on World Wide Web, Madrid, Spain, 20–24 April 2009; pp. 632–637. [Google Scholar]
- Crawshaw, C.; Urry, J. Tourism and the photographic eye. In Touring Cultures: Transformations of Travel and Theory; Ojek, C.R., Urry, J., Eds.; Routledge: London, UK, 1997; pp. 176–195. [Google Scholar]
- Pan, S.; Lee, J.; Tsai, H. Travel photos: Motivations, image dimensions, and affective qualities of places. Tour. Manag. 2014, 40, 59–69. [Google Scholar] [CrossRef]
- Xu, Z.; Liu, Y.; Yen, N.Y.; Mei, L.; Luo, X.; Wei, X.; Hu, C. Crowdsourcing Based Description of Urban Emergency Events Using Social Media Big Data. IEEE Trans. Cloud Comput. 2020, 8, 387–397. [Google Scholar] [CrossRef] [Green Version]
- Naaman, M.; Becker, H.; Gravano, L. Hip and trendy: Characterizing emerging trends on Twitter. J. Am. Soc. Inf. Sci. Technol. 2011, 62, 902–918. [Google Scholar] [CrossRef] [Green Version]
- Crooks, A.; Pfoser, D.; Jenkins, A.; Croitoru, A.; Stefanidis, A.; Smith, D.; Karagiorgou, S.; Efentakis, A.; Lamprianidis, G. Crowdsourcing urban form and function. Int. J. Geogr. Inf. Sci. 2015, 29, 720–741. [Google Scholar] [CrossRef]
- Lu, X.; Wang, C.; Yang, J.; Pang, Y.; Zhang, L. Photo2Trip: Generating travel routes from geo-tagged photos for trip planning. In Proceedings of the 18th International Conference on Multimedia, Firenze, Italy, 25–29 October 2010; pp. 143–152. [Google Scholar]
- García-Palomares, J.C.; Gutiérrez, J.; Mínguez, C. Identification of tourist hot spots based on social networks: A comparative analysis of European metropolises using photo-sharing services and GIS. Appl. Geogr. 2015, 63, 408–417. [Google Scholar] [CrossRef]
- Samany, N.N. Automatic landmark extraction from geo-tagged social media photos using deep neural network. Cities 2019, 93, 1–12. [Google Scholar] [CrossRef]
- Jankowski, P.; Andrienko, N.; Andrienko, G.; Kisilevich, S. Discovering Landmark Preferences and Movement Patterns from Photo Postings. Trans. GIS 2010, 14, 833–852. [Google Scholar] [CrossRef]
- Ji, R.; Gao, Y.; Zhong, B.; Yao, H.; Tian, Q. Mining flickr landmarks by modeling reconstruction sparsity. ACM Trans. Multimed. Comput. Commun. Appl. 2011, 7S, 31. [Google Scholar] [CrossRef]
- Rattenbury, T.; Good, N.; Maaman, M. Towards automatic extraction of event and place semantics from flickr tags. In Proceedings of the 30th Annual International ACM SIGIR Conference on Research and Development in Information Retrieval, Amsterdam, The Netherlands, 23–27 July 2007; ACM: New York, NY, USA, 2007; pp. 103–110. [Google Scholar]
- Rattenbury, T.; Naaman, M. Methods for extracting place semantics from Flickr tags. ACM Trans. Web 2009, 3, 1–30. [Google Scholar] [CrossRef] [Green Version]
- Dunkel, A. Visualizing the perceived environment using crowdsourced photo geodata. Landsc. Urban. Plan. 2015, 142, 173–186. [Google Scholar] [CrossRef]
- Papadopoulos, S.; Zigkolis, C.; Kompatsiaris, I.; Vakali, A. Cluster-Based Landmark and Event Detection for Tagged Photo Collections. IEEE Multimed. Mag. 2011, 18, 52–63. [Google Scholar] [CrossRef]
- Miah, S.J.; Vu, H.Q.; Gammack, J.; McGrath, M. A Big Data Analytics Method for Tourist Behaviour Analysis. Inf. Manag. 2017, 54, 771–785. [Google Scholar] [CrossRef] [Green Version]
- Ibrahim, M.R.; Haworth, J.; Cheng, T. Understanding cities with machine eyes: A review of deep computer vision in urban analytics. Cities 2020, 96, 102481. [Google Scholar] [CrossRef]
- Wang, R.; Luo, J.; Huang, S. Developing an artificial intelligence framework for online destination image photos identification. J. Destin. Mark. Manag. 2020, 18, 100512. [Google Scholar] [CrossRef]
- Sheng, F.; Zhang, Y.; Shi, C.; Qiu, M.; Yao, S. Xi’an tourism destination image analysis via deep learning. J. Ambient. Intell. Humaniz. Comput. 2020, in press, corrected proof. [Google Scholar] [CrossRef]
- Zhou, B.; Liu, L.; Oliva, A.; Torralba, A. Recognizing City Identity via Attribute Analysis of Geo-tagged Images. In Proceedings of the 13th European Conference on Computer Vision (ECCV), Zurich, Switzerland, 6–12 September 2014; pp. 519–534. [Google Scholar] [CrossRef] [Green Version]
- Zhang, K.; Chen, Y.; Li, C. Discovering the tourists’ behaviors and perceptions in a tourism destination by analyzing photos’ visual content with a computer deep learning model: The case of Beijing. Tour. Manag. 2019, 75, 595–608. [Google Scholar] [CrossRef]
- Chen, M.; Arribas-Bel, D.; Singleton, A. Quantifying the Characteristics of the Local Urban Environment through Geotagged Flickr Photographs and Image Recognition. ISPRS Int. J. Geo-Inf. 2020, 9, 264. [Google Scholar] [CrossRef] [Green Version]
- Doersch, C.; Singh, S.; Gupta, A.; Sivic, J.; Efros, A.A. What makes Paris look like Paris? ACM Trans. Graph. 2012, 31, 101. [Google Scholar] [CrossRef]
- Zhang, F.; Zhou, B.; Ratti, C.; Liu, Y. Discovering place-informative scenes and objects using social media photos. R. Soc. Open Sci. 2019, 6, 181375. [Google Scholar] [CrossRef] [Green Version]
- Batty, M. Cities as Complex Systems: Scaling, Interaction, Networks, Dynamics and Urban Morphologies. UCL CASA Work. Pap. Ser. 2009, 131, 1041–1071. [Google Scholar] [CrossRef] [Green Version]
- Batty, M. The New Science of Cities; MIT Press: Cambridge, MA, USA, 2013. [Google Scholar] [CrossRef]
- Senaratne, H.; Mobasheri, A.; Ali, A.L.; Capineri, C.; Haklay, M. A review of volunteered geographic information quality assessment methods. Int. J. Geogr. Inf. Sci. 2017, 31, 139–167. [Google Scholar] [CrossRef]
- Zhou, B.; Lapedriza, A.; Khosla, A.; Oliva, A.; Torralba, A. Places: A 10 Million Image Database for Scene Recognition. IEEE Trans. Pattern Anal. Mach. Intell. 2018, 40, 1452–1464. [Google Scholar] [CrossRef] [Green Version]
- Ankerst, M.; Breunig, M.M.; Kriegel, H.P.; Sander, J. OPTICS: Ordering points to identify the clustering structure. In Proceedings of the ACM SIGMOD International Conference on Management of Data, Philadelphia, PA, USA, 31 May–3 June 1999; pp. 49–60. [Google Scholar]


| Aspects | Structural-Element-Based Study | Factor-Based Study | Imagery-Element-and-Area-Based Study |
|---|---|---|---|
| Representative research | City image [1,6,7]. | City image and destination image [8,17,18,19,20]. | City image and tourist gaze, etc. [1,23]. |
| Conceptual nature | The generalization of the “built image”, i.e., basic types of spatial carriers of city image. | The analysis of complex factors related to city perception, i.e., influential factors and evaluation factors. | The analysis of the “graphic image” and its spatial distribution, i.e., people’s “gaze” to the city and its concentrated areas. |
| Cognitive subject | Mainly residents. | Mainly tourists and investors. | Multi groups including residents, commuters, and tourists. |
| Cognitive object | Built environment. | All aspects including physical environment, human activities, economic development, etc. | Built environment, natural landscape, and human activities, etc. |
| Cognitive form | Mental maps. | Mental images and descriptions. | Mental images and mental maps. |
| Cognitive View | Bird’s-eye view (urban planners’ perspective). | Abstract view (psychologists’ perspective). | Human’s-eye view (publics’ perspective). |
| Data | Sketched maps, photo identification survey, etc. | Likert-scale-based questionnaire or interview results. | User-generated geo-tagged photos. |
| Methodology | Cognitive mapping. | Literature analysis or statistical analysis. | Data-driven methods, e.g., image recognition, spatial clustering, etc. |
| Image Reconstruction | Mainly through blueprints of spatial structure planning. | Mainly through city marketing and tourist publicity strategies | Virtually through images in the media or physically through planning strategies. |
Publisher’s Note: MDPI stays neutral with regard to jurisdictional claims in published maps and institutional affiliations. |
© 2021 by the authors. Licensee MDPI, Basel, Switzerland. This article is an open access article distributed under the terms and conditions of the Creative Commons Attribution (CC BY) license (http://creativecommons.org/licenses/by/4.0/).
Share and Cite
Shen, Y.; Xu, Y.; Liu, L. Crowd-Sourced City Images: Decoding Multidimensional Interaction between Imagery Elements with Volunteered Photos. ISPRS Int. J. Geo-Inf. 2021, 10, 740. https://doi.org/10.3390/ijgi10110740
Shen Y, Xu Y, Liu L. Crowd-Sourced City Images: Decoding Multidimensional Interaction between Imagery Elements with Volunteered Photos. ISPRS International Journal of Geo-Information. 2021; 10(11):740. https://doi.org/10.3390/ijgi10110740
Chicago/Turabian StyleShen, Yao, Yiyi Xu, and Lefeng Liu. 2021. "Crowd-Sourced City Images: Decoding Multidimensional Interaction between Imagery Elements with Volunteered Photos" ISPRS International Journal of Geo-Information 10, no. 11: 740. https://doi.org/10.3390/ijgi10110740
APA StyleShen, Y., Xu, Y., & Liu, L. (2021). Crowd-Sourced City Images: Decoding Multidimensional Interaction between Imagery Elements with Volunteered Photos. ISPRS International Journal of Geo-Information, 10(11), 740. https://doi.org/10.3390/ijgi10110740