
A Post-Scan Point Cloud Colorization Method for Cultural Heritage Documentation

 ,
, 
 ,
, 

Abstract
:1. Introduction
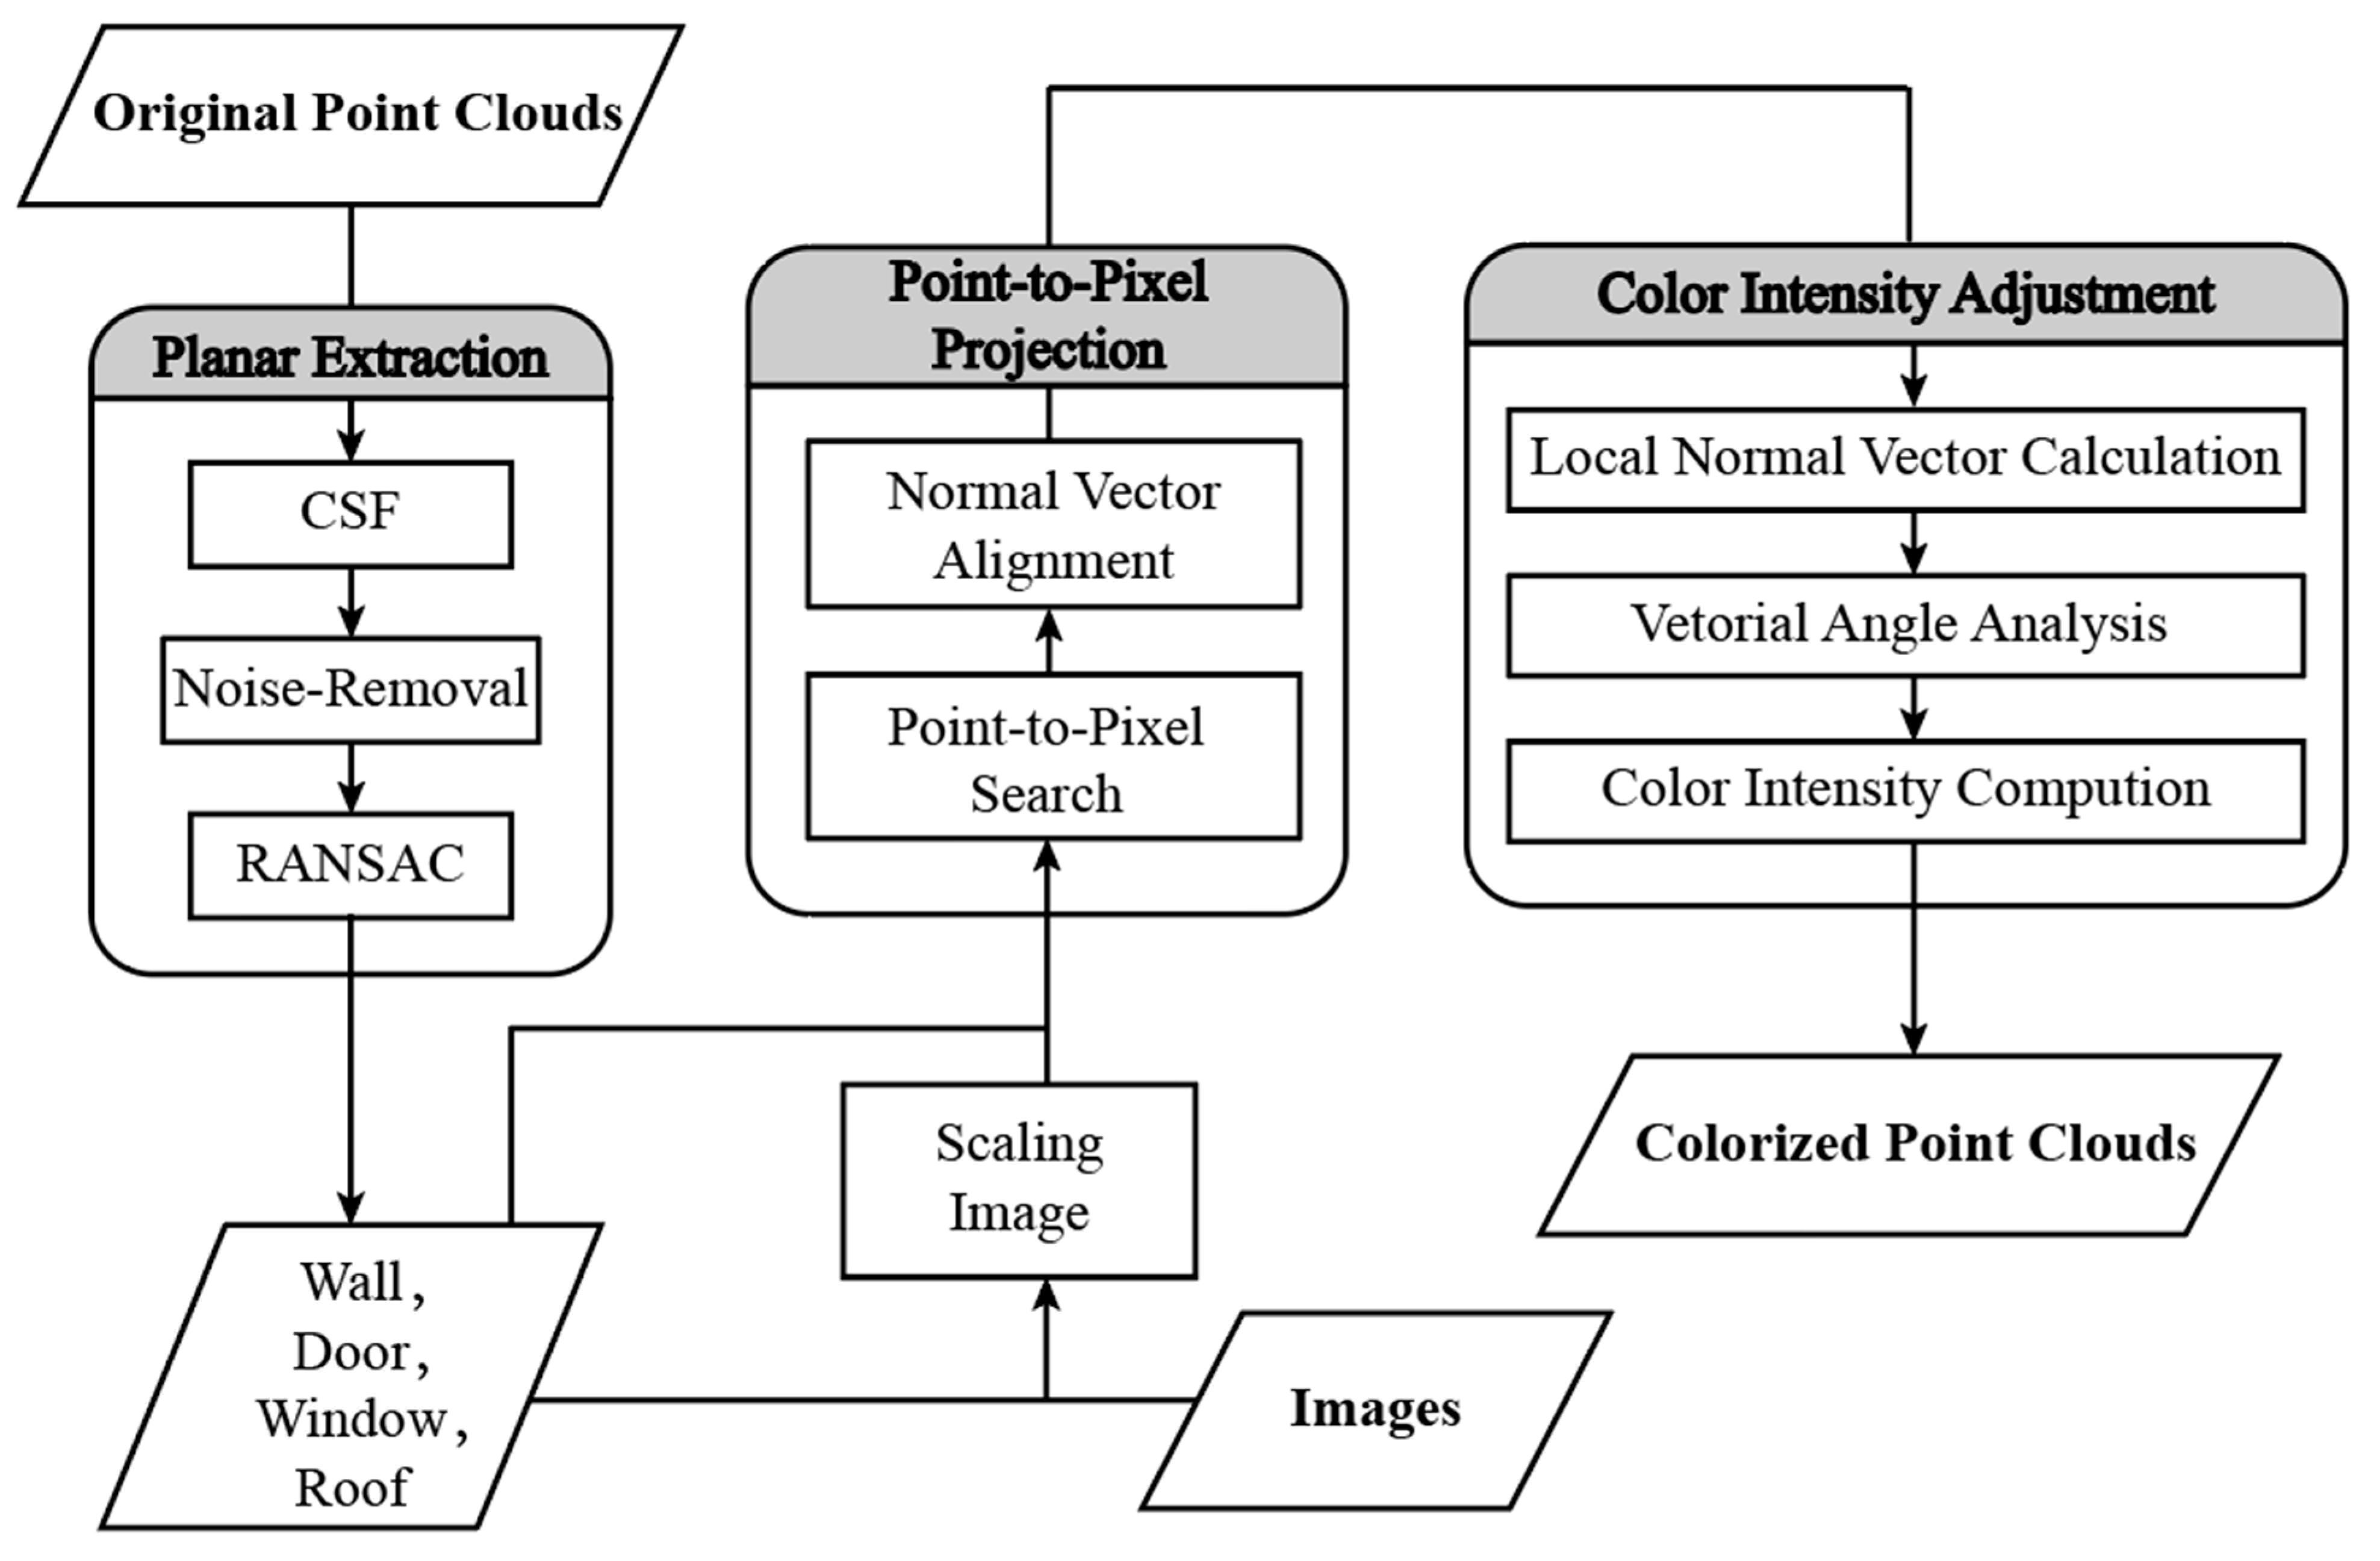
2. Method
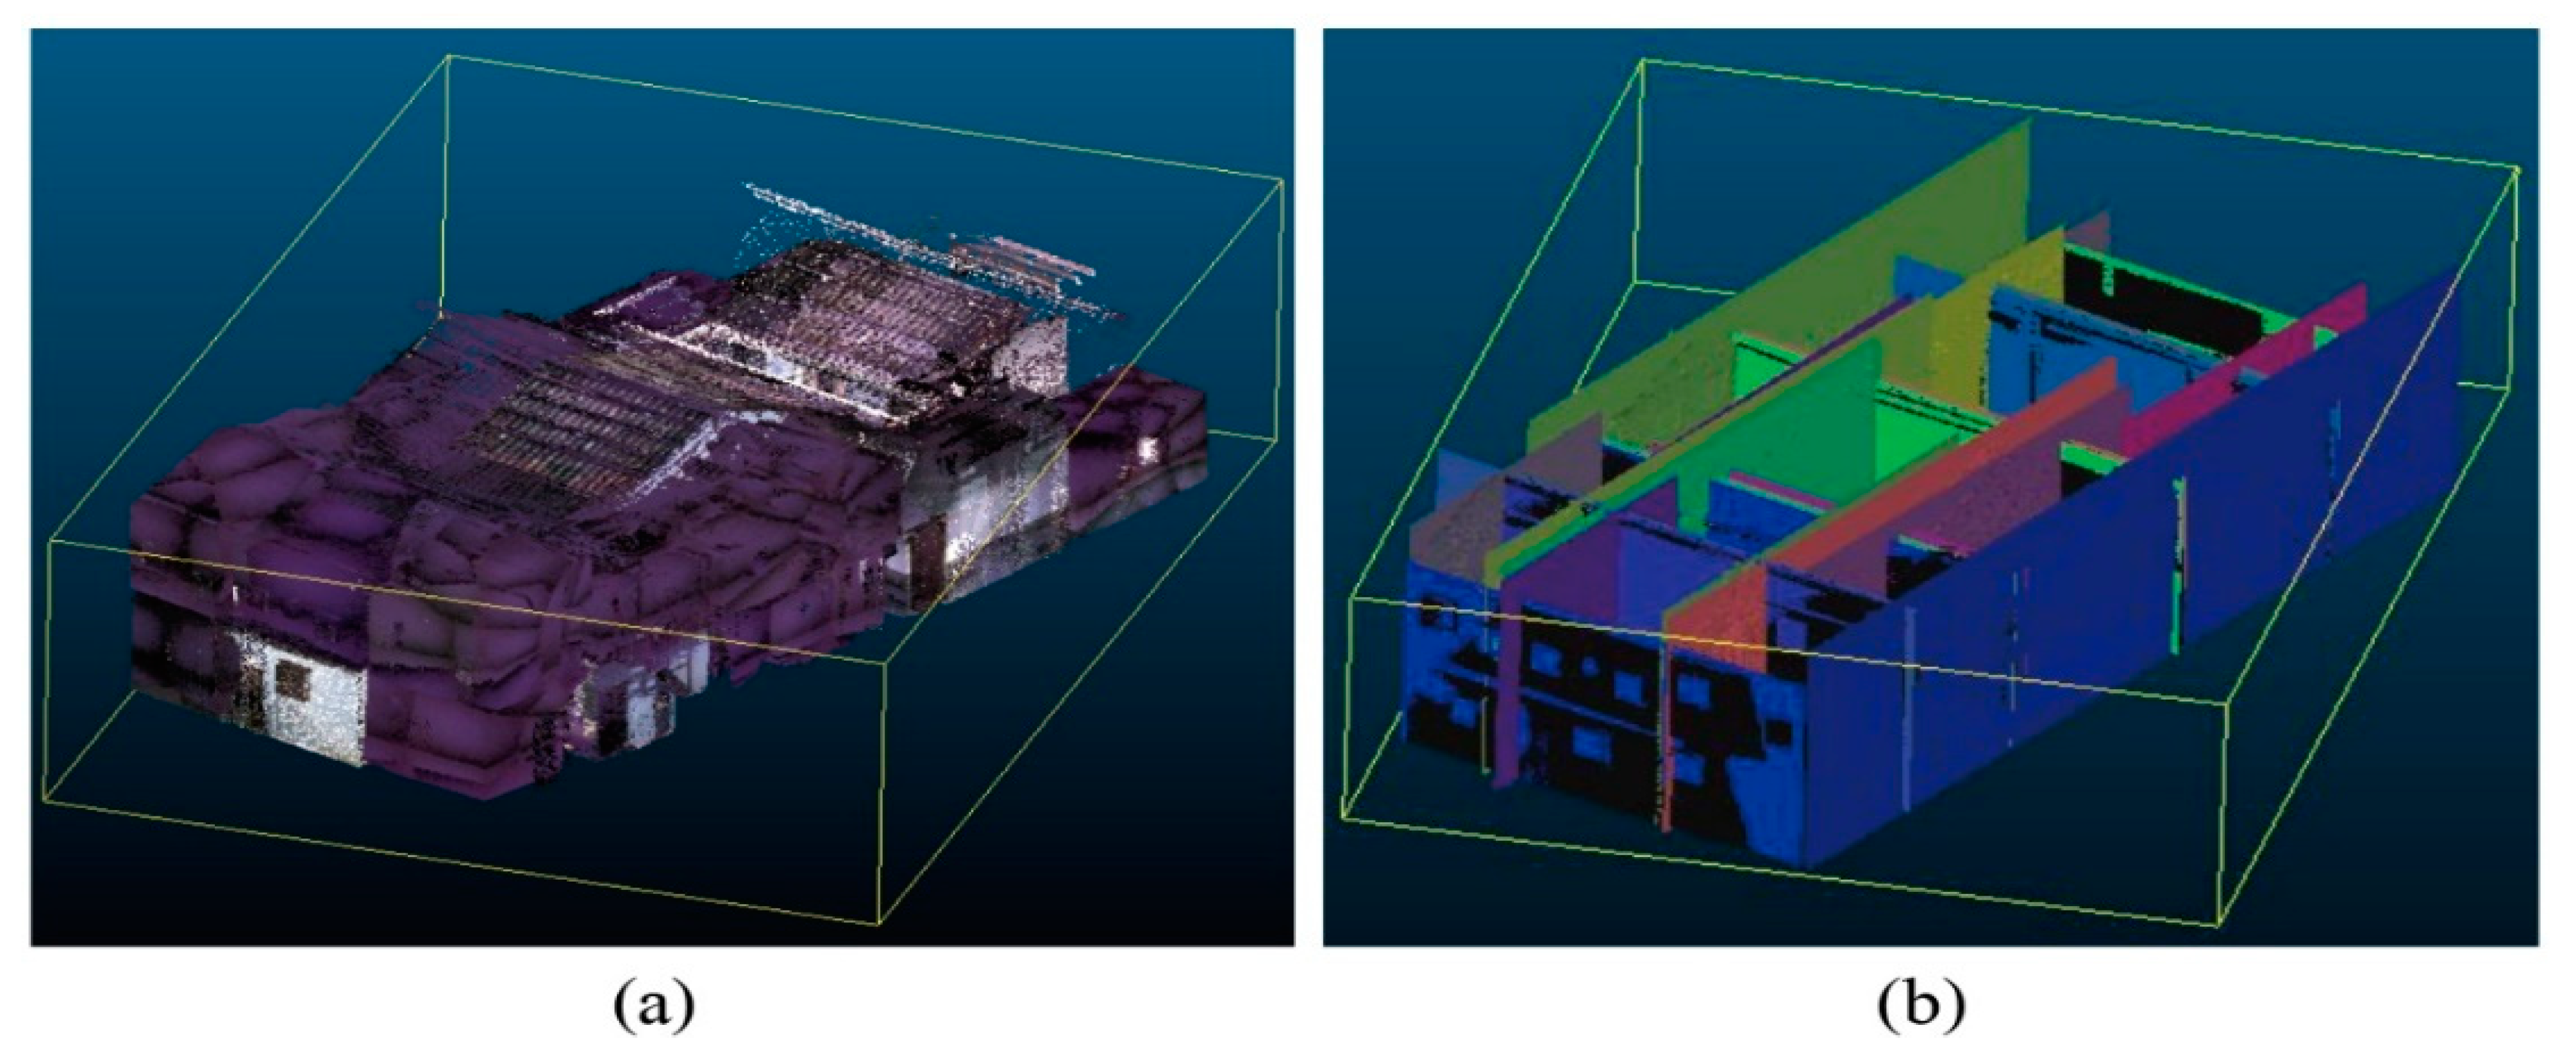
2.1. Planar Feature Extraction
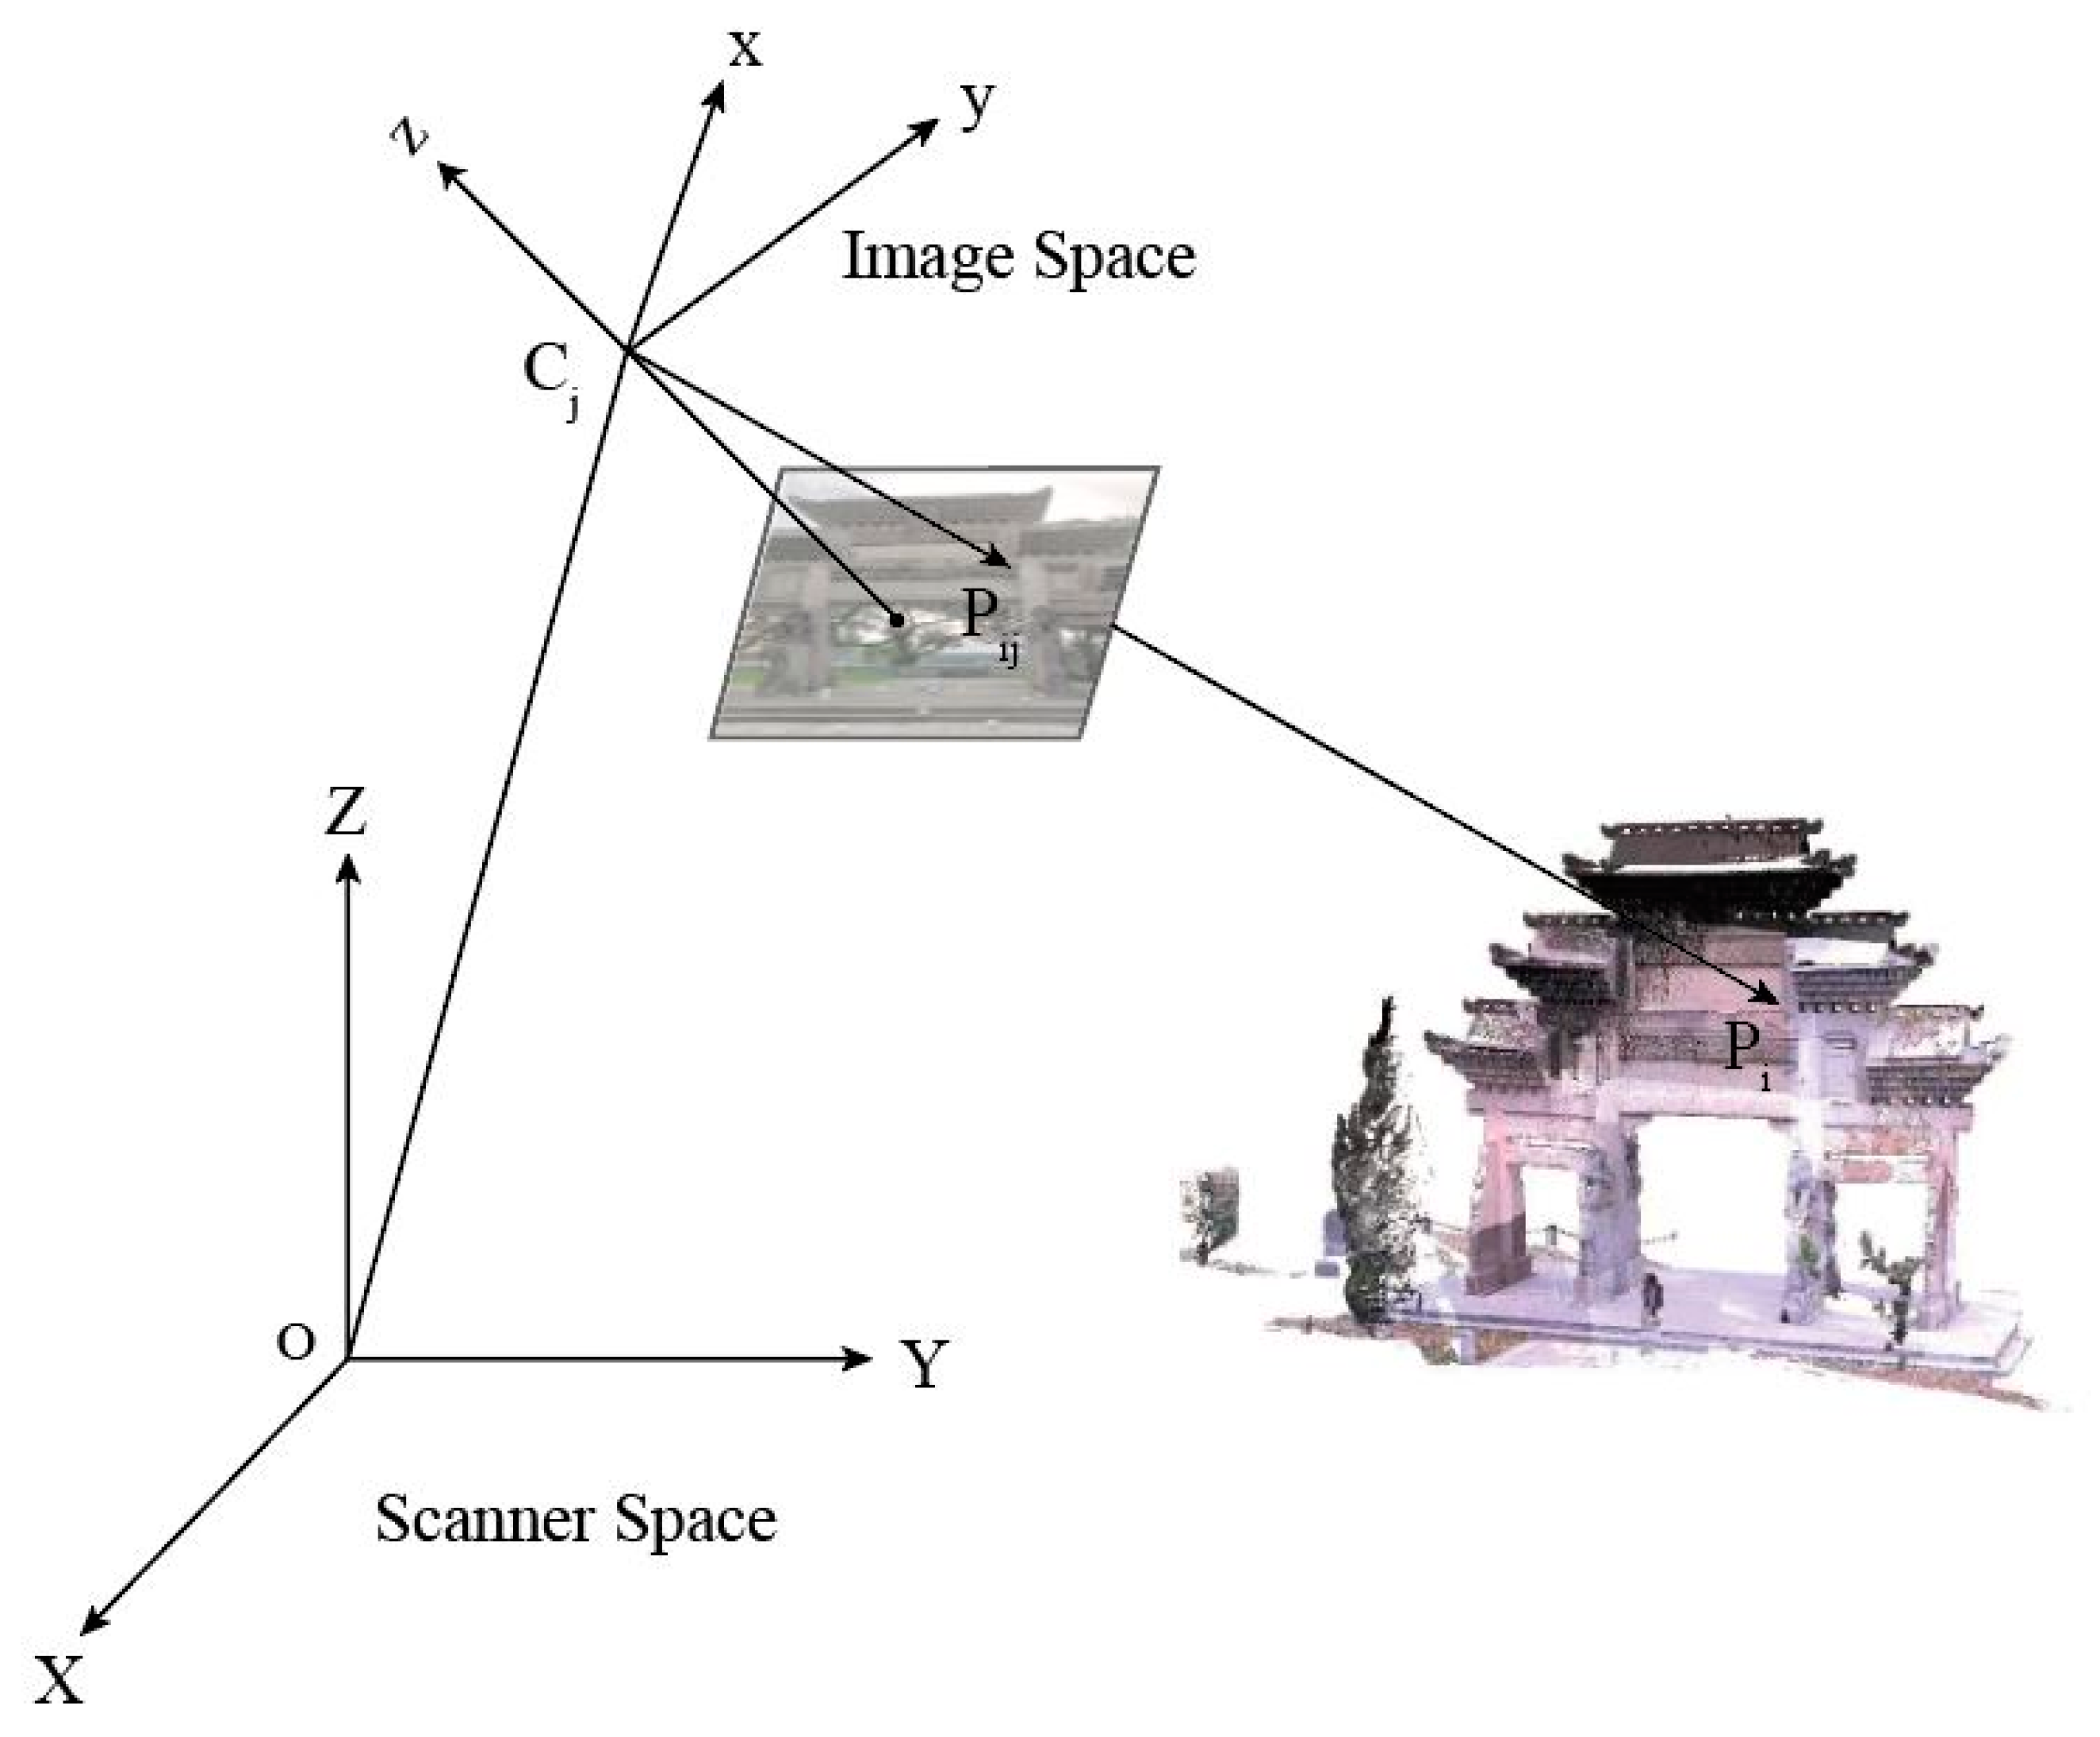
2.2. Point-to-Pixel Projection
2.3. Color Intensity Adjustment (CIA)
3. Experiment
3.1. Simulated Dataset
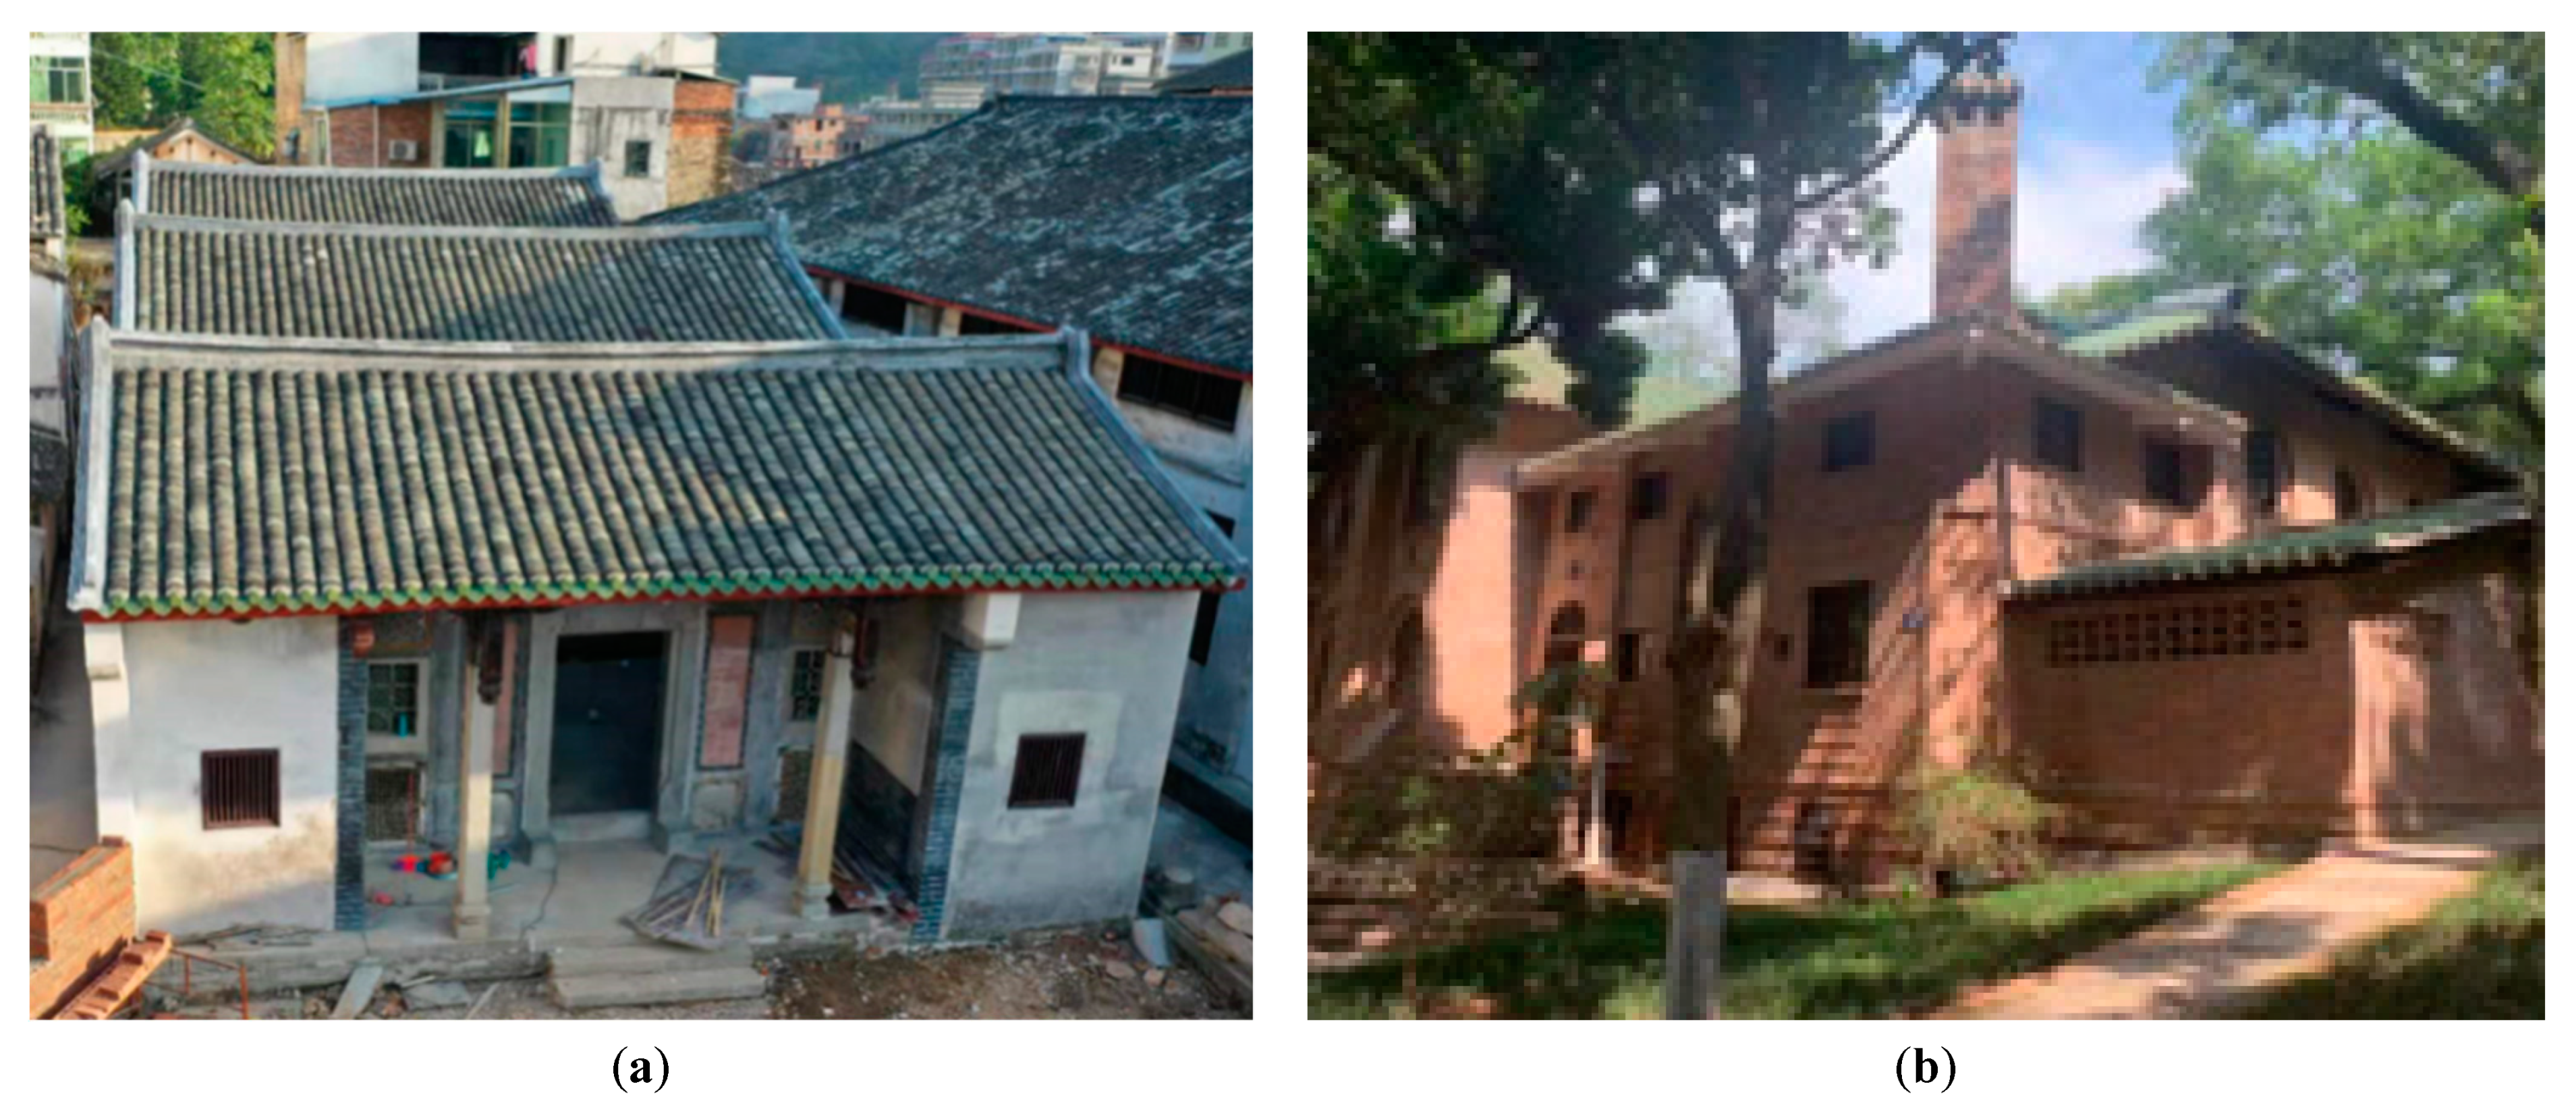
3.2. Real Dataset
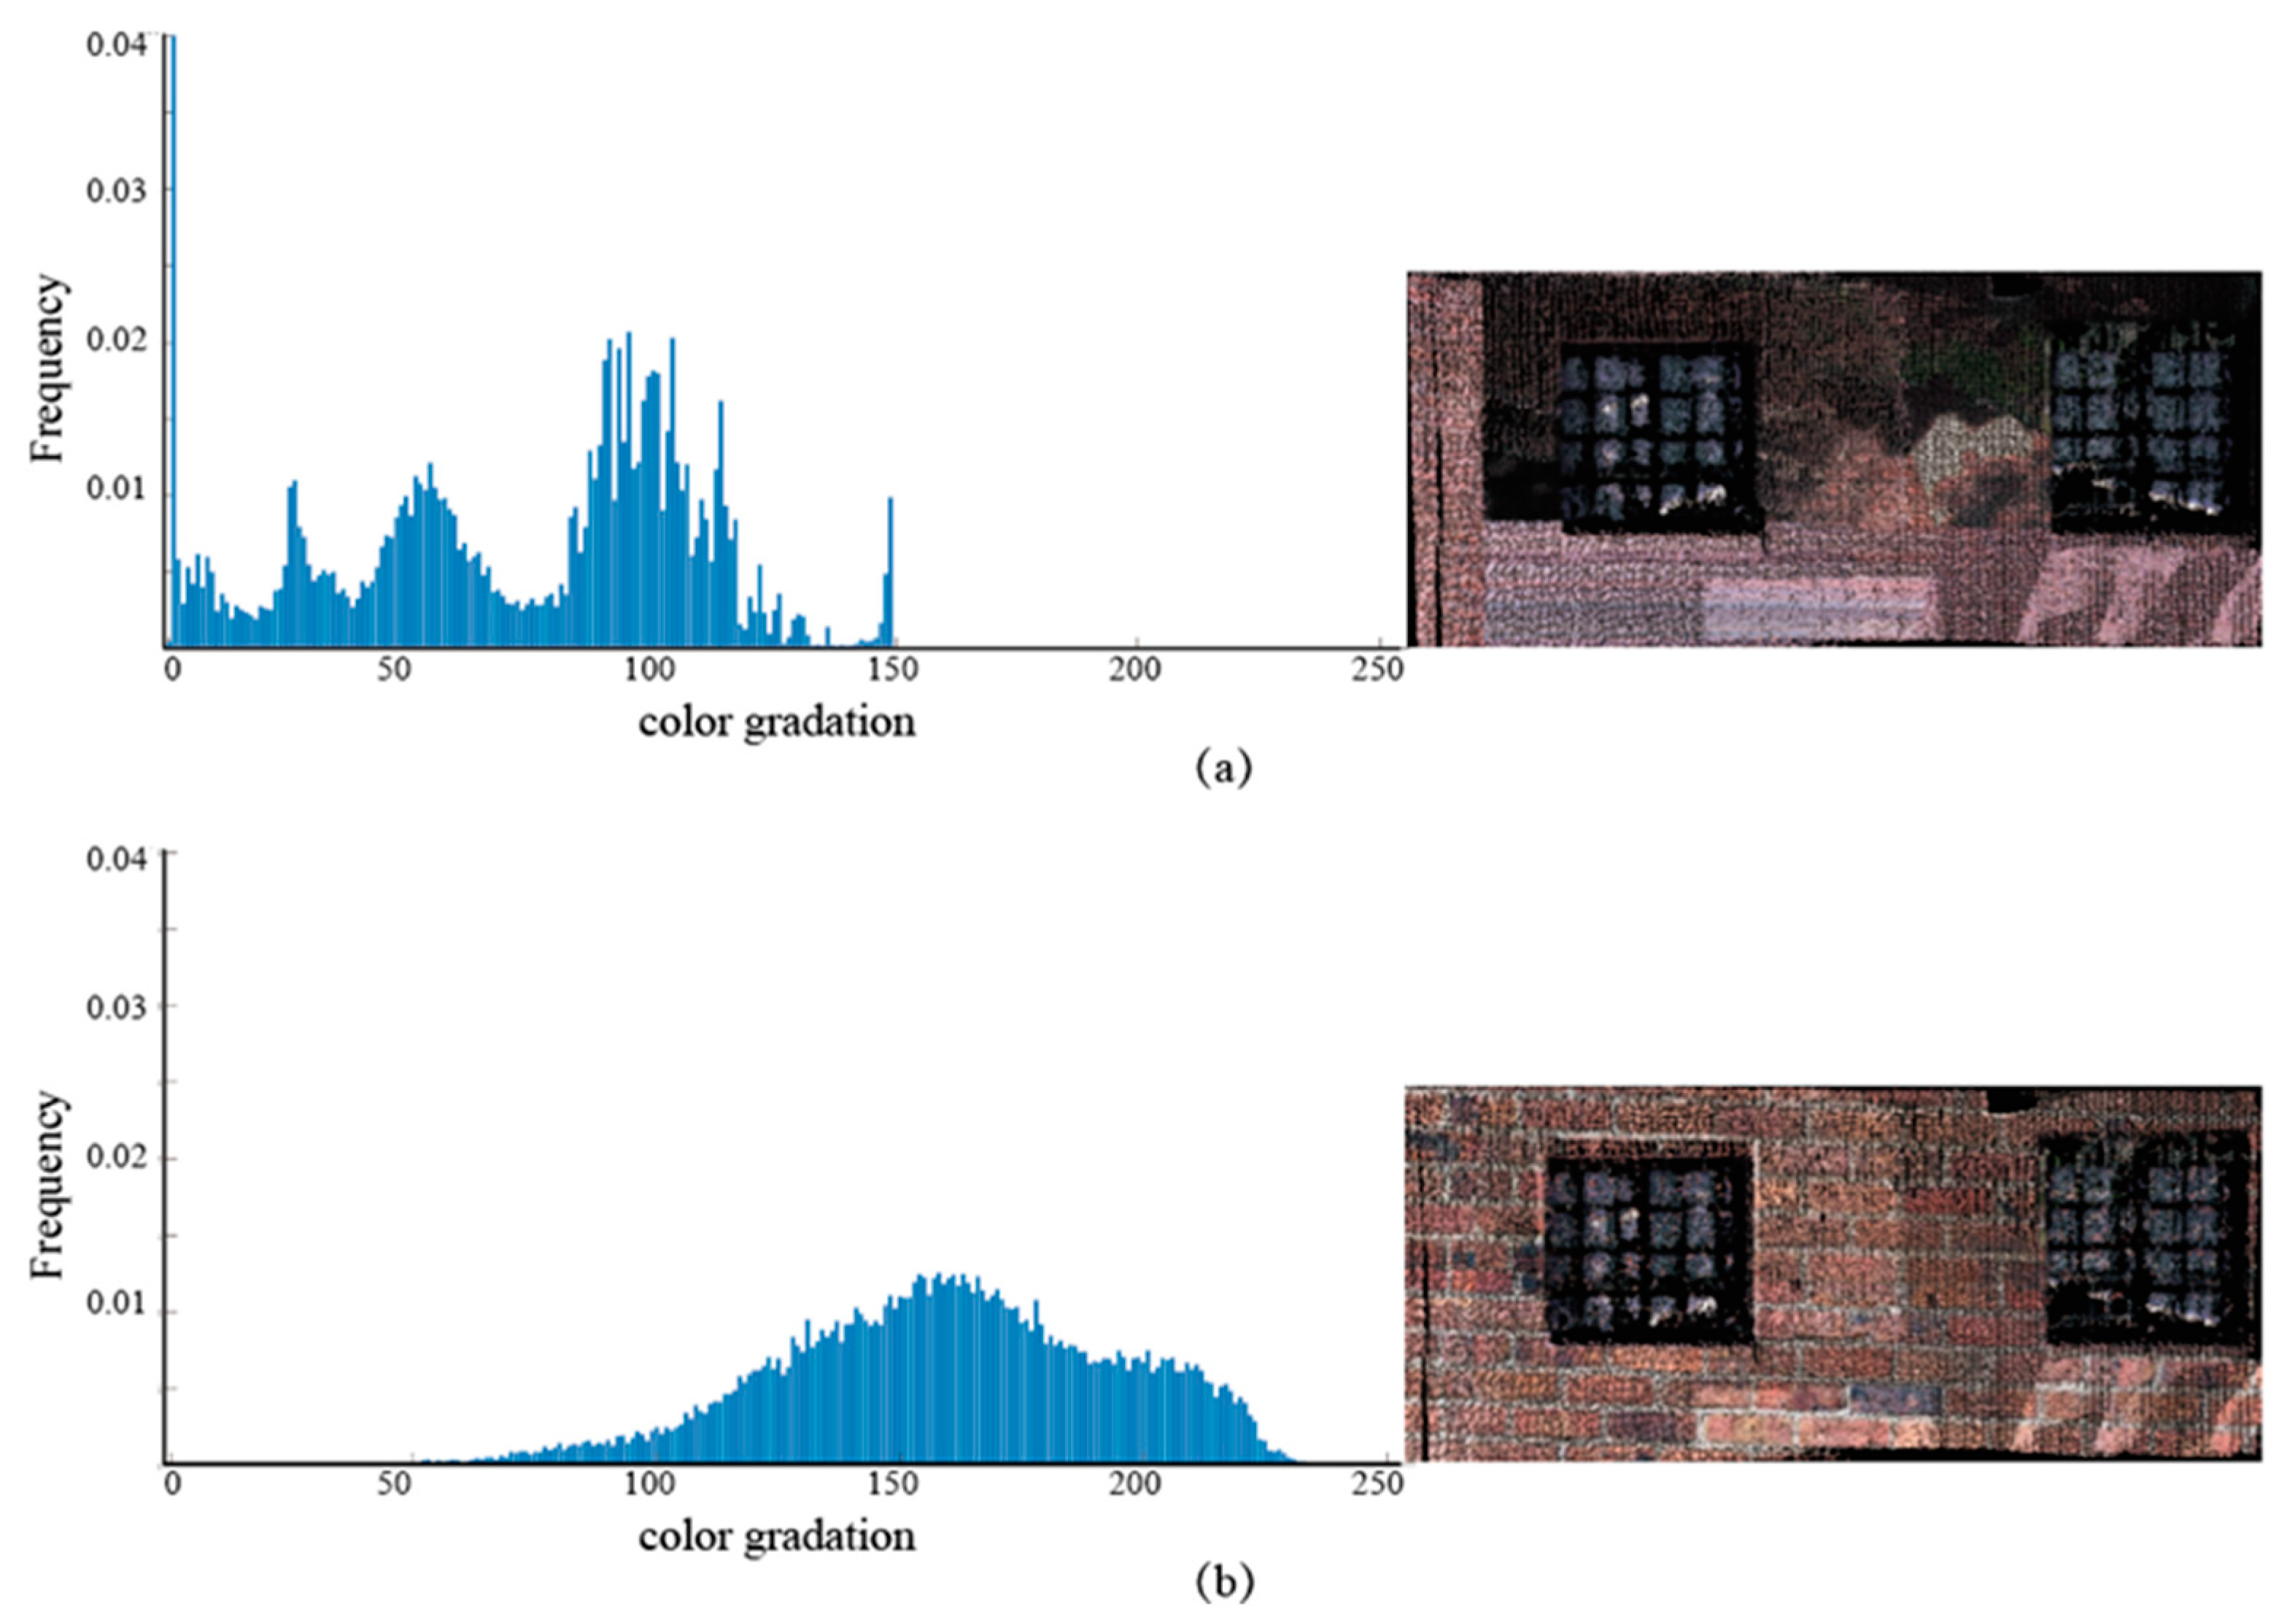
4. Results
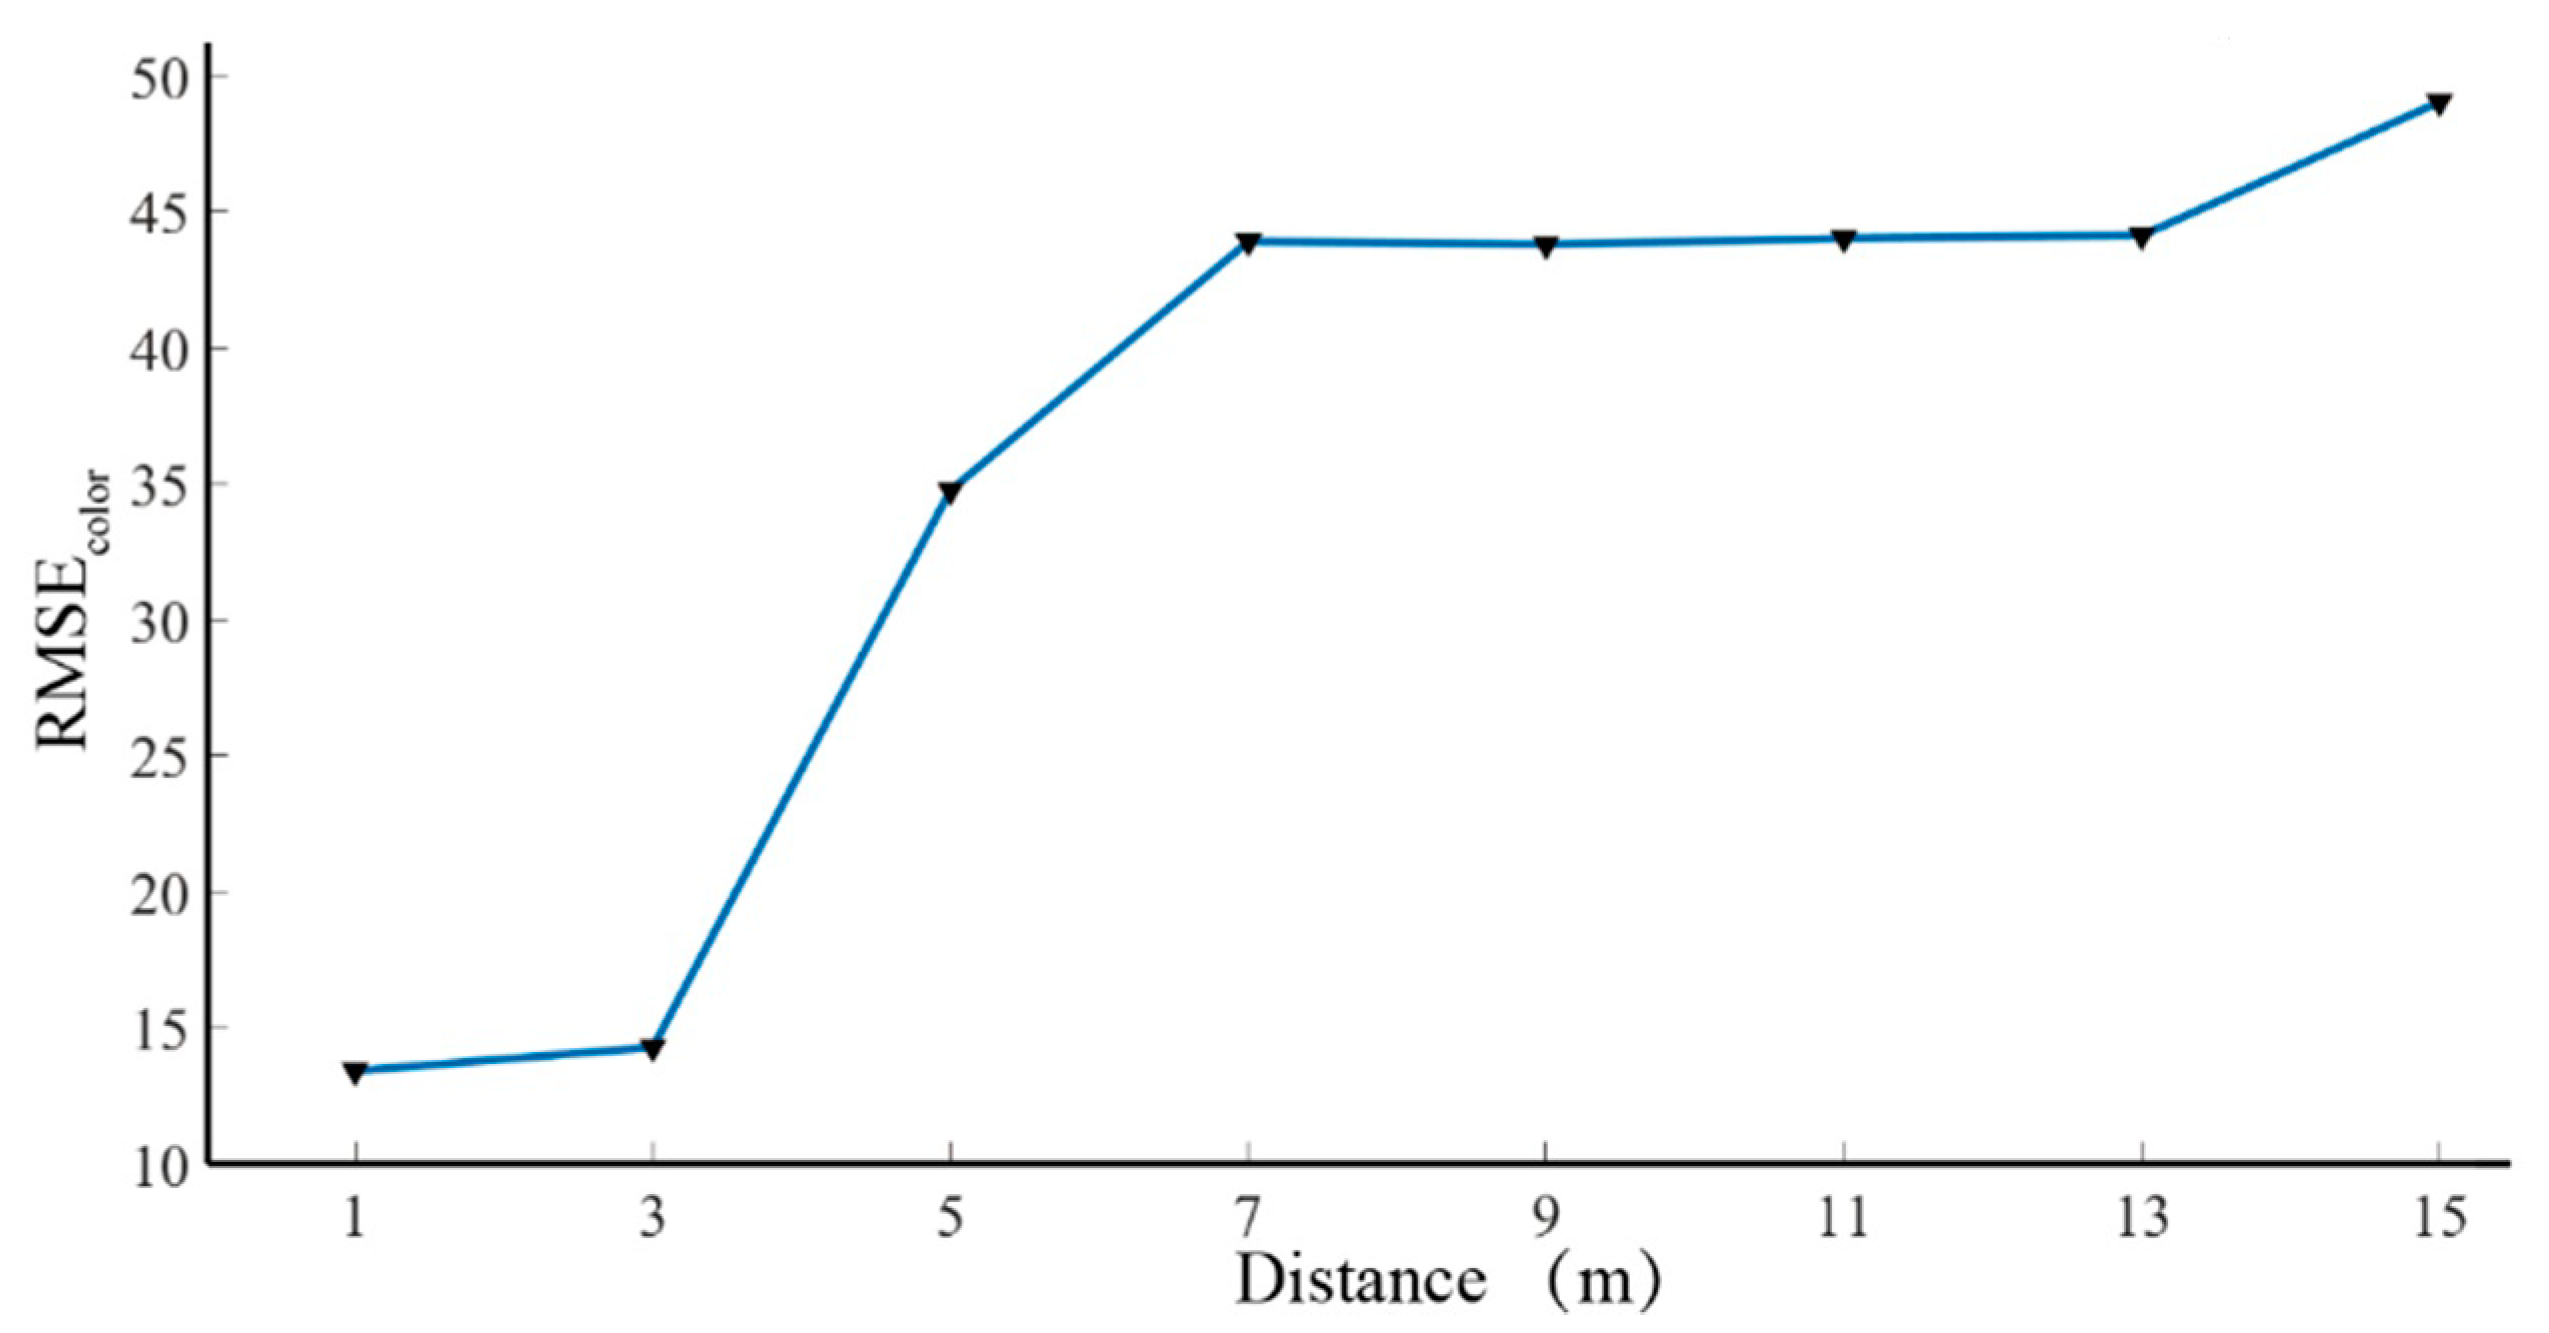
4.1. Results for the Simulated Data
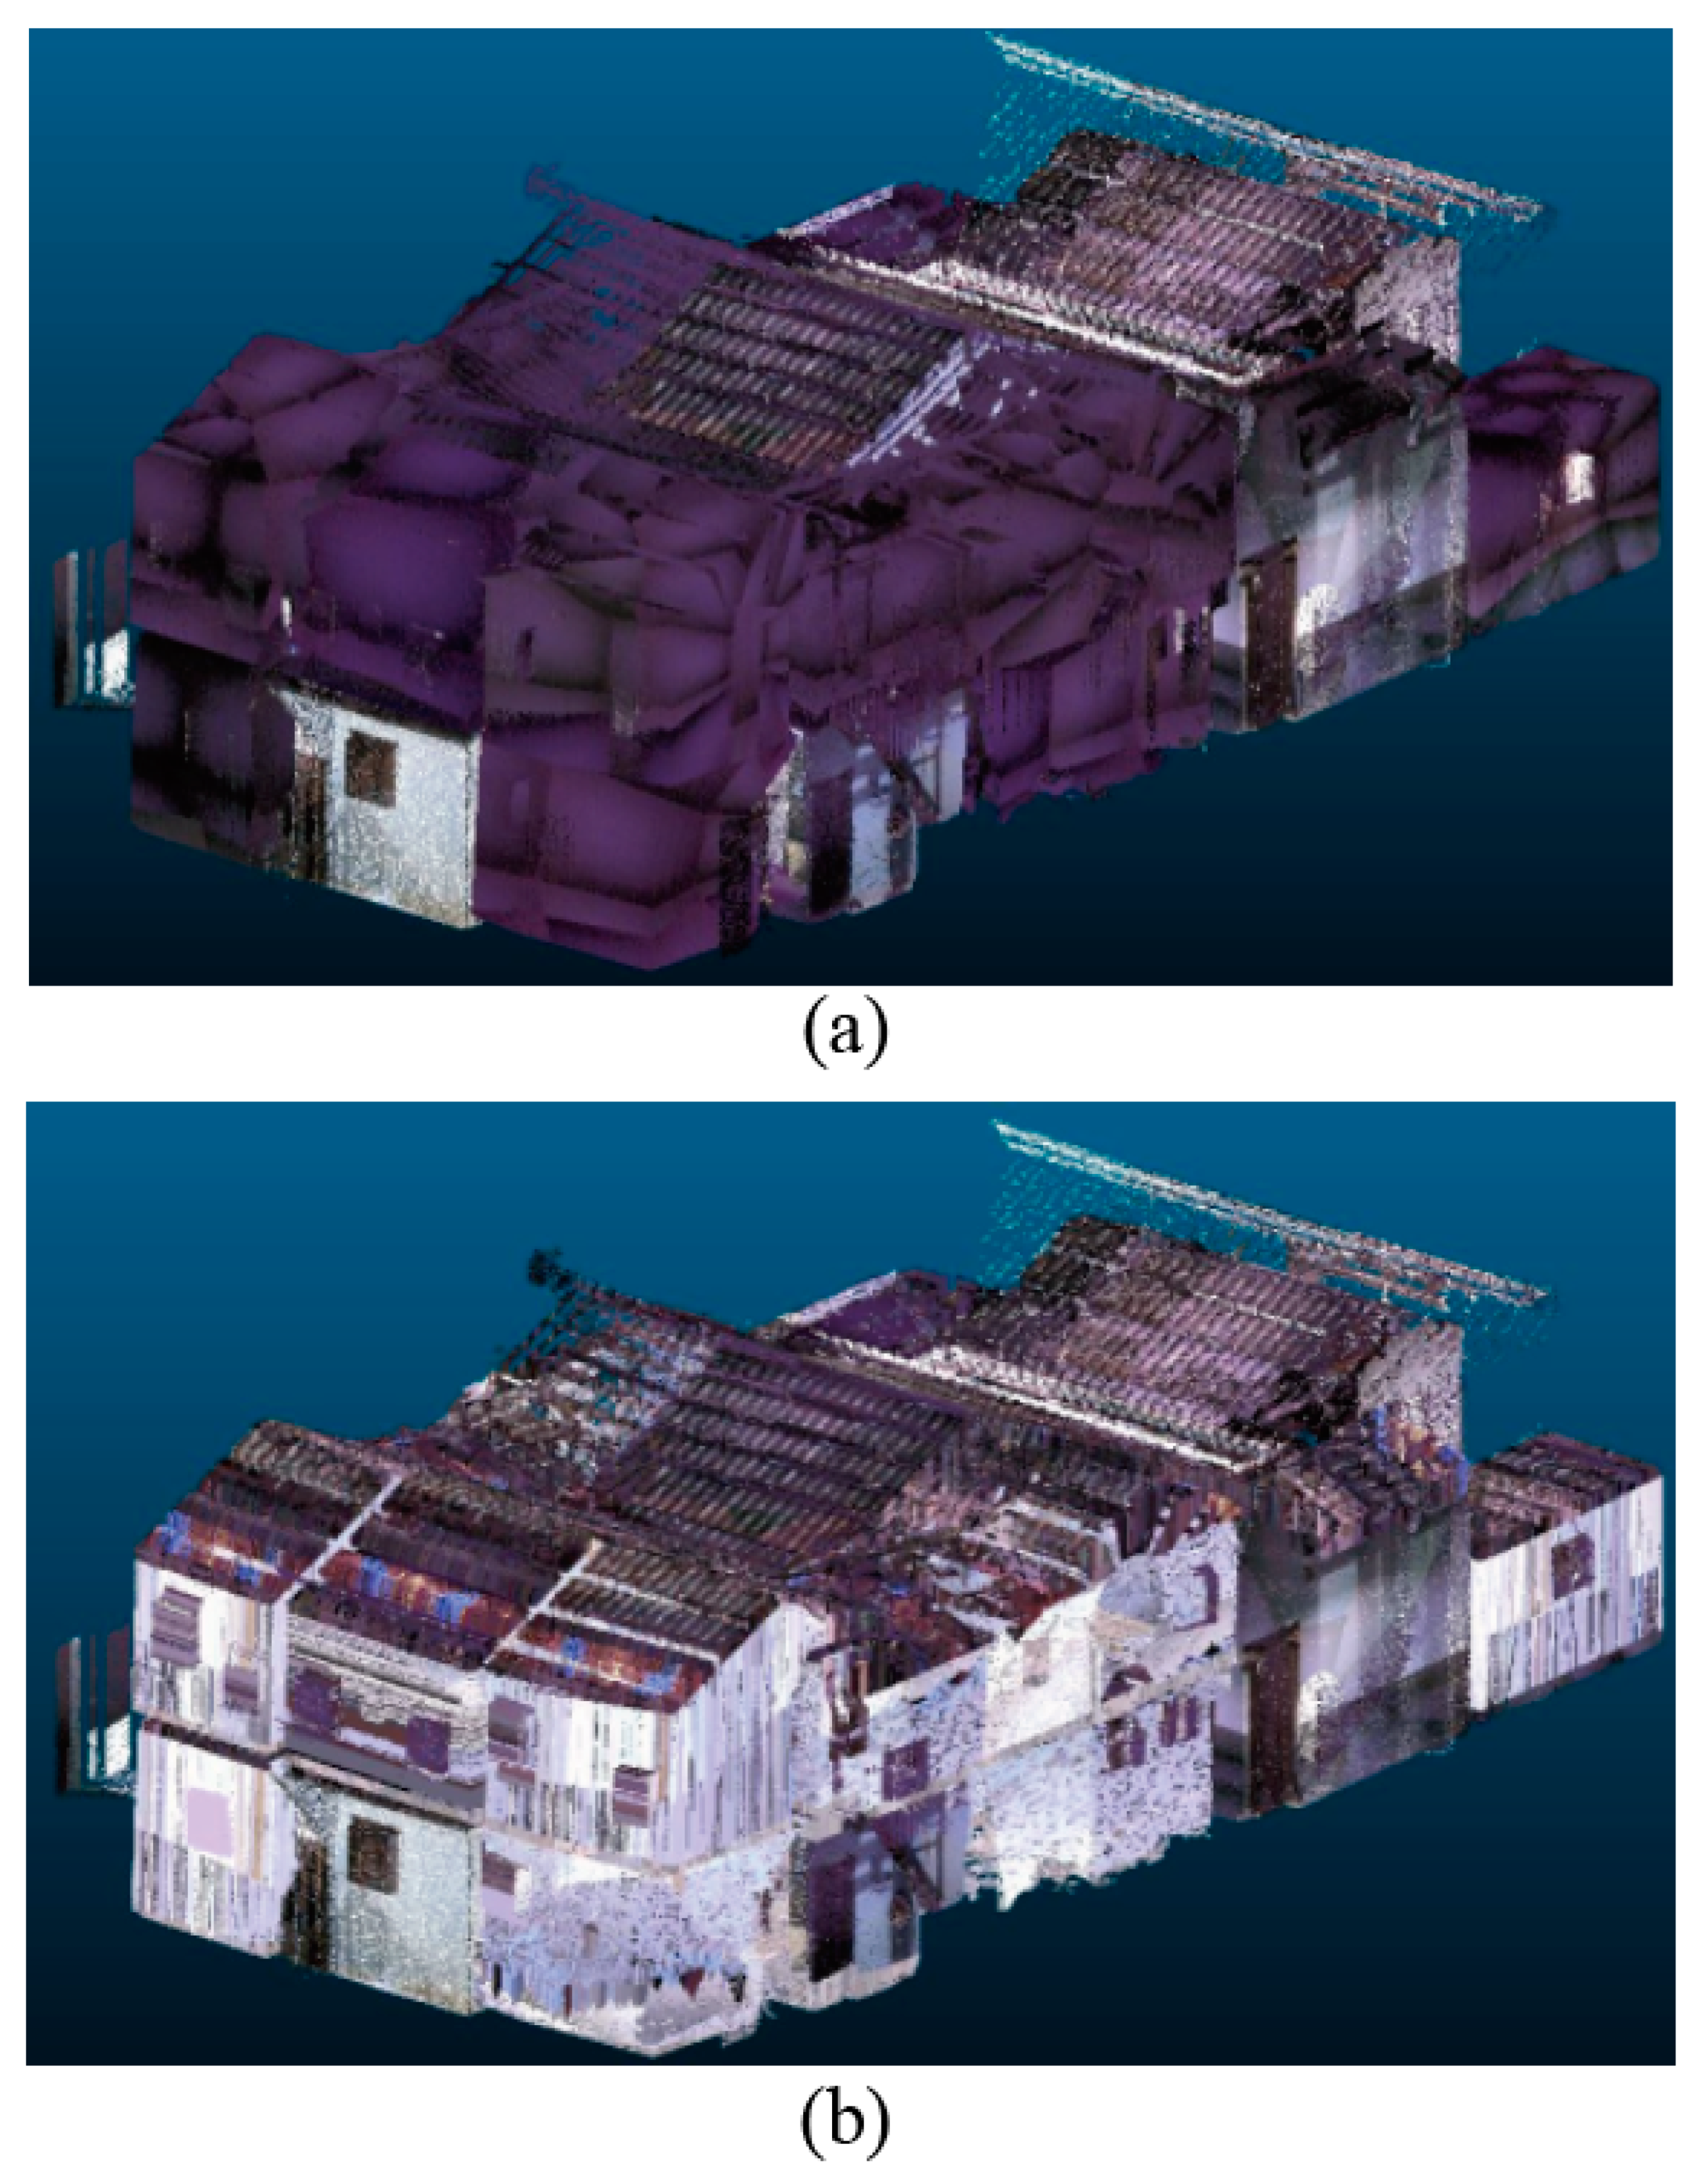
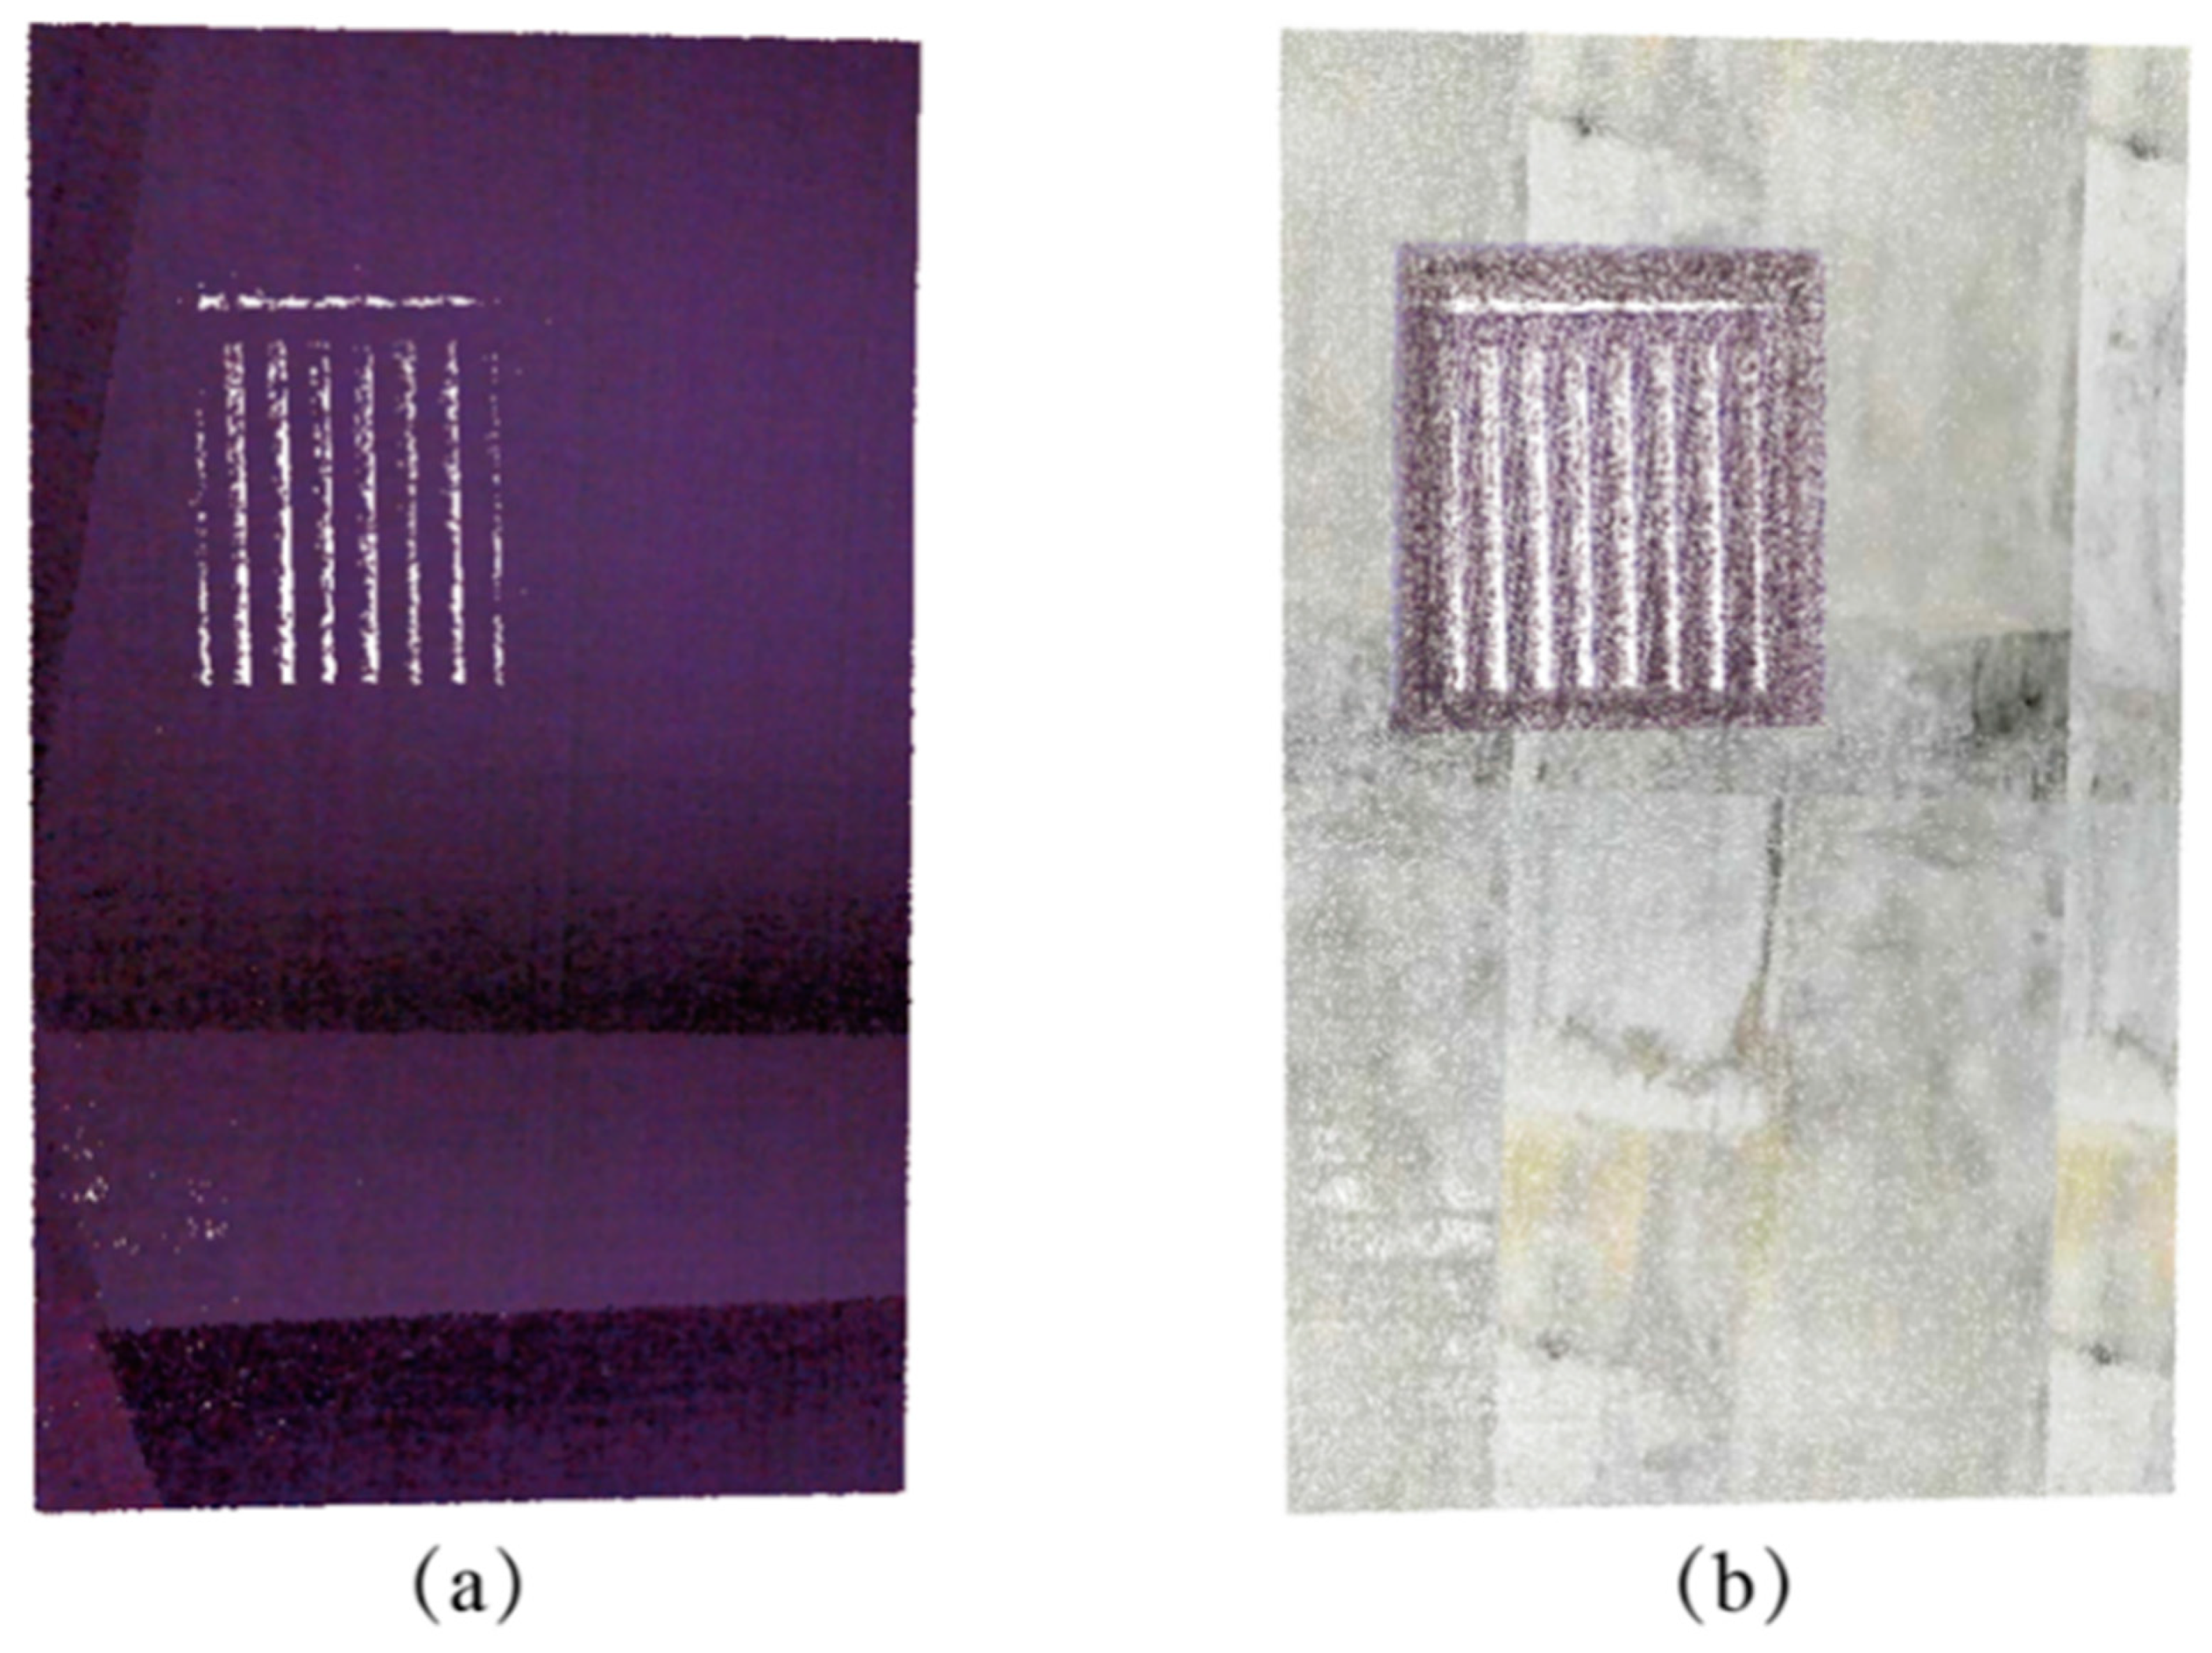
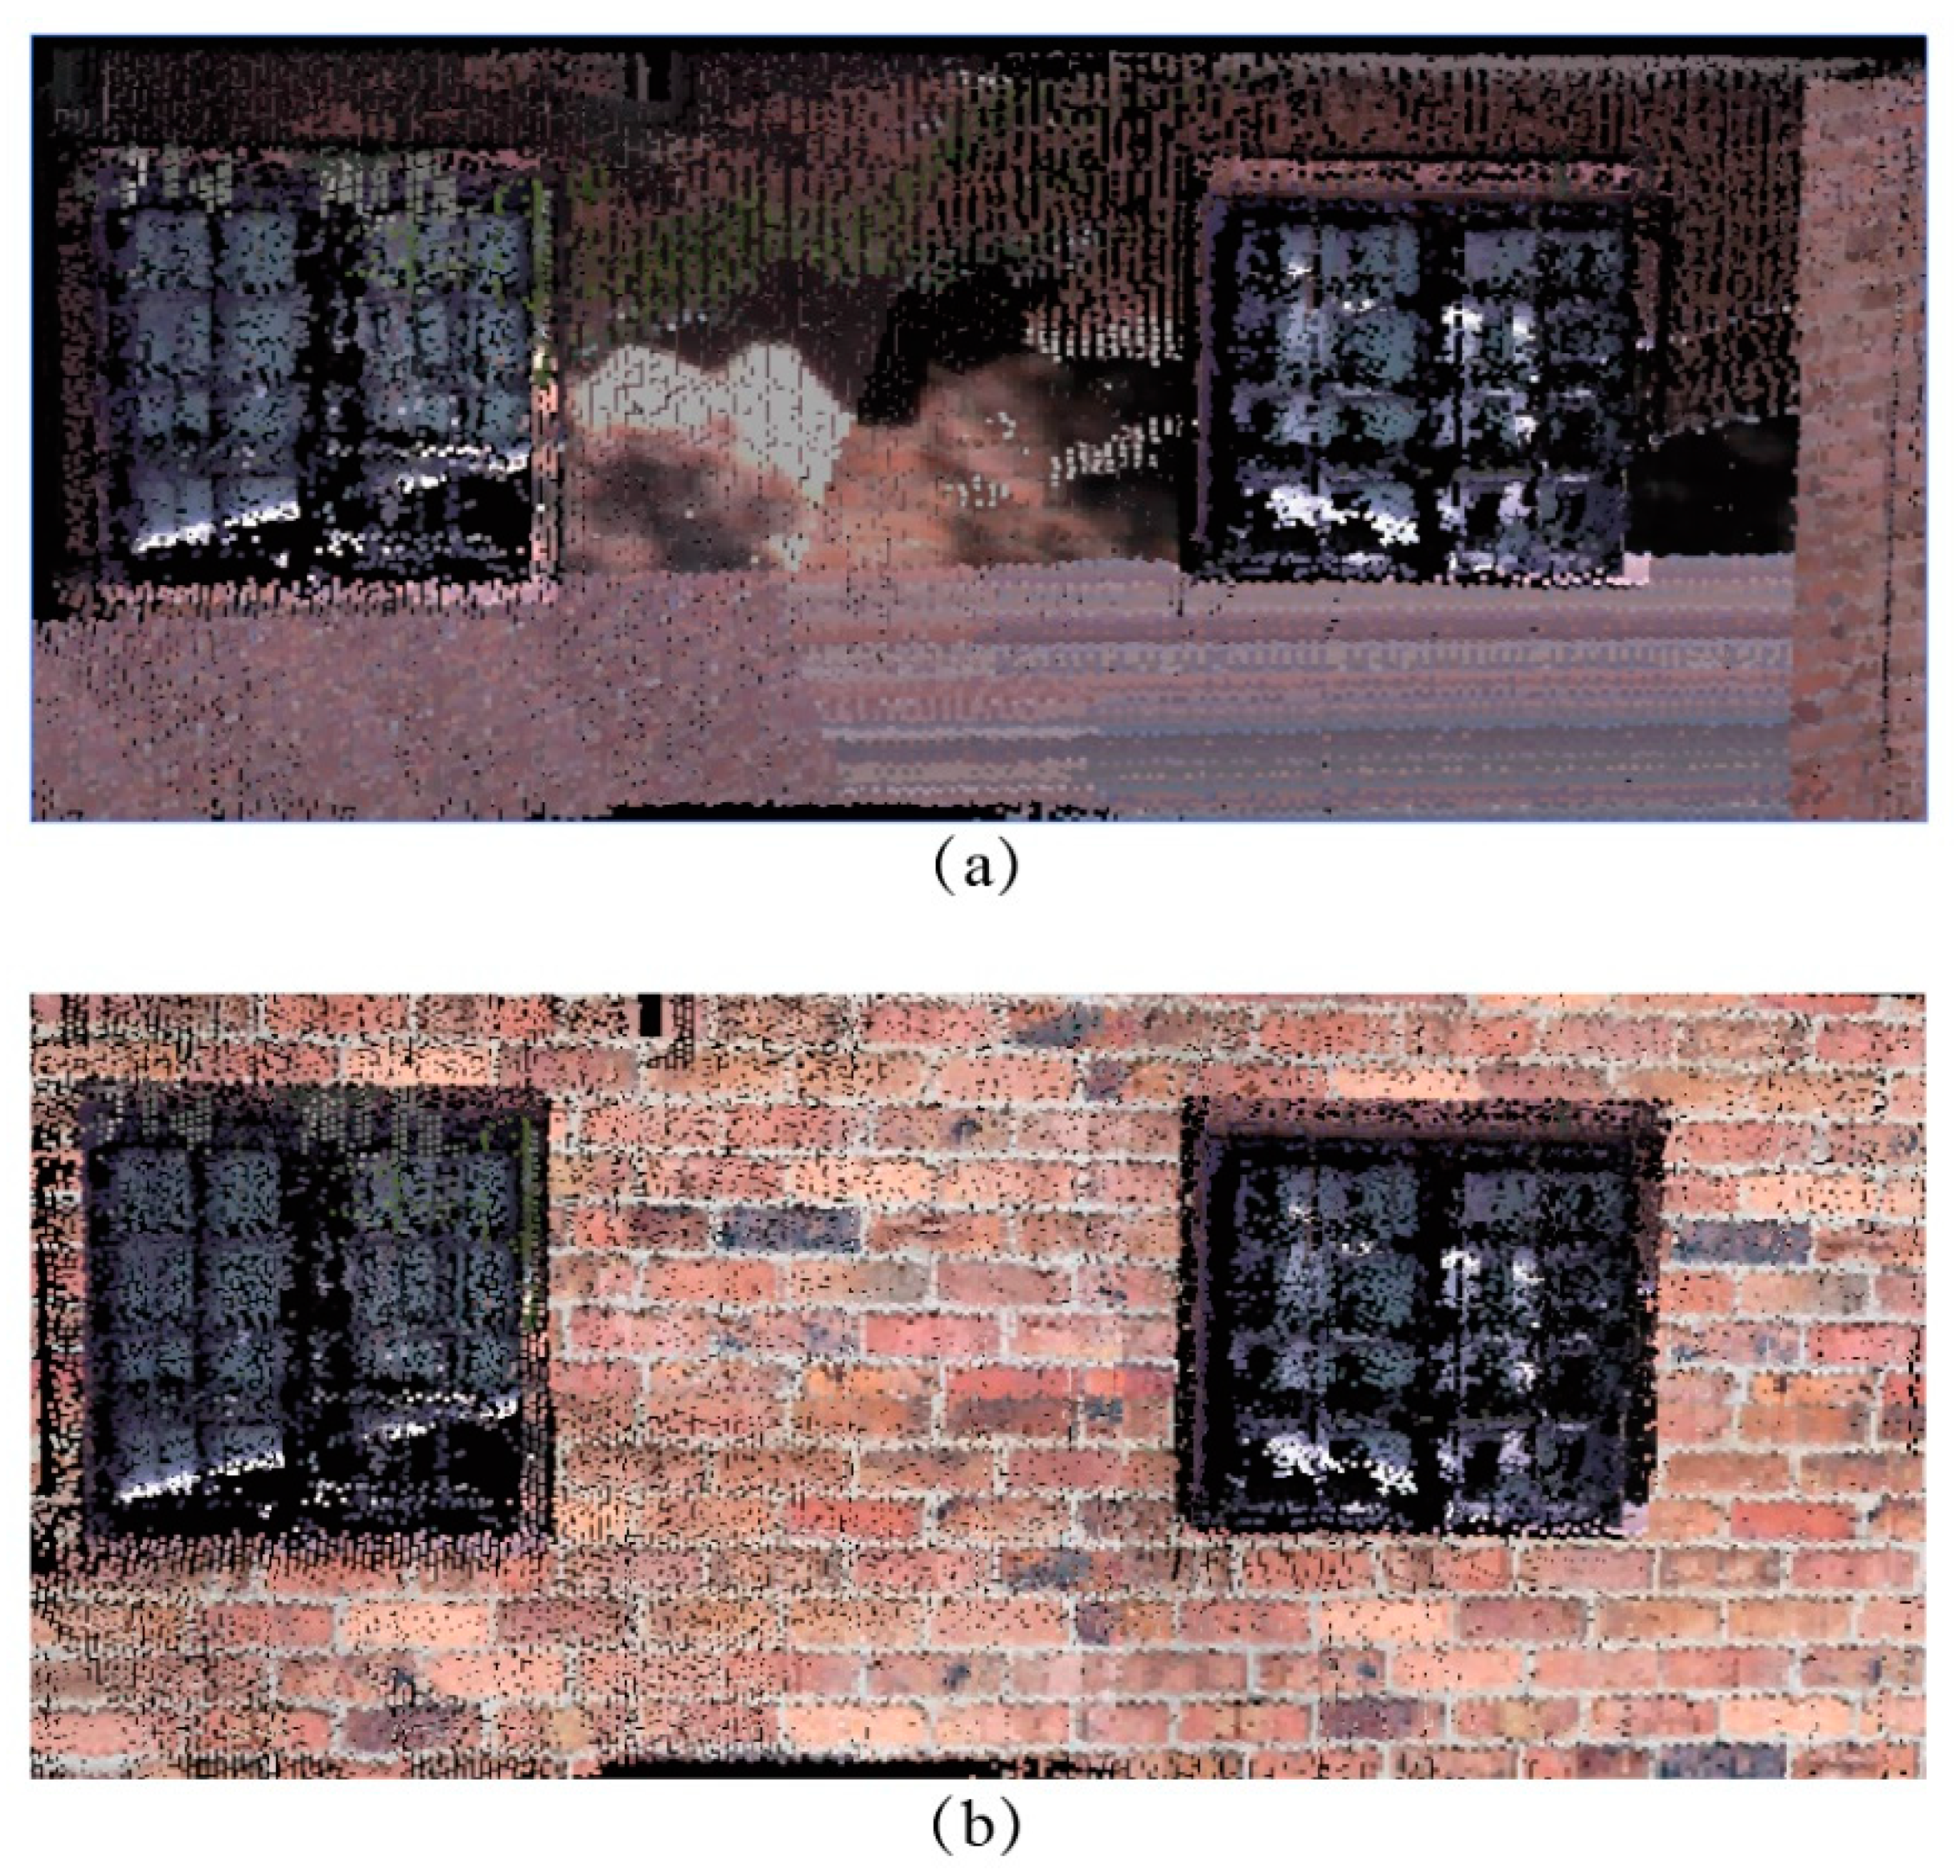
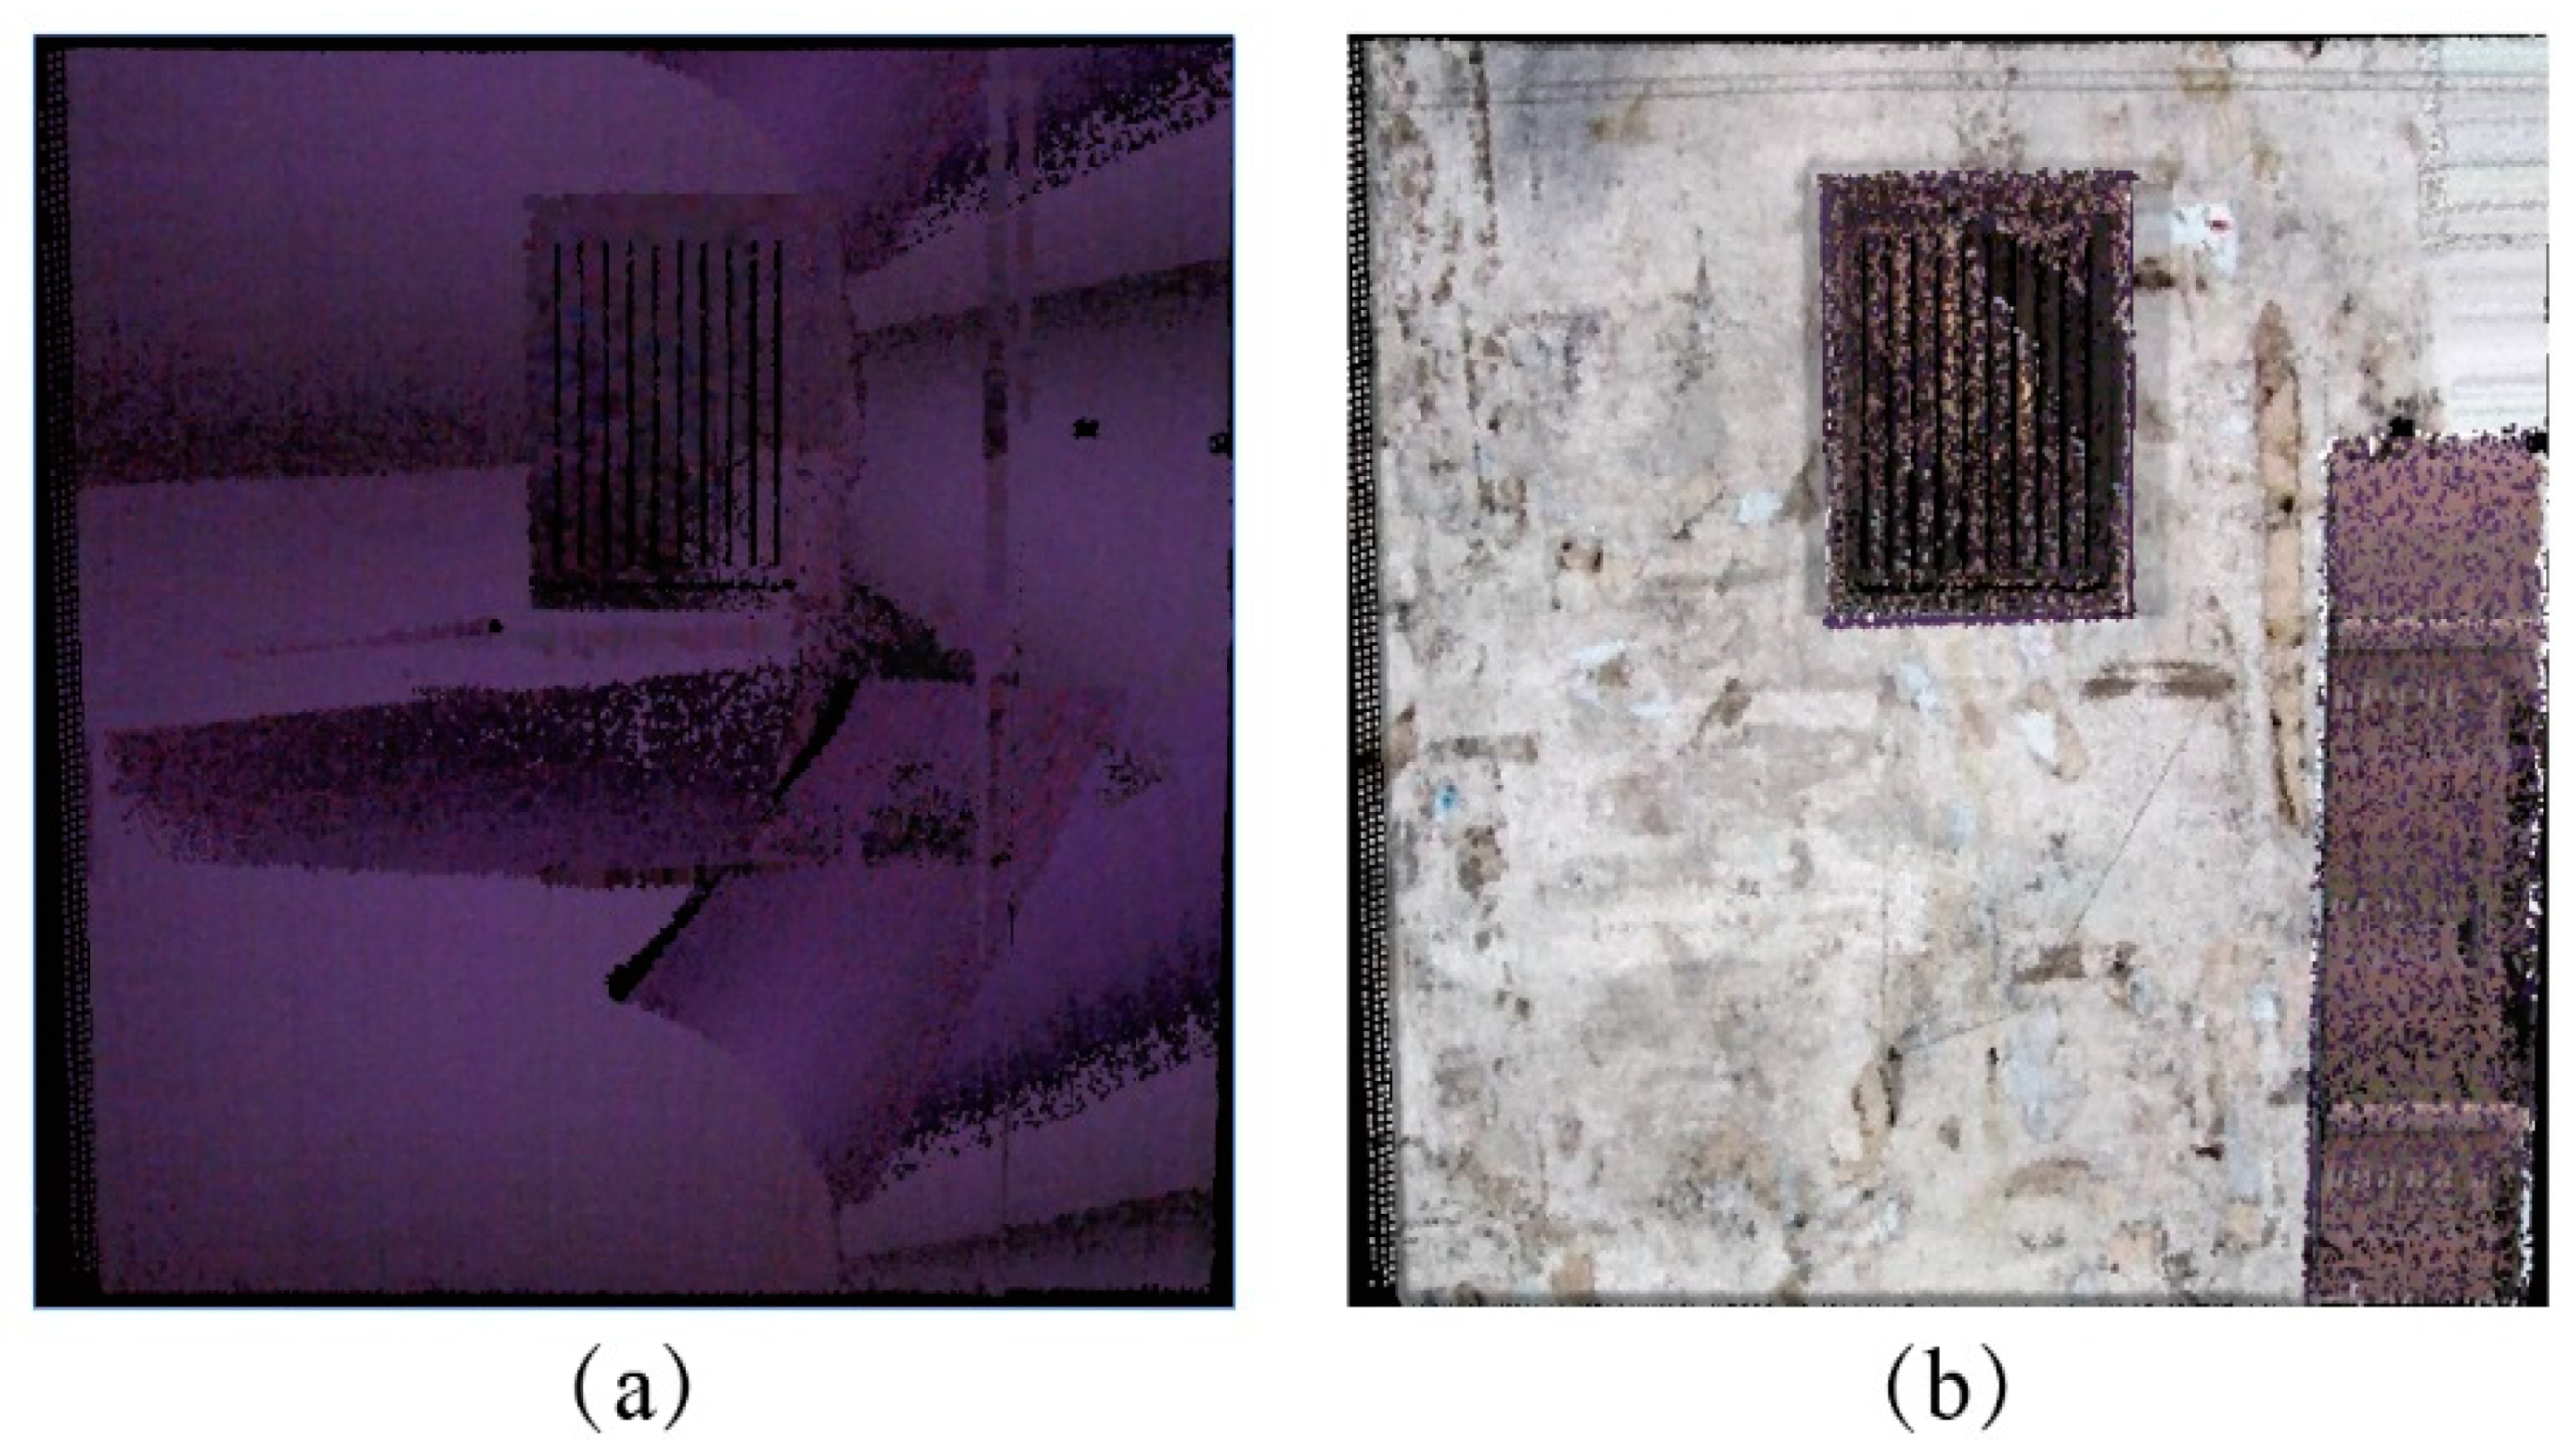
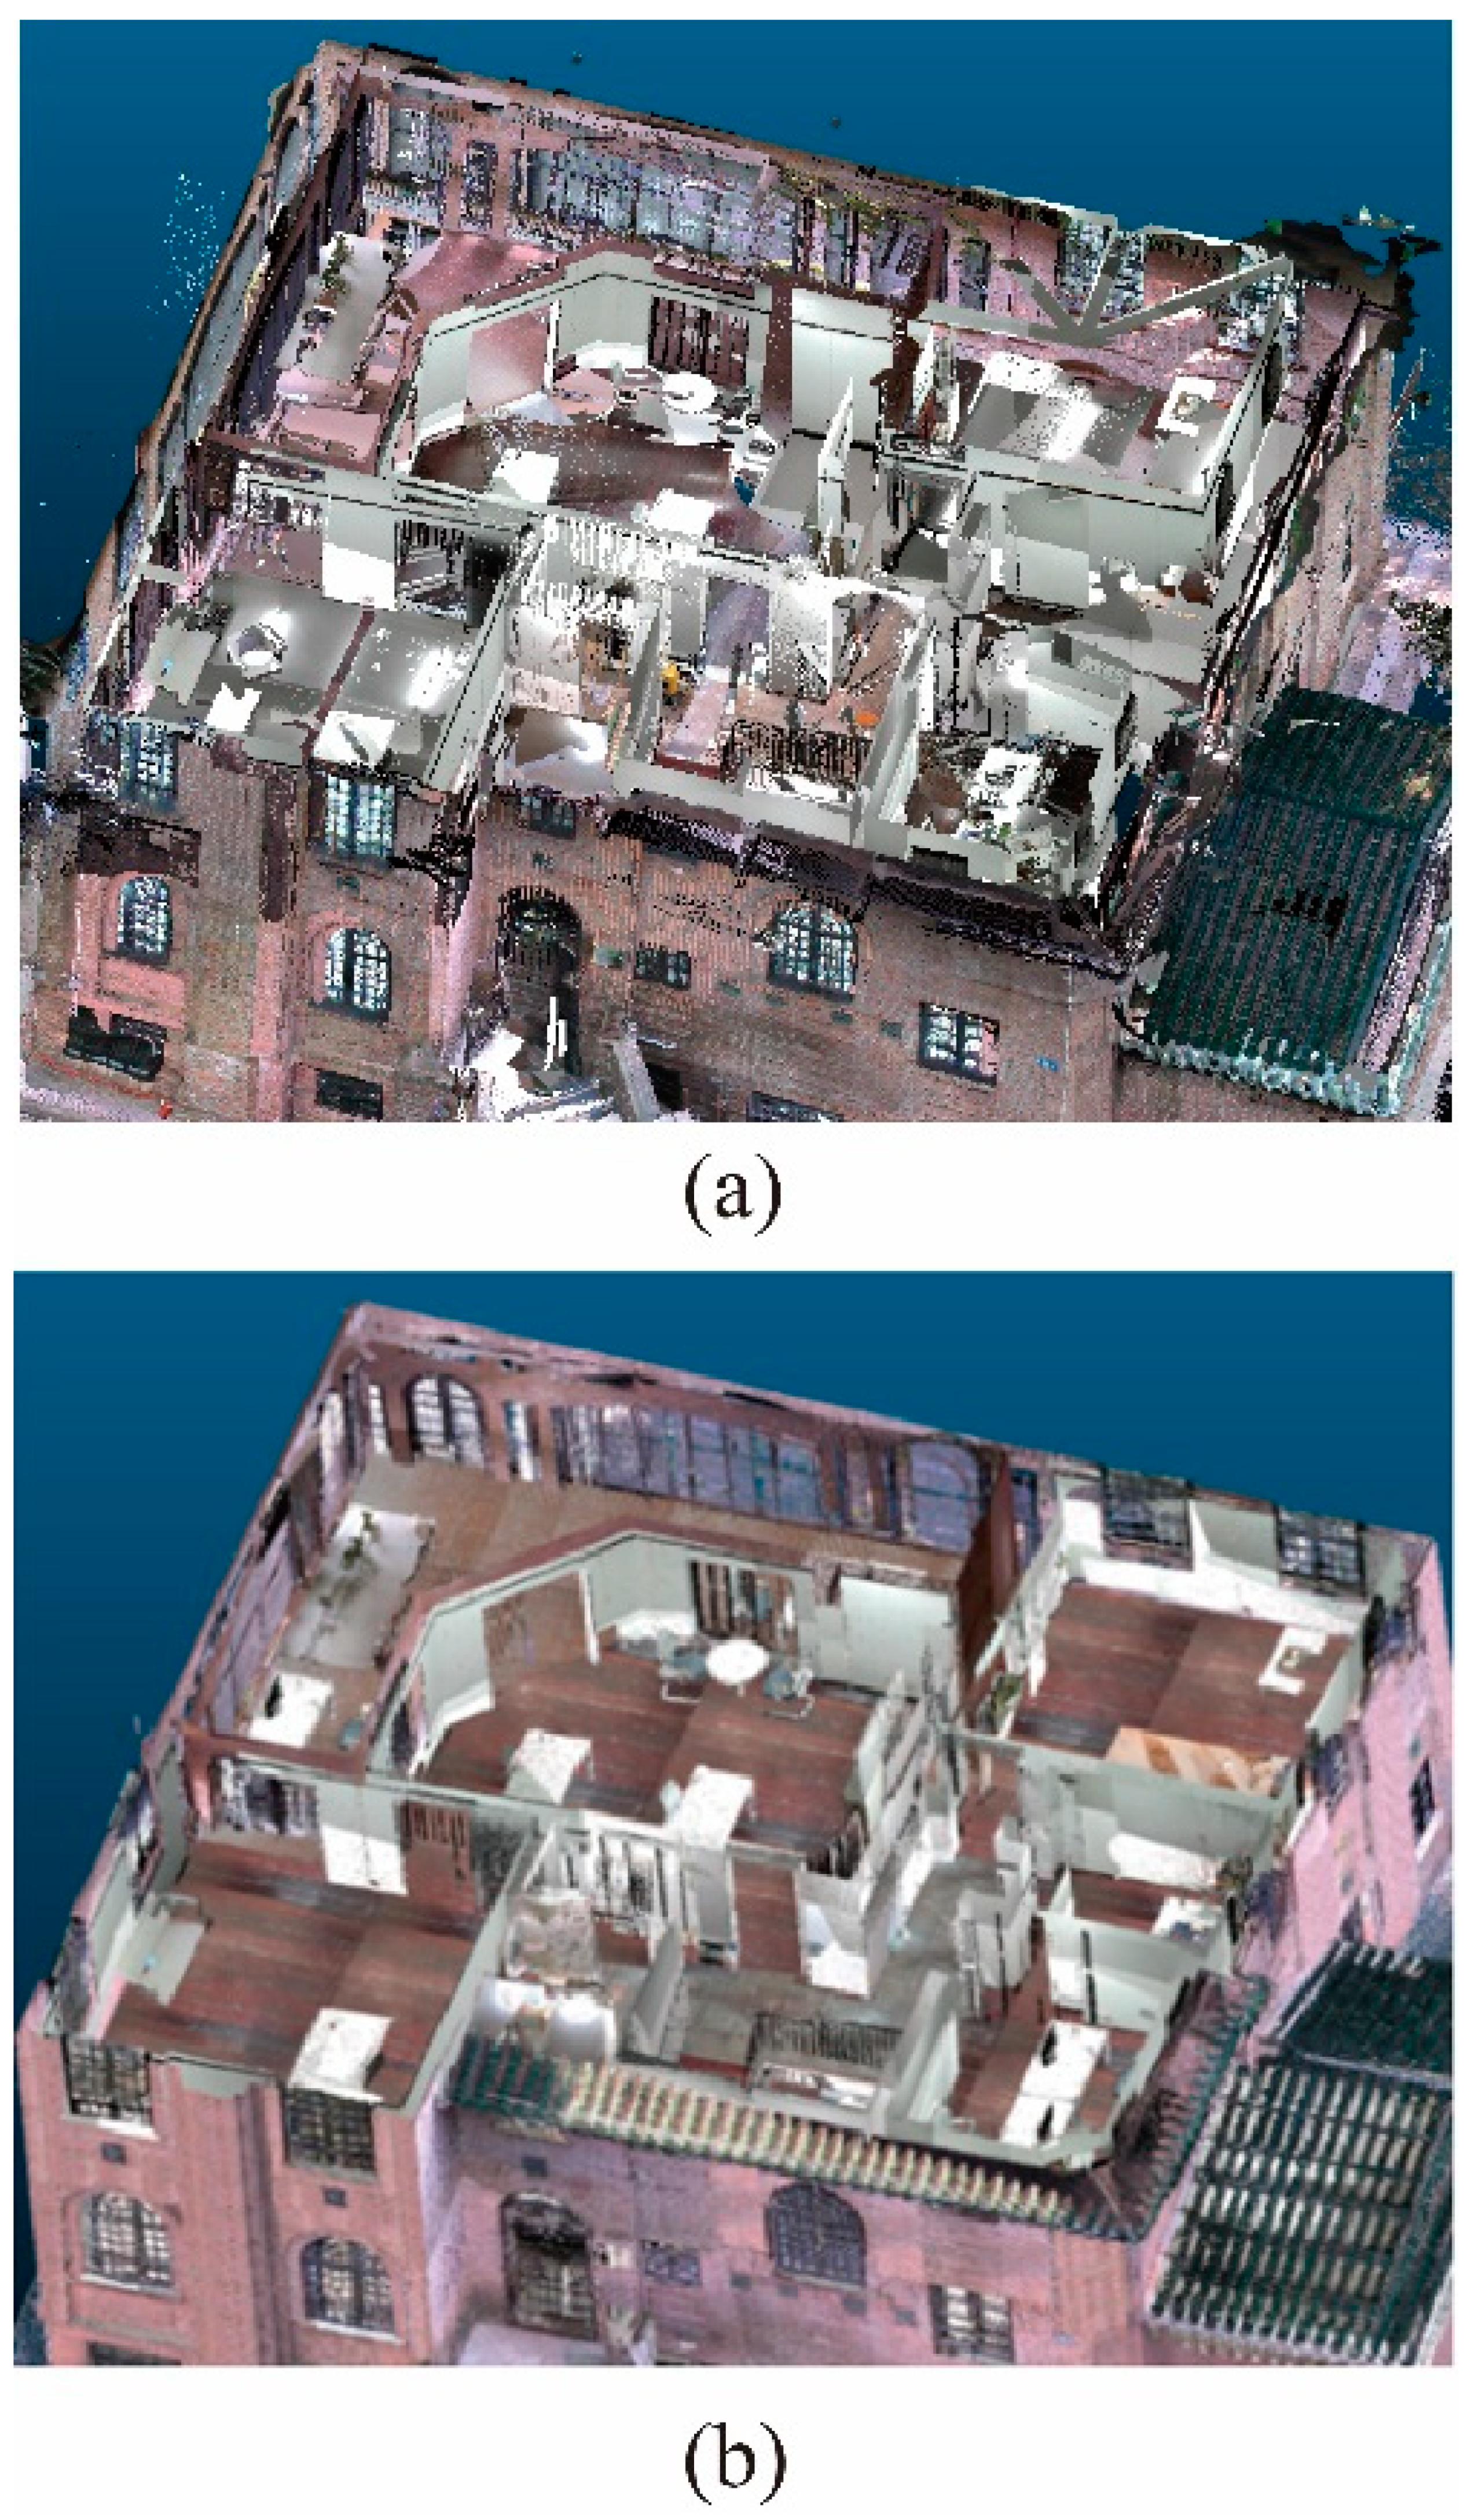
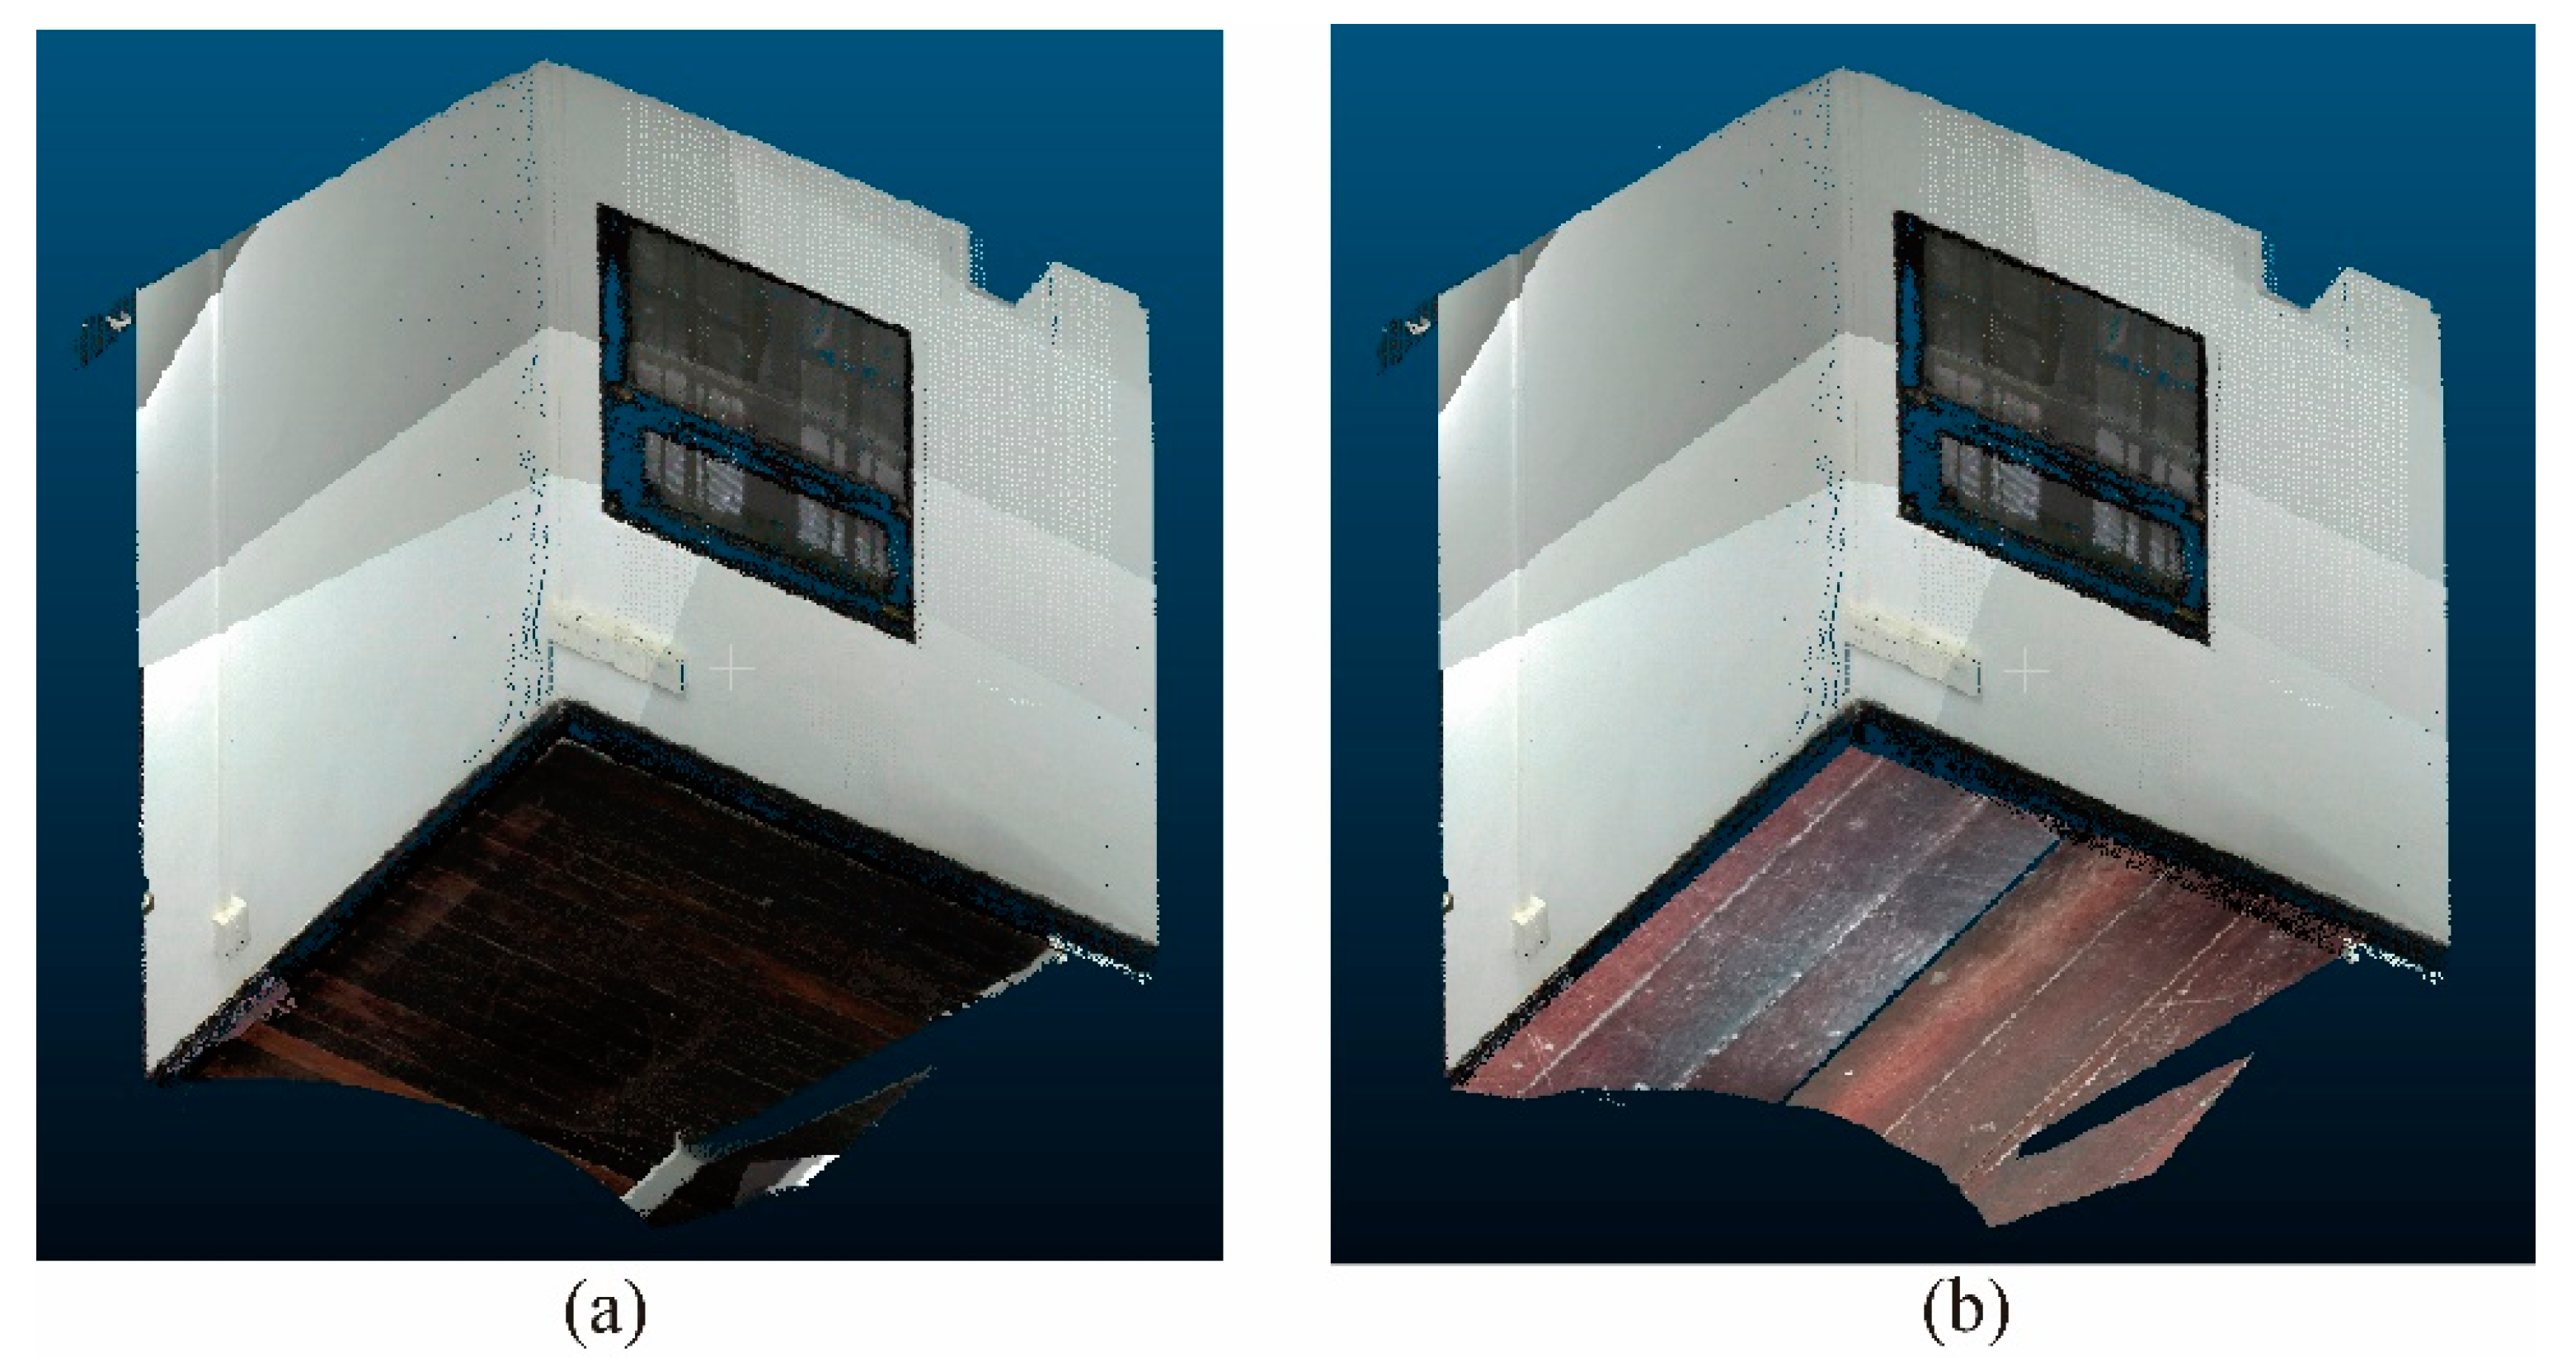
4.2. Results for the Real Data
5. Discussion
6. Conclusions
Author Contributions
Funding
Acknowledgments
Conflicts of Interest
References
- English Heritage. 3D Laser Scanning for Heritage (Second Edition): Advance and Guidance to User on Laser Scanning in Archaeology and Architecture. 2011. Available online: https://docplayer.net/1211136-3d-laser-scanning-for-heritage-second-edition-advice-and-guidance-to-users-on-laser-scanning-in-archaeology-and-architecture.html (accessed on 28 July 2021).
- Julin, A.; Kurkela, M.; Rantanen, T.; Virtanen, J.P.; Maksimainen, M.; Kukko, A.; Kaartinen, H.; Vaaja, M.T.; Hyyppä, J.; Hyyppä, H. Evaluating the quality of TLS point cloud colorization. Remote Sens. 2020, 12, 2748. [Google Scholar] [CrossRef]
- Lindsay, M. Using color effectively in computer graphics. IEEE Comput. Graph. 1999, 19, 20–35. [Google Scholar]
- Franceschi, E.; Letardi, P.; Luciano, G. Colour measurements on patinas and coating system for outdoor bronze monuments. J. Cult. Herit. 2006, 7, 166–170. [Google Scholar] [CrossRef]
- Lorenza, A.; Vittoria, B.; Rossella, C.; Domenico, V. Computer-aided monitoring of buildings of historical importance based on color. J. Cult. Herit. 2006, 7, 85–91. [Google Scholar]
- Saglam, A.; Baykan, N.A. A new color distance measure formulated from the cooperation of the Euclidean and the vector angular differences for lidar point cloud segmentation. Int. J. Eng. Sci. 2021, 6, 117–124. [Google Scholar]
- Choi, O.; Park, M.G.; Hwang, Y. Iterative k-closest point algorithms for colored point cloud registration. Sensors 2020, 20, 5331. [Google Scholar] [CrossRef]
- Ling, X. Research on building measurement accuracy verification based on terrestrial 3D laser Scanner. In Proceedings of the 2020 Asia Conference on Geological Research and Environmental Technology, Kamakura, Japan, 10–11 October 2021; Volume 632, p. 052086. [Google Scholar]
- Chai, D. A probabilistic framework for building extraction from airborne color image and DSM. IEEE J.-Stars 2016, 10, 948–959. [Google Scholar] [CrossRef]
- Keskin, G.; Gross, W.; Middelmann, W. Color-guided enhancement of airborne laser scanning data. IGARSS 2017, 4, 2617–2620. [Google Scholar]
- Awrangjeb, M.; Zhang, C.; Fraser, C.S. Automatic extraction of building roofs using LIDAR data and multispectral imagery. ISPRS J. Photogramm. Remote Sens. 2013, 83, 1–18. [Google Scholar] [CrossRef] [Green Version]
- Habib, A.F.; Kersting, J.; McCaffrey, T.M.; Jarvis, A.M. Integration of LIDAR and airborne imagery for realistic visualization of 3D urban environments. Int. Arch. Photogramm. Remote Sens. Spat. Inf. Sci. 2008, 37, 617–623. [Google Scholar]
- Förstner, W.; Wrobel, B. Mathematical concepts. In Photogrammetry; McGlone, J.C., Mikhail, E.M., Bethel, J., Mullen, R., Eds.; Manual of Photogrammetry: Bethesda, MA, USA, 2004; Volume 5, pp. 15–180. [Google Scholar]
- Crombez, N.; Caron, G.; Mouaddib, E. 3D point cloud model colorization by dense registration of dense images. Int. Arch. Photogramm. Remote Sens. Spat. Inf. Sci. 2015, 40, 123–130. [Google Scholar] [CrossRef] [Green Version]
- Pepe, M.; Ackermann, S.; Fregonese, L.; Achille, C. 3D Point cloud model color adjustment by combining terrestrial laser scanner and close range photogrammetry datasets. Int. J. Comput. Inf. Eng. 2016, 10, 1942–1948. [Google Scholar]
- Xu, C.; Katashi, N. Point Cloud Colorization Based on Densely Annotated 3D Shape Dataset; Springer: Cham, Germany, 2019; pp. 436–446. [Google Scholar]
- Arshad, M.S.; Beksi, W. A Progressive conditional generative adversarial network for generating dense and colored 3D point clouds. In Proceedings of the 2020 International Conference on 3D Vision, Fukuoka, Japan, 25–28 November 2020; Volume 5, pp. 712–722. [Google Scholar]
- Gaiani, M.; Apollonio, F.I.; Ballabeni, A.; Remondino, F. Securing color fidelity in 3D architectural heritage scenarios. Sensors 2017, 17, 2437. [Google Scholar] [CrossRef] [Green Version]
- Edler, D.; Keil, J.; Wiedenlübbert, T.; Sossna, M.; Kuhne, O.; Dickmann, F. Immersive VR experience of redeveloped post-industrial sites: The example of “Zeche Holland” in Bochum-Wattenscheid. KN J. Cartogr. Geogr. Inf. 2019, 69, 267–284. [Google Scholar] [CrossRef] [Green Version]
- Büyüksalih, G.; Kan, T.; Özkan, G.E.; Meric, M.; Isin, L.; Kersten, T.P. Preserving the knowledge of the past through virtual visits: From 3D laser scanning to virtual reality visualization at the Istanbul Çatalca İnceğiz Caves. PFG 2020, 88, 133–146. [Google Scholar] [CrossRef]
- Lezzerini, M.; Antonelli, F.; Columbu, S.; Gadducci, R.; Marradi, A.; Miriello, D.; Parodi, L.; Secchiari, L.; Lazzeri, A. Cultural heritage documentation and conservation: Three-dimensional (3D) laser scanning and geographical information system (GIS) techniques for thematic mapping of facade stonework of St. Nicholas Church (Pisa, Italy). Int. J. Archit. Herit. 2016, 10, 9–19. [Google Scholar] [CrossRef]
- Qian, X.; Ye, C. NCC-RANSAC: A fast plane extraction method for 3D range data segmentation. IEEE Trans. Cybern. 2014, 44, 2771–2783. [Google Scholar] [CrossRef]
- Zhang, W.; Qi, J.; Wan, P.; Wang, H.; Xie, D.; Wang, X.; Yan, G. An easy-to-use airborne LiDAR data filtering method based on cloth simulation. Remote Sens. 2016, 8, 501. [Google Scholar] [CrossRef]
- Friedman, J.H.; Bentley, J.L.; Finkel, R.A. An algorithm for finding best matches in logarithmic expected time. ACM Trans. Math. Softw. 1977, 3, 209–226. [Google Scholar] [CrossRef]
- Demantké, J.; Mallet, C.; David, N.; Vallet, B. Dimensionality based scale selection in 3D LiDAR point cloud. Int. Arch. Photogramm. Remote Sens. Spat. Inf. Sci. 2011, 37, 97–102. [Google Scholar] [CrossRef] [Green Version]
- Chelishchev, P.; Sørby, K. Estimation of minimum volume of bounding box for geometrical metrology. Int. J. Metrol. Qual. Eng. 2020, 11, 9. [Google Scholar] [CrossRef]
- Klapa, P.; Mitka, B. Edge efect and its impact upon the accuracy of 2d and 3d modelling using laser scanning. Geomat. Landmanag. Landsc. 2017, 1, 25–33. [Google Scholar] [CrossRef]


| Param. | μ (m) | xp (m) | yp (m) | c (m) | Xc (m) | Yc (m) | Zc (m) | Ω (°) | Φ (°) | Κ (°) |
|---|---|---|---|---|---|---|---|---|---|---|
| Value | 1.37 × 10⁻⁵ | 10−5 | 10−5 | 4 × 10⁻³ | 0 | 1,3,5,7,9,11,13,15 | 0 | 90 | 0 | 0 |
| Site | Area (m2) | Number of Scans | Number of Images |
|---|---|---|---|
| Zou Lu House | 1352 | 21 | 389 |
| Wesley House | 406 | 32 | 582 |
| Datasets | Planar Feature | Original Point Cloud (Unitless) | Colorized Point Cloud without CIA (Unitless) | Colorized Point Cloud without CIA (Unitless) |
|---|---|---|---|---|
| Zou Lu House | 1 | 235 | 371 | 626 |
| 2 | 293 | 407 | 583 | |
| Wesley House | 3 | 1034 | 1201 | 1395 |
| 4 | 311 | 427 | 548 |
Publisher’s Note: MDPI stays neutral with regard to jurisdictional claims in published maps and institutional affiliations. |
© 2021 by the authors. Licensee MDPI, Basel, Switzerland. This article is an open access article distributed under the terms and conditions of the Creative Commons Attribution (CC BY) license (https://creativecommons.org/licenses/by/4.0/).
Share and Cite
Chan, T.O.; Xiao, H.; Liu, L.; Sun, Y.; Chen, T.; Lang, W.; Li, M.H. A Post-Scan Point Cloud Colorization Method for Cultural Heritage Documentation. ISPRS Int. J. Geo-Inf. 2021, 10, 737. https://doi.org/10.3390/ijgi10110737
Chan TO, Xiao H, Liu L, Sun Y, Chen T, Lang W, Li MH. A Post-Scan Point Cloud Colorization Method for Cultural Heritage Documentation. ISPRS International Journal of Geo-Information. 2021; 10(11):737. https://doi.org/10.3390/ijgi10110737
Chicago/Turabian StyleChan, Ting On, Hang Xiao, Lixin Liu, Yeran Sun, Tingting Chen, Wei Lang, and Ming Ho Li. 2021. "A Post-Scan Point Cloud Colorization Method for Cultural Heritage Documentation" ISPRS International Journal of Geo-Information 10, no. 11: 737. https://doi.org/10.3390/ijgi10110737
APA StyleChan, T. O., Xiao, H., Liu, L., Sun, Y., Chen, T., Lang, W., & Li, M. H. (2021). A Post-Scan Point Cloud Colorization Method for Cultural Heritage Documentation. ISPRS International Journal of Geo-Information, 10(11), 737. https://doi.org/10.3390/ijgi10110737