Article

Study on the Impact of the COVID-19 Pandemic on the Spatial Behavior of Urban Tourists Based on Commentary Big Data: A Case Study of Nanjing, China

1
School of Architecture and Urban Planning, Nanjing University, Nanjing 210093, China
2
Institute of Geographic Sciences and Natural Resources Research, CAS, Beijing 100101, China
*
Author to whom correspondence should be addressed.
ISPRS Int. J. Geo-Inf. 2021, 10(10), 678; https://doi.org/10.3390/ijgi10100678
Submission received: 15 August 2021 / Revised: 4 October 2021 / Accepted: 5 October 2021 / Published: 7 October 2021
(This article belongs to the Special Issue Geovisualization and Social Media)

Abstract

:
The global outbreak of the COVID-19 epidemic has caused a considerable impact on humans, which expresses the urgency and importance of studying its impacts. Previous studies either frequently use aggregated research methods of statistic data or stay during COVID-19. The afterward impacts of COVID-19 on human behaviors need to be explored further. This article carries out a non-aggregated study methodology in human geography based on big data from social media comments and takes Nanjing, China, as the research case to explore the afterward impact of the COVID-19 epidemic on the spatial behavior of urban tourists. Precisely, we propose the methodology covers two main aspects regarding travel contact trajectory and spatial trajectory. In contact trajectory, we explore three indicators—Connection Strength, Degree Centrality, and Betweenness Centrality—of the collected attractions. Then, in spatial trajectory, we input the results from contact trajectory into ArcGIS by using the Orientation–Destination Model and Standard Deviation Ellipse to explore the influences on the spatial pattern. By setting up comparative groups for the three periods of before, during, and after the COVID-19 in Nanjing, this study found that, in the post-epidemic era, (1) the spatial behavior of urban tourists showed a state of overall contraction; (2) the objects of contraction changed from urban architectural attractions to urban natural attractions; (3) the form of contraction presents concentric circles with the central city (Old City of Nanjing) as the core; (4) the direction of contraction heads to the large-scale natural landscape in the central city, which highlights the importance of green open spaces in the post-epidemic era.

1. Introduction

The COVID-19 epidemic that broke out in early 2020 has become a global public health event with a tremendous impact on human history [1]. The unique long incubation period, high transmission, and vast influence of the epidemic [2] forced the Chinese government to implement a nationwide joint prevention and control mechanism from 25 January 2020 and actively intervene in epidemic prevention and control through solid administrative interventions. Since the outbreak of the epidemic in China was during the “Spring Festival” period, the prevention and control of the epidemic actively “cut off” the free flow of about 1.2 billion people across the country and 22 provinces at that time [3]. Moreover, with the continuous development of the epidemic, the intensity of prevention and control has continued to rise. The World Health Organization (WHO) quickly classified the spread of the new crown epidemic as a global plague on 11 March 2020 [4]. Since then, a race to block borders has been launched among countries around the world. Therefore, some Chinese scholars claim that the COVID-19 epidemic has affected the openness of various countries to a certain extent and has deepened the “anti-globalization” trend of thought caused by the 2008 financial crisis [5].
In such a drastically changing external environment, scholars have begun to conduct much research on the impact of the epidemic. From a psychological perspective, some scholars believe that the global spread of the COVID-19 epidemic has had a severe impact on people’s mental health, with increased anxiety, fear, mental stress, and insomnia [6,7], and found that men and women affected by the epidemic show the different psychological feelings [8]. The living style of urban parks or gardens would moderately reduce people’s anxiety and improve the happiness index during the epidemic period [9,10]. Some scholars analyzed the communication mechanism of the hot spots of the COVID-19 epidemic among the public from the perspective of communication and provided references for public opinion and risk management [11]. In addition, some geographers and urban planners have already carried out the studies on the impacts of COVID-19 on residents’ behaviors and related urban spaces. For instance, Venter et al. used the mobile tracking data of the STRAVA users in Oslo, Norway, and associated with an analysis combining Google mobility and Normalized Difference Vegetation Index (NDVI), they emphasized the importance of green open spaces during the lockdown time of COVID-19 [12]. Zecca et al. used site survey to confirm the changes of residents’ pedestrian behaviors related to urban services in Scotland before and during COVID-19 [13]. Sun et al. assessed the spatial relationship between the COVID-19 outbreak and the crime rate in London [14]. Irawan et al. analyzed the changes of residents’ travel behavior by using an online survey during the outbreak of COVID-19 in Indonesia [15]. As the COVID-19 epidemic continues to spread and its duration continues to lengthen, research has also gone from more resident-focus and the in-time public opinion to the relatively indirect effects of the epidemic on macro international relations, national economy, and industrial development. As an industry that is highly sensitive to politics, economy, natural disasters, public health, social security, and other crisis events [16], tourism is one of the focuses of geography and urban planning research in the post-epidemic era.

1.1. Pandemics and Tourism

Due to the level of scientific development, the fragmented geographical research viewpoints, and the randomness of the time of the global epidemic, many studies on epidemics and tourism happened to appear after the SARS epidemic in 2003 [17,18]. Since then, scholars have begun to pay attention to the research on the impact of significant epidemics on the tourism industry, such as the H1N1, Ebola [19,20], and H5N1 epidemics [21]. However, studies have shown that the epidemics that broke out before COVID-19 had limited impacts on the tourism industry [22]. Scholars believe that the main reason for the insignificant impact is that compared with the COVID-19 epidemic, these epidemics have not shown such high transmission and long-term persistence, so governments at all levels have not implemented the strict administrative closure measures such as the ones that the COVID-19 epidemic caused. Therefore, the previous pandemics just caused a slight impact on tourism-related industries such as travel agencies, airlines, hotels, etc. [23]. From the negative side, it was also shown that the government’s unprecedented “blockades” after the COVID-19 epidemic have indeed brought new challenges to the tourism industry. It is vital to re-examine the impact of the severe public health crisis on the tourism industry [24].
Most of the previous studies have been carried out from the perspectives of tourism awareness, tourist flow, tourism revenue, etc., from a quantitative perspective on the mechanism of the epidemic’s impact on the tourism industry. For example, Lee et al. studied the impact of the H1N1 epidemic on tourists’ travel awareness [25]. Lee and Chen, Mao et al., and Cooper studied the impact of the SARS epidemic on tourist flow [26,27,28], while Kuo et al. studied the impact of SARS and poultry with a comparative study on the flow of inbound and arrival international tourists [29]; Chen mapped the impact of the SARS epidemic on the tourism industry by studying the changes in hotel income [30]. In general, previous studies have primarily focused on the aggregation level of various statistical data. Although they can reflect the impact of the epidemic on the tourism industry to a certain extent, they are limited by the clustering attributes of the aggregated data, making it so that most of the research can only stay at a relatively macro-regional scale.
Fewer scholars have researched a more micro level. For example, Wen et al. used consumer behavior changes as the perspective [31] to study the impact of the SARS epidemic on tourists’ travel preferences and leisure travel characteristics; Hu et al. also followed this clue to explore expectations of hotel consumers for hotel services at different development stages of the COVID-19 epidemic [32]. These studies, in fact, respect the perspective of traditional behavioral geography that can more fully describe the impact of the epidemic on individual tourists. The research idea of this article also respects this traditional thinking of behavioral geography.

1.2. Tourist Behavior and Social Media Big Data

The study on tourist behavior is an important research direction in behavioral geography, which focuses on the relationship between tourist activities, tourist behavior patterns, and the physical environment [33]. As an essential type of human activity, the study of tourist behavior is also carried out in the overall context of human geography. Especially after the Second World War, the experience of human geography in the 1960s and 1970s criticized the overemphasis on the fundamental axiomatic characteristics in traditional space science methods [34]. Furthermore, the viewpoint that “sees human behavior as a series of events that are relatively stable and recurring” is revised from the study of the form that emphasizes human activities to the study of the process of action [35] (p. 2). Under the influence of such humanism and postmodernism, the research of human geography has shifted from describing social phenomena in the early stage to explaining and answering social problems, and the object of research has also changed from “spatial behavior” to “behaviors in spaces” [36,37].
The introduction of the concept of “time and space” has accelerated the development of behavioral geography. Hagerstrand put forward the concept of “temporal and spatial constraints” in 1970, which established and expanded the theoretical premise of behavioral geography research. It is believed that human behavior or activity influences are subject to three types of constraints in time and space: (1) Ability constraints: tools, organs, or cognitive premises restrict the expansion of human behavior in time and space; (2) Combination constraints: combination with others or intermediate materials restricts the expansion of human behavior in time and space; (3) Authority constraints: laws, rules, and standards restrict the development of human behavior in time and space [38]. Since then, human geographers from all over the world have conducted group behavior research on different types of people in different countries under the three constraints of the general background of the transition to non-aggregated analysis, from the dimension of “temporal and spatial” [34], regarding consumers [39,40], commuters [33], genders [41,42], tourists [43,44,45], vulnerable groups [46], and other groups.
Although it has undergone a shift in the overall research logic of human geography in the 1970s, it was limited by the information acquisition, information processing, and computing power at that time. The classic “space–time prism” research methods [47] and travel diary methods encounter inapplicability when studying tourist groups that are more mobile than residents. It was not until the beginning of the 21st century that the technological development of ICT-related fields such as the Global Positioning System (GPS), Location Based Services (LBS), and the Geo-Information system (GIS) changed the research paradigm of tourist behavior [48,49,50,51]. The research scale is gradually reduced to the middle and micro levels such as the city’s interior, between tourist attractions, and the interior of tourist attractions [52,53,54,55]. Later, with the emerging development of social media and big data technology, it has further made it possible to focus more on the activities of micro-individuals [12,56,57], emotions [58], and other information in time and space. For example, the study of tourist behavior based on the previous changes in spatial behavior with spatial coordinates has added research paradigms from the perspective of tourist mood, such as using the Bayesian model in the sentiment analysis [59], photo-based analysis [60,61,62], and applying more efficient machine learning system in real-time camera monitoring analysis [63].

1.3. The Aim of this Study

From the perspective of the actual occurrence of the COVID-19 epidemic, governments of various countries have adopted administrative solid blockade measures first to change the “Authority Constraint” conditions of tourists’ travel behavior. Then, thereby making the “Combination Constraints” required to complete the entire travel behavior subject to the unprecedented restrictions, so the “Ability Constraints” that ultimately affect the behavior of tourists to a certain extent can be described as a comprehensive reconstruction of the three constraints that affect human behavior. Therefore, it is particularly urgent to observe, capture, and analyze the impact of COVID-19 on tourists’ spatial behavior and provide scientific guidance for the revival of urban tourism and the restoration of overall social dynamics in the post-epidemic era.
The author reviews the previous studies regarding themes of the epidemic, tourist, and spatial behavior, and we think most of them concentrate on aggregated methods and seldom use the non-aggregated method which looks deeply into the individuals’ activities. In addition, a large number of studies on the influences of COVID-19 on spatial behavior focus on the period during the epidemic [12,13,14,15]. More research that assesses the afterward impacts of the COVID-19 epidemic should be carried out. Therefore, this article respects these formal conditions and research gaps, carries out a non-aggregated method, and chooses a case study in China where the epidemic has been fully alleviated, to fill this research gap. It will use big data of tourist behavior as the primary data sample, apply the method of Social Network Analysis (SNA) from society research to study tourist behavior, and combine geo-visualization analysis in ArcGIS to explore the changes in the spatial behavior of urban tourists before and after the COVID-19 epidemic. Furthermore, in terms of space selection and quality characteristics, it provides the city with a supply direction that is more in line with the selection behavior of tourists in the post-epidemic era.

2. Materials and Methods
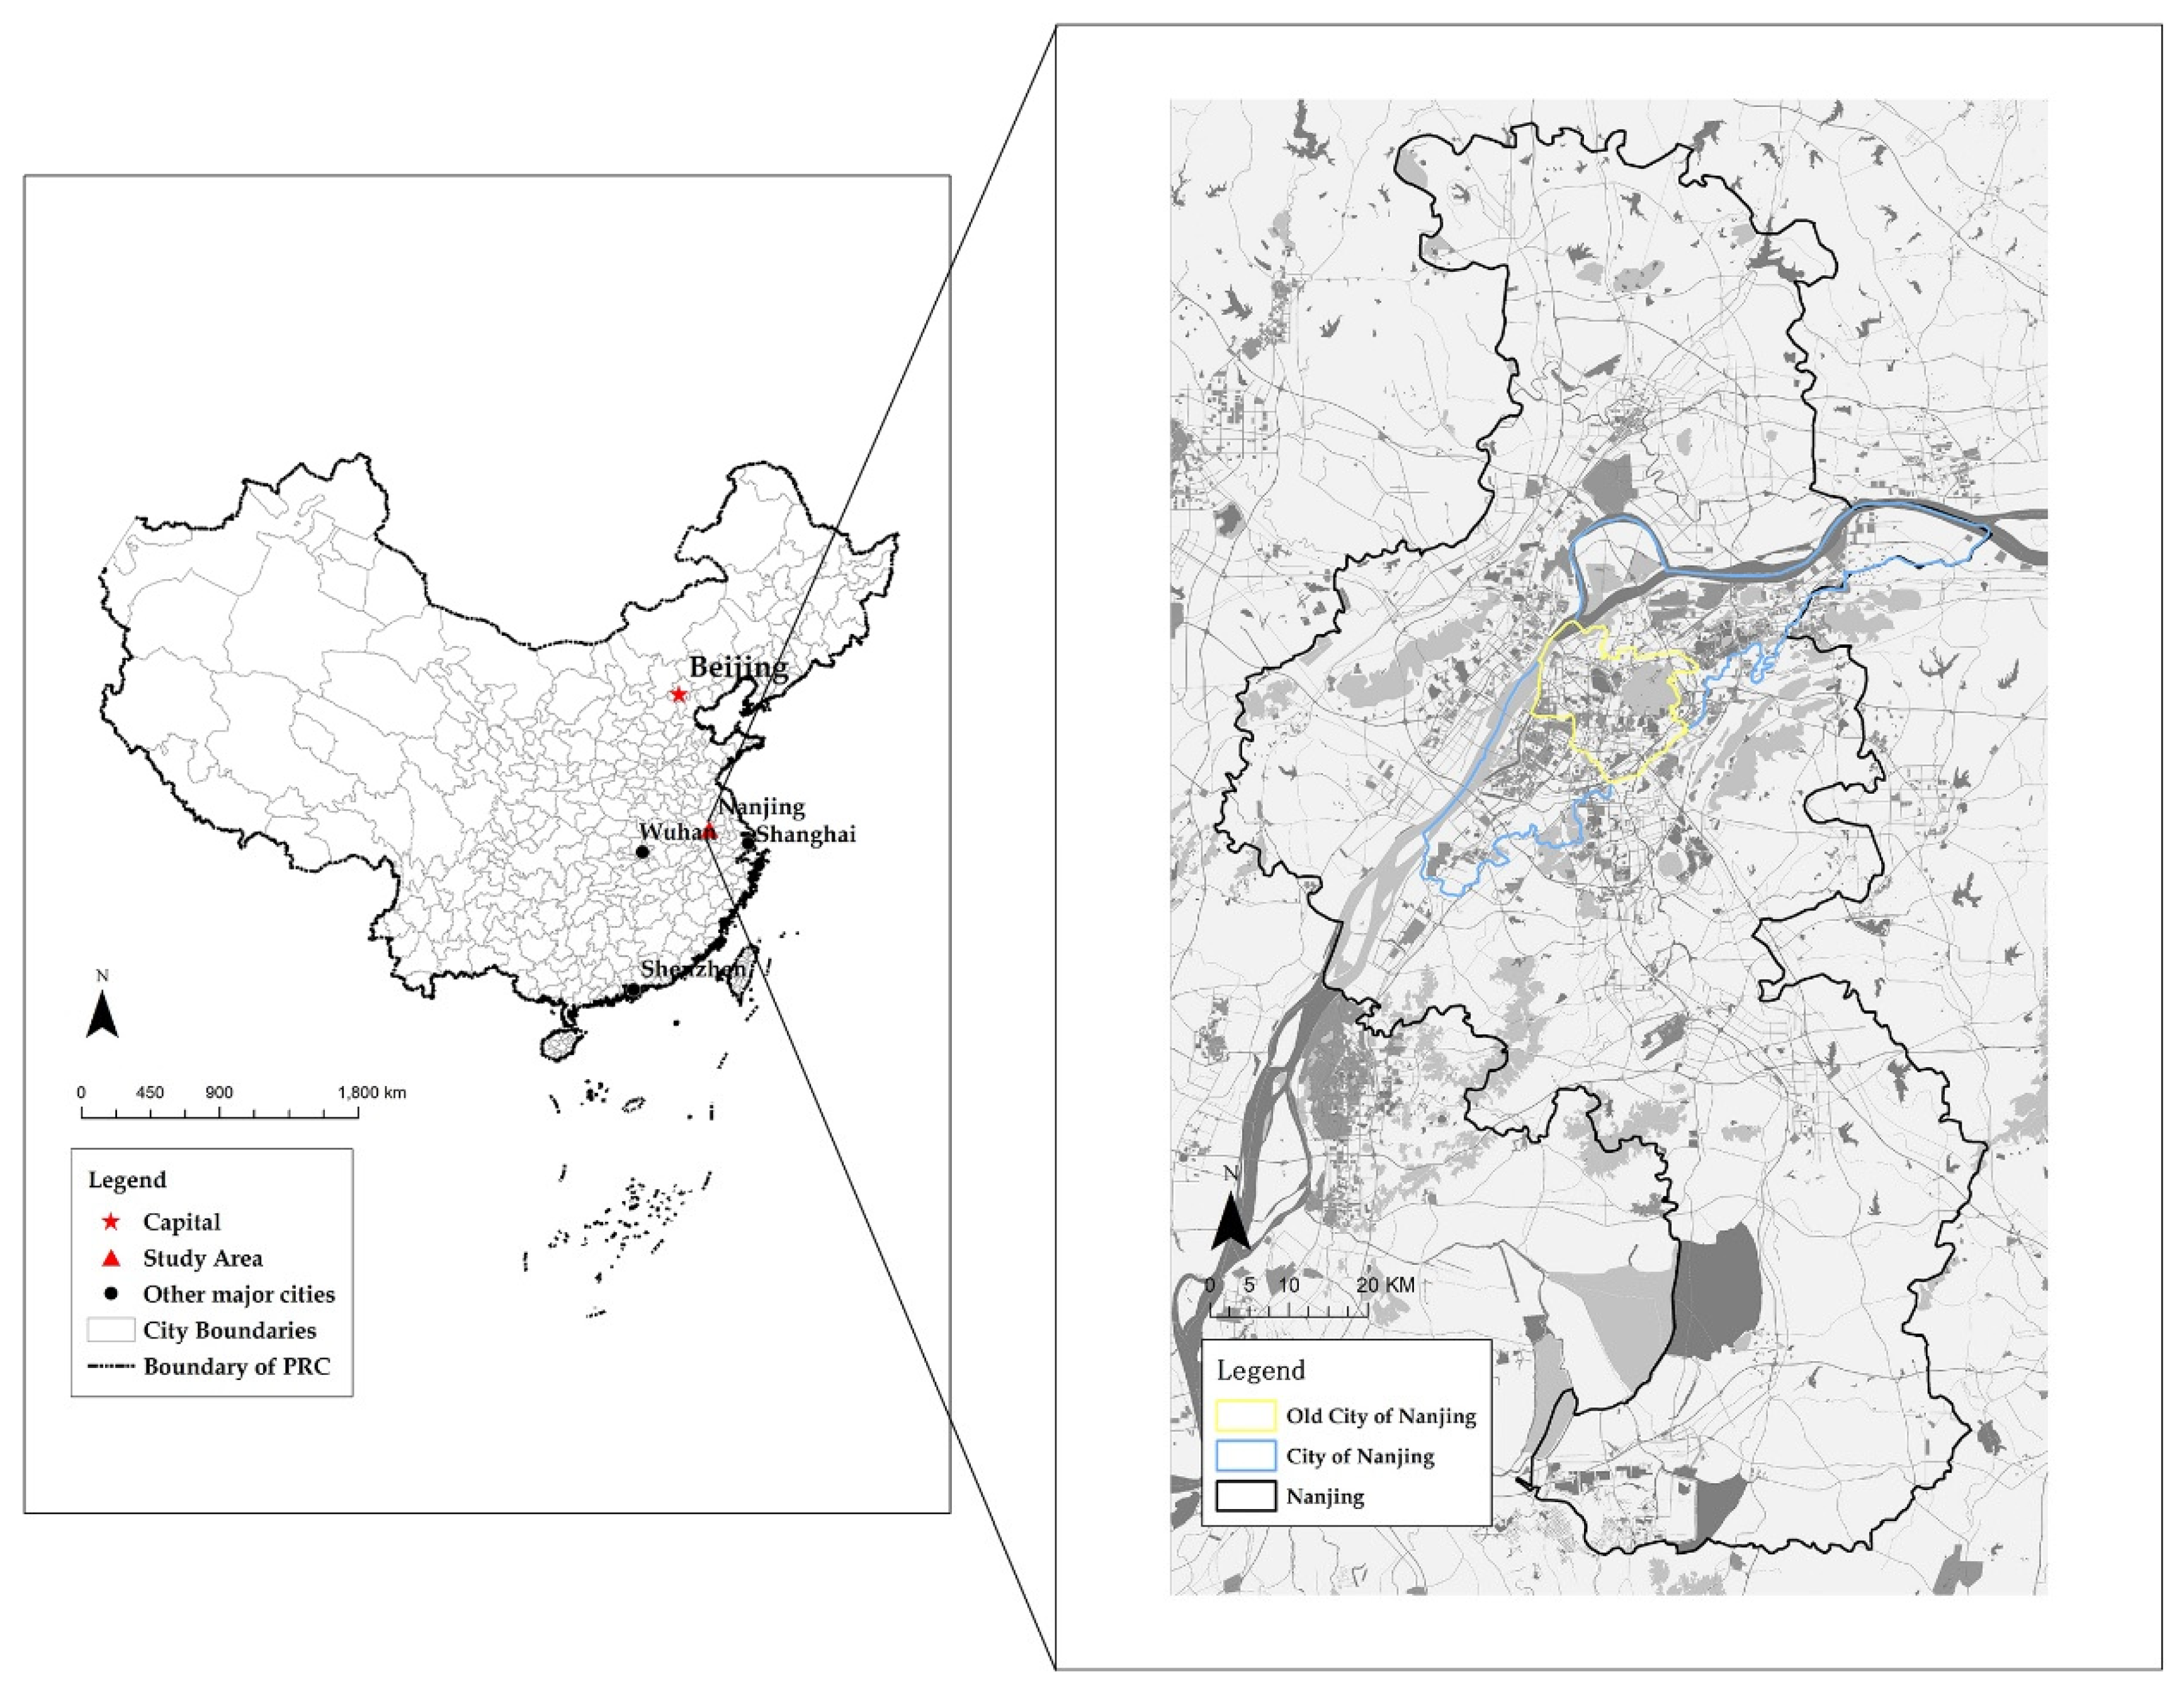
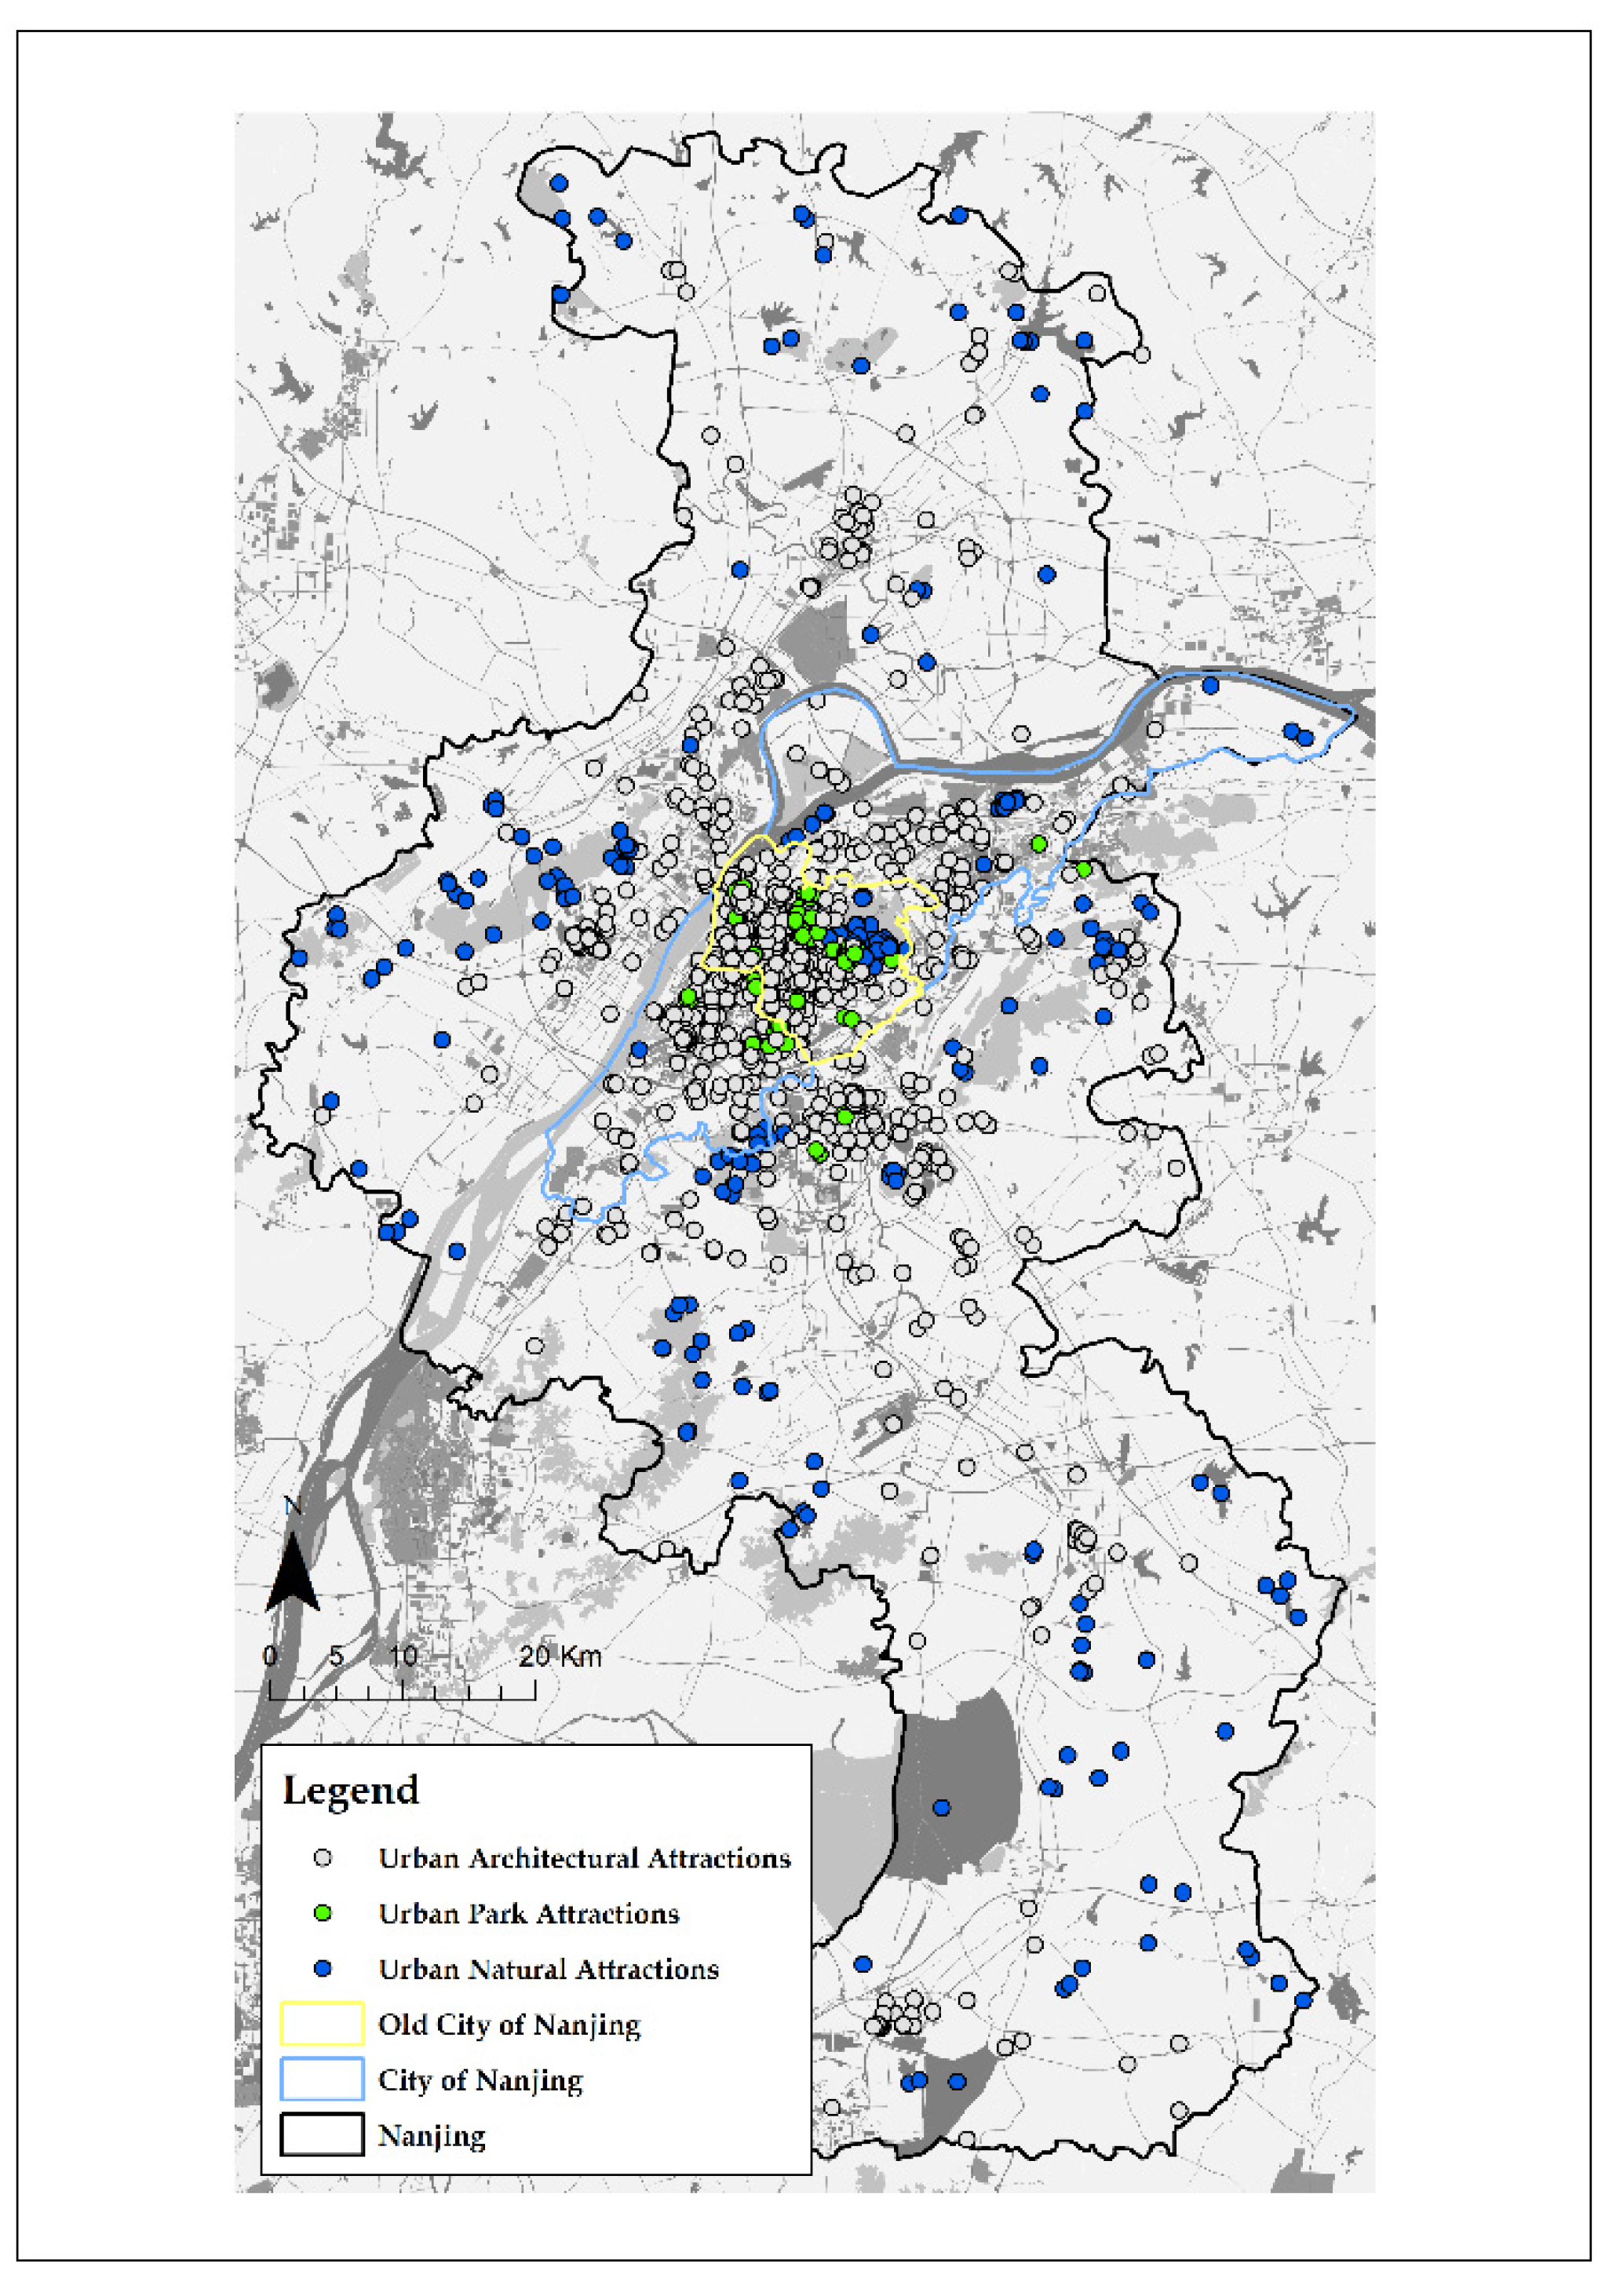
2.1. Study Area

This article takes Nanjing City (32′04” N, 118′77” E) as the research object, located in the eastern coastal area of China (Figure 1). Nanjing is an important historical and cultural city and the first batch of great tourist cities in China, which has one world cultural heritage and two national 5A-level scenic spots. In 2020, it had received 150 million domestic and foreign tourists and achieved a total tourism income of CNY 300 billion. It is an important tourist destination city in China. Therefore, the selection of Nanjing City as the empirical case for this study has particular research value and practical significance.
According to the development history of Nanjing City, it can be divided into three different patterns within the city with different landscapes and lifestyles (Figure 1). At the center of Nanjing city is the Old City of Nanjing, representing the very beginning of the development in Nanjing City, which still has the most popular commercial centers and recreational areas of Nanjing. Surrounding the Old City of Nanjing is the City of Nanjing, which acts as the new districts or suburbs of Nanjing City. More and more residents are moving to these areas regarding the new decentralization policy to relieve the overcrowded living environment in the Old City of Nanjing. The rest is the rural area of Nanjing, with a large number of natural attractions and countryside landscapes.

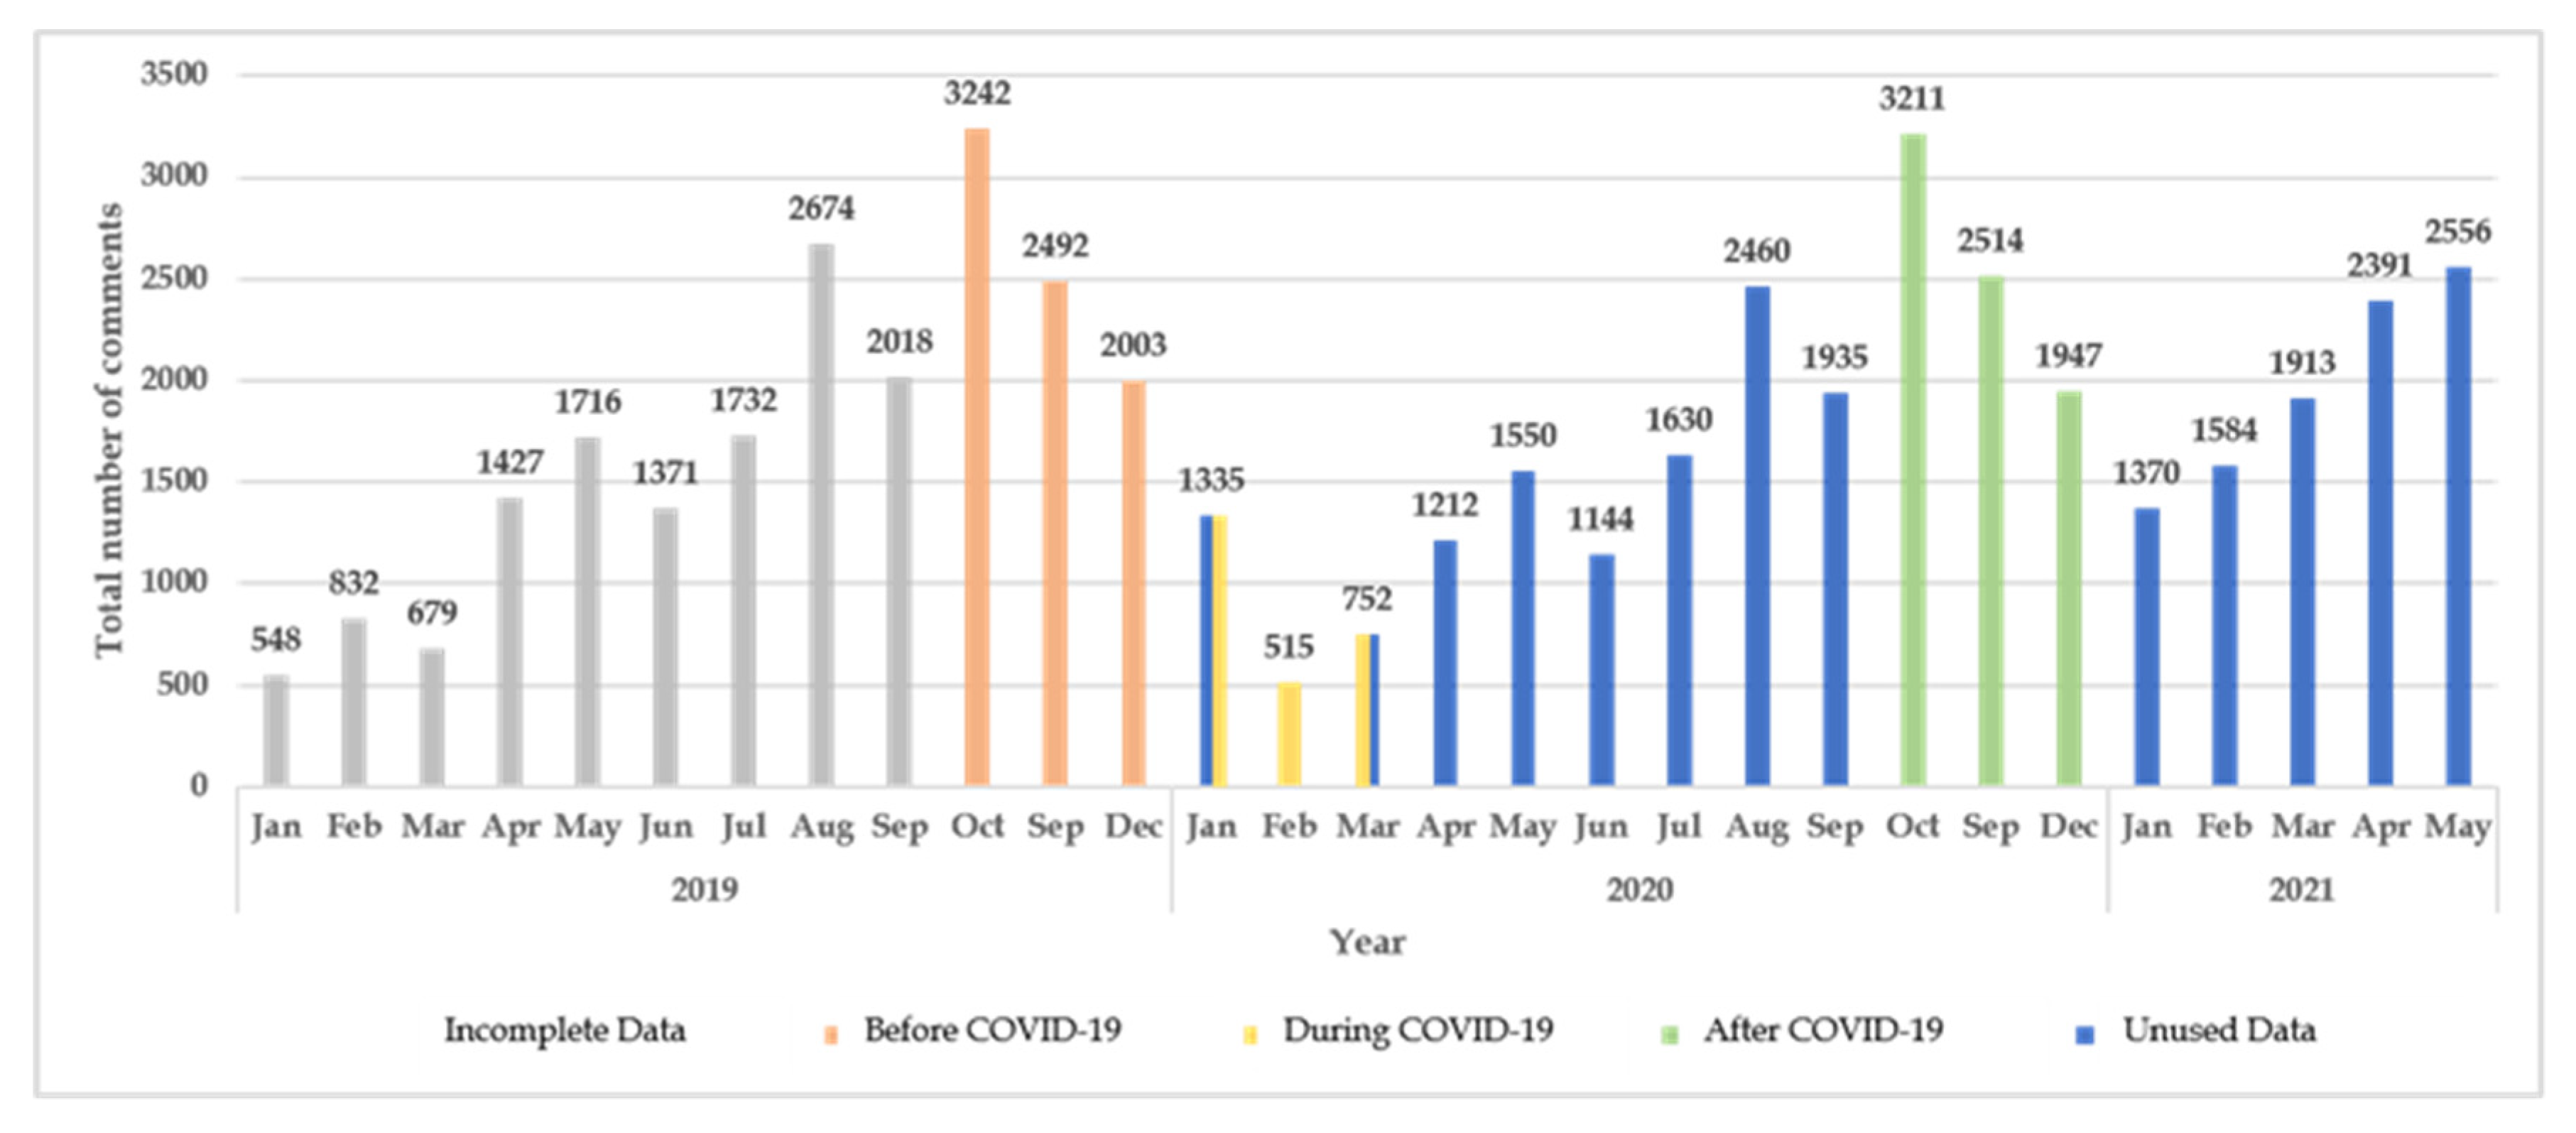
2.2. Data Collection

This article uses Ctrip as the leading source platform for data acquisition. Ctrip, an established online ticketing service company in China, was founded in 1999 and listed on the NASDAQ in December 2003. At present, Ctrip has expanded into a tourist social and sharing consultation platform integrating hotel reservations, air ticket reservations, scenic spot reservations, travel notes, and comments. In 2018, Ctrip’s total annual transaction users reached 135 million, with absolutely high user activity and usage.
On the Ctrip website (https://you.ctrip.com/sight/nanjing9.html, accessed on 4 June 2021), a total of 1707 tourist attractions and their addresses in Nanjing are included (the longitude and latitude information can be obtained through geocoding), and the comment information uploaded by tourists is opened under the webpage of each attraction. Each comment information includes the visitor’s ID (website registration), comment time, and comment content, which provides temporal and spatial data support for studying the spatial behavior of tourists. The author uses Python language for program development, uses the selenium framework to automate the operation of the browser, crawls the URL of each attraction, simulates the interface of looping access to all comment information, and obtains the source code. Then, the author uses the lxml library to convert into xpath nodes for interpretation, extracts the information of 1707 attractions in Nanjing on Ctrip.com before 1 June 2021, and a total of 97,346 commentary data from the website of the attraction pages were taken as the research sample for this research (data samples see Table 1).

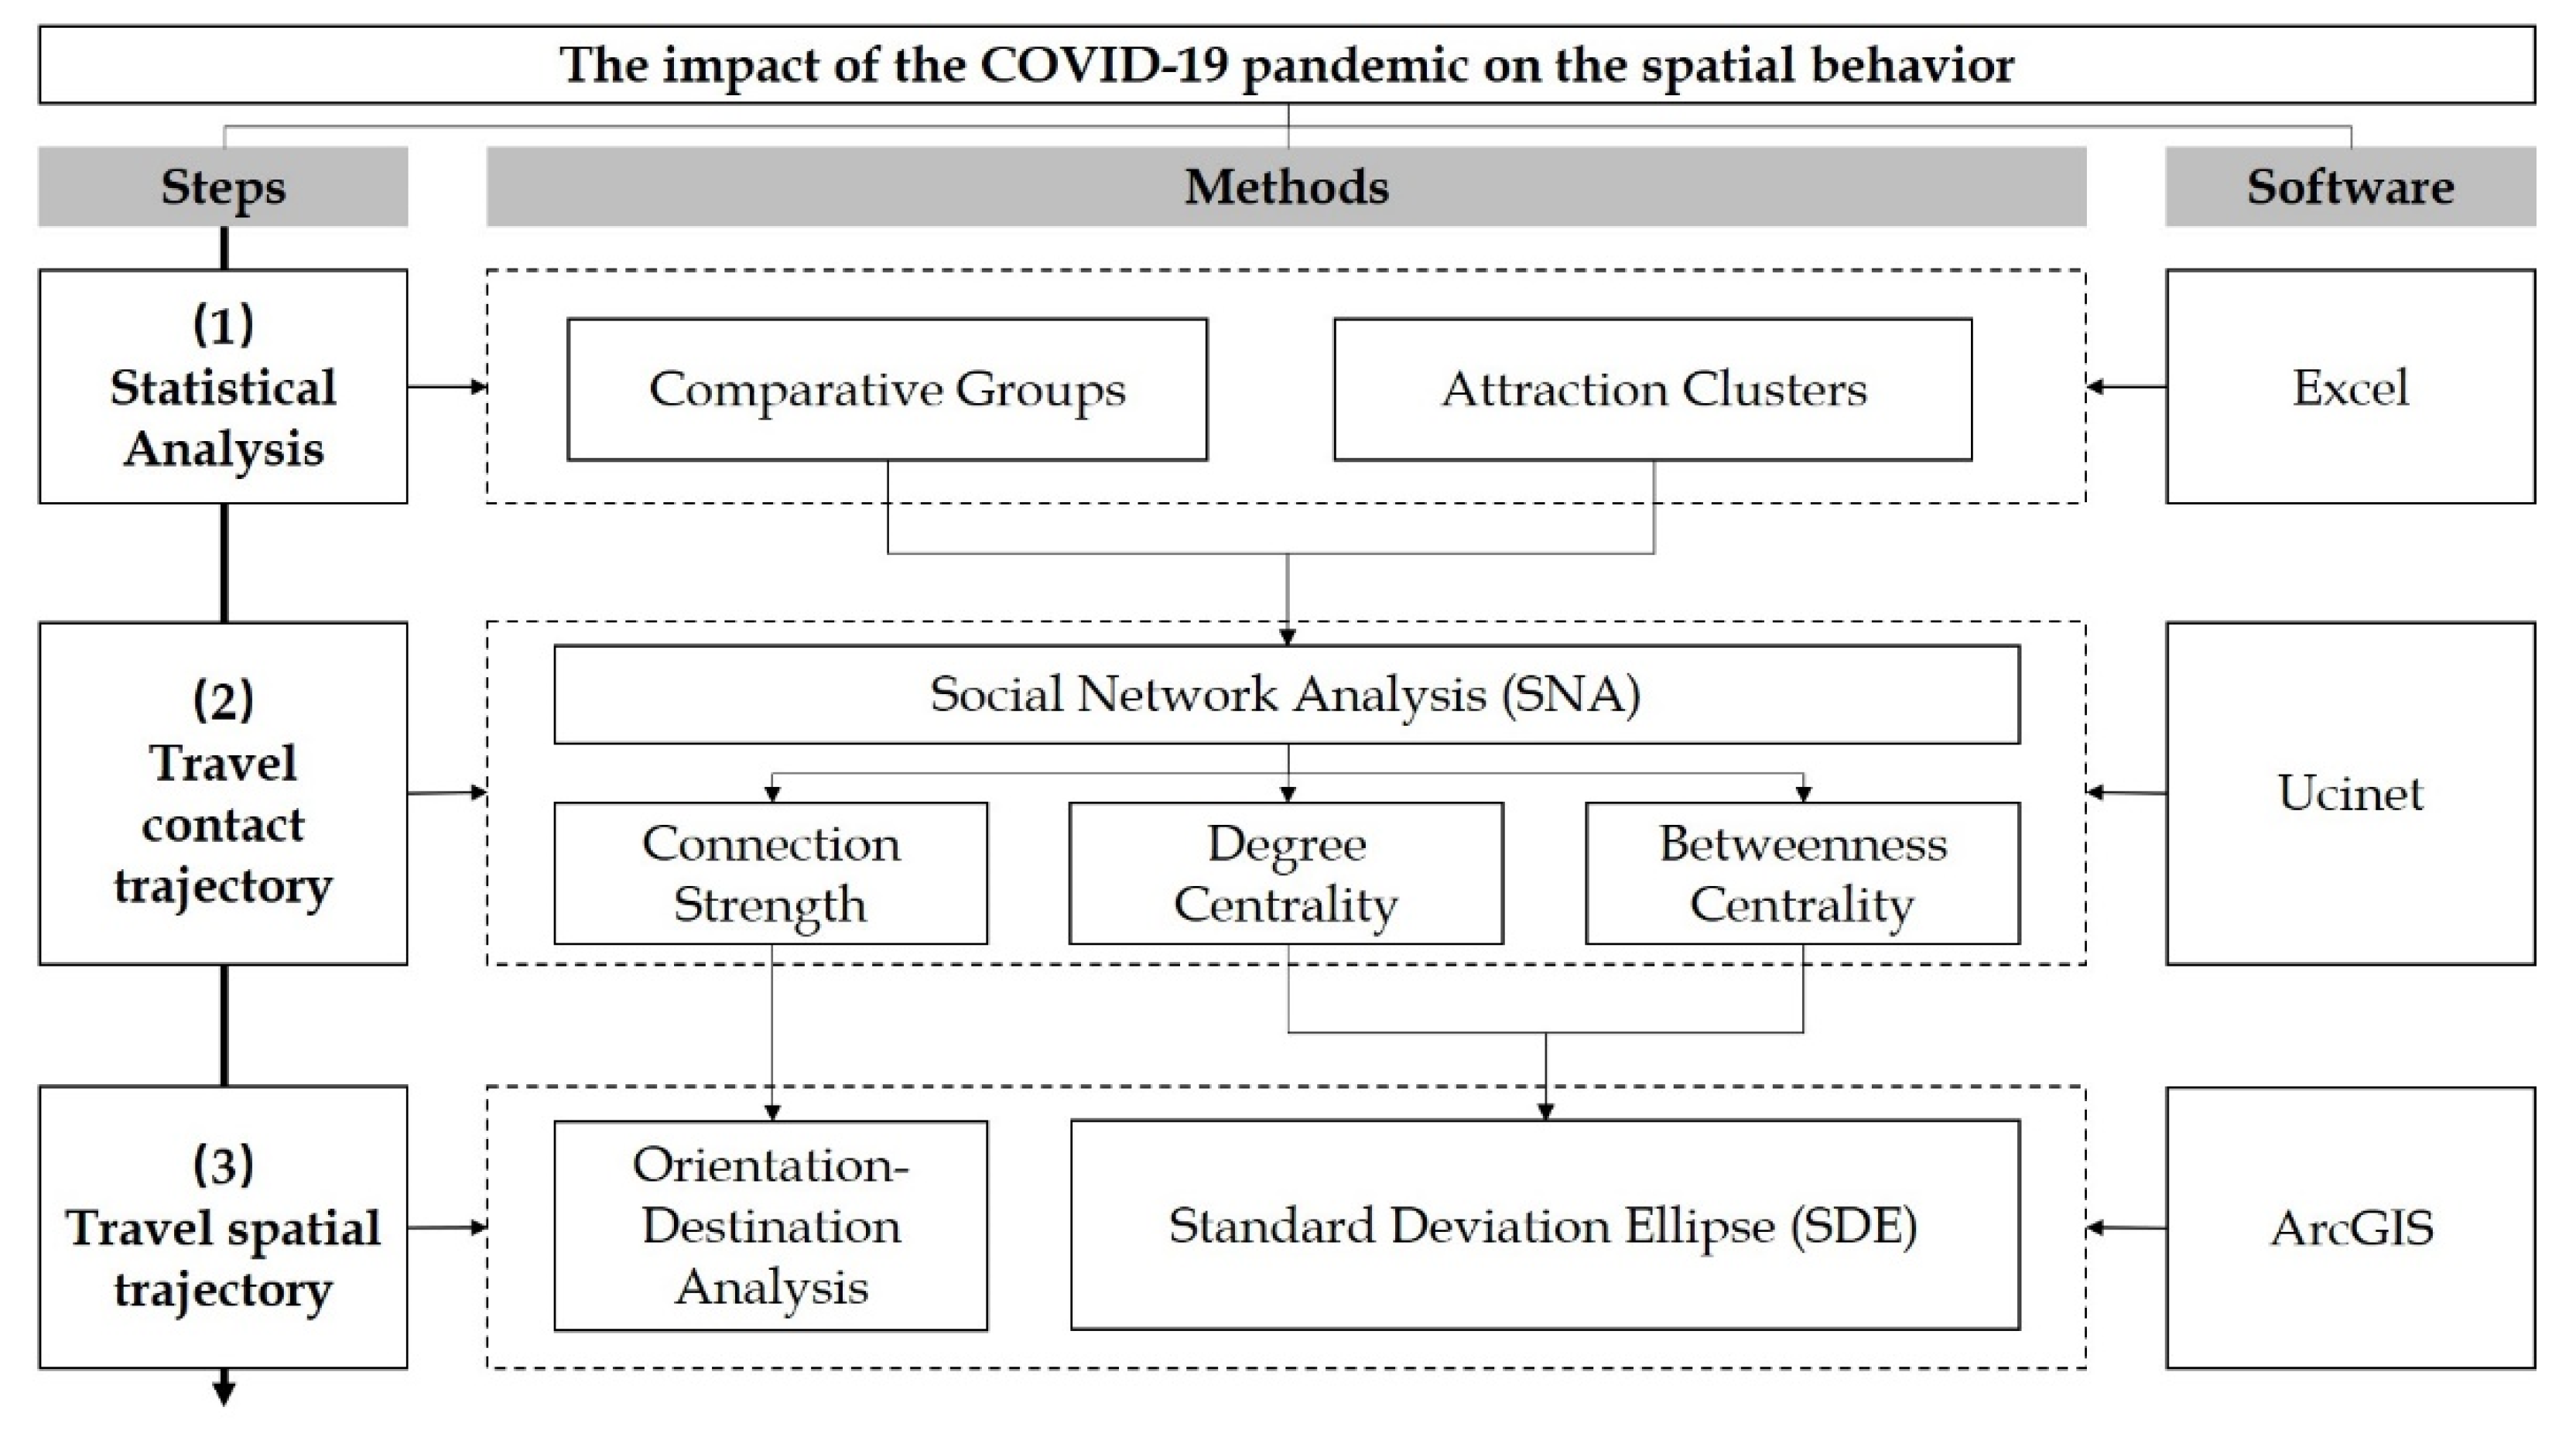
2.3. Methods and Framework

The spatial behavior of tourists can be understood as the behavior choice of tourists to travel, which includes destinations with sequence and direction characteristics and their connection relationships. It means that it has the dual relationship characteristics of the network and spatial attributes. The research on the network trajectory highlights the critical nodes in travel choice and the relationship between each node. In contrast, the research on the spatial trajectory can highlight the relationship between travel choices in urban space and clearly show the spatial pattern outlined by travel behavior. Therefore, this research focuses on the trajectory of the two dimensions of network and spatial relationship.
The study of tourist trajectory is different from monitoring tourist behavior in terms of the total quantity. It starts with the individual tourists and arranges statistics in a precise order of travel time and activities [64] (p. 28) to simulate the behavioral characteristics of urban tourists before and after the outbreak. Early traditional simulation of human activities has three types of methods: conversion method, conventional and mature selection method, and conventional and cultural transmission structure method. However, most traditional research methods take individual urban residents or families as sample objects to investigate discrete events within a certain period. They require a large number of social surveys, dairy surveys, or interviews as support. The sample size is small, but the field requirements are large, which is not suitable for investigating the travel behavior of urban tourists in the context of the epidemic.
In contrast, Social Network Analysis (SNA), which originated in sociology, does not require more fields for its research data. Moreover, it is only necessary to obtain a large quantity of tourist-based information in a certain period, and then the behavior network of the actors can be constructed. Therefore, it gradually became a popular social science research paradigm after the 1960s [65]. This article applies SNA methods to study the spatial behavior of urban tourists. The urban attractions are regarded as nodes in the network, and the amount and sequence of visitors to each node are used as the value to calculate the strength of the connection between the nodes. Moreover, the author loads the data analysis results into ArcGIS for visual analysis. Hence, it constructs two main research frameworks of tourist travel contact trajectory and spatial trajectory to explore the characteristics of the impact of the COVID-19 epidemic on urban tourists’ spatial behavior (Figure 2).

2.3.1. Comparative Group

To be simple, this study can be understood as the different behavioral characteristics and spatial representations of tourists on the scale of dynamic time and space under the epidemic as the primary external constraint that restricts behavior choices. Therefore, setting up an appropriate Comparative Group to cover the three time periods before, during, and after the outbreak is one of the keys to this study.
Affected by COVID-19, Jiangsu Province, where Nanjing is located, launched the “Level One Response to Public Health Emergencies” mechanism at 24:00 on 24 January 2020, and all types of external traffic were suspended. Shopping malls, entertainment venues, scenic spots, and other consumer spaces ceased operations. Until 24 February 2020, Jiangsu Province adjusted the primary response of epidemic prevention and control to secondary response. Subsequently, Nanjing issued the “Notice on Printing and Distributing Guidelines for Further Optimizing Epidemic Prevention and Control Measures in the Catering Industry and Accelerating the Resumption of Work and Resumption of Work”. It successively opened up the business restrictions on the consumption space on 3 March. Therefore, in this study, the period from 24 January to 3 March 2020 was taken as the “during” comparative group.
In an ideal circumstance, it is perfect for capturing the commentary data of the whole year before the COVID-19 and setting up the comparative group of the next whole year. However, since the limitation of data storage on the Ctrip.com website, each attraction’s maximum number of comments is 3000. It means the historical commentary data of hotspot attractions would probably be covered more frequently than other spots. Therefore, we should look into details each month to guarantee that the data captured would cover all the attractions and comments within the same select period. In addition, Tourism is a sympathetic activity, easily affected by various external constraints, with specific seasonal characteristics. In China, the establishment of short and long vacations, summer vacations, and other holidays profoundly impact the formation of the off-season and peak seasons of the urban tourism industry. Therefore, to make the research results more representative and significant, this article will set up another two Comparative Groups around the National Day holiday period. The period from October to the end of December 2019 will be regarded as the early stage before the outbreak in Nanjing, and the period from October to the end of December 2020 will be regarded as the later stage after the outbreak in Nanjing.

2.3.2. Attractions Clusters

Previous studies by scholars have shown that during the COVID-19 epidemic, urban parks and green open spaces have positive functions to individuals [9,12], indicating that the scenic landscape itself can have an impact on tourists experiencing the COVID-19 epidemic. This article believes that from the perspective of urban planning, the landscape composition of an urban attraction is the nature of the land where the attraction is located. Therefore, this study will learn from the classification of land properties in China’s Third Land Survey. Specifically, the attractions in this study are divided into three categories: (1) The land used for the attraction is classified as “land for garden use”, recognized as “Urban Park Attraction”; (2) The land used for the attraction is classified as “woodland”, “wetland”, and “cultivated land”, recognized as “Urban Natural Attraction”; (3) The attraction except for the land mentioned above use properties are classified as “Urban Architectural Attraction”.

2.3.3. Research on Contact Trajectory of Tourists

The attractions in Nanjing are regarded as nodes in the network, and the attractions commented by each tourist (review ID) are defined as the nodes that the tourist arrives successively, and the order of the comments is defined as the order of arrival. Furthermore, through the Python language, the cumulative statistics of all visiting tourists in the three Comparative Groups are used to construct a two-way matrix Equation (1) of the number of visits to Nanjing’s attractions to carry out the Node Connection Strength (NCS), Node Degree Centrality (NDC), and Node Betweenness Centrality (NBC) in the network centrality analysis.
[ N o d e 1 N o d e 1 0 N o d e 2 N o d e i C 1 ,   2 C 1 , i N o d e 2 C 2 , 1 0 C 2 , i N o d e i C i , 1 C i , 2 0 ]
(1) Node Connection Strength
In simple terms, the strength of the connection between nodes is the flow relationship of tourists choosing from one attraction to the next attraction. By constructing a two-way matrix, the direction of choice between the two attractions is determined, and the initiator and the recipient of the connection between the attractions are clarified. Although the NCS can clearly show a tourist route with high contact strength, the nodes at both ends of the high-strength tourist route do not represent its high centrality. Therefore, it is necessary to calculate further the degree centrality of the nodes in the network.
(2) Degree centrality
Centrality is one of the critical points of SNA. The greater the node’s centrality, the greater the “power” that the node has in the entire network. Bavelas was the first to conduct innovative research on the formal characteristics of centrality, verifying that the more the actor is in the center of the network, the greater its influence [66]. The centrality of a network is generally measured by two indicators: “Node Degree Centrality (NDC)” and “Network Centrality (NC)”. The former is a measurement of node centrality, and the latter is a measurement of the centrality trend of the overall network.
The measurement of NDC is divided into absolute centrality and relative centrality. The two are logically consistent, but the relative centrality standardizes the result of absolute centrality so that nodes in different networks can be compared horizontally. Therefore, the Normalized Node Degree Centrality (NrNDC) is selected to measure the centrality of the nodes in the network under the requirements of setting three types of time Comparative Groups in this article. The calculation formula is as follows:
C R D i = j X i j n 1
In the Formula (2), C R D i is the NrNDC of node i; j X i j represents the sum of the number of relations between point i and any other point j in the network, that is, the degree of node i. n represents the overall network scale, that is, the number of all nodes in the network; n − 1 represents the total number of remaining nodes in the network excluding its node, which is used in the standardization process.
The above is used to measure the degree centrality of each node in the network, and it is also necessary to measure the centrality trend of the overall network. The higher the value of NC, the greater the degree of convergence of the network to the high centrality node, and the more the actors’ activity range is concentrated toward the center of the network. The formula for calculating NC is as follows:
C R D = i = 1 n ( C R D m a x C R D i ) C A D m a x / ( n 1 )
In Formula (3), C R D is the value of NC, C R D m a x is the node value with the highest relative degree centrality in the network, and C R D i is the degree centrality value of other points in the network. i = 1 n   ( C R D m a x C R D i ) is the sum of the difference between the highest point of relative centrality and the relative centrality of other points in the network. n represents the overall network scale, that is, the number of all nodes in the network; Freeman confirmed the maximum value of absolute degree centrality is C A D m a x = n 2 3 n + 2 in the social network analysis [67]; n − 1 represents the total number of remaining nodes in the network, excluding its node, which is used in the index standardization process.
(3) Betweenness centrality
The centrality of node and network degree often measures the nodes that occupy absolute “power” dominance. While there is another kind of node in the context of tourism activities, when tourists choose to travel from point A to point B, they must pass through intermediate point C. In other words, the activity connection between attraction A and B depends on the C node. Therefore, it also has a certain degree of centrality in the overall network, called Node Betweenness Centrality (NBC). Similarly, the measure of betweenness centrality is divided into NBC and overall Network Betweenness (NB). The calculation of the NBC formula is as follows:
C R B i = j < k g j k ( i ) / g j k C R B m a x
In Formula (4), C R B i represents the betweenness centrality of the node i, g j k ( i ) represents the number of network paths that exist between node j and k through node i, so g j k ( i ) / g j k can represent the probability that node i is on the network path between node j and k. Freeman confirmed that the maximum value of betweenness centrality of nodes in social network analysis is C R B m a x = ( n 2 3 n + 2 ) / 2 [67], and n − 1 represents the total number of remaining nodes in the network, excluding its node, which is used in the index standardization process. In the process of summarizing g j k ( i ) / g j k , it should make sure the j < k, otherwise it may double count the possibility between the same two nodes.
The calculation of the NB formula is as follows:
C B = 2 i = 1 n ( C R B m a x C R B i ) ( n 1 )
In Formula (5), C B represents the betweenness centrality of the overall network. The calculation process of the formula is complicated, and it is simplified as shown above. C R B m a x represents the maximum value of betweenness centrality of nodes in the network, C R B i represents the betweenness centrality values of other nodes, excluding the maximum value, and n represents all nodes in the network.

2.3.4. Research on the Spatial Trajectory of Tourists

Although the SNA method can clearly show the centrality of each node in the network, the connection strength between the nodes, and the selection order relationship, it does not contain the geographic coordinate information of the nodes. It cannot show the characteristics of changes in the geographic space. Therefore, it is necessary to load the SNA results into ArcGIS to analyze the spatial pattern. The author uses the Orient–Destination (OD) model and the Standard Deviation Ellipse (SDE) model to deduce the changes in the travel trajectory of tourists before, during, and after the epidemic and the range of activities in the urban space.
(1)
Spatial trajectory pattern
The SDE model includes calculating the average center, distribution direction, and range of the spatial behavior of tourists. Through the previous SNA works, the C R D i and C R B i of various attractions in Nanjing before, during, and after the epidemic was obtained, which were used as the weight coefficients of the SDE analysis to obtain a tourism spatial pattern map of Nanjing based on the trajectory of tourists’ travel choices. The calculation of the SDE is generally divided into three steps. The center of the ellipse, the rotation angle, and the long and short axis length will be calculated separately. The calculation formula for the center of the ellipse is as follows:
S D E x = i = 1 n ( w i x i X ¯ w ) 2 i = 1 n w i , S D E y = i = 1 n ( w i y i Y ¯ w ) 2 i = 1 n w i
where X ¯ w = i = 1 n w i x i i = 1 n w i , Y ¯ w = i = 1 n w i y i i = 1 n w i .
In Formula (6), S D E x and S D E y calculate the x and y coordinate values, respectively, of the center of the ellipse, where w i represents the calculated weight of the attraction i, that is, the value of the degree centrality and betweenness centrality of the attraction; X ¯ w and Y ¯ w are the x- and y- coordinates of the arithmetic mean center point of all attractions under the weight of w; and x i and y i are the spatial position coordinates of each attraction.
Subsequently, the direction of the ellipse needs to be calculated, taking the proper north direction as 0 degrees and the x-coordinate axis as the reference. The calculation formula is as follows:
tan θ = ( i = 1 n x ˜ i 2 i = 1 n y ˜ i 2 ) + ( i = 1 n x ˜ i 2 i = 1 n y ˜ i 2 ) 2 + 4 ( i = 1 n x ˜ i y ˜ i ) 2 2 i = 1 n x ˜ i y ˜ i
where x ˜ i = w i x i X ¯ w , y ˜ i = w i y i Y ¯ w .
In Formula (7), tan θ is the sine function of the ellipse’s clockwise rotation angle from true north, where X ¯ w and Y ¯ w are the arithmetic average center point x and y coordinates of all attractions under the weight of w. The calculation formula is shown in Formula (6).
Finally, the x- and y-axis lengths of the ellipse need to be calculated. The formula is as follows:
σ x = 2 i = 1 n ( x ˜ i cos θ y ˜ i sin θ ) 2 i = 1 n w i , σ y = 2 i = 1 n ( x ˜ i sin θ + y ˜ i cos θ ) 2 i = 1 n w i
In Formula (8), σ x is the length of the x-axis of the ellipse, and σ y is the length of the y-axis of the ellipse; the values of cos θ and sin θ can be calculated by the trigonometric function formula; the calculation processes of x ˜ i and y ˜ i are in the Formula (7).
(2)
Spatial trajectory changes
Use the Python language to construct the OD table (Table 2) of the starting place field, the destination field, and the number of visits field using the two-by-two matrix constructed in the SNA. Taking each starting point connection in the table as a spatial trajectory, by comparing the data before, during, and after the epidemic, three types of increased trajectory, decreased trajectory, and the same trajectory with value changes are obtained.

3. Results

The results of this study are divided into three parts. The first part is the basic analysis of the data sample captured from the Ctrip.com website to form the Comparative groups and Attraction Clusters. The second part of the results is about the travel contact trajectory, through the SNA method. The last part of results is the travel spatial trajectory, through the O–D model and the SDE model in ArcGIS.

3.1. Statistic Analysis

3.1.1. Statistics of Comparative Groups

According to the Comparative Group classification requirements set in the previous research method, the obtained Ctrip comment data are preprocessed, and the comment data for three time periods are extracted. Statistics show that (as shown in Table 3), a total of 16,117 comment data in the three Comparative Groups have been screened out, accounting for 16.66% of the full captured data. Among them, a total of 7693 entries were made before the epidemic (October–December 2019), a total of 760 entries were made during the epidemic (24 January–3 March 2020), and a total of 7664 entries were made after the epidemic (October–December 2020).
From the statistical point of view of the total amount of review data, the epidemic has caused a decline in the total number of tourist reviews of Nanjing’s scenic spots, which indirectly indicates that tourists’ travel choices are restricted under the impact of the epidemic. On the one hand, although Ctrip’s attraction reviews are limited by the total number of pages, resulting in a certain degree of missing data in the first half of 2019, the incomplete data for February 2019 alone also has 832 scenic reviews, which is higher than the number of 760 scenic reviews during the epidemic (Figure 3). On the other hand, compared to the same quarter before and after the outbreak, under the premise of steady growth in the number of tourists in Nanjing (15.8% in 2018 and 8.5% in 2019), the number of comments after the epidemic has declined (Figure 3).

3.1.2. Statistics of Attraction Clusters

The clustering method above is divided into three categories: urban architectural attractions, urban park attractions, and urban natural attractions. As shown in Figure 4, most of the urban architectural attractions are located in the City of Nanjing, and a small number of urban architectural attractions are located in urbanized areas outside the City of Nanjing. Most of the urban park attractions are concentrated in the Old City of Nanjing, and a few are located in the City of Nanjing. Most of the urban natural attractions are located outside the City of Nanjing, but a small number of urban natural attractions are in the Old City of Nanjing. As shown in Table 3, in the time group before the epidemic, tourists visited 400 attractions, of which 268 were urban architectural attractions, accounting for 67%; 81 urban natural attractions, accounting for 20.25%; and 51 urban park attractions, accounting for 12.75%. During the outbreak, tourists visited 175 attractions, of which 117 were urban architectural attractions, accounting for 66.86%; 36 were urban natural attractions, accounting for 20.57%; and 22 were urban park attractions, accounting for 12.57%. In the time period after the outbreak, tourists visited 427 attractions, of which 300 were urban architectural attractions, accounting for 70.26%; 75 were urban natural attractions, accounting for 17.56%; and 52 were urban park attractions, accounting for 12.18%.
In general, from the preliminary statistics of Ctrip’s check-in information before, during, and after the outbreak, the number of tourist attractions in Nanjing was ranked in order of urban architectural attractions, urban natural attractions, and urban park attractions. However, after the outbreak, the number of urban architectural attractions visited increased by 32, while the number of urban natural attractions visited decreased by 6, and the number of urban park attractions visited remained the same as before the epidemic.

3.2. Results of Contact Trajectory of Tourists

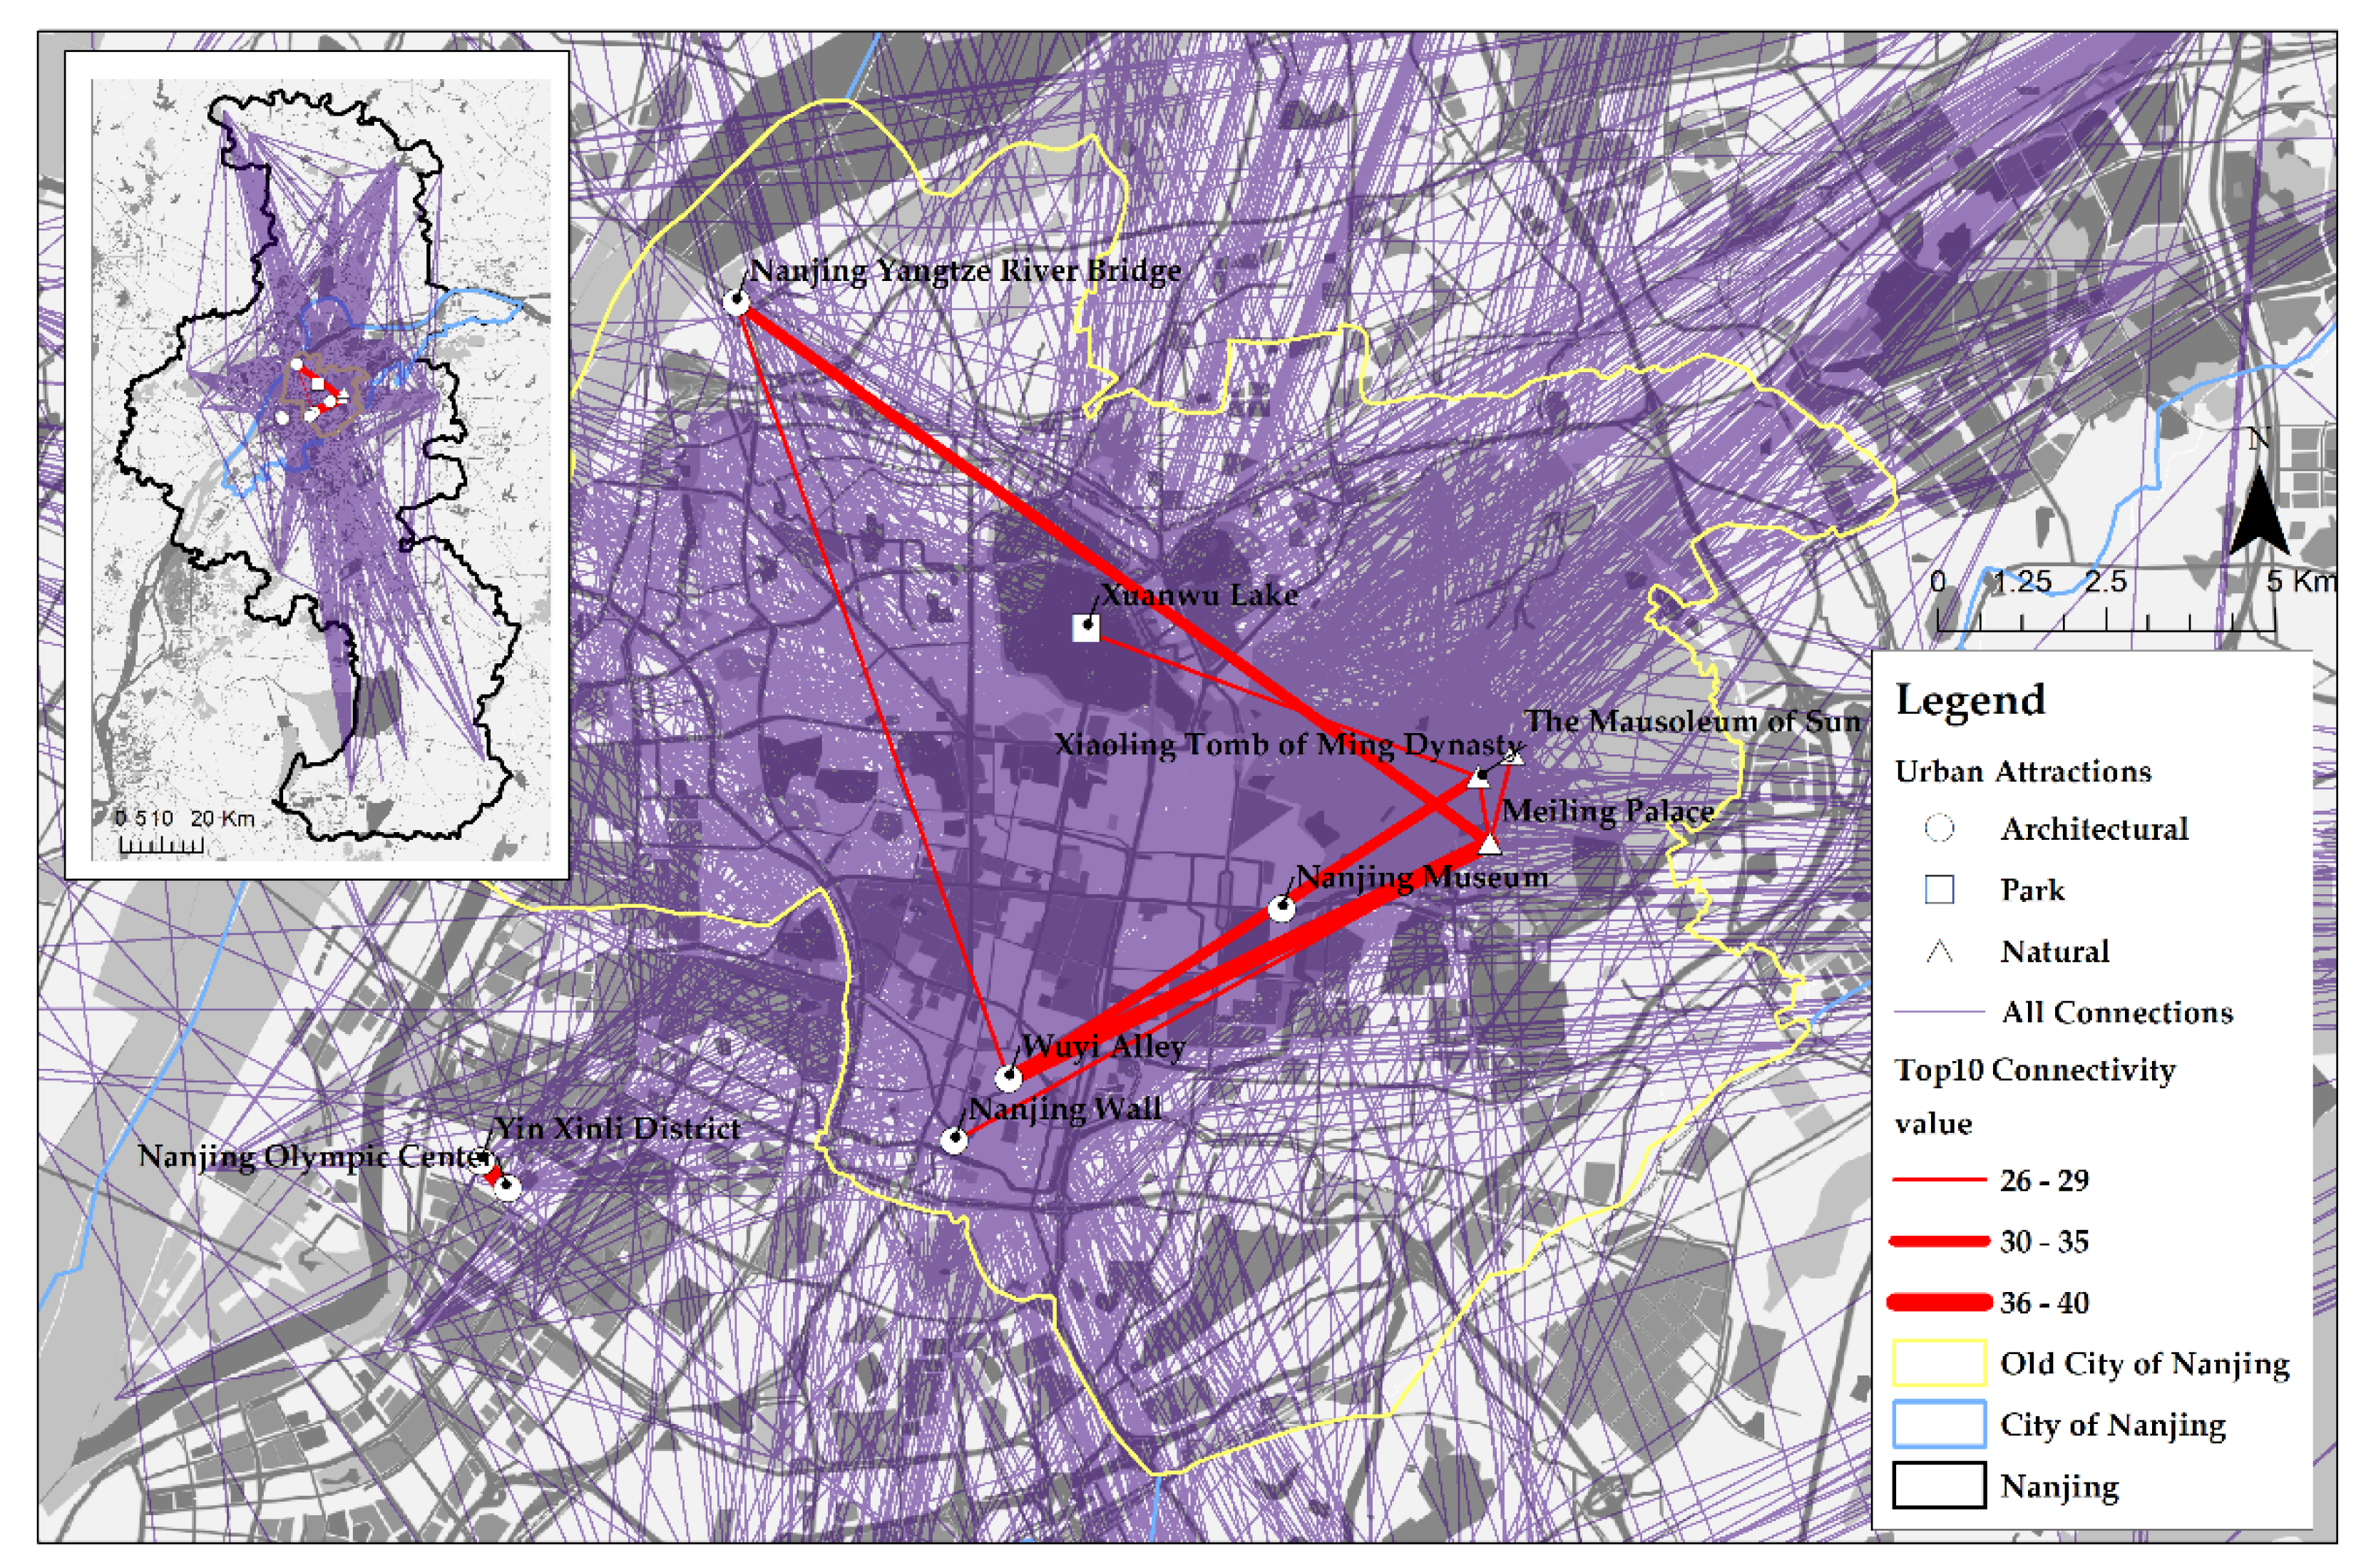
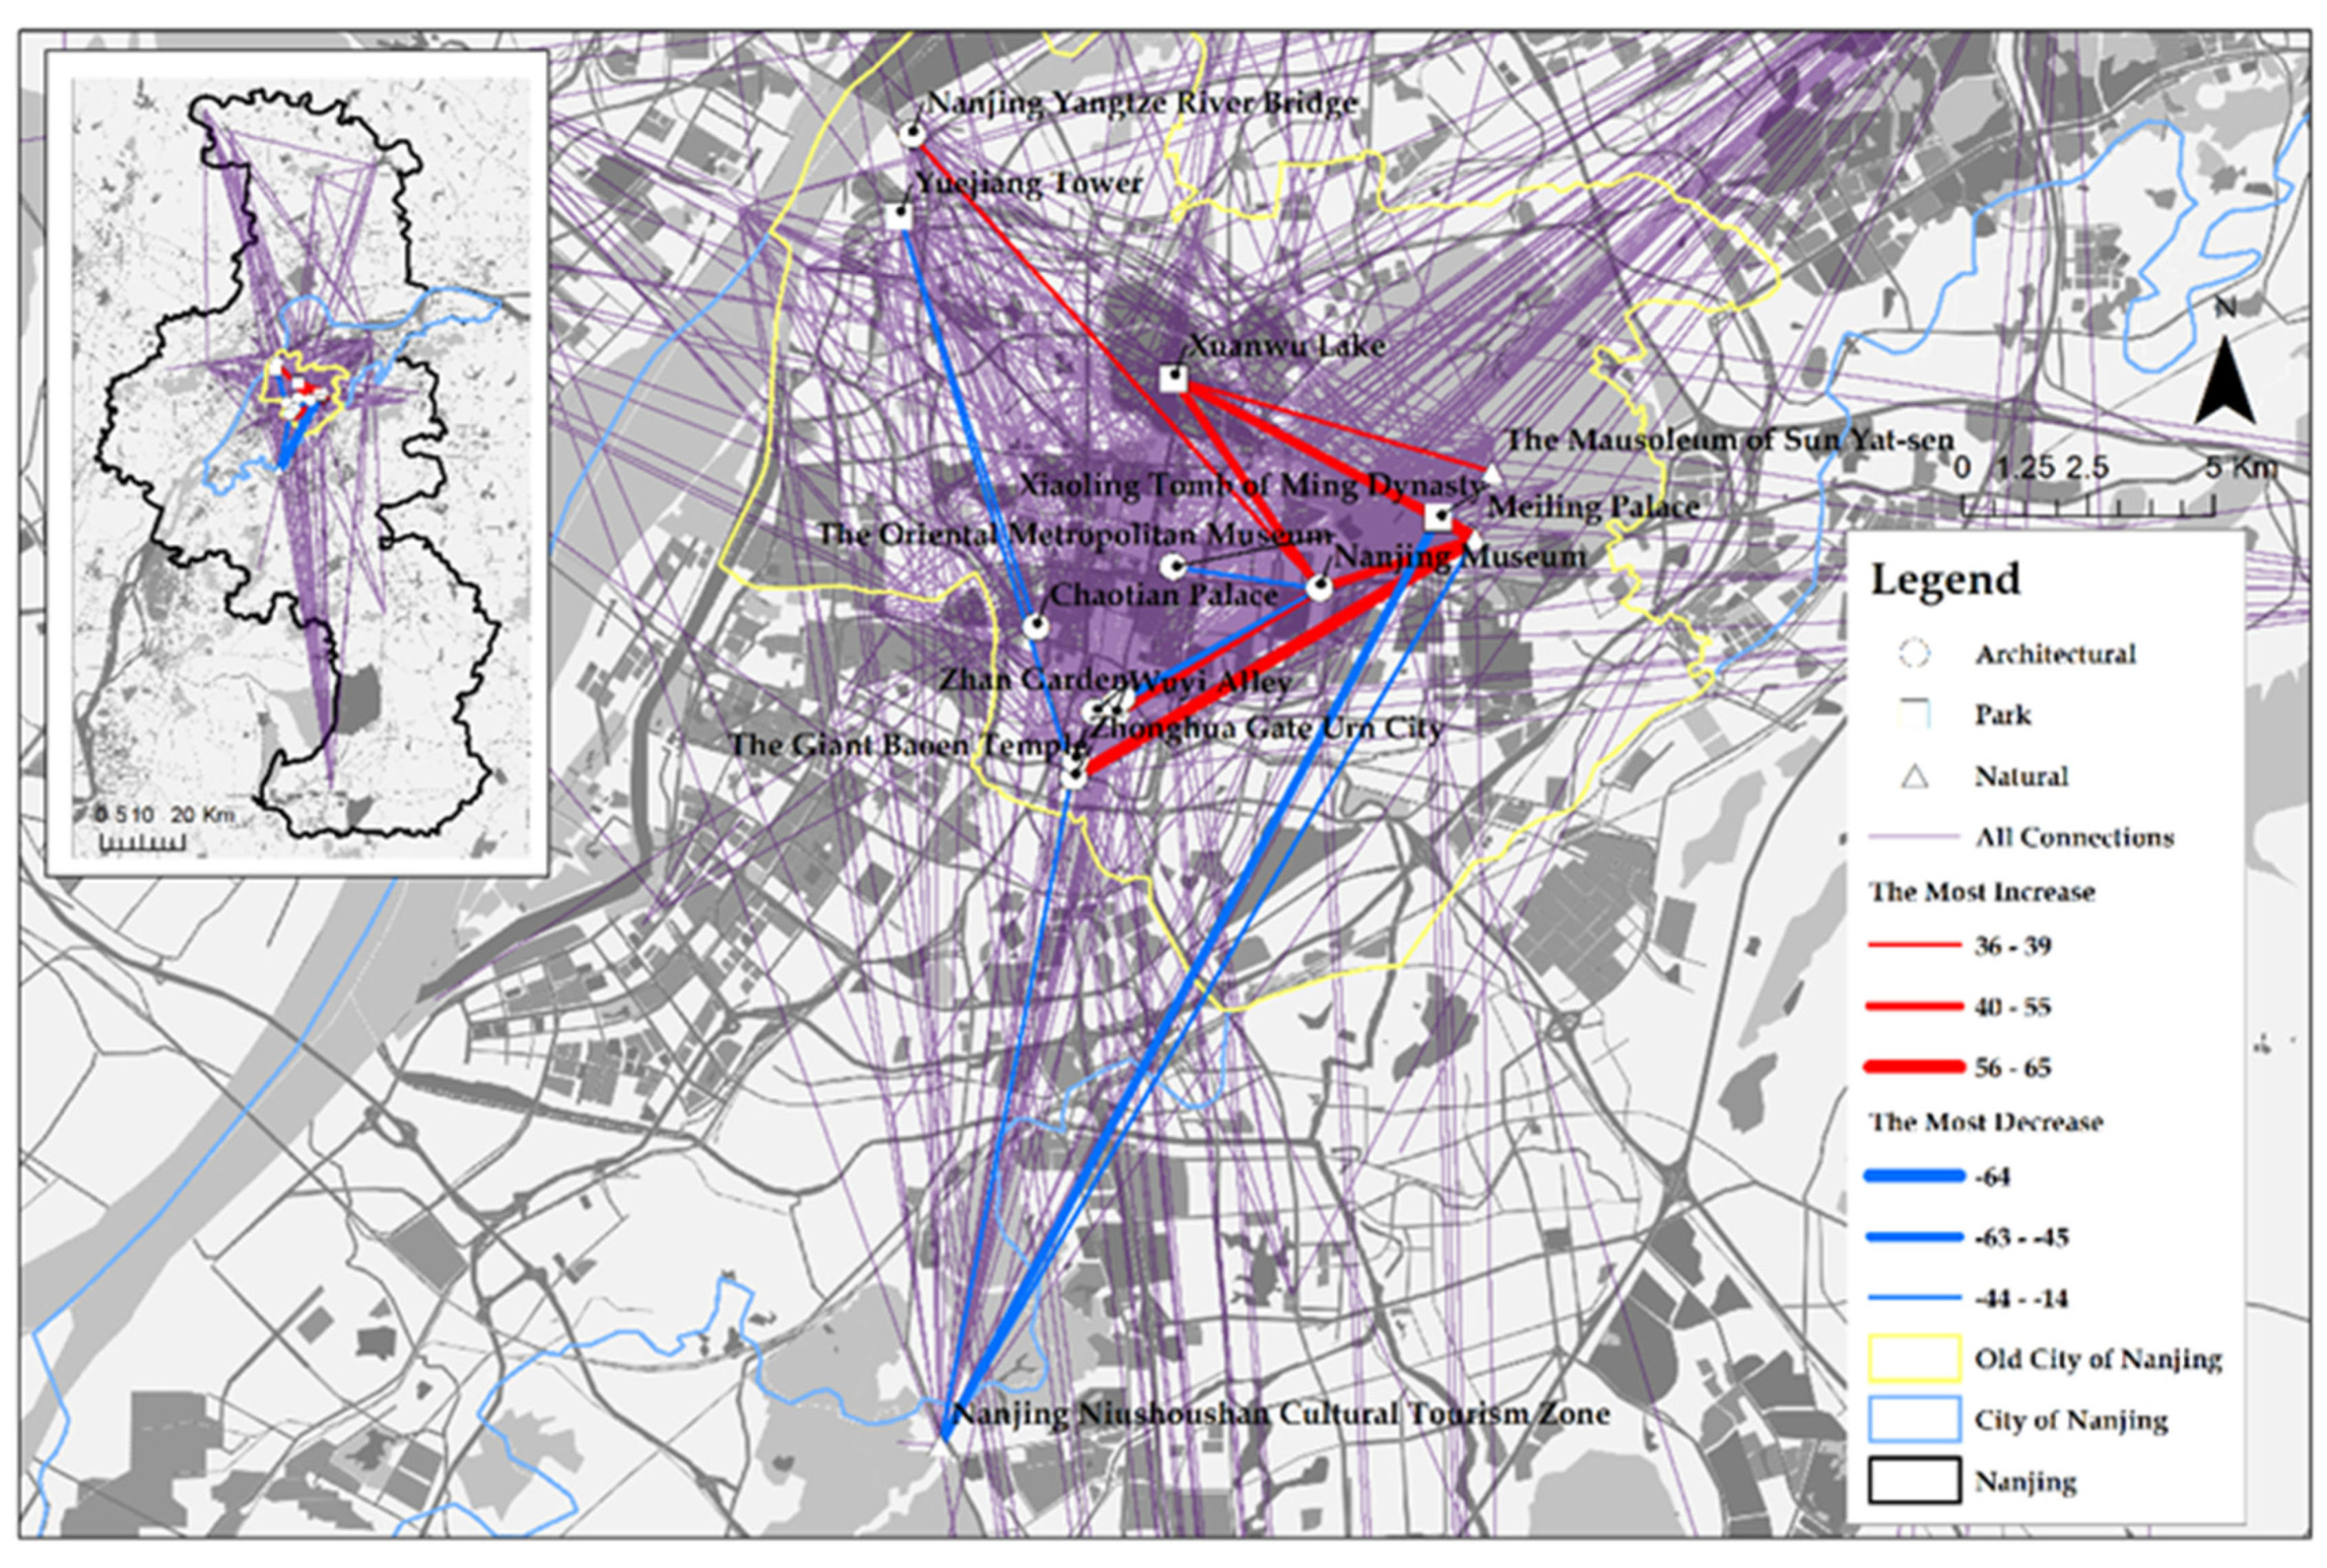
3.2.1. Node Connection Strength

After the epidemic, the overall number of connections in Nanjing’s attractions network decreased, but the strength of contacts increased. As shown in Table 4, in the Comparative Group before the outbreak, the total number of connections between attractions in Nanjing was 9697. In contrast, the total number of connections between attractions after the epidemic decreased by 3555 to 6142 during the same period. However, the overall connection density of attractions increased from 1498 before the epidemic to 2063 after the epidemic, indicating an increase in the strength of unit networks. Similarly, from the travel routes of the first five groups of connection strength, it can be seen that when the total amount is reduced, the connection intensity of the top five groups of tourist routes with the highest values is generally higher after the epidemic than before the epidemic.
Urban architectural attractions are regarded as the hot tourist areas in Nanjing before and during the outbreak. Table 4 shows that the orientation and destination nodes of the top five tourist routes with urban architectural attractions occupy three-fifths of the sample. Moreover, the top two attractions with high connection value are all occurred between urban architectural attractions; similarly, when the epidemic occurred, urban architectural attractions in the three most popular travel routes were still the central theme of the tour. The Confucius Temple, the Confucius Temple-Qinhuai River Scenic Area, and the Zhan Garden are the hot spots of urban architecture attractions for Nanjing tourists before and during the outbreak, followed by the urban park attractions and urban natural attractions such as the Xiaoling Tomb of the Ming Dynasty, Qixia Mountain, and the Nanjing Niushoushan Cultural Tourism Zone.
Urban park attractions and urban natural attractions are the hot tourist areas in Nanjing after the outbreak. As shown in Table 4, Nanjing’s hotspot tourist routes have undergone significant changes after the epidemic outbreak. The orientation and destination nodes of the hot tourist route after the epidemic are urban park attractions, supplemented by urban natural attractions. Among the orientation node of hot tourist routes, urban park attractions occupy four-fifths of the sample, while the other fifth is the urban natural attractions. Among the destination node of hot tourist routes, urban natural attractions and urban park attractions occupy two-fifths separately, while only one urban architectural attraction is in the list. In addition, in the connection of Xiaoling Tomb of the Ming Dynasty (urban park attraction) to the Qixia Mountain (urban natural attraction), the strength increased by 72.73% after the epidemic. In addition, Nanjing formed a hot spot for urban tourism with urban park attractions and urban natural attractions after the epidemic, such as the Xiaoling Tomb of Ming Dynasty, Qixia Mountain, Meiling Palace, Xuanwu Lake, and the Giant Baoen Temple.

3.2.2. Degree Centrality

In contrast, before the epidemic outbreak, the tourist behavior of Nanjing City was relatively scattered; after the outbreak of the epidemic, it was more concentrated in attractions with a high value of degree centrality, while the agglomeration was most apparent when the epidemic occurred. As shown in Table 5, before the epidemic outbreak, the network degree centrality of Nanjing was 0.0311, which was the lowest among the three Comparative Groups, indicating that the city’s tourist travel behavior before the outbreak of the epidemic had the lowest degree of clustering. At the time of the epidemic, the centrality of the tourist behavior network in Nanjing was 0.0678, which was the highest value among the three Comparative Groups. From the horizontal comparison of the top five ranked attractions, the NrNDC of the attractions at the time of the epidemic is also the highest, which shows that the tourist behavior network of Nanjing city tourists had shrunk to attractions with high value of NDC when the epidemic occurred. After the outbreak, Nanjing’s tourist travel behavior network has a value of 0.0525, which is lower than when the outbreak occurred but is improved compared to before the outbreak, indicating that after the outbreak Nanjing’s tourist travel tends to be more centralized to attractions with a high value of NDC than before. In other words, after the outbreak, attractions with high centrality have higher “power” to allocate resources in the entire tourist behavior network.
Urban park attractions in Nanjing had the highest average relative centrality before and during the outbreak, followed by urban architectural attractions and urban natural attractions. As shown in Table 5, before the epidemic, the average relative centrality of urban park attractions was the highest, at 0.00381, followed by urban architectural attractions (0.00358) and urban natural attractions (0.00307). The exact same order of attraction cluster also occurred in the Comparative Group at the time of the epidemic. However, from a horizontal comparison, the relative centrality value of tourists’ visit behavior was the highest when the epidemic occurred, indicating that the concentration of tourists to attractions with high centrality was more prominent. However, the Confucius Temple, Nanjing Museum, and Zhan Garden, three urban architectural attractions, had the highest relative centrality before the outbreak in terms of the top five attractions in terms of relative centrality, followed by Ming Xiaoling (urban park landscape) and Qixia Mountain (urban natural landscape).
Urban natural attractions in Nanjing had the highest average relative centrality values after the outbreak, followed by urban park attractions and urban architectural attractions. After the outbreak, the three urban park attractions of the Xiaoling Tomb of Ming Dynasty, Xuanwu Lake, and Meiling Palace had the highest relative centrality in the network. As shown in Table 5, the average relative centrality value of urban natural attractions after the epidemic outbreak was 0.00329, followed by the urban park attractions with a value of 0.00288, and the urban architectural attractions with a value of 0.00238. Compared with before the outbreak, the average relative centrality of urban architectural attractions has fallen the most, followed by urban park attractions, while the relative centrality of urban natural attractions has increased. In addition, the two urban architectural attractions, the Confucius Temple and the Nanjing Museum, which had the highest relative centrality values before the outbreak, their relative degree centrality declined after the outbreak, by 0.008 and 0.005, respectively. They dropped from first and second to fourth and fifth, respectively. The relative centralities of the three urban park attractions, the Xiaoling Tomb of Ming Dynasty, Xuanwu Lake, and Meiling Palace, are 0.025, 0.021, and 0.021, respectively, and they have become new tourism network centers after the epidemic.

3.2.3. Betweenness Centrality

The tourist behavior of Nanjing City further concentrated on nodes with a high value of betweenness centrality, and the ability of these nodes to control resources in the travel network improved. As shown in Table 6, after the epidemic outbreak, the value of the network betweenness centrality for tourist behavior in Nanjing increased from 0.0493 to 0.0637. It can be found that Confucius Temple and Xuanwu Lake have a high value of betweenness centrality in all three Comparative Groups, and the relative betweenness centrality of the two nodes has increased to a certain extent after experiencing the epidemic. Affected by seasonal factors in tourism, the Qixia Mountain appeared in the list of the high value of betweenness centrality before and after the epidemic, and its value has also been improved to a certain extent.
The betweenness centrality of urban park attractions and urban natural attractions has been improved to varying degrees in the overall network. As shown in Table 6, the value of the betweenness centrality of the three types of attractions increased when the epidemic occurred. However, after the outbreak, the ranking of the three types of attractions has changed. Urban park attractions still have the highest average value, while the average value of urban natural attractions after the epidemic has exceeded that of urban architectural attractions. Comparing before and after the outbreak, the value of urban architectural attractions remained the same, while the average value of urban park attractions and urban natural attractions increased by varying degrees. In addition, the new ranked attractions with high value of betweenness centrality during and after the outbreak include the Zijin Mountain Scenic Area, Meihua Mountain, the Xiaoling Tomb of Ming Dynasty, and the East Zhonghua Gate Historical Culture Block. Except for the East Zhonghua Gate Historical Culture Block, the other three items are urban park attractions and urban natural attractions.

3.3. Result of the Spatial Trajectory of Tourists

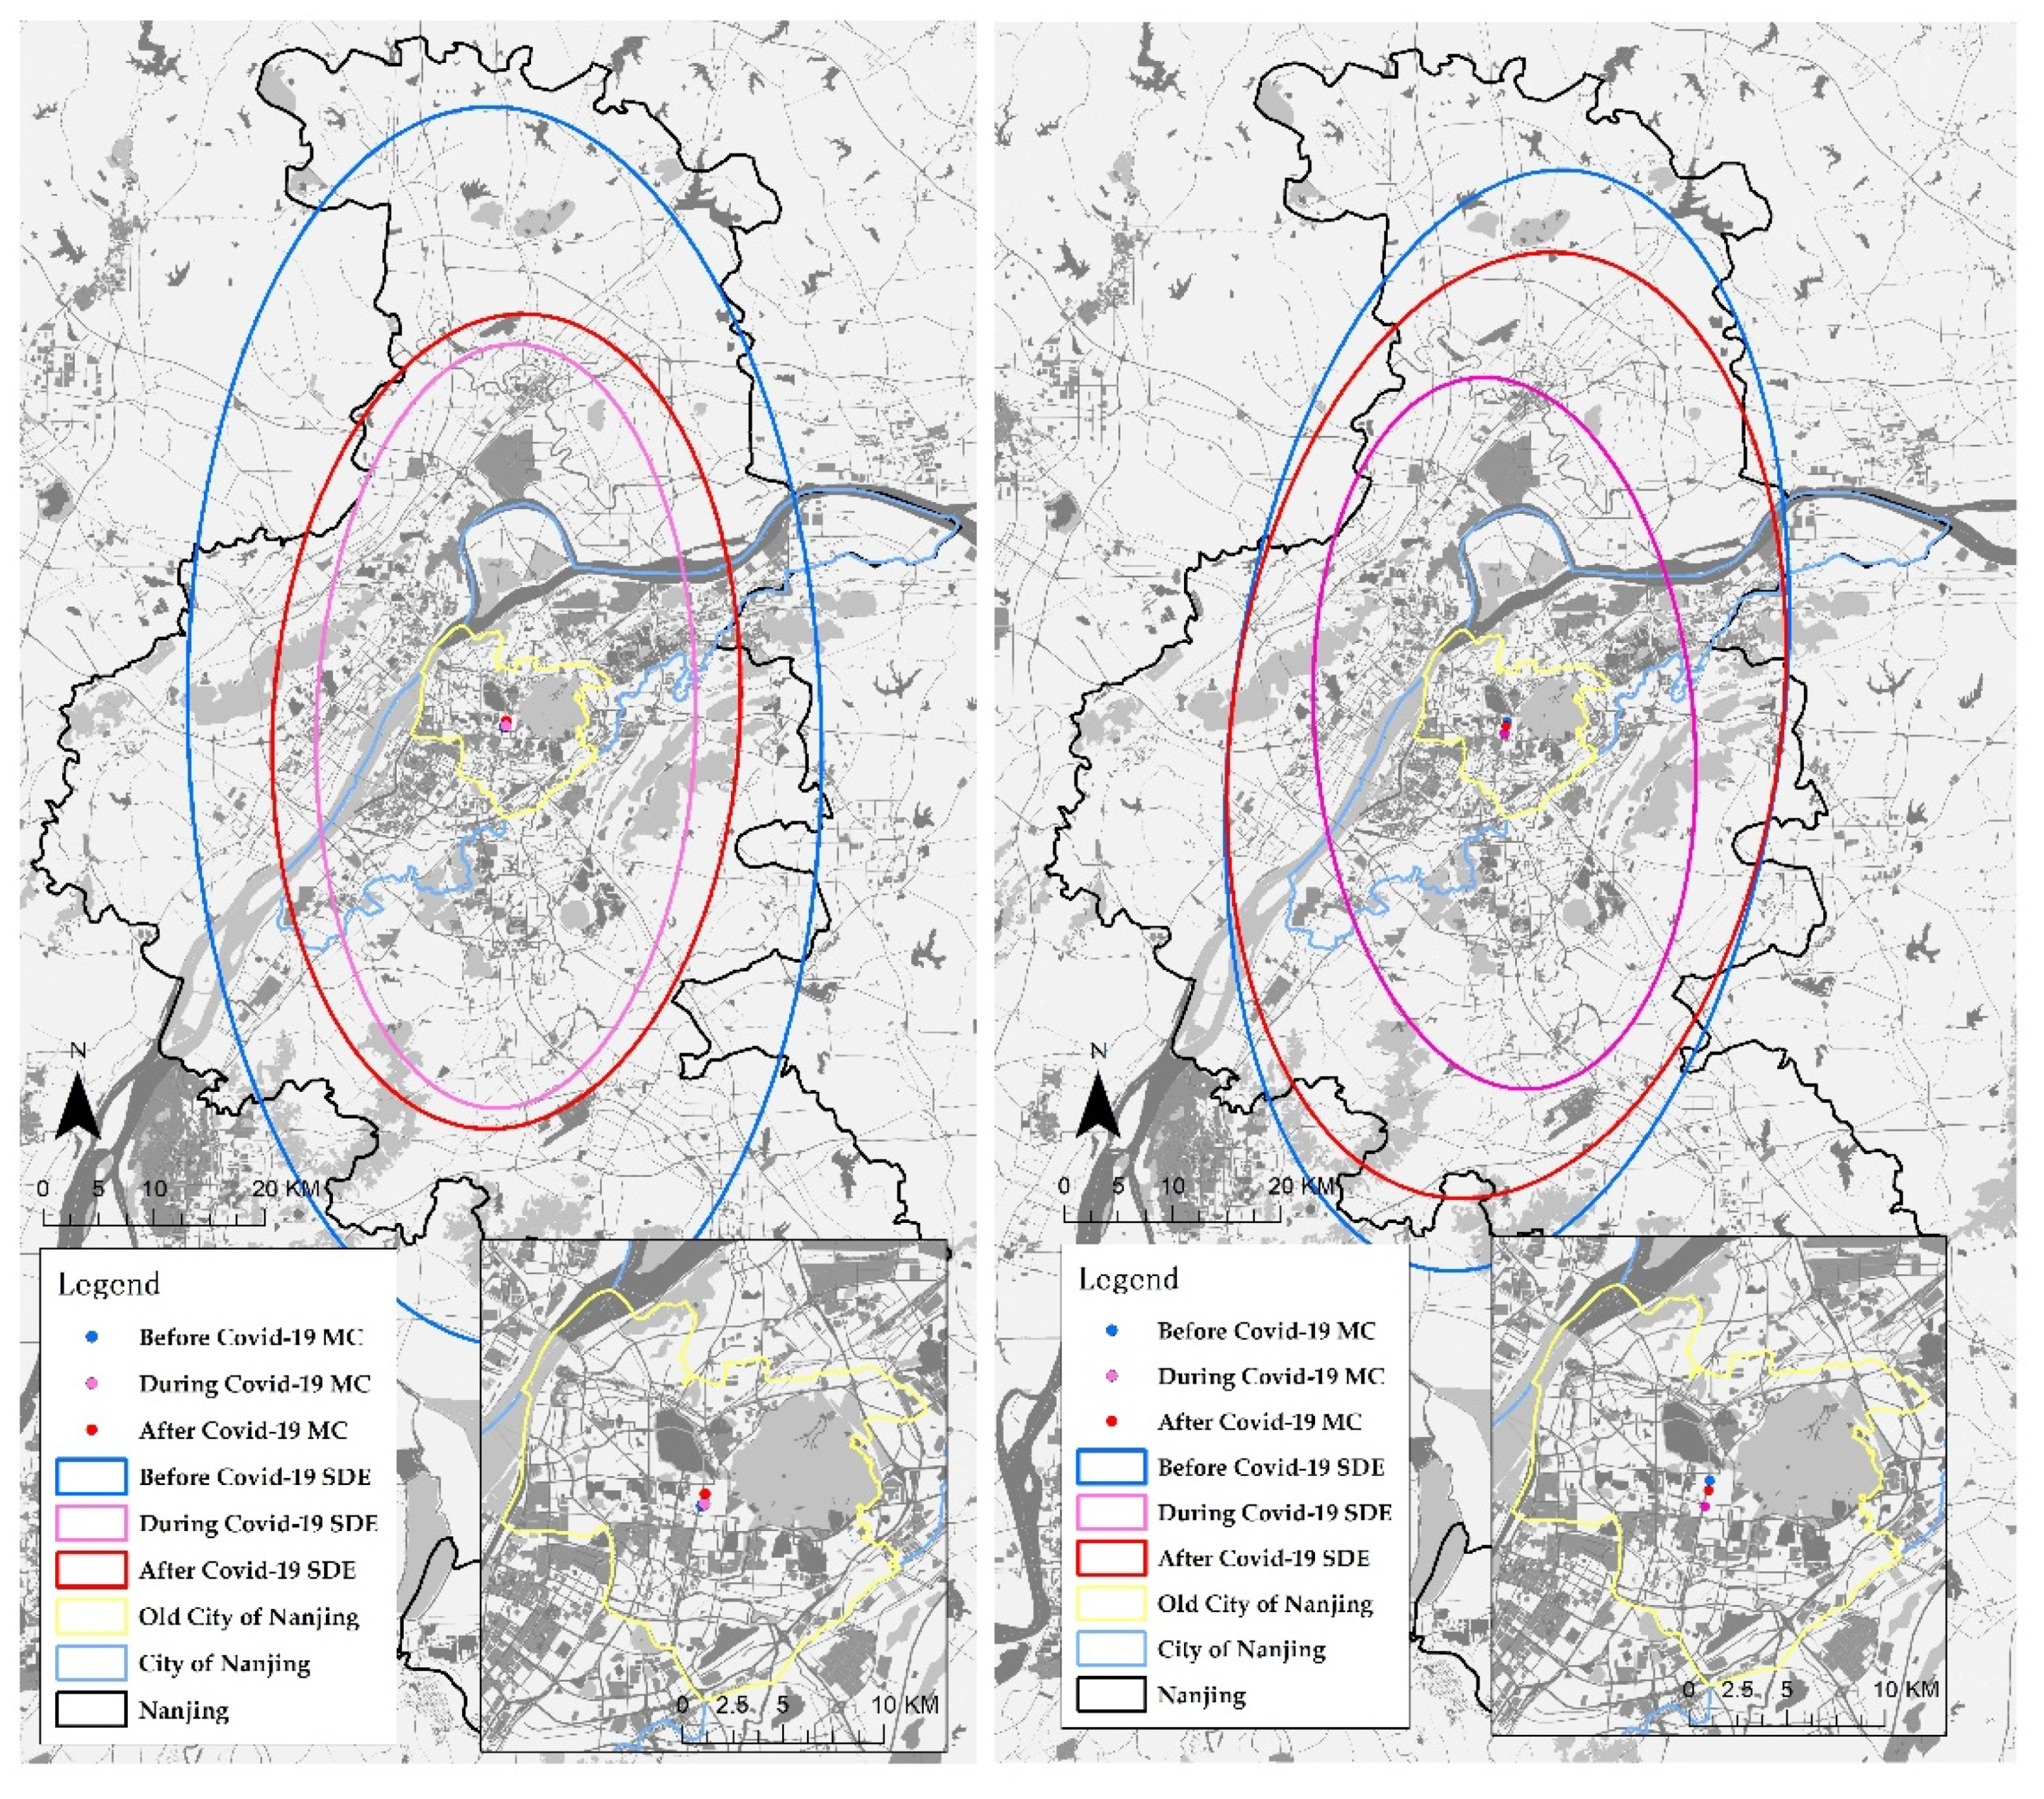
3.3.1. Spatial Trajectory Pattern

From the perspective of the scope of tourists’ spatial behavior, on the one hand, after the epidemic, the spatial behavior of urban tourists in Nanjing has generally shrunk to the Old City of Nanjing (Figure 5). As shown in Table 7, compared with before the outbreak, the area of the standard deviation ellipses of the two types of main indicators during and after the outbreak have been reduced to varying degrees. The decrease was the greatest when the epidemic occurred, followed by after the epidemic, indicating that the spatial behavior of tourists in Nanjing is shrinking to the Old City of Nanjing after the epidemic. By comparing the length of the short axis ( σ x ) of the ellipse during the three time periods, the short axis ( σ x ) length during the epidemic is the shortest, with 17,086.018 m of the NDC and 17,480.785 m of the NBC, indicating that the centripetal force of the spatial behavior of tourists was towards the Old City of Nanjing during the epidemic.
On the other hand, the attractions with high values of NDC visited by tourists shrink to the Old City of Nanjing more than the attractions with high values of NBC. The short-axis length ( σ x ) of the attractions after the outbreak has also been reduced compared to before the outbreak, from 28,544.32 m to 21,035.754 m (Table 7), indicating that the distribution of tourists to the attractions with high values of degree centrality after the epidemic has also shrunk toward the Old City of Nanjing. However, the short axis of the attractions with high values of NBC after the outbreak was almost the same as before the outbreak, indicating that the overall distribution of the intermediate visits did not shrink or disperse before the epidemic.
In terms of the location of tourists’ spatial behavior, the attractions as the final travel destinations for visitors in Nanjing generally shifted to the northeast of the city after the epidemic, and the intermediate attractions in Nanjing during their visits have generally shifted to the southwest of the city (Figure 5). As shown in Table 7, taking the center of the ellipse of the NDC of the attractions in Nanjing before the outbreak as the starting point, the center was shifted by 134.862 m (offset distance) to the northeast when the outbreak occurred and by 510.356 m (offset distance) to the northeast after the outbreak. Taking the center of the ellipse of the NBC of the attractions in Nanjing before the outbreak as the starting point, the center of the circle shifted by 1124.645 m (offset distance) to the southwest when the epidemic occurred, and the center of the circle shifted by 419.649 m (offset distance) to the southwest after the outbreak.

3.3.2. Spatial Trajectory Changes

By comparing the spatial behavior path of tourists in Nanjing after the outbreak with that before the outbreak, the new tourist routes after the outbreak and the exiting tourist routes with changes are obtained. Generally speaking, after the outbreak of the epidemic, whether it is a new tourist route or the old tourist route, the peak increase appears in the Old City of Nanjing (Figure 6 and Figure 7), while the peak decrease in the old tourist route appears between the Old City of Nanjing and the City of Nanjing (Figure 7). To a certain extent, it is confirmed that after the epidemic outbreak, the spatial behavior of urban tourists in Nanjing has shrunk toward the Old City of Nanjing.
In addition, the activity of urban tourists in attractions in the northeast of the Old City of Nanjing increased. Compared with before the outbreak, whether it is from the old tourist route (Figure 6) or a new tourist route (Figure 7), routes with high contact strength all pass through Xuanwu Lake, the Xiaoling Tomb of Ming Dynasty, the Mausoleum of Sun Yat-sen, and Meiling Palace in the northeast of the Old City of Nanjing. To a certain extent, it also supports the spatial characteristics of Nanjing’s tourist hotspots shifting to the northeast of the city after the outbreak.

4. Discussion

This paper tries to apply social network analysis in revisualization research to analyze the changes in the spatial behavior network and pattern of urban tourists under the influences of COVID-19, taking Nanjing as a case. Compared with the traditional methods, which are travel dairies or a space–time prism, to study spatial behavior, the novel technology that combines big data methods with SNA can improve the efficiency of data capture and the illustration of travel connections. Moreover, by combining SNA with ArcGIS, this article not only successfully shows the connections among different attractions in Nanjing, but it also makes the relationships more visualized on the ground. The related indicators of the connection strength, degree centrality, betweenness centrality, the O–D model, and the standard deviation ellipses of urban tourist attractions expressed from the tourist trajectory all point to effects of the COVID-19 epidemic that reduced the overall spatial behavior of urban tourists, increased the popularity of urban parks and natural attractions, and highlighted the importance of large areas of natural landscapes in the central city.

4.1. The Overall Contraction of Urban Tourists’ Spatial Behavior

By setting up a comparative analysis of before, during, and after the epidemic, this article found that after the epidemic (including the epidemic occurred), the spatial behavior of tourists in Nanjing overall contracted. The density of spatial behavior networks in Nanjing has increased, and the values of Network Centrality and the Network Betweenness Centrality have increased to varying degrees. Moreover, the conclusions of increased centripetal force and decreased directionality in the standard deviation ellipse analysis all support the change characteristics of the overall contraction of urban tourists’ spatial behavior after the outbreak.

4.2. Increased Popularity of Natural Attractions and Park Attractions

What is the specific contraction object? We calculated the degree centrality and betweenness centrality of tourist attractions and found that after the outbreak of the epidemic, urban park attractions and urban natural attractions in Nanjing have become more popular as a whole. In the analysis of the NrNDC of scenic spots, the value of urban natural attractions after the outbreak increased in the first place. In the context of the overall network shrinking toward highly centralized attractions, further shrinkage further occurred towards urban natural attractions with a high probability. In the analysis of NrNBC, a horizontal comparison shows that the values of urban park attractions and urban natural attractions have increased to varying degrees after the outbreak. The urban park attraction has the highest value of NBC, followed by the urban natural attraction. Moreover, after the epidemic, urban park attractions have become an essential intermediate point in the urban tourist routes, and the probability of visiting urban natural attractions in the middle of the route has also increased.
Generally speaking, before the outbreak of the epidemic, the probability of visiting attractions in Nanjing were urban architectural attractions, urban park attractions, and urban natural attractions, in order, and the probability of visiting intermediate attractions during the journey were urban park attractions and urban architectural attractions, and urban park attractions, in sequence. However, after the outbreak of the epidemic, the order of visiting changes into urban natural attractions, urban park attractions, and urban architectural attractions, and passing attractions on the way with high possibility is urban park attractions, urban natural attractions, and urban architectural attractions. As a whole, it is shown that under the influence of the COVID-19 epidemic, the popularity of urban natural attractions has increased overall, and the passage of urban parks has increased in Nanjing.

4.3. The Importance of a Large Area of the Natural Landscape in the City

What is the scope of the shrinkage in tourists’ spatial behavior in the city? Is it directional? In the case study of Nanjing in this article, it is found that the centripetal force of the overall travel behavior has increased; that is, the travel behavior has shrunk toward the Old City of Nanjing. Moreover, after the epidemic, the center of the standard deviation ellipse for the centrality of attractions in Nanjing was shifted by about 500 m to the northeast. In the spatial visualization analysis of the tour route after the epidemic, it also shows that the tour area composed of urban park attractions and urban natural attractions with the highest connection strength relationship in the overall tour behavior network, such as Xuanwu Lake, the Xiaoling Tomb of Ming Dynasty, and Meiling Palace, are all in the northeast of the Old City of Nanjing, whose position is also consistent with the offset direction of the center of the standard deviation ellipse. Furthermore, the area where these attractions are located is a continuous area of gardens and woodlands composed of Xuanwu Lake and Zijin Mountain, with an area of approximately 36.02 square kilometers and accounting for about one-third of the area of the Old City of Nanjing. Therefore, this also shows that the large area of the natural landscape in the city has become the prominent place of urban tourists’ spatial behavior after the epidemic, and its importance is highlighted in the post-epidemic era.
It is common in many well-known cities to have a large area of the natural landscape in the main city, such as Central Park in New York, the green belt in the London metropolitan area, and Hyde Park in Sydney. Similarly, the living concept of “near the mountain and by the river” has long been one of the ideal concepts for building cities in China, and the Xuanwu Lake–Zijin Mountain area in Nanjing is a model of large-scale natural landscapes in urban cities in China. Some scholars believe that urban parks and street parks positively impact residents suffering from the epidemic and can improve the happiness of residents [9,10]. This article also confirms that it found further result that urban tourism in Nanjing is shrinking towards significant natural attractions in the central city after COVID-19. Therefore, for urban tourism development in the post-epidemic era, this article believes that the city government should respect and understand the new selection characteristics and spatial changes of urban tourist behavior and guide more elements to protect and promote large-scale natural landscape with convenient locations and facilities.

5. Conclusions

The COVID-19 epidemic has become one of the most significant public health events in human history. Under the external constraints of such massive changes, the tourism industry, which is extremely sensitive to changes in the external environment, has had a profound impact. This article respects the transformation of the behavioral geography research paradigm and new information technology in human geography to study the impacts of COVID-19 on urban tourists’ spatial behavior. It uses big data technology to obtain user comment data from Ctrip.com and uses Social Network Analysis in Ucinet and ArcGIS geographic visualization analysis from a non-aggregated perspective to identify the trajectory information of comment users before, during, and after the epidemic. Moreover, the study takes Nanjing City as a case study and pre-classifies all attractions into three cluster groups: urban architectural attraction, urban park attraction, and urban natural attraction, according to the land classification of the Third National Land Survey in China. In general, after the outbreak, the tourist behavior choices of urban tourists have changed. First of all, the spatial behavior of urban tourists has shrunk as a whole, while Nanjing has shown an overall characteristic of convergence to the main urban area. Secondly, urban architectural landscapes are no longer the primary choice for urban tourists to travel. Natural environmental landscapes such as open spaces, suitable social distancing areas, and green landscapes have become a high probability choice for urban tourists in the post-epidemic era. Nanjing City shows that the urban park attractions and urban natural attractions in the Xuanwu Lake-Zijin Mountain area northeast of the central city have become the primary hotspot for urban tourists. Furthermore, this article believes that in the post-epidemic era, the large-scale natural landscape in the city should be the key to the recovery and development of urban tourism.
This article respects the research orientation of traditional human geography after the transformation in research methods. It uses non-aggregated data and big data to study the spatial behavior of urban tourists, and the conclusions drawn are consistent with the general impact of the epidemic on human travel habits. However, this article still has many research deficiencies: (1) The sample size and credibility of the review data related to real life. This article uses the big data method to capture the data from Ctrip.com. However, the sample size is still an order of magnitude different from the actual number of tourists visiting Nanjing each year (more than 150 million people in 2020). In addition, from a rigorous point of view, this article, in fact, captures the tourists’ behavior in cyberspace, and there are still some professional commenters in the comment data. Whether their characteristics can represent the actual characteristics of visiting tourists is worthy of further discussion. (2) The research method still stays on the characteristics of temporal and spatial changes. The comment content of social media big data can also further explore the characteristics closer to individual behavior, such as the impact of the epidemic represented by the emotion of the comment content, keywords, and focus content. The deficiencies of these studies may provide space for further discussion and new trends in research on the combination of human geography and social media big data.

Author Contributions

Conceptualization, Yu Gao and Dongqi Sun; methodology, Yu Gao; formal analysis, Yu Gao; writing—original draft preparation, Yu Gao.; writing—review and editing, Jingxiang Zhang; visualization, Yu Gao; supervision, Dongqi Sun; funding acquisition, Jingxiang Zhang. All authors have read and agreed to the published version of the manuscript.

Funding

This research was funded by National Natural Science Foundation of China, Grant No. 52078245.

Institutional Review Board Statement

Not applicable.

Informed Consent Statement

Not applicable.

Data Availability Statement

The data presented in this study are openly available in [FigShare] at [https://doi.org/10.6084/m9.figshare.16759834.v1] accessed on 4 October 2021.

Conflicts of Interest

The authors declare no conflict of interest.

References

  1. Sigala, M. Tourism and COVID-19: Impacts and implications for advancing and resetting industry and research. J. Bus. Res. 2020, 117, 312–321. [Google Scholar] [CrossRef] [PubMed]
  2. Chinazzi, M.; Davis, J.T.; Ajelli, M.; Gioannini, C.; Litvinova, M.; Merler, S.; Piontti, Y.; Pastore, A.; Mu, K.; Rossi, L.; et al. The effect of travel restrictions on the spread of the 2019 novel coronavirus (COVID-19) outbreak. Science 2000, 368, 395–400. [Google Scholar] [CrossRef] [PubMed] [Green Version]
  3. Zhang, Y.; Lingyi, M.; Peixue, L.; Lu, Y.; Zhang, J. COVID-19’s impact on tourism: Will compensatory travel intention appear? Asia Pac. J. Tour. Res. 2021, 26, 732–747. [Google Scholar] [CrossRef]
  4. WHO. Director-General’s Opening Remarks at the Media Briefing on COVID-19. Available online: http://www.un.org.cn/info/7/1044.html (accessed on 15 August 2021).
  5. Liu, W.D. The impacts of COVID-19 Pandemic on the development of economic globalization. Geogr. Res. 2020, 39, 1439–1449. (In Chinese) [Google Scholar]
  6. Duong, C.D. The impact of fear and anxiety of COVID-19 on life satisfaction: Psychological distress and sleep disturbance as mediators. Personal. Individ. Differ. 2021, 178, 110869. [Google Scholar] [CrossRef]
  7. Feng, L.-S.; Dong, Z.-J.; Yan, R.-Y.; Wu, X.-Q.; Zhang, L.; Ma, J.; Zeng, Y. Psychological distress in the shadow of the COVID-19 pandemic: Preliminary development of an assessment scale. Psychiatry Res. 2020, 291, 113202. [Google Scholar] [CrossRef] [PubMed]
  8. DeGrace, S.; Baptist-Mohseni, N.; Single, A.; Keough, M.T.; Wardell, J.D.; Stewart, S.H. Sex differences in maladaptive emotional and behavioral responses to COVID-19: What is the role of personality? Personal Individ. Differ. 2021, 178, 110834. [Google Scholar] [CrossRef]
  9. Cheng, Y.; Zhang, J.; Wei, W.; Zhao, B. Effects of urban parks on residents’ expressed happiness before and during the COVID-19 pandemic. Landsc. Urban Plan. 2021, 212, 104118. [Google Scholar] [CrossRef]
  10. Lehberger, M.; Kleih, A.K.; Kai, S. Self-reported well-being and the importance of green spaces—A comparison of garden owners and non-garden owners in times of COVID-19. Landsc. Urban Plan. 2021, 212, 104108. [Google Scholar] [CrossRef]
  11. Cui, H.; Kertész, J. Attention dynamics on the Chinese social media Sina Weibo during the COVID-19 pandemic. EPJ Data Sci. 2021, 10, 1–16. [Google Scholar] [CrossRef]
  12. Venter, Z.S.; Barton, D.N.; Gundersen, V.; Figari, H.; Nowell, M. Urban nature in a time of crisis: Recreational use of green space increase during the COVID-19 outbreak in Oslo, Norway. Environ. Res. Lett. 2020, 15, 104075. [Google Scholar] [CrossRef]
  13. Zecca, C.; Gaglione, F.; Laing, R.; Gargiulo, C. Pedestrian routes and accessibility to urban services: An urban rhythmic analysis on people’s behavior before and during the COVID-19. TeMA J. Land Use Mobil. Environ. 2020, 13, 241–256. [Google Scholar]
  14. Sun, Y.; Huang, Y.; Yuan, K.; Chan, T.O.; Wang, Y. Spatial patterns of COVID-19 incidence in relation to crime rate across London. ISPRS Int. J. Geo-Inf. 2021, 10, 53. [Google Scholar] [CrossRef]
  15. Irawan, M.Z.; Belgiawan, P.F.; Joewono, T.B.; Bastarianto, F.F.; Rizki, M.; Ilahi, A. Exploring activity-travel behavior changes during the beginning of COVID-19 pandemic in Indonesia. Transportation 2021, 1–25. [Google Scholar] [CrossRef]
  16. Cro, S.; Martins, A.M. Structural breaks in international tourism demand: Are they caused by crises or disasters? Tour. Manag. 2017, 63, 3–9. [Google Scholar] [CrossRef] [PubMed]
  17. Wut, T.M.; Xu, J.B.; Wong, S. Crisis management research (1985–2020) in the hospitality and tourism industry: A review and research agenda. Tour. Manag. 2021, 85, 104307. [Google Scholar] [CrossRef]
  18. Novelli, M.; Burgess, L.G.; Jones, A.; Ritchie, B.W. ‘No Ebola…still doomed’—The Ebola-induced tourism crisis. Ann. Tour. Res. 2018, 70, 76–87. [Google Scholar] [CrossRef] [PubMed]
  19. Henderson, J.C.; Ng, A. Responding to crisis: Severe acute respiratory syndrome (SARS) and hotels in Singapore. Int. J. Tour. Res. 2004, 6, 411–419. [Google Scholar] [CrossRef]
  20. Rassy, D.; Smith, R.D. The economic impact of H1N1 on Mexico’s tourist and pork sectors. Health Econ. 2013, 22, 824–834. [Google Scholar] [CrossRef] [PubMed]
  21. Tran, C.C.; Yost, R.S.; Yanagida, J.F.; Saksena, S.; Fox, J.; Sultana, N. Spatio-temporal occurrence modeling of highly pathogenic avian influenza subtype H5N1: A case study in the Red River Delta, Vietnam. ISPRS Int. J. Geo-Inform. 2013, 2, 1106–1121. [Google Scholar] [CrossRef] [Green Version]
  22. Hall, C.M.; Scott, D.; Gössling, S. Pandemics, transformations and tourism: Be careful what you wish for. Tour. Geogr. 2020, 22, 577–598. [Google Scholar] [CrossRef]
  23. Gssling, S.; Scott, D.; Hall, C.M. Pandemics, tourism and global change: A rapid assessment of COVID-19. J. Sustain. Tour. 2020, 29, 1–20. [Google Scholar] [CrossRef]
  24. Yang, T.T.; Ruan, W.Q.; Zhang, S.N.; Li, Y.Q. The influence of the COVID-19 pandemic on tourism demand for destinations: An analysis of spatial heterogeneity from a multi-scale perspective. Asia Pac. J. Tour. Res. 2021, 26, 793–810. [Google Scholar] [CrossRef]
  25. Lee, C.K.; Song, H.J.; Bendle, L.J.; Kim, M.J.; Han, H. The impact of non-pharmaceutical interventions for 2009 H1N1 influenza on travel intentions: A model of goal-directed behavior—ScienceDirect. Tour. Manag. 2012, 33, 89–99. [Google Scholar] [CrossRef]
  26. Mao, C.K.; Ding, C.G.; Lee, H.Y. Post-SARS tourist arrival recovery patterns: An analysis based on a catastrophe theory. Tour. Manag. 2010, 31, 855–861. [Google Scholar] [CrossRef]
  27. Lee, C.C.; Chen, C.J. The reaction of elderly Asian tourists to avian influenza and SARS. Tour. Manag. 2011, 32, 1421–1422. [Google Scholar] [CrossRef]
  28. Cooper, M. Japanese tourism and the SARS epidemic of 2003. J. Travel Tour. Mark. 2006, 19, 117–131. [Google Scholar] [CrossRef]
  29. Kuo, H.-I.; Chen, C.-C.; Tseng, W.-C.; Ju, L.-F.; Huang, B.-W. Assessing impacts of SARS and Avian Flu on international tourism demand to Asia. Tour. Manag. 2008, 29, 917–928. [Google Scholar] [CrossRef]
  30. Chen, M.H. The response of hotel performance to international tourism development and crisis events. Int. J. Hosp. Manag. 2011, 30, 200–212. [Google Scholar] [CrossRef]
  31. Wen, Z.; Huimin, G.; Kavanaugh, R.R. The impacts of SARS on the consumer behavior of Chinese domestic tourists. Curr. Issues Tour. 2005, 8, 22–38. [Google Scholar] [CrossRef]
  32. Hu, F.; Teichert, T.; Deng, S.; Liu, Y.; Zhou, G. Dealing with pandemics: An investigation of the effects of COVID-19 on customers’ evaluations of hospitality services. Tour. Manag. 2021, 85, 104320. [Google Scholar] [CrossRef]
  33. Shen, Y.; Chai, T.; Kwan, M. Space–time fixity and flexibility of daily activities and the built environment: A case study of different types of communities in Beijing suburbs. J. Transp. Geogr. 2015, 47, 90–99. [Google Scholar] [CrossRef]
  34. Golledge, R.G. Behavioral geography and the theoretical/quantitative revolution. Geogr. Anal. 2008, 40, 239–257. [Google Scholar] [CrossRef]
  35. Golledge, R.G.; Stimson, R.J. Spatial Behaviour: A Geographic Perspective; The Guilford Press: New York, NY, USA, 1997. [Google Scholar]
  36. Chai, Y.W.; Ta, N. Recent progress of behavioral geographic research in China. Arid Land Geogr. 2011, 34, 1–11. (In Chinese) [Google Scholar]
  37. Huang, X.T. A study on temporal-spatial behavior pattern of tourists based on time-geography science—A case study of Summer Palace, Beijing. Tour. Trib. 2009, 24, 82–87. (In Chinese) [Google Scholar]
  38. Hagerstrand, T. What about people in regional science? Pap. Reg. Sci. 1986, 24, 143–158. [Google Scholar]
  39. Golledge, R.G.; Clark, G. Some spatial characteristics of Iowa’s dispersed farm population and their implications for the grouping of central place functions. Econ. Geogr. 1966, 42, 261–272. [Google Scholar] [CrossRef]
  40. Clark, W.A.V.; Rushton, G. Models of intra urban consumer behavior and their implications for central place theory. Econ. Geogr. 1970, 46, 486–497. [Google Scholar] [CrossRef]
  41. Kwan, M. Gender differences in space-time constraints. Area 2000, 32, 145–156. [Google Scholar] [CrossRef]
  42. Ta, N.; Kwan, M.-P.; Chai, Y.; Liu, Z. Gendered space-time constraints, activity participation and household structure: A case study using a GPS-based activity survey in suburban Beijing, China. J. Econ. Hum. Geogr. 2016, 107, 505–521. [Google Scholar] [CrossRef]
  43. Deng, M.; Athanasopoulos, G. Modelling Australian domestic and international inbound travel: A spatial–temporal approach. Tour. Manag. 2011, 32, 1075–1084. [Google Scholar] [CrossRef] [Green Version]
  44. Xia, J.C.; Zeephongsekul, P.; Packer, D. Spatial and temporal modelling of tourist movements using Semi-Markov processes. Tour. Manag. 2011, 32, 844–851. [Google Scholar] [CrossRef] [Green Version]
  45. Martins, L.F.; Gan, Y.; Ferreira-Lopes, A. An empirical analysis of the influence of macroeconomic determinants on World tourism demand. Tour. Manag. 2017, 61, 248–260. [Google Scholar] [CrossRef] [Green Version]
  46. Golledge, R.G. Geography and the disabled: A survey with special reference to vision impaired and blind populations. Trans. Inst. Br. Geogr. 1993, 18, 63–85. [Google Scholar] [CrossRef]
  47. Hägerstrand, T. Geography and the study of interaction between nature and society. Geoforum 1976, 7, 329–334. [Google Scholar] [CrossRef]
  48. Miller, H.J. A measurement theory for time geography. Geogr. Anal. 2005, 37, 17–45. [Google Scholar] [CrossRef]
  49. Bauder, M. Using GPS supported speed analysis to determine spatial visitor behaviour. Int. J. Tour. Res. 2015, 17, 337–346. [Google Scholar] [CrossRef]
  50. Edwards, D.; Griffin, T. Understanding tourists’ spatial behaviour: GPS tracking as an aid to sustainable destination management. J. Sustain. Tour. 2013, 21, 580–595. [Google Scholar] [CrossRef]
  51. Pettersson, R.; Zillinger, M. Time and space in event behaviour: Tracking visitors by GPS. Tour. Geogr. 2011, 13, 1–20. [Google Scholar] [CrossRef]
  52. Kidd, A.M.; Monz, C.; D’Antonio, A.; Manning, R.E.; Reigner, N.; Goonan, K.A.; Jacobi, C. The effect of minimum impact education on visitor spatial behavior in parks and protected areas: An experi-mental investigation using GPS-based tracking. J. Environ. Manag. 2015, 162, 53–62. [Google Scholar] [CrossRef]
  53. Yun, H.J.; Park, M.H. Time-space movement of festival visitors in rural areas using a smart phone application. Asia Pac. J. Tour. Res. 2015, 20, 1246–1265. [Google Scholar] [CrossRef]
  54. Smallwood, C.B.; Beckley, L.E.; Moore, S.A. An analysis of visitor movement patterns using travel networks in a large marine park, north-western Australia. Tour. Manag. 2011, 33, 517–528. [Google Scholar] [CrossRef] [Green Version]
  55. Pettebone, D.; Newman, P.; Lawson, S.R. Estimating visitor use at attraction sites and trailheads in Yosemite National Park using automated visitor counters. Landsc. Urban Plan. 2010, 97, 229–238. [Google Scholar] [CrossRef] [Green Version]
  56. Zhen, F.; Cao, Y.; Qin, X.; Wang, B. Delineation of an urban agglomeration boundary based on Sina Weibo microblog ‘check-in’ data: A case study of the Yangtze River Delta. Cities 2017, 60, 180–191. [Google Scholar] [CrossRef]
  57. Shelton, T.; Poorthuis, A.; Zook, M. Social media and the city: Rethinking urban socio-spatial inequality using user-generated geographic information. Landsc. Urban Plan. 2015, 142, 198–211. [Google Scholar] [CrossRef]
  58. Bollen, J.; Pepe, A.; Mao, H. Modeling public mood and emotion: Twitter sentiment and socio-economic phenomena. In Proceedings of the 5th International AAAI Conference on Weblogs and Social Media (ICWSM 2011), Barcelona, Spain, 17–21 July 2011. [Google Scholar]
  59. Stieglitz, S.; Dang-Xuan, L. Emotions and information diffusion in social media—Sentiment of microblogs and sharing behavior. J. Manag. Inf. Syst. 2013, 29, 217–248. [Google Scholar] [CrossRef]
  60. Li, C.; Zhao, Y.; Sun, X.; Su, X.; Zheng, S.; Dong, R.; Shi, L. Photography-based analysis of tourists’ temporal–spatial behaviour in the Old Town of Lijiang. Int. J. Sustain. Dev. World Ecol. 2011, 18, 523–529. [Google Scholar] [CrossRef]
  61. Ghermandi, A. Analysis of intensity and spatial patterns of public use in natural treatment systems using geotagged photos from social media. Water Res. 2016, 105, 297–304. [Google Scholar] [CrossRef]
  62. Orsi, F.; Geneletti, D. Using geotagged photographs and GIS analysis to estimate visitor flows in natural areas. J. Nat. Conserv. 2013, 21, 359–368. [Google Scholar] [CrossRef]
  63. Szczepanek, R. Analysis of pedestrian activity before and during COVID-19 lockdown, using webcam time-lapse from Cracow and machine learning. PeerJ 2020, 8, e10132. [Google Scholar] [CrossRef]
  64. Cullen, I.G. The treatment of time in the explanation of spatial behavior. Timing Space Spacing Time 1978, 2, 27–38. [Google Scholar]
  65. Wolfe, A.W. Social network analysis: Methods and applications. Contemp. Sociol. 1995, 91, 219–220. [Google Scholar] [CrossRef]
  66. Freeman, L.C. Centrality in social networks conceptual clarification. Soc. Netw. 1978, 1, 215–239. [Google Scholar] [CrossRef] [Green Version]
  67. Freeman, L.C. A set of measures of centrality based on betweenness. Sociometry 1977, 40, 35–41. [Google Scholar] [CrossRef]
Figure 1. The Location of Nanjing City (left) and the illustration of study area (right).
Ijgi 10 00678 g001
Figure 2. Research Methods and Analysis Framework.
Ijgi 10 00678 g002
Figure 3. Statistic of data captured from Ctrip.com and data used in three comparative groups.
Ijgi 10 00678 g003
Figure 4. The location and cluster of attractions in Nanjing.
Ijgi 10 00678 g004
Figure 5. The results of SDE analysis by using the value of NDC (left) and NBC (right).
Ijgi 10 00678 g005
Figure 6. The exiting tourist routes with changes in Nanjing.
Ijgi 10 00678 g006
Figure 7. The new tourist routes with Changes after the outbreak in Nanjing.
Ijgi 10 00678 g007
Table 1. The example of the research sample from the Ctrip website.
No.AttractionLocationLongitude and Latitude (WGS 1984)User ID.Date of
Comment
Comment
7185Xiaoling Tomb of Ming DynastyNo. 7 Shixiang Road, Xuanwu District, Nanjing118.836 *, 32.049 *M27 **** 088713 October 2020It’s an old scenic area, it’s fun and nice …. Let’s play it first.
Note: The contents in Field Attraction, Location, and Comment are translated to English. The longitude *, Latitude * are approximated by three decimal places. **** is used to protect the privacy of User ID.
Table 2. The sample of OD. Model.
No. of RouteOrientation Destination Connection Strength
1Attraction oneAttraction twonumber of visits
Table 3. Data statistics of comparative groups and attractions clusters.
BeforeDuringAfter
Number of Comments76937607664
Number of Attractions400175427
Quantity subtotalPercentageQuantity subtotalPercentageQuantity subtotalPercentage
Urban Architectural attraction26867%11766.86%30070.26%
Urban Park Attraction5112.75%2212.57%5212.18%
Urban Natural Attraction8120.25%3620.57%7517.56%
Table 4. Node connection strength and the top five high-connection travel routes.
BeforeDuringAfter
Connection number969710736142
Network Density1.4981.2242.063
Connection Strength
RankOrientationDestinationValueOrientationDestinationValueOrientationDestinationValue
1Zhan Garden (1)Confucius Temple-Qinhuai River Scenic Area (1)69Confucius Temple (1)Confucius Temple-Qinhuai River Scenic Area (1)7Xiaoling Tomb of Ming Dyn-asty (2)Meiling Palace (3)77
2Confucius Temple-Qinhuai River Scenic Area (1)Zhan Garden (1)53Confucius Temple (1)Xuanwu Lake (2)6Xiaoling Tomb of Ming Dyn-asty (2)Qixia Mountain (3)76
3Nanjing Niushoushan Cultural Tourism Zone (3)Xiaoling Tomb of Ming Dynasty (2)47Confucius Temple (1)Imperial Examination Museum of China (1)5Meiling Palace (3)The Giant Baoen Temple (2)64
4Xiaoling Tomb of Ming Dynasty (1)Qixia Mountain (3)44-- Xuanwu Lake (2)Nanjing Museum (1)63
5Confucius Temple (1)Zhan Garden (1)39-- Xuanwu Lake (2)Xiaoling Tomb of Ming Dynasty (2)62
Note: In the table (1) = urban architectural attractions; (2) = urban park attractions; (3) = urban natural attractions.
Table 5. Network and node degree centrality.
BeforeDuringAfter
C R D 0.03110.06780.0525
RankAttractionCluster C R D i AttractionCluster C R D i AttractionCluster C R D i
1Confucius Temple(1)0.023Confucius Temple(1)0.071Xiaoling Tomb of Ming Dynasty(2)0.025
2Nanjing Museum(1)0.019Zhan Garden(1)0.056Xuanwu Lake(2)0.021
3Zhan Garden(1)0.018Lovers’ Garden(2)0.055Meiling Palace(2)0.021
4Xiaoling Tomb of Ming Dynasty(2)0.018Zijin Mountain Scenic Area(3)0.052Confucius Temple(1)0.015
5Qixia Mountain(3)0.017Xuanwu Lake(2)0.050Nanjing Museum(1)0.014
C R D i
Type of AttractionsAverage ValueRankAverage ValueRankAverage ValueRank
Urban Architectural Attractions0.0035820.0123720.002383
Urban Park Attractions0.0038110.0179510.002882
Urban Natural Attractions0.0030730.0115130.003291
Note: In the table (1) = urban architectural attractions; (2) = urban park attractions; (3) = urban natural attractions.
Table 6. Network and node betweenness centrality.
BeforeDuringAfter
C B 0.04930.05060.0637
RankAttractionCluster C R B i AttractionCluster C R B i AttractionCluster C R B i
1Nanjing Museum(1)5.137Zijin Mountain Scenic Area(3)5.477Confucius Temple(1)6.599
2Qixia Mountain(3)5.013Xuanwu Lake(2)5.339Xuanwu Lake(2)5.797
3Xuanwu Lake(2)4.334East Zhonghua Gate Historical Culture Block(1)5.027Qixia Mountain(3)5.046
4Xin Jiekou(1)3.669Meihua Mountain(2)4.997Xiaoling Tomb of Ming Dynasty(2)4.373
5Confucius Temple(1)2.948Confucius Temple(1)4.662East Zhonghua Gate Historical Culture Block(1)4.090
C R B i
Type of AttractionsAverage ValueRankAverage ValueRankAverage ValueRank
Urban Architectural Attractions0.25020.48320.2463
Urban Park Attractions0.35511.20110.4631
Urban Natural Attractions0.20730.38030.3112
Note: In the table (1) = urban architectural attractions; (2) = urban park attractions; (3) = urban natural attractions.
Table 7. The results of SDE by using values of NDC and NBC.
Standard Deviation Ellipse of Normalized Degree Centrality (NDC)
Period S D E x (m) S D E y (m)Offset Distance (m) σ x (m) σ y (m) θ (degree)
Before 386,890.743 *3,548,155.424 *028,544.13256,006.365−1.750
During 387,009.677 *3,548,219.003 *134.86217,086.01834,506.7231866
After 387,049.364 *3,548,640.504 *510.35621,035.75436,836.7873489
Standard Deviation Ellipse of Normalized Betweenness (NBC)
Period S D E x (m) S D E y (m)Offset Distance (m) σ x (m) σ y (m) θ (degree)
Before 386,997.338 *3,548,779.576 *025,310.22950,901.9298212
During 386,768.756 *3,547,678.406 *−1124.64517,480.78532,767.213−4.020
After 386,934.585 *3,548,364.646 *−419.64925,244.74043,732.8058757
Node: In order to launch geo-calculation, the Geographic Coordination System is transformed to GCS_Xian_1980 and projected by Xian_1980_3_Degree_GK_CM_120E. The longitude *, Latitude * are approximated by three decimal places.
Publisher’s Note: MDPI stays neutral with regard to jurisdictional claims in published maps and institutional affiliations.

