Article

Selective Pharmacological Activation of PPARα/δ/γ Alters the Triglyceride Composition of Fatty Liver in a Diet-Induced MASLD Mouse Model


1
Department of Health Chemistry, Showa Pharmaceutical University, Machida, Tokyo 194-8543, Japan
2
Department of Lipidomics, Graduate School of Medicine, The University of Tokyo, Bunkyo, Tokyo 113-0033, Japan
3
Department of Lipid Life Science, Japan Institute for Health Security, Shinjuku, Tokyo 162-8655, Japan
4
Department of Medical Lipid Science, Graduate School of Medicine, The University of Tokyo, Bunkyo, Tokyo 113-0033, Japan
*
Author to whom correspondence should be addressed.
These authors contributed equally to this work.
Biomolecules 2026, 16(8), 1078; https://doi.org/10.3390/biom16081078
Submission received: 15 June 2026 / Revised: 9 July 2026 / Accepted: 22 July 2026 / Published: 23 July 2026

Abstract

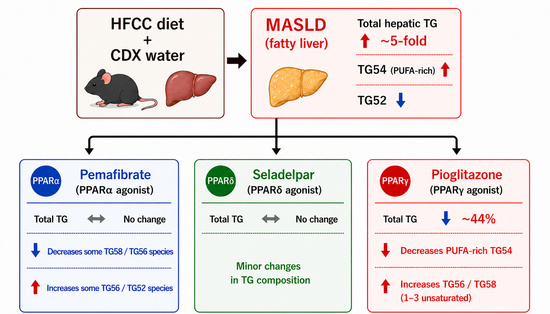
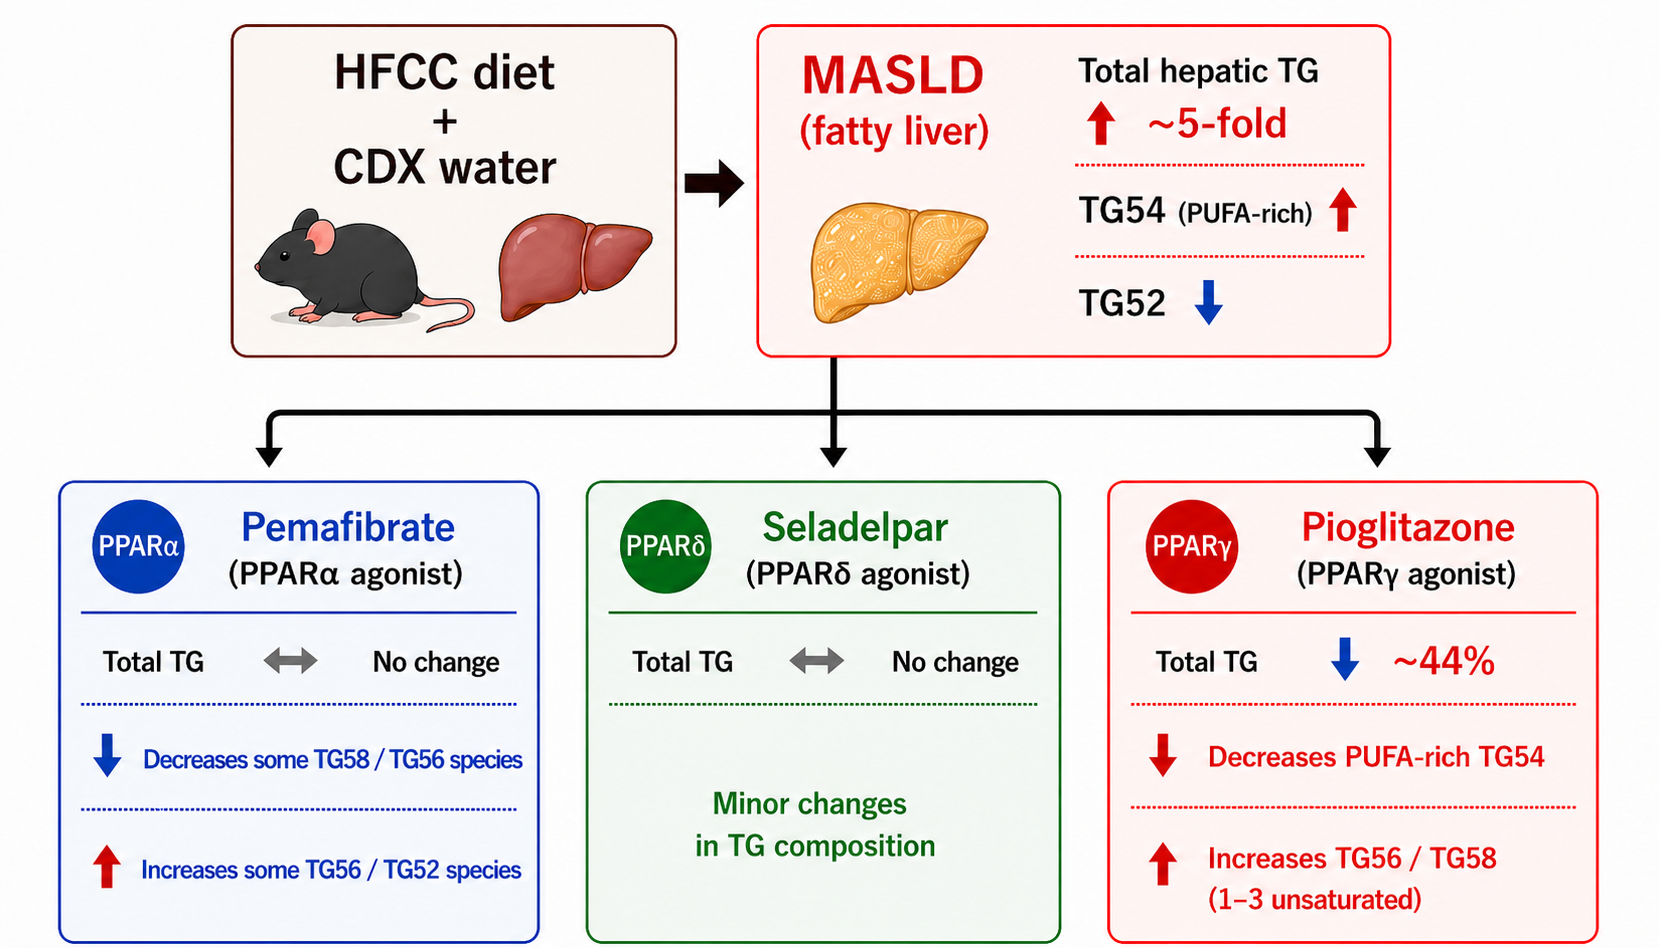
Various high-fat diets have been used to create animal models of metabolic dysfunction-associated steatotic liver disease (MASLD) and to evaluate the effect of various therapeutic drugs. We determined the effects of PPARα/δ/γ subtype-selective agonists (pemafibrate, seladelpar, and pioglitazone, respectively) on the hepatic triglyceride (TG) profile using LC–MS in a MASLD mouse model established by administering a high-fat/high-cholesterol/high-cholic acid (HFCC) diet combined with cyclodextrin-containing water, which is thought to induce fatty liver over a short period. The livers of mice fed the HFCC/CDX diet for four weeks exhibited an approximately fivefold increase in the summed TG LC–MS signal per unit liver weight and altered TG composition compared with normal livers of mice administered a standard diet/water. Specifically, the proportion of TG54 (TG with 54 carbon atoms) species doubled, whereas the proportion of TG52 decreased by 38%. Pemafibrate did not alter the relative total TG signal but decreased the proportion of some TG58/TG56 species and increased the proportion of some TG56/TG52 species. Seladelpar did not alter the relative total TG signal, while only slightly altering TG composition. Pioglitazone reduced the relative total TG signal by 44%, which included a decrease in the proportion of polyunsaturated fatty acid-rich TG54 and an increase in the proportion of TG58/TG56 with 1–3 unsaturated bonds. We are the first to demonstrate that selective activation of PPARα/δ/γ has different effects on the TG profile in fatty liver.

1. Introduction

There has been a global surge in patients with metabolic dysfunction-associated steatotic liver disease (MASLD), which begins with triglyceride (TG) accumulation in the liver. Numerous drugs targeting various molecular targets have been developed [1,2,3,4]; however, only two have been approved: resmetirom [5] and semaglutide [6]. While numerous drugs targeting various molecular pathways are currently under development, peroxisome proliferator-activated receptor (PPAR) agonists hold promise for inhibiting the early stages of MASLD—a process progressing from hepatic steatosis to lipotoxicity, inflammation, and fibrosis [2]. PPARs are nuclear receptor transcription factors comprising three subtypes—PPARα, PPARβ/δ, and PPARγ—which differ in their tissue distribution and physiological functions [7]. PPARs play a major role in regulating lipid metabolism: PPARα is mainly expressed in the liver, skeletal muscle, and heart, and induces fatty acid transport and mitochondrial/peroxisomal β-oxidation; PPARδ is expressed in most organs and drives fatty acid oxidation and energy uncoupling [8]; and PPARγ is mainly expressed in adipose tissues, and promotes adipocyte differentiation, fatty acid incorporation, and TG accumulation [9].
In a previous study [10], we used an early-stage mouse model of MASLD to systematically investigate the therapeutic effects of activating PPARα/δ/γ using clinically relevant drugs—specifically, agents that are already approved with established safety profiles or those currently undergoing clinical trials for MASLD. The agents employed were pemafibrate, seladelpar, and pioglitazone, which are selective agonists for PPARα/δ/γ, respectively [11]. Although various (genetic or dietary) animal models have been established to support drug discovery for MASLD, a model that fully captures the pathophysiological, biochemical, and histological characteristics of human MASLD (e.g., inflammation, fibrosis, and hepatocyte ballooning) remains elusive [12]. Studies have attempted to reproduce these characteristics by feeding experimental animals various high-fat diets (HFDs) that mimic Western eating habits [12,13]. We generated a mouse model of diet-induced MASLD by administering a high-fat/high-cholesterol/high-cholic acid (HFCC) diet and 1% cyclodextrin (CDX)-containing drinking water to mice [10]. Initially, we administered the HFCC diet and 2% CDX water, which Duparc et al. [14] suggested would induce symptoms of nonalcoholic steatohepatitis (NASH) within three weeks; however, extreme weight loss occurred [10]. Therefore, we reduced the water content of CDX to 1% and successfully established an early-stage MASLD-like pathology (massive TG accumulation and mild inflammation/fibrosis) in just four weeks.
Through such research, we hypothesized that the three PPAR subtypes might induce distinct patterns of TG accumulation in the fatty liver of this early-stage MASLD mouse model. The objective of this study was to systematically compare the effects of PPARα/δ/γ activation on the molecular remodeling of TG by performing lipid analysis using liquid chromatography–mass spectrometry (LC–MS) on frozen liver samples prepared in our previous study [10].

2. Materials and Methods

2.1. PPAR Agonists

Pemafibrate was kindly donated by Kowa Co., Ltd. (Tokyo, Japan). Seladelpar and pioglitazone were purchased from ChemScene (Monmouth Junction, NJ, USA) and Cayman Chemical (Ann Arbor, MI, USA), respectively.

2.2. Animals

C57BL/6J mice (C57BL/6JJcl) were purchased from CLEA Japan (Tokyo, Japan) and housed under the following controlled conditions: temperature 23 °C ± 1 °C, humidity 55% ± 5%, 12 h dark (8 PM to 8 AM)/12 h light cycle, and 4–5 mice housed in cages measuring 225 (width) × 338 (depth) × 140 (high) mm. The mice were fed CE-2 standard dry rodent feed (CLEA Japan) with free access to water. All experimental procedures using mice were performed in accordance with the “Guidelines for the Care and Use of Laboratory Animals (8th Edition)” issued by the U.S. National Research Council. This study was conducted with the approval of the Animal Experiment Committee of Showa Pharmaceutical University (approval numbers: P-2021-2 (validity period: April 2021–March 2024) and P-2024-4 (validity period: April 2024–March 2027)).

2.3. Creation of MASLD Model

Six-week-old C57BL/6J male mice were fed an HFCC [high-fat (60 kcal%)/high-cholesterol (1.25%)/high-cholic acid (0.5%); catalog number D11061901 (Research Diets, New Brunswick, NJ, USA)] diet with 1% (w/v) 2-hydroxypropyl-β-cyclodextrin (CDX; Fujifilm Wako Pure Chemical Corp., Osaka, Japan) water for four weeks to establish an early-stage MASLD model [10].
Numerous animal models have been developed for MASLD research, including genetic models, dietary models, and various combinations [1]. HFDs, high-fructose(/sucrose) diets, high-fat/high-cholesterol diets, and high-fat/high-cholesterol/high-fructose(/sucrose) diets have been widely used as diet-induced models [12,13,15]. Moreover, because methionine and choline are necessary for the synthesis of lipoproteins that circulate in the bloodstream and supply TGs throughout the body, methionine/choline-deficient diets (MCDs) have also been used to establish MASLD models, either alone or in combination with high-fat content [12,13]. Although MCDs are often superior to HFDs because they result in fatty liver and steatohepatitis associated with lobular inflammation and fibrosis over a short period, their phenotypes, including insulin resistance and inflammatory/fibrogenic gene expression, somehow differ from those observed in HFD-fed animals [13]. Therefore, it might not be considered an accurate human disease model. Because previous studies differ significantly in terms of dietary composition, administration method/duration, and animal species/sex/age, and the same experiments are rarely repeated and reproducible in multiple laboratories, it is likely that no animal model exists that can perfectly replicate human MASLD [13]. Thus, the reason for selecting the HFCC/CDX diet was that, compared with similar experiments [4,16], it was possible to induce fatty liver in inbred C57BL/6J mice over a short period without inducing significant weight changes or insulin resistance as an early-stage MASLD model [10].

2.4. Administration of PPAR Agonists in a MASLD Model

Food intake measurements were performed during PPAR agonist dose setting but were not continuously recorded throughout the entire treatment period in our previous study using the identical HFCC/CDX mouse model [10]. Based on the amount of food consumed, the maximum dose of each PPAR-selective agonist (0.1 mg/kg (body weight)/day for pemafibrate, 1 mg/kg/day for seladelpar, and 3 mg/kg/day for pioglitazone) that could be administered without significant weight changes and could confer selective activation of PPARα/δ/γ was determined [10]. These drugs were mixed into the HFCC feed and were ingested freely with the CDX fluid, achieving pharmacologically relevant blood drug concentrations [10]. Therefore, the present study was conducted using a previously validated fixed-dose regimen rather than a dose–response design.
Mice were randomly allocated to cages before treatment (five mice per cage; two cages per experimental group). Although medicated diets were supplied on a cage basis, all histological and lipid analyses were performed using independently collected liver samples from individual animals. Therefore, the individual mouse was considered the experimental unit for all statistical analyses.

2.5. Lipid Analysis

All liver specimens used for lipid analysis were obtained from the same animal experiment reported in our previous study [10]. Livers were quickly removed from isoflurane-anesthetized mice, flash-frozen in liquid nitrogen, and stored at −80 °C until lipid extraction without repeated freeze–thaw cycles. Lipid analyses were performed using coded samples to minimize analytical bias with respect to treatment allocation. A portion of frozen liver (20.6–30.8 mg) was transferred to a specific tube containing a metal grinder (Tokken Inc., Chiba, Japan) pre-cooled with liquid nitrogen. The frozen liver tissue was pulverized into a fine powder using a TK-AM7 AUTOMILL freeze grinding device (Tokken) [17]. The sample was then mixed with 0.8 mL of 2-propanol and stirred at 4 °C for 1 h using a rotator. The metal grinder was removed, and the tube was centrifuged at 20,000× g for 10 min at 4 °C. Finally, 0.65 mL of the supernatant was collected and stored at −80 °C until LC–MS analysis. The lipid samples were diluted 50-fold with 2-propanol just before the analysis.
TG analysis was performed using an LC–MS-8060NX triple quadrupole mass spectrometer (Shimadzu Corporation, Kyoto, Japan) equipped with a Nexera UHPLC (Shimadzu Corporation), with some modifications to the previously described method [18]. System control, data acquisition, and data evaluation were carried out using Shimadzu LabSolutions LCMS software version 5.9. Reversed-phase chromatography was performed using a Shimadzu Shim-pack Velox C18 column (2.1 × 50 mm, 2.7 µm). The injection volume was 1 µL, the column temperature was 45 °C, and the flow rate was 0.4 mL/min. Mobile phase A consisted of 20 mM NH4HCO2/water, and mobile phase B consisted of 20% acetonitrile and 80% 2-propanol. The pump gradient program [time (%B/%A)] was as follows: 0 min (85/15), 0.1 min (85/15), 8.4 min (95/5), 9 min (95/5), 9.1 min (85/15), and 11 min (85/15). The mass spectrometer parameters were as follows: 2.5 L/min for nitrogen gas (as a nebulizer), 10 L/min drying gas, 400 °C heat block, and 250 °C desolvation line. Argon gas was used for collision-induced dissociation. The multiple reaction monitoring (MRM) transitions, optimized based on preliminary experiments, were used to target the major TG species in the mouse liver [18]. In the transition, Q1 was defined as the parent ion of the ammonium adduct, and Q3 was as the product ion generated by neutrality loss (NL) of a fatty acyl chain. Therefore, the fatty acyl chain component of the TGs can be observed along with its respective NL ion (Supplementary Materials Data Source File worksheet 1). The names of the TGs were expressed as the sum of the carbon atoms and double bond equivalents of the three fatty acyl chains. Peak areas were calculated using TRACES software [19]. The TG carbon-number group signals were calculated as the sum of the MRM signals with the identical Q1 transition. The proportion of each TG type was expressed as parts per million (ppm) of the relative total TG signals (the sum of peak areas for all TG MRM signals). The LC–MS analysis was not intended to provide absolute quantification of total hepatic TG content.
No internal standard was used for the present targeted TG analysis. All liver samples were extracted using an identical protocol and analyzed consecutively under identical LC–MS conditions within a single analytical batch. To monitor analytical performance, human serum pool (Cosmo Bio, Tokyo, Japan) was analyzed before, during, and after the analytical batch using the same LC–MS panel. These technical QC measurements confirmed stable instrument performance throughout the analytical sequence. Therefore, batch correction was not performed.

2.6. Statistical Analysis

Data are expressed as the mean ± standard deviation (SD) (n: sample size). Individual statistical comparisons of the signals for each specific summed species were performed using Prism 9.5.1 (528) software (GraphPad, San Diego, CA, USA). Unpaired two-tailed Student t-test was used for comparisons between two groups, and a one-way ANOVA with Tukey’s multiple comparison test was used for comparisons between five groups. A p-value < 0.05 was considered statistically significant.

3. Results

3.1. Effects of PPARα/δ/γ-Selective Activation on Hepatic TG and Fibrosis Levels

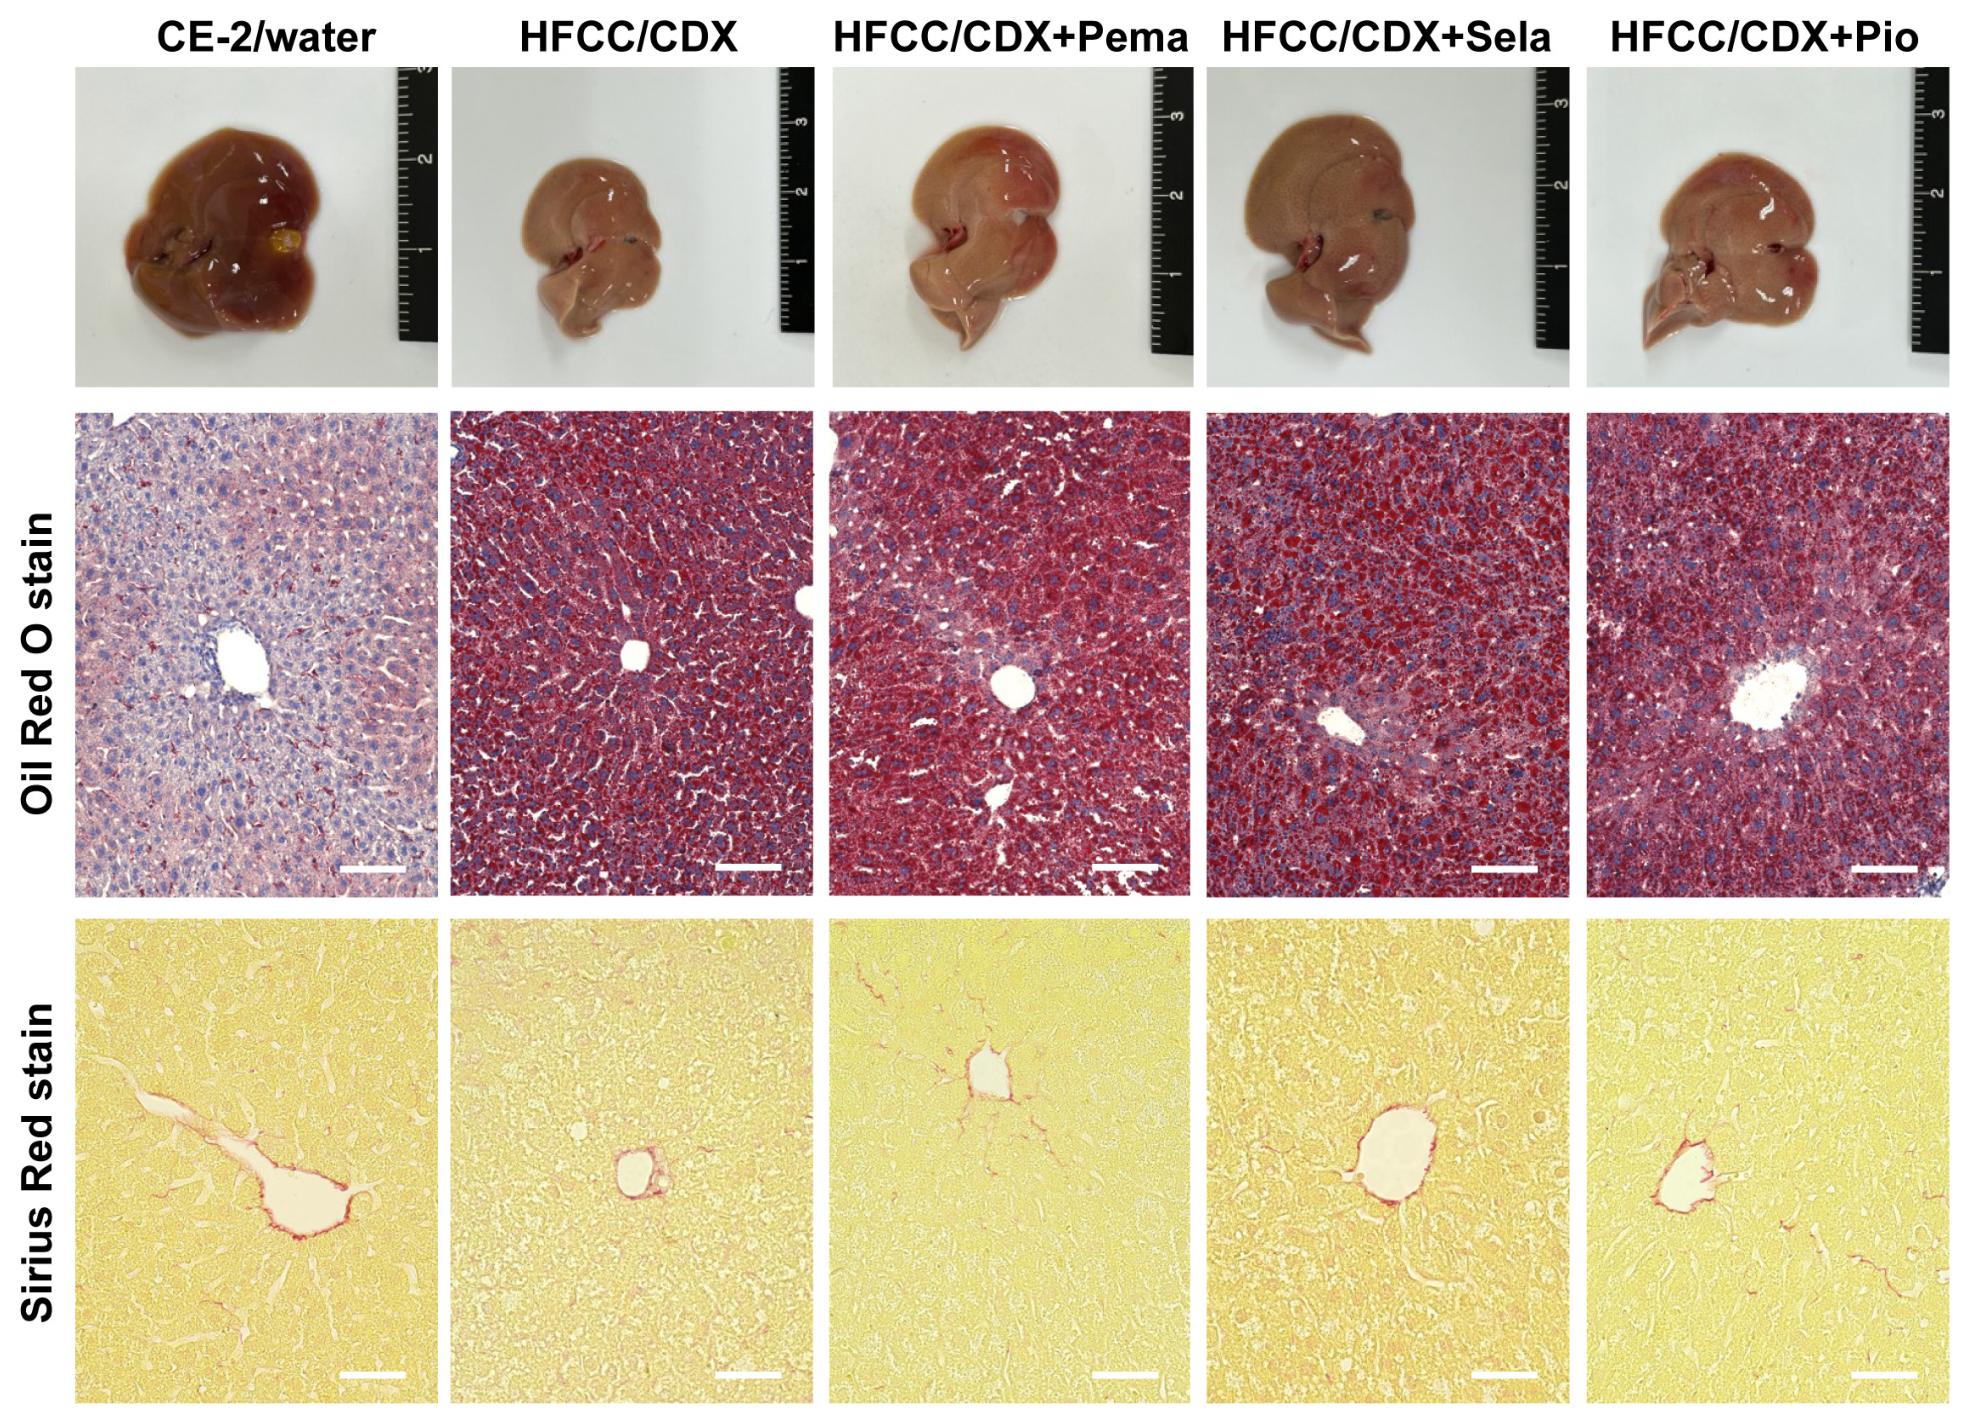
To determine the molecular changes in TGs preceding hepatic lipotoxicity/dysfunction, we created an early-stage MASLD model in which 6-week-old mice were fed an HFCC/CDX diet for 4 weeks, which resulted in significant TG accumulation (revealed by Oil Red O staining), but mild/limited fibrosis (revealed by Sirius Red staining) (Figure 1) [10]. During the same period, pemafibrate, seladelpar, and pioglitazone were added to the feed at 0.1, 1, and 3 mg/kg/day, respectively. These amounts did not have a significant effect on changes in body weight/liver weight and did not induce hepatocyte damage as evidenced by normal serum alanine/aspartate aminotransferase levels [10]. Histological examination of liver tissue sections revealed no significant changes in the summed TG LC–MS signal or fibrosis following the administration of pemafibrate, seladelpar, or pioglitazone (Figure 1).

3.2. LC–MS Analysis of TG Species in the MASLD Model

3.2.1. TG Profiling of Fatty Liver in Mice Administered HFCC/CDX

Although the composition of a standard CE-2 diet is not publicly available, its fat content has been reported to be 4.33% (average value of the shipped products in 2025, Supplementary Materials Table S1). On the other hand, the HFCC diet contains 10.0% soy bean oil [rich in polyunsaturated fatty acids (PUFAs), such as fatty acid (FA)18:2 (linoleic acid; 50.9% of fat according to USDA FoodData Central Food Details (Supplementary Materials Table S2)) and FA18:3 (α-linolenic acid; 6.6%)], 15.1% cocoa butter [rich in monounsaturated fatty acids (MUFAs), such as FA18:1 (oleic acid: 32.6%) and FA16:1 (palmitoleic acid; 0.2%)], and 7.0% coconut oil [rich in FA4:0–24:0 saturated fatty acids (SFAs)], with an estimated total fat content of 32% (Tables S1 and S2). HFCC also contains 0.584% sodium cholate, which may promote intestinal cholesterol absorption, increase plasma VLDL/LDL cholesterol levels, and decrease plasma HDL cholesterol levels [20]. CDX has a hydrophobic cavity within its cyclic structure that increases the solubility of cholate and cholesterol by forming an inclusion complex, which promotes intestinal absorption and hepatic deposition [16]. The combination of the HFCC diet and CDX beverage was first proposed by Duparc et al. to establish a dietary model of nonalcoholic steatohepatitis (NASH) over a short period of time [14].
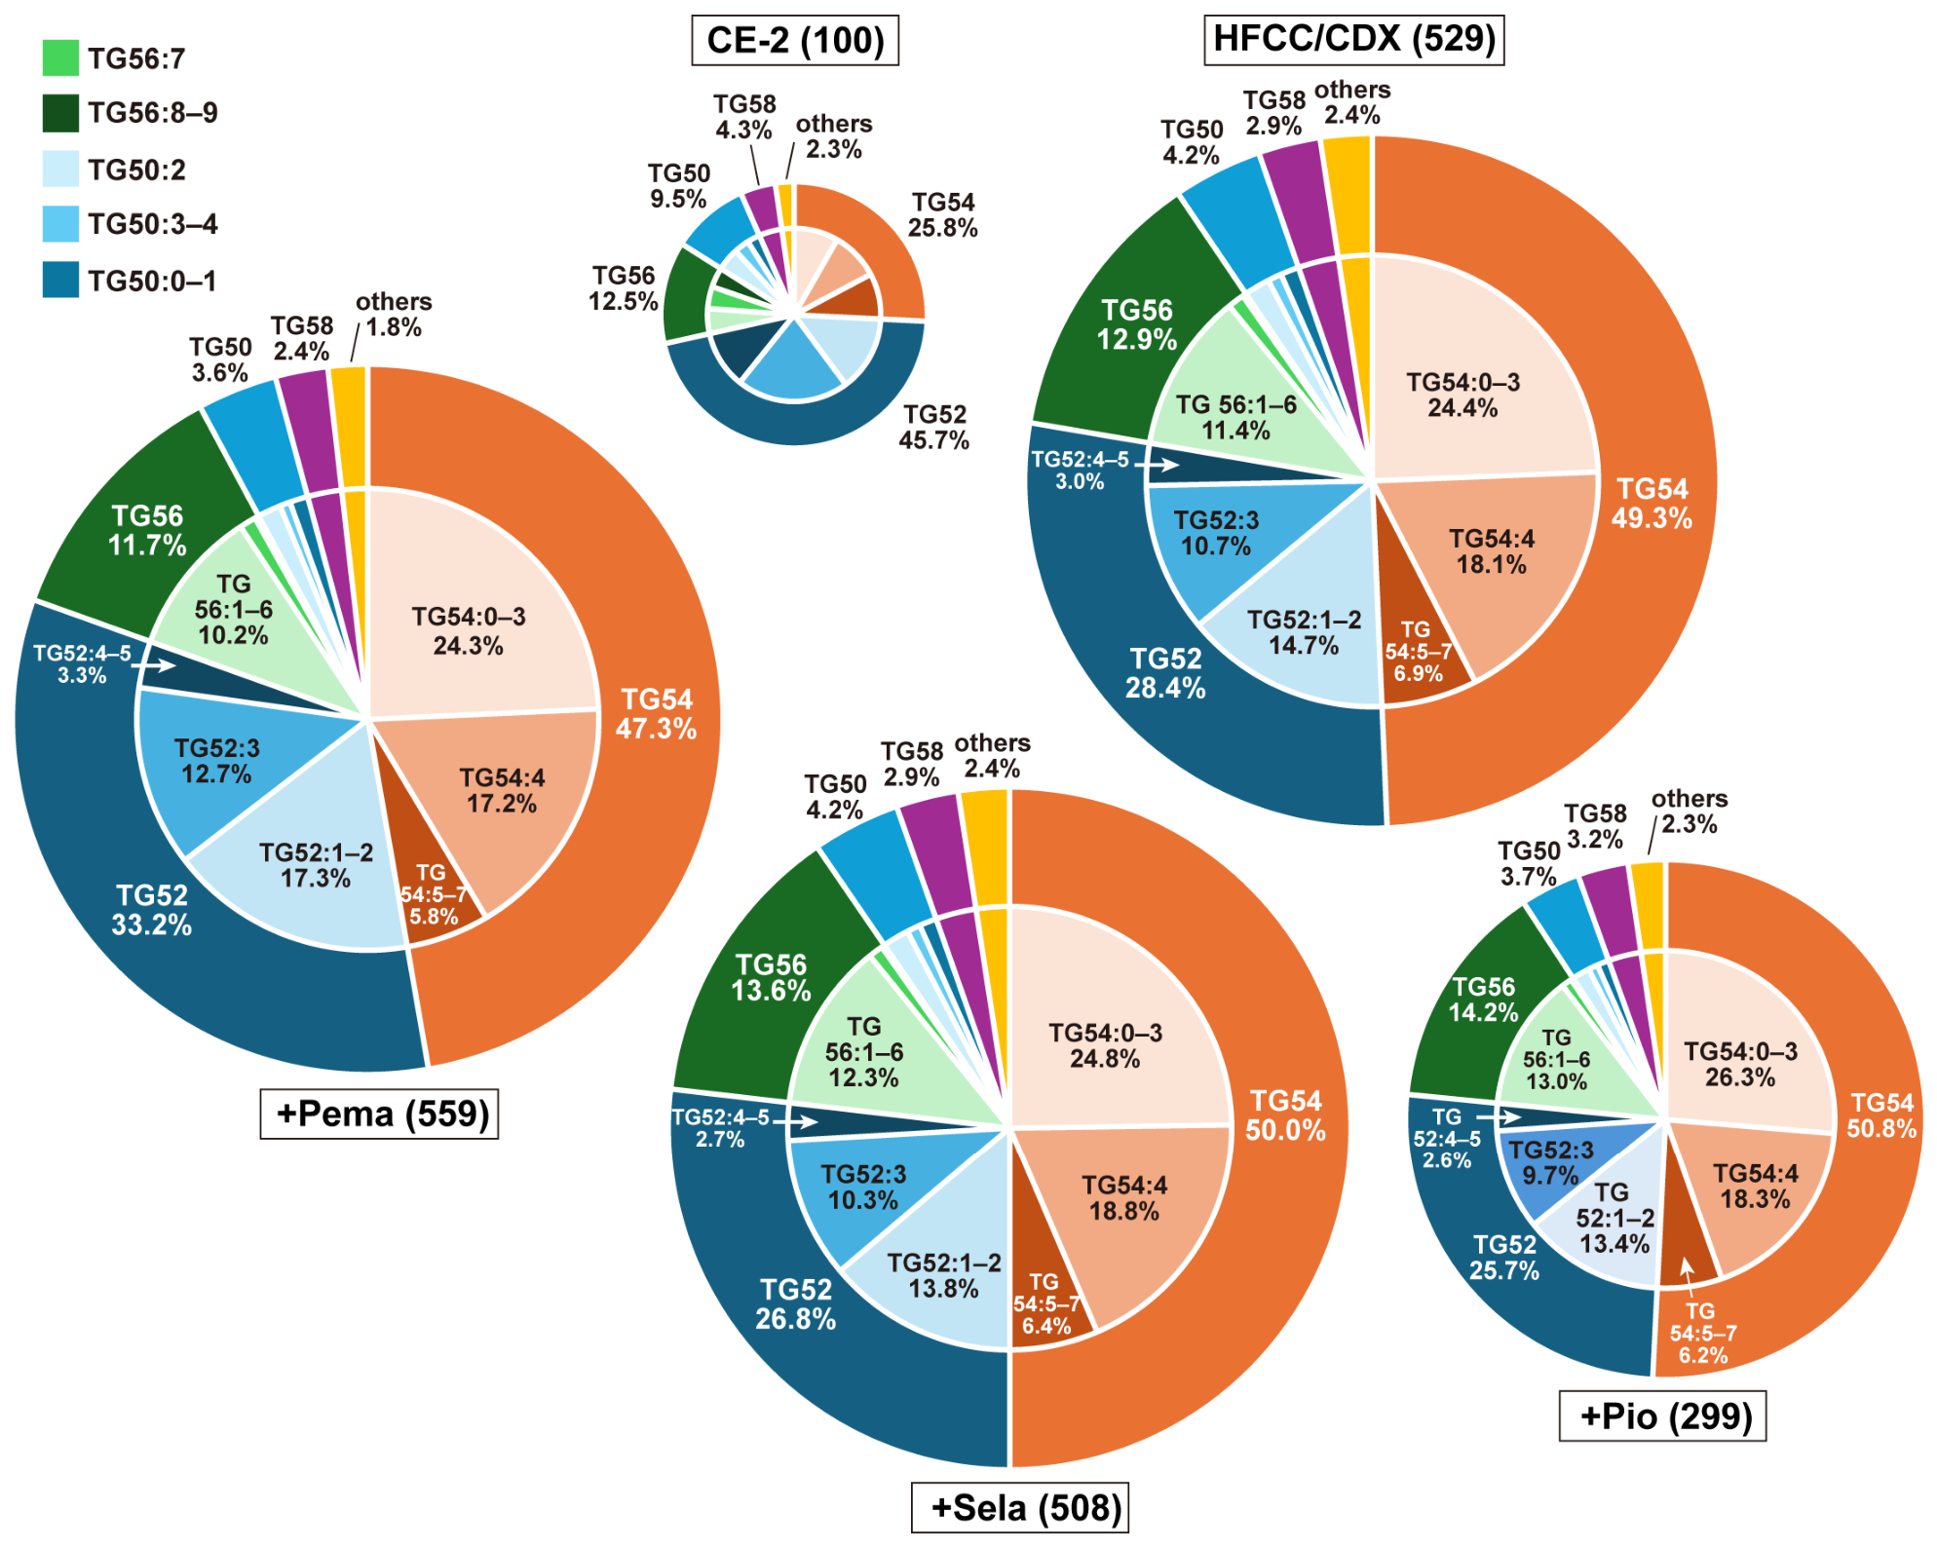
Our lipid TG analyses using LC–MS/MS detected a total of 225 different MRM signals (Data Source File worksheets 2 and 3). Administration of HFCC/CDX resulted in a > 5-fold increase in the relative total hepatic TG signal within four weeks (Figure 2). The proportion of TG54 nearly doubled with a significant decrease in the proportions of TG52, TG50, and TG58, while the proportions of TG56 and the others remained unchanged (Data Source File worksheet 4 and Figure 2). Among the TG54 species, a significant increase in the proportion of TG54:0–4 species was observed (Figure 2).

3.2.2. Effects of Pemafibrate on TG Components

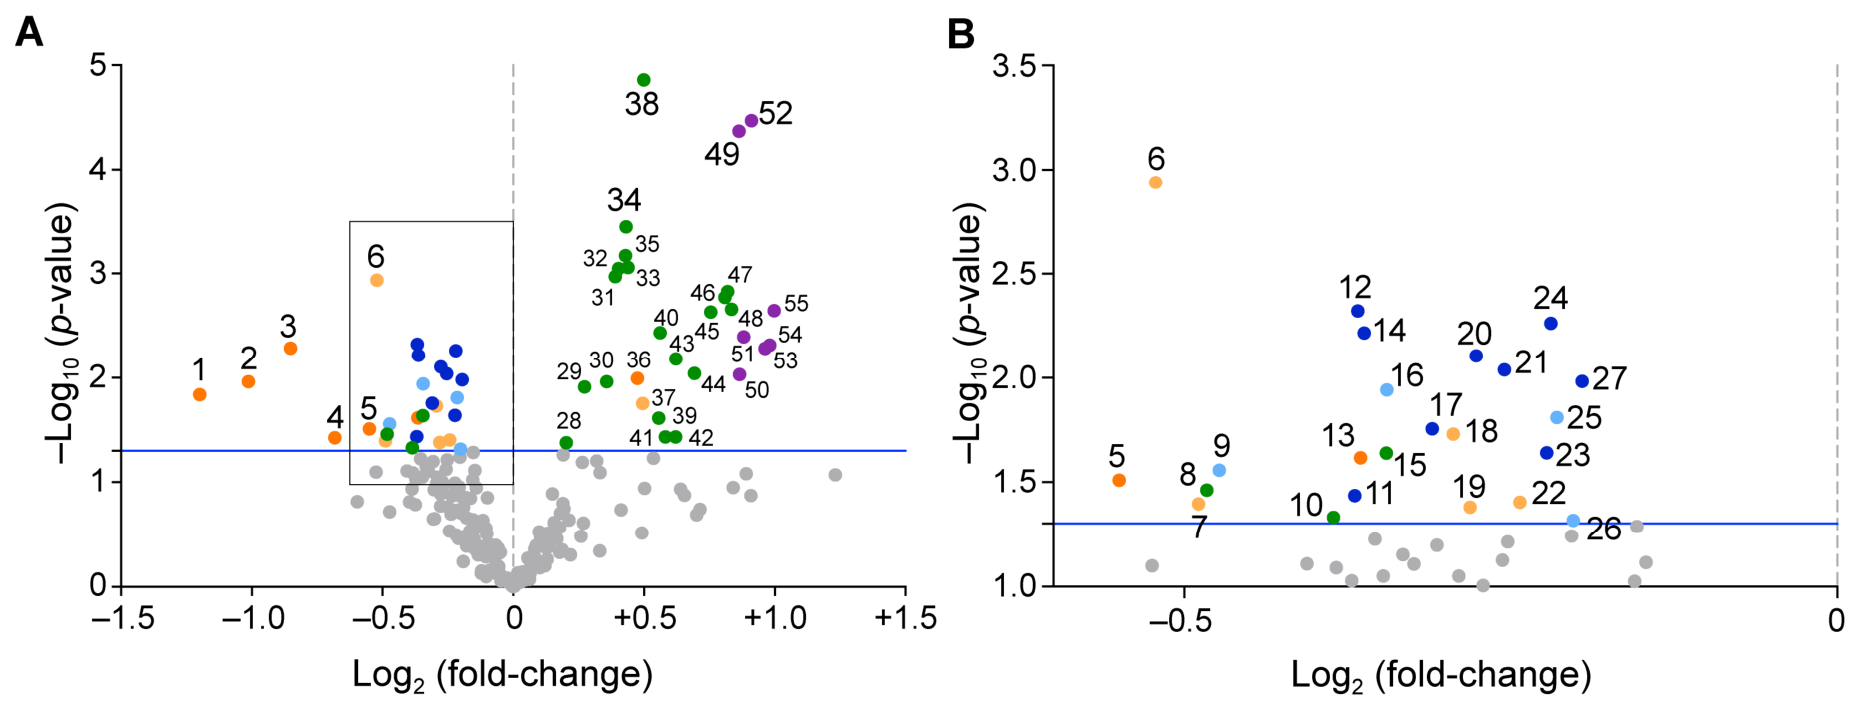
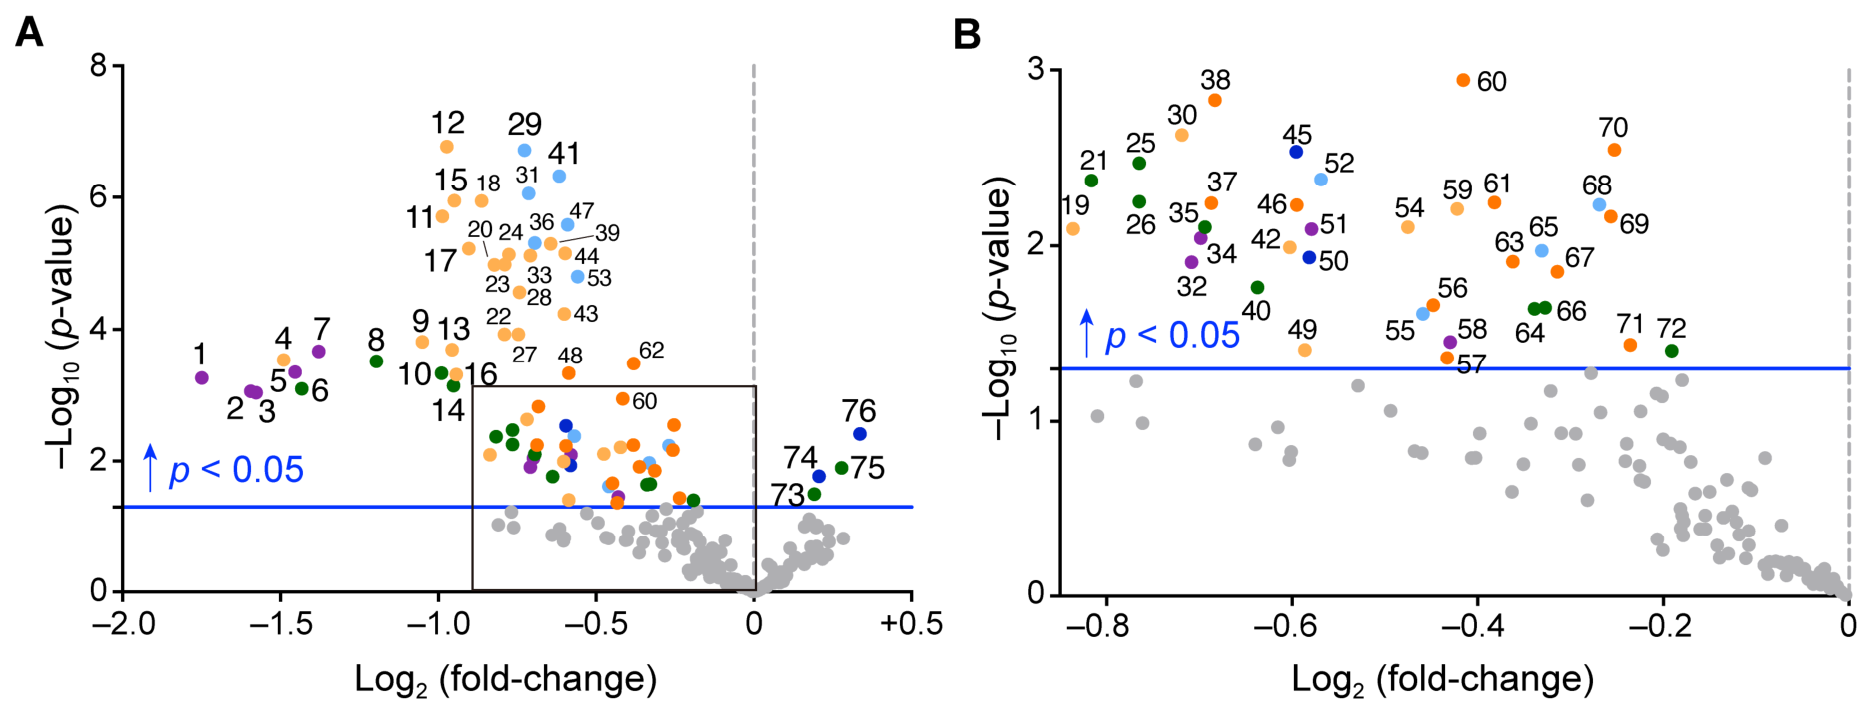
The administration of pemafibrate (0.1 mg/kg/day) had no significant effect on the relative total TG signal; however, the proportions of TG54, TG56, TG50, and TG58 decreased slightly, whereas the proportion of TG52 increased by 17% (Figure 2). A total of 72 TG species were significantly downregulated, while only four species were upregulated (Figure 3 and Table 1). Notably, five types of TG58:1–3 (IDs: 1, 2, 3, 5, and 7) were remarkably (70–62% down) downregulated with pemafibrate treatment. Furthermore, although the 29 TG species with fewer than 50 carbon atoms quantitatively account for only 2.4% or 1.8% of all TGs, 24 of them exhibited a significant decrease, albeit to varying degrees (61–28% down) (Figure 2 and Table 1).

3.2.3. Effects of Seladelpar on TG Components

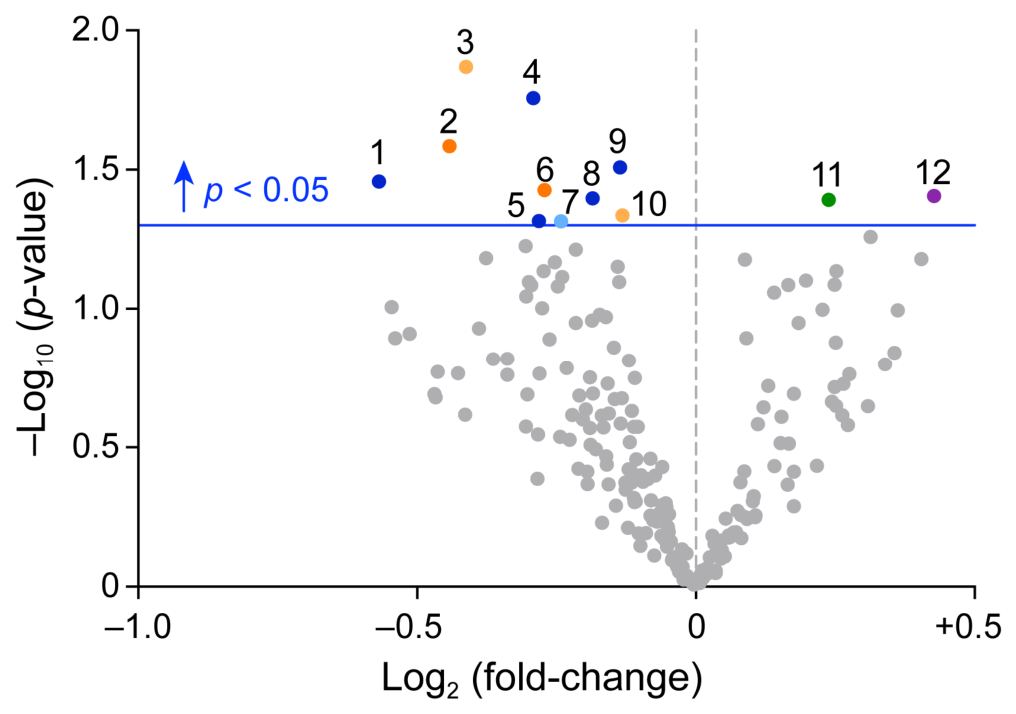
Seladelpar (1 mg/kg/day) administration showed no significant effect on the relative total TG signal and TG components (Figure 2). Although the proportion of the 10 types of TG species (TG50–54) with unsaturation degrees of 1–5 decreased by 9–33%, only the proportions of TG56:4-FA20:1 and TG58:3-FA18:1 increased by 18% and 34%, respectively (Figure 4 and Table 2).

3.2.4. Effects of Pioglitazone on TG Components

In contrast to pemafibrate and seladelpar, the administration of pioglitazone (3 mg/kg/day) significantly decreased the relative total TG signal by 44% without causing significant changes in the TG classification subcategory (Figure 2); however, the proportion of 55 TG species out of a total of 225 TG species decreased or increased (Figure 5 and Table 3), and these changes were characteristic of each subcategory in Figure 2. Namely, the five types of TG54:5–7 (IDs: 1–5) exhibited the largest decrease (56–32% down), followed by the nine types of TG52 (IDs: 11, 12, 14, 17, 20, 21, 23, 24, and 27) (23–13% down). In contrast, the 3 and 19 different TG56 species showed a significant decrease and increase, respectively (Figure 5 and Table 3). In particular, the 82–100% increase in seven types of TG58:1–3 (ID: 49–55) was significantly different from that observed with pemafibrate.

4. Discussion

This is the first study to examine how PPARα/δ/γ-selective agonists (pemafibrate, seladelpar, and pioglitazone) exert similar or different effects on the TG composition of fatty liver in a MASLD mouse model. Because PPAR agonists are expected to treat patients in the early stages of MASLD [2], we established a model by allowing mice to freely consume an HFCC/CDX diet for only four weeks (Figure 1) [10]. The HFCC/CDX model combines several dietary factors, including high fat, cholesterol, cholic acid, and cyclodextrin, each of which may influence hepatic lipid metabolism. Because the present study did not include control groups lacking individual dietary components, the specific contribution of each component to TG54 enrichment or drug-induced TG remodeling cannot be determined. Future studies using simplified dietary models or systematic comparisons of individual dietary components will be required to clarify the respective roles of these dietary factors.
Of the PPAR agonists that are expected to treat early-stage MASLD, similar to resmetirom (but different from semaglutide) [2], the pan agonist lanifibranor is the most advanced in clinical trials, followed by the α/γ dual agonist saroglitazar [4,21,22]. In addition, two phase 2 clinical trials have been initiated in Japan: a pemafibrate monotherapy trial (PRESEMT trial, NCT06623539) for non-alcoholic fatty liver disease (NAFLD) complicated with hypertriglyceridemia, and a combination therapy trial (NCT05327127) with pemafibrate and CSG452 (an SGLT2 inhibitor) for non-alcoholic steatohepatitis (NASH) with liver fibrosis [23]. Meanwhile, clinical trials involving seladelpar for NAFLD/NASH patients are currently suspended whereas trials involving pioglitazone have been ongoing for a decade [11]. Nevertheless, the effects of these drugs on the early progression of hepatic steatosis (e.g., before the diagnosis of MASLD) have not been thoroughly studied, either experimentally or clinically. Therefore, we determined how the activation of PPARα/δ/γ using approved selective agonists affects fatty liver formation in an MASLD model by comparing the hepatic TG composition.
When HFCC diets containing high concentrations of three lipid sources rich in SFAs, MUFAs, and PUFAs, respectively (Tables S1 and S2), were administered with CDX-containing drinking water, the composition of the TG54:0–4 group markedly increased (from 17.2% with CE-2/water to 42.5%; see Data Source File worksheet 4 and Figure 2). TG54:3_FA18:1 (oleic acid) appears to be the most abundant, and it could be one of the following molecules: TG54:3_FA18:1 × 3 (three FA18:1 are bound to sn-1–3 in the glycerol skeleton), TG54:3_FA18:1-FA16:0-FA20:2 (three different FAs are bound to sn-1–3), TG54:3_FA18:1-FA16:1-FA20:1, or TG54:3_FA18:1-FA18:0-FA18:2 (TG54:3_FA18:1-FA16:2-FA20:0 was not detected; Data Source File worksheets 2 and 3). One limitation of the lipid analysis was that, since we detected diacylglycerol species as fragment ions derived from TG ammonium adduct ions (parent ions [M + NH4]+) (Data Source File worksheet 1), it is unclear which FAs (except mentioned such as TG54:3_FA18:1) are attached to which positions of the glycerol, and which sn positions are prone to losing FAs; however, TG54:3_FA18:1, TG54:3_FA18:0, and TG54:3_FA18:2, which have high composition ratios, exhibited similar composition ratio patterns for each feed, whereas the TG54:3_FA16:0, TG54:3_FA16:1, TG54:3_FA20:1, and TG54:3_FA20:2, which have lower composition ratios, exhibited different patterns for each feed (Supplementary Materials Figure S1). These results suggest that there are specific locations within the TG molecule from which FAs are readily lost, and FA18:1, which is rich in all three lipid sources, was the major component of TG54:3. This supports the validity of our experimental system, which calculates the relative total TG signal by accumulating the signal values of each TG species (for which absolute quantification is not possible because of the lack of available TG standard substances). It is difficult to imagine that the TG composition of the liver of someone who frequently eats fatty meats would resemble that of such meat; however, this animal experiment suggests that it may be possible. In a recent 16-week randomized, parallel-group intervention trial involving 84 adults aged 22–36, the group that consumed nut snacks rich in MUFAs daily had higher plasma concentrations of MUFAs (present in the forms of phospholipids, diacylglycerols, TGs, cholesterol esters, and free FAs), as well as higher oleic acid content in their abdominal subcutaneous fat, compared to the control group that consumed carbohydrate snacks daily [24].
The present lipid analysis was designed to compare the relative abundance of TG molecular species among experimental groups. Because no internal standard was included, absolute correction for extraction efficiency and analytical variability was not possible. Nevertheless, all samples were analyzed under identical experimental conditions within a single analytical batch, and analytical stability was monitored using human serum pool analyzed throughout the measurement sequence. These procedures minimized technical variation; however, the lack of study-specific internal standards should be recognized as a limitation of the present study.
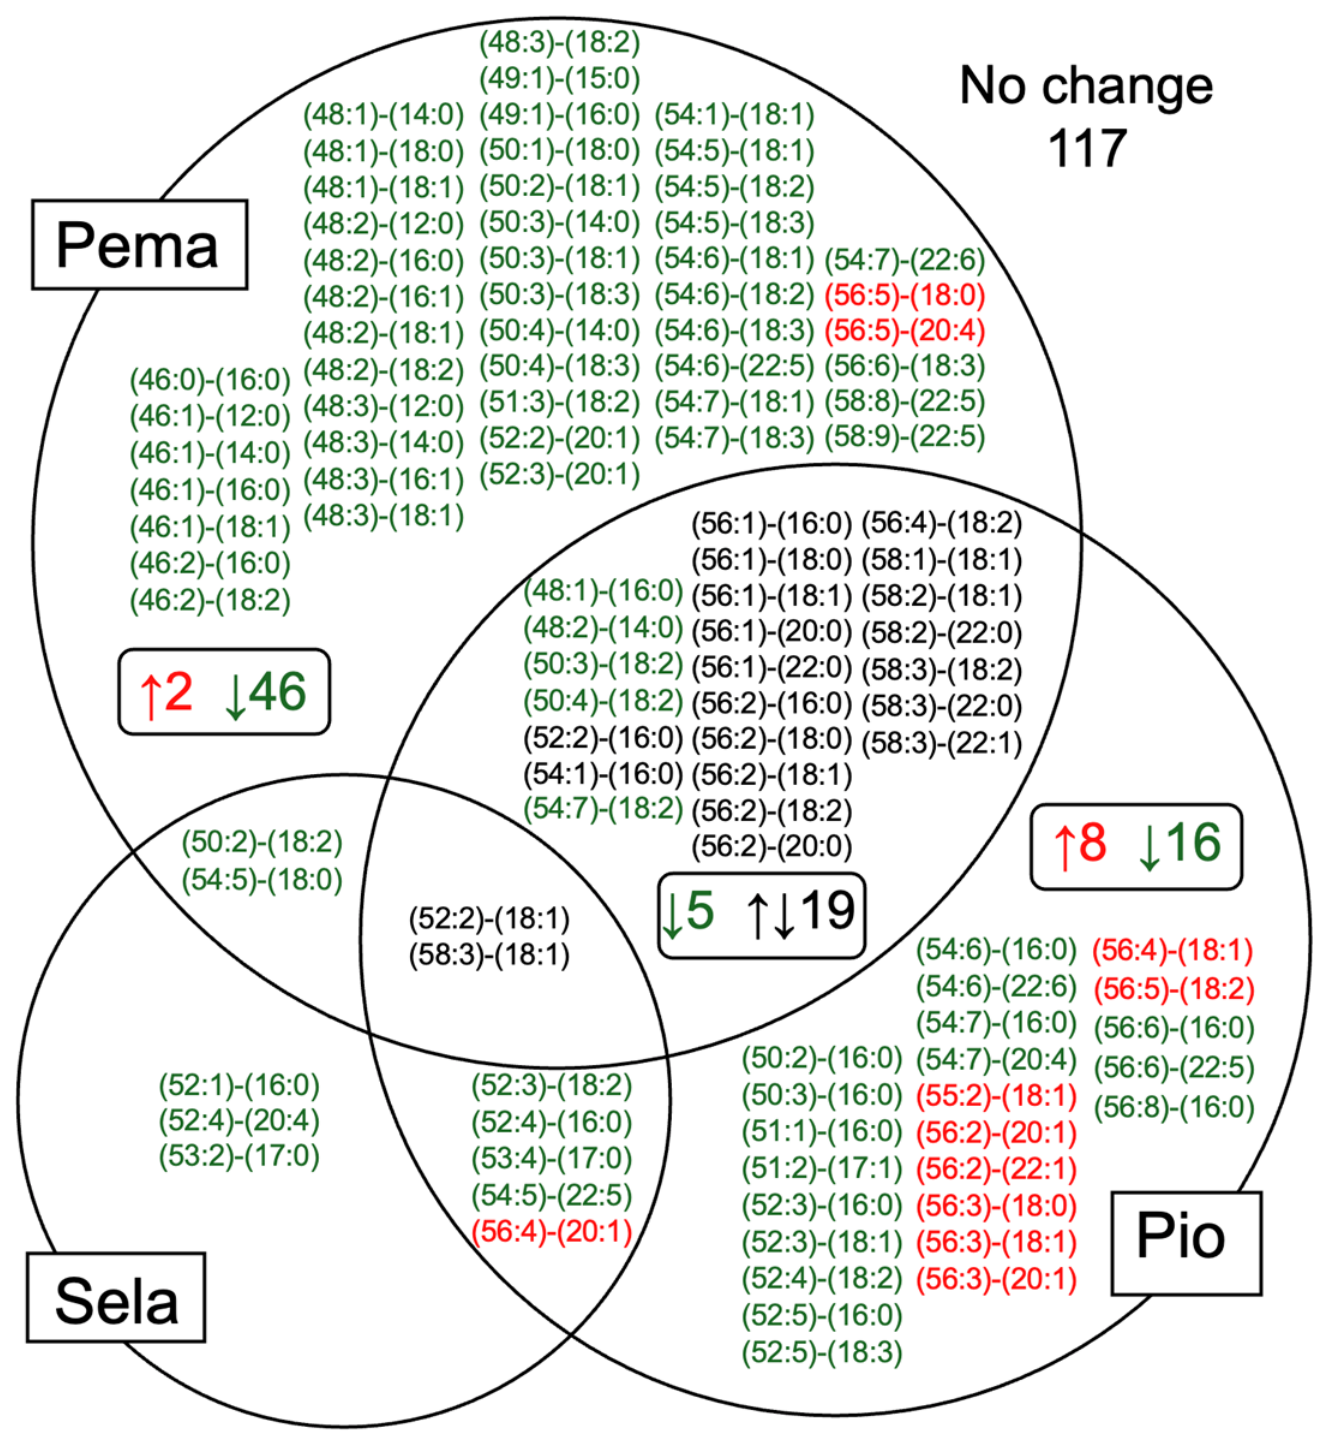
Figure 6 summarizes the results of classifying the 225 detected TG signals. Of these, the composition ratio of 76 TGs changed with pemafibrate stimulation, 12 TGs with seladelpar stimulation, and 55 TGs with pioglitazone stimulation (117 TGs remained unchanged). Of the three subtypes, PPARα is the primary regulator of hepatic lipid metabolism, and its agonists, known as fibrates, are used for decades to treat hypertriglyceridemia and hypercholesterolemia by reducing blood TG levels and increasing blood HDL-cholesterol levels. However, conventional fibrates (renal metabolism type) do not show efficacy against NAFLD, and in fact, they have side effects, such as renal dysfunction, which limits their effectiveness [9]. Recently, a next-generation fibrate pemafibrate (hepatic metabolism type) was developed as a selective PPARα modulator (SPPARMα) [25,26] containing a distinctive Y-shaped structure unlike other fibrates. It firmly binds to the PPARα ligand-binding site, and exhibits high PPARα selectivity/efficacy [27]. In this HFCC/CDX-induced MASLD model, pemafibrate treatment reduced serum TG levels without altering liver TG levels and Oil Red O-stained lipid droplets in the liver sections [10]. Consistently, pemafibrate did not superficially improve fatty liver (Figure 1) nor alter the relative total liver TG signal (Figure 2). However, unexpectedly, it significantly decreased the composition ratios of 72 TG species (most of which were present in small proportions), while increasing those of only 4 TG species (Figure 3 and Table 1). PPARα is physiologically activated upon fasting, perhaps by endogenous FAs released from TG stores [27]. Pemafibrate induces the expression of peroxisomal acyl-coenzyme A oxidase 1 (Acox1), enoyl-CoA hydratase, (short-chain, middle-chain, long-chain, and very long-chain) acyl-CoA dehydrogenase, as well as carnitine palmitoyl-CoA transferases 1a/2 (the components of peroxisomal and mitochondrial β-oxidation) in mouse liver in a PPARα-dependent manner [28]. Notably, the activity of pemafibrate, a TG-lowering drug, begins with the breakdown of such minor TG species.
Seladelpar did not significantly alter the relative total liver TG signal and their components (Figure 4 and Table 3). PPARδ agonists are promising drugs that combine the lipid metabolism-regulating effects of PPARα with the glucose metabolism-regulating effects of PPARγ [7], although studies remained limited compared with PPARα/γ. Consequently, the development of PPARδ agonists has been delayed, and the only approved PPARδ-selective agonist is seladelpar, which was only approved for use in primary biliary cholangitis in August 2024 following the results of the RESPONSE trial (NCT04620733) [29]. Seladelpar (1 mg/kg/day) maintained blood concentrations around the EC50 required for PPARδ activation observed in vitro, even after 4 weeks of administration [10], but this may be too low to significantly alter the quantity and quality of hepatic TGs.
Unlike the other two drugs, pioglitazone significantly reduces the relative total liver TG signal, resulting in a “balanced” change in the composition of 55 different TG species (27 decreased, 28 increased). Of these, there was a variety of effects in which some showed the same changes as those following pemafibrate or seladelpar administration, whereas some caused different changes, and some were unaffected (Figure 6). For cases in which the ratio increased following pioglitazone administration, most of the increases were induced specifically by pioglitazone stimulation. Of the 26 species that showed significant changes following pemafibrate and pioglitazone administration, 11 exhibited different directions of change, suggesting the opposing roles of PPARα and PPARγ. In our previous study, quantitative analyses of Oil Red O- and Sirius Red-positive areas in the liver sections revealed no statistically significant alteration among the treatment groups (except for reduced fibrosis upon pioglitazone treatment) [10]. Oil Red O staining and LC–MS evaluate different aspects of hepatic lipid accumulation. Oil Red O is a semi-quantitative histological method reflecting lipid droplet area within selected tissue sections, whereas LC–MS provides highly sensitive quantitative measurement of TG molecular species extracted from selected liver aliquots. Therefore, moderate changes in relative total liver TG signal or molecular composition may not necessarily be reflected by detectable differences in histological lipid staining.
Another limitation of this study is that the relationship between the observed changes in TG composition and the pathology/improvement of fatty liver in the MASLD model remains completely unknown. A meta-analysis of 23 studies revealed that oleic acid supplements improve blood lipid profiles [30]. Another meta-analysis of 26 randomized clinical trials involving 1244 participants also showed that dietary interventions with high-oleic acid diets slightly improve blood lipid profiles [31]. Therefore, it is unlikely that the massive hepatic accumulation of oleic acid (as TG forms), which makes up 70–80% of the components of olive oil—a heart of the Mediterranean diet—and is a ligand for PPARα/δ [27,32] and an activator of sirtuin 1 [33], and is responsible for a variety of physiological effects such as anti-inflammatory activity [34], would directly lead to the pathogenesis of MASLD. As another limitation, while we confirmed the specific induction of Acox1 as evidence of PPARα-selective activation by pemafibrate [10], the similar PPARδ/γ-specific target engagement effects of seladelpar and pioglitazone, respectively, remain to be demonstrated in future studies.

5. Conclusions

Using a MASLD mouse model, we clarified the similarities and differences in the effects of three approved PPARα/δ/γ-selective agonists on the TG profile of fatty liver. All three drugs are either currently in clinical trials for MASLD or expected to see a resumption of such trials; consequently, studies investigating their effects on the liver—even those involving animal models—are highly relevant. These findings provide new insight into PPAR subtype-specific regulation of hepatic TG remodeling and may facilitate the development of PPAR-targeted therapies for MASLD and other metabolic diseases.

Supplementary Materials

The following supporting information can be downloaded at https://www.mdpi.com/article/10.3390/biom16081078/s1: Table S1: The formulas and compositions of the CE-2 (standard) and D11061901 (HFCC) diets; Table S2: Fatty acid composition of soybean oil, cocoa butter, and coconut oil from the USDA FoodData Central Food Details; Figure S1: Comparison of the composition ratios of TG molecular species that can constitute TG54:3; Data Source File (a separate Excel file that has four worksheets).

Author Contributions

Conceptualization, A.H., S.K. and I.I.; methodology, T.H., A.H., S.K., S.M.T., Y.K. and H.S.; validation, T.H., A.H. and I.I.; formal analysis, T.H., A.H. and I.I.; investigation, A.H., R.T., Y.M., O.M., T.K., W.K., S.M.T., Y.K. and H.S.; resources, A.H., R.T., Y.M., O.M., T.K., S.K., W.K. and I.I.; data curation, T.H., A.H. and I.I.; writing—original draft preparation, I.I.; writing—review and editing, T.H., A.H. and I.I.; visualization, T.H., A.H. and I.I.; supervision, I.I.; project administration, A.H. and I.I.; funding acquisition, T.H., S.K. and I.I. All authors have read and agreed to the published version of the manuscript.

Funding

This research was funded in part by a Grant-in-Aid for Early Career Scientists (22K15049 to S.K.), a Grant-in-Aid for Scientific Research (C) (24K08642 to T.H.), and a Grant-in-Aid for Transformative Research Areas (A) (22H05577 to I.I.) from Japan Society for the Promotion of Science, and the Japan Institute for Health Security (JIHS) Intramural Research Fund (22T001 to H.S.).

Institutional Review Board Statement

This study was conducted with the approval of the Animal Experiment Committee of Showa Pharmaceutical University. Approval numbers: P-2021-2 (validity period: April 2021–March 2024) and P-2024-4 (validity period: April 2024–March 2027).

Informed Consent Statement

Not applicable.

Data Availability Statement

The data used to support the findings of this study are available upon request from the corresponding author.

Conflicts of Interest

The authors declare no conflicts of interest.

Abbreviations

The following abbreviations are used in this manuscript:
CDXCyclodextrin
FAFatty acid
HFCCHigh-fat/high-cholesterol/high-cholic acid
HFDHigh-fat diet
LC–MSLiquid chromatography–mass spectrometry
MASLDMetabolic dysfunction-associated steatotic liver disease
MCDMethionine/choline-deficient diet
MUFAMonounsaturated fatty acid
NAFLDNonalcoholic fatty liver disease
NASHNonalcoholic steatohepatitis
PPARPeroxisome proliferator-activated receptor
ppmparts per million
PUFAPolyunsaturated fatty acid
SFASaturated fatty acid
TGTriglyceride

References

  1. Friedman, S.L.; Neuschwander-Tetri, B.A.; Rinella, M.; Sanyal, A.J. Mechanisms of NAFLD development and therapeutic strategies. Nat. Med. 2018, 24, 908–922. [Google Scholar] [CrossRef] [PubMed]
  2. Vuppalanchi, R.; Noureddin, M.; Alkhouri, N.; Sanyal, A.J. Therapeutic pipeline in nonalcoholic steatohepatitis. Nat. Rev. Gastroenterol. Hepatol. 2021, 18, 373–392. [Google Scholar] [CrossRef] [PubMed]
  3. Devasia, A.G.; Ramasamy, A.; Leo, C.H. Current Therapeutic Landscape for Metabolic Dysfunction-Associated Steatohepatitis. Int. J. Mol. Sci. 2025, 26, 1778. [Google Scholar] [CrossRef] [PubMed]
  4. Prikhodko, V.A.; Okovityi, S.V. Current Drug Development Pipeline for MASLD and MASH: Focusing on Cardiovascular Comorbidities. Biomedicines 2026, 14, 909. [Google Scholar] [CrossRef] [PubMed]
  5. Harrison, S.A.; Bedossa, P.; Guy, C.D.; Schattenberg, J.M.; Loomba, R.; Taub, R.; Labriola, D.; Moussa, S.E.; Neff, G.W.; Rinella, M.E.; et al. A Phase 3, Randomized, Controlled Trial of Resmetirom in NASH with Liver Fibrosis. N. Engl. J. Med. 2024, 390, 497–509. [Google Scholar] [CrossRef] [PubMed]
  6. Sanyal, A.J.; Newsome, P.N.; Kliers, I.; Østergaard, L.H.; Long, M.T.; Kjær, M.S.; Cali, A.M.G.; Bugianesi, E.; Rinella, M.E.; Roden, M.; et al. Phase 3 Trial of Semaglutide in Metabolic Dysfunction-Associated Steatohepatitis. N. Engl. J. Med. 2025, 392, 2089–2099. [Google Scholar] [CrossRef] [PubMed]
  7. Dubois, V.; Eeckhoute, J.; Lefebvre, P.; Staels, B. Distinct but complementary contributions of PPAR isotypes to energy homeostasis. J. Clin. Investig. 2017, 127, 1202–1214. [Google Scholar] [CrossRef] [PubMed]
  8. Palomer, X.; Wang, J.R.; Tang, X.; Wu, S.; Rodríguez-Calvo, R.; Wahli, W.; Vázquez-Carrera, M. Peroxisome Proliferator-Activated Receptor β/δ: A Link Between Metabolism, Inflammation, and Fibrosis in Metabolic Dysfunction-Associated Steatotic Liver Disease. Cells 2026, 15, 464. [Google Scholar] [CrossRef] [PubMed]
  9. Cheng, H.S.; Tan, W.R.; Low, Z.S.; Marvalim, C.; Lee, J.Y.H.; Tan, N.S. Exploration and Development of PPAR Modulators in Health and Disease: An Update of Clinical Evidence. Int. J. Mol. Sci. 2019, 20, 5055. [Google Scholar] [CrossRef] [PubMed]
  10. Honda, A.; Kamata, S.; Tanaka, R.; Minomo, Y.; Ino, S.; Kamichatani, W.; Hishiki, T.; Akahoshi, N.; Nakagawa, S.; Nunomura, K.; et al. Combination therapy with clinically approved PPARα/δ/γ subtype-selective agonists pemafibrate, seladelpar, and pioglitazone in a 4-week diet-induced early-stage MASLD mouse model. Biomed. Pharmacother. 2026, 199, 119432. [Google Scholar] [CrossRef] [PubMed]
  11. Kamata, S.; Honda, A.; Ishii, I. Current clinical trial status and future prospects of PPAR-targeted drugs for treating nonalcoholic fatty liver disease. Biomolecules 2023, 13, 1264. [Google Scholar] [CrossRef] [PubMed]
  12. Im, Y.R.; Hunter, H.; de Gracia Hahn, D.; Duret, A.; Cheah, Q.; Dong, J.; Fairey, M.; Hjalmarsson, C.; Li, A.; Lim, H.K.; et al. A Systematic Review of Animal Models of NAFLD Finds High-Fat, High-Fructose Diets Most Closely Resemble Human NAFLD. Hepatology 2021, 74, 1884–1901. [Google Scholar] [CrossRef] [PubMed]
  13. Alshawsh, M.A.; Alsalahi, A.; Alshehade, S.A.; Saghir, S.A.M.; Ahmeda, A.F.; Al Zarzour, R.H.; Mahmoud, A.M. A Comparison of the Gene Expression Profiles of Non-Alcoholic Fatty Liver Disease between Animal Models of a High-Fat Diet and Methionine-Choline-Deficient Diet. Molecules 2022, 27, 858. [Google Scholar] [CrossRef] [PubMed]
  14. Duparc, T.; Briand, F.; Trenteseaux, C.; Merian, J.; Combes, G.; Najib, S.; Sulpice, T.; Martinez, L.O. Liraglutide improves hepatic steatosis and metabolic dysfunctions in a 3-week dietary mouse model of nonalcoholic steatohepatitis. Am. J. Physiol. Gastrointest. Liver Physiol. 2019, 317, G508–G517. [Google Scholar] [CrossRef] [PubMed]
  15. Recena Aydos, L.; Aparecida do Amaral, L.; Serafim de Souza, R.; Jacobowski, A.C.; Freitas Dos Santos, E.; Rodrigues Macedo, M.L. Nonalcoholic Fatty Liver Disease Induced by High-Fat Diet in C57bl/6 Models. Nutrients 2019, 11, 3067. [Google Scholar] [CrossRef] [PubMed]
  16. Williams, R.O., 3rd; Mahaguna, V.; Sriwongjanya, M. Characterization of an inclusion complex of cholesterol and hydroxypropyl-beta-cyclodextrin. Eur. J. Pharm. Biopharm. 1998, 46, 355–360. [Google Scholar] [CrossRef] [PubMed]
  17. Hashidate-Yoshida, T.; Yamada, M.; Nagata, K.; Kihara, Y.; Kita, Y.; Shindou, H. Protocol to purify fatty acid metabolites with two approaches for quantification using liquid chromatography-mass spectrometry. STAR Protoc. 2026, 7, 104459. [Google Scholar] [CrossRef] [PubMed]
  18. Tokuoka, S.M.; Hamano, F.; Kobayashi, A.; Adachi, S.; Andou, T.; Natsume, T.; Oda, Y. Plasma proteomics and lipidomics facilitate elucidation of the link between Alzheimer’s disease development and vessel wall fragility. Sci. Rep. 2024, 14, 19901. [Google Scholar] [CrossRef] [PubMed]
  19. Kita, Y.; Tokuoka, S.M.; Oda, Y.; Shimizu, T. TRACES: A Lightweight Browser for Liquid Chromatography-Multiple Reaction Monitoring-Mass Spectrometry Chromatograms. Metabolites 2022, 12, 354. [Google Scholar] [CrossRef] [PubMed]
  20. Vergnes, L.; Phan, J.; Strauss, M.; Tafuri, S.; Reue, K. Cholesterol and cholate components of an atherogenic diet induce distinct stages of hepatic inflammatory gene expression. J. Biol. Chem. 2003, 278, 42774–42784. [Google Scholar] [CrossRef] [PubMed]
  21. Barb, D.; Kalavalapalli, S.; Godinez Leiva, E.; Bril, F.; Huot-Marchand, P.; Dzen, L.; Rosenberg, J.T.; Junien, J.L.; Broqua, P.; Rocha, A.O.; et al. Pan-PPAR agonist lanifibranor improves insulin resistance and hepatic steatosis in patients with T2D and MASLD. J. Hepatol. 2025, 82, 979–991. [Google Scholar] [CrossRef] [PubMed]
  22. Sanyal, A.; Doshi, S.; Behl, N.; Gupta, H.K.; Bhatia, V.; Kavitha, A.; Kalla, M.; Shah, C.; Maiwall, R.; Khurrana, D.; et al. Saroglitazar 4 Mg in Metabolic Dysfunction-Associated Steatotic Liver Disease: 24-Week Results From Phase 4 Study. Liver Int. 2026, 46, e70558. [Google Scholar] [CrossRef] [PubMed]
  23. Fruchart, J.C.; Fruchart-Najib, J.; Yamashita, S.; Libby, P.; Yokote, K.; Kodama, T.; Tomita, Y.; Ridker, P.M.; Hermans, M.P.; Zambon, A. Lessons from PROMINENT and prospects for pemafibrate. Cardiovasc. Diabetol. 2024, 23, 279. [Google Scholar] [CrossRef] [PubMed]
  24. Widmer, A.; Lillegard, K.; Wood, K.; Robles, M.; Fan, R.; Ye, F.; Koethe, J.R.; Silver, H.J. Consumption of tree nuts as snacks stimulates changes in plasma fatty acid profiles and adipose tissue gene expression in young adults at risk for metabolic syndrome. Clin. Nutr. 2025, 48, 25–34. [Google Scholar] [CrossRef] [PubMed]
  25. Fruchart, J.C. Pemafibrate (K-877), a novel selective peroxisome proliferator-activated receptor alpha modulator for management of atherogenic dyslipidaemia. Cardiovasc. Diabetol. 2017, 16, 124. [Google Scholar] [CrossRef] [PubMed]
  26. Yamashita, S.; Masuda, D.; Matsuzawa, Y. Pemafibrate, a New Selective PPARα Modulator: Drug Concept and Its Clinical Applications for Dyslipidemia and Metabolic Diseases. Curr. Atheroscler. Rep. 2020, 22, 5. [Google Scholar] [CrossRef] [PubMed]
  27. Kamata, S.; Oyama, T.; Saito, K.; Honda, A.; Yamamoto, Y.; Suda, K.; Ishikawa, R.; Itoh, T.; Watanabe, Y.; Shibata, T.; et al. PPARα Ligand-Binding Domain Structures with Endogenous Fatty Acids and Fibrates. iScience 2020, 23, 101727. [Google Scholar] [CrossRef] [PubMed]
  28. Zhang, Z.; Zhang, X.; Qian, C.; Diao, P.; Nakajima, T.; Kimura, T.; Gonzalez, F.J.; Tanaka, N. Hepatocyte PPARα Is Essential for Triglyceride-Lowering Effect of Pemafibrate. Int. J. Mol. Sci. 2026, 27, 3308. [Google Scholar] [CrossRef] [PubMed]
  29. Hirschfield, G.M.; Bowlus, C.L.; Mayo, M.J.; Kremer, A.E.; Vierling, J.M.; Kowdley, K.V.; Levy, C.; Villamil, A.; Ladrón de Guevara Cetina, A.L.; Janczewska, E.; et al. A Phase 3 Trial of Seladelpar in Primary Biliary Cholangitis. N. Engl. J. Med. 2024, 390, 783–794. [Google Scholar] [CrossRef] [PubMed]
  30. Pastor, R.; Bouzas, C.; Tur, J.A. Beneficial effects of dietary supplementation with olive oil, oleic acid, or hydroxytyrosol in metabolic syndrome: Systematic review and meta-analysis. Free Radic. Biol. Med. 2021, 172, 372–385. [Google Scholar] [CrossRef] [PubMed]
  31. Xu, H.; Xu, X.; Sohouli, M.H. The effect of oleic acid enriched diets on glucose and lipid metabolism: A systematic review and meta-analysis. Nutr. Metab. 2026, 23, 49. [Google Scholar] [CrossRef]
  32. Zhu, B.; Zhu, X.; Borland, M.G.; Ralph, D.H.; Chiaro, C.R.; Krausz, K.W.; Ntambi, J.M.; Glick, A.B.; Patterson, A.D.; Perdew, G.H.; et al. Activation of Peroxisome Proliferator-Activated Receptor-β/δ (PPARβ/δ) in Keratinocytes by Endogenous Fatty Acids. Biomolecules 2024, 14, 606. [Google Scholar] [CrossRef] [PubMed]
  33. Lim, J.H.; Gerhart-Hines, Z.; Dominy, J.E.; Lee, Y.; Kim, S.; Tabata, M.; Xiang, Y.K.; Puigserver, P. Oleic acid stimulates complete oxidation of fatty acids through protein kinase A-dependent activation of SIRT1-PGC1α complex. J. Biol. Chem. 2013, 288, 7117–7126. [Google Scholar] [CrossRef] [PubMed]
  34. Santa-María, C.; López-Enríquez, S.; Montserrat-de la Paz, S.; Geniz, I.; Reyes-Quiroz, M.E.; Moreno, M.; Palomares, F.; Sobrino, F.; Alba, G. Update on Anti-Inflammatory Molecular Mechanisms Induced by Oleic Acid. Nutrients 2023, 15, 224. [Google Scholar] [CrossRef] [PubMed]
Figure 1. Fatty liver induced after 4 weeks of HFCC/CDX administration and the effects of concomitant treatment with pemafibrate (Pema), seladelpar (Sela), or pioglitazone (Pio). Representative macroscopic findings (top panels; cm scales), hematoxylin–Oil Red O-stained sections (middle panels), and Sirius Red-stained sections (bottom panels) of the liver of mice fed a standard CE-2 diet/tap water or HFCC/CDX for 4 weeks are shown. The HFCC/CDX groups were divided into those receiving 0.1 mg Pema/kg/day, 1 mg Sela/kg/day, or 3 mg Pio/kg/day, and those not receiving any treatment. Bar: 100 µm.
Biomolecules 16 01078 g001
Figure 2. TG composition of fatty liver induced by 4 weeks of HFCC/CDX administration and the effects of concomitant administration with pemafibrate (Pema), seladelpar (Sela), or pioglitazone (Pio). LC–MS lipidomic analysis of livers of mice fed either a standard CE-2 diet or HFCC/CDX for 4 weeks with or without each PPARα/δ/γ-selective agonist (0.1 mg Pema/kg/day, 1 mg Sela/kg/day, or 3 mg Pio/kg/day). Summed liver TG signals for each group are shown as relative total signal levels with the CE-2 control set to 100, and the amount of each TG signal is expressed as a percentage, with the total TG signal in each group set at 100%.
Biomolecules 16 01078 g002
Figure 3. Volcano plot analysis of individual TG changes following pemafibrate administration. (B) is an enlarged view of a part of (A) (the rectangular frame). Fold-change and p-values were calculated for all TGs detected in the livers of mice administered HFCC/CDX without and with 0.1 mg/kg/day pemafibrate (n = 10 and 9, respectively). The x-axis represents Log2 (fold-change), and the y-axis represents −Log10 (p-value), with the p-value threshold set to 0.05 (blue line). The color of each dot corresponds to the major classification in Figure 2. The individual IDs and values of TGs 1–76 that exhibited significant changes are listed in Table 1.
Biomolecules 16 01078 g003
Figure 4. Volcano plot analysis of individual TG changes following after seladelpar administration. Fold-change and p-values were calculated for all TGs detected in the livers of mice administered HFCC/CDX with and without 1 mg/kg/day seladelpar (n = 10 each). The x-axis represents Log2 (fold-change), and the y-axis represents −Log10 (p-value) with the p-value threshold set to 0.05 (blue line). The color of each dot corresponds to the major classification in Figure 2. The individual IDs and values of TGs 1–12 showing significant changes are listed in Table 2.
Biomolecules 16 01078 g004
Figure 5. Volcano plot analysis of individual TG changes following pioglitazone administration. (B) is an enlarged view of a part of (A) (the rectangular frame). Fold changes and p-values were calculated for all TGs detected in the livers of mice administered HFCC/CDX with and without 3 mg/kg/day pioglitazone (n = 10 each). The x-axis represents Log2 (fold-change), and the y-axis represents −Log10 (p-value) with the p-value threshold set to 0.05 (blue line). The color of each dot corresponds to the major classification in Figure 2. The individual IDs and values of TGs 1–55 showing significant changes are listed in Table 3.
Biomolecules 16 01078 g005
Figure 6. Venn diagram showing the TG species exhibiting a significant decrease or increase among all 225 detected TG species following PPAR agonist administration. For each PPAR agonist, changes are indicated in green if the value decreased and red if it increased. When changes occurred in response to multiple stimuli, changes in the same directions are shown in green or red, whereas changes in different directions are shown in black.
Biomolecules 16 01078 g006
Table 1. Changes in liver TGs following treatment with pemafibrate (Pema) in a HFCC/CDX-induced MASLD model. The TG species showing a significant decrease or increase (negative or positive in the x-axis) with Pema administration are listed in order of fold-change using the same ID as in Figure 2. The log2 (fold-change), −log10 (p-value), p-value, and mean ppm for HFCC/CDX (without Pema; n = 10) and + Pema (n = 9) are shown.
IDLipid Specieslog2 (Fold-Change)−log10 (p-Value)p-ValueHFCC/CDX ppm+Pema ppm
1TG_58:3-FA_22:0−1.74923.26500.000543333,0259824
2TG_58:2-FA_22:0−1.59373.06160.000867843,95614,564
3TG_58:3-FA_18:2−1.57663.03770.000916933,87011,355
4TG_46:1-FA_14:0−1.48953.53740.000290170502511
5TG_58:2-FA_18:1−1.45393.35010.000446690,03332,865
6TG_56:1-FA_22:0−1.43233.09750.000799049511835
7TG_58:1-FA_18:1−1.37843.67060.000213587313358
8TG_56:1-FA_16:0−1.19593.51770.000303664032795
9TG_46:2-FA_16:0−1.05043.81170.000154318,9269138
10TG_56:2-FA_18:2−0.989783.33610.000461210,6415358
11TG_48:3-FA_18:1−0.987165.70910.000002086,20643,488
12TG_46:2-FA_18:2−0.973096.77540.000000217,5368933
13TG_48:3-FA_14:0−0.955673.69360.000202570423631
14TG_56:1-FA_18:1−0.951353.14610.000714419,89510,288
15TG_48:3-FA_18:2−0.948905.94860.000001185,41344,246
16TG_49:1-FA_15:0−0.942623.31230.000487173933846
17TG_48:3-FA_12:0−0.903235.22380.000006088,33447,231
18TG_46:1-FA_18:1−0.862475.94450.000001137,71720,745
19TG_48:3-FA_16:1−0.836062.09630.008012169393887
20TG_46:1-FA_16:0−0.822224.97650.000010632,47118,365
21TG_56:2-FA_20:0−0.816312.37050.0042611322,931183,390
22TG_46:1-FA_12:0−0.790153.92990.000117538,46622,244
23TG_48:2-FA_18:1−0.788984.98310.0000104271,245156,984
24TG_48:2-FA_12:0−0.776315.13360.0000074137,00479,991
25TG_56:2-FA_18:1−0.764812.47060.0033841577,543339,903
26TG_56:1-FA_18:0−0.764672.24980.005626522,72113,373
27TG_48:2-FA_18:2−0.745773.92910.000117728,51217,003
28TG_48:2-FA_16:0−0.742894.56360.000027333,86820,237
29TG_50:4-FA_18:3−0.726266.71750.000000214,9179017
30TG_48:2-FA_16:1−0.718792.63110.002338425,46415,472
31TG_50:4-FA_14:0−0.713536.05660.000000932,57619,865
32TG_58:3-FA_22:1−0.708311.90660.012399059,15536,205
33TG_48:2-FA_14:0−0.708215.11670.000007637,63923,038
34TG_58:3-FA_18:1−0.698382.04380.0090400136,20383,937
35TG_56:1-FA_20:0−0.693892.10480.007855719,38011,980
36TG_50:4-FA_18:2−0.693675.30890.000004951,10431,597
37TG_54:1-FA_16:0−0.686892.24110.005739348,43930,090
38TG_54:7-FA_18:1−0.682942.82900.001482513,7718578
39TG_48:1-FA_16:0−0.643445.29480.0000051101,81065,177
40TG_56:2-FA_16:0−0.637161.76420.017209012,9818347
41TG_50:3-FA_18:1−0.616136.32600.0000005206,224134,545
42TG_48:1-FA_18:0−0.602531.99120.010204016,12810,622
43TG_48:1-FA_14:0−0.600374.23800.000057869,03445,534
44TG_48:1-FA_18:1−0.597495.15060.000007180,00852,878
45TG_52:2-FA_20:1−0.595462.53490.002918117,98211,901
46TG_54:6-FA_22:5−0.594792.23040.005882912,1728060
47TG_50:3-FA_14:0−0.590085.58320.0000026198,882132,119
48TG_54:7-FA_18:2−0.586793.33370.000463842,34028,191
49TG_46:0-FA_16:0−0.586111.40940.038960013,4658969
50TG_52:3-FA_20:1−0.581391.93350.011655083525582
51TG_58:9-FA_22:5−0.579112.09370.008059829,08919,472
52TG_50:1-FA_18:0−0.568792.37710.004196232,62521,995
53TG_50:3-FA_18:2−0.557964.79930.0000159235,880160,224
54TG_49:1-FA_16:0−0.475202.10500.007852210,6857686
55TG_50:3-FA_18:3−0.459141.61500.024267076695578
56TG_54:7-FA_18:3−0.447951.66410.021671031,21722,885
57TG_54:1-FA_18:1−0.432881.36380.043268098,06672,646
58TG_58:8-FA_22:5−0.429541.45420.0351430164,362122,038
59TG_51:3-FA_18:2−0.422282.20770.006199032,74124,433
60TG_54:6-FA_18:3−0.415582.94430.0011369229,404171,989
61TG_54:6-FA_18:2−0.382002.24420.0056985413,911317,625
62TG_54:6-FA_18:1−0.381033.48480.0003275190,379146,190
63TG_54:7-FA_22:6−0.362121.91030.012295028,33522,045
64TG_56:6-FA_18:3−0.338751.64240.022785031,78425,133
65TG_50:2-FA_18:2−0.331081.97150.0106770168,380133,852
66TG_56:4-FA_18:2−0.327501.64950.0224150567,895452,565
67TG_54:5-FA_18:0−0.314091.85190.014063025,94720,870
68TG_50:2-FA_18:1−0.268952.23280.0058499794,094659,037
69TG_54:5-FA_18:1−0.256522.16560.00683022,105,6581,762,655
70TG_54:5-FA_18:3−0.252722.54680.0028392466,382391,440
71TG_54:5-FA_18:2−0.235621.43860.03642302,519,1872,139,598
72TG_56:2-FA_18:0−0.190891.40470.039386067,57659,201
73TG_56:5-FA_18:00.192051.49610.031904072,84183,212
74TG_52:2-FA_18:10.206311.76770.01707108,478,2979,781,715
75TG_56:5-FA_20:40.277731.89630.0126980129,834157,397
76TG_52:2-FA_16:00.336292.41300.00386354,943,8856,241,676
Table 2. Changes in liver TGs following treatment with seladelpar (Sela) in a HFCC/CDX-induced MASLD model. TG species that showed a significant decrease or increase (negative or positive in the x-axis) following Sela administration are listed in order of fold-change using the same ID as in Figure 4. The log2 (fold-change), −log10 (p-value), p-value, and mean ppm for 10 mice each of HFCC/CDX (without Sela) and + Sela are shown.
IDLipid Specieslog2 (Fold-Change)−log10 (p-Value)p-ValueHFCC/CDX ppm+Sela ppm
1TG_52:4-FA_20:4−0.568361.45740.034885014,4679755
2TG_54:5-FA_22:5−0.441961.58480.026013085996331
3TG_53:4-FA_17:0−0.412101.86920.013513099897508
4TG_52:4-FA_16:0−0.291401.75700.0174980598,593489,117
5TG_52:1-FA_16:0−0.281711.31550.0483560316,852260,647
6TG_54:5-FA_18:0−0.271181.42650.037456025,94721,501
7TG_50:2-FA_18:2−0.242001.31430.0484960168,380142,378
8TG_52:3-FA_18:2−0.185421.39690.04009602,664,6902,343,311
9TG_52:2-FA_18:1−0.135831.50810.03103708,478,2977,716,484
10TG_53:2-FA_17:0−0.131931.33600.046127074,59668,077
11TG_56:4-FA_20:10.238261.39210.0405390598,659706,163
12TG_58:3-FA_18:10.427001.40560.0393000136,203183,117
Table 3. Changes in liver TGs following treatment with pioglitazone (Pio) in a HFCC/CDX-induced MASLD model. TG species showing a significant decrease or increase (negative or positive in the x-axis) with Pio administration are listed in order of fold-change using the same ID as in Figure 5. The log2 (fold-change), –log10 (p-value), p-value, and mean ppm for 10 mice each of HFCC/CDX (without Pio) and + Pio are shown.
IDLipid Specieslog2 (Fold-Change)–log10 (p-Value)p-ValueHFCC/CDX ppm+Pio ppm
1TG_54:7-FA_16:0–1.199101.83760.014534038651650
2TG_54:6-FA_22:6–1.012201.96260.010899030,48715,115
3TG_54:5-FA_22:5–0.851392.28430.005196585994766
4TG_54:7-FA_20:4–0.682101.42530.037555092535767
5TG_54:6-FA_16:0–0.549651.50950.030938038,61926,383
6TG_51:2-FA_17:1–0.521852.93760.001154524,08516,774
7TG_53:4-FA_17:0–0.488871.39530.040241099897118
8TG_56:8-FA_16:0–0.482561.46070.034622025,78318,453
9TG_50:3-FA_16:0–0.473171.55690.027737097,11269,957
10TG_56:6-FA_22:5–0.385711.33050.0467200157,853120,821
11TG_52:5-FA_16:0–0.369291.43510.036716054,53142,214
12TG_52:4-FA_16:0–0.366932.32190.0047652598,593464,167
13TG_54:7-FA_18:2–0.364811.61600.024212042,34032,880
14TG_52:4-FA_18:2–0.362222.21580.00608411,019,636793,244
15TG_56:6-FA_16:0–0.345141.63830.023001077,34260,885
16TG_50:2-FA_16:0–0.344881.94190.0114330615,045484,268
17TG_52:5-FA_18:3–0.310151.75510.017576080,66365,062
18TG_48:2-FA_14:0–0.294041.72930.018649037,63930,699
19TG_51:1-FA_16:0–0.281061.37960.041726016,16813,306
20TG_52:3-FA_18:2–0.276392.10550.00784252,664,6902,200,113
21TG_52:3-FA_16:0–0.254902.03890.00914273,271,3352,741,534
22TG_48:1-FA_16:0–0.242971.40330.0395100101,81086,030
23TG_52:3-FA_18:1–0.222311.64030.02289104,006,6273,434,445
24TG_52:2-FA_18:1–0.219132.26130.00547918,478,2977,283,564
25TG_50:3-FA_18:2–0.214551.80930.0155130235,880203,283
26TG_50:4-FA_18:2–0.202091.31610.048298051,10444,425
27TG_52:2-FA_16:0–0.195231.98250.01041104,943,8854,318,141
28TG_56:5-FA_18:20.202651.37890.0417960339,646390,866
29TG_56:4-FA_18:10.272381.91260.01222801,214,4921,466,862
30TG_56:3-FA_18:00.357391.96210.010911070,21589,955
31TG_56:4-FA_20:10.389942.97120.0010686598,659784,449
32TG_56:3-FA_20:10.403293.04780.0008958782,4811,034,850
33TG_56:2-FA_18:00.428843.17150.000673867,57690,968
34TG_56:4-FA_18:20.431823.44650.0003577567,895766,049
35TG_56:3-FA_18:10.438543.05890.00087311,601,1372,169,912
36TG_54:1-FA_16:00.474991.99430.010131048,43967,326
37TG_55:2-FA_18:10.495211.75440.017605085,678120,763
38TG_56:2-FA_20:10.499284.85810.000013958,31682,428
39TG_56:2-FA_22:10.556181.61440.0243020872412,825
40TG_56:2-FA_16:00.561892.43370.003683812,98119,163
41TG_56:1-FA_22:00.582141.43460.036761049517414
42TG_56:2-FA_18:20.621381.43420.036794010,64116,369
43TG_56:1-FA_18:00.621432.18170.006581522,72134,957
44TG_56:1-FA_18:10.692752.04180.009082919,89532,155
45TG_56:2-FA_18:10.755072.63270.0023298577,543974,727
46TG_56:2-FA_20:00.809172.77150.0016924322,931565,843
47TG_56:1-FA_16:00.820012.82700.0014894640311,303
48TG_56:1-FA_20:00.834732.65850.002195419,38034,562
49TG_58:3-FA_22:10.863494.36760.000042959,155107,629
50TG_58:1-FA_18:10.865352.03270.0092753873115,903
51TG_58:3-FA_18:20.881082.39360.004040133,87062,381
52TG_58:3-FA_18:10.910474.46990.0000339136,203256,015
53TG_58:3-FA_22:00.962672.28330.005208633,02564,365
54TG_58:2-FA_22:00.980992.31570.004833443,95686,758
55TG_58:2-FA_18:10.998192.64430.002268390,033179,840
Disclaimer/Publisher’s Note: The statements, opinions and data contained in all publications are solely those of the individual author(s) and contributor(s) and not of MDPI and/or the editor(s). MDPI and/or the editor(s) disclaim responsibility for any injury to people or property resulting from any ideas, methods, instructions or products referred to in the content.