Article

miR-132-y Targets YAP1 and Modulates Sertoli Cell Viability-Associated Transcriptional Responses in Southdown × Hu F1 Sheep


1
Key Laboratory of Animal Genetics and Breeding on the Tibetan Plateau, Ministry of Agriculture and Rural Affairs, Lanzhou Institute of Husbandry and Pharmaceutical Sciences, Chinese Academy of Agricultural Sciences, Lanzhou 730050, China
2
Sheep Breeding Engineering Technology Research Center, Chinese Academy of Agricultural Sciences, Lanzhou 730050, China
*
Authors to whom correspondence should be addressed.
Biomolecules 2026, 16(7), 995; https://doi.org/10.3390/biom16070995
Submission received: 21 May 2026 / Revised: 5 July 2026 / Accepted: 6 July 2026 / Published: 7 July 2026
(This article belongs to the Collection Feature Papers in Molecular Reproduction)

Abstract

Sertoli cells are essential for testicular development and spermatogenesis, but the post-transcriptional mechanisms regulating their function in sheep remain incompletely understood. This study investigated the regulatory relationship between miR-132-y and Yes-associated protein 1 (YAP1), a core effector of the Hippo pathway, in primary Sertoli cells isolated from Southdown × Hu F1 sheep. Target prediction and dual-luciferase reporter assays supported a direct interaction between miR-132-y and the YAP1 3′ untranslated region. YAP1 overexpression was associated with increased CCK-8-based cell viability and altered mRNA expression of selected viability-associated, YAP1-related, and Sertoli cell function-associated genes, whereas YAP1 silencing showed opposite trends. Conversely, miR-132-y overexpression reduced YAP1 mRNA abundance and was associated with decreased CCK-8-based cell viability and corresponding transcriptional changes, while miR-132-y inhibition produced the opposite pattern. Rescue experiments showed that ectopic YAP1 expression partially attenuated miR-132-y-associated changes. Overall, these findings provide in vitro, cell-based evidence that miR-132-y targets YAP1 at the transcript level and is associated with viability-related transcriptional responses in sheep Sertoli cells.

1. Introduction

Hu sheep are widely recognized in China for their high prolificacy, and their outstanding reproductive performance has made them an important resource in genetic improvement and breeding programs [1]. Southdown sheep, when used as terminal sires, contribute favorable production traits to their offspring, particularly improved post-weaning growth performance and meat quality [2]. Accordingly, the F1 offspring generated from Southdown × Hu crosses exhibit superior meat quality and reproductive performance relative to the parental breeds [3,4]. Because normal testicular development is fundamental to male fertility, Sertoli cells (SCs) are indispensable for the establishment and maintenance of the spermatogenic microenvironment [5,6,7,8]. Through structural, nutritional, and regulatory support to developing germ cells, SCs critically influence spermatogenesis and testicular function. Therefore, clarifying the molecular mechanisms that regulate SC biology is important for understanding male reproductive development in mammals.
Non-coding RNAs, especially microRNAs (miRNAs), are important post-transcriptional regulators in the testis and participate in the functional regulation of Sertoli cells, Leydig cells, and germ cells [9,10,11,12]. Declining semen quality and male infertility have also been associated with molecular alterations in small noncoding RNAs, which may not be fully captured by conventional semen parameters. Recent evidence indicates that sperm small noncoding RNAs and sperm nuclear basic proteins can reflect environmental impacts on male germ cells, while miRNA dysregulation has been linked to spermatogenesis-related disorders in infertile men [13,14]. In SCs, miRNAs have been implicated in the control of cell survival, proliferation, differentiation, and other biological processes through their interactions with target mRNAs. However, the specific miRNAs and downstream regulatory axes that govern SC function in livestock species remain insufficiently understood. Among these molecules, miR-132 has attracted increasing attention because of its involvement in cell proliferation and differentiation [15]. In a vinclozolin-induced reproductive injury model, YAP1 was identified as a direct target of miR-132, and increased miR-132 expression was associated with reduced YAP1 abundance and abnormal male reproductive phenotypes, including penile malformation and reduced testis size [16]. These observations suggest that the miR-132–YAP1 axis may participate in male reproductive development. YAP1 is a core effector of the Hippo signaling pathway and is widely recognized as an important regulator of cell growth, survival, and organ size [17]. Although YAP1-dependent regulatory mechanisms, including its interaction with LATS2 in adipogenesis, have been described in other biological contexts [18], its role in ruminant Sertoli cells remains poorly defined.
In the present study, SCs isolated from Southdown × Hu F1 sheep were used as an in vitro model to investigate the relationship between miR-132-y and YAP1 in sheep Sertoli cells. Based on in silico target prediction, YAP1 was identified as a candidate target of miR-132-y, and the predicted interaction was further supported by dual-luciferase reporter assays. We further examined the effects of YAP1 overexpression or silencing, as well as miR-132-y overexpression or inhibition, on SC viability and on the expression of genes related to YAP1-associated signaling and SC function. In addition, rescue experiments were performed to assess whether YAP1 may mediate, at least in part, the effects of miR-132-y in this cell model. Collectively, this study provides evidence for a miR-132-y–YAP1 regulatory relationship in sheep SCs and offers a basis for further investigation of post-transcriptional regulation in testicular somatic cells.

2. Materials and Methods

2.1. Experimental Animals and Samples

All animal procedures were reviewed and approved by the Animal Management and Ethics Committee of the Lanzhou Institute of Husbandry and Veterinary Medicine, Chinese Academy of Agricultural Sciences (Approval No. 0231447; approval date: 19 November 2023). All procedures involving animals were performed in accordance with the institutional guidelines for animal care and welfare. Testicular tissues were aseptically collected from clinically healthy 4-month-old male Southdown × Hu F1 sheep at Qing huan Mutton Sheep Breeding Company, Gansu Province, China. The age of each animal was verified using breeding records. Four clinically healthy 4-month-old male Southdown × Hu F1 sheep were used as donor animals in this study. Primary Sertoli cells (SCs) were independently isolated and cultured from the testicular tissue of each donor animal. Unless otherwise stated, biological replicates represented independent Sertoli cell preparations derived from different donor animals and processed independently for subsequent culture, transfection, RNA extraction, RT-qPCR, and cell viability assays. HEK-293T cells used for dual-luciferase reporter assays were obtained from our laboratory and maintained in high-glucose DMEM supplemented with 10% FBS and 1% penicillin–streptomycin (100×; Solarbio, Beijing, China) solution at 37 °C in a humidified incubator containing 5% CO2. Cells were passaged at approximately 80–90% confluence and used for transfection during the logarithmic growth phase.

2.2. Isolation, Purification, and Culture of Primary Sertoli Cells from Southdown × Hu F1 Sheep

Testes were collected following castration under general anesthesia. General anesthesia was induced by intramuscular injection of diazepam (410 mg; Jining Ankang Pharmaceutical Co., Ltd., Jining, China) and scopolamine (90.3 mg; ChemeGen, Shanghai, China), followed by intravenous administration of thiopental sodium (10–20 mg/kg; Shanghai SPH New ASIA Pharmaceutical Co., Ltd., Shanghai, China). After collection, the tunica albuginea was aseptically removed, and the testicular tissue was washed three times with phosphate-buffered saline (PBS) containing antibiotics.
The tissue was mechanically minced and subjected to two-step enzymatic digestion. Briefly, tissue fragments were first digested with collagenase IV at 37 °C for 50 min, followed by digestion with 0.25% trypsin for 15 min. The concentration of collagenase IV used was 1 mg/mL. Digestion was terminated by adding complete medium. The resulting cell suspension was sequentially filtered through 100-, 200-, and 300-mesh sieves, centrifuged at 1000× g for 5 min, and washed three times with PBS containing 1% antibiotics.
Primary cells were cultured in DMEM/F-12 complete medium supplemented with 10% fetal bovine serum (FBS) and 1% antibiotics at 37 °C in a humidified atmosphere containing 5% CO2. Sertoli cells were enriched by repeated hypotonic treatment and differential adhesion. When cells reached approximately 80% confluence, they were detached using 0.05% trypsin. This purification procedure was repeated 3–4 times to obtain an enriched population of immature SCs.

2.3. Identification of Primary SCs from F1 Hybrid of Southdown × Hu Sheep

Purified SCs were identified by immunofluorescence staining, Oil Red O staining, and alkaline phosphatase (ALP) staining, as described in the original experimental workflow. The isolated cells showed the typical bipolar morphology of SCs, and cell purity in the present study exceeded 85%, consistent with the subsequent characterization results.
For immunofluorescence staining, purified SCs were seeded in 6-well plates at a density of 2 × 10⁵ cells/well, allowed to adhere overnight, and fixed with 4% paraformaldehyde for 30 min at room temperature after PBS washing. Cells were permeabilized with 0.1% Triton X-100 (Thermo Scientific, Waltham, MA, USA, 28313) for 10 min, blocked with 5% bovine serum albumin (BSA) for 30 min, and incubated overnight at 4 °C with primary antibodies against GATA4 (Bioss, Beijing, China, bs-1778P) and SOX9 (Bioss, Pbs-4177R) at a dilution of 1:200. After washing with PBS, cells were incubated with a Cy3-conjugated secondary antibody (1:500) for 90 min at 37 °C in the dark. Nuclei were counterstained with DAPI for 5 min, and fluorescence images were acquired under a fluorescence microscope.
For Oil Red O staining, cells were fixed and processed using an Oil Red O staining kit (Beijing Solarbio Science & Technology Co., Ltd., Beijing, China., G1261) according to the manufacturer’s instructions, followed by hematoxylin counterstaining. For ALP staining, cells were fixed in 4% paraformaldehyde and stained using an ALP detection kit (Beijing Solarbio Science & Technology Co., Ltd., G1480) according to the manufacturer’s instructions. ALP-positive cells were identified by blue–purple membrane-associated staining under an inverted microscope.

2.4. Construction of YAP1 Gene Overexpression and Interference Vectors

Three siRNAs targeting the coding sequence (CDS) of ovine YAP1 (si-YAP1-1, si-YAP1-2, and si-YAP1-3), together with a negative control siRNA (si-NC), were designed. The YAP1 overexpression plasmid pcDNA3.1(+)-YAP1 and the corresponding empty vector pcDNA3.1(+) were commercially synthesized by Genewiz (GENEWIZ, Suzhou, China). Plasmids were extracted using a low-endotoxin mini prep kit (DP103-02; TIANGEN Biotech Co., Ltd., Beijing, China). Detailed sequences are provided in Supplementary Table S1.

2.5. Construction of YAP1 3′-UTR Wild-Type and Mutant Recombinant Plasmids

Potential miRNA-binding sites in the ovine YAP1 3′UTR were predicted using TargetScan (version 7.2). Wild-type (WT) and mutant (MUT) YAP1 3′UTR fragments were generated by molecular cloning. In the mutant construct, the predicted miRNA-binding site was replaced with a reverse-complementary sequence to disrupt the interaction. The YAP1 3′UTR fragments were directionally cloned into the pmirGLO luciferase reporter vector using Xho I and Sal I restriction sites. All constructs were verified by sequencing and double enzyme digestion. The final recombinant plasmids were designated YAP1 3′UTR-WT and YAP1 3′UTR-MUT. Full sequence information is provided in Supplementary Figure S1.

2.6. Design and Synthesis of miRNA Mimics and Inhibitors

Based on the mature ovine miR-132-y sequence, the corresponding miR-132-y mimic and inhibitor were designed and synthesized. For the mimic duplex, the sense strand corresponded to the mature miR-132-y sequence, and the antisense strand was generated as the reverse complement of the sense strand excluding the final two nucleotides, followed by addition of a 3′ UU overhang. The inhibitor sequence was designed as the full reverse complement of mature ovine miR-132-y. Detailed sequences are listed in Supplementary Table S2. Corresponding negative controls were used in all transfection experiments.

2.7. Cell Transfection

SCs were seeded in 6-well plates at a density of 2 × 10⁵ cells/well in DMEM/F-12 medium supplemented with 10% FBS. When cells reached approximately 40% confluence, they were washed three times with PBS (3 min each). Transfections were performed using Lipofectamine 3000 (nvitrogen; Thermo Fisher Scientific, Carlsbad, CA, USA) according to the manufacturer’s instructions. For YAP1 overexpression, 2.5 μg pcDNA3.1(+)-YAP1 plasmid or empty vector was diluted in 125 μL Opti-MEM, and 5 μL Lipofectamine 3000 was diluted separately in 125 μL Opti-MEM. The two solutions were combined, incubated for 15 min at room temperature, and added to cells. For YAP1 interference, siRNA or si-NC was transfected at a final concentration of 20 nM using the same protocol. The total volume in each well was adjusted to 2 mL with Opti-MEM. After 6 h, the transfection medium was replaced with complete culture medium containing 1% antibiotics, and cells were harvested 48 h post-transfection.
For miRNA experiments, SCs were transfected with miR-132-y mimic, mimic negative control, miR-132-y inhibitor, or inhibitor negative control under the same conditions. The final concentrations of the mimic and inhibitor were 10 nM, respectively. For the dual-luciferase reporter assay, HEK-293T cells were seeded in 24-well plates at a density of 1 × 10⁵ cells/well and transfected when they reached approximately 70–80% confluence. For each well, 1 μg of pmirGLO reporter plasmid containing the wild-type or mutant YAP1 3′UTR was diluted in 50 μL Opti-MEM. In parallel, 2 μL Lipofectamine 3000 reagent was diluted in 50 μL Opti-MEM. The diluted DNA and Lipofectamine 3000 solutions were gently mixed and incubated for 15 min at room temperature before being added dropwise to each well. The final transfection volume in each well was adjusted to 500 μL. Cells were co-transfected with the reporter plasmid and miR-132-y mimic at a final concentration of 50 nM or miR-132-y inhibitor at a final concentration of 100 nM. The corresponding mimic negative control or inhibitor negative control was used under the same conditions. After 4 h, the transfection medium was replaced with complete culture medium, and cells were harvested 48 h after transfection for the dual-luciferase reporter assay. The effectiveness of YAP1 overexpression, YAP1 knockdown, and miR-132-y mimic/inhibitor transfection was evaluated by RT-qPCR analysis of the corresponding target transcripts 48 h after transfection. No fluorescence-labeled control or flow cytometry-based assay was used to directly quantify the absolute transfection efficiency.
Rescue experiments were performed using four transfection groups: (1) miR-132-y mimic + pcDNA3.1(+)-YAP1, (2) miR-132-y mimic + empty vector, (3) mimic negative control + pcDNA3.1(+)-YAP1, and (4) mimic negative control + empty vector. For all transfection experiments, the corresponding negative controls were transfected under the same conditions as the treatment groups. The siRNA negative control (si-NC) was a non-targeting siRNA sequence used as the control for YAP1 knockdown. The mimic negative control (mimic NC) was a scrambled RNA duplex used as the control for the miR-132-y mimic, whereas the inhibitor negative control (inhibitor NC) was a scrambled antisense oligonucleotide used as the control for the miR-132-y inhibitor. The empty pcDNA3.1(+) vector was used as the plasmid control for YAP1 overexpression. Unless otherwise stated, the term “control group” refers to the corresponding negative control group transfected under identical experimental conditions.

2.8. Dual-Luciferase Reporter Assay

HEK-293T cells were collected 48 h after transfection. Cells were washed twice with PBS and lysed with 100 μL precooled passive lysis buffer (1 × PLB). Plates were shaken at 200 rpm for 10 min at room temperature to ensure complete lysis. A 100 μL aliquot of lysate was transferred to a 96-well plate. Firefly luciferase activity was measured after addition of 50 μL Luciferase Assay Reagent II (LAR II), followed by measurement of Renilla luciferase activity after addition of an equal volume of Stop & Glo reagent (Promega, Corporation, Madison, WI, USA). Relative luciferase activity was calculated as the ratio of firefly to Renilla luminescence.

2.9. Cell Counting Kit-8

Cell viability was assessed using the Cell Counting Kit-8 (CCK-8, Dojindo Laboratories, Kumamoto, Japan). Logarithmically growing SCs were seeded into 96-well plates at a density of 1 × 10⁴ cells/well in 100 μL culture medium and cultured at 37 °C in 5% CO2 for 24 h to allow cell adhesion. Cells were then subjected to the corresponding transfection treatments. At 24, 48 and 72 h post-transfection, 10 μL CCK-8 reagent was added to each well, followed by incubation at 37 °C in the dark for 120 min. Absorbance was measured at 450 nm using a microplate reader (BioTek Instruments, Winooski, VT, USA). Each experiment included three independent biological replicates, and each condition within one biological replicate contained six technical replicate wells.

2.10. Total Cellular RNA Extraction and RT-qPCR

First-strand cDNA was synthesized using the Transcriptor First Strand cDNA Synthesis Kit (Roche Diagnostics GmbH, Mannheim, Germany) according to the manufacturer’s instructions. RT-qPCR was performed on a CFX96 Real-Time PCR System (Bio-Rad, Inc., Hercules, CA, USA) using a SYBR Green-based qPCR assay (Bio-Rad Laboratories, Inc., Hercules, CA, USA). Each 20 μL reaction contained 10 μL of 2× SYBR Green qPCR Master Mix, 0.4 μL of forward primer, 0.4 μL of reverse primer, 2 μL of diluted cDNA template, and 7.2 μL of nuclease-free water. The final concentration of each primer was 0.2 μM. The amplification program was as follows: initial denaturation at 95 °C for 30 s, followed by 40 cycles of 95 °C for 5 s and 60 °C for 30 s. A melting curve analysis was performed from 65 °C to 95 °C to confirm amplification specificity. No-template controls (NTCs) and no-reverse-transcription controls (no-RT controls) were included in each run to monitor reagent contamination and genomic DNA carryover. Primer sequences are listed in Table S1, and primer specificity was confirmed by melting curve analysis. U6 small RNA and β-actin were used as internal controls for miRNA and mRNA quantification, respectively. Relative expression levels were calculated using the 2−ΔΔCt method, and each sample was analyzed in technical triplicate.

2.11. Statistical Analysis

Statistical analyses were performed using GraphPad Prism version 9.0. Data are presented as mean ± standard deviation (SD). Unless otherwise stated, each experiment included three independent biological replicates. Each biological replicate corresponded to an independently prepared primary Sertoli cell culture derived from a different donor animal and processed independently for culture, transfection, RNA extraction, RT-qPCR, dual-luciferase reporter assay, and CCK-8 assay. Technical replicates were performed within each biological replicate as indicated for each assay. For the CCK-8 assay, each biological replicate contained six technical replicate wells per condition. For RT-qPCR, each biological replicate was analyzed in technical triplicate. For comparisons between two groups, an unpaired Student’s t-test was used. For comparisons among more than two groups, one-way ANOVA followed by Tukey’s post hoc multiple-comparison test was applied. The specific statistical test used for each figure panel is indicated in the corresponding figure legend. A value of p < 0.05 was considered statistically significant.

3. Results

3.1. Isolation, Culture, and Characterization of SCs from F1 Hybrid of Southdown × Hu Sheep

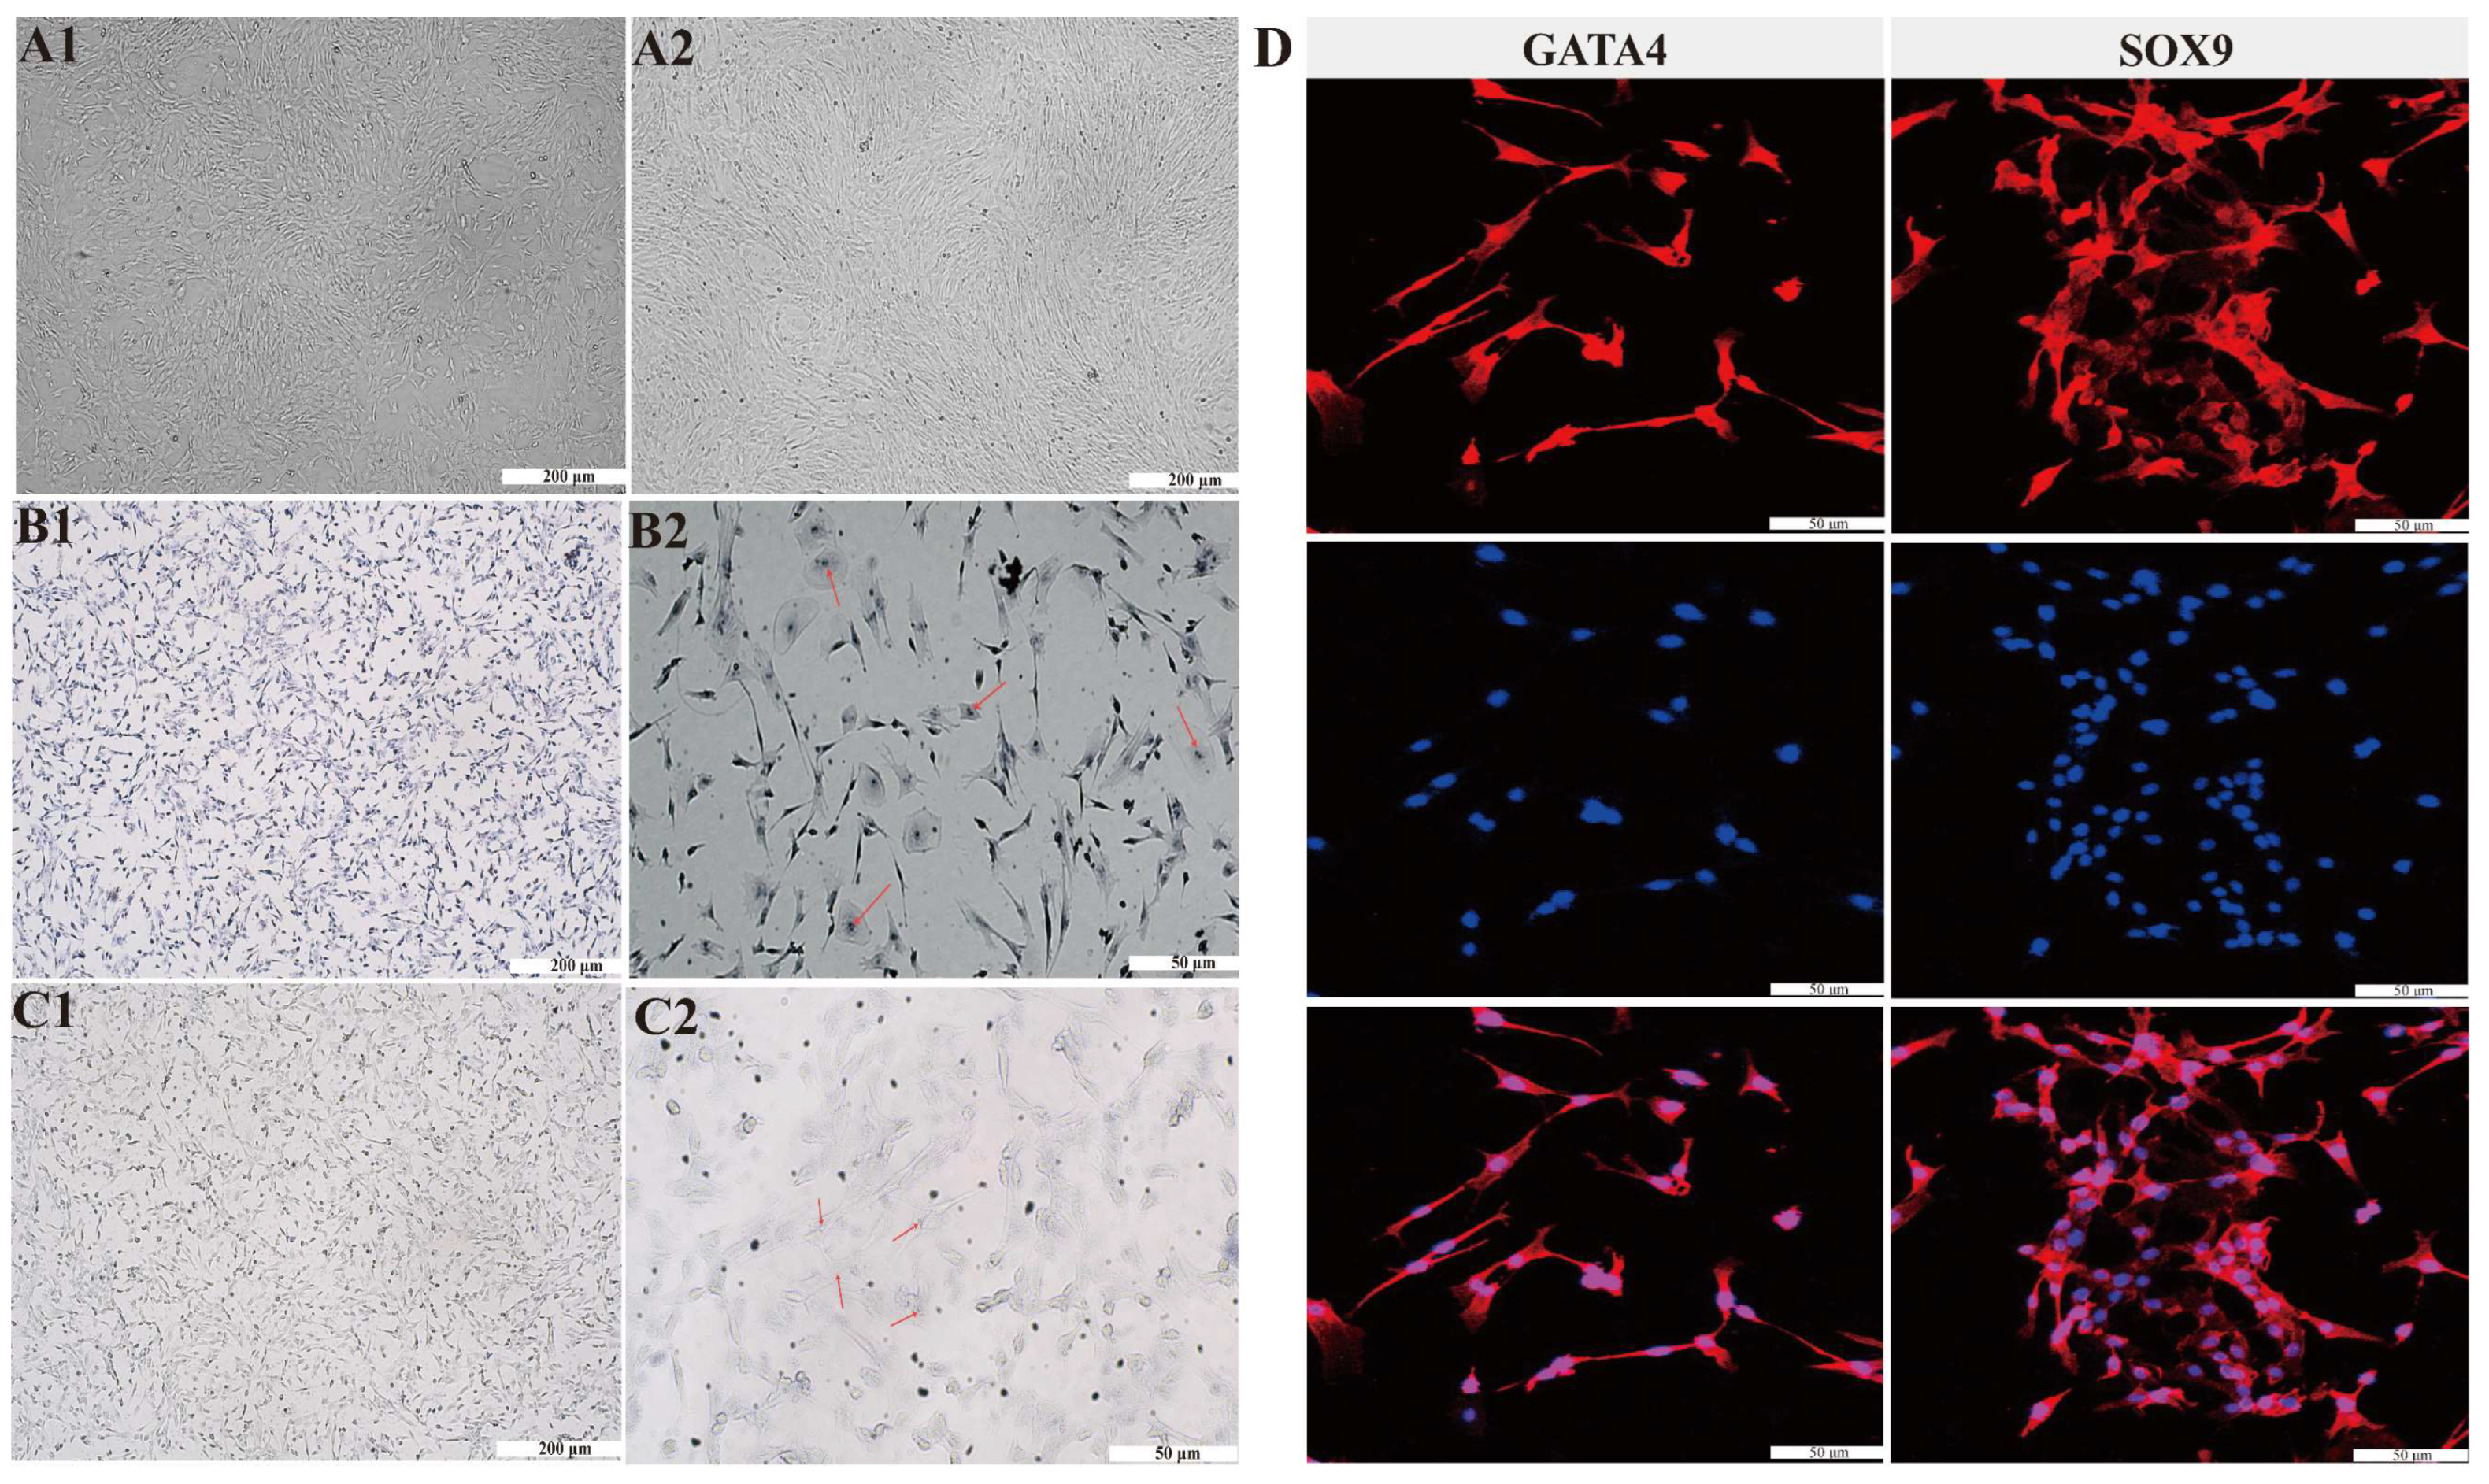
Primary SCs were isolated by differential adhesion combined with hypotonic treatment and 0.05% trypsin digestion to reduce contamination from spermatogenic and interstitial cells. After 48 h of purification, the proportion of SCs exceeded 85%. By the third passage, the cells displayed a relatively uniform morphology and stable growth characteristics (Figure 1(A1,A2)). Cell identity and enrichment were further evaluated by morphological and staining analyses. The isolated cells exhibited the typical bipolar morphology of SCs, with elongated cytoplasmic processes. Oil Red O staining showed the presence of intracellular lipid droplets with relatively weak staining intensity (Figure 1(B1,B2)). ALP staining revealed only minimal positive signals, suggesting low contamination by peritubular myoid cells (Figure 1(C1,C2)). In addition, immunofluorescence staining showed strong GATA4 and SOX9 signals in the cultured cells (Figure 1D), consistent with the characteristics of Sertoli cells. Together, these findings indicate that the isolated cell population was highly enriched for SCs and was suitable for subsequent in vitro experiments.

3.2. Association of YAP1 Overexpression or Silencing with Sertoli Cell Viability and Viability-Related Transcript Expression

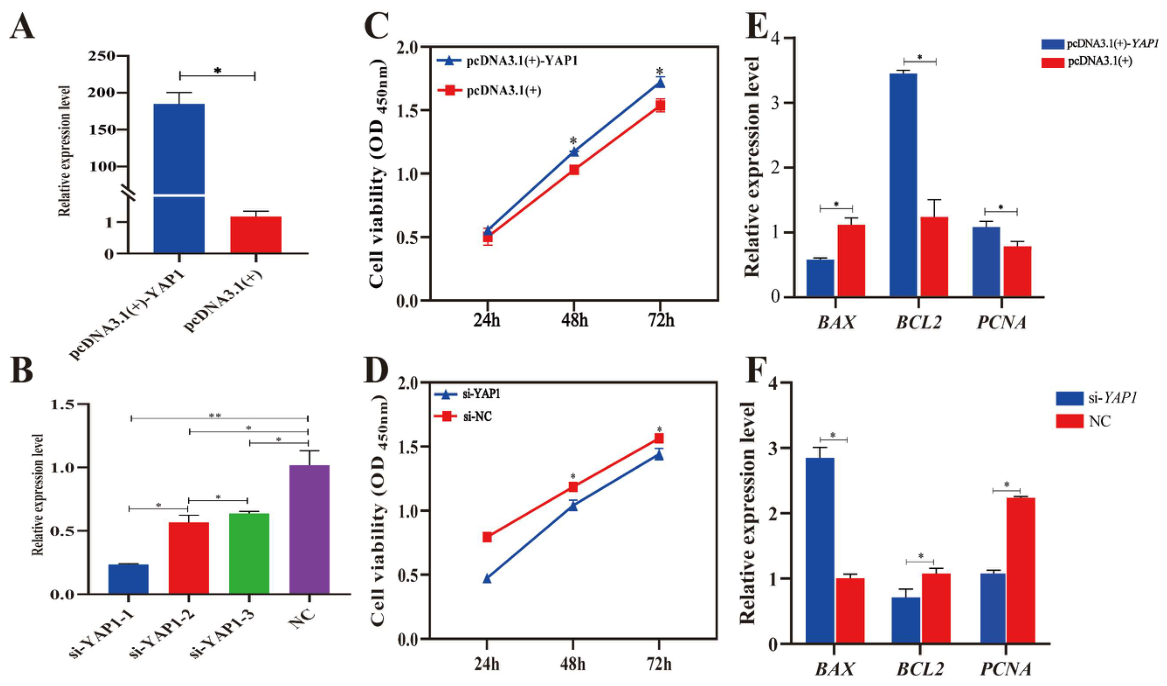
RT-qPCR performed 48 h after transfection confirmed the effectiveness of YAP1 overexpression and silencing. Compared with the corresponding control, YAP1 mRNA expression was significantly increased in the pcDNA3.1(+)-YAP1 group (p < 0.05; Figure 2A). Among the three interference fragments, si-YAP1-1 showed the strongest inhibitory effect on YAP1 expression (p < 0.01; Figure 2B) and was therefore used in subsequent knockdown experiments. CCK-8 assays showed no significant difference in cell viability among groups at 24 h after transfection (p > 0.05). In contrast, at 48 h and 72 h, cell viability was significantly higher in the YAP1 overexpression group than in the empty-vector group (p < 0.05), whereas YAP1 silencing significantly reduced cell viability relative to the si-NC group (p < 0.05; Figure 2C,D). RT-qPCR further showed that YAP1 overexpression was accompanied by significantly decreased BAX expression and significantly increased PCNA and BCL2 expression (p < 0.05). Conversely, YAP1 silencing resulted in significantly increased BAX expression and significantly decreased PCNA and BCL2 expression compared with the negative control group (p < 0.05; Figure 2E,F).
Overall, these data indicate that altered YAP1 expression was associated with changes in CCK-8-based Sertoli cell viability and with corresponding mRNA-level changes in viability-associated genes. Because BAX, BCL2, and PCNA were not examined at the protein level, these findings should be interpreted as transcriptional evidence rather than direct evidence of altered proliferation or apoptosis.

3.3. Effect of YAP1 Silencing or Overexpression on Hippo Pathway Downstream Genes

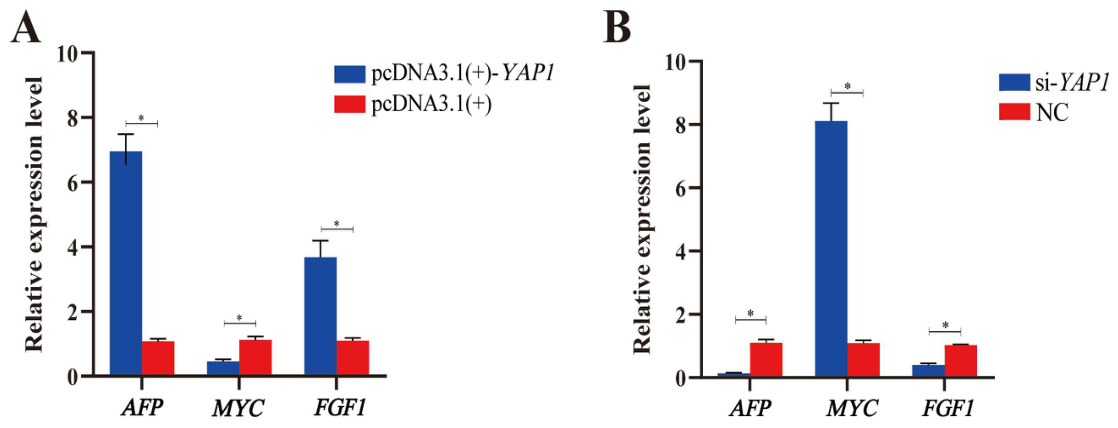
RT-qPCR analysis performed 48 h after transfection showed that altered YAP1 expression was accompanied by changes in several Hippo pathway-related transcripts. In the YAP1 overexpression group, AFP and FGF1 expression levels were significantly increased compared with those in the empty-vector group (p < 0.05), whereas MYC expression showed a decreasing trend (Figure 3A). In contrast, YAP1 silencing significantly reduced AFP and FGF1 expression relative to the control group (p < 0.05), while MYC expression was increased (Figure 3B). Overall, these results indicate that YAP1 modulation was associated with differential transcriptional changes in Hippo pathway-related genes in sheep Sertoli cells, with AFP and FGF1 showing expression patterns more consistent with YAP1 abundance.

3.4. Effect of YAP1 Overexpression or Silencing on Functional Genes in Sheep SCs

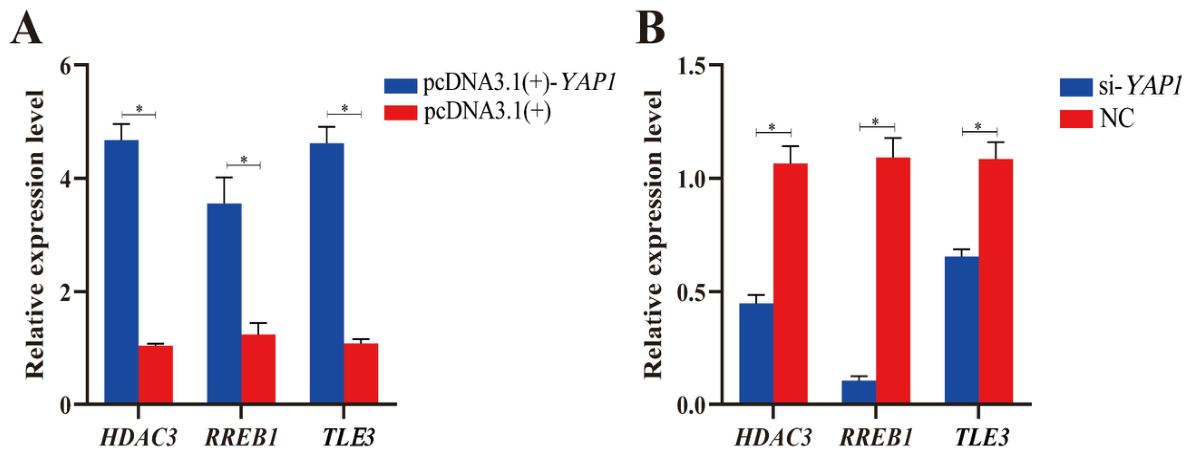
RT-qPCR analysis performed 48 h after transfection showed that YAP1 modulation was associated with changes in the expression of SC functional genes. Compared with the empty-vector group, HDAC3, RREB1 and TLE3 expression levels were significantly increased in the pcDNA3.1(+)-YAP1 group (p < 0.05; Figure 4A). In contrast, silencing of YAP1 significantly reduced the expression of these three genes relative to the negative control group (p < 0.05; Figure 4B). These results indicate that altered YAP1 expression was associated with corresponding transcriptional changes in SC functional genes.

3.5. miR-132-y Is Associated with YAP1 Expression Through Interaction with the YAP1 3′UTR

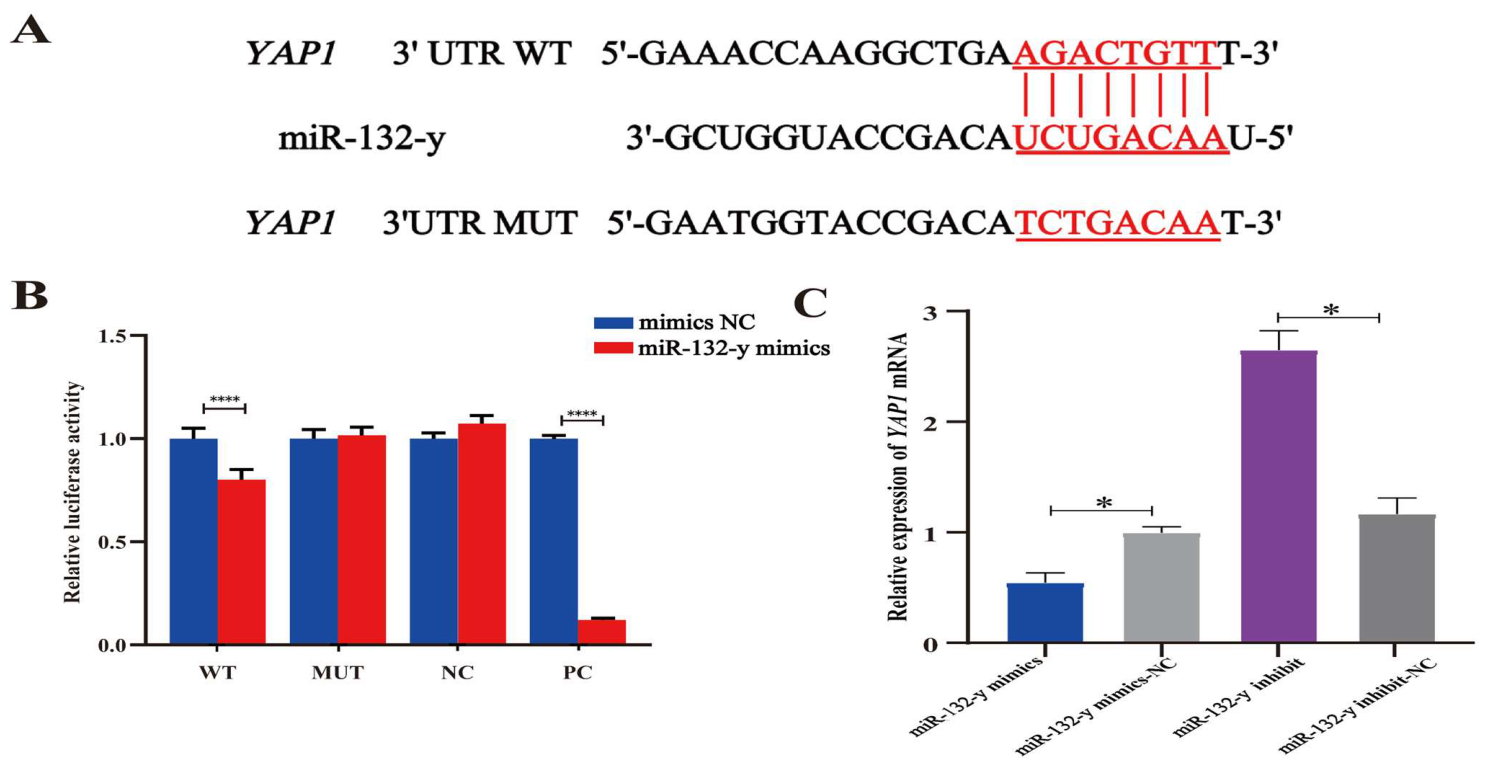
Previous sequencing analysis identified several candidate miRNAs targeting YAP1, among which miR-132-y was selected for further investigation. TargetScan analysis predicted a conserved miR-132-y binding site within the 3′UTR of ovine YAP1 (Figure 5A). To verify this interaction, luciferase reporter plasmids containing either the wild-type (WT) or mutant (MUT) YAP1 3′UTR were constructed. Dual-luciferase reporter assays showed that transfection of miR-132-y mimic significantly reduced luciferase activity in the WT group (p < 0.01), whereas no significant change was observed in the MUT group (p > 0.05; Figure 5B). In addition, RT-qPCR analysis showed that transfection of the miR-132-y mimic significantly decreased YAP1 mRNA expression, whereas transfection of the miR-132-y inhibitor significantly increased YAP1 expression compared with the corresponding control group (p < 0.05; Figure 5C). Together, these findings support a direct interaction between miR-132-y and the YAP1 3′UTR and indicate that miR-132-y is associated with reduced YAP1 expression in sheep Sertoli cells.

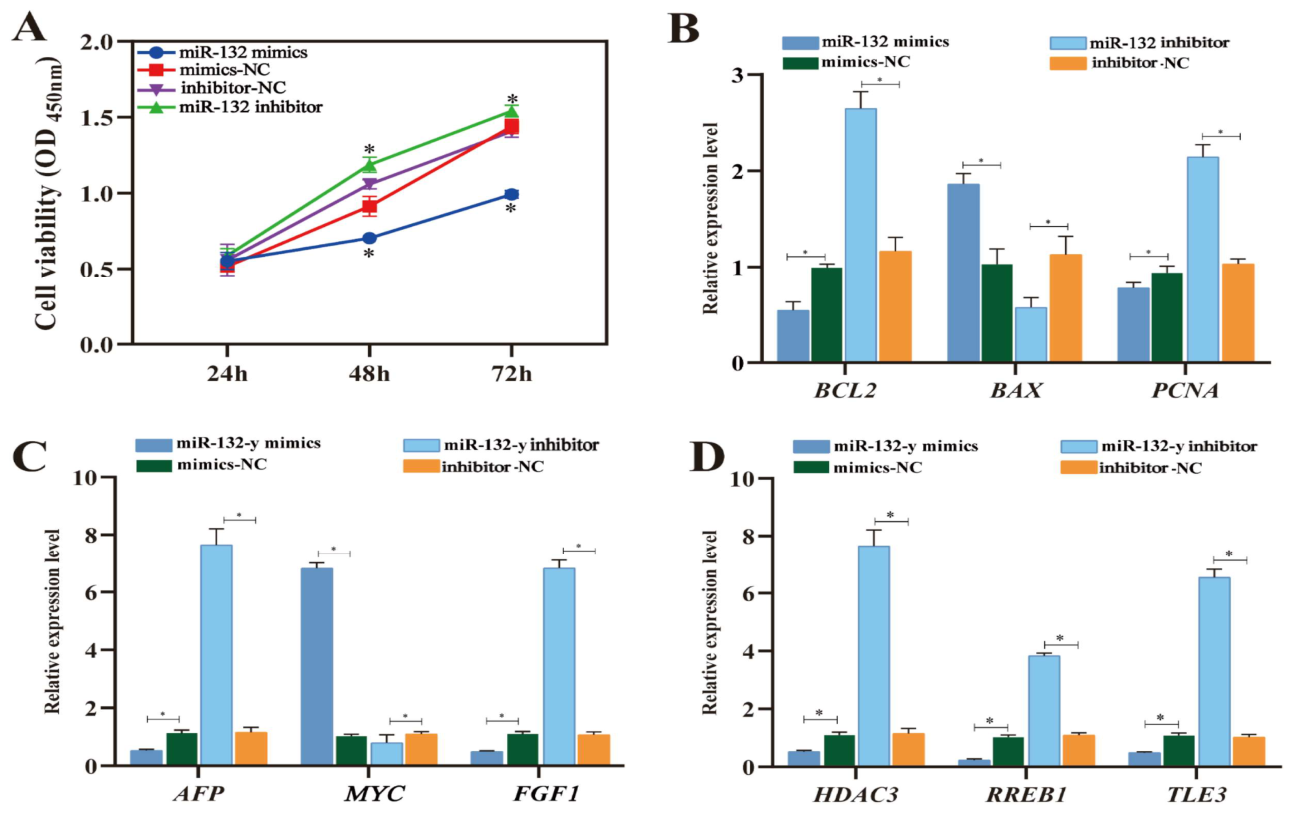
3.6. Association of miR-132-y Modulation with Sertoli Cell Viability and Viability-Related Transcript Expression

To evaluate the effects of miR-132-y on sheep Sertoli cells, cell viability was first assessed using the CCK-8 assay. No significant differences were observed between the miR-132-y overexpression or inhibition groups and their corresponding control groups at 24 h post-transfection. However, at 48 h and 72 h, cell viability was significantly lower in the miR-132-y mimic group than in the control group, whereas transfection of the miR-132-y inhibitor significantly increased cell viability relative to the corresponding control group (Figure 6A). RT-qPCR was subsequently performed to examine transcriptional changes in proliferation- and apoptosis-related genes. Overexpression of miR-132-y significantly increased BAX expression and significantly decreased PCNA and BCL2 expression (p < 0.05). In contrast, inhibition of miR-132-y produced the opposite expression pattern (Figure 6B). Taken together, these results indicate that miR-132-y modulation was associated with changes in CCK-8-based Sertoli cell viability and with altered mRNA expression of viability-associated genes. These data do not directly demonstrate changes in proliferation or apoptosis, which require further validation using protein-level and cell-based functional assays. Since the corresponding protein levels of BAX, BCL2 and PCNA were not measured, the effects of miR-132-y on proliferation- or apoptosis-related proteins remain to be determined.

3.7. Impact of miR-132-y on Hippo Pathway Downstream Targets and Functional Genes in SCs

RT-qPCR analysis showed that miR-132-y modulation was associated with changes in the expression of Hippo/YAP signaling-related genes. Compared with the corresponding control group, AFP, MYC and FGF1 expression levels were significantly decreased in the miR-132-y mimic group (p < 0.05), whereas the miR-132-y inhibitor group showed the opposite pattern (p < 0.05; Figure 6C). A similar trend was observed for SC functional genes. Relative to the corresponding control group, HDAC3, RREB1 and TLE3 expression levels were reduced in the miR-132-y mimic group and significantly increased in the miR-132-y inhibitor group (Figure 6D). Because YAP1 protein abundance, YAP phosphorylation status, YAP subcellular localization, and YAP/TAZ-TEAD transcriptional reporter activity were not assessed, these data should be interpreted as transcript-level evidence of selected YAP1-related responses rather than direct evidence of altered Hippo/YAP pathway activity.

3.8. Rescue Experiment

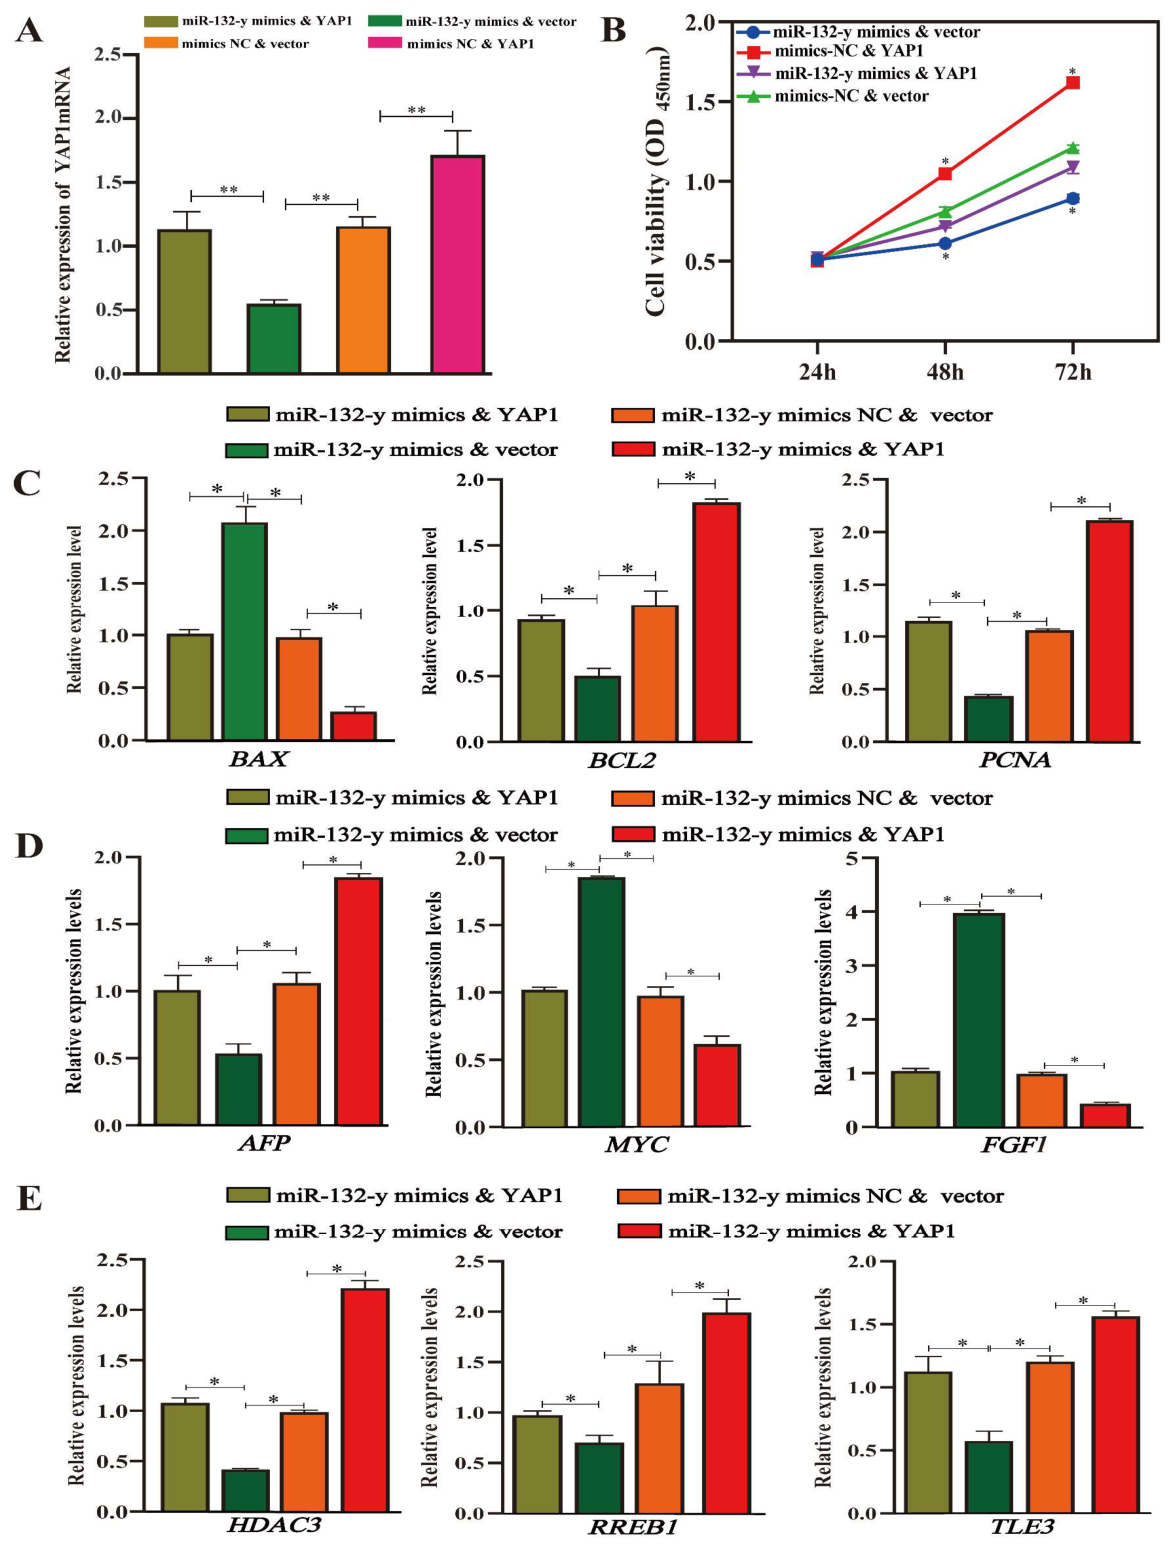
To further assess whether YAP1 mediates the effects of miR-132-y in sheep Sertoli cells, a rescue experiment was performed using four transfection groups: miR-132-y mimic + pcDNA3.1(+)-YAP1, miR-132-y mimic + empty vector, mimic negative control + pcDNA3.1(+)-YAP1 and mimic negative control + empty vector. RT-qPCR analysis showed that YAP1 mRNA expression in the co-transfection group was significantly higher than that in the miR-132-y mimic + empty vector group (p < 0.05), whereas no significant difference was observed relative to the negative control group (p > 0.05; Figure 7A).
Compared with the miR-132-y mimic + empty vector group, co-transfection with the YAP1 overexpression plasmid significantly increased cell viability and was accompanied by expression changes in proliferation- and apoptosis-related genes opposite to those induced by miR-132-y overexpression alone (Figure 7B,C). In addition, the altered expression of Hippo pathway-related genes and SC functional genes induced by miR-132-y overexpression was partially attenuated by ectopic YAP1 expression (Figure 7D,E).

4. Discussion

Although primary Sertoli cell culture systems have been well established in rodents, species-specific differences remain an important consideration when isolating and culturing testicular somatic cells from livestock and poultry species [19,20,21,22,23,24,25]. Previous methodological studies have shown that mechanical dissociation combined with enzymatic digestion is an effective strategy for Sertoli cell isolation, and marker-based characterization is necessary to evaluate cell identity and enrichment [26,27]. In the present study, primary Sertoli cells were enriched from 4-month-old Southdown × Hu F1 sheep testes using enzymatic dissociation, hypotonic treatment, and differential adhesion, based on previously described principles for Sertoli cell preparation and identification [28,29,30,31,32,33,34]. The isolated cells showed typical elongated or bipolar morphology and were characterized by Oil Red O staining, weak alkaline phosphatase staining, and positive immunofluorescence signals for the Sertoli cell markers GATA4 and SOX9, with an estimated purity exceeding 85%. These results indicate that the culture system was enriched for Sertoli cells and suitable for subsequent in vitro assays. Nevertheless, because a comprehensive negative-marker panel for germ cells, Leydig cells, and peritubular myoid cells was not performed, minor contamination by other testicular cell populations cannot be completely excluded. Therefore, the observed responses should be interpreted in the context of an enriched primary Sertoli cell culture system rather than as definitive Sertoli cell-autonomous effects.
A limitation of this study is that cell proliferation and apoptosis were inferred from gene expression and viability assays rather than directly quantified at the cellular level. The dynamic balance between cell proliferation and apoptosis is precisely regulated by a multilevel regulatory network, involving the synergy between cyclins (Cyclins/CDKs) and apoptosis-related molecules (Bcl2 family/Caspases). Proliferating cell nuclear antigen (PCNA) plays an important role in DNA replication and, together with cyclin-dependent kinases, contributes to G1/S-phase progression and cell proliferation [35]. As a representative pro-apoptotic member of the BCL2 family, BAX participates in the mitochondrial apoptosis pathway. In response to apoptotic stimuli, BAX translocates to mitochondria and contributes to mitochondrial outer membrane permeabilization. This process promotes the release of pro-apoptotic factors, such as cytochrome c, and activates the caspase cascade [36]. Overexpression of BAX can induce cell apoptosis. Bax-deficient male mice exhibit infertility accompanied by abnormal seminiferous tubule architecture and the accumulation of atypical premeiotic germ cells. This abnormal condition hinders the production of mature sperm and ultimately leads to atrophy of the testicles in adult mice [37]. The BAX gene plays a role in the process of spermatogenesis and in maintaining the number of cells in the testicle environment. The BAX defect leads to a large accumulation of germ cells before meiosis in mature animals, and almost complete absence of sperm cells and mature sperm [38]. After Xi et al. performed local testicular heating of pig testes in vitro, mRNA and protein levels of BAX and Bcl2 increased, resulting in an increase in apoptotic germ cells [39]. Zhao et al. administered fluoride treatment to rats and assessed the expression of the proliferation markers PCNA and Ki-67 in testicular and epididymal tissues using immunohistochemistry. F treatment significantly increased the apoptosis of spermatogenetic cells in the testicles. It was found that PCNA and Ki-67 were also positively expressed in the testicles, resulting in spermatogenesis disorders [40,41]. When YAP1 is overexpressed in SCs, the expression level of BAX is downregulated, while the expression levels of PCNA and Bcl2 are upregulated; on the contrary, after interfering with YAP1 expression, the expression level of BAX is increased, and the expression of PCNA is suppressed. The relatively modest changes in cell viability observed in this study may reflect the tightly controlled nature of Sertoli cell proliferation and survival, where subtle regulatory effects can still be biologically meaningful. These results suggest that YAP1 modulation is associated with changes in CCK-8-based cell viability and in the mRNA expression of selected viability-associated genes. However, because direct proliferation/apoptosis assays and protein-level validation were not performed, these findings should not be interpreted as definitive evidence that YAP1 directly promotes proliferation or inhibits apoptosis.
The Hippo signaling pathway, as a signal pathway that regulates cell proliferation, differentiation and survival, mainly plays a role in cancer and tumor diseases. Alpha-fetoprotein (AFP), a diagnostic marker for non-seminomatous germ cell tumors and testicular cancer prior to treatment, was positive in more than 50% of patients in the study by Takami et al. [42]. After overexpressing YAP1 in this study, the AFP expression level was significantly upregulated, and it was speculated that the increase in its expression level was related to the activation of YAP1. After silencing, the AFP expression level was significantly reduced, which further evidenced the speculation of this study. The Hippo signaling pathway also plays an important role in maintaining dynamic tissue balance and organ regeneration. After liver damage, the expression of FGF1 increases by activating the Hippo signaling pathway, promoting the proliferation of hepatocytes and liver regeneration [43].
Sertoli cells are essential for germ cell development by supporting maturation and establishing the blood–testis barrier (BTB), which provides an immune-protective microenvironment for meiotic and postmeiotic germ cells [44]. Among the Sertoli cell function-associated genes examined in this study, HDAC3 has been implicated in germ cell development and Sertoli cell maturation-related epigenetic regulation [45,46]. RREB1, a conserved zinc finger transcription factor, is enriched in Sertoli cells and has been associated with Sertoli cell development and FSHR promoter activity, suggesting a potential role in spermatogenesis-related signaling [47,48,49,50]. TLE3, a transcriptional corepressor, also shows stage- and cell type-associated expression during male germ cell development, and altered TLE3 expression has been linked to abnormal Sertoli cell responses [51,52,53]. In the present study, YAP1 overexpression was accompanied by increased HDAC3, RREB1 and TLE3 mRNA expression, whereas YAP1 silencing showed the opposite pattern. These findings suggest that YAP1 modulation is associated with transcriptional changes in selected Sertoli cell function-associated genes. However, because these genes were measured only at the mRNA level, and YAP1 protein abundance, phosphorylation status, subcellular localization, and transcriptional activity were not directly assessed, these results should be interpreted as transcript-level associations rather than direct evidence that YAP1 regulates BTB function or Sertoli cell maturation.
Previous studies have demonstrated that follicle-stimulating hormone (FSH) can regulate YAP activity in Sertoli cells, highlighting the interaction between hormonal signaling and the Hippo pathway. For example, FSH has been shown to influence YAP phosphorylation status and its downstream transcriptional activity in cultured Sertoli cells [54,55]. Although FSH signaling was not directly investigated in the present study, our findings that miR-132-y regulates YAP1 expression suggest a potential link between post-transcriptional regulation and hormone-mediated signaling pathways. These observations imply that YAP1 regulation in Sertoli cells may involve complex interactions between miRNA-mediated mechanisms and endocrine signaling.
MicroRNAs regulate gene expression post-transcriptionally by binding to complementary sequences within the 3′UTR of target mRNAs, leading to mRNA degradation and translational repression [56]. In the present study, the dual-luciferase reporter assay and RT-qPCR results support a direct regulatory relationship between miR-132-y and the YAP1 3′UTR in sheep Sertoli cells. Specifically, miR-132-y overexpression decreased YAP1 mRNA abundance, whereas miR-132-y inhibition increased YAP1 expression, indicating that YAP1 is a transcript-level target of miR-132-y in this in vitro model. However, the effects of miR-132-y are unlikely to be mediated exclusively through YAP1. Because a single miRNA can regulate multiple downstream mRNAs simultaneously, the changes in CCK-8-based cell viability and viability-associated transcript expression observed after miR-132-y modulation may reflect the combined contribution of YAP1-dependent and YAP1-independent regulatory events [57]. Therefore, the present findings should be interpreted as evidence that miR-132-y is associated with a post-transcriptional regulatory network involving YAP1, rather than as proof of a single linear miR-132-y–YAP1 pathway. Future studies using transcriptome-wide target identification, protein-level validation, and direct functional assays will be required to define the broader target spectrum of miR-132-y and its role in Sertoli cell biology.
Several limitations of this study should be acknowledged. First, all functional analyses were performed in an in vitro primary Sertoli cell culture system, and the physiological relevance of the miR-132-y–YAP1 relationship remains to be validated in vivo. Second, the present study mainly relied on CCK-8 assays and RT-qPCR analysis of selected transcripts. CCK-8 reflects cellular metabolic activity and overall viability, but it does not directly distinguish proliferation from apoptosis. Similarly, changes in BAX, BCL2, PCNA, AFP, MYC, FGF1, HDAC3, RREB1 and TLE3 mRNA abundance do not necessarily indicate corresponding changes at the protein or functional level. Third, YAP1 protein abundance, YAP phosphorylation status, YAP subcellular localization, and YAP/TAZ-TEAD transcriptional activity were not directly examined. Fourth, although the isolated cell population was enriched for Sertoli cells based on morphology, Oil Red O staining, weak ALP staining, and GATA4/SOX9 immunofluorescence, a comprehensive negative-marker panel for germ cells, Leydig cells, and peritubular myoid cells was not performed. Therefore, minor contamination by other testicular cell types cannot be completely excluded. These limitations indicate that the current findings should be interpreted as cell-based evidence for a miR-132-y–YAP1 regulatory relationship and associated transcriptional responses, rather than definitive proof of an in vivo Sertoli cell-autonomous mechanism.
MiRNAs exhibit dynamic expression patterns during male reproductive development and have been implicated in the regulation of spermatogenesis and Sertoli cell function. Taking miR-361-3p as an example, this molecule specifically regulates the expression level of the FSHB gene, thereby affecting the biosynthesis process of gonadotropin, and ultimately participates in the biological mechanism of regulating spermatogenesis [58]. Another study found that miR-762 can effectively stimulate the proliferation activity of immature Sertoli cells by acting on the RNF4 gene regulatory network in the pig model, which provides a new perspective for the study of the mechanism of germ cell development [59]. The Hippo signaling pathway is a mechanism that regulates the size of mammalian and human organs. Organ size is regulated by mediating cell growth, division, and death. In the case of low cell density, inhibition of the Hippo pathway leads to activation of YAP, and the activated YAP moves toward the nucleus. This series of events leads to the activation of subsequent genes responsible for elevated cell growth, thereby inhibiting the biogenesis of miRNAs [60]. In addition, miRNAs can target components of the Hippo pathway. miR-132 has been reported to show differential expression between embryonic and postnatal sperm, and sperm concentration has been positively associated with ANO1 expression in sperm [61]. Functional studies have shown that bta-miR-146b overexpression inhibits the proliferation of bovine male germline stem cells and may participate in apoptosis-related regulation. In contrast, regulating bta-miR-146b inhibitors can promote cattle reproduction and proliferation, resulting in stagnation of yak sperm [62]. In cynomolgus monkeys, altered miR-34b-5p and miR-34c-5p expression has been associated with changes in germ cell number, including reductions in spermatocytes and spermatids [63]. Another study reported a negative association between miR-29a and TRPV4 expression during testicular ischemia–reperfusion injury, with reduced miR-29a expression observed in both animal tissues and GC-1 germ cells. MiR-29a inhibition upregulates TRPV4 and aggravates germ cell apoptosis, while overexpression significantly reduces TRPV4 levels, effectively alleviating IRI-induced apoptosis in vivo and in vivo models [64].
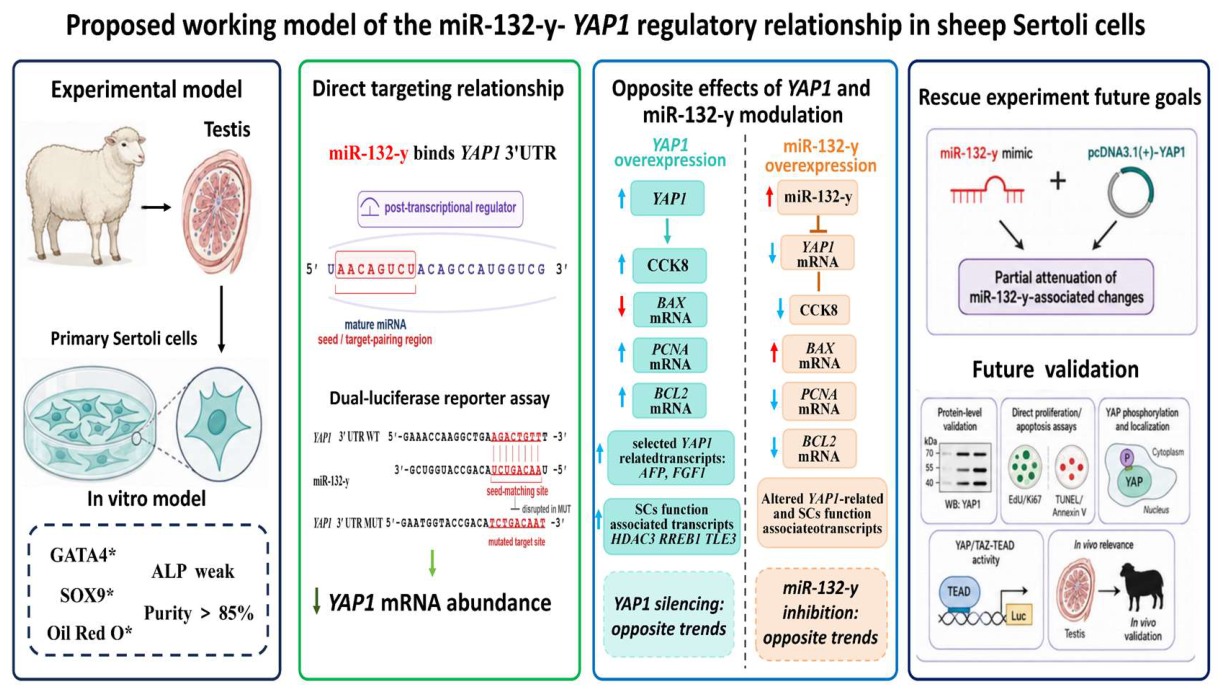
Although the present study provides in vitro, cell-based evidence supporting a regulatory relationship between miR-132-y and YAP1 in sheep Sertoli cells, several additional experiments should be performed to further strengthen and extend the current findings. First, protein-level validation is required, including the detection of YAP1, phosphorylated YAP, BAX, BCL2, PCNA/Ki67, cleaved caspase-3, and cleaved PARP, to determine whether the observed mRNA-level changes are translated into corresponding protein-level alterations. Second, direct functional assays, such as EdU or Ki67 staining, TUNEL staining, and Annexin V/PI flow cytometry, are necessary to distinguish effects on proliferation and apoptosis from general changes in CCK-8-based cell viability. Third, YAP subcellular localization, YAP phosphorylation status, YAP/TAZ-TEAD reporter activity, and additional canonical YAP/TAZ target genes should be examined to determine whether miR-132-y functionally modulates Hippo-YAP signaling activity. Fourth, the upstream mechanisms regulating miR-132-y expression in Sertoli cells, including endocrine, developmental, and stress-related signals, should be investigated. Finally, in vivo studies in developing testes and further analyses linking this regulatory axis to male reproductive traits will be important for defining its physiological relevance to testicular development, spermatogenesis, mammalian reproductive biology, and livestock breeding (Figure 8).

5. Conclusions

In summary, this study provides in vitro, cell-based evidence that YAP1 is a transcript-level target of miR-132-y in sheep Sertoli cells. The predicted miR-132-y binding site within the YAP1 3′UTR was supported by a dual-luciferase reporter assay, and miR-132-y modulation was associated with reciprocal changes in YAP1 mRNA abundance. Gain- and loss-of-function analyses showed opposite associations between YAP1 or miR-132-y modulation and CCK-8-based Sertoli cell viability, as well as the mRNA expression of selected viability-associated, YAP1-related, and Sertoli cell function-associated genes. Rescue experiments further showed that ectopic YAP1 expression partially attenuated miR-132-y-associated changes, suggesting that YAP1 may contribute, at least in part, to miR-132-y-associated transcriptional responses in this in vitro model.
Collectively, these findings extend the miRNA–YAP1 regulatory framework to ovine primary Sertoli cells and provide a basis for further investigation of post-transcriptional regulation in testicular somatic cells. To strengthen the results presented in this study and further define the biological significance of the miR-132-y–YAP1 axis, additional experiments should be performed in future work, including protein-level validation, direct proliferation and apoptosis assays, YAP phosphorylation and subcellular localization analyses, YAP/TAZ-TEAD activity assays, upstream regulatory assessment of miR-132-y, and in vivo verification in developing testes. These additional studies will be important for determining the physiological relevance of this regulatory axis to Sertoli cell function, testicular development, spermatogenesis, and male reproductive performance.

Supplementary Materials

The following supporting information can be downloaded at: https://www.mdpi.com/article/10.3390/biom16070995/s1, Figure S1: Complete nucleic acid sequence information of YAP1 3′-UTR wild-type and mutant recombinant plasmids; Table S1: Information of si-YAP1 sequence; Table S2: Information of miRNA sequence; Table S3: Information of primer sequence.

Author Contributions

Conceptualization, X.A. and B.X.; methodology, B.X., Z.L., M.Z. and X.A.; software, B.X., R.Z. and L.Z.; validation, B.X. and M.Z.; formal analysis, X.A.; investigation, Y.Y.; resources, B.X. and X.A.; data curation, B.X. and X.A.; writing—original draft preparation, B.X., Y.Y. and X.A.; writing—review and editing, B.X. and X.A.; visualization, X.A.; supervision, Y.Y.; project administration, X.A.; funding acquisition, Y.Y. All authors have read and agreed to the published version of the manuscript.

Funding

This research was funded by the Agricultural Science and Technology Innovation Program of China (CAAS-ZDRW202502), the Central Public-interest Scientific Institution Basal Research Fund (Y2026YY05), and the earmarked fund for Gansu Agriculture Research System (GSARS02).

Institutional Review Board Statement

This study was approved by the Animal Management and Ethics Committee of the Lanzhou Institute of Husbandry and Veterinary Medicine, Chinese Academy of Agricultural Sciences (Approval No. 0231447; approval date: 19 November 2023). All animal procedures were conducted in accordance with the institutional guidelines for animal care and welfare.

Informed Consent Statement

Not applicable.

Data Availability Statement

The original contributions presented in this study are included in the article/supplementary material. Further inquiries can be directed to the corresponding authors.

Conflicts of Interest

The authors declare no conflicts of interest.

References

  1. Zhong, T.; Hou, D.; Zhao, Q.; Zhan, S.; Wang, L.; Li, L.; Zhang, H.; Zhao, W.; Yang, S.; Niu, L. Comparative whole-genome resequencing to uncover selection signatures linked to litter size in Hu Sheep and five other breeds. BMC Genom. 2024, 25, 480. [Google Scholar] [CrossRef]
  2. Zhang, R.; An, X.; Li, J.; Lu, Z.; Niu, C.; Xu, Z.; Zhang, J.; Geng, Z.; Yue, Y.; Yang, B. Comparative analysis of growth performance, meat productivity, and meat quality in Hu sheep and its hybrids. Acta Prataculturae Sin. 2024, 33, 186–197. [Google Scholar]
  3. Kong, L.; Yue, Y.; Zhang, C.; Lu, Z. Slaughtering Performance and Meat Quality Characteristics of Hu Sheep and Its Hybrid Offspring with Southdown Sheep. Food Sci. 2023, 44, 64–70. [Google Scholar]
  4. Kong, L.; Yue, Y.; Li, J.; Yang, B.; Chen, B.; Liu, J.; Lu, Z. Transcriptomics and metabolomics reveal improved performance of Hu sheep on hybridization with Southdown sheep. Food Res. Int. 2023, 173, 113240. [Google Scholar] [CrossRef] [PubMed]
  5. Liu, J.; Liang, Z.; Li, W.; Weng, X.; Yue, X.; Li, F. Effect of whole-plant mulberry supplementation on testis development and antioxidant capacity in Hu rams. Anim. Biosci. 2025, 38, 1398–1410. [Google Scholar] [CrossRef] [PubMed]
  6. O’Donnell, L.; Smith, L.B.; Rebourcet, D. Sertoli cells as key drivers of testis function. Semin. Cell Dev. Biol. 2022, 121, 2–9. [Google Scholar] [CrossRef] [PubMed]
  7. Tysoe, O. Sertoli cell lysosomal dysfunction drives age-related testicular degeneration. Nat. Rev. Endocrinol. 2024, 20, 386. [Google Scholar] [CrossRef] [PubMed]
  8. Rehder, P.; Packeiser, E.M.; Körber, H.; Goericke-Pesch, S. Altered Sertoli Cell Function Contributes to Spermatogenic Arrest in Dogs with Chronic Asymptomatic Orchitis. Int. J. Mol. Sci. 2025, 26, 1108. [Google Scholar] [CrossRef] [PubMed]
  9. Nadri, P.; Nadri, T.; Gholami, D.; Zahmatkesh, A.; Hosseini Ghaffari, M.; Savvulidi Vargova, K.; Georgijevic Savvulidi, F.; LaMarre, J. Role of miRNAs in assisted reproductive technology. Gene 2024, 927, 148703. [Google Scholar] [CrossRef] [PubMed]
  10. Ditonno, F.; Franco, A.; Manfredi, C.; Fasanella, D.; Abate, M.; La Rocca, R.; Crocerossa, F.; Iossa, V.; Falagario, U.G.; Cirillo, L.; et al. The Role of miRNA in Testicular Cancer: Current Insights and Future Perspectives. Medicina 2023, 59, 2033. [Google Scholar] [CrossRef] [PubMed]
  11. Chen, X.; Zheng, Y.; Li, X.; Gao, Q.; Feng, T.; Zhang, P.; Liao, M.; Tian, X.; Lu, H.; Zeng, W. Profiling of miRNAs in porcine Sertoli cells. J. Anim. Sci. Biotechnol. 2020, 11, 85. [Google Scholar] [CrossRef] [PubMed]
  12. Meroni, S.B.; Galardo, M.N.; Rindone, G.; Gorga, A.; Riera, M.F.; Cigorraga, S.B. Molecular Mechanisms and Signaling Pathways Involved in Sertoli Cell Proliferation. Front. Endocrinol. 2019, 10, 224. [Google Scholar] [CrossRef]
  13. Ferrero, G.; Festa, R.; Follia, L.; Lettieri, G.; Tarallo, S.; Notari, T.; Giarra, A.; Marinaro, C.; Pardini, B.; Marano, A.; et al. Small noncoding RNAs and sperm nuclear basic proteins reflect the environmental impact on germ cells. Mol. Med. 2024, 30, 12. [Google Scholar] [CrossRef] [PubMed]
  14. Razavi, S.M.; Sabbaghian, M.; Jalili, M.; Divsalar, A.; Wolkenhauer, O.; Salehzadeh-Yazdi, A. Comprehensive functional enrichment analysis of male infertility. Sci. Rep. 2017, 7, 15778. [Google Scholar] [CrossRef] [PubMed]
  15. Yang, J. Role of MicroRNA-Mediatted Hippo Signaling Pathway in the Reproductive Organs Damage Malformation Induced by Vinclozolin in Mice; Hunan Normal University: Changsha, China, 2020. [Google Scholar]
  16. Guo, Q.; Lu, Y.; Huang, Y.; Guo, Y.; Zhu, S.; Zhang, Q.; Zhu, D.; Wang, Z.; Luo, J. Exosomes from β-Cells Promote Differentiation of Induced Pluripotent Stem Cells into Insulin-Producing Cells Through microRNA-Dependent Mechanisms. Diabetes Metab. Syndr. Obes. Targets Ther. 2021, 14, 4767–4782. [Google Scholar]
  17. Negrón-Pérez, V.M.; Hansen, P.J. Role of yes-associated protein 1, angiomotin, and mitogen-activated kinase kinase 1/2 in development of the bovine blastocyst. Biol. Reprod. 2018, 98, 170–183. [Google Scholar] [PubMed]
  18. Zhou, M.; Zhao, Y.Q.; Yan, W.; Fu, X.F.; Zhang, L.H.; Zhang, H.Y.; Bao, G.G.; Liu, D.J. YAP1 promotes adipogenesis by regulating the negative feedback mechanism of the Hippo signaling pathway via LATS2. Zool. Res. 2025, 46, 851–862. [Google Scholar] [CrossRef] [PubMed]
  19. Gerber, J.; Rode, K.; Hambruch, N.; Langeheine, M.; Schnepel, N.; Brehm, R. Establishment and functional characterization of a murine primary Sertoli cell line deficient of connexin43. Cell Tissue Res. 2020, 381, 309–326. [Google Scholar] [CrossRef] [PubMed]
  20. Bhushan, S.; Aslani, F.; Zhang, Z.; Sebastian, T.; Elsässer, H.P.; Klug, J. Isolation of Sertoli Cells and Peritubular Cells from Rat Testes. J. Vis. Exp. 2016, 108, e53389. [Google Scholar] [CrossRef]
  21. Zhu, W.Q.; Yang, D.C.; Jiang, Y.; Cai, N.N.; Yang, R.; Zhang, X.M. Effective isolation of Sertoli cells from New Zealand rabbit testis. J. Adv. Vet. Anim. Res. 2021, 8, 218–223. [Google Scholar] [CrossRef] [PubMed]
  22. Godwin, O.C.; Daniel, E.N. Characteristics of Sertoli cells in the ectopic and scrotal testes of unilateral cryptorchid West African dwarf goats. Folia Morphol. 2016, 75, 355–363. [Google Scholar] [CrossRef][Green Version]
  23. Renier, G.; Gaulin, J.; Gibb, W.; Simard, P.; Leung, T.K.; Collu, R.; Ducharme, J.R. Isolation, purification and culture of Sertoli cells from immature piglet testes. Acta Endocrinol. 1986, 111, 411–418. [Google Scholar] [CrossRef]
  24. Wang, C.; Zheng, P.; Adeniran, S.O.; Ma, M.; Huang, F.; Adegoke, E.O.; Zhang, G. Thyroid hormone (T3) is involved in inhibiting the proliferation of newborn calf Sertoli cells via the PI3K/Akt signaling pathway in vitro. Theriogenology 2019, 133, 1–9. [Google Scholar] [PubMed]
  25. Yu, X.; Yuan, Y.; Qiao, L.; Gong, Y.; Feng, Y. The Sertoli cell marker FOXD1 regulates testis development and function in the chicken. Reprod. Fertil. Dev. 2019, 31, 867–874. [Google Scholar] [CrossRef] [PubMed]
  26. Cameron, D.F.; Muffly, K.E. Hormonal regulation of spermatid binding. J. Cell Sci. 1991, 100, 623–633. [Google Scholar] [CrossRef] [PubMed]
  27. Bernardino, R.L.; Alves, M.G.; Oliveira, P.F. Establishment of Primary Culture of Sertoli Cells. Methods Mol. Biol. 2018, 1748, 1–8. [Google Scholar] [CrossRef] [PubMed]
  28. Ross, A.J.; Amy, S.P.; Mahar, P.L.; Lindsten, T.; Knudson, C.M.; Thompson, C.B.; Korsmeyer, S.J.; MacGregor, G.R. BCLW mediates survival of postmitotic Sertoli cells by regulating BAX activity. Dev. Biol. 2001, 239, 295–308. [Google Scholar] [CrossRef] [PubMed]
  29. Ma, K.; Chen, N.; Wang, H.; Li, Q.; Shi, H.; Su, M.; Zhang, Y.; Ma, Y.; Li, T. The regulatory role of BMP4 in testicular Sertoli cells of Tibetan sheep. J. Anim. Sci. 2023, 101, skac393. [Google Scholar] [CrossRef] [PubMed]
  30. Liu, C.; Wang, H.; Shang, Y.; Liu, W.; Song, Z.; Zhao, H.; Wang, L.; Jia, P.; Gao, F.; Xu, Z.; et al. Autophagy is required for ectoplasmic specialization assembly in sertoli cells. Autophagy 2016, 12, 814–832. [Google Scholar] [CrossRef] [PubMed]
  31. Malolina, E.A.; Galiakberova, A.A.; Mun, V.V.; Sabirov, M.S.; Dashinimaev, E.B.; Kulibin, A.Y. A comparative analysis of genes differentially expressed between rete testis cells and Sertoli cells of the mouse testis. Sci. Rep. 2023, 13, 20896. [Google Scholar] [CrossRef] [PubMed]
  32. Xiong, Z.; Wang, C.; Wang, Z.; Dai, H.; Song, Q.; Zou, Z.; Xiao, B.; Zhao, A.Z.; Bai, X.; Chen, Z. Raptor directs Sertoli cell cytoskeletal organization and polarity in the mouse testis. Biol. Reprod. 2018, 99, 1289–1302. [Google Scholar] [CrossRef] [PubMed]
  33. Lu, L.; Zhang, Q.; Ren, M.; Jin, E.; Hu, Q.; Zhao, C.; Li, S. Effects of Boron on Cytotoxicity, Apoptosis, and Cell Cycle of Cultured Rat Sertoli Cells In vitro. Biol. Trace Elem. Res. 2020, 196, 223–230. [Google Scholar] [PubMed]
  34. Anway, M.; Folmer, J.; Wright, W.; Zirkin, B. Isolation of sertoli cells from adult rat testes: An approach to exvivo studies of Sertoli cell function. Biol. Reprod. 2003, 68, 996–1002. [Google Scholar] [PubMed][Green Version]
  35. Pravdic, Z.; Vukovic, N.; Gasic, V.; Marjanovic, I.; Karan-Djurasevic, T.; Pavlovic, S.; Tosic, N. The influence of BCL2, BAX, and ABCB1 gene expression on prognosis of adult de novo acute myeloid leukemia with normal karyotype patients. Radiol. Oncol. 2023, 57, 239–248. [Google Scholar] [CrossRef] [PubMed]
  36. Zhang, M.; Wang, B.; Ni, Y.H.; Liu, F.; Fei, L.; Pan, X.Q.; Guo, M.; Chen, R.H.; Guo, X.R. Overexpression of uncoupling protein 4 promotes proliferation and inhibits apoptosis and differentiation of preadipocytes. Life Sci. 2006, 79, 1428–1435. [Google Scholar] [CrossRef] [PubMed]
  37. Russell, L.D.; Chiarini-Garcia, H.; Korsmeyer, S.J.; Knudson, C.M. Bax-dependent spermatogonia apoptosis is required for testicular development and spermatogenesis. Biol. Reprod. 2002, 66, 950–958. [Google Scholar] [CrossRef] [PubMed]
  38. Knudson, C.M.; Tung, K.S.; Tourtellotte, W.G.; Brown, G.A.; Korsmeyer, S.J. Bax-deficient mice with lymphoid hyperplasia and male germ cell death. Science 1995, 270, 96–99. [Google Scholar] [CrossRef] [PubMed]
  39. Xi, H.; Fan, X.; Zhang, Z.; Liang, Y.; Li, Q.; He, J. Bax and Bcl2 are involved in the apoptosis induced by local testicular heating in the boar testis. Reprod. Domest. Anim. 2017, 52, 359–365. [Google Scholar] [PubMed]
  40. Zhao, W.P.; Wang, H.W.; Liu, J.; Tan, P.P.; Luo, X.L.; Zhu, S.Q.; Chen, X.L.; Zhou, B.H. Positive PCNA and Ki-67 Expression in the Testis Correlates with Spermatogenesis Dysfunction in Fluoride-Treated Rats. Biol. Trace Elem. Res. 2018, 186, 489–497. [Google Scholar] [CrossRef] [PubMed]
  41. Hu, T. The Expression and Regulatory Significance of Cell Proliferation and Apoptosis Factors in Lymphadenectasis Diseases; Chongqing Medical University: Chongqing, China, 2006. [Google Scholar]
  42. Takami, H.; Graffeo, C.S.; Perry, A.; Giannini, C.; Nakazato, Y.; Saito, N.; Matsutani, M.; Nishikawa, R.; Ichimura, K.; Daniels, D.J. Roles of Tumor Markers in Central Nervous System Germ Cell Tumors Revisited with Histopathology-Proven Cases in a Large International Cohort. Cancers 2022, 14, 979. [Google Scholar] [CrossRef] [PubMed]
  43. Duan, X.; Liu, S. Advances in biological effects of Hippo signaling pathway. Chin. Bull. Life Sci. 2023, 35, 1249–1258. [Google Scholar]
  44. Liu, D. Mitochondrial ROS-Evoked Integrative Stress Response of Sertoli Cells Is Involved in Arsenic-Induced Blood-Testis Barrier Disruption and Decline in Sperm Quality; Anhui Medical University: Hefei, China, 2024. [Google Scholar]
  45. Yin, H.; Kang, Z.; Zhang, Y.; Gong, Y.; Liu, M.; Xue, Y.; He, W.; Wang, Y.; Zhang, S.; Xu, Q.; et al. HDAC3 controls male fertility through enzyme-independent transcriptional regulation at the meiotic exit of spermatogenesis. Nucleic Acids Res. 2021, 49, 5106–5123. [Google Scholar] [CrossRef] [PubMed]
  46. Yang, W.; Tsai, S.; Wen, Y.; Fejer, G.; Seto, E. Functional domains of histone deacetylase-3. J. Biol. Chem. 2002, 277, 9447–9454. [Google Scholar] [CrossRef] [PubMed]
  47. Dudnyk, K.; Cai, D.; Shi, C.; Xu, J.; Zhou, J. Sequence basis of transcription initiation in the human genome. Science 2024, 384, eadj0116. [Google Scholar] [CrossRef] [PubMed]
  48. Wu, Z.; Chen, X.; Yan, T.; Yu, L.; Zhang, L.; Zheng, M.; Zhu, H. Rreb1 is a key transcription factor in Sertoli cell maturation and function and spermatogenesis in mouse. Zygote 2024, 32, 130–138. [Google Scholar] [CrossRef] [PubMed]
  49. Wang, J.; Li, Z.; Yang, W.; Tan, F. Follicle-stimulating hormone signaling in Sertoli cells: A licence to the early stages of spermatogenesis. Reprod. Biol. Endocrinol. 2022, 20, 97. [Google Scholar] [CrossRef] [PubMed]
  50. Wu, S.; Yan, M.; Ge, R.; Cheng, C. Crosstalk between Sertoli and Germ Cells in Male Fertility. Trends Mol. Med. 2020, 26, 215–231. [Google Scholar] [CrossRef] [PubMed]
  51. Chen, G.; Courey, A.J. Groucho/TLE family proteins and transcriptional repression. Gene 2000, 249, 1–16. [Google Scholar] [CrossRef] [PubMed]
  52. Wu, X.; Lu, M.; Yun, D.; Gao, S.; Chen, S.; Hu, L.; Wu, Y.; Wang, X.; Duan, E.; Cheng, C.Y.; et al. Single-cell ATAC-Seq reveals cell type-specific transcriptional regulation and unique chromatin accessibility in human spermatogenesis. Hum. Mol. Genet. 2022, 31, 321–333. [Google Scholar] [PubMed]
  53. Lee, S.; Jang, H.; Moon, S.; Lee, O.H.; Lee, S.; Lee, J.; Park, C.; Seol, D.W.; Song, H.; Hong, K.; et al. Differential Regulation of TLE3 in Sertoli Cells of the Testes during Postnatal Development. Cells 2019, 8, 1156. [Google Scholar] [CrossRef] [PubMed]
  54. Sen, S.; Majumdar, S.S. Transcriptional co-activator YAP regulates cAMP signaling in Sertoli cells. Mol. Cell Endocrinol. 2017, 450, 64–73. [Google Scholar]
  55. Sen, S.; Vats, A.; Majumdar, S. Regulation of Hippo pathway components by FSH in testis. Reprod. Biol. 2019, 19, 61–66. [Google Scholar] [CrossRef]
  56. Uphoff, C.C.; Drexler, H.G. Detection of Mycoplasma contamination in cell cultures. Curr. Protoc. Mol. Biol. 2014, 106, 28.4.1–28.4.14. [Google Scholar] [CrossRef] [PubMed]
  57. Stoddart, M.J. Cell viability assays: Introduction. Methods Mol. Biol. 2011, 740, 1–6. [Google Scholar] [CrossRef] [PubMed]
  58. Xiang, G.; Liu, Q.; Wang, X.; Di, R.; Hu, W.; Zeng, X.; Cao, X.; Chu, M. Advance in Effects of microRNA on Reproductive Axis and Embryo Implantation. Chin. J. Anim. Husb. 2019, 55, 1–8. [Google Scholar]
  59. Ma, C.; Song, H.; Yu, L.; Guan, K.; Hu, P.; Li, Y.; Xia, X.; Li, J.; Jiang, S.; Li, F. miR-762 promotes porcine immature Sertoli cell growth via the ring finger protein 4 (RNF4) gene. Sci. Rep. 2016, 6, 32783. [Google Scholar] [CrossRef] [PubMed]
  60. Kaur, S.; Najm, M.Z.; Khan, M.A.; Akhter, N.; Shingatgeri, V.M.; Sikenis, M.; Sadaf Aloliqi, A.A. Drug-Resistant Breast Cancer: Dwelling the Hippo Pathway to Manage the Treatment. Breast Cancer Targets Ther. 2021, 13, 691–700. [Google Scholar] [CrossRef]
  61. Tektemur, A.; Etem Önalan, E.; Kaya Tektemur, N.; Güngör, İ.H.; Türk, G.; Kuloğlu, T. Verapamil-induced ion channel and miRNA expression changes in rat testis and/or spermatozoa may be associated with male infertility. Andrologia 2020, 52, e13778. [Google Scholar] [CrossRef] [PubMed]
  62. Gao, Y.; Wu, F.; Ren, Y.; Zhou, Z.; Chen, N.; Huang, Y.; Lei, C.; Chen, H.; Dang, R. MiRNAs Expression Profiling of Bovine (Bos taurus) Testes and Effect of bta-miR-146b on Proliferation and Apoptosis in Bovine Male Germline Stem Cells. Int. J. Mol. Sci. 2020, 21, 3846. [Google Scholar] [PubMed]
  63. Sakurai, K.; Mikamoto, K.; Shirai, M.; Iguchi, T.; Ito, K.; Takasaki, W.; Mori, K. MicroRNA profiles in a monkey testicular injury model induced by testicular hyperthermia. J. Appl. Toxicol. 2016, 36, 1614–1621. [Google Scholar] [CrossRef] [PubMed]
  64. Ning, J.; Li, W.; Cheng, F.; Yu, W.; Rao, T.; Ruan, Y.; Yuan, R.; Zhang, X.; Zhuo, D.; Du, Y.; et al. MiR-29a Suppresses Spermatogenic Cell Apoptosis in Testicular Ischemia-Reperfusion Injury by Targeting TRPV4 Channels. Front. Physiol. 2017, 8, 966. [Google Scholar] [PubMed]
Figure 1. Isolation, morphological characterization, and identification of primary Sertoli cells from Southdown × Hu F1 sheep. (A1,A2) Morphology of primary Sertoli cells after purification and culture, showing a relatively uniform cell population with typical elongated or bipolar morphology. (B1,B2) Oil Red O staining of cultured cells. Intracellular lipid droplets were observed in the cytoplasm (red arrows). (C1,C2) Alkaline phosphatase (ALP) staining of cultured cells. Only weak positive signals were detected (red arrows), suggesting low contamination by peritubular myoid cells. (D) Immunofluorescence staining of Sertoli cell markers GATA4 and SOX9. Red fluorescence indicates GATA4 or SOX9 signal, and blue fluorescence indicates DAPI-stained nuclei. Scale bars: 200 μm in (A1,B1,C1); 50 μm in (A2,B2,C2,D).
Biomolecules 16 00995 g001
Figure 2. Effects of YAP1 overexpression and silencing on Sertoli cell viability and mRNA expression of viability-associated genes, including BAX, BCL2, and PCNA, as assessed by RT-qPCR. (A) RT-qPCR analysis of YAP1 mRNA expression after transfection with the YAP1 overexpression plasmid pcDNA3.1(+)-YAP1 or the empty vector pcDNA3.1(+). (B) RT-qPCR analysis of YAP1 mRNA expression after transfection with three YAP1 siRNAs (si-YAP1-1, si-YAP1-2, and si-YAP1-3) and the negative control (NC). (C) CCK-8 assay showing changes in cell viability after YAP1 overexpression at 24, 48, and 72 h post-transfection. (D) CCK-8 assay showing changes in cell viability after YAP1 silencing at 24, 48, and 72 h post-transfection. (E) RT-qPCR analysis of BAX, BCL2, and PCNA mRNA expression after YAP1 overexpression. (F) RT-qPCR analysis of BAX, BCL2, and PCNA mRNA expression after YAP1 silencing. Data are presented as mean ± SD from three independent biological replicates. In panels (A,CF), statistical significance was assessed by Student’s t-test between the two indicated groups. In panel B, statistical significance was assessed by one-way ANOVA followed by a post hoc multiple-comparison test. Data are presented as mean ± SD from three independent biological replicates. Panels (A,CF) were analyzed using an unpaired Student’s t-test between the two indicated groups at each time point or for each gene. Panel (B) was analyzed using one-way ANOVA followed by Tukey’s post hoc test. p < 0.05 was considered statistically significant. Data are presented as mean ± SD. * p < 0.05 indicate statistically significant differences; ** p < 0.01.
Biomolecules 16 00995 g002
Figure 3. Association of YAP1 overexpression and silencing with the mRNA expression of selected YAP1-related genes in Sertoli cells. ((A) RT-qPCR analysis of AFP, MYC and FGF1 mRNA expression after transfection with the YAP1 overexpression plasmid pcDNA3.1(+)-YAP1 or the empty vector pcDNA3.1(+). (B) RT-qPCR analysis of AFP, MYC and FGF1 mRNA expression after transfection with si-YAP1 or the negative control (NC). Data are presented as mean ± SD from three independent biological replicates. Statistical significance in each panel was assessed by Student’s t-test between the two indicated groups. differences AFP, MYC and FGF1 mRNA expression was measured by RT-qPCR. Data are presented as mean ± SD from three independent biological replicates. Panels (A,B) were analyzed using an unpaired Student’s t-test between the two indicated groups for each gene. Data are presented as mean ± SD. * p < 0.05 indicate statistically significant.
Biomolecules 16 00995 g003
Figure 4. Effects of YAP1 overexpression and silencing on the expression of Sertoli cell functional genes. (A) RT-qPCR analysis of HDAC3, RREB1 and TLE3 mRNA expression after transfection with the YAP1 overexpression plasmid pcDNA3.1(+)-YAP1 or the empty vector pcDNA3.1(+). (B) RT-qPCR analysis of HDAC3, RREB1 and TLE3 mRNA expression after transfection with si-YAP1 or the negative control (NC). Data are presented as mean ± SD from three independent biological replicates. Statistical significance in each panel was assessed by Student’s t-test between the two indicated groups. Data are presented as mean ± SD. * p < 0.05 indicate statistically significant, HDAC3, RREB1 and TLE3 mRNA expression was measured by RT-qPCR. Data are presented as mean ± SD from three independent biological replicates. Panels (A,B) were analyzed using an unpaired Student’s t-test between the two indicated groups for each gene.
Biomolecules 16 00995 g004
Figure 5. Assessment of the interaction between miR-132-y and the YAP1 3′UTR. (A) Predicted binding site of miR-132-y within the ovine YAP1 3′UTR and the corresponding mutant sequence used for luciferase reporter construction. Red letters indicate the predicted seed-matching region. (B) Dual-luciferase reporter assay showing relative luciferase activity in HEK-293T cells co-transfected with miR-132-y mimic or mimic negative control (mimics NC) and reporter constructs containing the wild-type (WT) or mutant (MUT) YAP1 3′UTR. NC indicates the negative control reporter, and PC indicates the positive control used in the dual-luciferase assay. (C) RT-qPCR analysis of YAP1 mRNA expression after transfection of sheep Sertoli cells with miR-132-y mimic, mimic negative control, miR-132-y inhibitor, or inhibitor negative control. Data are presented as mean ± SD from three independent biological replicates. In panel B, statistical significance was assessed by one-way ANOVA followed by a post hoc multiple-comparison test. In panel (C), statistical significance was assessed by Student’s t-test between the two indicated groups. Data are presented as mean ± SD. ns, not significant; * p < 0.05; **** p < 0.0001 (B) was performed using a dual-luciferase reporter assay in HEK-293T cells. Panel (C) shows YAP1 mRNA expression measured by RT-qPCR in sheep Sertoli cells. The miR-132-y mimic was used to increase miR-132-y levels, and mimic NC indicates the corresponding negative control mimic. The miR-132-y inhibitor was used to suppress endogenous miR-132-y activity, and inhibitor NC indicates the corresponding inhibitor negative control. Data are presented as mean ± SD from three independent biological replicates. Panel (B) was analyzed using one-way ANOVA followed by Tukey’s post hoc test. Panel (C) was analyzed using an unpaired Student’s t-test between the two indicated groups.
Biomolecules 16 00995 g005
Figure 6. Effects of miR-132-y on Sertoli cell viability and gene expression. (A) CCK-8 assay showing changes in Sertoli cell viability at 24, 48, and 72 h after transfection with miR-132-y mimic, mimic negative control (mimics-NC), miR-132-y inhibitor, or inhibitor negative control (inhibitor-NC). (B) RT-qPCR analysis of BCL2, BAX and PCNA mRNA expression after transfection with miR-132-y mimic, mimics-NC, miR-132-y inhibitor, or inhibitor-NC. (C) RT-qPCR analysis of selected YAP1-related transcripts, including AFP, MYC and FGF1, after transfection with miR-132-y mimic, mimic-NC, miR-132-y inhibitor, or inhibitor-NC. (D) RT-qPCR analysis of Sertoli cell functional genes, including HDAC3, RREB1 and TLE3, after transfection with miR-132-y mimic, mimic-NC, miR-132-y inhibitor, or inhibitor-NC. Panel (A) shows Sertoli cell viability measured by CCK-8 assay at 24, 48 and 72 h after transfection. Panels (BD) show mRNA expression measured by RT-qPCR. The miR-132-y mimic was used to increase miR-132-y levels, and mimic NC indicates the corresponding negative control mimic. The miR-132-y inhibitor was used to suppress endogenous miR-132-y activity, and inhibitor NC indicates the corresponding inhibitor negative control. Data are presented as mean ± SD from three independent biological replicates. Panel (A) was analyzed by comparing the indicated groups at each time point. Panels (BD) were analyzed using one-way ANOVA followed by Tukey’s post hoc test. Data are presented as mean ± SD. * p < 0.05 indicate statistically significant.
Biomolecules 16 00995 g006
Figure 7. Rescue Experiment. (A) YAP1 mRNA expression levels following co-transfection. (B) Cell viability assessed by CCK-8 assay. (C) Expression of proliferation- and apoptosis-related genes (BAX, BCL2, and PCNA). (D) RT-qPCR analysis of selected YAP1-related transcripts, including AFP, MYC and FGF1, in the rescue experiment. (E) Expression of functional genes (HDAC3, RREB1, and TLE3). Panel (A) shows YAP1 mRNA expression measured by RT-qPCR after co-transfection. Panel (B) shows Sertoli cell viability measured by CCK-8 assay. Panels (CE) show mRNA expression measured by RT-qPCR. The rescue experiment included four groups: miR-132-y mimic + pcDNA3.1(+)-YAP1, miR-132-y mimic + empty vector, mimic NC + pcDNA3.1(+)-YAP1, and mimic NC + empty vector. The miR-132-y mimic was used to increase miR-132-y levels; mimic NC indicates the corresponding negative control mimic; pcDNA3.1(+)-YAP1 indicates the YAP1 overexpression plasmid; and empty vector indicates pcDNA3.1(+). Data are presented as mean ± SD from three independent biological replicates. Panels (AE) were analyzed using one-way ANOVA followed by Tukey’s post hoc test. * p < 0.05 was considered statistically significant; ** p < 0.01.
Biomolecules 16 00995 g007
Figure 8. Proposed working model of the miR-132-y–YAP1 regulatory relationship in sheep Sertoli cells. Primary Sertoli cells isolated from Southdown × Hu F1 sheep were used as an in vitro model. miR-132-y was predicted and experimentally supported to interact with the YAP1 3′UTR by target prediction and dual-luciferase reporter assays. YAP1 overexpression and miR-132-y overexpression showed opposite associations with CCK-8-based cell viability and with the mRNA expression of selected viability-associated, YAP1-related, and Sertoli cell function-associated genes. Rescue experiments further showed that ectopic YAP1 expression partially attenuated miR-132-y-associated changes, * refers to cell signature antibody markers.
Biomolecules 16 00995 g008
Disclaimer/Publisher’s Note: The statements, opinions and data contained in all publications are solely those of the individual author(s) and contributor(s) and not of MDPI and/or the editor(s). MDPI and/or the editor(s) disclaim responsibility for any injury to people or property resulting from any ideas, methods, instructions or products referred to in the content.