Article

Transcriptomic Analysis Suggests Overlapping Molecular Pathogenesis in JIA-Associated and ANA-Positive Uveitis


1
Ophtha Lab and Department of Ophthalmology, at St. Franziskus Hospital, Hohenzollernring 74, 48145 Münster, Germany
2
Core Facility Genomik, Universität Münster, 48149 Münster, Germany
3
Department of Ophthalmology, Universität of Duisburg-Essen, 45147 Essen, Germany
4
Eye Center, Medical Center, Faculty of Medicine, University of Freiburg, 79106 Freiburg, Germany
5
Universität of Duisburg-Essen, 45147 Essen, Germany
*
Authors to whom correspondence should be addressed.
These authors contributed equally to this work.
Biomolecules 2026, 16(4), 534; https://doi.org/10.3390/biom16040534
Submission received: 20 January 2026 / Revised: 11 March 2026 / Accepted: 31 March 2026 / Published: 3 April 2026
(This article belongs to the Section Molecular Biomarkers)

Abstract

Purpose: Clinical presentation of anterior uveitis affecting the iris is nearly identical in patients with juvenile idiopathic-associated uveitis (JIAU) and patients with antinuclear antibody-positive anterior uveitis (ANA-U). This study investigates whether the iris transcriptomes of patients with JIAU or ANA-U differ or reflect the clinical homogeneity. Methods: Iris biopsies were obtained from patients with JIAU (n = 31) or ANA-U (n = 9) during trabeculectomy, iridectomy, or complex cataract surgery. Frozen iris tissues were homogenized, the RNA was isolated and analyzed using a bulk RNA sequencing approach. Genes with a Benjamini–Hochberg false discovery rate (FDR) p ≤ 0.05 and a log2 fold change (FC) of >1 or <−1 were defined as significantly differentially expressed genes (DEGs). Pathway enrichment analysis was subsequently performed to characterize these DEGs. Results: The JIAU group included nine male and 22 female patients (median age 10.2 [IQR 7.2, 13.7] years), while the ANA-U group consisted of one male and eight female patients (median age 10.2 years (IQR [6.1, 11.7]) years). No DEGs were identified when comparing the iris transcriptomes of JIAU and ANA-U directly. Subgroup analyses based on disease activity revealed 35 DEGs in ANA-U, one DEG in JIAU. Inter-group comparisons based on uveitis activity status yielded no DEGs. In the merged JIAU/ANA-U cohort, 28 DEGs were upregulated in the active vs. inactive uveitis. Regarding secondary glaucoma, 12 DEGs were identified in JIAU, and 15 DEGs were identified in the corresponding ANA-U subgroup. Inter-group comparisons based on glaucoma status yielded no DEGs. In the merged JIAU/ANA-U cohort, 20 DEGs were identified between patients with and without glaucoma. Conclusions: Our findings reveal only marginal differences in gene expression patterns in iris tissues from JIAU and ANA-U patients. These results suggest a high degree of similarity in the underlying inflammatory processes of both uveitis subsets.

1. Introduction

Uveitis remains a leading cause of preventable blindness in both children and adults. In the pediatric population, idiopathic anterior uveitis (IAU) accounts for approximately 30–40% of all cases [1]. Parallel to this, juvenile idiopathic arthritis (JIA)—the most prevalent pediatric rheumatic disease—is complicated by associated uveitis (JIAU) in up to one-fifth of patients [2].
JIAU is typically characterized by the presence of antinuclear antibodies (ANAs), an insidious onset, and a chronic, relapsing course that frequently leads to vision-threatening complications [3,4]. While established clinical guidelines emphasize the necessity of multidisciplinary care between ophthalmologists and rheumatologists [5,6,7], long-term prognosis is often hindered by a poorly understood pathogenesis involving a complex interplay of innate and adaptive immune responses [8,9].
As the ANA status per se is neither a specific cause nor a clinical manifestation of uveitis, a routine ANA determination is not recommended, except in cases with signs of systemic diseases such as JIA [10]. Thus, ANA determination is not usually done in clinical monitoring of IAU patients.
Intriguingly, JIAU and ANA-positive IAU are phenotypically indistinguishable; they share near-identical clinical courses, complication rates (e.g., secondary glaucoma, cataract, band keratopathy), and therapeutic responses to corticosteroids and disease-modifying antirheumatic drugs (DMARDs). Consequently, these two entities are managed with identical treatment protocols [11,12,13].
Genetic studies further support a shared etiology, as chronic anterior uveitis without arthritis shares key HLA alleles with JIAU, suggesting that IAU may simply be an early manifestation of JIAU [14]. Furthermore, analyses of aqueous humor, tears, and iris cellular infiltrates have yielded largely overlapping cytokine profiles for both groups [15,16,17].
Despite these clinical and genetic parallels, it remains unknown whether these conditions share a common molecular fingerprint at the tissue level.
Anterior uveitis affects the iris and ciliary body. In previous immunohistochemical studies, a cellular infiltrate of predominantly B cells in iris biopsies of JIA and ANA-U patients could be shown [17,18,19,20,21]. Presence of B-cells in the iris tissue of JIAU patients was confirmed in a bulk RNA seq study [22]. To elucidate the intraocular proinflammatory landscape and determine the degree of molecular divergence between JIAU and ANA-positive IAU (ANA-U), we performed comprehensive bulk RNA sequencing to characterize the global iris transcriptome.

2. Materials and Methods

2.1. Patients and Sample Collection

All study participants were diagnosed with chronic anterior uveitis characterized by an insidious onset of flare associated with juvenile idiopathic arthritis (JIA), and patients with ANA-positive anterior uveitis but without arthritis were included in the study. Exclusion criteria included other uveitis entities (e.g., infectious), other anatomic uveitis subtypes, or the presence of other associated systemic immune-mediated diseases. JIA was diagnosed by collaborating pediatric rheumatologists in accordance with the International League of Associations for Rheumatology (ILAR) criteria [23], and uveitis (including activity) and related complications (e.g., glaucoma) were assessed in accordance with the recommendations of the Standardization of Uveitis Nomenclature (SUN) Working Group [24].
Iris biopsy specimens were collected during elective trabeculectomy, iridectomy, or complex cataract surgery under general anesthesia. Prior to surgery, prednisolone acetate 1% eye drops were given 5 times daily for one week. Iris specimens were immediately snap-frozen in liquid nitrogen and stored at −80 °C until further processing. Samples were collected at the Department of Ophthalmology at St. Franziskus Hospital, Münster. This study was conducted in accordance with the principles of the Declaration of Helsinki and was approved by the local ethics committee (protocol code 2020-614-f-S, 2015-013-f-S). Written informed consent was obtained from patients and parents prior to surgery.

2.2. RNA Preparation, Library Construction and Sequencing

Frozen iris tissue samples were homogenized mechanically using a pestle. RNA isolation was followed by using the Direct-zolTM RNA MicroPrep kit. (Zymo Research Group GmbH, Freiburg, Germany), A Bioanalyzer or TapeStation (Agilent, Santa Clara, CA, USA) was used to determine the RNA Integrity Number (RIN). Total RNA libraries were constructed after rRNA removal using the NEBNext® rRNA Depletion Kit and the NEBNext® Ultra II Directional RNA Library Prep Kit (both from New England Biolabs GmbH, Frankfurt am Main, Germany), following the manufacturer’s instructions. Paired-end sequencing was performed on the Illumina NextSeq2000 platform at a depth of 40 million pairs per sample.

2.3. Bioinformatic Analysis

Raw sequencing reads were introduced into the RNA bioinformatics pipeline. Quality control was performed on the raw FASTQ files using FastQC 0.12.1 [25] and MultiQC 1.30 [26]. FASTP 0.24.0 was used to quality filter reads and trim adapters [27] using the –g PolyG tail-removing option to remove overrepresented poly-G tails. For alignment, we used the GRCh38.p14 v113 reference genome from the Ensembl-database [28], as well as the matching GTF files for annotation purposes (also from the Ensembl database). The read alignment itself was performed using the splicing-aware STAR aligner 2.7.11b [29], which sorted the output reads by coordinates during the alignment process. The quality of alignment was assessed via a combination of different tools: IGV 2.17.3 for Linux [30,31] for random inspection of the samples, RSeQC 5.0.1 [32,33], Samtools 11.19.2 [33] and the STAR alignment statistics for each sample. Due to high duplicate rates after alignment, MarkDuplicates in Picard 3.1.1 (Picard Toolkit, Broad Institute, GitHub Repository, http://broadinstitute.github.io/picard/, 2019, accessed on 16 January 2025) function was applied to remove duplicates for downstream analysis. Each aligned sample was checked with the dupRadar 1.38.0 R package [34] before applying this function. FeatureCounts (subread 2.0.6) [35] was used to count the reads mapped to the reference genome. To address multimapping issues, we filtered secondary alignments with Samtools before running FeatureCounts again.

2.4. Identification of Differentially Expressed Genes

Gene count matrices from FeatureCount were used further for differential gene expression (DEG) analysis in R with the DESeq2 1.48.0 Bioconductor package [36]. Confounding factors, such as the type of surgery the patients underwent (especially trabeculectomy) or the sample processing batch, were taken-into-account for the linear model of the DESeqDataSet object (~surgery + batch + uveitis-subgroup). Genes with low or zero counts (fewer than ten counts in at least 18 samples) were removed before running DESeq2.
Principal component analysis (PCA) was used to assess data quality and check for additional biases and confounding factors. For visualization, the data were transformed using the variance-stabilizing transformation function. Genes were considered significant if they had a Benjamini–Hochberg adjusted p-value (FDR) of less than 0.05 and a log2 fold change (FC) greater than 1 or less than −1. Hierarchical cluster analysis was performed on significant DEGs.

2.5. Pathway Enrichment Analysis

The g:GOSt tool from g:Profiler (gprofiler2 v0.2.3) [37,38] was used to identify significantly enriched Gene Ontology (GO) terms and pathways. For analysis, we incorporated the gprofiler2 R package version 0.2.3 [39] into our pipeline. The package performs statistical enrichment analysis to identify overrepresented GO terms and biological pathways in user-provided gene lists using cumulative hypergeometric tests [40,41]. We created two lists containing significantly up- and downregulated genes as input for pathway enrichment analysis with the gprofiler2 package. We applied a threshold of 0.05 for determining significant terms, along with the FDR correction method. The list of all genes analyzed with DESeq2 was used as a custom background, excluding all genes with an “NA” entry for the p-value in the results table. Only manually reviewed GO annotations were considered. The output of gprofiler2 was fine-tuned by removing all pathway terms with a term size less than 5 or greater than 350 to exclude pathways that are too small or too large with limited interpretative value [42]. To enhance interpretability and reduce background noise, only functional categories containing at least three genes from the input set were included in the analysis. The sources included in the analysis were GO Molecular Function, GO Biological Process, and GO Cellular Component.

3. Results

3.1. Clinical Data

Clinical demographics for the 40 pediatric patients included in this study are summarized in Supplementary Table S1. The cohort comprised patients with JIAU (n = 31) and ANA-U (n = 9). At the time of surgery, the median age was 10.2 years (IQR [7.2, 13.9]) for the JIAU group and 10.2 years (IQR [6.1, 11.7]) for the ANA-U group. Uveitis duration was longer in the JIAU group (median 5.6 years; IQR [3.1, 9.6]) compared to the ANA-U group (median 2.1 years; IQR [1.5, 5.5]). Both groups were predominantly female and shared a similar immunological profile: ANA-positive, RF-negative, and HLA-B27-negative. Within the JIAU group, all patients were diagnosed with oligoarticular JIA, categorized as either persistent (n = 21) or extended (n = 10) subtypes.

3.2. Clinical Status and Complications

While a minimum of three months of clinical inactivity (<0.5+ cells per SUN criteria) was the standard prerequisite for surgery, a subset of patients (n = 5 JIAU; n = 4 ANA-U) required urgent intervention. Indications for urgent surgery included rapidly progressing mature cataracts, anterior chamber flattening, or refractory glaucoma with characteristic optic disk changes despite maximal medical therapy.
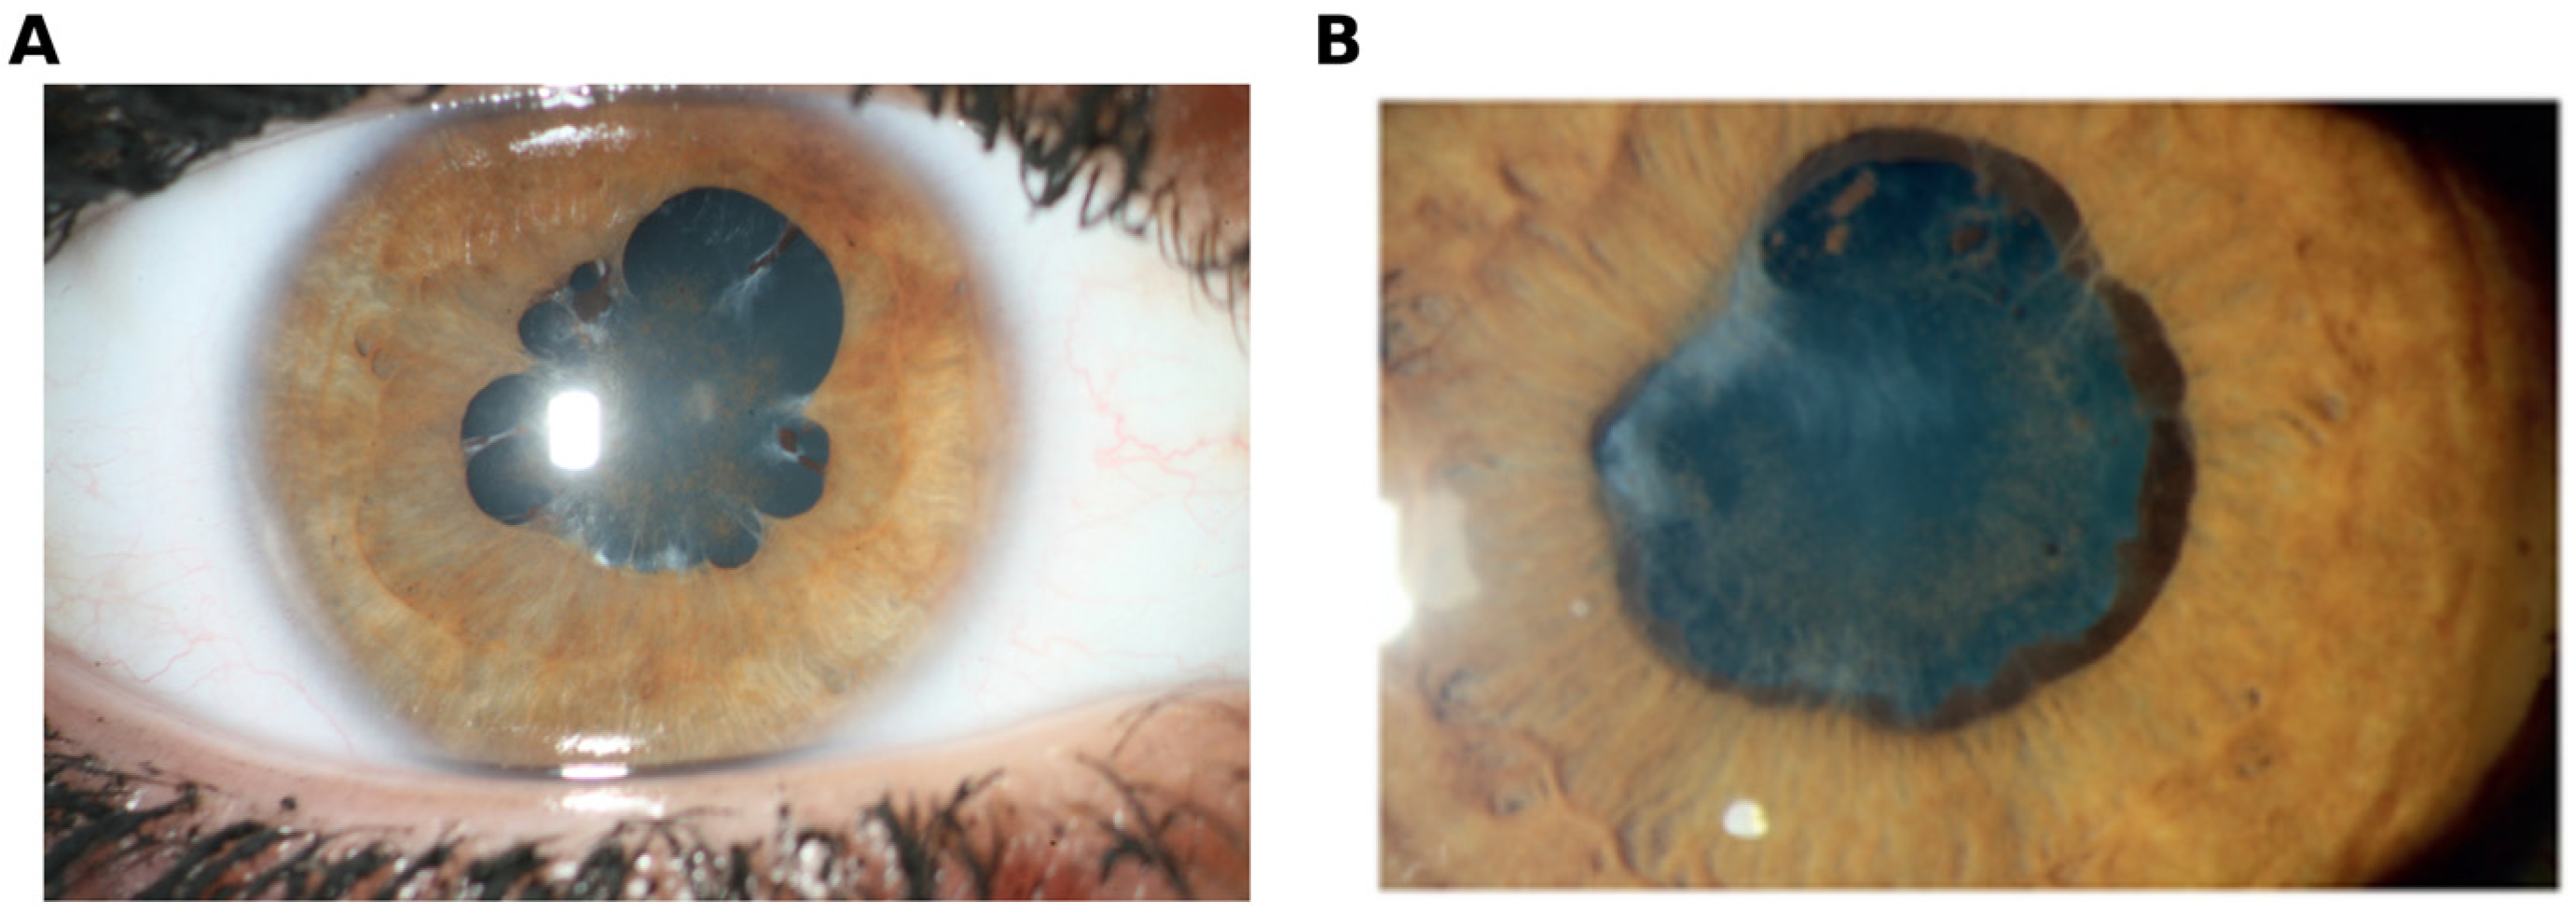
All participants presented with at least one uveitis-related complication, such as posterior synechiae or band keratopathy (Figure 1). Most patients developed cataracts (JIAU: n = 30; ANA-U: n = 8), secondary glaucoma (JIAU: n = 19; ANA-U: n = 5), posterior synechia (JIAU: n = 25; ANA-U: n = 8), or band keratopathy (JIAU: n = 22; ANA-U: n = 4). At the time of sampling, most patients were on systemic immunomodulatory therapy, including conventional synthetic (cs) and/or biological (b) disease-modifying antirheumatic drugs (DMARDs) (Supplementary Table S1).

3.3. Differential Iris Transcriptome of Patients with JIAU Versus ANA-U

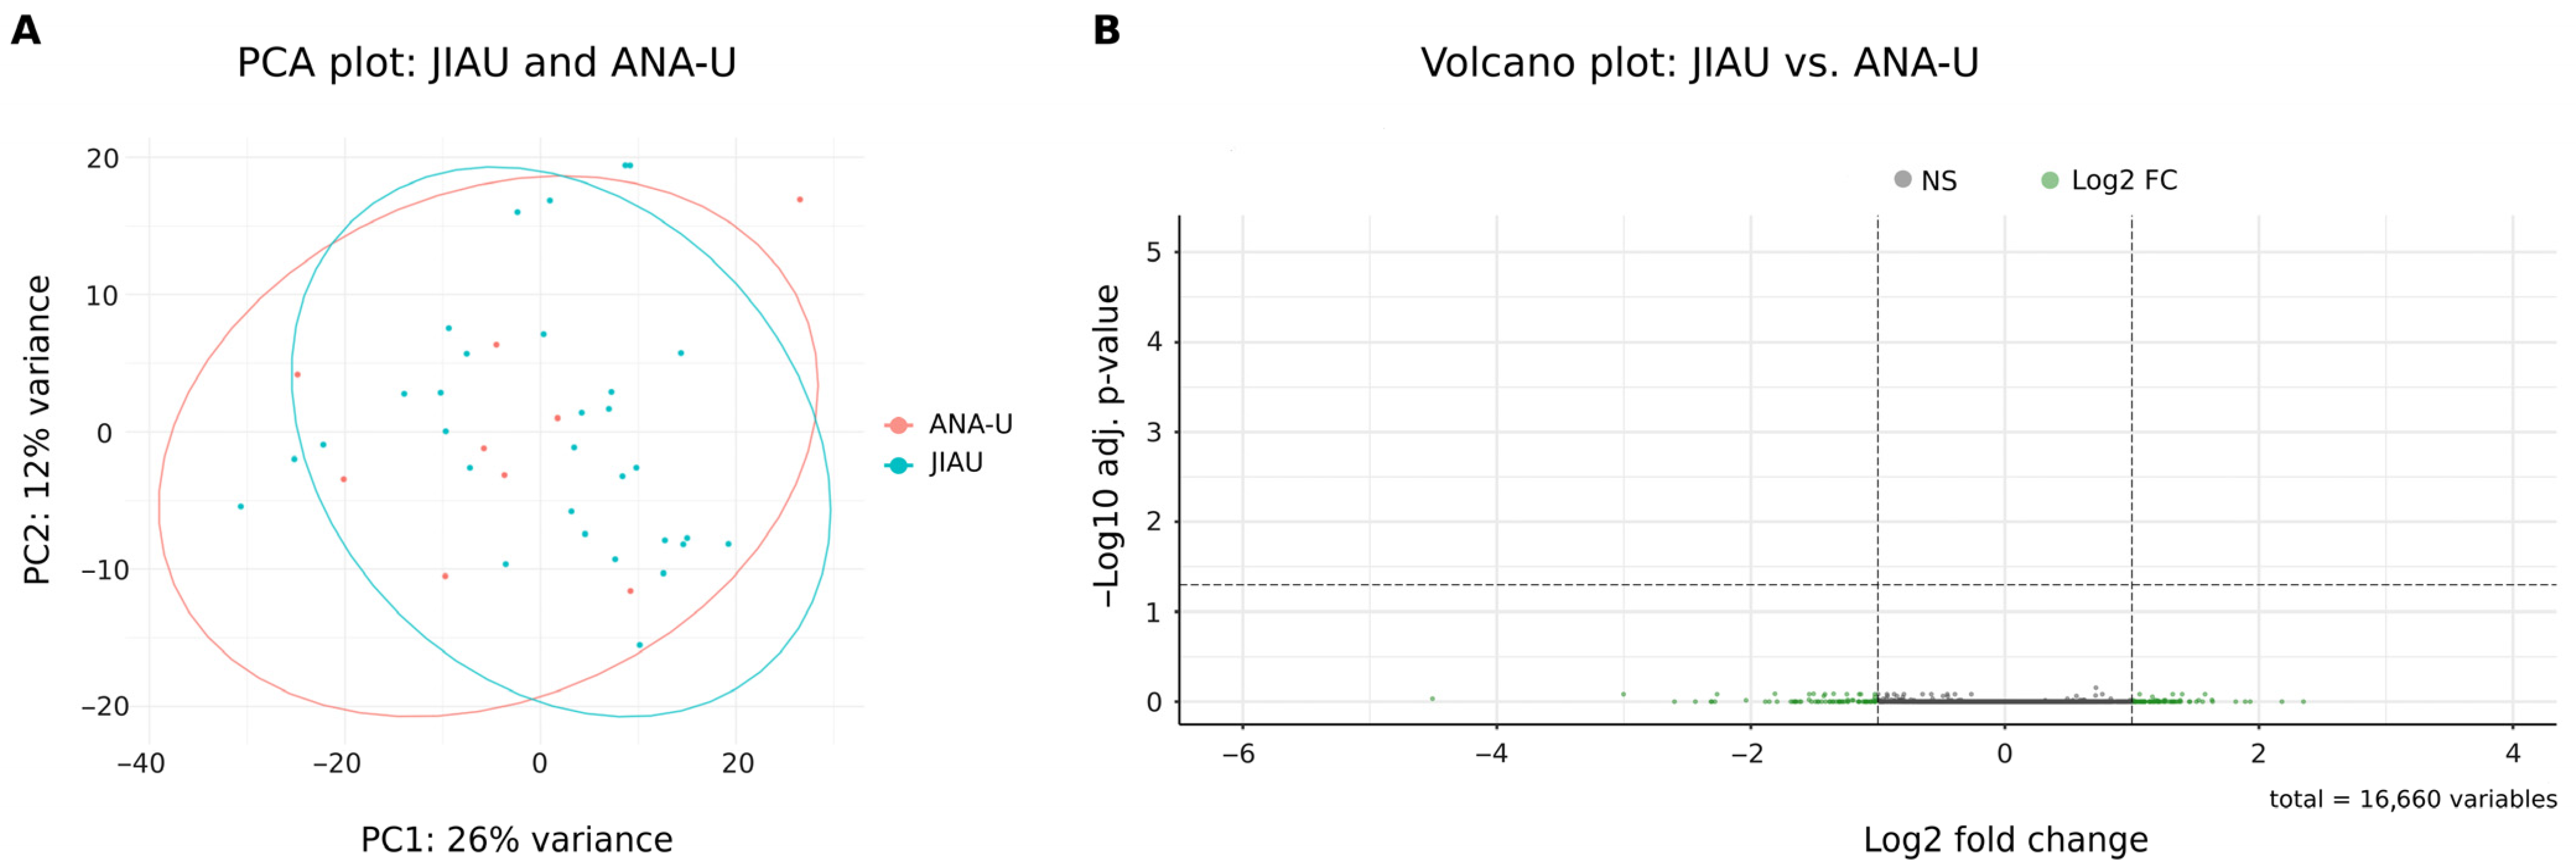
Principal component analysis (PCA) of the iris transcriptomes revealed that JIAU and ANA-U samples exhibited overlapping profiles without distinct clustering (Figure 2A). In agreement with these findings, no significant DEGs were identified between the two groups (Figure 2B; Supplementary Table S2).

3.4. Differential Iris Transcriptome of Patients with JIAU Versus ANA-U During Active or Inactive Uveitis

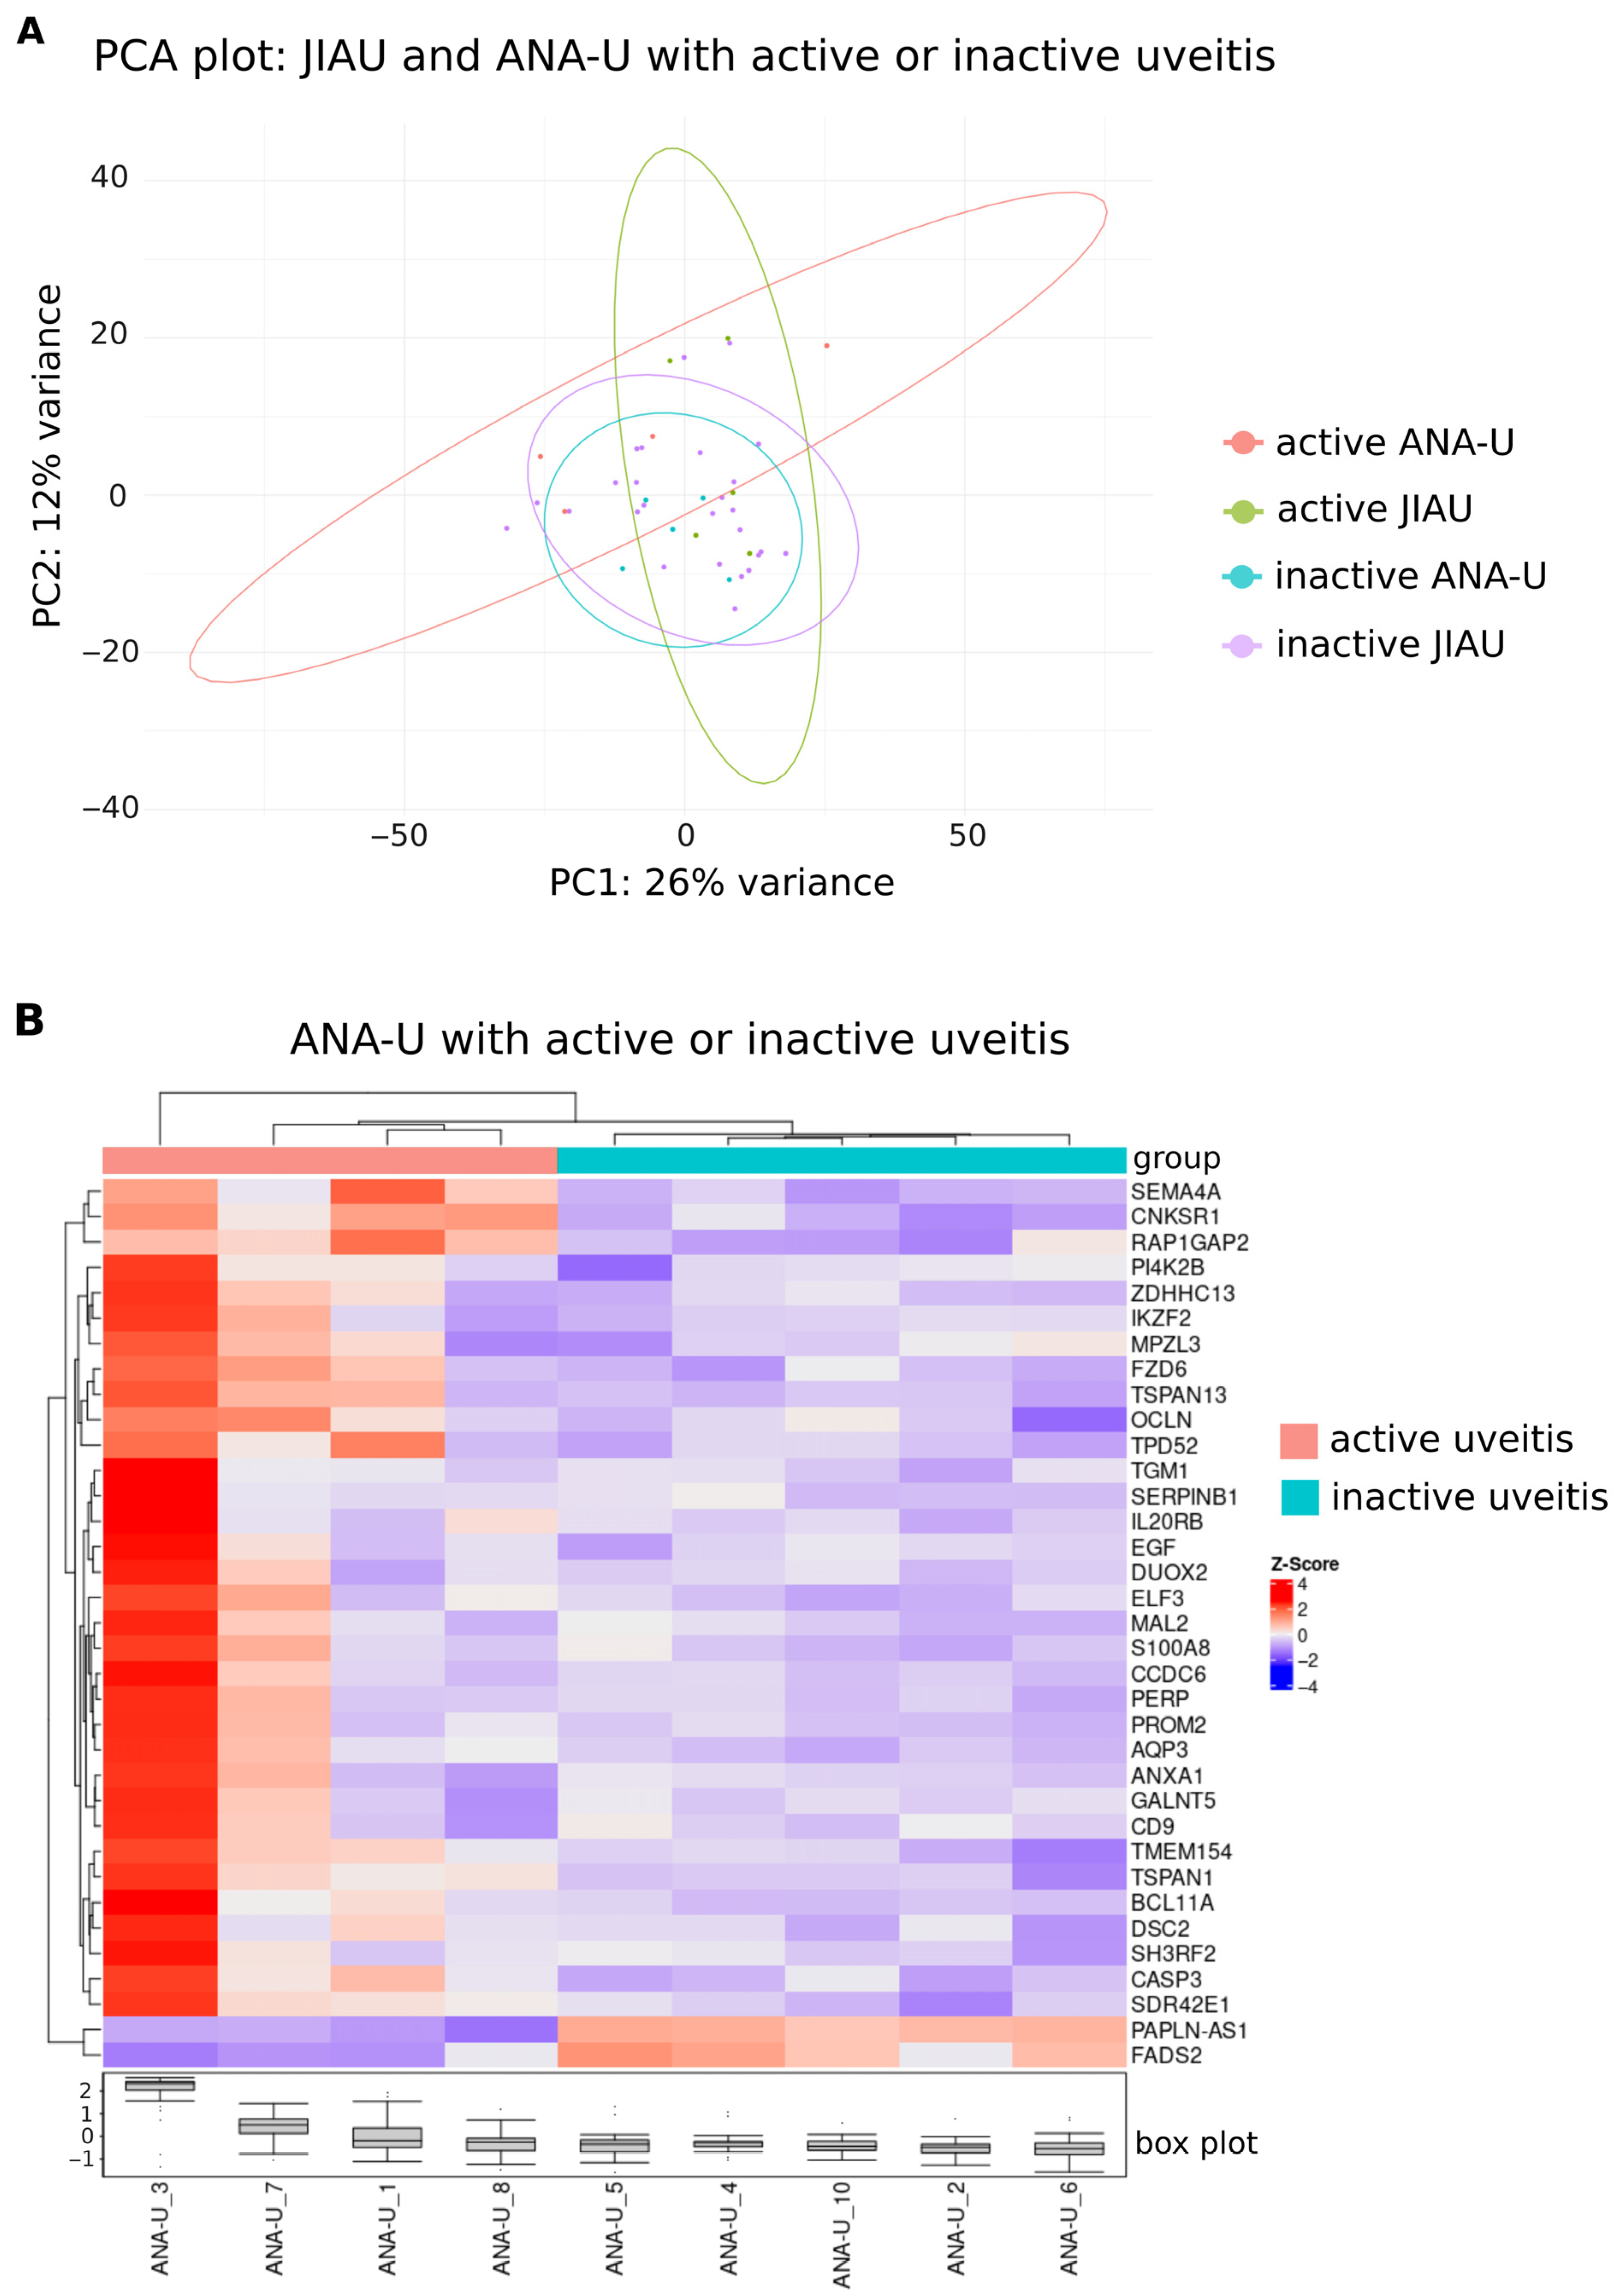
When categorized by clinical activity (defined as <0.5+ anterior chamber cells), PCA of JIAU and ANA-U samples showed overlapping distributions, with low variance (Figure 3A). However, active ANA-U samples exhibited a trend toward separation from the inactive ANA-U cluster. Intra-group analysis of JIAU patients revealed significant upregulation of DENND11 during active uveitis (Supplementary Table S2). Inter-group comparison of active cases identified a significant upregulation of SEMA4A in the JIAU group compared to the ANA-U group. In contrast, no significant DEGs were identified between the groups during periods of clinical inactivity (Supplementary Table S2).
Hierarchical clustering analysis of the ANA-U group revealed two distinct branches corresponding to uveitis activity (Figure 3B). Comparison between active and inactive states identified 35 DEGs: 33 were significantly upregulated (including S100A8 and IL20RB) and two were significantly downregulated (FADS2 and PAPLN-AS1) during the active phase (Figure 3B, Supplementary Figure S1, Supplementary Table S2). Gene Ontology analysis indicated that these DEGs are primarily involved in cell–cell junction processes and calcium ion binding (Supplementary Table S4).

3.5. Differential Iris Transcriptome of Patients Within the Merged JIAU/ANA-U Group During Active or Inactive Uveitis

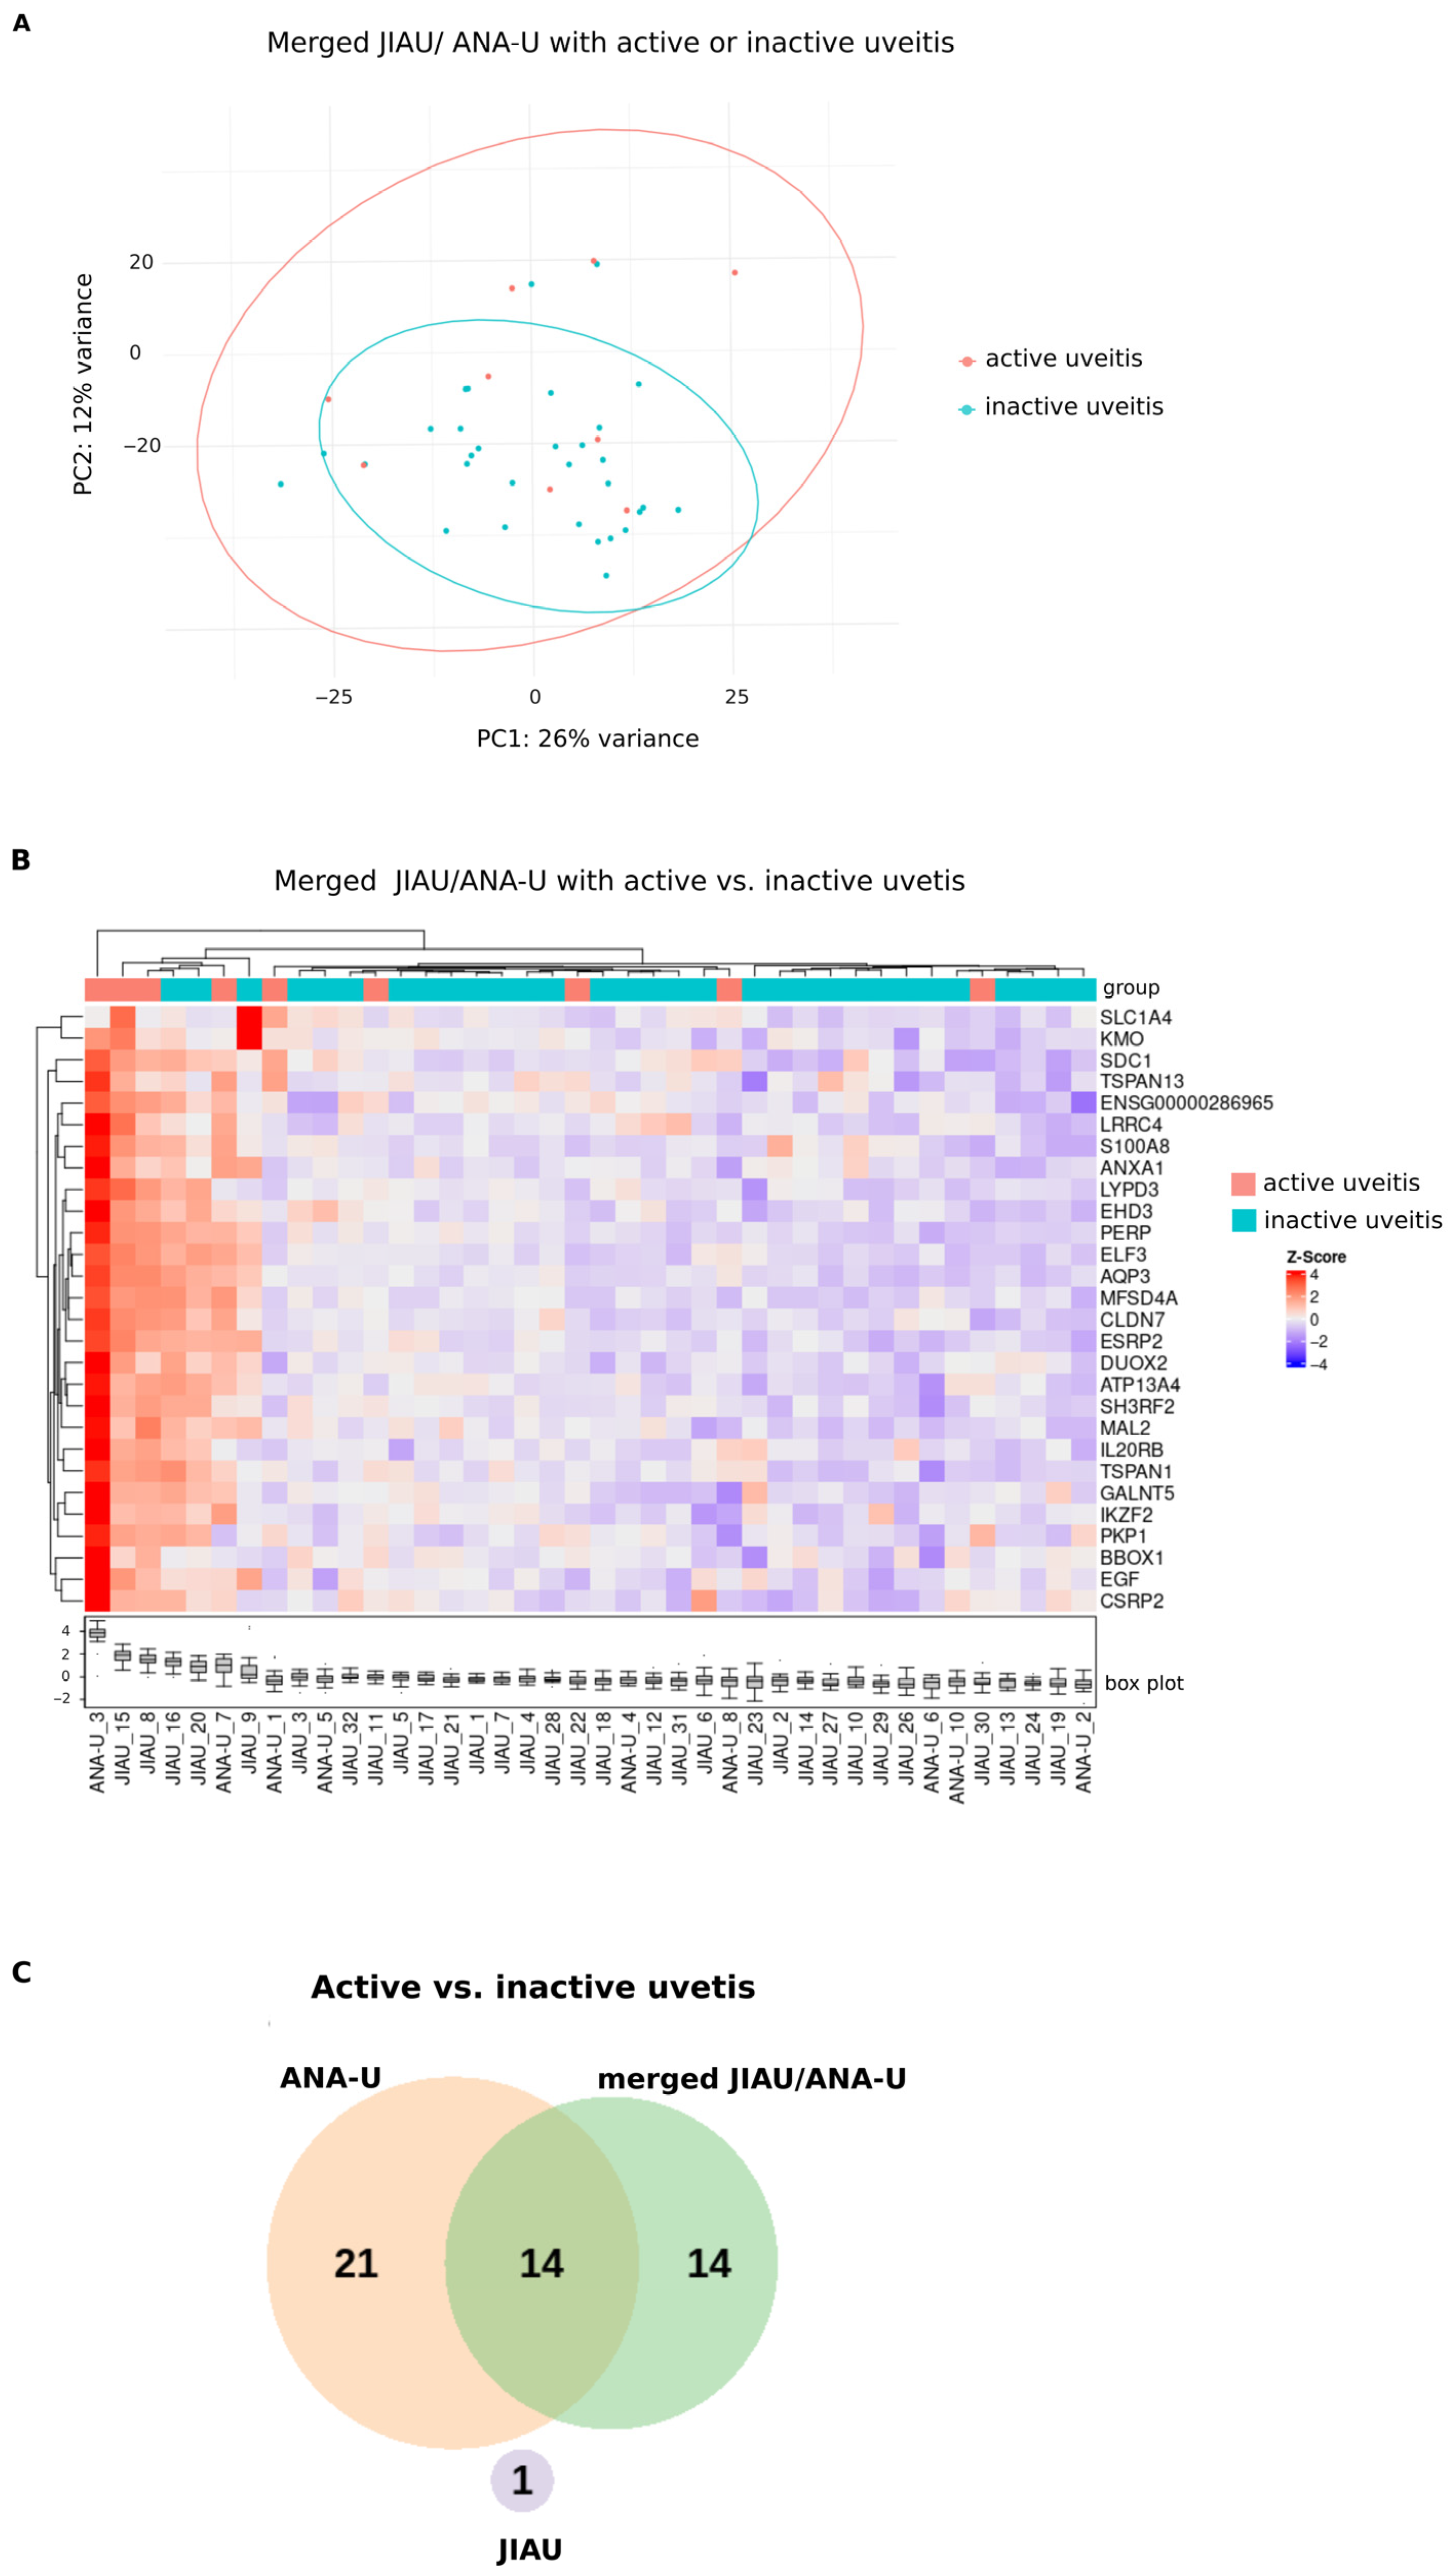
Given the transcriptomic similarity between the iris samples of the JIAU and ANA-U groups, the cohorts were merged into a single JIAU/ANA-U group to increase statistical power. Differential gene expression was subsequently re-evaluated in relation to uveitis activity (Figure 4; Supplementary Table S2). PCA showed that samples from both active and inactive subgroups were interspersed without clear separation (Figure 4A). However, three samples of patients with active uveitis (ANA-U-3, JIAU-15, and JIAU-8) exhibited a cluster in the hierarchical clustering heatmap (Figure 4B). Differential expression analysis identified 28 genes significantly upregulated during active uveitis in the merged cohort (Figure 4B, Supplementary Figure S1, Supplementary Table S2). Gene Ontology analysis indicated that these DEGs are primarily involved in cell–cell junction processes (Supplementary Table S4).
Among the DEGs identified in the merged JIAU/ANA-U group (e.g., S100A8, IL20RB, and MAL2), 14 overlapped with those found in the ANA-U group (e.g., S100A8, ANXA1, and IKZF2). ANA-U patients uniquely expressed 21 DEGs (e.g., SEMA4A and CD9). In contrast, the JIAU group shared no common DEGs with the other groups and uniquely expressed DENND11 (Figure 4C, Supplementary Table S3).
The upregulated genes identified in patients with active uveitis include both proinflammatory functions—such as the alarmin S100A8 promoting granulocytes/monocyte infiltration [43] and SDC1 involved in leukocyte endothelial adhesion [44], as well as anti-inflammatory potential via, e.g., ANXA1 [45,46,47], CD9 [46], and IKZF2 [48].

3.6. Differential Iris Transcriptome of Patients with JIAU Versus ANA-U with or Without Secondary Glaucoma

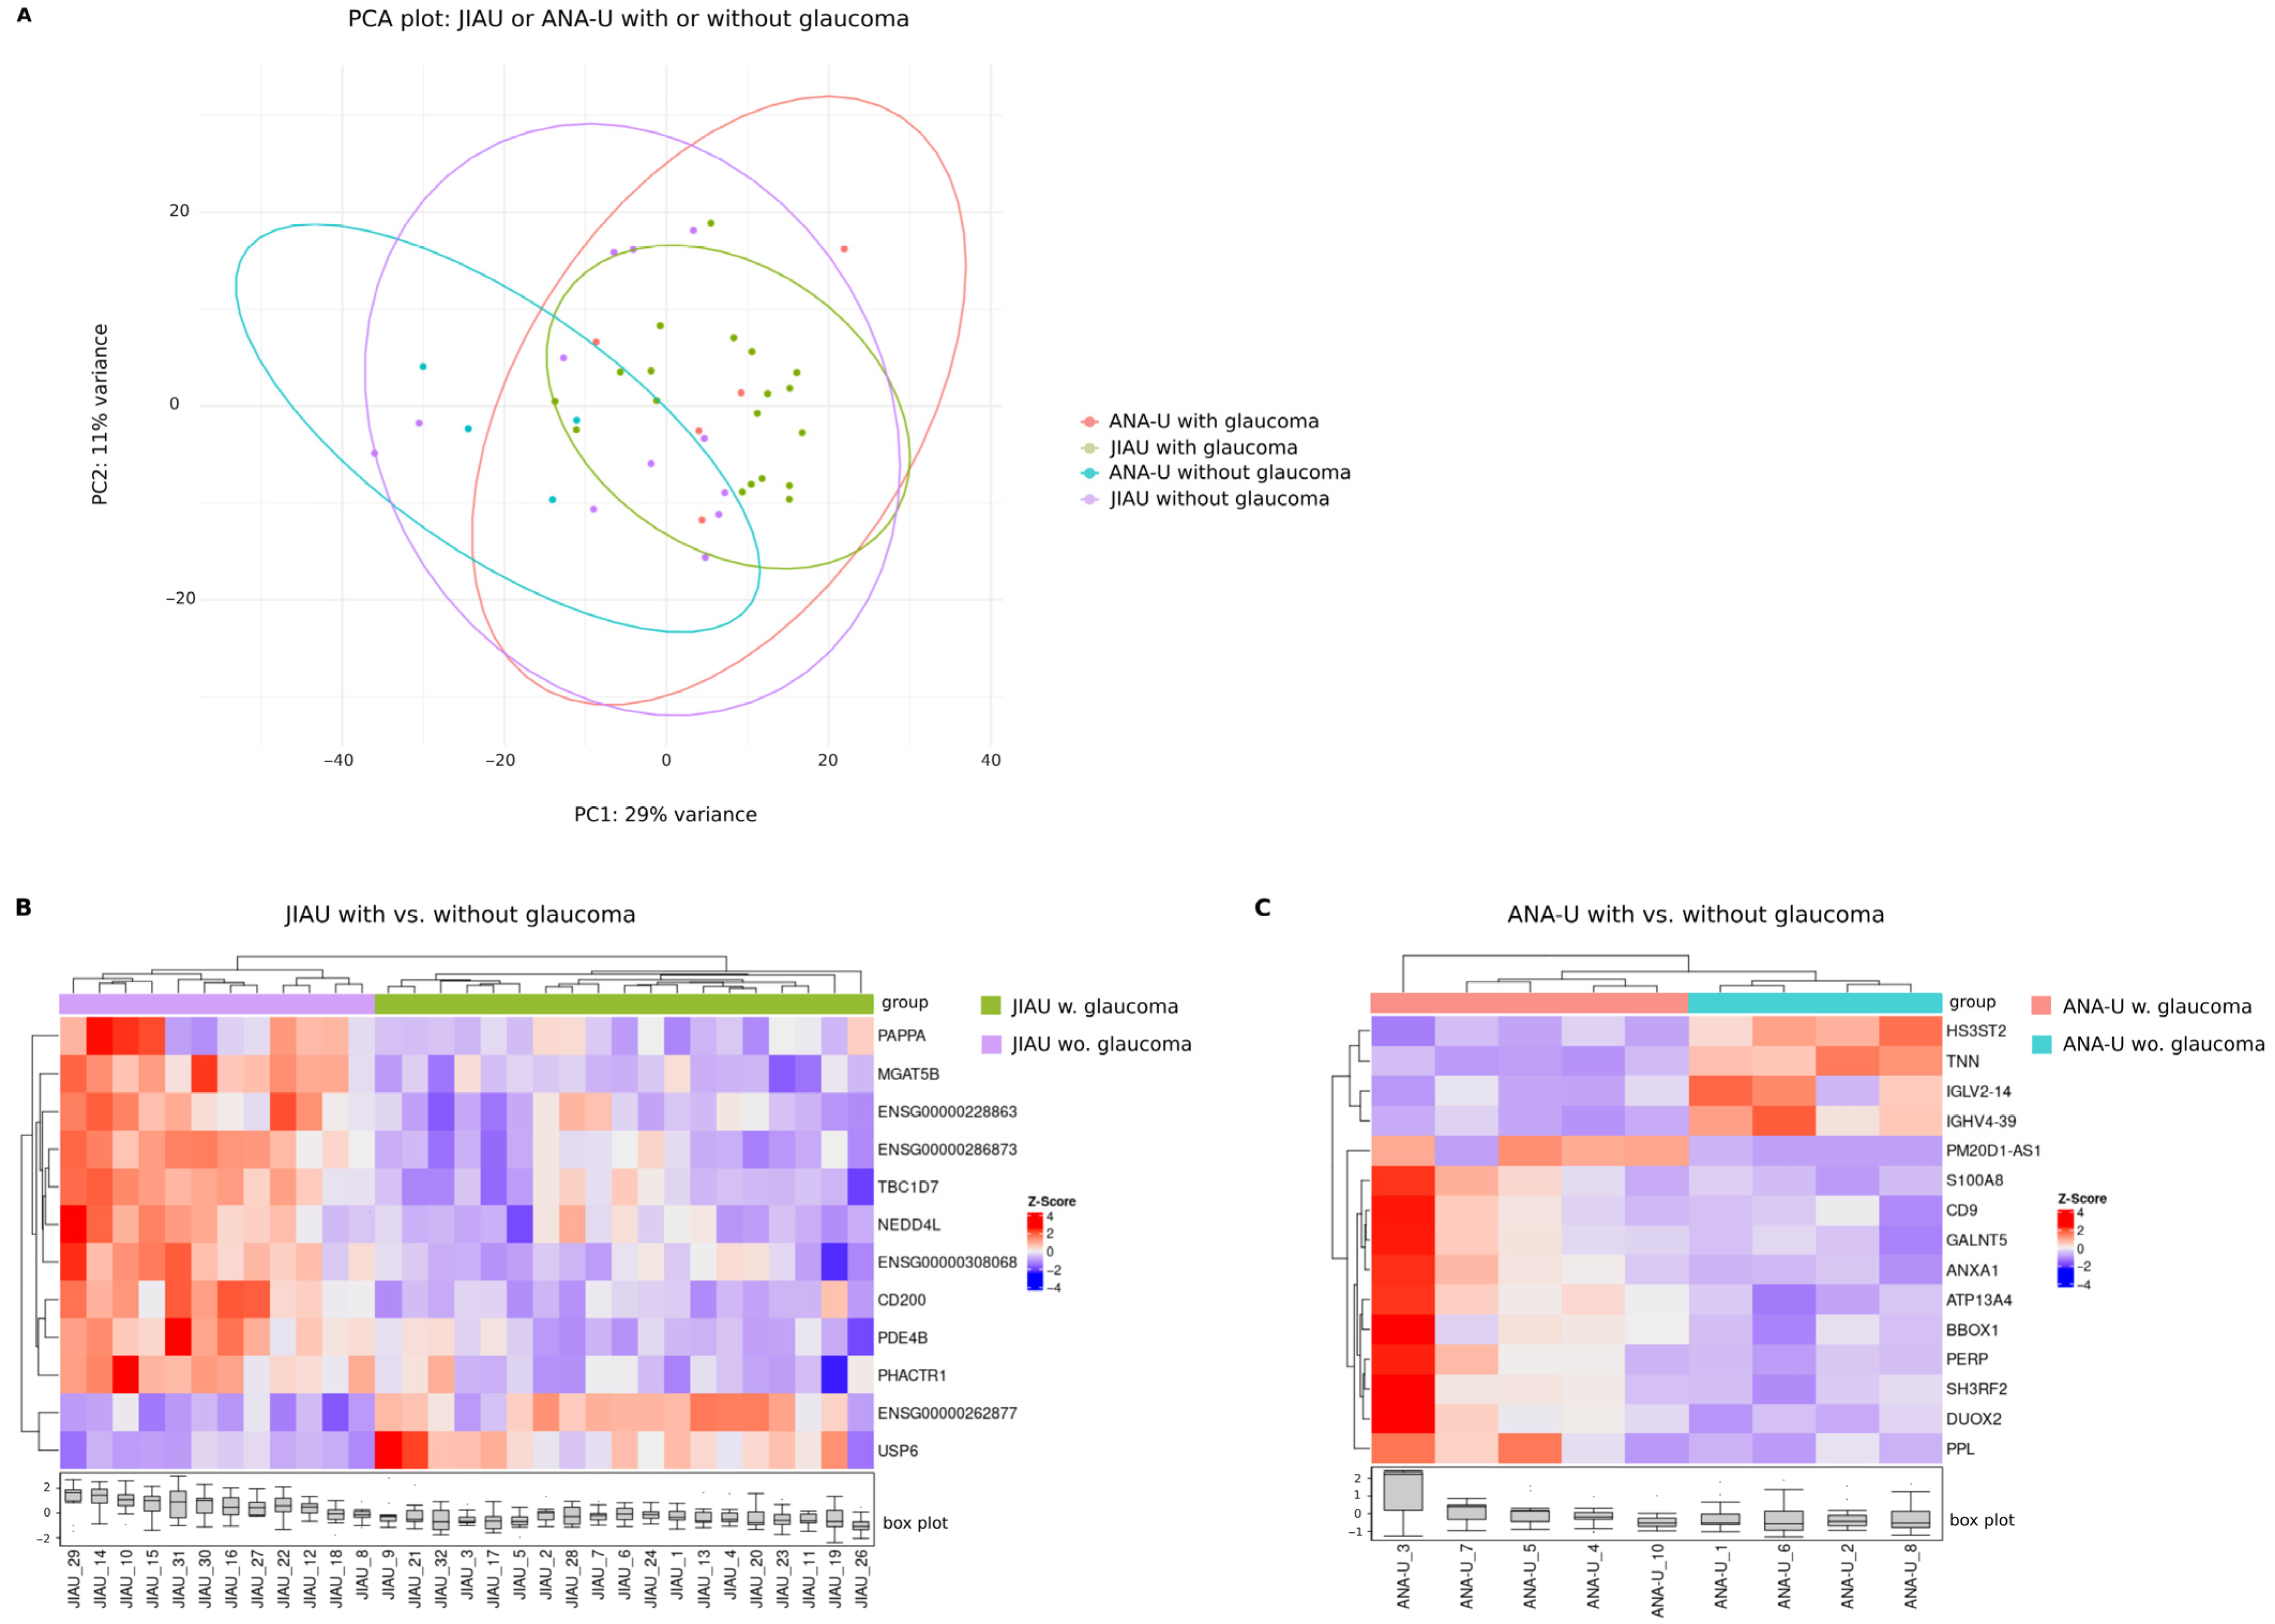
Secondary glaucoma is a major vision-threatening complication in patients with JIAU and ANA-U. To investigate its transcriptomic signature, we performed comparative analyses both between and within these two groups, stratified by the presence of glaucoma. In the PCA plot, samples from both the JIAU and ANA-U cohorts generally appeared interspersed regardless of glaucoma status (Figure 5A). However, ANA-U samples with and without glaucoma formed clusters separately. No DEGs were identified when comparing JIAU and ANA-U patients with glaucoma, nor when comparing the two groups without glaucoma (Supplementary Table S2). In contrast, hierarchical clustering revealed that samples within both the JIAU and ANA-U groups branched distinctly according to the presence of glaucoma (Figure 5B,C). In JIAU patients, we identified 12 DEGs associated with glaucoma: two were significantly upregulated (including USP6 and a novel long non-coding RNA transcript), and ten were downregulated (e.g., PAPPA and CD200) compared to those without glaucoma (Figure 5B, Supplementary Figure S2, Supplementary Table S2). Within the ANA-U group, we identified 15 DEGs associated with glaucoma: 11 genes were significantly upregulated, and four were downregulated (e.g., IGHV4-39 and TNN) in patients with glaucoma relative to those without glaucoma (Figure 5C, Supplementary Figure S2, Supplementary Table S2).

3.7. Differential Iris Transcriptome of Patients Within the Merged JIAU/ANA-U Group with or Without Glaucoma

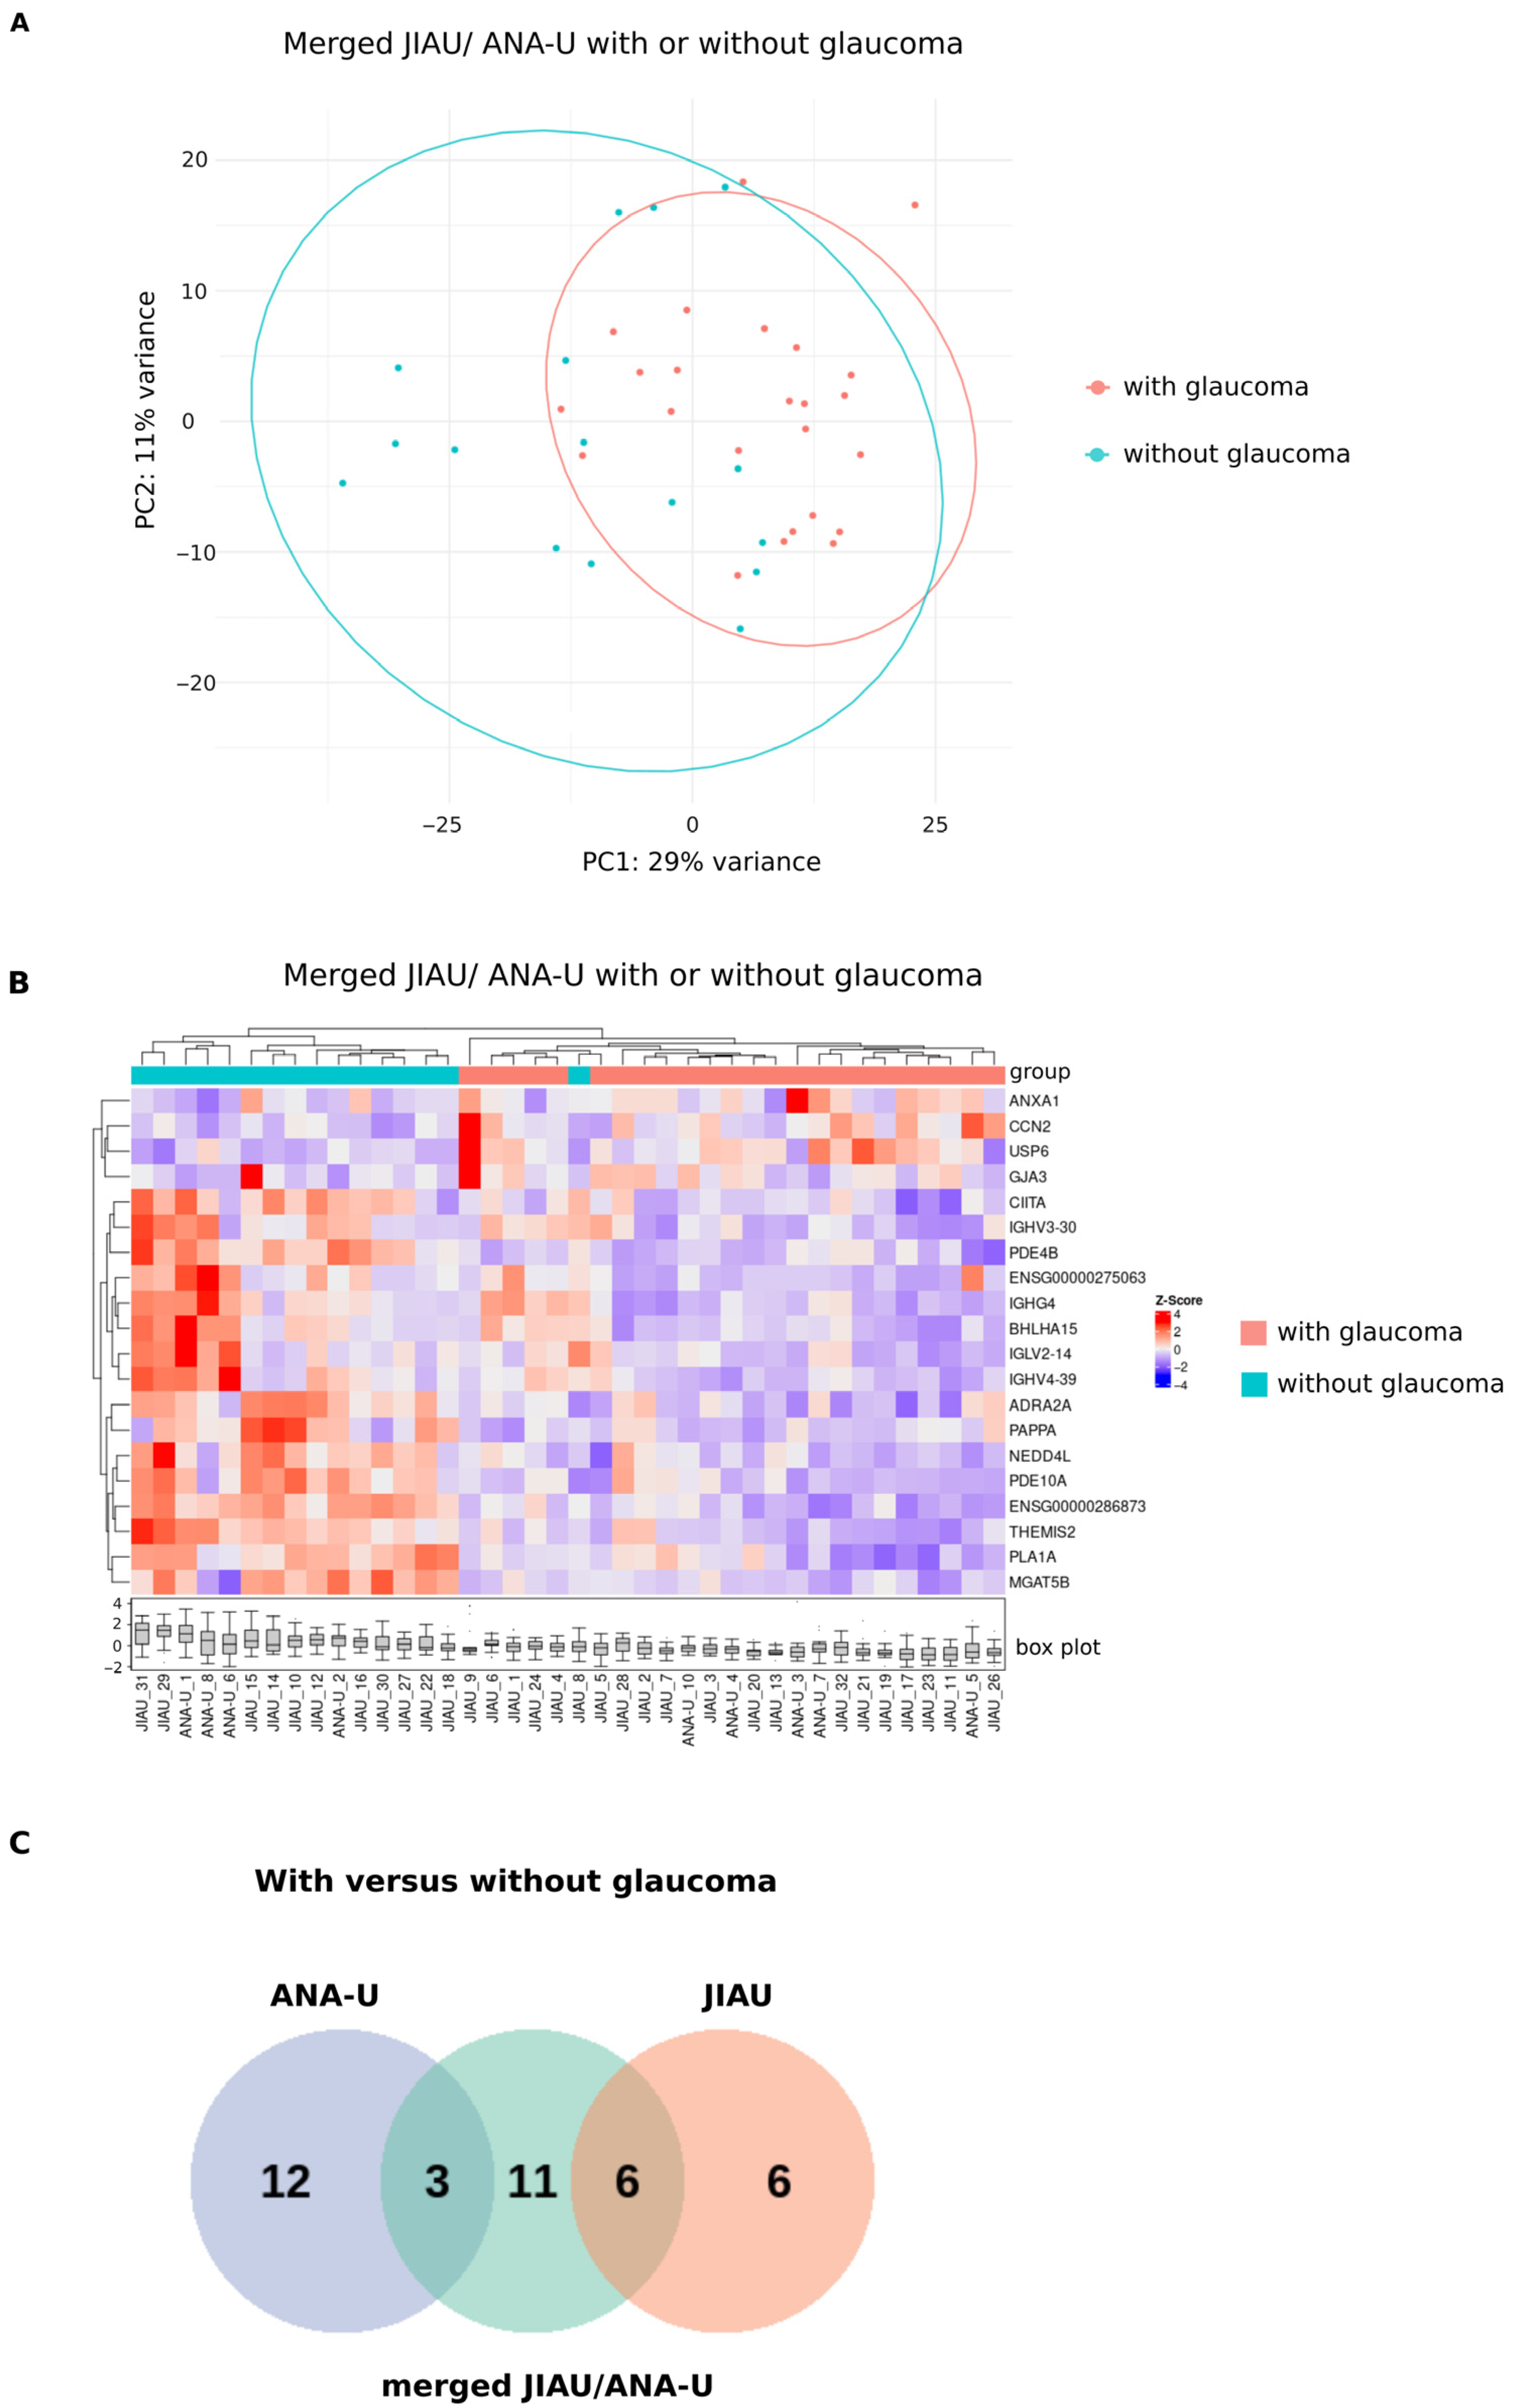
When evaluating the merged JIAU/ANA-U cohort by glaucoma status, samples exhibited moderate separation in the PCA plot (Figure 5A). Hierarchical clustering further distinguished the groups, with samples—excluding JIAU-8—partitioning into two distinct branches based on the presence of glaucoma (Figure 5B). Within the JIAU/ANA-U group, we identified 20 DEGs associated with glaucoma: four genes were significantly upregulated (e.g., CCN2 and GJA3) and 16 were downregulated (including several immunoglobulin variable IG_V genes, THEMIS2, CIITA, and NEDD4L) in the glaucoma subgroup (Supplementary Figure S2 and Supplementary Table S2). Pathway enrichment analysis did not yield significant results, as no biological categories met the minimum threshold of three matching genes.
Among the DEGs identified in the merged JIAU/ANA-U group, three genes (ANXA1, IGHV4-39, and IGLV2-14) were shared with the ANA-U group, and six genes (e.g., USP6, PAPPA, and NEDD4L) overlapped with the JIAU group. Furthermore, 12 DEGs were uniquely identified in samples of the ANA-U group (e.g., S100A8), 11 in the merged JIAU/ANA-U group (e.g., CCN2), and six in the JIAU group (e.g., CD200) (Figure 6 and Supplementary Table S5).
Similar to uveitis activity, the upregulated genes identified in patients with glaucoma include both proinflammatory (e.g., S100A8 [43] and CCN2 [49]) and anti-inflammatory functions (ANXA1 [45,46,47] and CD9 [45,46,47]). Furthermore, DEGs such as PAPPA and TNN, relevant for extracellular matrix (ECM) remodeling [50], are downregulated; the disturbance of ECM remodeling, particularly in trabecular meshwork cells, is a key process in glaucoma pathogenesis [51]. In addition, markers of adaptive immunity, e.g., CIITA required for MHC II restricted antigen presentation [52] and IGHG4 pointing to a local presence of plasma cells [22], are downregulated.

4. Discussion

In the current study, a comparison of the iris transcriptomes of ANA-U and JIAU patients revealed no significant differences when samples were analyzed without stratification for uveitis activity, ocular complications, or therapeutic regimens. This finding reinforces clinical observations of equivalence between these two entities [11], suggesting that the clinical course and treatment responses in JIAU and ANA-U are largely comparable. While several studies have previously characterized the peripheral [53] or local cytokine milieu in the aqueous humor [8,16,22,54] and tears [15,55,56], these proteomic approaches often varied in methodology, clinically heterogeneous cohorts and statistical approaches, which may substantially hamper direct comparison of their findings. Furthermore, although previous transcriptomic studies of ocular tissues in JIA patients have provided insights into local immunological processes [22,57], they did not directly compare ANA-U and JIAU within a single cohort, nor did they focus specifically on the iris—the tissue primarily involved in the disease.
Subgroup analysis in the present study revealed elevated expression of DENND11 and SEMA4A in JIAU patients with active uveitis compared to their ANA-U counterparts. While DENND11 is ubiquitously expressed, a role in neuritogenesis after ischemia has been described [58]. Studies on immunomodulatory function are lacking and do not allow any connection to uveitis activity to be made.
The semaphorin family contains critical immunoregulators. SEMA4A is known to facilitate T-cell co-stimulation [59], while SEMA3A has demonstrated immunomodulatory capacity in experimental autoimmune uveitis (EAU) [60,61] and other autoimmune disorders [62]. Notably, in axial spondyloarthritis, peripheral SEMA3A levels correlate with systemic disease activity and the presence of uveitis [63]. During inactive uveitis, no transcriptomic differences were detected between the two entities, suggesting a convergence of transcriptional profiles during clinical remission.
Interestingly, comparing active versus inactive states yielded significantly more DEGs within the ANA-U group than within the JIAU group. This discrepancy may be attributed to the significantly higher proportion of JIAU patients receiving DMARDs, as both uveitis and arthritis show higher baseline disease activity and severity.
This discrepancy may be attributable to the significantly higher proportion of JIAU patients receiving DMARDs, as both uveitis and arthritis show higher baseline activity and disease severity.
An alternative interpretation is that irreversible damage to iris tissue in JIAU patients remains the upregulation of inflammation- and damage-associated genes even during inactive disease [22]. In a ceiling effect, additional disease activity produces only a limited further change in the expression signal. Similar observations were made in RNA-seq studies with synovial tissue of patients with rheumatoid arthritis [64,65].
In addition, Triaille et al. showed that various DMARDs consistently downregulate immune cell activation genes in RA synovium, with stronger effects in treatment responders. Thereby, DMARD therapy leads to a dampening of transcriptomic activity and prevents additional expression increases with recurrent disease activity [66].
The DEGs identified in active ANA-U patients are associated with the modulation of cell–cell junctions, likely reflecting tight junction dysfunction and subsequent breakdown of the blood-ocular barrier [64,65,67]. Additionally, we observed an enrichment of calcium-ion binding processes, particularly involving S100A8 during active uveitis. S100A8 and its heterodimer S100A9 are primarily expressed in myeloid cells, such as macrophages and granulocytes, and play an important role in inflammatory processes [68]. The presence of S100-A8 positive granulocytes and monocytes in ocular tissue was shown in experimental autoimmune uveitis (EAU) [69], and in particular in the iris–ciliary body in an experimental model of LPS-induced uveitis (EIU) [43].
This aligns with evidence positioning S100A8/A9 proteins as potent proinflammatory biomarkers in multiple sclerosis, rheumatoid arthritis, JIA, and uveitis, reflecting the recruitment of monocytes to the local and peripheral immune response [16,56,70,71]. Beyond S100A8, the elevated expression of SERPINB1, ANXA1, FADS2, and DUOX2 further implicates monocyte involvement. T-cell activity was suggested by increased expression of SEMA4A, CD9, and IKZF2. Notably, IKZF2 (Helios) is a marker for regulatory T-cells (Tregs) [72], potentially indicating a local counter-regulatory mechanism against inflammation. Furthermore, the presence of B-cells was indicated by the expression of BCL11A, TSPAN1, TSPAN13, GALNT5, IL20RB, and PROM2, corroborating earlier findings [22,57].
To increase statistical power, JIAU and ANA-U data were merged for a combined analysis of uveitis activity. This re-analysis reaffirmed the involvement of monocytes, T-cells, and B-cells, alongside alterations in tight junctions—evidenced by the upregulation of PKP1, SDC1, and CLDN7, which are known to modulate immune cell recruitment and barrier integrity.
Secondary glaucoma is a major vision-threatening complication associated with chronic uveitis. While no DEGs were found when comparing the two uveitis subgroups directly in the context of glaucoma, intra-group analyses identified several DEGs associated with local inflammation. Although these were insufficient for robust pathway enrichment, we observed reduced TNN (Tenascin-N) expression in ANA-U patients with glaucoma. Tenascin-C, another member of this extracellular matrix (ECM) family, plays a known role in experimental autoimmune glaucoma [73,74] and is elevated in human glaucomatous eyes [75,76].
While glaucoma is typically a consequence of chronic inflammation, it often manifests after clinical inactivity is achieved [77,78,79]. In line with this notion, our analysis of the merged JIAU/ANA-U group suggested reduced pro-inflammatory activity in patients with secondary glaucoma. However, there is a sampling bias to mention: the non-glaucoma group contained a higher proportion of samples with active uveitis at the time point of surgery (n = 6) compared to the glaucoma group (n = 3).
The results of the comprehensive bulk RNAseq analysis confirm the previous clinical observations outlining a similar clinical course of uveitis in the two patient groups, and also response to treatment. The results are relevant for clinical care, particularly diagnostic measures and treatment modalities in the future.

5. Limitations of Our Study

Several limitations warrant consideration. First, unequal distributions of gender and age between cohorts may serve as confounding factors. Second, the modest and unequal sizes of the JIAU and ANA-U groups may have limited the statistical power to detect subtle differential expression.
Third, the reduced library complexity due to PCR duplicates may have hindered the detection of lower expressed transcripts.
Furthermore, the lack of independent validation (e.g., via RT-qPCR) limits the generalizability of these transcriptomic findings, but it was not feasible due to a lack of further samples. A comparison with healthy iris tissue would be desirable, but for ethical reasons, it is not possible to obtain healthy human iris tissue.
Finally, the influence of anti-inflammatory therapy cannot be fully excluded; nearly all patients received topical corticosteroids preoperatively, and the majority were on systemic DMARDs, in particular MTX and TNF-alpha inhibitors. The significant differences in therapeutic regimen between the JIAU and ANA-U cohorts likely influenced the iris transcriptome and increased overall heterogeneity. Additionally, the presence of other uveitis-related eye complications may have increased transcriptome heterogeneity.
As the bulk RNA Sequencing approach used in the current study does not resolve transcriptional profiles at the single-cell level, gene expression patterns attributed to specific immune cell types should not be overinterpreted. Future studies should use single-cell RNA sequencing methods to overcome this limitation.

6. Conclusions

In conclusion, our results demonstrate that JIA-associated and ANA-positive uveitis share a convergent transcriptional signature. This molecular similarity likely reflects a common final inflammatory pathway, providing a biological basis for the observed parallels in their clinical progression and their equivalent responses to DMARD therapy.

Supplementary Materials

The following supporting information can be downloaded at: https://www.mdpi.com/article/10.3390/biom16040534/s1, Figure S1: Volcano plot active versus inactive uveitis; Figure S2: Volcano plot with glaucoma versus without glaucoma; Table S1: Clinical data; Table S2: DEGs group comparisons; Table S3: DEGs transcripts of ANA-U and JIAU/ANA-U during active uveitis shown in a VENN diagramm in Figure 4C; Table S4: Gene ontology; Table S5: DEGs transcripts of JIAU, ANA-U and JIAU/ANA-U with glaucoma shown in a VENN diagramm in Figure 6C.

Author Contributions

M.K., D.B., M.S. (Melanie Schell), and A.W. performed experiments. M.K., M.L., and K.P. performed computational analyses. M.S. (Monika Stoll) and A.H. conceived and supervised the study. C.W., R.W., C.H. Co-supervised the study. M.K., M.L., C.W., D.B., T.L. and A.H. wrote the manuscript. All authors have read and agreed to the published version of the manuscript.

Funding

This research was supported by grants DFG HE 1877/24-1 and DFG Monika Stoll STO STO 352/9-1.

Institutional Review Board Statement

The study was conducted according to the guidelines of the Declaration of Helsinki and approved by the Ethics committee of the Medical Association of Westfalen-Lippe (protocol code 2020-614-f-S, approval date 21 December 2020; 2015-013-f-S, approval date 23 February 2015).

Informed Consent Statement

Informed consent was obtained from all subjects involved in the study.

Data Availability Statement

The data presented in this study are available on request from the corresponding authors.

Conflicts of Interest

A.H. has received research grants from BMBF (FKZ, 01ER1504C), DFG (He 1877/24-1), and honorary by Pfizer, MSD Sharp and Dohme, and Santen. C.H. is a consultant for Alimera Sciences and received honoraria from Alimera, Biogen and Bayer. All other authors declare no competing interests.

Abbreviations

ANAs: anti-nuclear antibodies, AU: anterior uveitis, AAU: acute anterior uveitis, cDNA: complementary desoxyribonucleic acid, DEGs: differentially expressed genes, DMARD: disease-modifying anti-rheumatic drug, FDR: false discovery rate, HLA: human leukocyte antigen, ILAR: International League of Associations for Rheumatology, IOP: intraocular pressure, JIA: juvenile idiopathic arthritis, JIAU: juvenile idiopathic arthritis-associated uveitis, m: male, mRNA: messenger RNA, MTX: methotrexate, PCA: principle component analysis, RF: rheumatoid factor, RNA: ribonucleic acid, RNA-Seq: RNA Sequencing, SUN: standardization of uveitis nomenclature.

References

  1. Holland, G.N.; Denove, C.S.; Yu, F. Chronic anterior uveitis in children: Clinical characteristics and complications. Am. J. Ophthalmol. 2009, 147, 667–678.e5. [Google Scholar] [CrossRef]
  2. Kearsley-Fleet, L.; Klotsche, J.; van Straalen, J.W.; Costello, W.; D’angelo, G.; Giancane, G.; Horneff, G.; Klein, A.; Láday, M.; Lunt, M.; et al. Burden of comorbid conditions in children and young people with juvenile idiopathic arthritis: A collaborative analysis of 3 JIA registries. Rheumatology 2022, 61, 2524–2534. [Google Scholar] [CrossRef] [PubMed]
  3. Vitale, A.T.; Graham, E.; de Boer, J.H. Juvenile idiopathic arthritis-associated uveitis: Clinical features and complications, risk factors for severe course, and visual outcome. Ocul. Immunol. Inflamm. 2013, 21, 478–485. [Google Scholar] [CrossRef] [PubMed]
  4. Heiligenhaus, A.; Niewerth, M.; Ganser, G.; Heinz, C.; Minden, K. German Uveitis in Childhood Study Group. Prevalence and complications of uveitis in juvenile idiopathic arthritis in a population-based nation-wide study in Germany: Suggested modification of the current screening guidelines. Rheumatology 2007, 46, 1015–1019. [Google Scholar] [CrossRef] [PubMed]
  5. Bou, R.; Adán, A.; Borrás, F.; Bravo, B.; Calvo, I.; De Inocencio, J.; Díaz, J.; Escudero, J.; Fonollosa, A.; de Vicuña, C.G.; et al. Clinical management algorithm of uveitis associated with juvenile idiopathic arthritis: Interdisciplinary panel consensus. Rheumatol. Int. 2015, 35, 777–785. [Google Scholar] [CrossRef]
  6. Ghadiri, N.; Reekie, I.R.; Gordon, I.; Safi, S.; Lingham, G.; Evans, J.R.; Keel, S. Systematic review of clinical practice guidelines for uveitis. BMJ Open Ophthalmol. 2023, 8, e001091. [Google Scholar] [CrossRef]
  7. Clarke, S.L.N.; Maghsoudlou, P.; Guly, C.M.; Dick, A.D.; Ramanan, A.V. The management of adult and paediatric uveitis for rheumatologists. Nat. Rev. Rheumatol. 2024, 20, 795–808. [Google Scholar] [CrossRef]
  8. Ayuso, V.K.; De Boer, J.H.; Byers, H.L.; Coulton, G.R.; Dekkers, J.; de Visser, L.; van Loon, A.M.; Schellekens, P.A.; Rothova, A.; de Groot-Mijnes, J.D. Intraocular biomarker identification in uveitis associated with juvenile idiopathic arthritis. Investig. Opthalmol. Vis. Sci. 2013, 54, 3709–3720. [Google Scholar] [CrossRef]
  9. Haasnoot, A.J.W.; Schilham, M.W.; Kamphuis, S.; Muller, P.C.E.H.; Heiligenhaus, A.; Foell, D.; Minden, K.; Ophoff, R.A.; Radstake, T.R.D.J.; Den Hollander, A.I.; et al. Identification of an Amino Acid Motif in HLA-DRβ1 That Distinguishes Uveitis in Patients with Juvenile Idiopathic Arthritis. Arthritis Rheumatol. 2018, 70, 1155–1165. [Google Scholar] [CrossRef]
  10. Ten Berge, J.C.; Groen-Hakan, F.; Rothova, A.; Schreurs, M.W.J. Antinuclear antibody profiling in uveitis. Acta Ophthalmol. 2018, 96, e660–e661. [Google Scholar] [CrossRef]
  11. Heiligenhaus, A.; Klotsche, J.; Niewerth, M.; Horneff, G.; Ganser, G.; Haas, J.-P.; Minden, K. Similarities in clinical course and outcome between juvenile idiopathic arthritis (JIA)-associated and ANA-positive idiopathic anterior uveitis: Data from a population-based nationwide study in Germany. Arthritis Res. Ther. 2020, 22, 81. [Google Scholar] [CrossRef]
  12. Solebo, A.L.; Rahi, J.S.; Dick, A.D.; Ramanan, A.V.; Ashworth, J.; Edelsten, C. Areas of agreement in the management of childhood non-infectious chronic anterior uveitis in the UK. Br. J. Ophthalmol. 2020, 104, 11–16. [Google Scholar] [CrossRef] [PubMed]
  13. Angeles-Han, S.T.; Lo, M.S.; Henderson, L.A.; Lerman, M.A.; Abramson, L.; Cooper, A.M.; Parsa, M.F.; Zemel, L.S.; Ronis, T.; Beukelman, T.; et al. Childhood Arthritis and Rheumatology Research Alliance Consensus Treatment Plans for Juvenile Idiopathic Arthritis-Associated and Idiopathic Chronic Anterior Uveitis. Arthritis Care Res. 2019, 71, 482–491. [Google Scholar] [CrossRef] [PubMed]
  14. Wennink, R.A.W.; de Boer, J.H.; Hiddingh, S.; Haasnoot, A.-M.J.W.; Ayuso, V.K.; de Hoop, T.; van Setten, J.; Spierings, E.; Kuiper, J.J.W. Next-Generation HLA Sequence Analysis Uncovers Shared Risk Alleles Between Clinically Distinct Forms of Childhood Uveitis. Investig. Ophthalmol. Vis. Sci. 2021, 62, 19. [Google Scholar] [CrossRef] [PubMed]
  15. Angeles-Han, S.T.; Yeh, S.; Patel, P.; Duong, D.; Jenkins, K.; Rouster-Stevens, K.A.; Altaye, M.; Fall, N.; Thornton, S.; Prahalad, S.; et al. Discovery of tear biomarkers in children with chronic non-infectious anterior uveitis: A pilot study. J. Ophthalmic Inflamm. Infect. 2018, 8, 17. [Google Scholar] [CrossRef]
  16. Walscheid, K.; Heiligenhaus, A.; Holzinger, D.; Roth, J.; Heinz, C.; Tappeiner, C.; Kasper, M.; Foell, D. Elevated S100A8/A9 and S100A12 Serum Levels Reflect Intraocular Inflammation in Juvenile Idiopathic Arthritis-Associated Uveitis: Results from a Pilot Study. Investig. Opthalmol. Vis. Sci. 2015, 56, 7653–7660. [Google Scholar] [CrossRef]
  17. Ayuso, V.K.; van Dijk, M.R.; de Boer, J.H. Infiltration of Plasma Cells in the Iris of Children With ANA-Positive Anterior Uveitis. Investig. Opthalmol. Vis. Sci. 2015, 56, 6770–6778. [Google Scholar] [CrossRef]
  18. Parikh, J.G.; Tawansy, K.A.; Rao, N.A. Immunohistochemical study of chronic nongranulomatous anterior uveitis in juvenile idiopathic arthritis. Ophthalmology 2008, 115, 1833–1836. [Google Scholar] [CrossRef]
  19. Godfrey, W.A.; Lindsley, C.B.; Cuppagey, F.E. Localization of IgM in plasma cells in the iris of a patient with iridocyclitis and juvenile rheumatoid arthritis. Arthritis Rheum. 1981, 24, 1195–1198. [Google Scholar] [CrossRef]
  20. Merriam, J.C.; Chylack, L.T., Jr.; Albert, D.M. Early-onset pauciarticular juvenile rheumatoid arthritis. A histopathologic study. Arch. Ophthalmol. 1983, 101, 1085–1092. [Google Scholar] [CrossRef]
  21. Sabates, R.; Smith, T.; Apple, D. Ocular histopathology in juvenile rheumatoid arthritis. Ann. Ophthalmol. 1979, 11, 733–737. [Google Scholar] [PubMed]
  22. Wildschütz, L.; Ackermann, D.; Witten, A.; Kasper, M.; Busch, M.; Glander, S.; Melkonyan, H.; Walscheid, K.; Tappeiner, C.; Thanos, S.; et al. Transcriptomic and proteomic analysis of iris tissue and aqueous humor in juvenile idiopathic arthritis-associated uveitis. J. Autoimmun. 2019, 100, 75–83. [Google Scholar] [CrossRef] [PubMed]
  23. Petty, R.E.; Southwood, T.R.; Manners, P.; Baum, J.; Glass, D.N.; Goldenberg, J.; He, X.; Maldonado-Cocco, J.; Orozco-Alcala, J.; Prieur, A.M.; et al. International League of Associations for Rheumatology classification of juvenile idiopathic arthritis: Second revision, Edmonton, 2001. J. Rheumatol. 2004, 31, 390–392. [Google Scholar] [PubMed]
  24. Jabs, D.A.; Nussenblatt, R.B.; Rosenbaum, J.T. Standardization of Uveitis Nomenclature (SUN) Working Group. Standardization of uveitis nomenclature for reporting clinical data. Results of the First International Workshop. Am. J. Ophthalmol. 2005, 140, 509–516. [Google Scholar]
  25. Andrews, S. FastQC: A Quality Control Tool for High Throughput Sequence Data. 2010. Available online: https://www.bioinformatics.babraham.ac.uk/projects/fastqc/ (accessed on 9 October 2025).
  26. Ewels, P.; Magnusson, M.; Lundin, S.; Käller, M. MultiQC: Summarize analysis results for multiple tools and samples in a single report. Bioinformatics 2016, 32, 3047–3048. [Google Scholar] [CrossRef]
  27. Chen, S.; Zhou, Y.; Chen, Y.; Gu, J. fastp: An ultra-fast all-in-one FASTQ preprocessor. Bioinformatics 2018, 34, i884–i890. [Google Scholar] [CrossRef]
  28. Dyer, S.C.; Austine-Orimoloye, O.; Azov, A.G.; Barba, M.; Barnes, I.; Barrera-Enriquez, V.P.; Becker, A.; Bennett, R.; Beracochea, M.; Berry, A.; et al. Ensembl 2025. Nucleic Acids Res. 2025, 53, D948–D957. [Google Scholar] [CrossRef]
  29. Dobin, A.; Davis, C.A.; Schlesinger, F.; Drenkow, J.; Zaleski, C.; Jha, S.; Batut, P.; Chaisson, M.; Gingeras, T.R. STAR: Ultrafast universal RNA-seq aligner. Bioinformatics 2013, 29, 15–21. [Google Scholar] [CrossRef]
  30. Robinson, J.T.; Thorvaldsdóttir, H.; Winckler, W.; Guttman, M.; Lander, E.S.; Getz, G.; Mesirov, J.P. Integrative genomics viewer. Nat. Biotechnol. 2011, 29, 24–26. [Google Scholar] [CrossRef]
  31. Thorvaldsdóttir, H.; Robinson, J.T.; Mesirov, J.P. Integrative Genomics Viewer (IGV): High-performance genomics data visualization and exploration. Brief Bioinform. 2013, 14, 178–192. [Google Scholar] [CrossRef]
  32. Wang, L.; Wang, S.; Li, W. RSeQC: Quality control of RNA-seq experiments. Bioinformatics 2012, 28, 2184–2185. [Google Scholar] [CrossRef]
  33. Danecek, P.; Bonfield, J.K.; Liddle, J.; Marshall, J.; Ohan, V.; Pollard, M.O.; Whitwham, A.; Keane, T.; McCarthy, S.A.; Davies, R.M.; et al. Twelve years of SAMtools and BCFtools. GigaScience 2021, 10, giab008. [Google Scholar] [CrossRef]
  34. Sayols, S.; Scherzinger, D.; Klein, H. dupRadar: A Bioconductor package for the assessment of PCR artifacts in RNA-Seq data. BMC Bioinform. 2016, 17, 428. [Google Scholar] [CrossRef] [PubMed]
  35. Liao, Y.; Smyth, G.K.; Shi, W. featureCounts: An efficient general purpose program for assigning sequence reads to genomic features. Bioinformatics 2014, 30, 923–930. [Google Scholar] [CrossRef] [PubMed]
  36. Love, M.I.; Huber, W.; Anders, S. Moderated estimation of fold change and dispersion for RNA-seq data with DESeq2. Genome Biol. 2014, 15, 550. [Google Scholar] [CrossRef] [PubMed]
  37. Reimand, J.; Kull, M.; Peterson, H.; Hansen, J.; Vilo, J. g:Profiler—A web-based toolset for functional profiling of gene lists from large-scale experiments. Nucleic Acids Res. 2007, 35, W193–W200. [Google Scholar] [CrossRef]
  38. Raudvere, U.; Kolberg, L.; Kuzmin, I.; Arak, T.; Adler, P.; Peterson, H.; Vilo, J. g:Profiler: A web server for functional enrichment analysis and conversions of gene lists (2019 update). Nucleic Acids Res. 2019, 47, W191–W198. [Google Scholar] [CrossRef]
  39. Kolberg, L.; Raudvere, U.; Kuzmin, I.; Vilo, J.; Peterson, H. gprofiler2—An R package for gene list functional enrichment analysis and namespace conversion toolset g:Profiler. F1000Research 2020, 9, ELIXIR-709. [Google Scholar] [CrossRef]
  40. Ashburner, M.; Ball, C.A.; Blake, J.A.; Botstein, D.; Butler, H.; Cherry, J.M.; Davis, A.P.; Dolinski, K.; Dwight, S.S.; Eppig, J.T.; et al. Gene Ontology: Tool for the unification of biology. Nat. Genet. 2000, 25, 25–29. [Google Scholar] [CrossRef]
  41. Gene Ontology Consortium; Aleksander, S.A.; Balhoff, J.; Carbon, S.; Cherry, J.M.; Drabkin, H.J.; Ebert, D.; Feuermann, M.; Gaudet, P.; Harris, N.L.; et al. The Gene Ontology knowledgebase in 2023. Genetics 2023, 224, iyad031. [Google Scholar] [CrossRef]
  42. Reimand, J.; Isserlin, R.; Voisin, V.; Kucera, M.; Tannus-Lopes, C.; Rostamianfar, A.; Wadi, L.; Meyer, M.; Wong, J.; Xu, C.; et al. Pathway enrichment analysis and visualization of omics data using g:Profiler, GSEA, Cytoscape and EnrichmentMap. Nat. Protoc. 2019, 14, 482–517. [Google Scholar] [CrossRef] [PubMed]
  43. Wang, Y.; Zhang, Z.; Zhang, L.; Li, X.; Lu, R.; Xu, P.; Zhang, X.; Dai, M.; Dai, X.; Qu, J.; et al. S100A8 promotes migration and infiltration of inflammatory cells in acute anterior uveitis. Sci. Rep. 2016, 6, 36140. [Google Scholar] [CrossRef] [PubMed]
  44. Götte, M.; Joussen, A.M.; Klein, C.; Andre, P.; Wagner, D.D.; Hinkes, M.T.; Kirchhof, B.; Adamis, A.P.; Bernfield, M. Role of syndecan-1 in leukocyte-endothelial interactions in the ocular vasculature. Investig. Ophthalmol. Vis. Sci. 2002, 43, 1135–1141. [Google Scholar]
  45. Gardner, P.J.; Yazid, S.; Ribeiro, J.; Ali, R.R.; Dick, A.D. Augmenting endogenous levels of retinal annexin A1 suppresses uveitis in mice. Transl. Vis. Sci. Technol. 2017, 6, 10. [Google Scholar] [CrossRef]
  46. Brosseau, C.; Colas, L.; Magnan, A.; Brouard, S. CD9 tetraspanin: A new pathway for the regulation of inflammation? Front. Immunol. 2018, 9, 2316. [Google Scholar] [CrossRef]
  47. Sugimoto, M.A.; Vago, J.P.; Teixeira, M.M.; Sousa, L.P. Annexin A1 and the resolution of inflammation: Modulation of neutrophil recruitment, apoptosis, and clearance. J. Immunol. Res. 2016, 2016, 8239258. [Google Scholar] [CrossRef]
  48. Hetemäki, I.; Arstila, T.P.; Kekäläinen, E. Helios—Illuminating the way for lymphocyte self-control. Immunology 2025, 174, 17–29. [Google Scholar] [CrossRef]
  49. Fuchs, L.; Mausner-Fainberg, K.; Luban, A.; Asseyer, S.E.; Golan, M.; Benhamou, M.; Volovitz, I.; Regev, K.; Vigiser, I.; Piura, Y.; et al. CTGF/CCN2 has a possible detrimental role in the inflammation and the remyelination failure in the early stages of multiple sclerosis. J. Neuroimmunol. 2022, 371, 577936. [Google Scholar] [CrossRef]
  50. Naba, A. Mechanisms of assembly and remodelling of the extracellular matrix. Nat. Rev. Mol. Cell Biol. 2024, 25, 865–885. [Google Scholar] [CrossRef]
  51. Keller, K.E.; Peters, D.M. Pathogenesis of glaucoma: Extracellular matrix dysfunction in the trabecular meshwork-A review. Clin. Exp. Ophthalmol. 2022, 50, 163–182. [Google Scholar] [CrossRef]
  52. Reith, W.; LeibundGut-Landmann, S.; Waldburger, J.-M. Regulation of MHC class II gene expression by the class II transactivator. Nat. Rev. Immunol. 2005, 5, 793–806. [Google Scholar] [CrossRef] [PubMed]
  53. Kouwenberg, C.V.; Kuiper, J.J.W.; de Boer, J.H.; Ayuso, V.K. Serum biomarkers of vascular involvement in childhood uveitis. Transl. Vis. Sci. Technol. 2024, 13, 9. [Google Scholar] [CrossRef] [PubMed]
  54. Bauer, D.; Kasper, M.; Walscheid, K.; Koch, J.M.; Müther, P.S.; Kirchhof, B.; Heiligenhaus, A.; Heinz, C. Multiplex Cytokine Analysis of Aqueous Humor in Juvenile Idiopathic Arthritis-Associated Anterior Uveitis with or Without Secondary Glaucoma. Front. Immunol. 2018, 9, 708. [Google Scholar] [CrossRef]
  55. Maccora, I.; Altaye, M.; Greis, K.D.; Brunner, H.I.; Duell, A.; Haffey, W.D.; Nguyen, T.; Quinlan-Waters, M.; Schulert, G.S.; Sproles, A.; et al. Candidate Tear-Based Uveitis Biomarkers in Children with JIA Based on Arthritis Activity and Topical Corticosteroid Use. Ocul. Immunol. Inflamm. 2025, 33, 603–612. [Google Scholar] [CrossRef] [PubMed]
  56. Angeles-Han, S.T.; Utz, V.M.; Thornton, S.; Schulert, G.; Rodriguez-Smith, J.; Kauffman, A.; Sproles, A.; Mwase, N.; Hennard, T.; Grom, A.; et al. S100 proteins, cytokines, and chemokines as tear biomarkers in children with juvenile idiopathic arthritis-associated uveitis. Ocul. Immunol. Inflamm. 2021, 29, 1616–1620. [Google Scholar] [CrossRef]
  57. Baquet-Walscheid, K.; Wildschütz, L.; Kasper, M.; Busch, M.; Thanos, S.; Bauer, D.; Stoll, M.; König, S.; Heiligenhaus, A. Assessment of angiogenesis-related parameters in juvenile idiopathic arthritis-associated uveitis. Mol. Biol. Rep. 2022, 49, 6093–6102. [Google Scholar] [CrossRef]
  58. Zhang, G.; Jung, B.P.; Ho, W.; Jugloff, D.G.M.; Cheung, H.H.; Gurd, J.W.; Wallace, M.C.; Eubanks, J.H. Isolation and characterization of LCHN: A novel factor induced by transient global ischemia in the adult rat hippocampus. J. Neurochem. 2007, 101, 263–273. [Google Scholar] [CrossRef]
  59. Ito, D.; Kumanogoh, A. The role of Sema4A in angiogenesis, immune responses, carcinogenesis, and retinal systems. Cell Adhes. Migr. 2016, 10, 692–699. [Google Scholar] [CrossRef]
  60. Fan, N.-W.; Li, J.; Mittal, S.K.; Foulsham, W.; Elbasiony, E.; Huckfeldt, R.M.; Chauhan, S.K.; Chen, Y. Characterization of clinical and immune responses in an experimental chronic autoimmune uveitis model. Am. J. Pathol. 2021, 191, 425–437. [Google Scholar] [CrossRef]
  61. Li, M.; Gao, X.; Liu, K.; Bao, N.; Jiang, Z. MiR-379-5p aggravates experimental autoimmune uveitis in mice via the regulation of SEMA3A. Autoimmunity 2021, 54, 275–283. [Google Scholar] [CrossRef]
  62. Iragavarapu-Charyulu, V.; Wojcikiewicz, E.; Urdaneta, A. Semaphorins in angiogenesis and autoimmune diseases: Therapeutic targets? Front. Immunol. 2020, 11, 346. [Google Scholar] [CrossRef]
  63. Liao, H.-T.; Lin, Y.-F.; Chou, C.-T.; Tsai, C.-Y. Semaphorin 3A in ankylosing spondylitis. J. Microbiol. Immunol. Infect. 2019, 52, 151–157. [Google Scholar] [CrossRef]
  64. Walsh, A.M.; Wechalekar, M.D.; Guo, Y.; Yin, X.; Weedon, H.; Proudman, S.M.; Smith, M.D.; Nagpal, S. Triple DMARD treatment in early rheumatoid arthritis modulates synovial T cell activation and plasmablast/plasma cell differentiation pathways. PLoS ONE 2017, 12, e0183928. [Google Scholar] [CrossRef]
  65. Braunger, B.M.; Gießl, A.; Schlötzer-Schrehardt, U. The Blood-ocular Barriers and their Dysfunction: Anatomy, Physiology, Pathology. Klin. Monatsblatter Augenheilkd. 2023, 240, 650–661. [Google Scholar] [CrossRef] [PubMed]
  66. Triaille, C.; Durez, P.; Sokolova, T.; Tilman, G.; de Bellefon, L.M.; Galant, C.; Coulie, P.; Lauwerys, B.R.; Limaye, N. Common transcriptomic effects of abatacept and other dmards on rheumatoid arthritis synovial tissue. Front. Immunol. 2021, 12, 724895. [Google Scholar] [CrossRef] [PubMed]
  67. Coca-Prados, M. The blood-aqueous barrier in health and disease. J. Glaucoma. 2014, 23, S36–S38. [Google Scholar] [CrossRef] [PubMed]
  68. Wang, S.; Song, R.; Wang, Z.; Jing, Z.; Wang, S.; Ma, J. S100A8/A9 in Inflammation. Front. Immunol. 2018, 9, 1298. [Google Scholar] [CrossRef]
  69. Yun, J.; Xiao, T.; Zhou, L.; Beuerman, R.W.; Li, J.; Zhao, Y.; Hadayer, A.; Zhang, X.; Sun, D.; Kaplan, H.J.; et al. Local S100A8 levels correlate with recurrence of experimental autoimmune uveitis and promote pathogenic T cell activity. Investig. Opthalmology Vis. Sci. 2018, 59, 1332–1342. [Google Scholar] [CrossRef]
  70. Kasper, M.; Heming, M.; Schafflick, D.; Li, X.; Lautwein, T.; zu Horste, M.M.; Bauer, D.; Walscheid, K.; Wiendl, H.; Loser, K.; et al. Intraocular dendritic cells characterize HLA-B27-associated acute anterior uveitis. eLife 2021, 10, e67396. [Google Scholar] [CrossRef]
  71. Li, H.; Ju, X.; Zhang, L.; Zhu, J.; Zhang, J.; Xiao, J.; Wang, T.; Wu, W.; Wang, L.; Gan, C.; et al. Comprehensive single-cell profiling of monocytes in HLA-B27-positive ankylosing spondylitis with acute anterior uveitis. MedComm 2024, 5, e759. [Google Scholar] [CrossRef]
  72. Kim, H.-J.; Barnitz, R.A.; Kreslavsky, T.; Brown, F.D.; Moffett, H.; Lemieux, M.E.; Kaygusuz, Y.; Meissner, T.; Holderried, T.A.; Chan, S.; et al. Stable inhibitory activity of regulatory T cells requires the transcription factor Helios. Science 2015, 350, 334–339. [Google Scholar] [CrossRef] [PubMed]
  73. Wiemann, S.; Reinhard, J.; Reinehr, S.; Cibir, Z.; Joachim, S.C.; Faissner, A. Loss of the Extracellular Matrix Molecule Tenascin-C Leads to Absence of Reactive Gliosis and Promotes Anti-inflammatory Cytokine Expression in an Autoimmune Glaucoma Mouse Model. Front. Immunol. 2020, 11, 566279. [Google Scholar] [CrossRef] [PubMed]
  74. Reinhard, J.; Wiemann, S.; Hildebrandt, S.; Faissner, A. Extracellular matrix remodeling in the retina and optic nerve of a novel glaucoma mouse model. Biology 2021, 10, 169. [Google Scholar] [CrossRef]
  75. Pena, J.D.; Varela, H.J.; Ricard, C.S.; Hernandez, M.R. Enhanced tenascin expression associated with reactive astrocytes in human optic nerve heads with primary open angle glaucoma. Exp. Eye Res. 1999, 68, 29–40. [Google Scholar] [CrossRef]
  76. Salkar, A.; Wall, R.V.; Basavarajappa, D.; Chitranshi, N.; Parilla, G.E.; Mirzaei, M.; Yan, P.; Graham, S.; You, Y. Glial cell activation and immune responses in glaucoma: A systematic review of human postmortem studies of the retina and optic nerve. Aging Dis. Aging Dis. 2024, 15, 2069–2083. [Google Scholar] [CrossRef]
  77. van Meerwijk, C.; Kuiper, J.; van Straalen, J.; Ayuso, V.K.; Wennink, R.; Haasnoot, A.-M.; Kouwenberg, C.; de Boer, J. Uveitis Associated with Juvenile Idiopathic Arthritis. Ocul. Immunol. Inflamm. 2023, 31, 1906–1914. [Google Scholar] [CrossRef]
  78. Evereklioglu, C.; Erşekerci, T.K.; Sönmez, H.K.; Sener, H.; Sevim, D.G.; Polat, O.A.; Arda, H.; Horozoglu, F. The frequency of intraocular pressure elevation, incidence of secondary glaucoma, and surgical treatment with postoperative complications in pediatric and adult patients with uveitis. Cureus 2024, 16, e55734. [Google Scholar] [CrossRef]
  79. Heinz, C.; Schumacher, C.; Roesel, M.; Heiligenhaus, A. Elevated intraocular pressure in uveitis associated with juvenile idiopathic arthritis-associated uveitis, often detected after achieving inactivity. Br. J. Ophthalmol. 2012, 96, 140–141. [Google Scholar] [CrossRef] [PubMed]
Figure 1. Representative slit-lamp appearance of (A) juvenile idiopathic arthritis (JIA)-associated anterior uveitis versus (B) ANA-positive anterior uveitis. For both, there are several posterior synechiae and a fibrovascular membrane on the lens.
Biomolecules 16 00534 g001
Figure 2. Iris transcriptome of JIAU versus ANA-U patients. (A) Principal component analysis (PCA) was performed on normalized gene expression data to evaluate variability among samples and identify clustering patterns. Each point represents an individual patient. JIAU (n = 31) and ANA-U (n = 9). (B) The volcano plot displays the distribution of gene expression changes identified by comparing the JIAU vs. ANA-U groups, illustrating transcriptional differences associated with uveitis. DEGs (red dots) are defined as an adjusted p-value of p ≤ 0.05, and a log2FC of >1 (upregulated) or log2FC < −1 (downregulated). Genes with log2FC > 1 or <−1 but p > 0.05 (not significant) are shown as green dots. Genes that do not pass these thresholds are shown in gray.
Biomolecules 16 00534 g002
Figure 3. Iris transcriptome of JIAU and ANA-U patients during active and inactive uveitis. (A) PCA plot of iris samples, color-coded by clinical group (JIAU vs. ANA-U) and disease activity status (active vs. inactive). (B) Hierarchical clustering heatmap visualizing 35 genes in the ANA-U group, which were significantly differentially expressed (upregulated n = 33; downregulated n = 2) when comparing active uveitis (n = 4) and inactive uveitis (n = 5) samples. Each row represents one gene, and each column represents one sample. The z-score represents a gene’s expression in relation to its mean expression by standard deviation units (red: upregulation and blue: downregulation).
Biomolecules 16 00534 g003
Figure 4. Iris transcriptome of the merged JIAU/ANA-U samples with active versus inactive uveitis, and overlapping genes with JIAU and ANA-U samples during active uveitis. (A) PCA plot showing merged JIAU/ANA-U samples marked by different colors depending on uveitis activity status (active or inactive) at the time of sample collection. (B) Hierarchical clustering heatmap visualizing 28 genes in the merged JIAU/ANA-U group, which were significantly upregulated when comparing active uveitis (n = 9) and inactive uveitis (n = 31) samples (Supplementary Table S2 and Supplementary Figure S1). Each row represents one gene, each column represents one sample. The z-score represents a gene’s expression in relation to its mean expression by standard deviation units (red: upregulation and blue: downregulation). (C) The Venn diagram depicts the number of unique and shared DEGs identified across the compared groups. Each circle represents one group: ANA-U, JIAU, or JIAU/ANA-U with active versus (vs.) inactive uveitis. The overlapping regions of the circles indicate the same genes that are regulated within the groups (see Supplementary Table S3).
Biomolecules 16 00534 g004
Figure 5. Iris transcriptome of JIAU and ANA-U patients with versus without glaucoma. (A) PCA plot showing the samples of the JIAU and ANA-U groups marked by different colors depending on the presence of glaucoma at the time of sample collection. Hierarchical clustering heatmap visualizing differentially expressed genes in the (B) JIAU and (C) ANA-U groups, comparing samples with (w) glaucoma (JIAU n = 19 and ANA-U n = 5) versus without (wo) glaucoma (JIAU n = 12 and ANA-U n = 4). In the glaucoma versus non-glaucoma comparison, 12 (JIAU) and 11 (ANA-U) genes were significantly upregulated, while 10 (JIAU) and 4 (ANA-U) genes were significantly downregulated (Supplementary Table S2 and Supplementary Figure S2). Each row represents one gene, each column represents one sample. The z-score represents a gene’s expression in relation to its mean expression by standard deviation units (red: upregulation and blue: downregulation).
Biomolecules 16 00534 g005
Figure 6. Iris transcriptome of merged JIAU/ANA-U patients with glaucoma versus without glaucoma. (A) PCA plot showing merged JIAU/ANA-U samples marked by different colors depending on glaucoma status [with (w) or without (wo)] at the time of sample collection. (B) Hierarchical clustering heatmap visualizing 4 genes in the merged JIAU/ANA-U group, which were significantly upregulated when comparing w glaucoma (n = 24) and wo glaucoma (n = 16) samples (Supplementary Table S2 and Supplementary Figure S2). Each row represents one gene, each column represents one sample. The z-score represents a gene’s expression in relation to its mean expression by standard deviation units (red: upregulation, blue: downregulation). (C) The Venn diagram depicts the number of unique and shared DEGs identified across the compared groups. Each circle represents one group: ANA-U, JIAU, or JIAU/ANA-U w glaucoma versus (vs.) wo glaucoma. The overlapping regions of the circles indicate the same genes that are regulated within the groups (see Supplementary Table S5).
Biomolecules 16 00534 g006
Disclaimer/Publisher’s Note: The statements, opinions and data contained in all publications are solely those of the individual author(s) and contributor(s) and not of MDPI and/or the editor(s). MDPI and/or the editor(s) disclaim responsibility for any injury to people or property resulting from any ideas, methods, instructions or products referred to in the content.