1. Introduction
Skin wound healing is a complex, multi-stage biological process involving inflammation, cell migration, re-epithelialization, and tissue remodeling, the efficiency of which directly affects regenerative outcomes and recovery time in patients [
1]. To better understand the regulatory mechanisms underlying these processes, various experimental models have been developed, including two-dimensional (2D) cell cultures, animal models, and organoid systems [
2,
3]. While 2D monolayer cultures are widely used due to their simplicity and reproducibility, they fail to recapitulate the three-dimensional architecture and local microenvironment of real tissue. Animal models more closely mimic physiological conditions but are constrained by long experimental cycles, ethical considerations, and species-dependent variability, and offer limited control over microenvironmental and single-factor perturbations [
4,
5].
Conventional models often rely on endpoint sampling and offline analyses, lacking the capability for high-resolution, spatiotemporal monitoring of the wound healing process [
6]. Studies have shown that key metabolic and signaling pathways involved in healing are highly time-sensitive; for example, inflammatory cytokine levels fluctuate dynamically, and reactive oxygen species (ROS) and glucose metabolism may exert opposing effects at different healing stages [
7,
8]. Real-time tracking of these molecular dynamics is thus critical for elucidating the mechanistic basis of wound repair, yet current platforms generally lack the capacity for in situ, multiparametric monitoring.
In response to these challenges, microfluidic technology has been increasingly applied to wound healing research in recent years. Its ability to construct three-dimensional microenvironments at the microscale, dynamically simulate cellular behaviors, and support high-throughput screening has positioned it as a promising experimental platform [
2,
9]. However, most existing microfluidic wound models still suffer from limited functional integration. On the one hand, wound generation methods often rely on mechanical or enzymatic approaches, which lack morphological precision and may disrupt the extracellular matrix, thereby compromising the accuracy of cell migration assessment [
10]. On the other hand, many platforms focus primarily on cellular-level parameters such as migration rate and wound area, while failing to simultaneously monitor molecular-level signals such as metabolites and inflammatory factors [
11].
Moreover, current systems typically operate using a single sensing modality—such as optical imaging or electrochemical detection—which constrains their ability to capture structural, functional, and metabolic information in parallel. This significantly limits their suitability for investigating complex exogenous stimuli such as CAP, which exerts multifaceted and time-sensitive biological effects [
5]. There is thus an urgent need for an experimental system that integrates robust microenvironmental control with multimodal sensing capabilities, enabling real-time, multiparametric analysis of the full wound healing process and associated metabolic responses.
Cold atmospheric plasma has emerged as a promising modality in wound care due to its non-thermal nature, strong antimicrobial activity, and excellent biocompatibility [
12]. Studies have shown that CAP generates reactive oxygen and nitrogen species (RONS) capable of modulating the local redox environment, stimulating cell migration and proliferation, and promoting angiogenesis and re-epithelialization [
13,
14]. However, these biological effects are highly time- and dose-dependent, influenced by multiple parameters such as treatment duration and discharge settings [
15]. Prior to clinical translation, a mechanistic understanding of CAP’s action requires dynamic and quantitative experimental platforms [
16]. Current research remains largely reliant on endpoint assays and static comparisons, lacking systems with the spatiotemporal resolution and multimodal detection capacity needed to capture dynamic cellular and metabolic responses to CAP treatment [
17].
In this study, we developed a microfluidic experimental system that integrates CAP stimulation with in situ, multiparametric sensing, along with precise environmental control of temperature, humidity, and CO2 concentration. The platform incorporates optical, electrochemical, and fluorescence-based detection modules. Validation experiments demonstrated stable environmental conditions and continuous culture of skin cells with sustained viability above 90%. A microneedle-induced scratch model was established to simulate wound injury. Upon CAP treatment, the wound area contracted by approximately 28.6% within 12 h, with markedly enhanced cell migration and proliferation. This system offers a robust platform for real-time investigation of CAP-enhanced wound healing mechanisms and can be extended to high-throughput screening of treatment parameters, biomaterials, or combination therapies, thereby supporting data-driven development of personalized therapeutic strategies.
2. Materials and Methods
2.1. Development and Functional Testing of the Microfluidic Environmental Control System
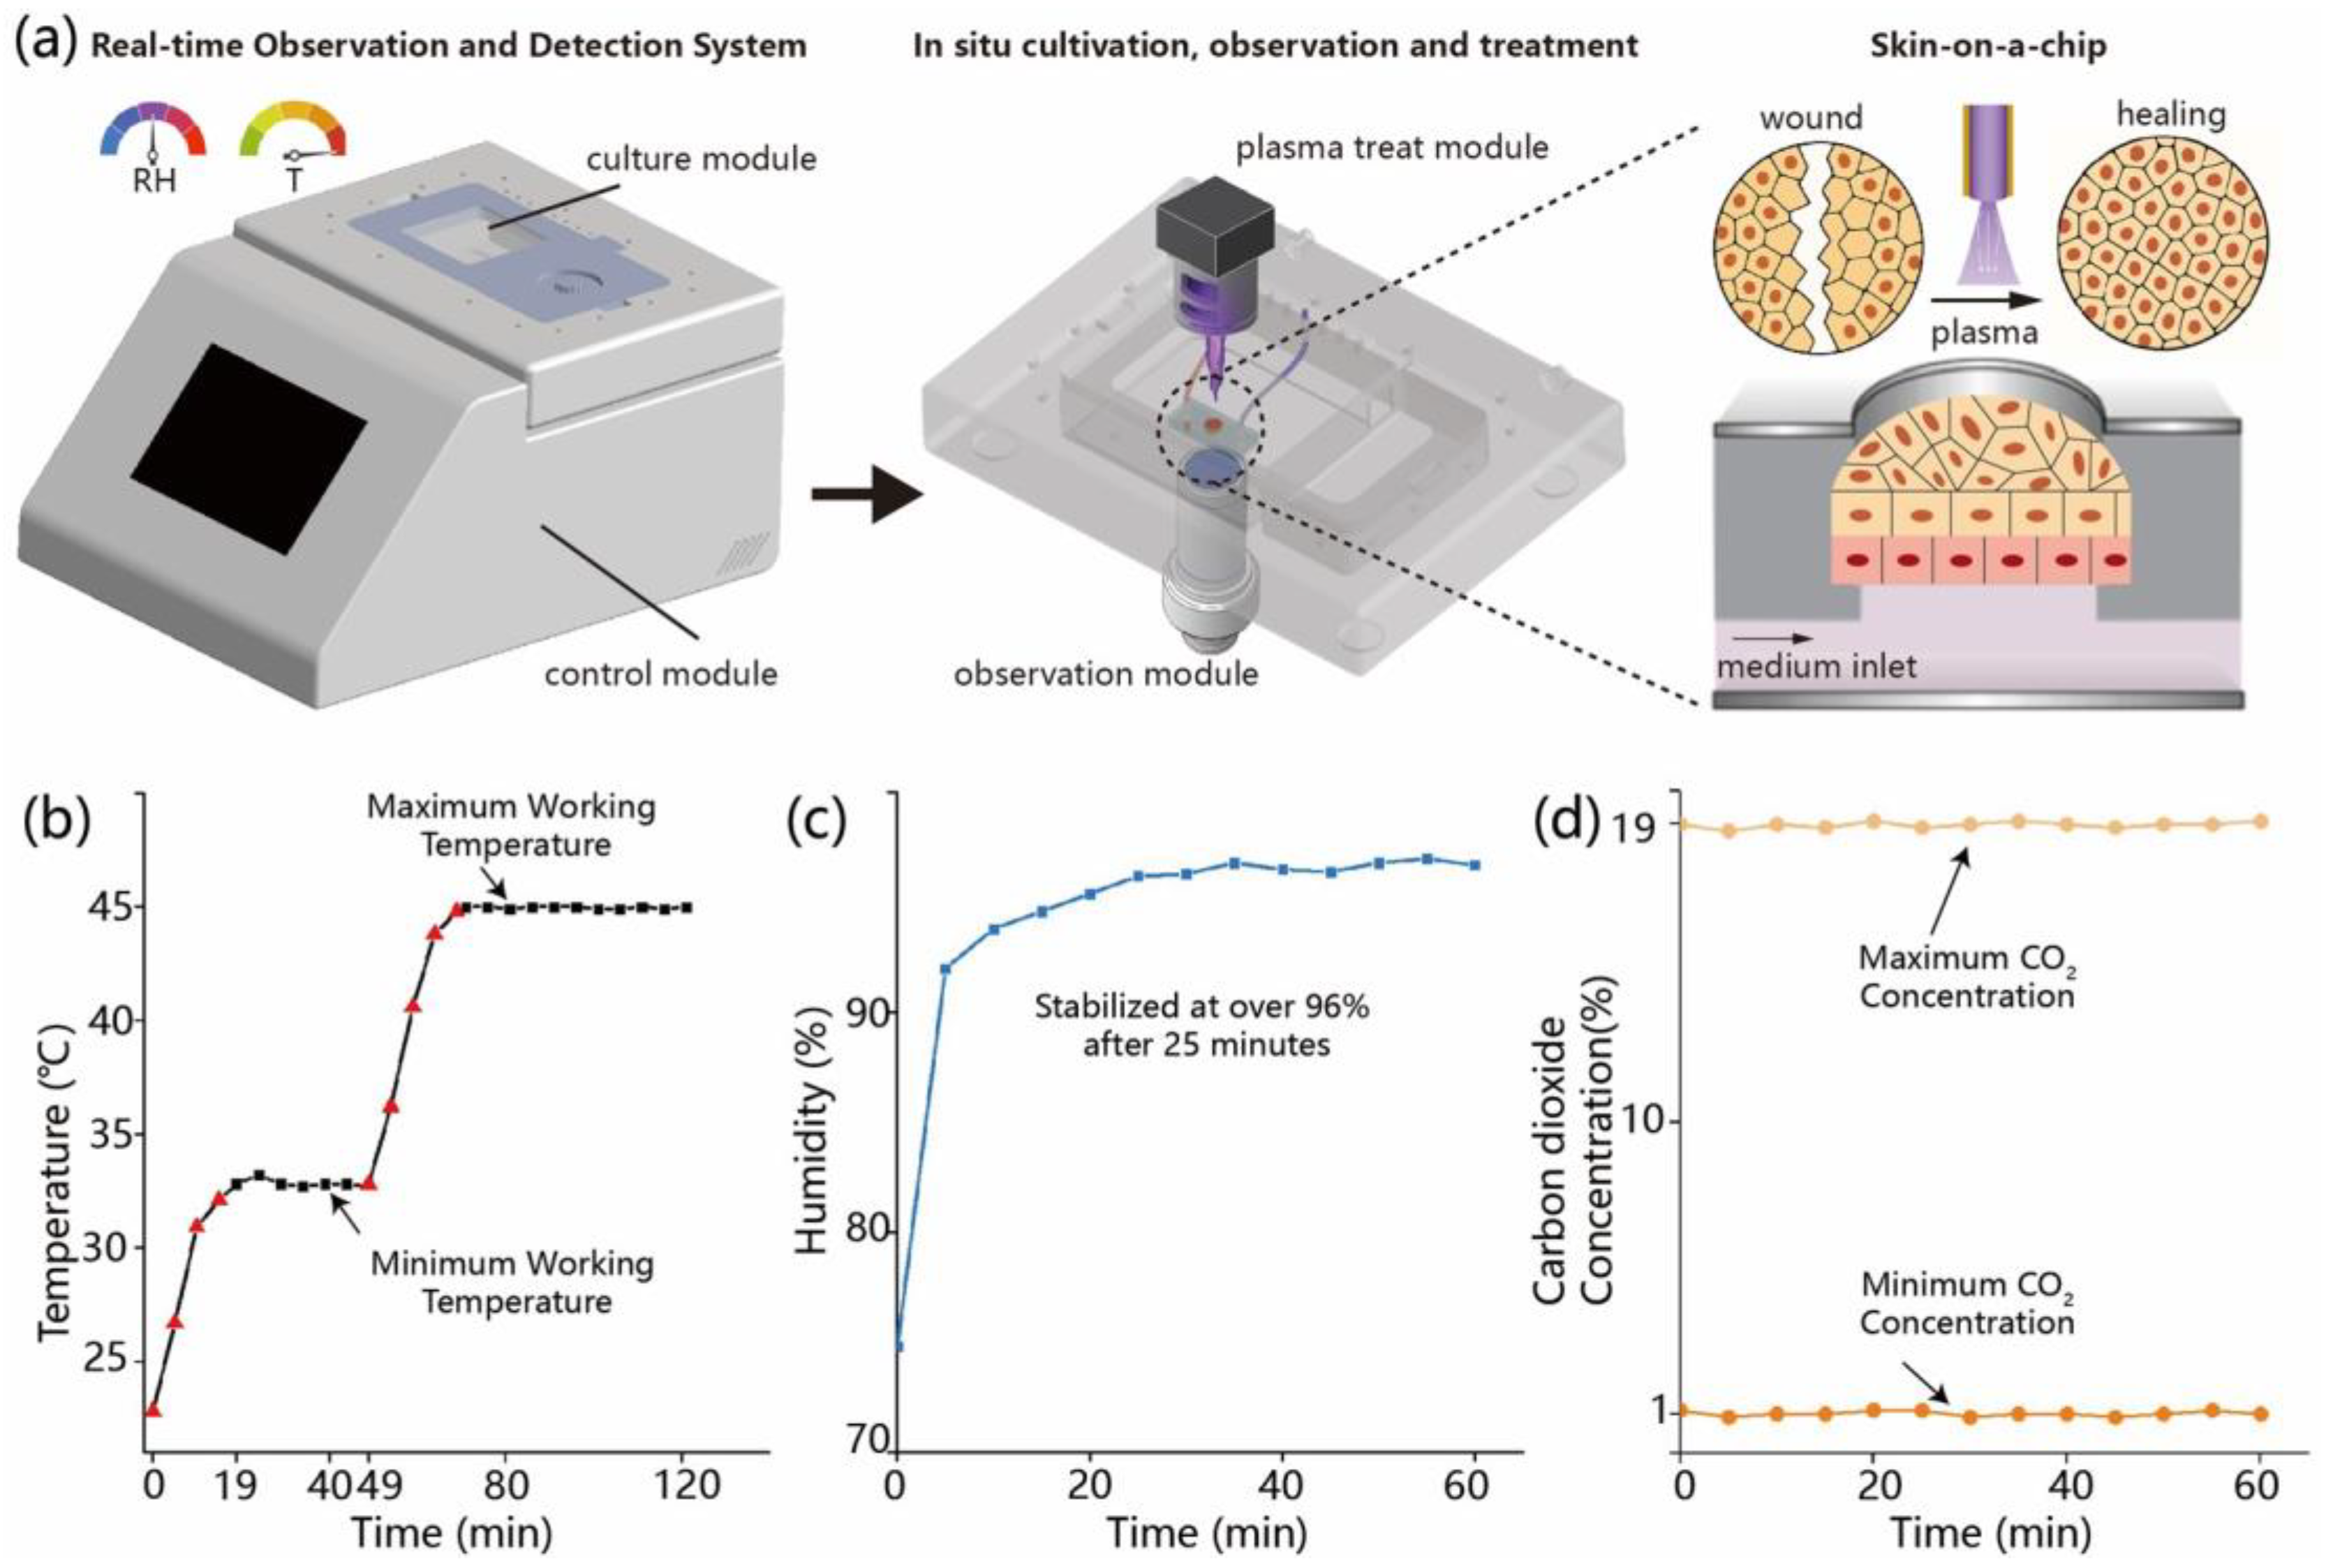
The microfluidic platform used in this study integrates temperature, humidity, and carbon dioxide (CO2) regulation units to establish a stable and controllable cell culture environment. The main structure consists of a sealed incubation chamber with a transparent glass window on the top for real-time microscopic observation, and side ports for gas and electrical connections linked to an embedded control system and gas supply module. Temperature regulation is achieved by thin-film heating elements attached to the outer surface of the glass window, in combination with thermistor sensors that continuously monitor the internal temperature. The system is configured to operate within a range of 22.8–45.0 °C, with a PID algorithm enabling automatic heating. Temperature data are recorded at 1 min intervals to evaluate heating kinetics and thermal stability. Humidity is controlled by heating a water-saturated sponge to generate vapor, which is introduced into the chamber. A humidity sensor positioned centrally monitors the internal relative humidity, with a target setpoint of 97% RH. The regulation process is automatically logged by the system. CO2 concentration is controlled using a mass flow controller to regulate the input of premixed gas. The target concentration ranges from 1% to 19%, with real-time monitoring via an infrared CO2 sensor at a sampling interval of 5 s. All sensor outputs and control signals are integrated via an embedded data acquisition module and managed through a LabVIEW-based interface, which enables parameter adjustment, real-time visualization, and data recording.
2.2. Fabrication of the Microfluidic Skin-on-a-Chip Device
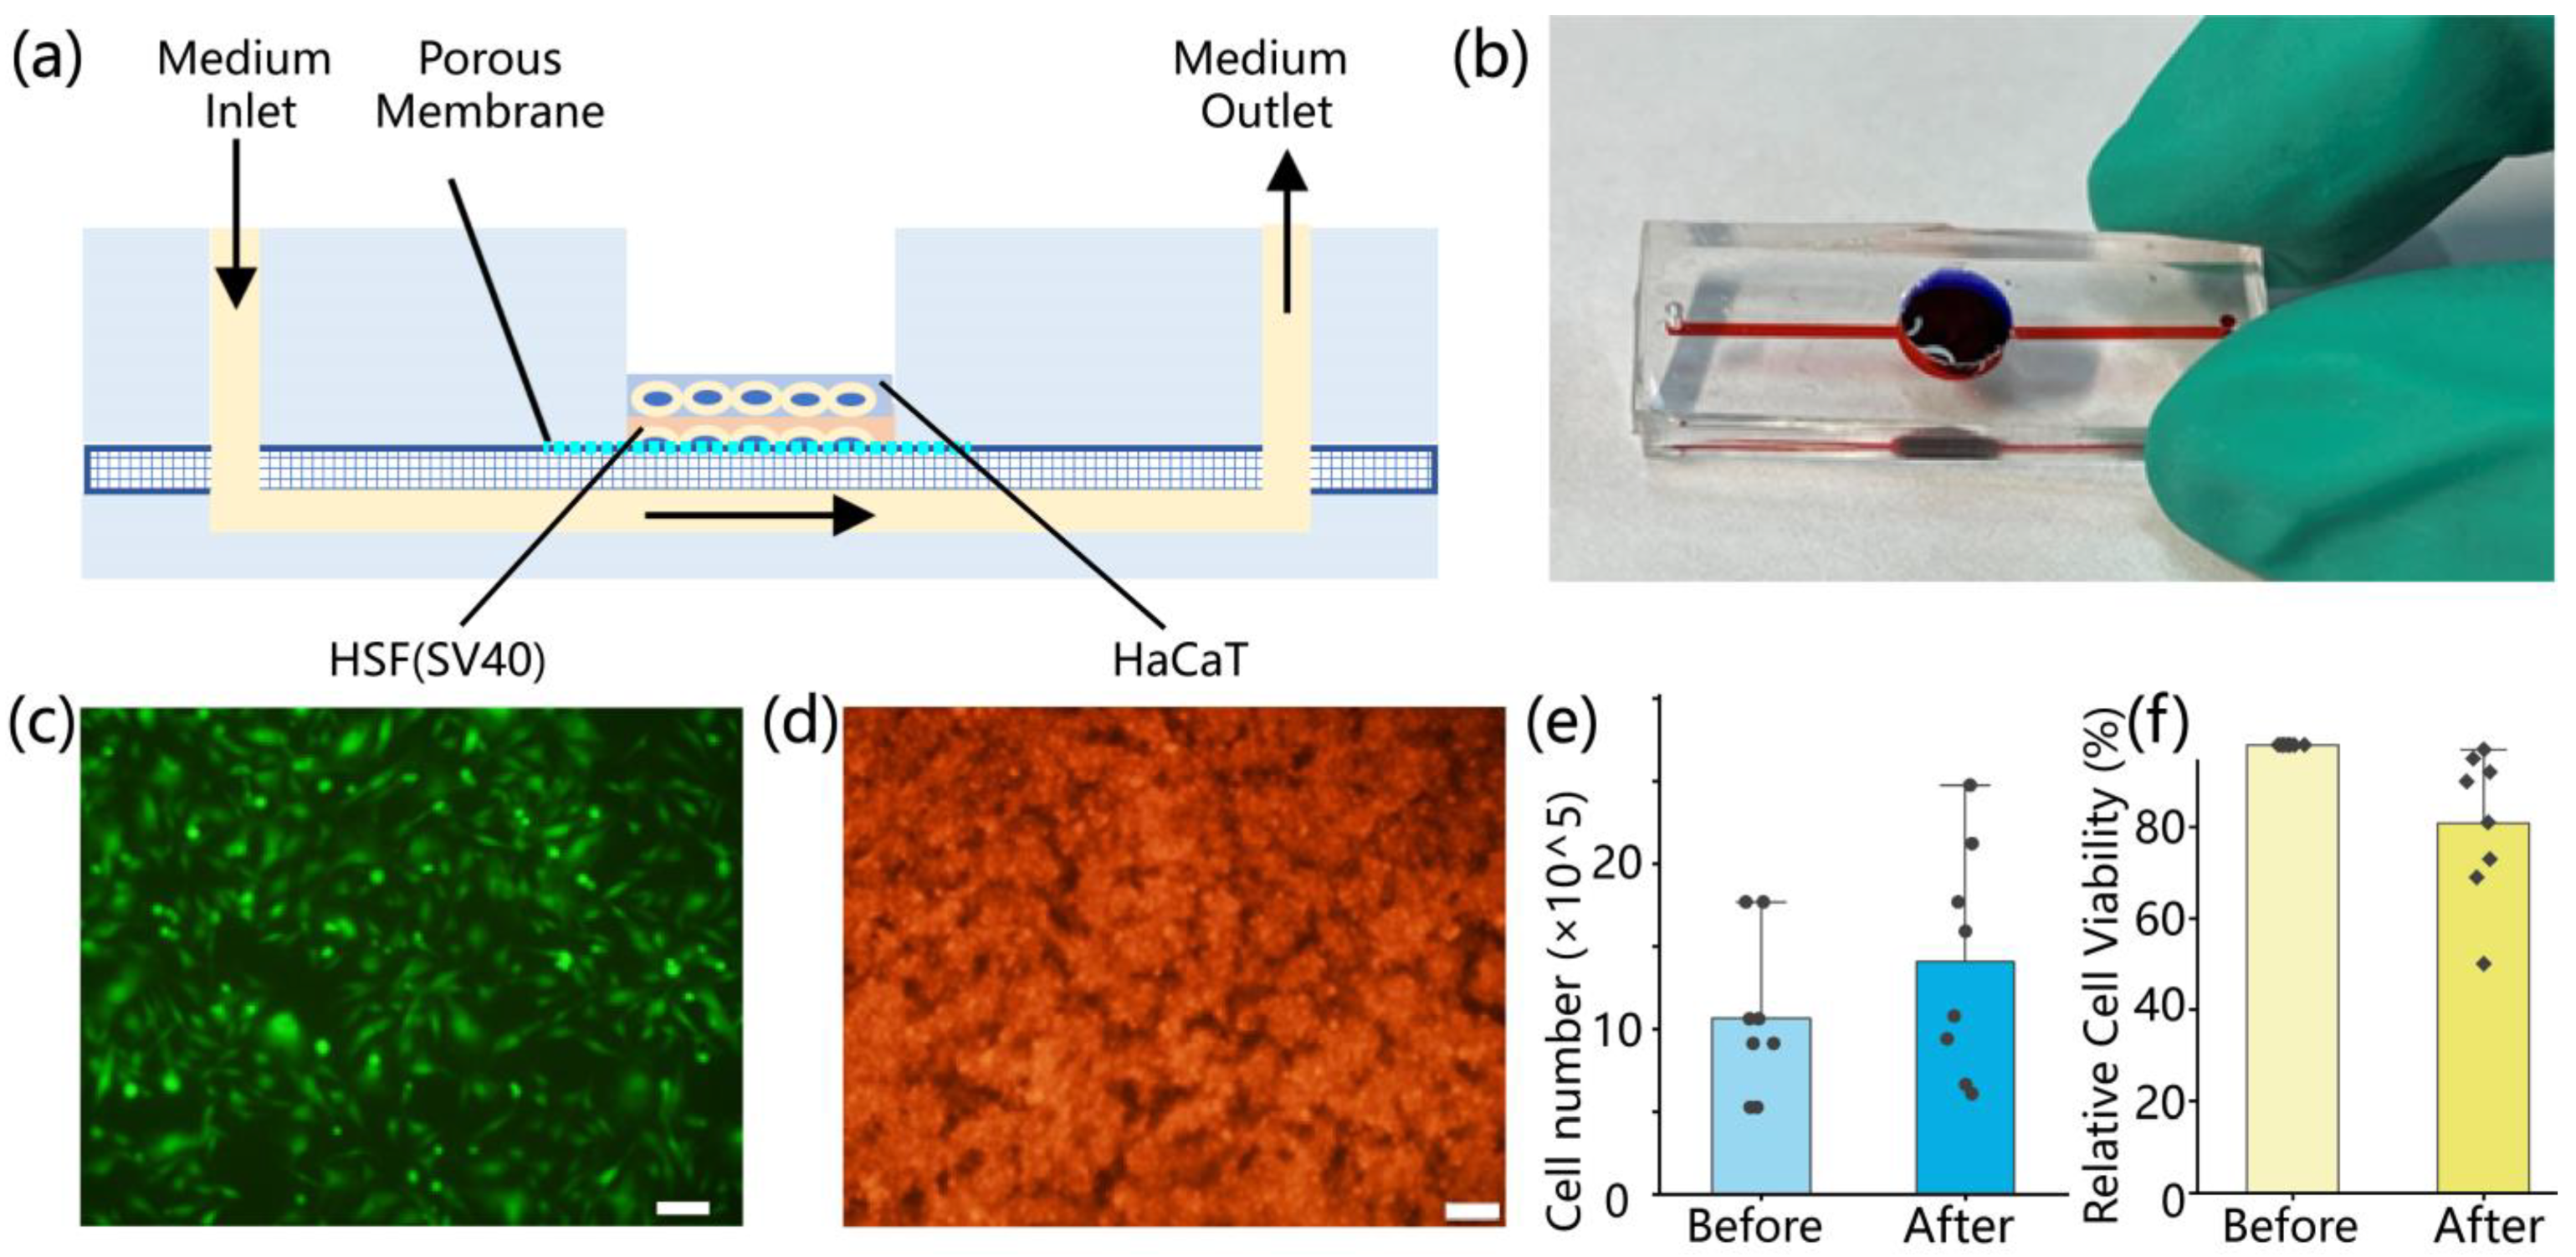
The skin-on-a-chip device was constructed from three layers of polydimethylsiloxane (PDMS), mimicking a bilayer epidermis–dermis architecture. It included upper and lower cell culture channels separated by a porous PDMS membrane. Each layer was fabricated using SU-8 photoresist molds. PDMS prepolymer (Sylgard 184, Dow Corning, Michigan, USA; 10:1 w/w) was degassed under vacuum, cast into the molds, and cured overnight at 65 °C. Following oxygen plasma treatment (120 s, 95% pure oxygen), the three layers were aligned and irreversibly bonded in a clean environment to ensure microchannel integrity and sealing. The upper PDMS layer (2 mm thick) contained a 10 mm central circular opening for gas exchange and manual access, along with 200 μm-wide parallel microchannels and two 1 mm ports for fluid circulation. The middle membrane (40 μm thick) contained uniform pores of approximately 5 μm diameter, allowing molecular exchange while preventing cell migration between layers. The lower PDMS layer (3 mm thick) mirrored the upper layer’s channel geometry. After assembly, the entire chip was sterilized by immersion in 75% ethanol followed by 2 h of UV exposure. To enhance cell adhesion, 50 μg/mL fibronectin (Procell, Wuhan, China) was injected into the microchannels and incubated at 37 °C for 1 h.
HaCaT keratinocytes and human skin fibroblasts (HSF, SV40-immortalized; Procell, Wuhan, China) were used to reconstruct the epidermal and dermal compartments, respectively. Prior to seeding, cells were cultured in T25 flasks using MEM or DMEM complete media (10% fetal bovine serum and 1% penicillin–streptomycin; Procell, Wuhan, China) until 70–90% confluence. Cells were harvested with 0.25% trypsin-EDTA at 37 °C for 5–15 min, followed by centrifugation at 900 rpm for 5–10 min. The resulting pellets were resuspended in prewarmed media for further use. HSF cells were seeded into the lower channel at a density of 0.5 × 10⁶ cells/mL (200 μL per well), followed by supplementation with HSF medium. The chip was incubated overnight at 37 °C in a humidified 5% CO2 incubator. The following day, the upper channel was rinsed three times with PBS to remove residual debris before seeding HaCaT cells at a density of 2 × 10⁶ cells/mL (200 μL per well). Equal volumes of HSF medium were used for both layers to maintain a consistent microenvironment. After an additional 24 h of incubation, both cell types exhibited attachment and spreading within their respective channels. To assess cell morphology and distribution, HaCaT and HSF cells were pre-labeled with CytoTrace™ CMTPX red fluorescent dye (AAT Bioquest, Pleasanton, CA, USA). Imaging was performed using an inverted fluorescence microscope. ImageJ software (version 1.51j8) was used to analyze fluorescence intensity, cell coverage, and spatial distribution, providing quantitative evaluation of cell viability, density, and uniformity.
To evaluate HaCaT cell attachment and proliferation within the chip, fluorescence images were acquired at 4 h, 12 h, 24 h, and 48 h post-seeding. Images were processed in ImageJ using threshold segmentation and binarization, and cell-covered area was calculated based on pixel count and converted to physical units using a calibrated scale (128 pixels = 100 µm).
The viability of cells after seeding into the chip was evaluated using the trypan blue exclusion assay. Cells were first enzymatically detached from the chip using 0.25% trypsin-EDTA. The resulting cell suspension was then mixed with 0.4% trypan blue solution at a 1:1 (v/v) ratio and incubated briefly for staining. The stained suspension was gently loaded into a hemocytometer chamber (0.1 mm3), and viable and non-viable cells were distinguished under a light microscope based on dye uptake. Cell viability was calculated as the percentage of unstained (live) cells relative to the total number of cells.
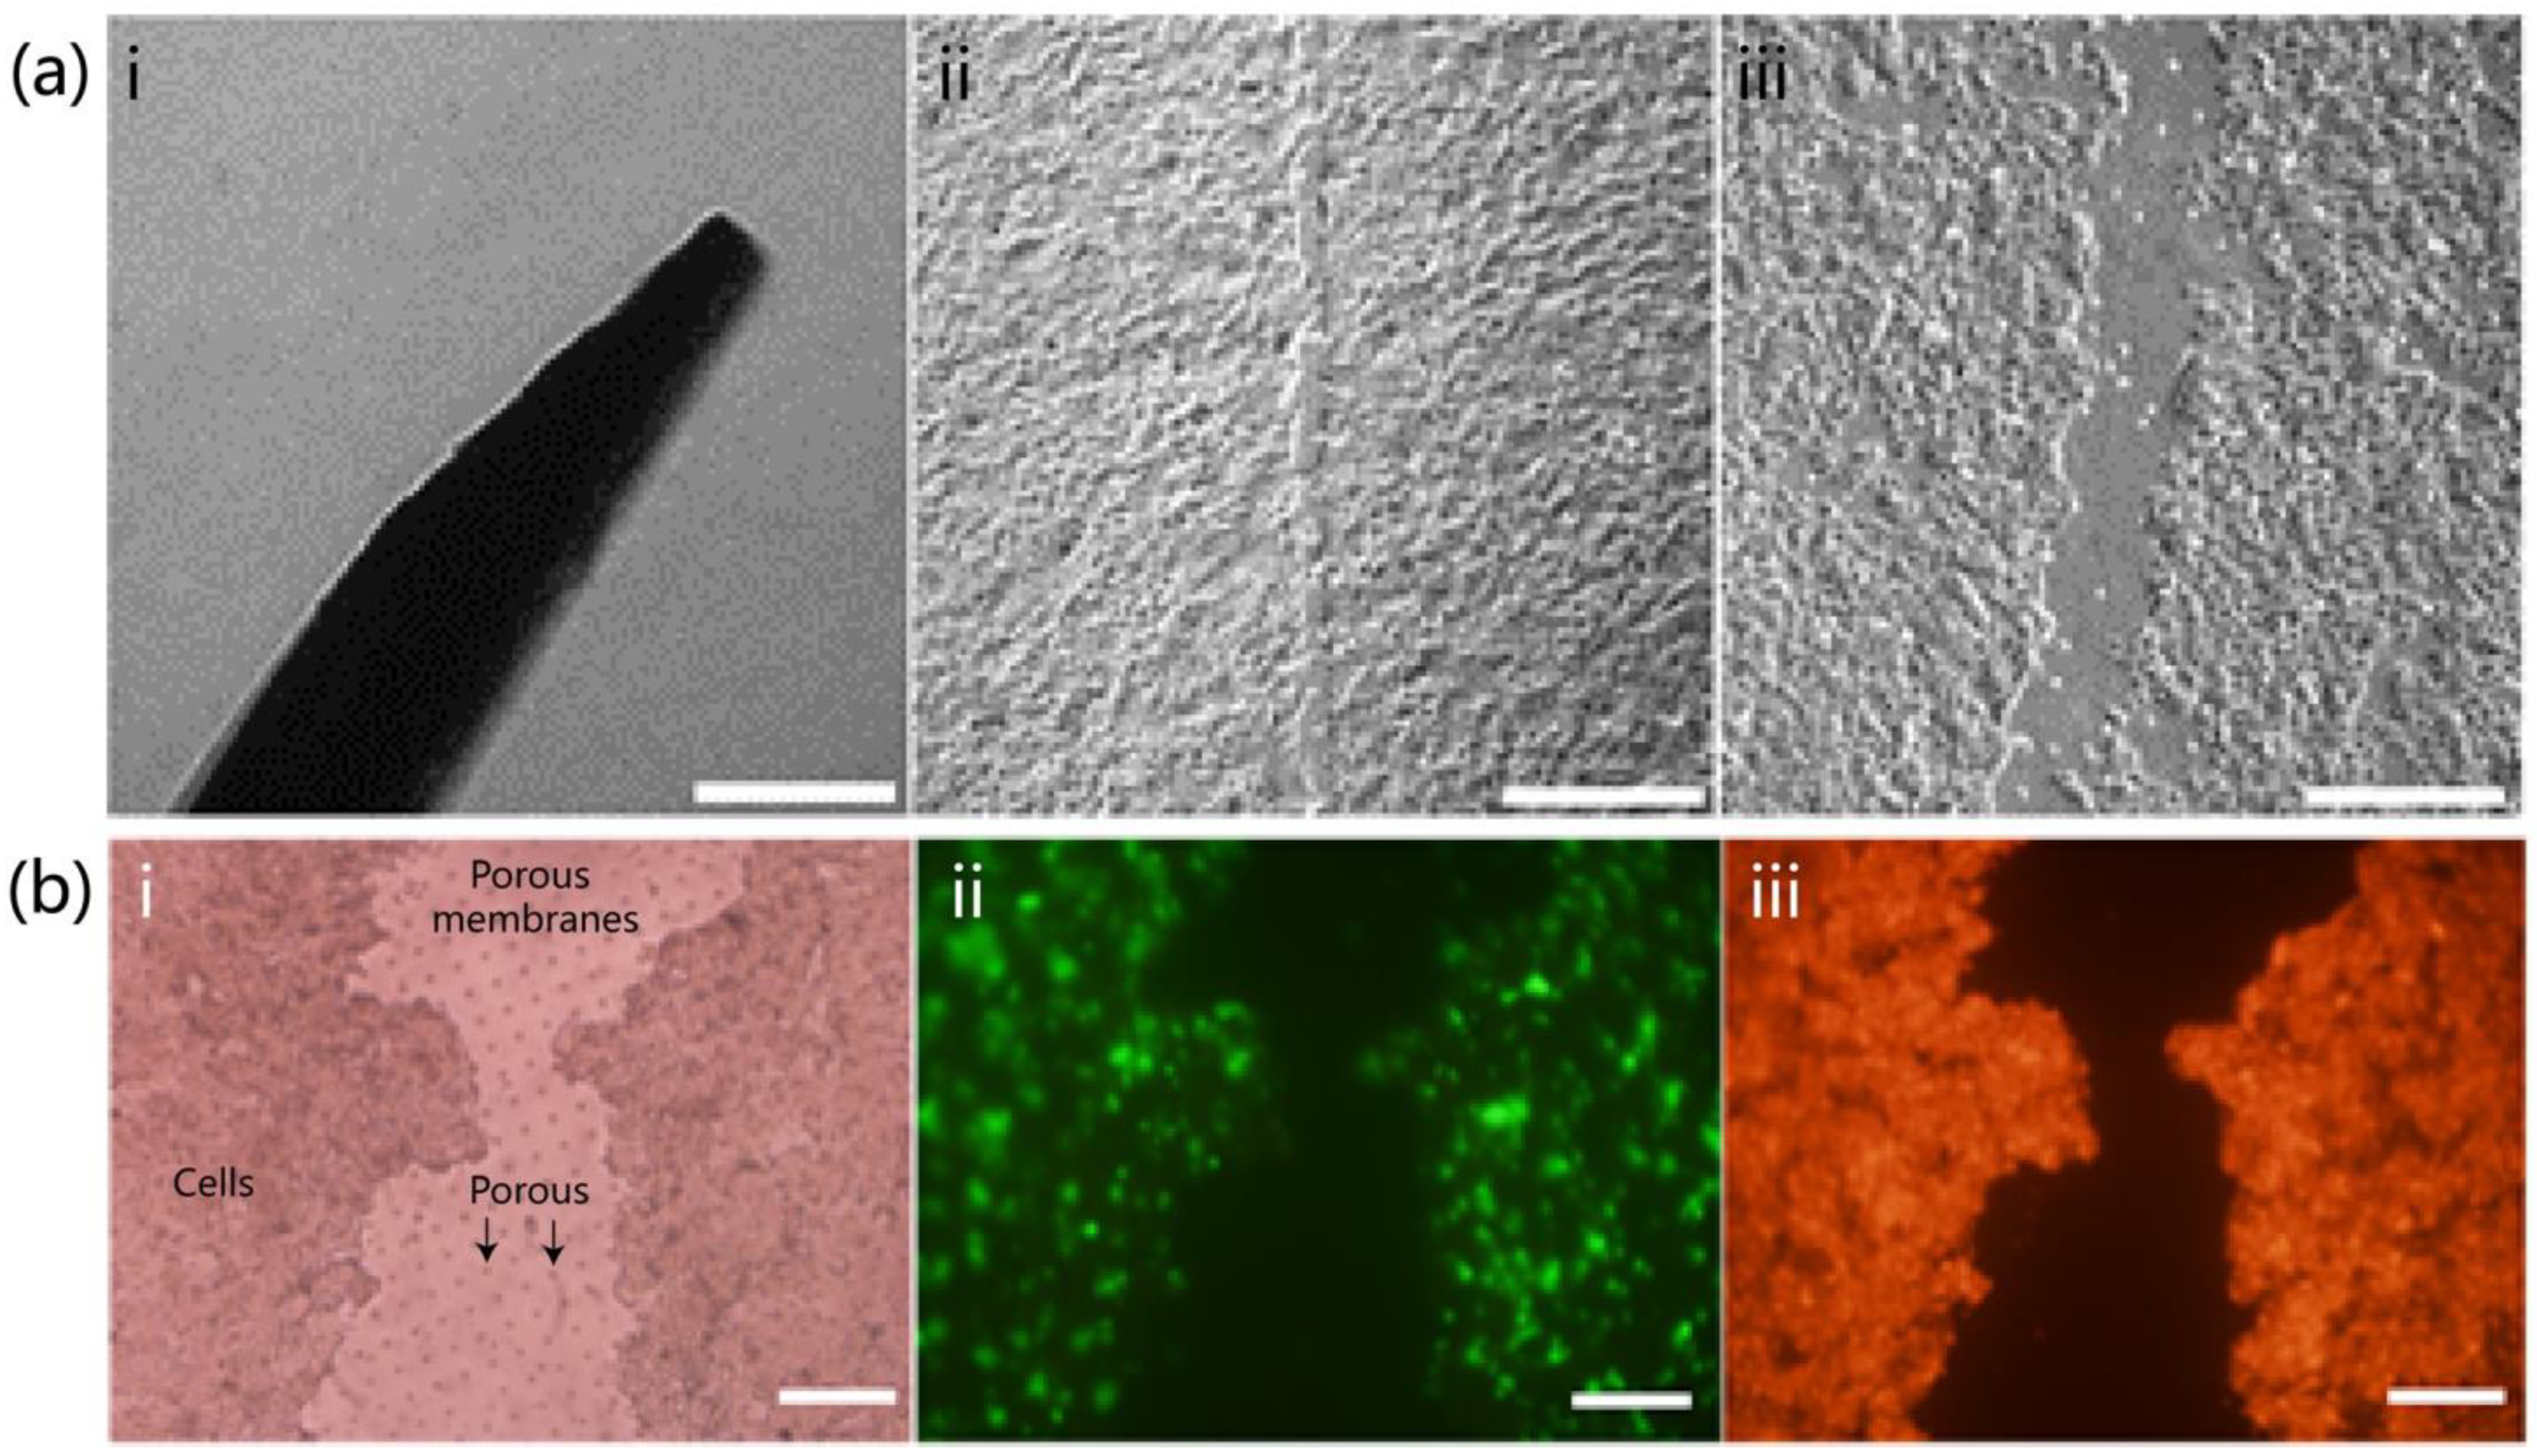
2.3. Construction of the On-Chip Wound Model
To establish a physical epidermal injury model in the microfluidic skin-on-a-chip, manual scratching was performed on the HaCaT cell layer using standard microneedles. Needles with diameters of 20 μm and 50 μm (Aladdin, Shanghai, China) were used to create scratch wounds of different widths. The procedure was conducted 24 h after seeding, once cells had adhered and spread uniformly. All operations were performed under sterile conditions. After exposing the upper channel, a sterilized needle was vertically applied to the cell layer, drawn along the main axis of the channel at a constant speed to form a linear scratch. After scratching, sterile phosphate-buffered saline (PBS; Procell, Wuhan, China) was gently added to the upper channel and flushed three times to remove detached cells and debris. Then, pre-warmed and pre-mixed complete media (1:1 v/v%, HaCaT complete medium and HSF complete medium) were added. Chips were returned to a humidified incubator at 37 °C with 5% CO2 for continued culture. The wound area was quantified by bright-field imaging using an inverted microscope. Images were imported into ImageJ software, and the scale was calibrated. The wound boundary was outlined manually or by threshold-based segmentation to calculate the two-dimensional projected area (A, μm2). For each image, 3–5 regions were randomly selected for measurement, and the average was calculated. All images were acquired using identical exposure and resolution settings to ensure consistency.
To visualize the wound morphology and cellular distribution, HaCaT cells were stained with CytoTrace™ CMTPX red fluorescent dye (AAT Bioquest, Pleasanton, CA, USA). Fluorescence microscopy was used to assess the extent of cell loss and spreading around the wound area. Additionally, the structural integrity of the porous PDMS membrane between channels was examined to ensure that the scratching procedure did not cause mechanical damage, preserving vertical diffusion and exchange functions essential for subsequent repair assays.
2.4. Plasma Treatment and Wound Healing Evaluation
After wound model construction for 24 h, CAP treatment was performed to evaluate its effect on cell migration and wound closure (
Supplementary Material Figure S1). A floating-electrode dielectric-barrier-discharge (FE-DBD) plasma generator was used as described in Reference [
18]. The system operated at a peak voltage of 5 kV and a frequency of 12 kHz. Water was used as the discharge medium, with the electrode inserted approximately 1 mm below the liquid surface. No external gas input was required. During treatment, the electrode was positioned above the wounded region in the upper channel of the chip, ensuring complete coverage of the wound area. Three treatment durations were applied: 0 min (control), 1 min, and 1.5 min. Immediately after discharge, fresh culture medium was replenished, and the chips were returned to a humidified incubator at 37 °C with 5% CO
2.
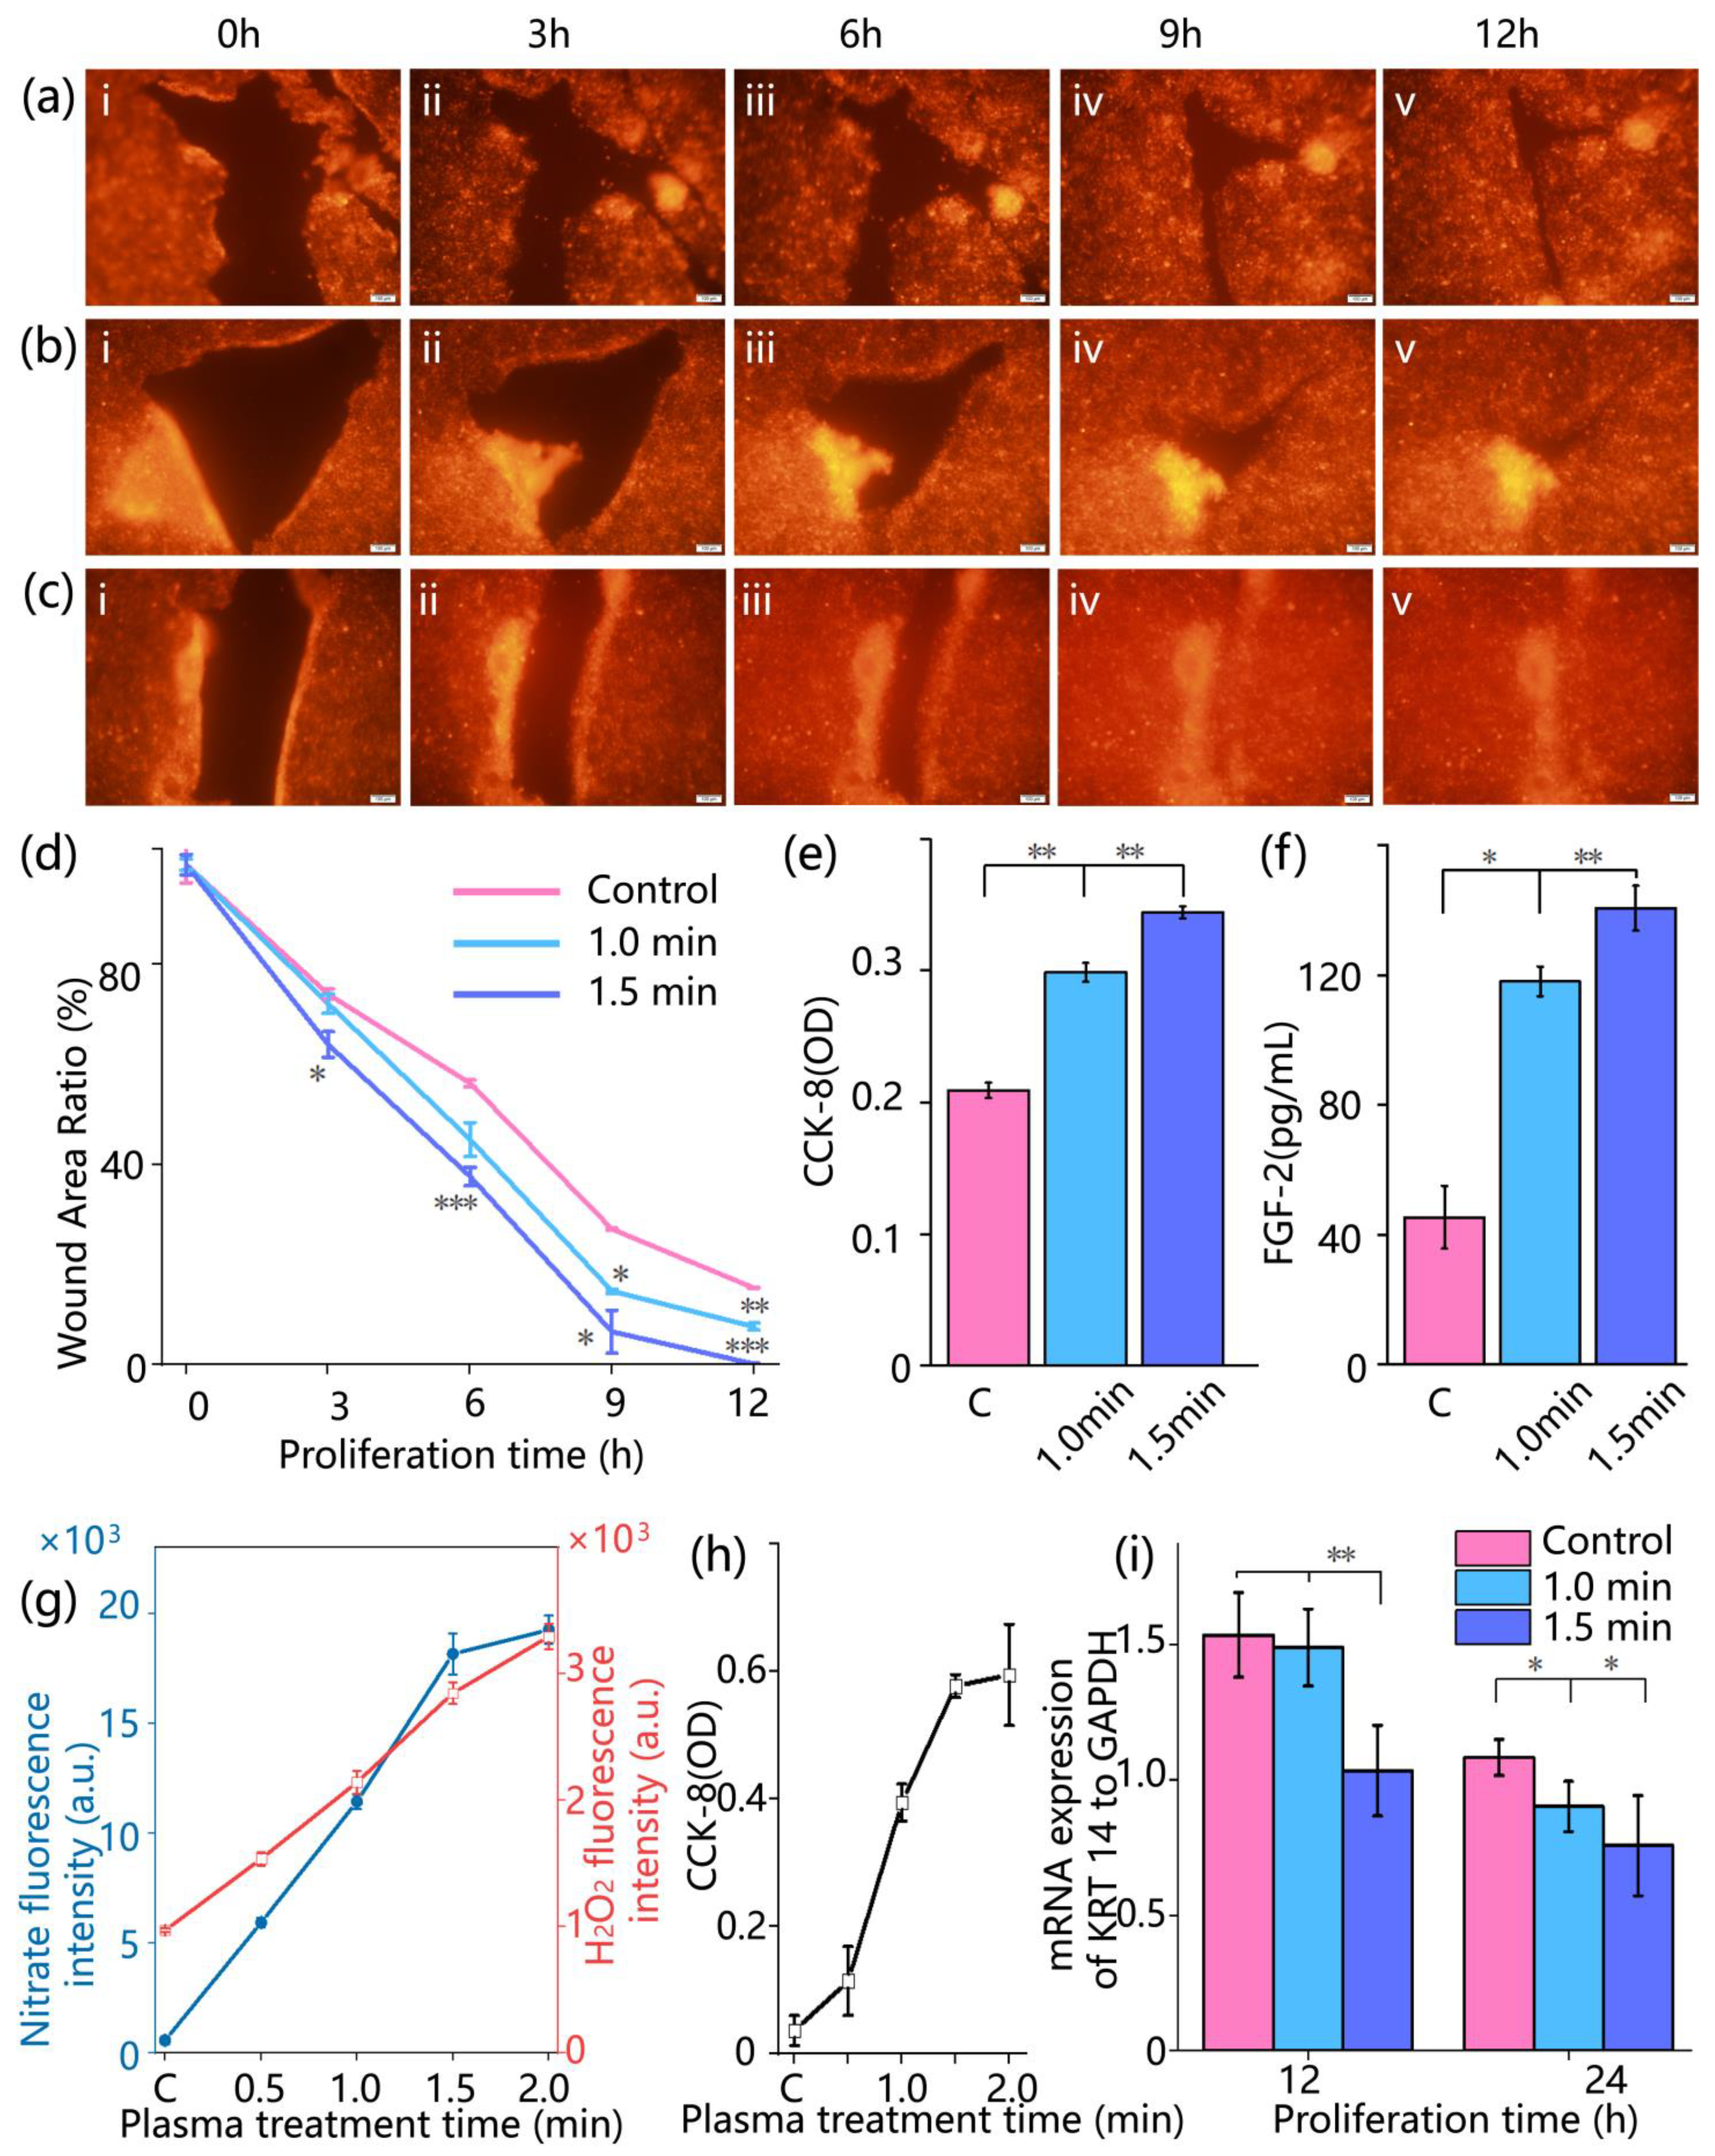
Wound healing was monitored by fluorescence imaging at 0, 3, 6, 9, and 12 h post-treatment. Red fluorescent images of the wound area were acquired using an inverted fluorescence microscope. The wound closure was quantified by calculating the relative wound area percentage, denoted as φ, according to the following formula:
where
Ah is the area of the wound at time
h, and
A0 is the area of the wound at the initial moment (
h = 0). Each group included three replicates, and mean values were used for further statistical analysis. This quantitative index was used to assess the healing process and the effectiveness of CAP treatment.
2.5. Cell Proliferation and Tissue Repair Assessment
To evaluate the physiological changes in cells in the skin-on-a-chip after cold atmospheric plasma treatment, cell metabolic activity and the secretion level of repair-associated factors were analyzed. Cell viability was assessed using a colorimetric CCK-8 assay (Solarbio, Beijing, China). At 0, 6, 12, and 24 h after treatment, CCK-8 working solution was added to both upper and lower channels of the chip at 10% of the total medium volume. The chips were incubated at 37 °C for 2 h, then 100 μL of the reaction solution was collected and transferred into a 96-well plate. Absorbance at 450 nm was measured using a microplate reader. Each group included three replicate wells, and the measured absorbance values were used to evaluate cell metabolic activity. The secretion level of fibroblast growth factor 2 (FGF-2) was quantified using an enzyme-linked immunosorbent assay (ELISA). At 12 hours’ post-treatment, 100 μL of culture medium was collected from the upper channel of each chip and analyzed using a human FGF-2 ELISA kit (Solarbio, Beijing, China). Samples and standards (100 μL per well) were added to ELISA plates pre-coated with anti-FGF-2 antibodies, followed by incubation at 37 °C for 90 min. After discarding the liquid, wells were washed five times. Next, 100 μL of biotin-conjugated secondary antibody was added to each well and incubated at 37 °C for 1 h, followed by another wash step. Subsequently, 100 μL of horseradish peroxidase (HRP)-conjugated solution was added and incubated at room temperature for 30 min. After washing, 90 μL of TMB substrate solution was added and incubated in the dark for 15 min. Finally, 50 μL of stop solution was added to terminate the reaction. Absorbance at 450 nm was measured, and FGF-2 concentrations were calculated based on the standard curve.
2.6. Detection of Plasma-Generated Reactive Species
To evaluate the generation of reactive nitrogen species (RNS) following cold atmospheric plasma treatment, the concentration of nitrite (NO2−) in the culture medium was quantitatively measured using the Griess colorimetric assay. At 0, 3, 6, 9, and 12 h post-treatment, 100 μL of medium was collected from the upper channel of the chip. Each sample was mixed with an equal volume of Griess reagent (Solarbio, Beijing, China), incubated in the dark at room temperature in the dark for 10 min, and the absorbance was measured at 540 nm using a microplate reader. Nitrite concentration was calculated based on a standard curve, serving as an indicator of plasma-derived reactive species accumulation. Hydrogen peroxide (H2O2) generated during plasma treatment was also tested using Ampliflu Red (Aladdin, Beijing, China) combined with horseradish peroxidase (HRP; Aladdin, Shanghai, China). Ampliflu Red reacts with H2O2 under the catalysis of HRP to produce fluorescence, enabling the quantification of H2O2 distribution and concentration within a microfluidic skin wound model chip created by plasma. According to the manufacturer’s instructions, Ampliflu Red and HRP were diluted to appropriate working concentrations. Before plasma treatment, the solution containing Ampliflu Red and HRP was added to the on-chip wound model to ensure uniform coverage of the entire test area. After plasma treatment, fluorescence signal changes were observed immediately using a microscope. Ampliflu Red reacts with H2O2 to produce fluorescence under HRP catalysis, allowing the quantification of H2O2 generation and transport based on fluorescence intensity and distribution. WE obtained cell culture medium samples after plasma treatment, and detected the fluorescence intensity changes excited at 570 nm using an enzyme-linked immunosorbent assay (ELISA) reader to evaluate the generation of H2O2.
All measurements were performed in triplicate, and the results were used to assess plasma discharge intensity and the persistence of its biochemical effects.
2.7. Quantification of KRT14 Expression in HaCaT Cells by qPCR
To investigate the potential molecular mechanisms by which cold atmospheric plasma promotes wound healing, the expression level of Keratin 14 (KRT14) in HaCaT cells was quantified using real-time quantitative PCR (qPCR). KRT-14 serves as a marker of basal keratinocytes, and its upregulation indicates epithelial activation and migratory responses during wound repair [
19]. At 12 h and 24 h post-treatment, HaCaT cells were collected from the upper channel of the chip, rinsed with PBS, and lysed using Trizol reagent (TSINGKE, Beijing, China) for total RNA extraction. RNA purity was assessed by spectrophotometry, and samples with an A260/A280 ratio between 1.8 and 2.1 were selected for reverse transcription using a commercial cDNA synthesis kit (TSINGKE, Beijing, China). qPCR was performed using a SYBR Green PCR Master Mix (TSINGKE, Beijing, China) on an ABI 7500 real-time PCR system. Each 20 μL reaction contained specific primers for KRT14 (target gene) and GAPDH (reference gene). The thermal cycling conditions were as follows: 95 °C for 30 s (initial denaturation), followed by 40 cycles of 95 °C for 5 s and 60 °C for 30 s. Each sample was analyzed in triplicate. Relative gene expression was calculated using the 2
−ΔΔCt method to compare KRT14 levels at different time points and evaluate the molecular response to CAP treatment.
2.8. Statistics
All data are presented as means ± standard deviation (SD). Two-tailed unpaired Student’s t-test was used to assess the significance of differences. Statistical significance was defined as follows: * p < 0.05, ** p < 0.01, *** p < 0.001. The number of replicates performed for each experiment varied between three and eleven. The exact number is indicated in the corresponding figure legend.
4. Discussion
This study presents an innovative microfluidics-based platform that integrates in situ cell culture, observation, and treatment, and demonstrates its application in investigating the biological effects of CAP on wound healing. By incorporating precise environmental control and continuous culture modules, this platform maintains stable conditions of temperature, humidity, and CO2, enabling long-term cell cultivation. Notably, the system supports in situ CAP treatment of skin-on-a-chip while preserving a sterile and stable environment. In addition, it facilitates continuous, real-time tracking and precise quantification of essential biological processes, including cell migration, proliferation, and metabolite production, via optical and colorimetric assays. This addresses a major limitation of conventional experimental approaches, where frequent environmental changes often distort tissue repair processes and obscure rapid biological responses. Consequently, this platform provides a powerful and high-resolution in vitro tool for in-depth, systematic investigation of CAP–biological system interactions, particularly in the context of wound healing, bridging a critical technological gap in the field.
One of the key advantages of this study lies in the successful construction and application of a biomimetic, double-layered skin-on-a-chip that replicates the structural and functional characteristics of native human skin with high fidelity. By co-culturing HaCaT keratinocytes and HSF fibroblasts on a porous membrane, the model reconstructs a skin architecture comprising epidermal and dermal equivalents, while simulating blood perfusion through microchannels. Compared with existing skin models [
20], the advantage of this system is that it can observe the wound healing status in real time, which means that during the culture process, the cell chip does not need to be displaced at all. Meanwhile, cell proliferation, budding, and other phenomena can be directly observed, allowing continuous and undisturbed tracking of key biological processes. Meanwhile, we systematically investigated the biological effects of CAP on wound healing, which accelerated wound closure by promoting both cell migration and proliferation. Time-lapse imaging showed enhanced collective migration and more rapid wound coverage in the CAP-treated group compared to controls. This observation was further supported by CCK-8 assays (
Figure 4e), which revealed increased cellular metabolic activity, and by the upregulation of FGF-2 secretion (
Figure 4f), indicating a CAP-induced boost in proliferative signaling.
Moreover, this biological effect is driven by the synergistic actions of multiple ROS and RNS generated by CAP. Our study demonstrates that the concentrations of nitrite and hydrogen peroxide both increase within the cellular microenvironment, representing a stable byproduct of RNS and a key molecule of ROS, respectively [
21]. Notably, these concentration levels exhibit a strong positive correlation with the rate of wound closure. We have demonstrated the critical role of RNS in tissue repair, with nitric oxide (NO), a major RNS component, effectively modulating inflammatory responses during wound healing and significantly promoting tissue regeneration [
21]. In the present study, the enhanced healing effects observed following CAP treatment, along with elevated nitrite levels in the cellular microenvironment, provide further validation of these earlier findings.
In addition, this study examined the expression dynamics of KRT14, a key marker protein of keratinocytes [
22]. Following CAP treatment, KRT14 mRNA levels exhibited a progressively accelerated downregulation within 24 h, which correlated with the enhanced wound closure rate. Importantly, this downregulation was not attributable to cytotoxic effects. On the contrary, CCK-8 assay results (
Figure 4e) indicated significantly higher metabolic activity in the CAP-treated cells compared to the control group throughout the observation period. In the later phases of wound re-epithelialization, as wound closure progresses, basal keratinocytes begin to differentiate and migrate into the suprabasal layers. This transition is accompanied by a physiological downregulation of KRT14 expression, reflecting the onset of epidermal maturation and stratification [
23,
24]. Accordingly, the more pronounced and earlier reduction in KRT14 expression observed in the CAP-treated group, particularly in the 1.5 min treatment group, suggests that CAP may accelerate the transition of keratinocytes from the proliferative and migratory phase to the differentiation and maturation phase. This provides molecular-level evidence supporting the role of CAP in promoting faster wound healing.
Despite the progress made, this study has certain limitations that warrant further investigation. While the current study offers valuable insights, several limitations remain to be addressed. First, on the biological level, although the in vitro skin model developed here successfully mimics the epidermal–dermal architecture, it lacks key components such as immune cells and a fully representative extracellular matrix. As a result, it does not fully capture the physiological complexity of the in vivo wound microenvironment. [
25]. Although HaCaT is a commonly used keratinocyte line [
26,
27], primary normal human keratinocytes might better reflect the human wound healing process [
28], and can be considered for future research. Meanwhile, the number of replicates in some omics-related experiments was limited in this study, and future work should include larger sample sizes to improve statistical reliability [
29]. In addition, biomarker analysis in this study employed methods appropriate to the characteristics of each target. For example, ELISA was used to quantify the secreted protein FGF-2, while qPCR was used to assess the gene expression of the intracellular structural protein KRT14. However, cross-validation of key biomarkers at both the protein and transcript levels would provide a more rigorous basis for mechanistic interpretation [
30]. Moreover, this study focused primarily on the short-term biological effects of CAP treatment, whereas its impact on longer-term processes such as tissue remodeling remains to be elucidated [
31].
The integrated microfluidic platform developed in this study offers substantial potential beyond its immediate application in wound healing research. The core design principles and methodologies are broadly applicable to other emerging biomedical areas involving cold atmospheric plasma, such as cancer therapy and antimicrobial treatment. Owing to its modular architecture, the platform enables high-throughput screening, which is essential for the systematic optimization of treatment parameters, the evaluation of novel biomaterials, and the identification of synergistic drug combinations. This versatility not only enhances the efficiency of fundamental research in plasma medicine but also provides a robust framework for the development of data-driven and personalized therapeutic strategies.


 ,
, 
