Abstract
To express and purify staphylococcal enterotoxin M (SEM) using immobilized metal affinity chromatography (IMAC), a signal peptide-truncated (ΔNsp) wild-type SEM (SEMWT) was N-terminally fused in pET-28a(+) to a polyhistidine tag (His6×-) and thrombin cleavage site (TCS; LVPR↓GS), generating His6×-TCS-ΔNspSEMWT. Unexpectedly, 4 °C desalting reduced the fusion protein’s molecular weight by ~2.0 kDa on sodium dodecyl sulfate-polyacrylamide gel electrophoresis (SDS-PAGE). N-terminal sequencing and mass spectrometry identified cleavage specifically at the arginine (R) and glycine (G) peptide bond (R–G bond) within the TCS motif. AlphaFold 3 revealed an exposed serine protease catalytic triad: histidine 172, serine 178, and aspartic acid 212 (H172/S178/D212) in the β-grasp domain, suggesting intrinsic thrombin-like activity (TLA). Sequential IMAC and size-exclusion high-performance liquid chromatography (SE-HPLC) purification eliminated contaminant concerns, while chromogenic substrate S-2238 (S-2238) assays demonstrated increasing specific activity and purification fold, supporting intrinsic TLA. Critically, the mutation of serine at position 178 to alanine (His6×-TCS-ΔNspSEMS178A) abolished TLA but preserved the secondary/tertiary structure, confirming the activity’s origin within the wild-type construct. Molecular dynamics (MD) simulations probed the atomistic mechanism for specific R–G bond cleavage. This work establishes a foundation for understanding ΔNspSEMWT’s TLA.
Keywords:
staphylococcal enterotoxin M; His6×-TCS-ΔNspSEMWT fusion protein; thrombin-like activity; thrombin cleavage site sequence (LVPR↓GS); immobilized metal affinity chromatography; chromogenic substrate S-2238; size-exclusion high-performance liquid chromatography; AlphaFold 3; serine protease triad (H172/S178/D212); mutant His6×-TCS-ΔNspSEMS178A fusion protein; molecular dynamics simulations 1. Introduction
Staphylococcus aureus (S. aureus), a Gram-positive opportunistic pathogen [1], colonizes respiratory epithelia and skin. Its virulence and antibiotic resistance stem largely from mobile genetic elements (MGEs) encoding critical host adaptation factors [2]. Among diverse virulence determinants, staphylococcal enterotoxins (SEs) represent notable pyrogenic toxin superantigens (SAgs) [3]. With high sequence homology, SEs induce immune hyperactivation, potentially causing toxic shock and death [4]. This SE superfamily comprises 29 members, classified as classical SE serotypes (A, Bn, Cn, D, E, G), staphylococcal enterotoxin-like (SEl) variants (H, I, J-X), and toxic shock syndrome toxin-1 (TSST-1). According to International Nomenclature Committee for Staphylococcal Superantigens (INCSS) recommendations [5], the SE/SEl nomenclature distinguishes members with demonstrated emetic activity [6].
The enterotoxin gene cluster (egc), harbored within genomic island υSa and encoding SEM, was identified in 2001 [7]. Recombinant SEM (rSEM) induces selective T-cell expansion via specific TCR Vβ interactions. Following egc’s recognition as a prevalent enterotoxin reservoir, research has focused on SEM-associated pathogenesis [8,9,10,11,12,13], confirming potent T-cell activation [14]. Nevertheless, the structural basis for SEM-mediated TCR Vβ/MHC II binding remains undefined, necessitating future high-resolution ternary complex analysis. Unlike classical SEs, SEM (SEI-group) exhibits weaker emetic potency than SEA [15,16] but contributes to staphylococcal food poisoning (SFP). While SEA’s emetic mechanism involves mucosal translocation, mast cell 5-HT release, and vagal activation [17], SEM’s pathway—particularly mucosal transport and mast cell interactions—remains elusive. In contrast to SEA, SEM’s intestinal translocation remains uncharacterized, although it induces inflammation in bovine mammary epithelia [18].
All SEs share a conserved fold: (1) an N-terminal β-barrel domain, (2) a C-terminal β-grasp fold, and (3) a central diagonal α-helix. Structural variations classify SEs into five evolutionary groups (I–V) [19], with SEM in group V. Group V SAgs (e.g., SEK, SEM, SEQ, SEV [20]) lack the emetic cysteine loop but retain group III/IV-like MHC II binding sites. Crucially, SEM possesses a distinctive 15-residue α3-β8 loop dictating TCR Vβ specificity and superantigenicity [21]. We encountered constraints studying SEs due to low native protein yield and purity from S. aureus. Therefore, we employed recombinant expression in E. coli. Following purification by IMAC and desalting via centrifugal ultrafiltration (Section 2.2 and Section 2.3), the engineered His6×-TCS-ΔNspSEMWT fusion protein underwent unexpected autocleavage at the TCS R–G bond (LVPR↓GS). This self-proteolytic activity indicates intrinsic TLA within the fusion protein, serendipitously revealing previously unrecognized enzymatic properties meriting systematic exploration.
2. Materials and Methods
2.1. Constructing Multiple Prokaryotic Expression Plasmids for SEM Protein and S178A Mutant
SignalP 4.1 [22] predicted an N-terminal signal peptide in SEM, consistent with secretion. The wild-type sem gene (GenBank: ADC37996) was PCR-amplified from S. aureus SA003 genomic DNA, isolated using a commercial kit. The mutant sem gene (S178A) was commercially synthesized. Both genes, lacking signal peptides (ΔNspSEMWT and ΔNspSEMS178A), were directionally cloned into pET-28a(+) vectors using introduced NdeI and XhoI sites.
To eliminate thrombin contamination risk, dedicated equipment and workspaces were strictly isolated. Structural comparison of ΔNspSEMS178A to wild-type ΔNspSEMWT required removal of the His6×-tag from His6×-TCS-ΔNspSEMS178A. For thrombin-free processing, a mutant sem gene (S178A) encoding an N-terminal His6×-tag (including NdeI site) followed by a SUMO-tag, based on pSmart I, was commercially synthesized (His6×-SUMO-ΔNspSEMS178A). This mutant sem gene (S178A) fragment also included a 3′ XhoI site with protective bases and was cloned into pSmart I using its native NdeI and XhoI sites. This strategy permits specific cleavage using SUMO protease, which recognizes the SUMO-tag’s C-terminal x-G-G-x motif and hydrolyzes the peptide bond after GG, releasing target ΔNspSEMS178A protein. All recombinant plasmids were sequence-verified before transformation into E. coli Rosetta (DE3) for expression.
2.2. Prokaryotic Expression and Purification of SEM and SEM (S178A) Mutant Fusion Protein
E. coli Rosetta (DE3) strains harboring pET-28a(+) or pSmart I recombinant plasmids were grown overnight at 37 °C in Luria–Bertani (LB) medium containing 30 μg/mL kanamycin or 100 μg/mL ampicillin, respectively. Following a 1:100 dilution into fresh medium, cultures were grown to OD600nm ≈ 0.6. Protein expression was induced with 0.5 mmol/L isopropyl β-D-1-thiogalactopyranoside (IPTG) for 4–12 h. Cells were harvested by centrifugation (4000× g, 10 min, 4 °C), washed and resuspended in 20 mL buffer A (50 mmol/L Tris-HCl, 500 mmol/L NaCl, pH 8.0). After sonication and centrifugation (10,000× g, 20 min, 4 °C), the supernatant was subjected to IMAC. Contaminants were removed with buffer A containing 50 mmol/L imidazole, and His6×-tagged fusion proteins (His6×-TCS-ΔNspSEMWT, His6×-TCS-ΔNspSEMS178A and His6×-SUMO-ΔNspSEMS178A) were eluted using buffer A with 500 mmol/L imidazole. Protein purity was confirmed by SDS-PAGE, with storage at 4 °C (short-term) or −80 °C (long-term).
Prior to SE-HPLC and TLA assays (Section 2.8), the buffer for His6×-TCS-ΔNspSEMWT was exchanged to buffer B (1 mmol/L Na2HPO4-NaH2PO4, 500 mmol/L NaCl, pH 7.4) before ultrasonication. The high salt concentration in buffer B suppressed TLA activity to prevent unintended cleavage during processing; activity was restored by centrifugal ultrafiltration and desalting (Section 2.3).
To confirm TLA loss in the catalytic triad mutant His6×-TCS-ΔNspSEMS178A, the purified protein in buffer A underwent identical centrifugal ultrafiltration desalting as the wild type (Section 2.3). This exchanged the buffer to low-sodium buffer C (1 mmol/L Na2HPO4-NaH2PO4, pH 7.4; [NaCl] < 1 mmol/L). Desalted samples equilibrated at 4 °C for varying durations were analyzed by SDS-PAGE (Section 2.3).
For His6×-SUMO-ΔNspSEMS178A, imidazole was removed by centrifugal ultrafiltration after IMAC purification, and the buffer exchanged to facilitate SUMO protease cleavage. Following overnight digestion at 4 °C with SUMO protease, the mixture was applied to Ni-NTA resin. The His6×-SUMO tag bound to the resin in the absence of imidazole, while the cleaved, untagged ΔNspSEMS178A flowed through. The resin was regenerated with 500 mmol/L imidazole to remove the bound tag. Purified ΔNspSEMS178A was desalted into NaCl-free buffer C via centrifugal ultrafiltration (Section 2.3) for subsequent circular dichroism (CD) and intrinsic fluorescence emission spectroscopy analyses (Section 2.9).
2.3. Desalting and Exchange of the Fusion Protein Buffer System via Centrifugal Ultrafiltration
For removal of the N-terminal His6×-tag, the purified protein was desalted via centrifugal ultrafiltration (Amicon® Ultra Centrifugal Filter, manufactured by Merck Ltd, Chengdu, Sichuan Province, China, 10 kDa MWCO, sample volume 15 mL) into buffer C. The three-stage ultrafiltration protocol comprised: (I) concentrating the 15 mL Ni-affinity purified sample to ≤1.5 mL by refrigerated centrifugation (4 °C, 4000~6000× g); (II) equilibrating the buffer by diluting to 15 mL with buffer C followed by re-concentration; (III) repeating Stage II three times to reduce NaCl and imidazole concentrations to ≤1 mmol/L, thereby equilibrating the His6×-TCS-ΔNspSEMWT and His6×-TCS-ΔNspSEMS178A fusion protein in fresh buffer C. The buffer-exchanged sample (day 0) and aliquots collected at intervals (0.5, 1, 2, 3, 6, 10 days) during 4 °C storage were analyzed by SDS-PAGE. All samples were immediately mixed with SDS/β-mercaptoethanol, heat-denatured (100 °C, 10 min), flash-frozen in liquid N2, and stored at −80 °C until analysis.
When subsequent gel filtration (Section 2.6) and TLA measurement with S-2238 (Section 2.8) was required, buffer B (500 mmol/L NaCl) replaced buffer C during ultrafiltration. This substitution eliminated imidazole while maintaining ionic strength, preventing spontaneous R–G peptide bond hydrolysis in the TCS of His6×-TCS-ΔNspSEMWT under low-salt conditions.
2.4. Analysis of Fusion Protein Primary Structure by Mass Spectrometry (MS) and N-Terminal Sequencing
Protein samples were resolved by SDS-PAGE. The target band was excised from the gel using a sterile blade and collected in a 1.5 mL microcentrifuge tube. Gel fragments were hydrated with ultrapure water to prevent dehydration prior to submission for mass spectrometry analysis (Beijing Protein Innovation Co., Ltd., Beijing, China, or Sangon Biotech (Shanghai) Co., Ltd., Shanghai, China). For N-terminal sequencing, the corresponding gel fragment was similarly processed and submitted to Sangon Biotech (Shanghai, China) Co., Ltd. (Shanghai, China) with hydration maintenance. Technical replicates were electrophoresed in parallel, with target bands digitally captured using a gel imaging system. Reference images were shared with service providers to confirm band positional accuracy.
2.5. Calibration of Gel Filtration Column via Protein Markers Using HPLC
A gel filtration protein molecular weight marker kit (12-200 kDa, Sigma-Aldrich® catalog number: MWFG200, Jakarta Timur, Indonesia) was analyzed using an Agilent® 1100 Series HPLC system (manufactured by Agilent Technologies, Santa Clara, CA, USA) equipped with a Waters™ XBridge Protein BEH SEC column (7.8 × 300 mm, 3.5 μm; manufactured by Waters™, Milford, MA, USA), autosampler, and variable wavelength detector (VWD). Isocratic elution employed buffer B at 0.86 mL/min with UV detection at 280 nm. Protein markers and blue dextran were prepared in buffer B: cytochrome C (horse heart, 12.4 kDa, 2 mg/mL), carbonic anhydrase (bovine erythrocytes, 29 kDa, 3 mg/mL), bovine serum albumin (66 kDa, 10 mg/mL), alcohol dehydrogenase (yeast, 150 kDa, 5 mg/mL), β-amylase (sweet potato, 200 kDa, 4 mg/mL), and blue dextran (2000 kDa, 2 mg/mL). The mixture (10 μL injection volume) was chromatographed at 25 °C. Elution volumns (Ve) were determined from injection to peak maximum. The void volume (V0) was similarly determined using blue dextran. Given the packed bed total volume (Vt) as 7 mL (column manual), apparent partition coefficients (Kav) were calculated as Kav = (Ve − V0)/(Vt − V0). A calibration curve was generated by plotting log-transformed molecular weights versus corresponding Kav values.
2.6. SE-HPLC Purification of the Ni-Affinity-Purified His6×-TCS-ΔNspSEMWT Fusion Protein
To eliminate Tris-base interference in ultraviolet (UV) spectra (Section 2.2), proteins from IPTG-induced cells were extracted via sonication in buffer B. Crude lysate aliquots were analyzed for His6×-TCS-ΔNspSEMWT fusion protein expression by SDS-PAGE with coomassie/silver staining, while TLA was assessed chromogenically (Section 2.8). Ni-affinity purification followed Section 2.2 with modifications: elution employed 500 mmol/L imidazole in buffer B. Eluate purity was verified by both staining methods. Before TLA assessment, imidazole was removed by centrifugal ultrafiltration (Section 2.3) with Buffer B exchange. For size-based purification, 100 μL Ni-eluted protein was loaded directly onto the SE- chromatographic column under molecular weight determination conditions (Section 2.5). Chromatographic peaks were fractionated and analyzed via SDS-PAGE, silver staining and TLA. Notably, SE-HPLC separated macromolecular proteins from low-molecular-weight imidazole, eliminating dialysis requirements. Thus, centrifugal ultrafiltration dialysis was unnecessary before chromatographic loading. To ensure chromatographic purity, 100 μL fractions from the initial SE-HPLC run were subjected to two subsequent purification rounds under identical conditions, with collected fractions retained for downstream analyses.
2.7. Bradford-Based Quantification of His6×-TCS-ΔNspSEMWT Fusion Protein
Protein concentrations in the crude extract (prepared by sonication), Ni-affinity chromatography eluent, and gel filtration eluent were quantified using the Bradford protein assay kit (TIANGEN BIOTECH, Beijing, Co., Ltd.; catalog number: PA102, Beijing, China), following the manufacturer’s instructions. A bovine serum albumin (BSA) standard curve was generated for total protein quantification.
2.8. Chromogenic Analysis of TLA in His6×-TCS-ΔNspSEMWT Fusion Protein
The chromogenic substrate S-2238 (H-D-Phe-Pip-Arg-pNA 2HCl) incorporates a p-nitroaniline (pNA) leaving group attached via an amide bond. Thrombin recognizes the arginine residue and hydrolyzes this bond, releasing pNA, which absorbs at 405 nm. Activity quantification relies on continuous kinetic monitoring of absorbance at 405 nm. To evaluate TLA in recombinant His6×-TCS-ΔNspSEMWT protein, positive and negative controls were implemented. Positive controls: Pre-incubated (37 °C, 15 min) aliquots of bovine thrombin stock (1 U/mL in buffer C with 150 mmol/L NaCl; 10 µL), S-2238 (3 mmol/L in buffer C with 150 mmol/L NaCl; 10 µL), and buffer C (150 mmol/L NaCl; 150 µL) were sequentially combined in a 96-well plate in the order buffer → substrate → enzyme, yielding a final volume of 170 µL. Reactions were initiated upon mixing, and hydrolysis rates were determined from the linear slope of absorbance (405 nm) versus time. Negative controls: Thrombin was replaced with an equal volume of buffer C (150 mmol/L NaCl) to quantify non-enzymatic hydrolysis. These controls confirmed serine protease-responsive detection (positive) and minimized background hydrolysis during incubation (negative), enabling precise enzymatic quantification. TLA in recombinant His6×-TCS-ΔNspSEMWT was confirmed by time-dependent increases in 405 nm absorbance, consistent with positive controls. Activity was assessed at three purification stages: (1) Crude E. coli lysate: Lysate (51 µL; 500 mmol/L NaCl), NaCl-free S-2238 (10 µL; 3 mmol/L), and NaCl-free buffer C (109 µL) were pre-incubated (37 °C, 15 min) and mixed (final NaCl: 150 mmol/L). Activity was quantified as for positive controls (triplicate measurements). (2) IMAC-purified protein: Protein (51 µL; 500 mmol/L NaCl post-ultrafiltration), NaCl-free S-2238 (10 µL), and NaCl-free buffer C (109 µL) were processed identically to (1). (3) SE-HPLC-purified protein: Analyzed as in (2).
2.9. Characterization of Recombinant Wild-Type ΔNspSEMWT and Mutant ΔNspSEMS178A Proteins by CD and Intrinsic Fluorescence Emission Spectroscopy
CD measurements were performed using an AVIV Model 400 spectropolarimeter (Aviv Biomedical, Inc., Lakewood, NJ, USA) equipped with a thermoelectrically controlled cell holder. Protein samples (ΔNspSEMWT and ΔNspSEMS178A, 0.2 mg/mL, 25 °C) in 0.5 mm pathlength quartz cuvettes were analyzed. Far-UV spectra (190~260 nm) were acquired under nitrogen purge with a 1 nm bandwidth, 50 nm/min scan rate, 1 nm data pitch, and signal-averaged over three scans. All spectra underwent sequential processing: (i) solvent baseline subtraction using matched buffer controls and (ii) conversion to mean residue ellipticity ([θ]MRW, deg·cm2·dmol−1) using [θ]MRW = (θobs × MRW)/10 × l × c, where l is pathlength (cm), c is concentration (mg/mL), MRW is mean residue weight (g/mol), and θobs is observed ellipticity (mdeg).
Fluorescence emission spectra were recorded on a Hitachi F-4500 spectrofluorometer (Hitachi High-Tech, Tokyo, Japan) equipped with a thermostated water circulator. Spectra (300~400 nm) were acquired at an excitation wavelength of 295 nm and averaged over triplicate scans. Fluorescence intensities were corrected sequentially: (i) solvent blank subtraction, (ii) inner filter effect correction using: Fcor = Fobs × e(Aex+Aem)/2, where Fcor and Fobs are corrected and observed intensities, respectively, and Aex and Aem are absorbances at excitation and emission wavelengths, and (iii) normalization to the initial intensity at 25 °C to eliminate thermal quenching effects. All reported fluorescence intensities are corrected values.
2.10. Preparation of the TLA Tag-Free ΔNspSEMWT Protein and Its Complex with Substrate His6×-TCS-ΔNspSEMWT for Subsequent MD Simulations
We employed AlphaFold 3 [23] to generate reliable structural models of the His6×-TCS-ΔNspSEMWT fusion protein and tag-free ΔNspSEMWT protein. These predicted structures served as initial coordinates for MD simulations. Following 40 ns of equilibration (confirmed by stabilized RMSD), we extended simulations by 10 ns and randomly selected 50 conformations per variant from the final trajectory. Using Packmol 17.333 [24], we constructed 50 enzyme–substrate complexes by constraining the distance between S178-OG6543 (ΔNspSEMWT) and R17-C251 (His6×-TCS-ΔNspSEMWT) to 2–6 Å, consistent with serine protease catalytic geometry. To address Packmol’s rigid-body limitation, we applied five heating–cooling cycles (0–350 K at 350 K/ns) for conformational refinement. Fifty annealed complexes exhibiting 3–4 Å catalytic spacing between S178-OG6543 and R17-C251 were randomly selected as initial MD structures (Section 2.10).
2.11. MD Simulations of Enzyme (ΔNspSEMWT) and Substrate (His6×-TCS-ΔNspSEMWT) Complex
All simulations used GROMACS 2019.5 [25] with the AMBER14SB force field [26] under periodic boundary conditions. The ΔNspSEMWT and His6×-TCS-ΔNspSEMWT complex was solvated in a 113.18 Å cubic box (maintaining ≥ 14 Å protein-wall clearance) with TIP3P water. Systems underwent energy minimization via steepest descent (convergence: 1000 kJ/(mol·nm); step size: 0.01 nm), followed by 30 ps position-restrained equilibration (protein fixed, solvent relaxed). Production simulations (150 ns) maintained 298.15 K using the Berendsen thermostat (λ = 0.5 ps; solute-solvent decoupled) and 1 bar pressure via the Parrinello–Rahman barostat (τ = 1.0 ps; isothermal compressibility = 4.5 × 10⁻⁵ bar−1). Electrostatics employed 15 Å short-range cutoffs and Particle Mesh Ewald (PME) for long-range interactions, with 1.2 Å grids and fourth-order splines.
3. Results and Discussion
3.1. Desalting-Induced Autocatalytic Activation of His6×-TCS-ΔNspSEMWT and Proteolytic Degradation Observed by SDS-PAGE
Due to the absence of SEM crystal structures, we predicted its 3D model using AlphaFold 3 (global pLDDT score: 93.51, pTM score: 0.93) and Swiss-Model [27] (Figure 1a). Structural alignment yielded a Cα-RMSD of 3.6 Å, indicating minimal backbone divergence. Like all SEs, SEM exhibits three conserved motifs: an N-terminal OB-fold domain with β-barrel and exposed cysteine (Cys93) for disulfide bonding; a C-terminal β-grasp domain containing antiparallel β-strands and a Zn2+-binding site [28] coordinated by histidine 190, histidine 228, and aspartic acid 230 (H190/H228/D230); and interconnected by a central diagonal α-helix. The His6×-TCS-ΔNspSEMWT fusion protein was purified via IMAC in buffer A (Figure 1b, lane 1), exhibiting an apparent mass of ~27 kDa consistent with its calculated mass. Minor dimeric/tetrameric species indicated residual aggregation. Prior to characterization, buffer exchange into a low-salt buffer C (<1 mmol/L NaCl) via centrifugal ultrafiltration (4 °C, Section 2.3) eliminated imidazole and optimized conditions for thrombin cleavage at the TCS R–G bond. Unexpectedly, SDS-PAGE revealed a sharp novel band below the parental protein after buffer exchange (Figure 1b, lane 2), despite no protease addition. The sharp bands without smearing strongly suggest site-specific autocatalysis in this Ni-affinity purified protein. This unprecedented self-cleavage under low ionic strength implies intrinsic protease-like activity in the His6×-TCS-ΔNspSEMWT fusion construct.
Figure 1.
Structural prediction of SEM, IMAC purification of the His6×-TCS-ΔNspSEMWT fusion protein, site-specific cleavage at R–G bonds within TCS motif and MS validation of the recombinant fusion protein. (a) SEM structure prediction using AlphaFold 3 (solid) and Swiss-Model homology modeling (transparent). (b) Unexpected proteolytic cleavage at the TCS R–G bond following ultrafiltration desalting. Lane 1: IMAC-purified His6×-TCS-ΔNspSEMWT; Lane M: molecular weight markers; Lane 2: Desalted fusion protein. (c) Time-course validation of TCS-specific cleavage. Lane M: Markers; Lane 1: IMAC-purified fusion protein; Lanes 3~9: Samples stored at 4 °C after desalting (0, 0.5, 1, 2, 3, 6, 10 days). (d) Peptide score distribution. (e) Protein score distribution. (f) Protein view. (g) Peptide view. Original images can be found in Supplementary Materials.
This finding intrigued us, as SEM protease-like activity remained unreported since its initial characterization by S Jarraud et al. in 2001 [7]. To preclude artifacts from exogenous proteases, we rigorously followed protocols (Section 2.2 and Section 2.3) using fresh reagents, a new plasmid kit, commercial sequencing, and newly transformed E. coli. Lysate was purified/desalted with new Ni-NTA media and Amicon® Ultra filters through repeated exchanges into salt-free buffer C (<1 mmol/L NaCl). Samples included: (1) “0 day” (immediately post-exchange), and (2) aliquots stored statically at 4 °C for 0.5–10 days. Salt-free samples and IMAC-purified high-salt (500 mmol/L NaCl) controls underwent SDS-PAGE. Figure 1c shows desalted day 0 samples (lanes 0 d) exhibiting two bands (faint, intense), indicating autocatalytic conversion. The degradation product intensified by day 0.5, stabilizing through day 10, while the parental 27-kDa band disappeared by day 1. A minor 16-kDa band emerged at day 0, intensified slightly by day 3, and persisted. Site-specific proteolysis was confirmed by absent nonspecific degradation. The observed 2-kDa shift corresponds to the theoretical His6×-tag mass (1.9 kDa) from pET-28a(+). Thus, we propose that His6×-TCS-ΔNspSEMWT autocatalytically cleaves the TCS sequence (LVPR↓GS) at R–G, liberating the His6×-tag. To validate this, the novel 25-kDa band (Figure 1c, lane 1 d, black arrow) was excised for MS and N-terminal sequencing. Figure 1d–g presents MS results: peptide scores > 28 were significant (p < 0.05), indicating confident matches between MS/MS spectra and Mascot-searched peptide sequences (Figure 1d). One protein showed a strongly significant match (score 77,111; Figure 1e). High sequence coverage (87%; Figure 1f) confirms identification. Moreover, the sequence aligns with signal-peptide-removed SEM (GenBank: D0K667), with 96.3% coverage. Crucially, no His6×-tag peptides were detected by MS, confirming His6×-tag removal during desalting and storing at 4 °C. N-terminal sequencing identified GSXMDVGVLN (Supplementary Materials). Position 3 (X) yielded undetectable PTH-amino acids; given PTH-cysteine exclusion from Edman chemistry, X was assigned as cysteine (C). Our design intended thrombin cleavage to generate N-terminal GSHMDVGVLN (tetrapeptide GSHM from vector; hexapeptide DVGVLN from ΔNspSEM’s native N-terminus). The sole discrepancy was position 3 (C instead of H), which does not invalidate the demonstrated TLA in the His6×-TCS-ΔNspSEMWT fusion protein cleaving at R–G bond, releasing ΔNspSEM with GSXMDVGVLN N-terminus.
In summary, the 25-kDa band confirms specific R–G bond proteolysis in His6×-TCS-ΔNspSEMWT, demonstrating intrinsic TLA. This recombinant protein exhibits desalting-activated, NaCl-inhibited TLA that specifically cleaves the TCS R–G peptide bond.
3.2. Two-Step Purification via IMAC Followed by SE-HPLC and S-2238-Based Chromogenic Detection of His6×-TCS-ΔNspSEMWT
Single-step IMAC may incompletely remove proteolytic enzymes from bacterial lysates. We therefore employed sequential IMAC/SE-HPLC purification and evaluated TLA of the purified His6×-TCS-ΔNspSEMWT fusion protein using S-2238 at different stages. First, the SE-chromatographic column was calibrated with protein markers (Section 2.5). Figure 2a shows five well-resolved symmetrical peaks corresponding to these markers. Only blue dextran (for V0 determination) exhibited fronting peak, reflecting inherent molecular heterogeneity. A calibration curve (Figure 2e) plotting log molecular weights against Kav established an SE-HPLC system suitable for target protein separation and apparent molecular weight determination. Prior to assessing TLA of the fusion protein, we verified the detection system reliability using a positive control (Section 2.8). Figure 2h shows a clear linear increase in ΔA405 nm (+0.183) over 20 h at 37 °C, demonstrating that S-2238, efficiently hydrolyzed by thrombin to release pNA, shows potential as a suitable substrate for the TLA-exhibiting protein. Negative controls confirmed S-2238 chemical stability, showing minimal spontaneous hydrolysis (ΔA405 nm ≤ 0.003 over 20 h at 37 °C, Figure 2h, blue points). Consequently, control experiments validated the S-2238-based assay for accurate TLA quantification. Following the Section 2.8 protocol, we quantified TLA of the His6×-TCS-ΔNspSEMWT fusion protein using this validated assay. Soluble lysates prepared by sonication in buffer B (Section 2.2) exhibited significant TLA (A405 nm = 0.440 after 20 h at 37 °C, Figure 2i, red dots), confirming the protein’s ability to hydrolyze S-2238 and release pNA. TLA was thus quantified by measuring ΔA405 nm over time. Sonicated lysates showed an elevated baseline (A405 nm = 0.150) due to unidentified pigments, yet still demonstrated a substantial ΔA405 nm increase (+0.290). SDS-PAGE confirmed efficient fusion protein expression at the predicted molecular weight (Figure 2f,g, lane 1).
Figure 2.
The His6×-TCS-ΔNspSEMWT fusion protein was purified to chromatographic homogeneity by IMAC followed by SE-HPLC, with TLA quantification after each step. (a) SE-HPLC analysis of protein molecular weight markers according to Section 2.5. (b) The IMAC-purified fusion protein was further purified by SE-HPLC. (c) SE-HPLC purification of the 9.655-min fraction from (b). (d) SE-HPLC repurification of the 9.641-min fraction from (c). (e) SE-HPLC calibration curve using protein molecular weight markers. (f) SDS-PAGE (coomassie brilliant blue) of purified fusion protein. Lane M: Protein markers; Lane 1: Crude extract via ultrasonication; Lane 2: IMAC-purified fusion protein; Lane 3: Fractions (9.655 min) from the first round of SEC-HPLC purification; Land 4: Fractions (9.641 min) from the secondary round of SEC-HPLC purification. (g) Silver-stained SDS-PAGE of purified fusion protein. Lane M, Lane 1~3: Samples identical to (f). (h) Validation of the S-2238-based TLA assay using positive and negative controls. (i) TLA activity monitoring via S-2238 hydrolysis during purification. Original images can be found in Supplementary Materials.
However, crude lysates obtained by ultrasonic disruption contained significant host-derived contaminants. We therefore employed IMAC as the initial purification step, following the protocol established in Section 2.2. SDS-PAGE analysis of the IMAC-purified fusion protein (Figure 2f,g, lane 2) revealed a prominent monomer band (27 kDa), a faint dimer band (54 kDa), and diffuse lower molecular weight bands, confirming efficient purification. Notably, using phosphate buffer instead of Tris-HCl for sonication and IMAC (Section 2.2) demonstrated that spontaneous hydrolysis at the R–G bond within the TCS motif was buffer-independent, but critically suppressed by high ionic strength (500 mmol/L NaCl). Following imidazole removal by centrifugal ultrafiltration, we quantified TLA of the IMAC-purified protein (Section 2.3 and Section 2.8). The ΔA405nm (+0.178) increase after 20 h (Figure 2i, green circles) was comparable to the thrombin positive control rate (Figure 2h, violet circles), demonstrating that IMAC enhanced purity while preserving TLA. This IMAC step yielded an electrophoretically pure, TLA-active fusion protein His6×-TCS-ΔNspSEMWT. To eliminate low-abundance contaminants below 27 kDa (Figure 2f,g, lane 2), we performed a second purification step using SE-HPLC (Section 2.6). Analysis revealed four symmetrical peaks at 9.173, 9.665, 10.935, and 11.392 min (Figure 2b). Calibration identified species of 83.5, 56.8, 21.0, and 14.7 kDa. Correlating with the theoretical mass (27.136 kDa) and SDS-PAGE migration (27 kDa), these data indicate a predominant dimeric conformation (56.8 kDa at 9.665 min) in buffer B, alongside minor trimer (83.5 kDa), monomer (21.0 kDa), and proteolytic fragment (14.7 kDa) populations. The dimeric fractions eluting at 9.665 min (56.8 kDa) were pooled. SDS-PAGE analysis (Figure 2f,g, lane 3) showed dissociation during denaturation to a prominent 27 kDa monomer band. Both coomassie blue and silver staining indicated high purity, with only trace dimer remaining. TLA analysis of this fraction (Section 2.8) revealed a ΔA405nm increase of +0.037 (Figure 2i, green dots), exceeding the negative control but below the positive control, confirming detectable TLA.
The 9.665 min fraction from the first SE-HPLC round was further purified by a second SE-HPLC separation. Re-analysis confirmed the chromatographically pure fusion protein dimer eluted predominantly at 9.641 min, accompanied by a minor monomer at 10.954 min (Figure 2c). SDS-PAGE of the 9.641-min fraction (Figure 2f,g, lane 4) matched the profile from the first SE-HPLC dimer purification (Figure 2f,g, lane 3). A third SE-HPLC cycle of this dimer fraction (9.641 min) yielded a major peak at 9.656 min and a minor peak at 10.951 min, with elution profiles superimposing on previous cycles. The absence of trimer and fragments during secondary and tertiary SE-HPLC, coupled with retention time consistency, demonstrates a dimer-monomer equilibrium in buffer B, confirming the His6×-TCS-ΔNspSEMWT fusion protein dimer as the predominant conformation. In summary, chromatographically pure His6×-TCS-ΔNspSEMWT fusion protein was obtained via sequential IMAC and SE-HPLC. This protein existed predominantly as dimers under high-salt conditions, wherein its TLA was suppressed. Reducing salt concentration restored TLA, enabling slow hydrolysis of S-2238.
Table 1 outlines the purification scheme for bacterially expressed fusion protein His6×-TCS-ΔNspSEMWT. Sequential IMAC/SEC-HPLC achieved 7.059-fold TLA purification from crude lysates, yielding chromatographically pure protein with 0.360 U/mg specific activity and 0.09% recovery. This measurable yet modest purification confirms successful isolation of functional His6×-TCS-ΔNspSEMWT fusion protein. The limited purification efficiency and catalytic parameters suggest either suboptimal S-2238 recognition by this fusion protein or potential inhibition of S-2238 proteolysis under physiological buffer conditions. Collectively, we demonstrate successful expression, purification and structural characterization of His6×-TCS-ΔNspSEMWT fusion protein, which predominantly forms NaCl-stabilized dimers (500 mmol/L NaCl).

Table 1.
Purification steps for His6×-TCS-ΔNspSEMWT fusion protein expressed in E. coli.
3.3. Impact of Ionic Strength, PH and Substrate on TLA in His6×-TCS-ΔNspSEMWT Fusion Protein
Following IMAC purification of His6×-TCS-ΔNspSEMWT via imidazole elution, buffer B (500 mmol/L NaCl) replaced the imidazole/NaCl-containing buffer using centrifugal ultrafiltration (Section 2.3). The imidazole-free fusion protein in high-salt buffer B (500 mmol/L NaCl) was incubated at 37 °C for 10 days. Aliquots collected daily (days 1~6, 8, 10) showed no autoproteolysis by SDS-PAGE, confirming full-length integrity under conditions optimal for thrombin activity (Figure 3a). Parallel samples in NaCl-supplemented buffer B (lacking imidazole) were stored at 37 °C for identical durations (1~6, 8, 10 days), then desalted into NaCl-free buffer C via centrifugal ultrafiltration (Section 2.3) until [NaCl] < 1 mmol/L. Subsequently, all desalted samples were subjected to incubation at 37 °C for 6 h prior to SDS-PAGE analysis. SDS-PAGE revealed that 6-h incubation at 37 °C induced autoproteolysis, releasing ΔNspSEMWT (Figure 3b). These results demonstrate that TLA activation requires low ionic strength and is suppressed in high-salt environments. The observed TLA suggests mechanistic parallels with thrombin’s serine proteolytic activity. AlphaFold 3 structural modeling (Figure 3f) identified the canonical catalytic triad (H172/S178/D212) [29] on the β-grasp domain surface. This integration of experimental and computational data demonstrates intrinsic serine protease activity. Consequently, pH-dependent regulation occurs through protonation/deprotonation of catalytic H172, explaining TLA suppression under both acidic (pH 2.0~5.5) and alkaline (pH 10.0~12.0) conditions. To examine pH effects, buffer exchange from buffer B to salt-free buffer C at various pH values was performed using IMAC-purified protein. Subsequent 24-h proteolytic reactions at 4 °C revealed maximal TLA activation in neutral-to-weakly-basic environments (pH 6.5~9.0). The fusion protein demonstrated TCS motif recognition and R–G peptide cleavage, enabling autonomous His6×-tag excision. This establishes signal peptide-deficient ΔNspSEMWT as a promising enzymatic tool for His6×-tag removal in prokaryotic and eukaryotic systems. To evaluate substrate specificity, IMAC-purified His6×-TCS-ΔNspSEMWT fusion protein underwent buffer exchange into salt-free buffer C to activate proteolysis. Time-course SDS-PAGE showed complete His6×-tag excision within 24 h at 4 °C (Figure 3e, Lane 3). Co-incubation of ΔNspSEMWT with bovine serum albumin (BSA) or hen egg-white lysozyme (HEWL) (1:1 mass ratio, salt-free, 37 °C, 8 h) showed no detectable nonspecific degradation (Figure 3e, Lanes 5 and 8), with individual controls confirming component integrity (BSA-Lane 4; HEWL-Lane 7; ΔNspSEMWT-Lane 6). Cleavage strictly required the TCS motif (LVPR↓GS), with no detectable activity observed in motif-deficient substrates, demonstrating ΔNspSEMWT’s precision for engineered tag removal.
Figure 3.
Effects of ionic strength, pH and TCS-free substrates on TLA activity in His6×-TCS-ΔNspSEMWT fusion protein. (a) Fusion protein exhibits inhibited TLA under high-salt conditions. Lane M: protein marker. Lanes 1~6, 8, 10: daily aliquots collected at days 1~6, 8, 10. (b) Ultrafiltration desalting resumes TLA. Lanes 1~6, 8, 10: daily aliquots collected at days 1~6, 8, 10. Lane M: protein marker. (c) Neutral-to-acidic pH modulates TLA following centrifugal desalting. Lane M: protein marker. Lane pH: pH-controlled buffer exchange (2.0, 3.0, 4.0, 4.5, 5.0, 5.5, 6.0, 6.5 and 7.0) during centrifugal desalting of the fusion protein. (d) Neutral-to-alkaline pH regulates TLA in fusion protein. Lane pH: pH-controlled buffer exchange (7.5, 8.0, 9.0, 10.0, 11.0 and 12.0) during centrifugal desalting of the fusion protein. Lane M: protein marker. (e) TCS motif-deficient substrates (BSA, HEWL) modulate TLA in fusion protein. Lane 1: His6×-TCS-ΔNspSEMWT fusion protein; Lane 2: Desalted His6×-TCS-ΔNspSEMWT fusion protein; Lane 3: His6×-tag cleaved ΔNspSEMWT protein; Lane 4: Bovine serum albumin (BSA); Lane 5: ΔNspSEMWT + BSA mixture; Lane 6: Same as lane 3; Lane 7: Hen egg-white lysozyme; Lane 8: ΔNspSEMWT + lysozyme mixture. (f) The catalytic triad (histidine-172: H172, aspartic Acid-212: D212, serine-178: S178) predicted by AlphaFold 3 n β-grasp domain surface of ΔNspSEMWT recombinant protein. Original images can be found in Supplementary Materials.
3.4. S178A Mutation in the Catalytic Triad Abolishes TLA of His6×-TCS-ΔNspSEMWT
In Section 3.2, purification of the His6×-TCS-ΔNspSEMWT fusion protein via sequential IMAC and SE-HPLC revealed TLA using S-2238. While SDS-PAGE confirmed increasing purity throughout purification (Figure 2f,g), both final yield and TLA decreased significantly (Table 1). Quantitative analysis, however, demonstrated corresponding increases in specific activity and purification fold, indicating effective contaminant removal and target protein enrichment. Absolute purity (100%) remains impractical in any purification scheme. Therefore, potential contributions of trace endogenous E. coli serine protease contamination to the observed activity must be excluded. To definitively attribute TLA to the catalytic triad (H172/S178/D212) within ΔNspSEMWT’s β-grasp domain, we generated the S178A [30] mutant His6×-TCS-ΔNspSEMS178A. This mutant was expressed in E. coli, purified by IMAC, and analyzed by SDS-PAGE under identical conditions to the wild-type protein. IPTG induction yielded mutant protein with electrophoretic mobility identical to the wild-type (Figure 4a, Lane 2 uninduced and Lane 3 induced). Following large-scale expression and IMAC purification (Section 2.2), the mutant fusion protein was desalted by centrifugal ultrafiltration at 4 °C (Section 2.3). SDS-PAGE analysis of desalted samples taken at identical time points to wild-type (Section 2.3, Figure 1c, lanes 0 d~10 d vs. Figure 4a, lanes 4~10) revealed that the mutant protein, unlike the wild-type, undergoes no peptide-specific degradation. The electrophoretic band (Figure 4a, Lane 10, black arrow) from the desalted sample incubated at 4 °C for 10 days was excised and submitted for MS sequencing. As shown in Figure 4d, the peptide coverage obtained from MS analysis exactly matched the primary structure of our engineered mutant fusion protein His6×-TCS-ΔNspSEMS178A.
Figure 4.
Validation of the loss of TLA for specific hydrolysis at R-G peptide bonds within the TCS sequence by the mutant His6×-TCS-ΔNspSEMS178A fusion protein. (a) Ultrafiltration and desalting of IMAC-purified mutant fusion protein. Lane 1, protein molecular weight markers; Lane 2, unin-duced E. coli lysate; Lane 3, induced E. coli lysate; Lanes 4~10: samples of the electrophoretically purified mutant protein after centrifugal ultrafiltration desalting, stored statically at 4 °C and collected at 0, 0.5, 1, 2, 3, 6, and 10 days. (b,c) CD spectra and fluorescence intensity (note: a.u., arbitrary units,) of His6×-tag-free wild-type ΔNspSEMwt and mutant ΔNspSEMS178A protein. Note. Y-values omitted to highlight spectral intensity signals at different wavelengths. (d) The electrophoretic band (Figure 4a, Lane 10, black arrow) was excised and analyzed by mass spectrometry for primary structure determination. The “Mutation: S→A” indicated by the black arrow shows the site where the serine residue was replaced by alanine in the catalytic triad (H172/S178/D212) of the SEM protein.
Notably, substituting the solvent-exposed, polar serine 178 within the β-grasp domain with hydrophobic alanine could invert the local microenvironment, potentially disrupting the catalytic triad’s 3D structure. Under extreme conditions, such a mutation might also alter secondary structure, compromising tertiary fold and destroying the active site. To rigorously exclude structural destabilization (secondary or tertiary) as the cause of TLA loss and eliminate potential thrombin contamination in the assay, we constructed the His6×-SUMO-ΔNspSEMS178A expression plasmid (Section 2.1). Following prokaryotic expression and IMAC purification (Section 2.2), the His6×-SUMO tag was cleaved with SUMO protease, and the tag-free ΔNspSEMS178A was isolated by reverse IMAC purification. Finally, CD and intrinsic fluorescence emission spectra of wild-type ΔNspSEMWT and mutant ΔNspSEMS178A were acquired at 25 °C (Section 2.9). Figure 4b,c shows nearly identical CD spectra (secondary structure) and intrinsic fluorescence spectra (local hydrophobicity around the β-grasp domain tryptophan) for both proteins. This demonstrates the mutant possesses secondary and tertiary structures indistinguishable from the wild-type at ambient temperature. Consequently, the loss of TLA in the ΔNspSEMS178A mutant is conclusively attributed to disruption of the catalytic mechanism, not global structural perturbation.
In conclusion, comparative structural and functional analysis of the mutant and wild-type fusion proteins robustly confirms the intrinsic TLA of the SEM protein.
3.5. Probing Substrate Specificity and TLA in ΔNspSEMWT via MD Simulations
Classical MD simulations provide atomic-level insights into enzymatic substrate-binding specificity. While protocols typically prioritize high-resolution crystal structures (≤2 Å), the absence of SEM crystal structure in the PDB necessitates alternative approaches. We generated initial models using AlphaFold 3 and homology modeling. Post-equilibration analyses revealed strong agreement between simulated secondary structures and circular dichroism data, complemented by computational solvent accessibility assessments of tryptophan residues correlating with fluorescence emission spectra [31]. These experimental validations confirm structural reliability.
Figure 5a shows equilibrated 150 ns simulations of ΔNspSEMWT (His6×-tag-free) and its His6×-tagged substrate forming stable complexes, with Cα–RMSD remaining converged over the final 110 ns (40~150 ns). Trajectory analysis identified a canonical catalytic triad (H172/S178/D212), with S178–OG6543 in the β-grasp domain acting as the nucleophile attacking R17–C251 in the TCS motif (Figure 5b,e). Critical S178–OG6543/R17–C251 distances fluctuated between 3~8 Å, with periodic approaches to 3~4 Å indicating catalytic competence (Figure 5b). Substrate recognition was stabilized by dual salt bridges (R17–D212/E214 ≤ 4 Å, Figure 5c,d) and thirteen hydrogen bonds (eight involving R17’s sidechain), with five additional hydrogen bonds enhancing specificity (Figure 5f). This configuration strategically positions the R17–G18 peptide bond near S178–OG6543 via electrostatic steering, establishing a “molecular guillotine” mechanism. The catalytic platform anchors R17 through D212/E214 while exposing S178–OG6543 as the cleavage element. At critical proximity (3~4 Å), this nucleophile severs the R17-G18 bond, releasing the His6×-tagged fragment from ΔNspSEMWT’s C-terminal domain. Collectively, S178–OG6543 acts as a precision catalytic element, selectively cleaving the R17–G18 bond within the β-grasp domain.
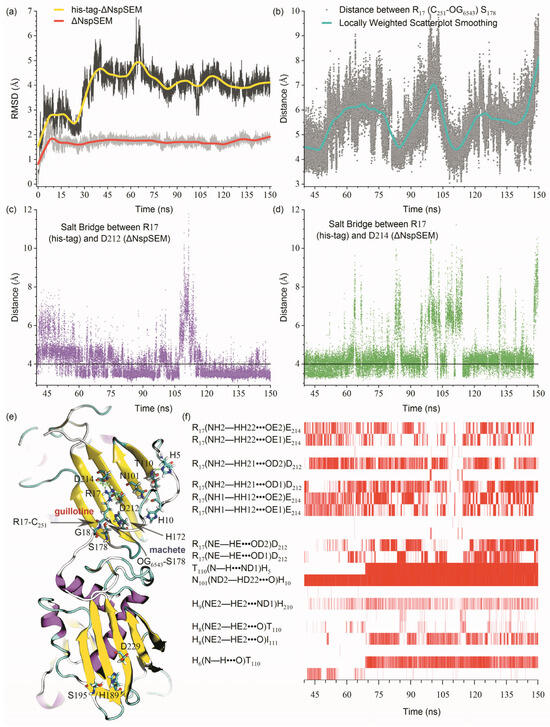
Figure 5.
MD simulations probe the molecular mechanism of His6×-TCS-ΔNspSEMWT substrate binding to the ΔNspSEMWT active center. (a) Time evolution of RMSD for His6×-TCS-ΔNspSEMWT and ΔNspSEMWT within the protease-substrate complex. (b) Distance dynamics between R17–C251 (substrate) and S178–OG6543 (protease). (c,d) Salt bridge formation between substrate R17 and protease D212/E214. (e) Proposed “molecular guillotine” mechanism for His6×-tag proteolytic cleavage. (f) Temporal evolution of substrate-protease hydrogen bond networks.
4. Conclusions
Based on experimental and simulation data, the surface-exposed residues H172/S178/D212 in SEM’s β-grasp domain constitute a canonical serine protease catalytic triad. Crucially, the N-terminal R17 of hydrolyzed R17–G18 peptide bonds anchors to SEM’s β-grasp surface via salt bridges and hydrogen bonds with D212/E214. This substrate fixation mechanism likely drove SEM’s evolutionary acquisition of TLA targeting R17–G18 bonds. Structural analyses integrating PDB and AlphaFold 3 predictions reveal five distinct evolutionary patterns within the staphylococcal enterotoxin (SE) superfamily: Type I (SEH/SEI/SEQ): preserves SEM’s catalytic triad and R17-recognition salt bridges. Type II (SEO/SEP/SES): retains triad but exhibits divergent substrate-binding interfaces. Type III (SET/SEY/SEY3/SEZ): evolved novel triads with reconfigured salt-bridged binding pockets. Type IV (SEA/SEN): retains triad but lacks R17-anchoring salt bridges. Type V (SEB/SEC/SED/SEE/SEG/SEJ/SEL/SEK/SEO2/SER/SEW/SEX): lost triad architecture, correlating with absent protease activity. These findings raise fundamental questions: why did nearly half of SEs evolve functional protease triads? What selective pressures drove specific enterotoxins to develop arginine-targeting pockets, refining TLA? Most critically, what pathogenic advantages do these activities confer? Addressing these knowledge gaps requires integrated structural phylogenetics, enzymatic assays, and host–pathogen studies. We hypothesize that SEs’ acquired protease/TLA activities mechanistically link to disseminated coagulation in severe S. aureus infections. While not exclusive contributors, TLA may cleave fibrinogen’s R–G bonds, generating fibrin monomers that polymerize into soft hydrogels. Crucially, fibrin-based soft hydrogel formation on bacterial surfaces may serve as a dual-functional immune evasion strategy: (1) establishing a physical barrier that masks surface antigenic heterogeneity, and (2) impairing phagocytic clearance by macrophages/neutrophils while attenuating lymphocyte-mediated attacks. This proposed mechanism would facilitate hematogenous dissemination of S. aureus, enabling systemic colonization of distant tissues and organs. Systematic investigations into this hypothesis could elucidate the pathophysiological significance of SEs’ enzymatic diversification during host invasion, potentially revealing novel therapeutic targets against complicated staphylococcal infections.
Inspired by salt-concentration-dependent TLA modulation (suppressed at ≥500 mM NaCl; activated upon desalting), we propose a heterologous expression system design featuring: target protein-TCS(LVPR↓GS)-His6×-SEM. Following IMAC purification and buffer exchange, desalted SEM would specifically cleave the R–G bond, releasing the target protein while retaining the His6×-tagged SEM for subsequent IMAC removal. This strategy would outperform thrombin-based methods by: (1) eliminating exogenous proteases; (2) enabling simultaneous tag removal and buffer optimization during 4 °C storage; (3) minimizing denaturation; and (4) enhancing product concentration by collecting flow-through, thus bypassing dilution-prone gel filtration. Collectively, this integrated purification-cleavage approach would reduce processing steps, minimize dilution, and streamline industrial-scale protein production, offering significant cost and scalability advantages.
Supplementary Materials
The following supporting information can be downloaded at: https://www.mdpi.com/article/10.3390/biom15101357/s1, Figure S1: Chromatogram of calibration of 19 kinds of PTH-amino acids mixture; Figure S2: N-terminal sequencing chromatogram of customer sample (TWF0815). File S1: Original images.
Author Contributions
Conceptualization, J.L.; Methodology, Q.H. and J.L.; Software, S.-H.L. and J.L.; Validation, W.-F.T.; Formal analysis, Q.H., S.-H.L. and J.L.; Investigation, W.-F.T.; Resources, S.-H.L.; Data curation, Q.H.; Writing—original draft, Q.H.; Writing—review & editing, J.L.; Visualization, J.L.; Project administration, J.-N.T.; Funding acquisition, J.L. All authors have read and agreed to the published version of the manuscript.
Funding
This work was supported by the fundamental research funds for the central universities of Southwest Minzu University (ZYN2023095).
Institutional Review Board Statement
Not applicable.
Informed Consent Statement
Not applicable.
Data Availability Statement
The original contributions presented in this study are included in the article/Supplementary Materials. Further inquiries can be directed to the corresponding authors.
Acknowledgments
The authors gratefully acknowledge Suyu Jin from the Modern Biotechnology Laboratory, College of Animal Husbandry and Veterinary Medicine, Southwest Minzu University, for her expert guidance and technical support in the operation of the high-performance liquid chromatography (HPLC) system. We also extend our sincere appreciation to the Central Universities Basic Research Fund of Southwest Minzu University for its generous financial support, which was instrumental in the completion of this study.
Conflicts of Interest
The authors declared that they have no conflict of interest.
References
- Chen, P.; Ma, Y.; Xiao, Y. How does Staphylococcus aureus successfully colonize the nasal cavity. Crit. Rev. Microbiol. 2025, 1–20. [Google Scholar] [CrossRef] [PubMed]
- Fang, G.-Y.; Wu, F.-H.; Mu, X.-J.; Jiang, Y.-J.; Liu, X.-Q. Monitoring longitudinal antimicrobial resistance trends of Staphylococcus aureus strains worldwide over the past 100 years to decipher its evolution and transmission. J. Hazard. Mater. 2024, 465, 133136. [Google Scholar] [CrossRef] [PubMed]
- Atchade, E.; De Tymowski, C.; Grall, N.; Tanaka, S.; Montravers, P. Toxic shock syndrome: A literature review. Antibiotics 2024, 13, 96. [Google Scholar] [CrossRef] [PubMed]
- Cieza, M.Y.R.; Bonsaglia, E.C.R.; Rall, V.L.M.; Dos Santos, M.V.; Silva, N.C.C. Staphylococcal enterotoxins: Description and importance in food. Pathogens 2024, 13, 676. [Google Scholar] [CrossRef]
- Zhu, Z.; Hu, Z.; Li, S.; Fang, R.; Ono, H.K.; Hu, D.-L. Molecular characteristics and pathogenicity of Staphylococcus aureus exotoxins. Int. J. Mol. Sci. 2023, 25, 395. [Google Scholar] [CrossRef]
- Wan, Y.; Yang, L.; Li, Q.; Wang, X.; Zhou, T.; Chen, D.; Li, L.; Wang, Y.; Wang, X. Stability and emetic activity of enterotoxin like X (SElX) with high carrier rate of food poisoning Staphylococcus aureus. Int. J. Food Microbiol. 2023, 404, 110352. [Google Scholar] [CrossRef]
- Jarraud, S.; Peyrat, M.A.; Lim, A.; Tristan, A.; Bes, M.; Mougel, C.; Etienne, J.; Vandenesch, F.; Bonneville, M.; Lina, G. egc, a highly prevalent operon of enterotoxin gene, forms a putative nursery of superantigens in Staphylococcus aureus. J. Immunol. 2001, 166, 669–677. [Google Scholar] [CrossRef]
- Grumann, D.; Scharf, S.S.; Holtfreter, S.; Kohler, C.; Steil, L.; Engelmann, S.; Hecker, M.; Völker, U.; Bröker, B.M. Immune cell activation by enterotoxin gene cluster (egc)-encoded and non-egc superantigens from Staphylococcus aureus. J. Immunol. 2008, 181, 5054–5061. [Google Scholar] [CrossRef]
- Viçosa, G.N.; Le Loir, A.; Le Loir, Y.; de Carvalho, A.F.; Nero, L.A. egc characterization of enterotoxigenic Staphylococcus aureus isolates obtained from raw milk and cheese. Int. J. Food Microbiol. 2013, 165, 227–230. [Google Scholar] [CrossRef]
- Chao, G.; Bao, G.; Cao, Y.; Yan, W.; Wang, Y.; Zhang, X.; Zhou, L.; Wu, Y. Prevalence and diversity of enterotoxin genes with genetic background of Staphylococcus aureus isolates from different origins in China. Int. J. Food Microbiol. 2015, 211, 142–147. [Google Scholar] [CrossRef]
- Johler, S.; Giannini, P.; Jermini, M.; Hummerjohann, J.; Baumgartner, A.; Stephan, R. Further evidence for staphylococcal food poisoning outbreaks caused by egc-encoded enterotoxins. Toxins 2015, 7, 997–1004. [Google Scholar] [CrossRef]
- Shen, M.; Li, Y.; Zhang, L.; Dai, S.; Wang, J.; Li, Y.; Zhang, L.; Huang, J. Staphylococcus enterotoxin profile of China isolates and the superantigenicity of some novel enterotoxins. Arch. Microbiol. 2017, 199, 723–736. [Google Scholar] [CrossRef] [PubMed]
- Umeda, K.; Nakamura, H.; Yamamoto, K.; Nishina, N.; Yasufuku, K.; Hirai, Y.; Hirayama, T.; Goto, K.; Hase, A.; Ogasawara, J. Molecular and epidemiological characterization of staphylococcal foodborne outbreak of Staphylococcus aureus harboring seg, sei, sem, sen, seo, and selu genes without production of classical enterotoxins. Int. J. Food Microbiol. 2017, 256, 30–35. [Google Scholar] [CrossRef] [PubMed]
- Pan, Y.; Ding, D.; Li, D.; Chen, S. Expression and bioactivity analysis of Staphylococcal enterotoxin M and N. Protein Expr. Purif. 2007, 56, 286–292. [Google Scholar] [CrossRef] [PubMed]
- Omoe, K.; Hu, D.-L.; Ono, H.K.; Shimizu, S.; Takahashi-Omoe, H.; Nakane, A.; Uchiyama, T.; Shinagawa, K.; Imanishi, K. Emetic potentials of newly identified staphylococcal enterotoxin-like toxins. Infect. Immun. 2013, 81, 3627–3631. [Google Scholar] [CrossRef]
- Ono, H.K.; Hirose, S.; Naito, I.; Sato’o, Y.; Asano, K.; Hu, D.-L.; Omoe, K.; Nakane, A. The emetic activity of staphylococcal enterotoxins, SEK, SEL, SEM, SEN and SEO in a small emetic animal model, the house musk shrew. Microbiol. Immunol. 2017, 61, 12–16. [Google Scholar] [CrossRef]
- Ono, H.K.; Nishizawa, M.; Yamamoto, Y.; Hu, D.-L.; Nakane, A.; Shinagawa, K.; Omoe, K. Submucosal mast cells in the gastrointestinal tract are a target of staphylococcal enterotoxin type A. FEMS Immunol. Med. Microbiol. 2012, 64, 392–402. [Google Scholar] [CrossRef]
- Zhao, Y.; Tang, J.; Yang, D.; Tang, C.; Chen, J. Staphylococcal enterotoxin M induced inflammation and impairment of bovine mammary epithelial cells. J. Dairy Sci. 2020, 103, 8350–8359. [Google Scholar] [CrossRef]
- Brouillard, J.-N.P.; Günther, S.; Varma, A.K.; Gryski, I.; Herfst, C.A.; Rahman, A.K.M.N.; Leung, D.Y.M.; Schlievert, P.M.; Madrenas, J.; Sundberg, E.J.; et al. Crystal structure of the streptococcal superantigen SpeI and functional role of a novel loop domain in T cell activation by group V superantigens. J. Mol. Biol. 2007, 367, 925–934. [Google Scholar] [CrossRef]
- Spaulding, A.R.; Salgado-Pabón, W.; Kohler, P.L.; Horswill, A.R.; Leung, D.Y.M.; Schlievert, P.M. Staphylococcal and streptococcal superantigen exotoxins. Clin. Microbiol. Rev. 2013, 26, 422–447. [Google Scholar] [CrossRef]
- Günther, S.; Varma, A.K.; Moza, B.; Kasper, K.J.; Wyatt, A.W.; Zhu, P.; Rahman, A.K.M.N.; Li, Y.; Mariuzza, R.A.; McCormick, J.K.; et al. A novel loop domain in superantigens extends their T cell receptor recognition site. J. Mol. Biol. 2007, 371, 210–221. [Google Scholar] [CrossRef]
- Nielsen, H.; Tsirigos, K.D.; Brunak, S.; von Heijne, G. A brief history of protein sorting prediction. Protein J. 2019, 38, 200–216. [Google Scholar] [CrossRef]
- Abramson, J.; Adler, J.; Dunger, J.; Evans, R.; Green, T.; Pritzel, A.; Ronneberger, O.; Willmore, L.; Ballard, A.J.; Bambrick, J.; et al. Accurate structure prediction of biomolecular interactions with AlphaFold 3. Nature 2024, 630, 493–500. [Google Scholar] [CrossRef] [PubMed]
- Martínez, L.; Andrade, R.; Birgin, E.G.; Martínez, J.M. PACKMOL: A package for building initial configurations for molecular dynamics simulations. J. Comput. Chem. 2009, 30, 2157–2164. [Google Scholar] [CrossRef] [PubMed]
- Van Der Spoel, D.; Lindahl, E.; Hess, B.; Groenhof, G.; Mark, A.E.; Berendsen, H.J.C. GROMACS: Fast, flexible, and free. J. Comput. Chem. 2005, 26, 1701–1718. [Google Scholar] [CrossRef] [PubMed]
- Maier, J.A.; Martinez, C.; Kasavajhala, K.; Wickstrom, L.; Hauser, K.E.; Simmerling, C. FF14SB: Improving the accuracy of protein side chain and backbone parameters from ff99SB. J. Chem. Theory Comput. 2015, 11, 3696–3713. [Google Scholar] [CrossRef]
- Waterhouse, A.; Bertoni, M.; Bienert, S.; Studer, G.; Tauriello, G.; Gumienny, R.; Heer, F.T.; de Beer, T.A.P.; Rempfer, C.; Bordoli, L.; et al. SWISS-MODEL: Homology modelling of protein structures and complexes. Nucleic Acids Res. 2018, 46, W296–W303. [Google Scholar] [CrossRef]
- Håkansson, M.; Petersson, K.; Nilsson, H.; Forsberg, G.; Björk, P.; Antonsson, P.; Svensson, L. The crystal structure of staphylococcal enterotoxin H: Implications for binding properties to MHC class II and TcR molecules. J. Mol. Biol. 2000, 302, 527–537. [Google Scholar] [CrossRef]
- Denesyuk, A.I.; Denessiouk, K.; Johnson, M.S.; Uversky, V.N. Structural catalytic core in subtilisin-like proteins and its comparison to trypsin-like serine proteases and alpha/beta-hydrolases. Int. J. Mol. Sci. 2024, 25, 11858. [Google Scholar] [CrossRef]
- Stok, J.E.; Goloshchapov, A.; Song, C.; Wheelock, C.E.; Derbel, M.B.H.; Morisseau, C.; Hammock, B.D. Investigation of the role of a second conserved serine in carboxylesterases via site-directed mutagenesis. Arch. Biochem. Biophys. 2004, 430, 247–255. [Google Scholar] [CrossRef]
- Liu, J. (Southwest Minzu University, Chengdu, Sichuan Province, China); Huang, Q. (Southwest Minzu University, Chengdu, Sichuan Province, China). Personal communication, 2024.
Disclaimer/Publisher’s Note: The statements, opinions and data contained in all publications are solely those of the individual author(s) and contributor(s) and not of MDPI and/or the editor(s). MDPI and/or the editor(s) disclaim responsibility for any injury to people or property resulting from any ideas, methods, instructions or products referred to in the content. |
© 2025 by the authors. Licensee MDPI, Basel, Switzerland. This article is an open access article distributed under the terms and conditions of the Creative Commons Attribution (CC BY) license (https://creativecommons.org/licenses/by/4.0/).